I. Introduction
Lamda CDM emerged in the late 1990’s as a paramertization of Big Bang Cosmology. This model proposes that 68.3% of the Universes Mass-Energy is due to Dark Energy with 26.8% due to Dark Matter and the remaining 4.9% due to the ordinary baryonic matter that we see all around us. Big Bang Cosmology and Lamda CDM have proved very successful in predicting the observed behavior of our universe. However, cracks have appeared over the decades since the model was introduced and some have pointed to these cracks as indicative of a crisis in Physics and a need for a paradigm change.
The existence of Dark Matter was originally suggested by Zwickey1 in the 1930s to explain the motion of “Nebulae” in galactic clusters. In 1978 Rubin et al2 found additional evidence in support of the Dark Matter hypothesis during their investigation of the rotation curves of the hydrogen surrounding spiral galaxies. Since then a great deal of effort, both experimental and theoretical, has been devoted to shoring up the Dark Matter hypothesis. Of particular importance are the earth based experiments designed to detect Dark Matter directly. However, to date, no Dark Matter has been detected by these experiments. This begs the question “does Dark Matter actually exist?” Perhaps we have a situation reminiscent of the 20th century search for the ether ?
In 2010 the author, together with an undergraduate student, became interested in the Dark Matter problem and published a couple of papers3,4 in the Physics teaching literature focused on exercises in computational physics that involve galactic dynamics. In the conclusion to reference 3, the authors pose the question: “An intriguing possibility is that these experiments could prove to be the next (after Michelson-Morley) great null experiments and then What? The present paper attempts to proactively address the “then What?’.
In section II we first set the stage for our model by considering the measurements that are made to determine galactic rotation curves. Following that we introduce a simple explanatory and predictive framework (Theory) intended to explain the flat rotation curves. Section III applies the theory to examples of readily available rotation curve data. A summary and conclusions are given in section IV
II. Explanatory and Predictive Framework
The rotation curves of spiral galaxies are frequently measured by interpreting the Doppler shifted 21cm hyperfine spectral line emitted by a rotating HI cloud of gas surrounding the luminous rotating galactic disk consisting of ordinary baryonic matter. In this paper we consider the rotating disk to be a rotating frame of reference with an “effective angular velocity (ω)”
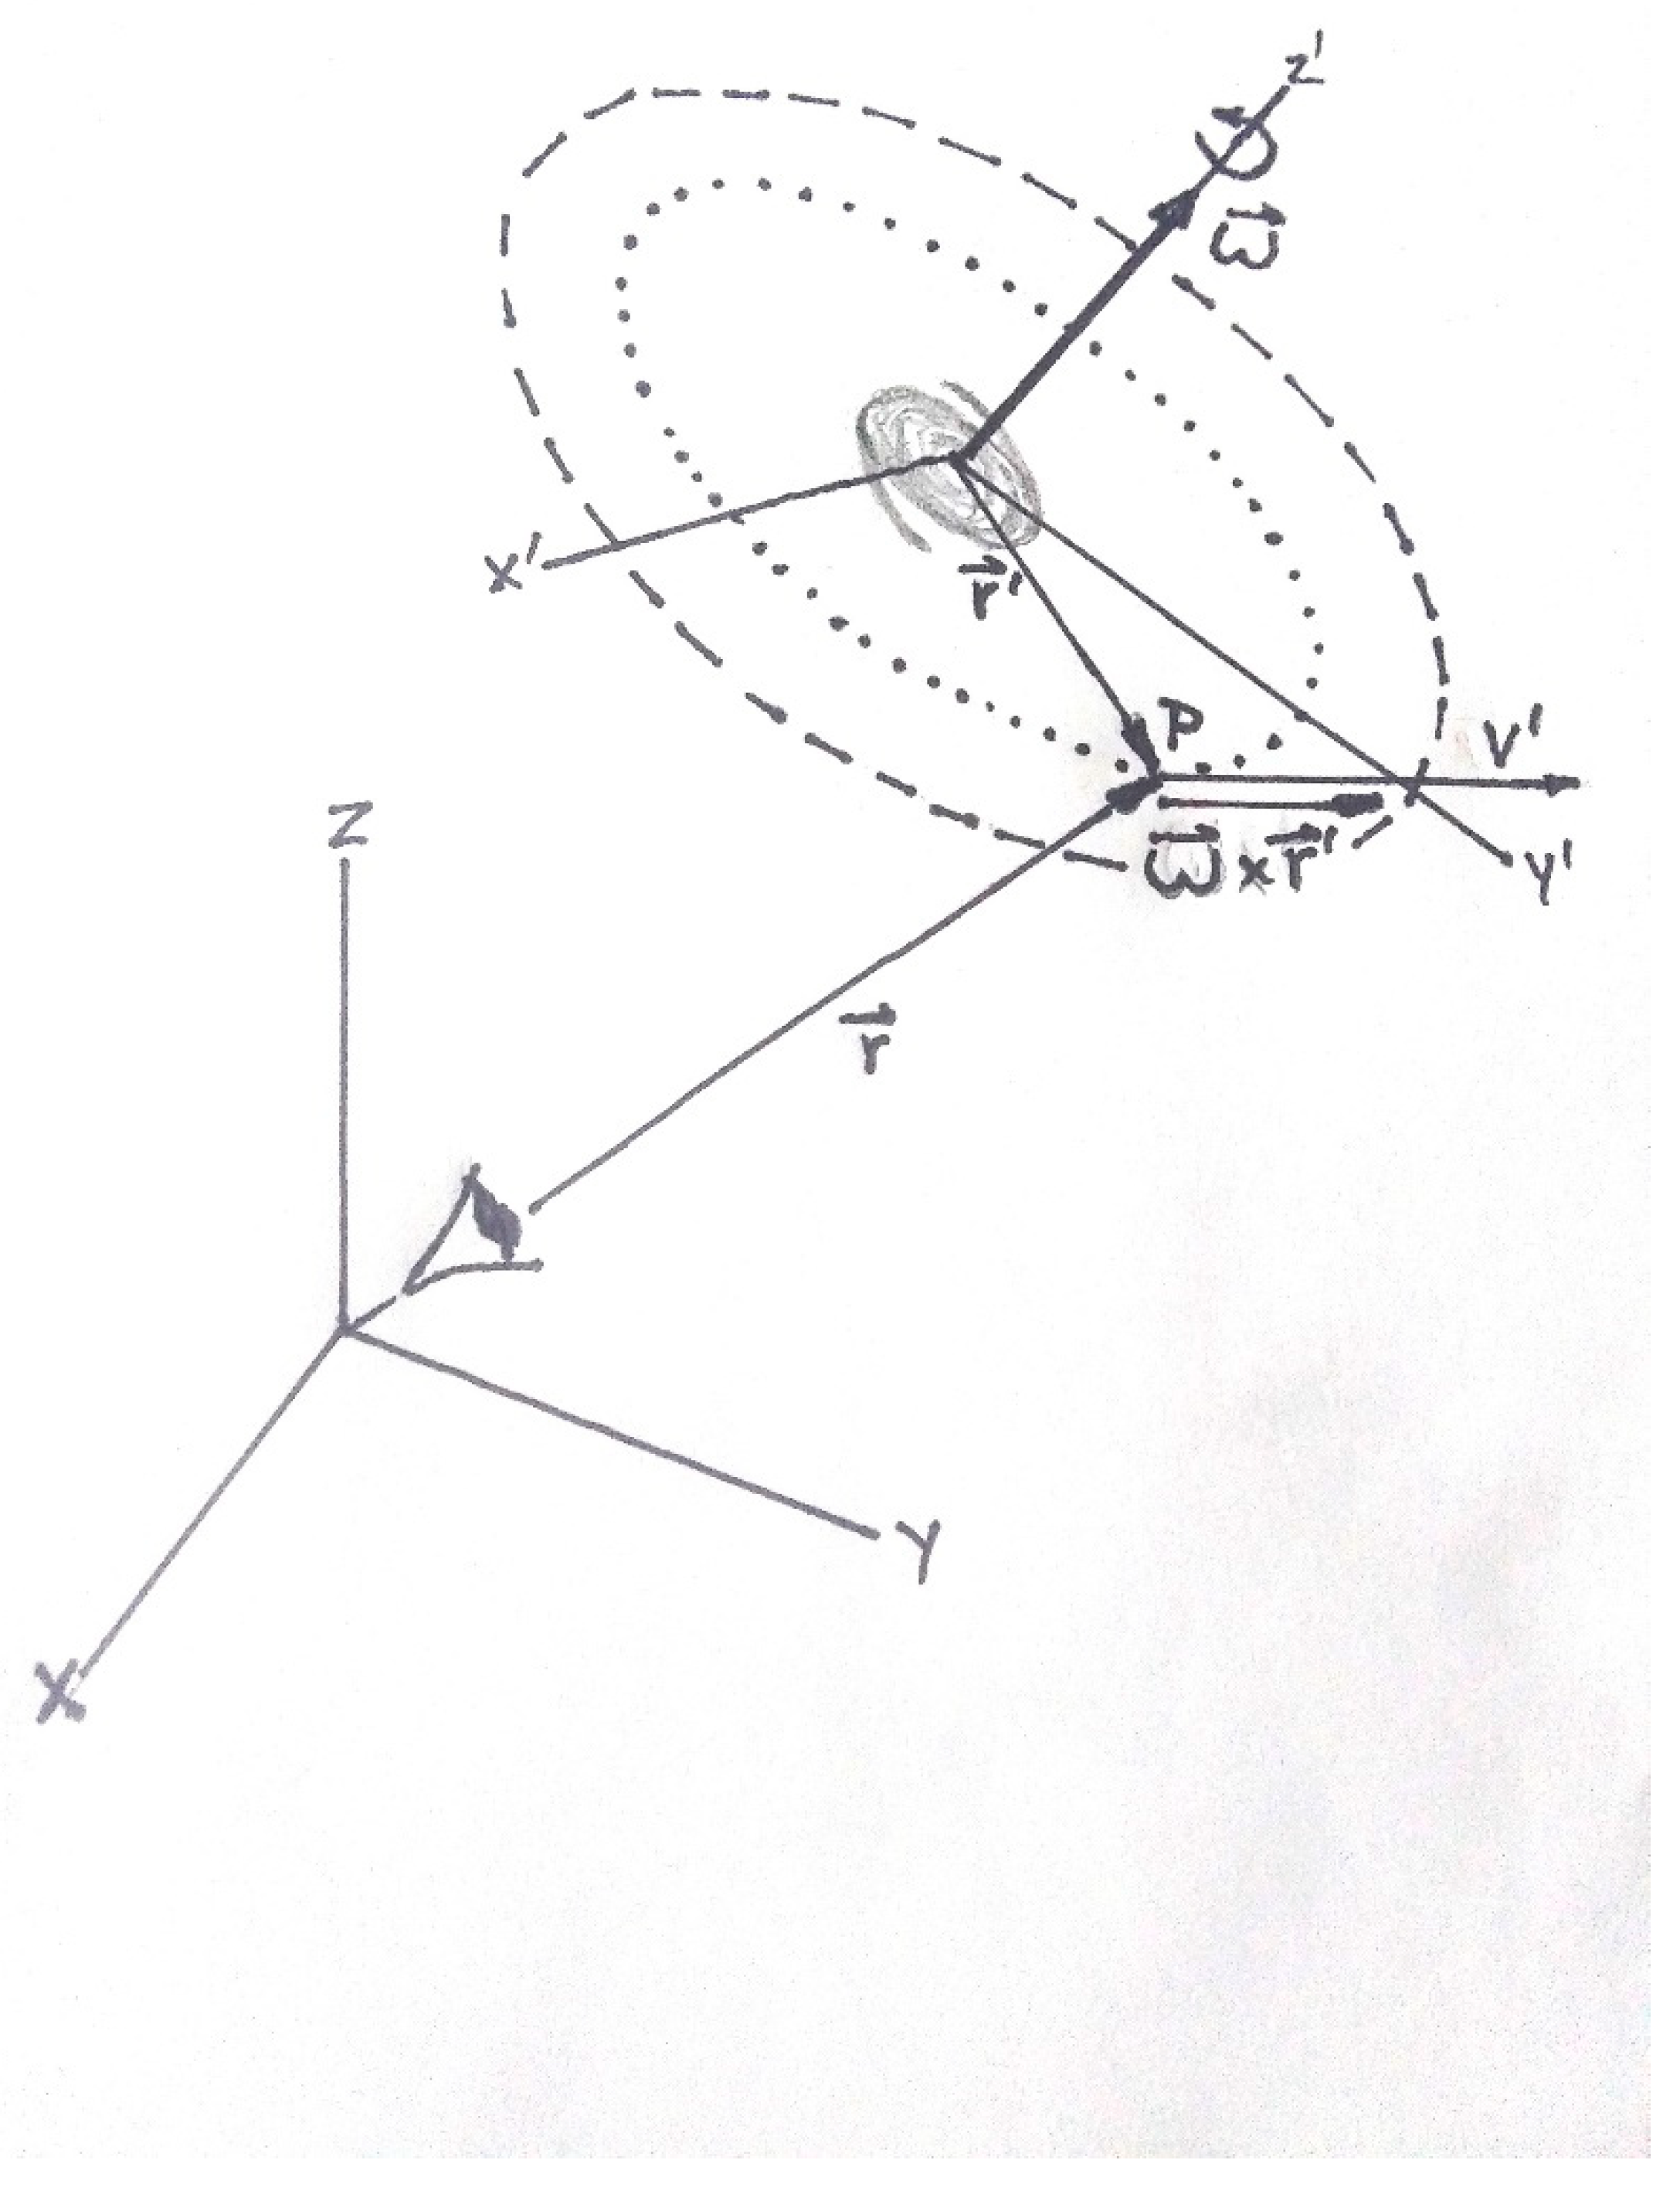
The basic heliocentric, line of sight measurements of the rotating HI cloud are typically made by earth based radio telescopes. For specificity we will limit our discussion to measurements made using radio telescopes although the radio telescope data are often supplemented by a variety of spectroscopic measurements. In this paper we consider the radio telescopes to be fixed Inertial frames of reference. A schematic of the measurement arrangement is shown in
Figure 1.
In
Figure 1 the primed coordinate system (x', y', z') is fixed to the rotating baryonic disk as shown. The disk is assumed to have an “effective angular velocity (ω)” about the z' axis. The dashed oval curve indicates the extent of the HI cloud rotating around the disk shown in the center. The dotted oval curve represents an assumed circular path followed by a sample of HI. The earth based coordinate system (x, y, z,) is depicted to the left. The earth bound radio telescopes record line of sight data from a point P in the HI cloud. The velocity (v') of the HI sample is the velocity relative to the primed coordinate system. This velocity results from the effect of the gravitational field of the disk and is tangent to the dashed oval at point P. The vector cross product ω x r' is also tangent to the circular path and will be introduced below.
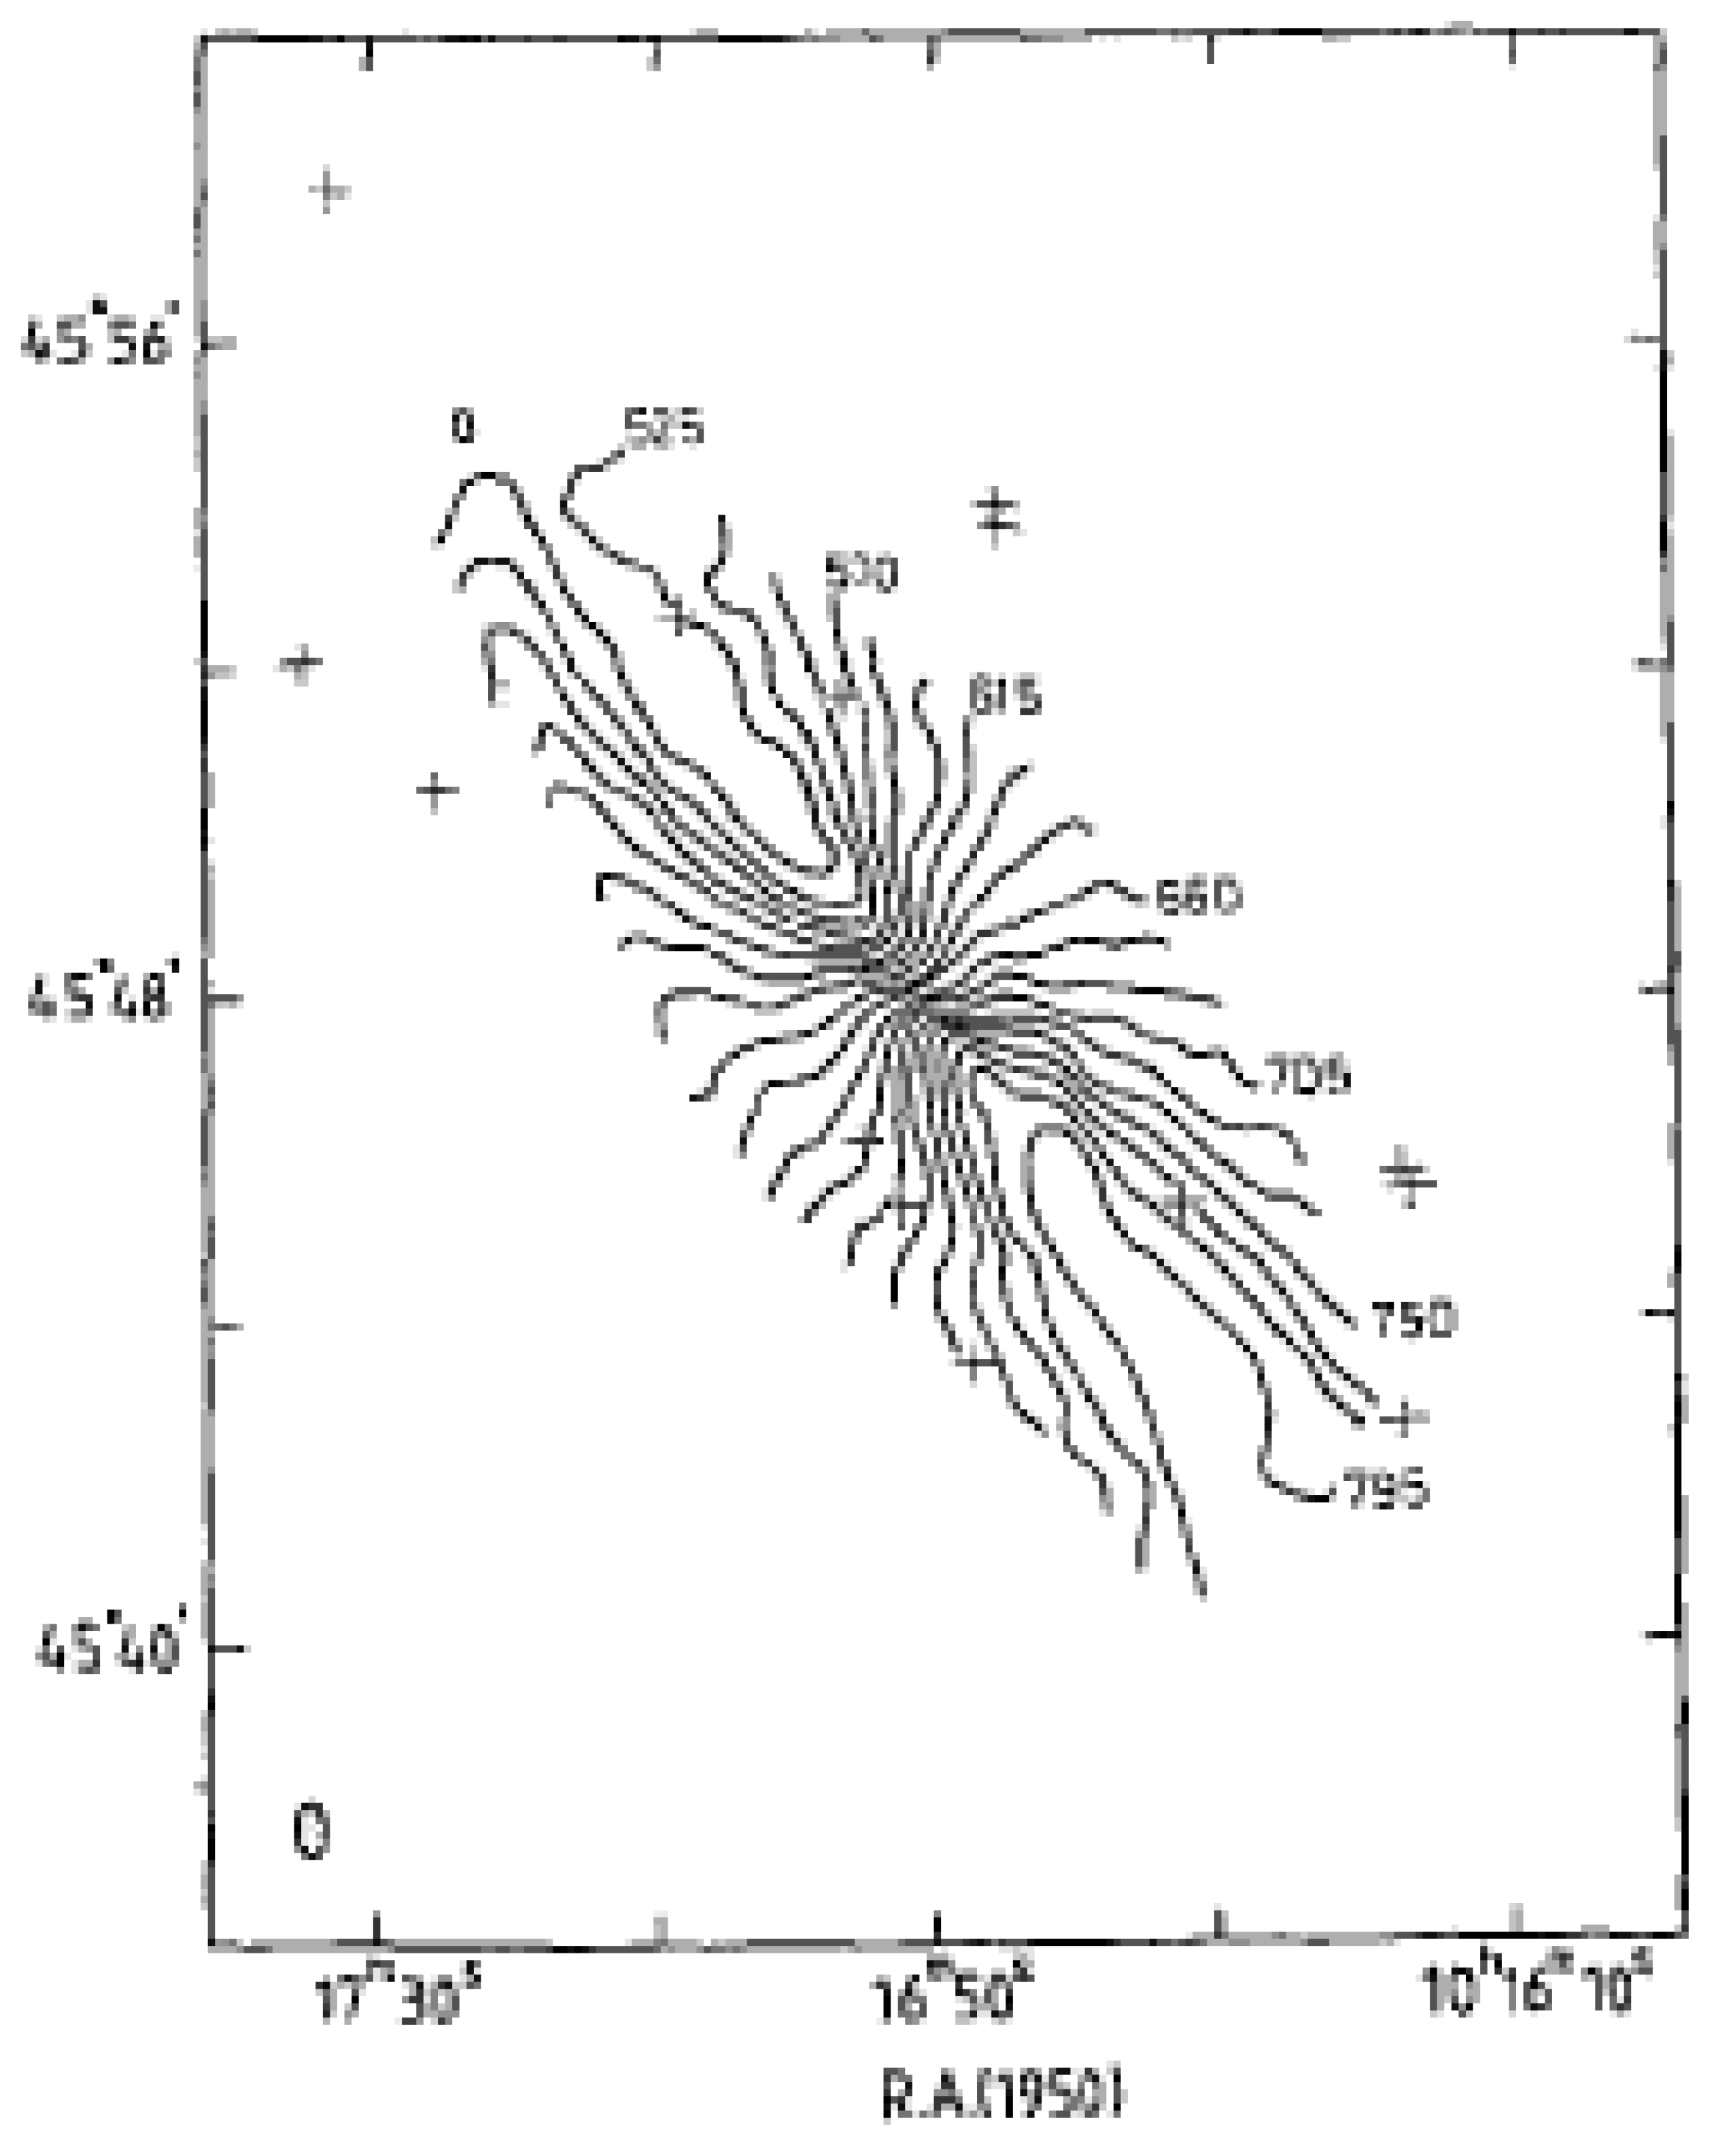
The interpretation of the line of sight measurements by a earth based observer relies on a complex model of the rotating HI cloud called the “Tilted Ring Model”. This model is described, for example, by Begeman5. As noted, the measurements are “line of sight” and as a result collect Doppler Shifted radiation from cylindrical samples through the tilted disk. This model assumes, a priori, that these cylindrical samples of HI material are part of a circular rotating mass of HI. From this raw data an algorithm is used to construct a contour map of the speeds. An example of such a contour map is shown in Figure 25
The experimental rotation curve is established by recording the speeds along the major axis of this plot. Two sets of data points are obtained. One from the side tilted towards the observer and one tilted away from the observer. The average is recorded as the rotation curve. Standard practice assumes that this is a best guess as to the rotation speed of the HI cloud as measured by the earth based radio telescopes.
From a kinematic perspective, any velocity (v) measured by an earth based inertial observer is related to the velocity (v') measured in the rotating primed frame by the straight forward vector equation (see for example reference 6 equation 5.2.13, page 177 and Figure 5.2.4 )

In this expression V is the velocity of translation of the primed system. In the present context V would be the systemic velocity of a galaxy. V is not relevant as far as the galactic rotation is concerned.
From figure1, the cross product ω x r' is always aligned with the direction of the tangent to the assumed circular paths and is in the same direction as the circular velocity (v'). Recall that (v') is a consequence of the gravitational field of the disk acting on the HI cloud. The magnitude of the cross product ω x r' is ωr'sin(α) where α is the angle between the vector ω and r'. We will assume that the disk is flat and therefore α is 90 degrees and ω x r' is therefore simply ωr'.
Theoretically, the velocity v' due to the gravitational field of the disk is determined as follows: It is assumed that the mass distribution of the baryonic disk mimics the light distribution. This is quantified by the “Mass to Light” ratio. The light distribution is usually assumed to be a decreasing exponential function. With this assumed mass distribution the gravitational field due to the baryonic disk can be calculated. Because the HI paths are assumed to be circular this gravitational field is by Newton’s second law equal to (v'2 /r'). From this we get the well known expression for the circular speed (v’) due to the gravitational force of the exponential disk (see for example reference 7).

Rd is a radial scale length dependent on the galaxy.

I0, K0 are modified Bessel functions of the first kind and I1, K1 are modified Bessel functions of the second kind.
From equation 1 the rotational speed measured by the earth based observer is then given by:

Equation (3) is used to fit the theory to the experimental data. In the non linear fitting procedure u0 and ω are treated as adjustable parameters.
IV. Results of Fitting to Selected Galaxies
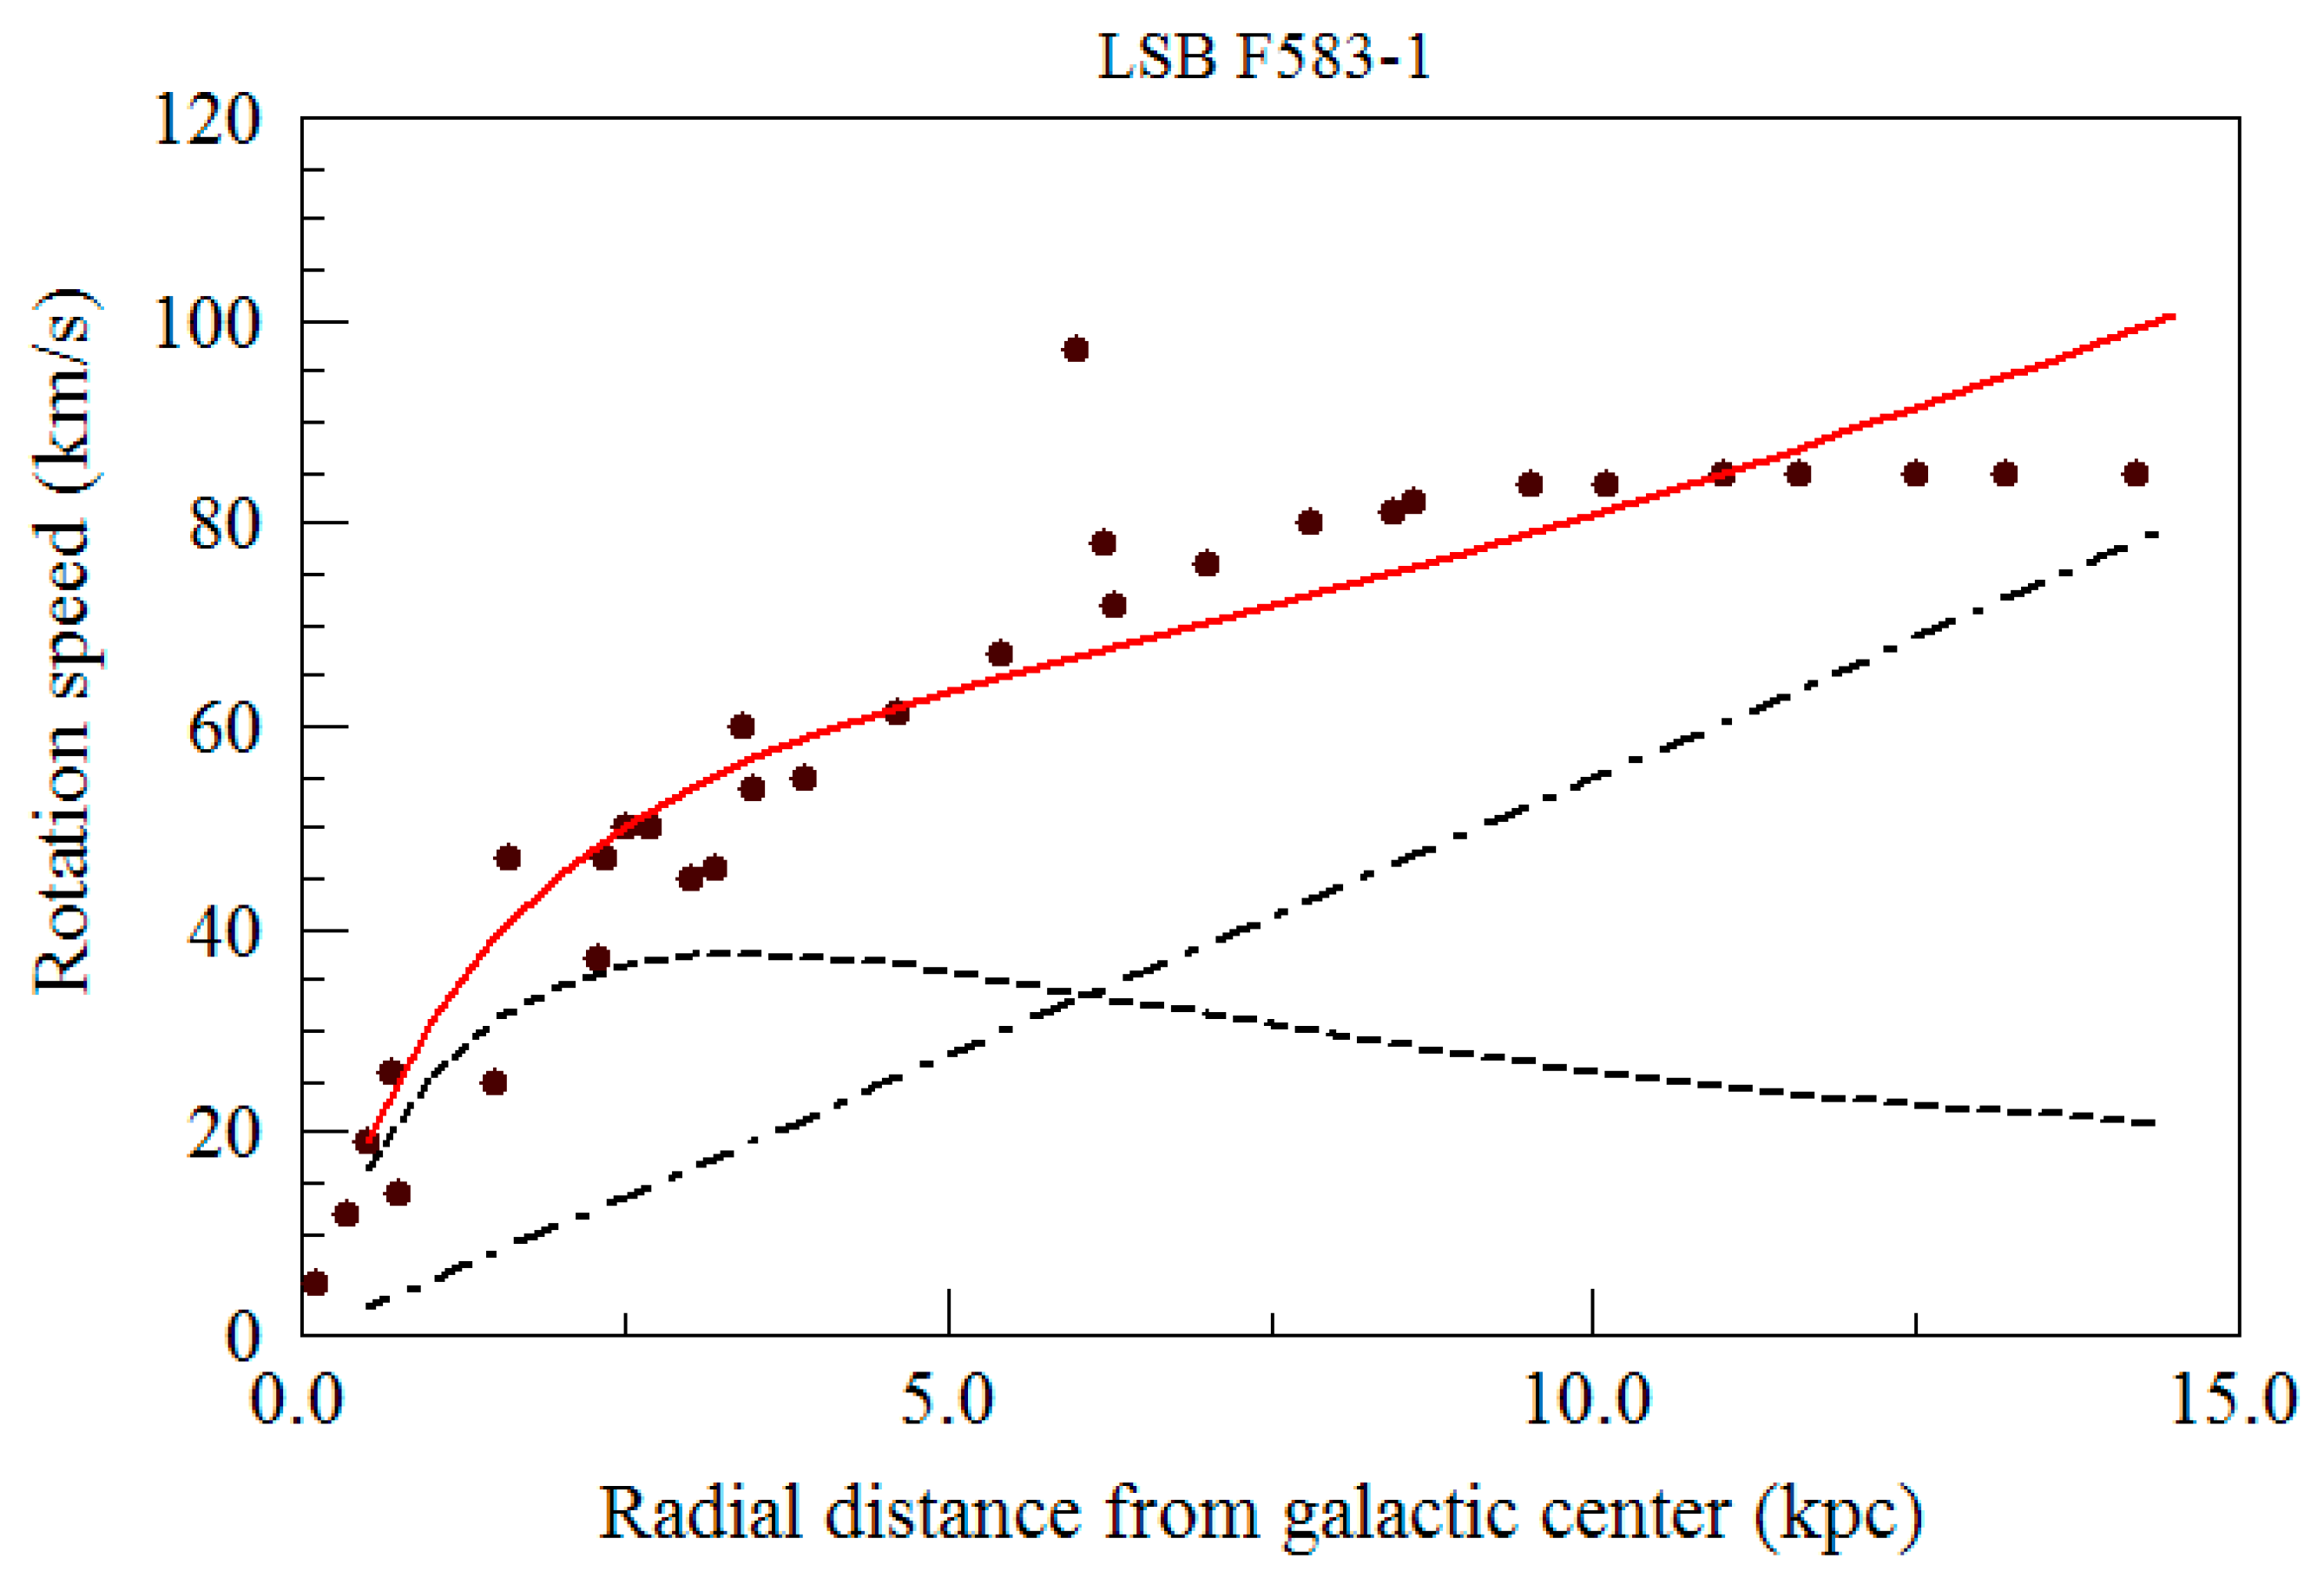
To illustrate the application of equation (3) to the experimental data we have chosen the 3 galaxies listed in Table 1.

Table 1 lists the galaxies studied in this paper. Column two gives the values of Rd used in the calculations. Column three gives the distance that the galaxies are from earth using a Hubble Constant H0 = 75 (km/s)/Mpc. Columns four and five give the values found for the fitting variables.
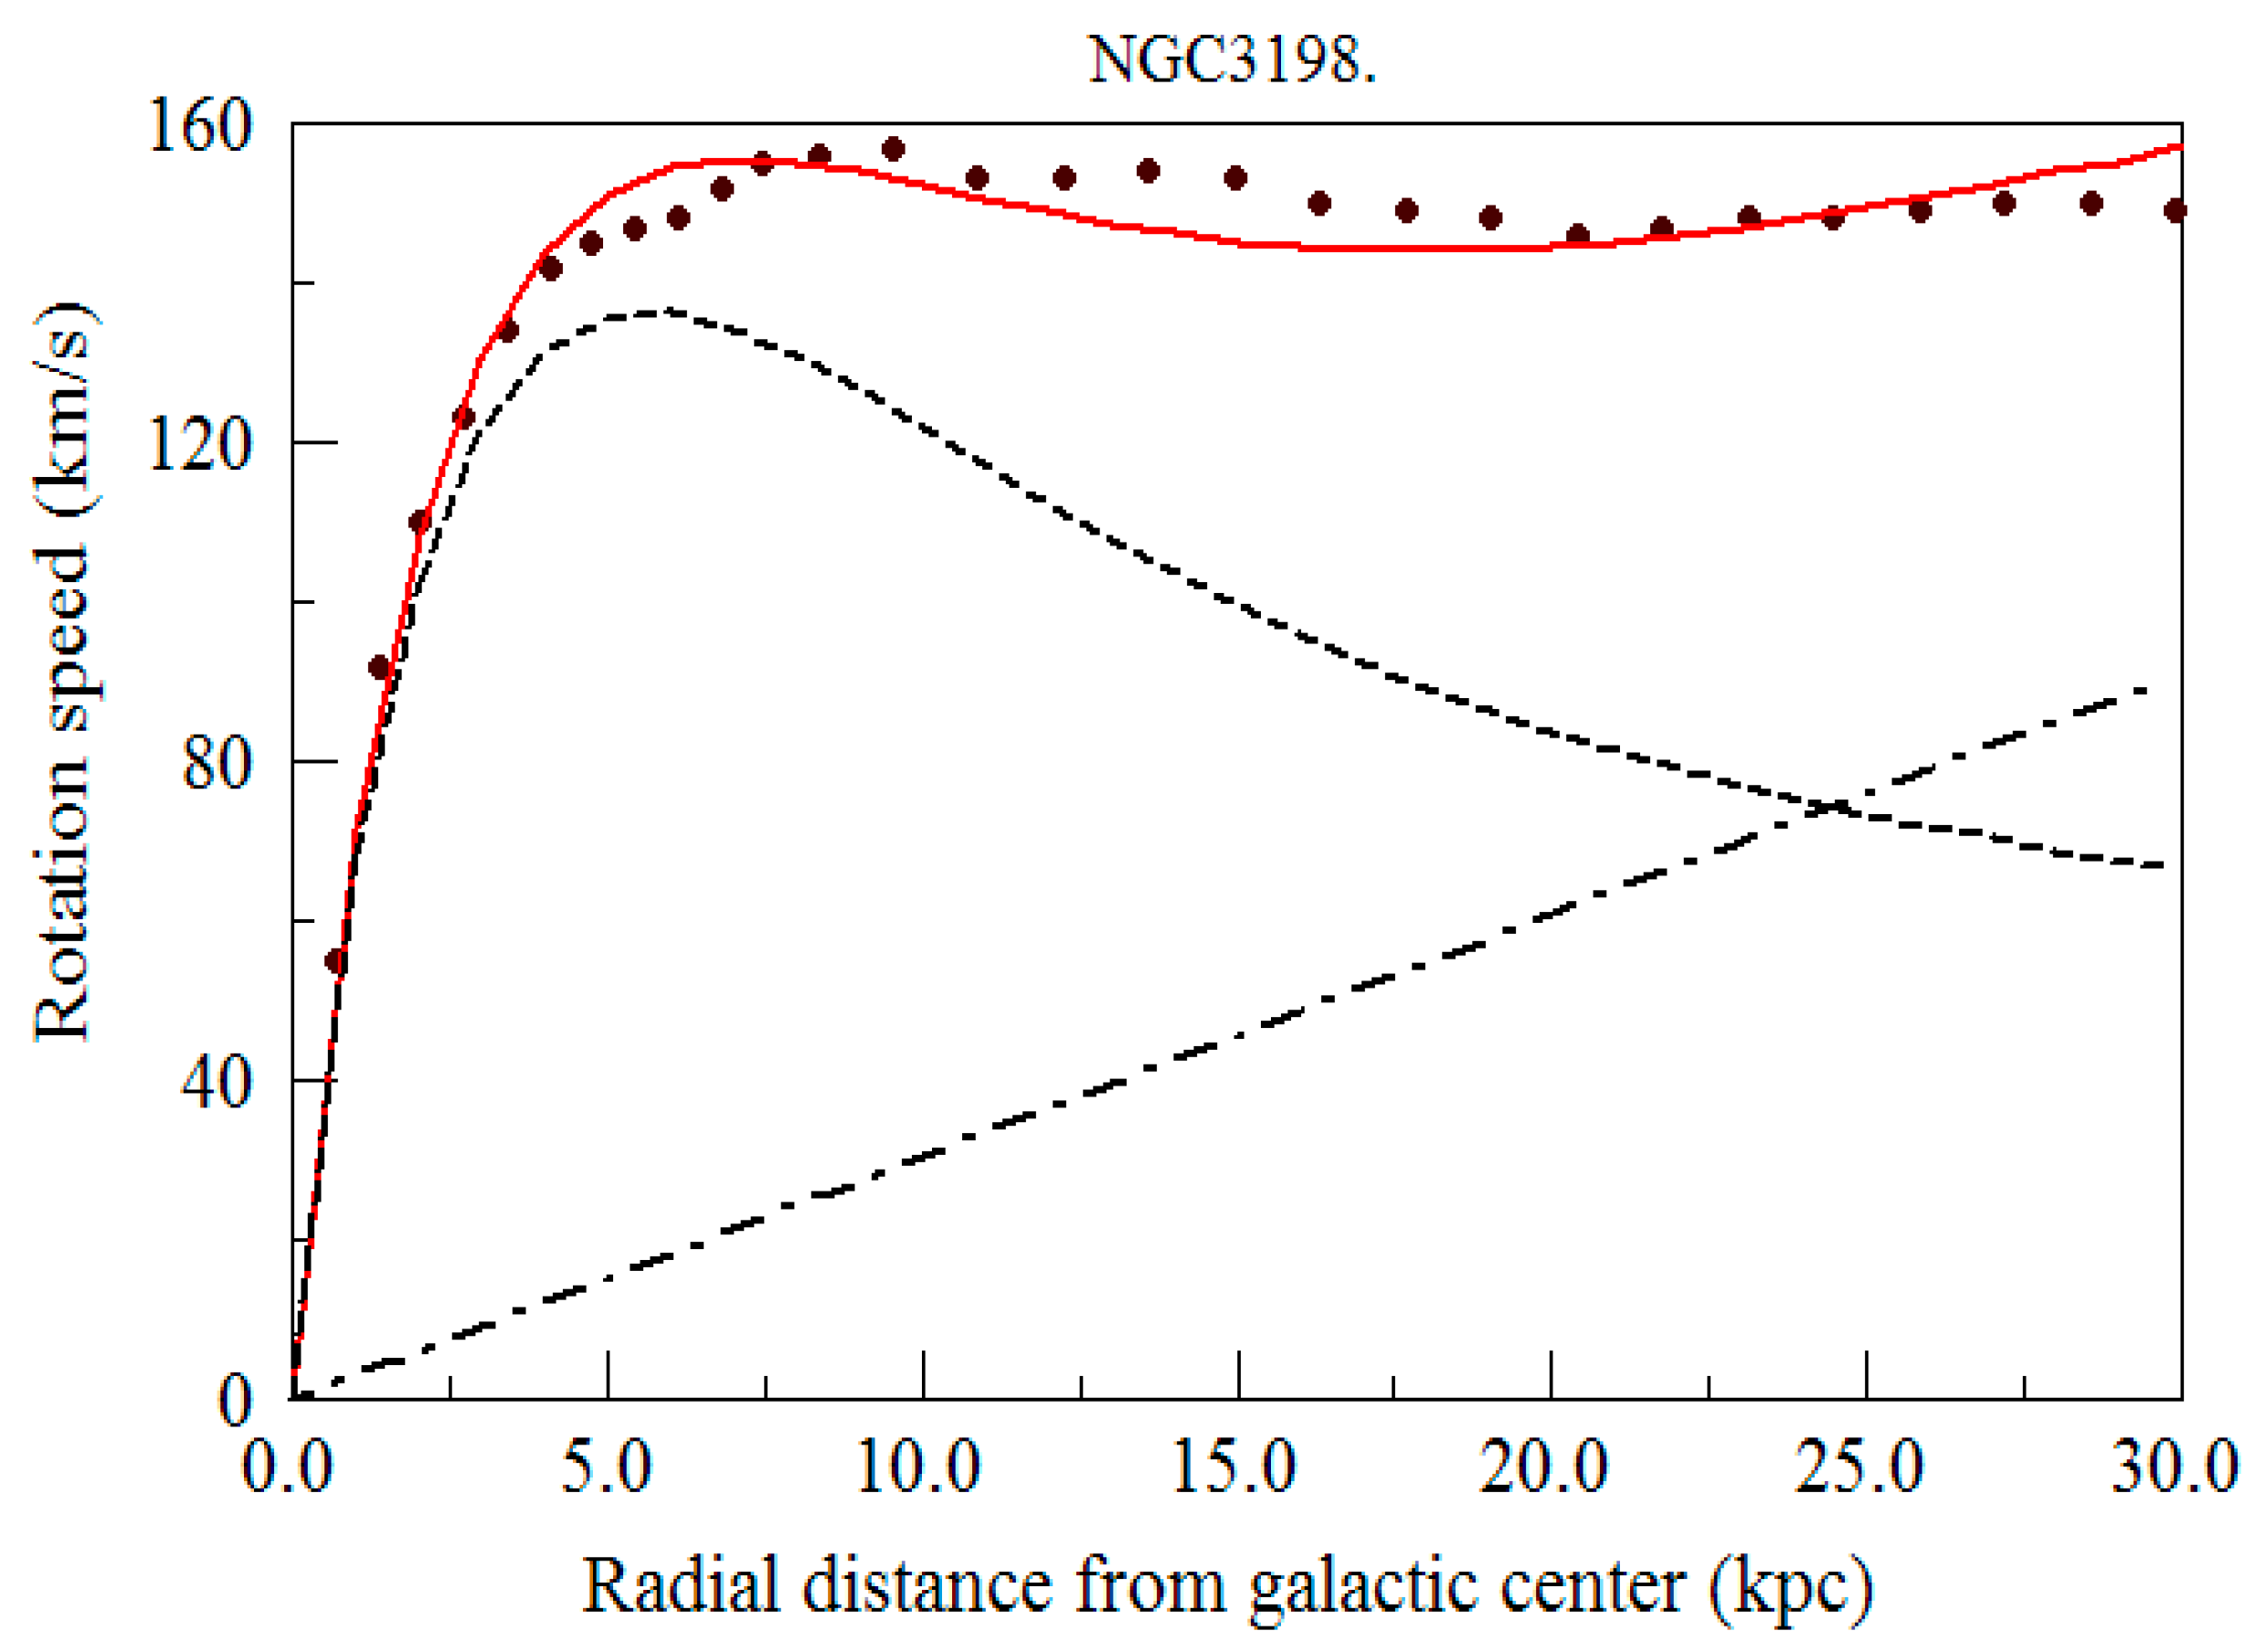
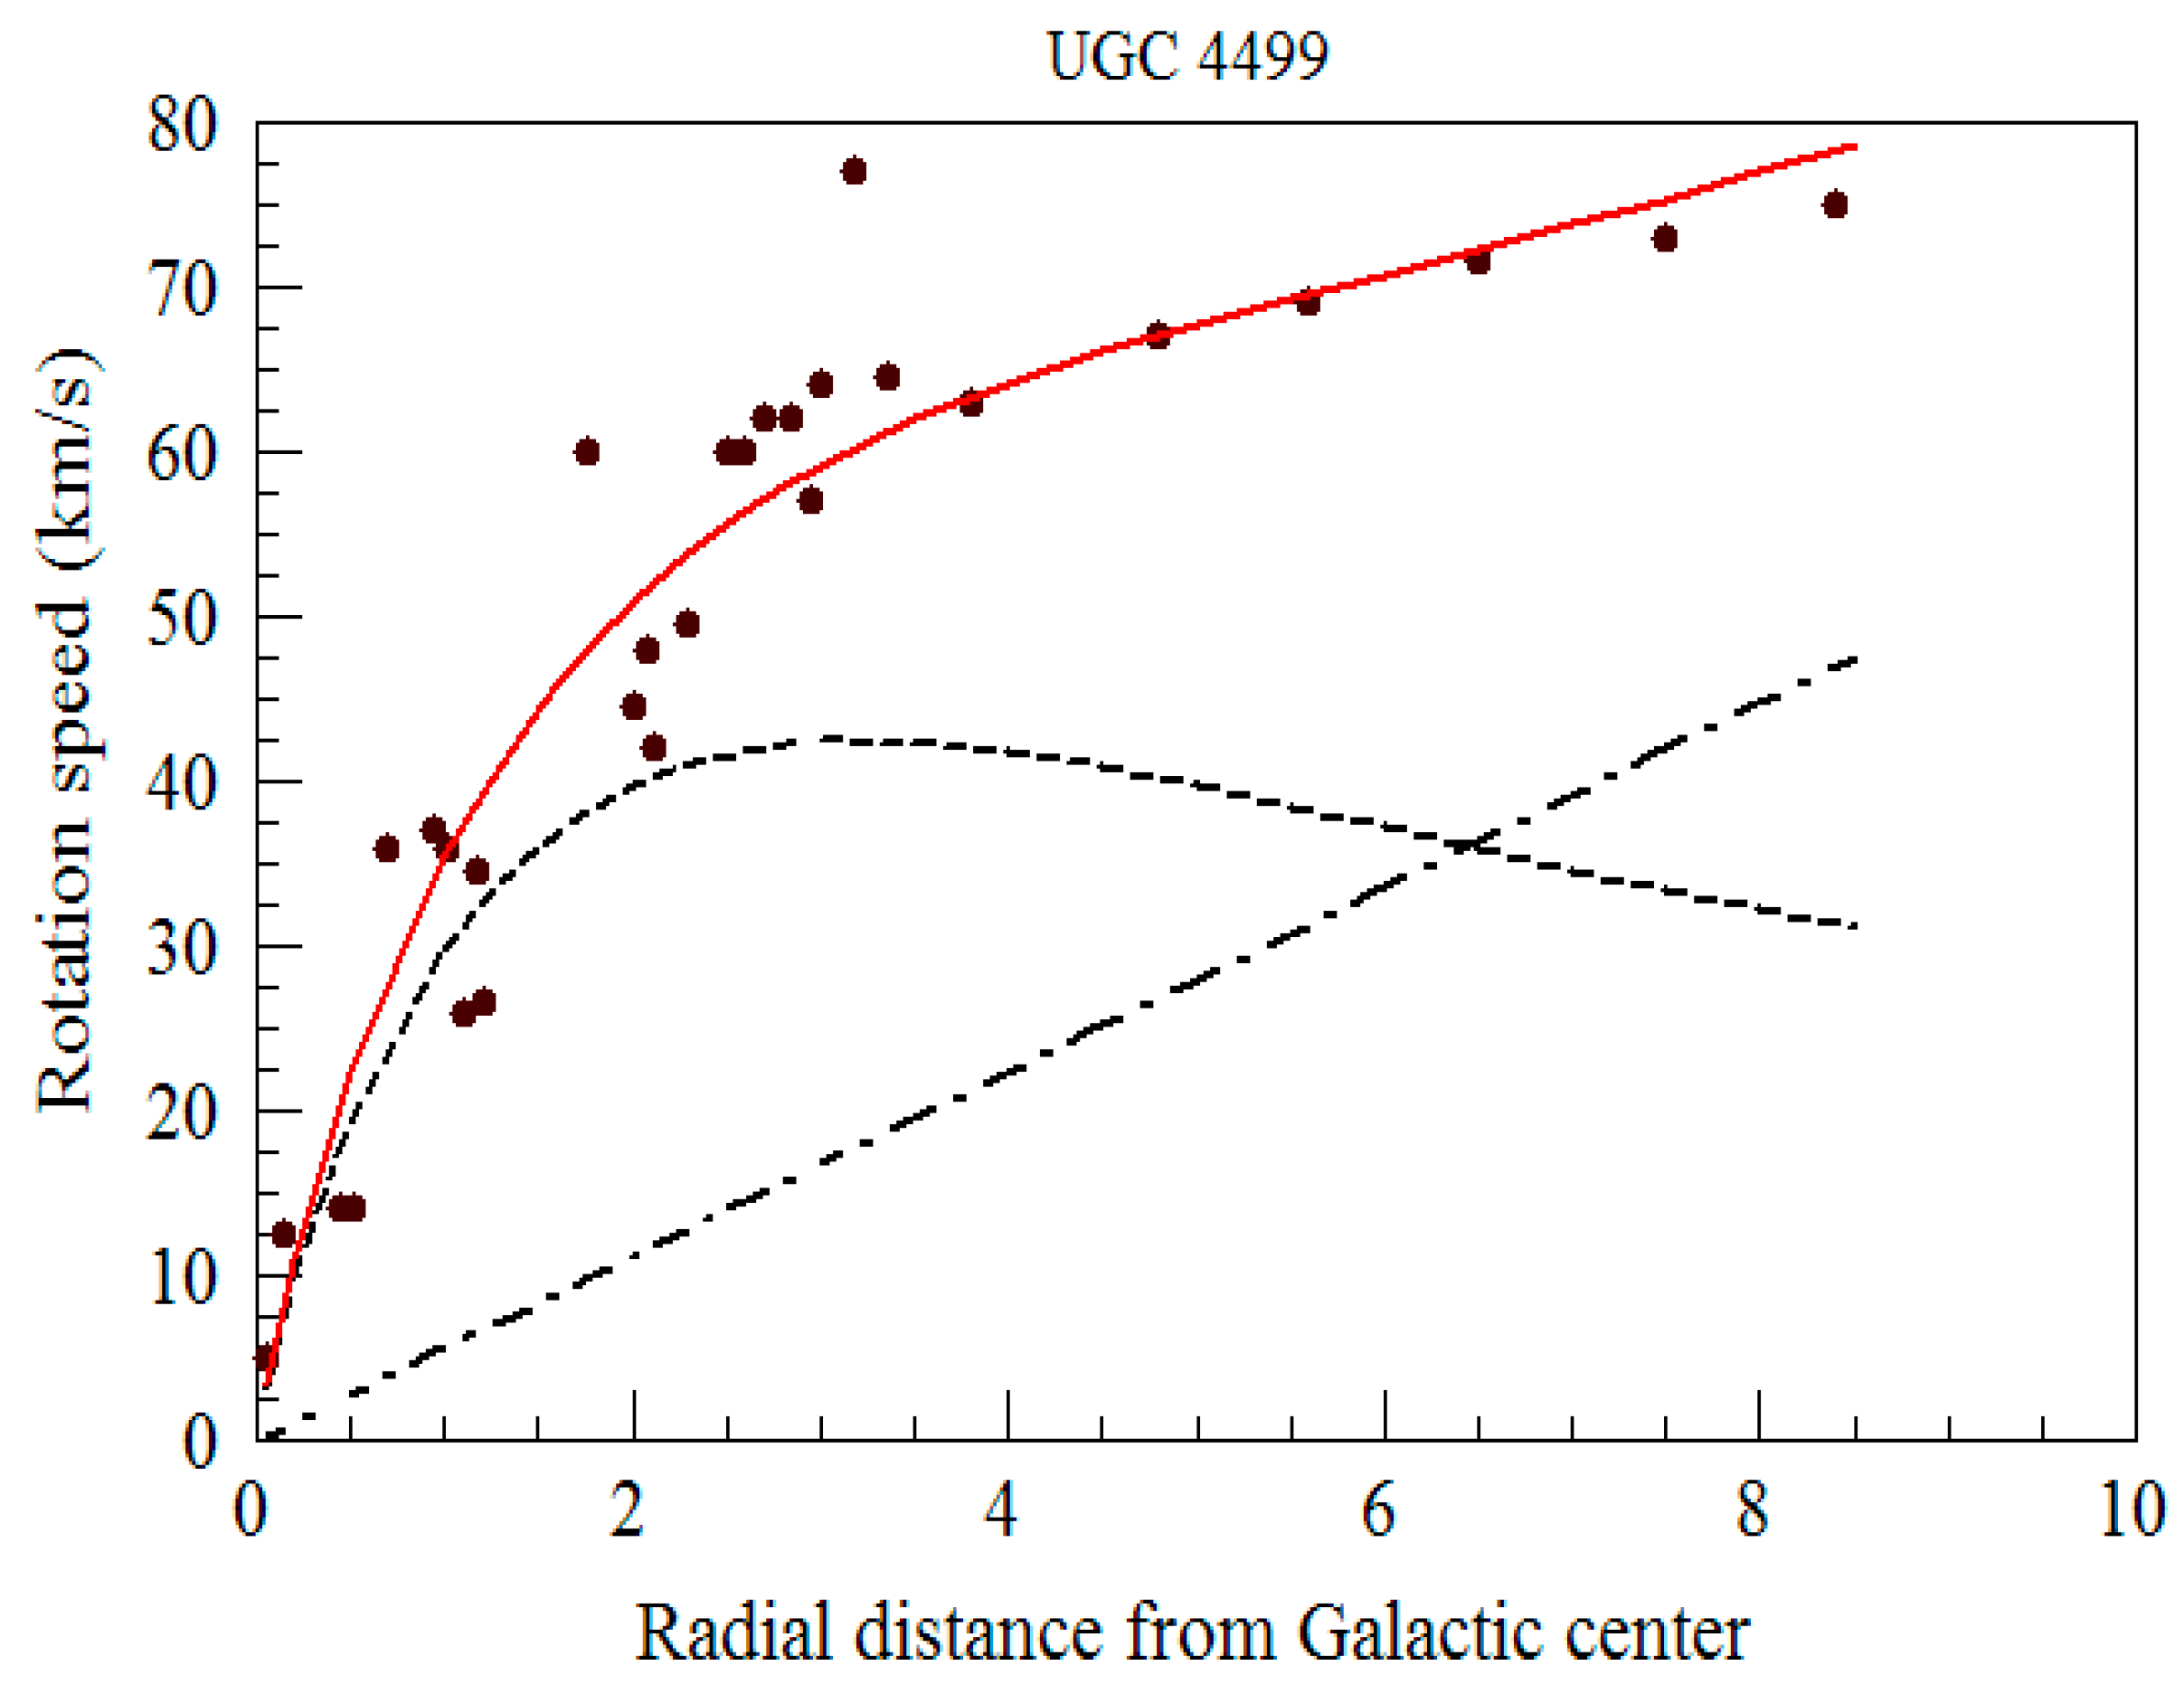
The first galaxy is a typical spiral galaxy (NGC3198) that has been studied by a number of authors. We have used the data given by Begaman5 for this galaxy. The second and third galaxies are a late type dwarf galaxy (UGC4499) and a low surface brightness galaxy (LSBC F583-1) respectively. These two galaxies are usually assumed to be dominated by Dark Matter. Here we have used data taken from figures published by Marchesini et al8
IV. Discussion and Conclusion
From
Figure 3,
Figure 4 and
Figure 5 we see that the agreement between the theoretical framework introduced in this paper and the experimental rotation curve is fairly good given the complexity of the experimental observations and the uncertainty associated with the concept of an “ effective angular velocity”. It should also be noted that there is plenty of room for fine tuning the basic model. For example the mass distribution of the disk is only approximately a decreasing exponential. In addition the disk is often not thin and the angle between ω and r
' will vary due to warping. In addition we have not included a bulge and the possibility of a Bar.
The essential aspect of the model presented in this paper is the prediction of “effective angular velocities (ω)” for the galaxies
It would be interesting to extend the calculations to all spiral galaxies for which data is currently available. Especially relevant would be those galaxies that are assumed to be dominated by Dark Matter such as those studied by Swaters et al in connection with their investigation of MOND (see reference 9). Also of particular interest would be the Milky Way and the Andromeda galaxies for which additional contributions to the disk gravitational field are generally included..
From such a collection of galactic studies it might be possible to establish systematic trends associated with the “effective angular velocity” of the disks. Perhaps the predicted “effective angular velocities” could be related to the morphology of Spiral galaxies (see references 7 and 10 in this regard).
The veracity of the model presented in this paper depends on what is meant by the concept of “effective angular velocity” and whether or not some independent measurements of this can be found. In this regard we note that the baryonic matter in the disk is rotating but the disk is not a merry-go-round. In essence what the present paper does is replace the mysterious Dark Matter with a somewhat less mysterious “effective angular velocity”. Acceptance of this would lead to a monumental shift in the Lamda CDM paradigm. In addition, the impact on Dark Matter searches and the path forward for particle physics would also be significant.
References
- F.Zwicky,”On the masses of nebulae and clusters of nebulae”, Astrophys. J. 86, 217-246 (1937).
- Vera C. Rubin,W. Kent Ford Jr, and Norbert Thonnard, “Extended rotation curves of high luminosity spiral galaxies IV. Systematic dynamical properties Sa-Sc”, Astrophys J. 225 (11), L107-L111 (1978).
- M.E.Bacon and Amber Sharrar, “Three ways to obtain flat rotation curves: A problem in computational physics”, Am. J. Phys 78(7) July 2010.
- M.E.Bacon and Amber Sharrar, “Computations of bound orbits in the plane of a galaxy with a flat rotation curve”, Eur.J.Phys.,31 470-489 (2010).
- K.G.Begeman, “H1 Rotation curves of spiral galaxies” Ph.D. Thesis, University of Groningen 1987 (dissertation.ub.rug.nl faculties/1987/k.begaman).
- Grant R. Fowles and George L. Cassiday, Analytic Mechanics, 6th ed (Saunders College Publishing, Harcourt College Publishers) Ch5 page 176 equation 5.2.8 (1990).
- J. Binney and S. Tremaine, Galactic Dynamics (Princeton U.P., Princeton, NJ, 1987) chap 10,.
- Danilo Marchesini, Elena D’Onghia, Guido Chincarini, Claudio Firmani, Paolo Conconi, Emilio Molinari and Andria Zacchei, “Halpa Rotation Curves: The Soft Core Question”, Astrophys J. 575, 801-813, August 2002.
- R. A. Swaters, R. H. Sanders, and S. S. McGaugh,“Testing Modified Newtonian Dynamics with Rotation Curves of Dwarf and Low Surface Brightness Galaxies”, Astrophys J.718, 380-391, (2010).
- Guiseppe Bertin, Dynamics of Galaxies (Cambridge University Press, Cambridge, UK, 2000).
|
Disclaimer/Publisher’s Note: The statements, opinions and data contained in all publications are solely those of the individual author(s) and contributor(s) and not of MDPI and/or the editor(s). MDPI and/or the editor(s) disclaim responsibility for any injury to people or property resulting from any ideas, methods, instructions or products referred to in the content. |
© 2023 by the authors. Licensee MDPI, Basel, Switzerland. This article is an open access article distributed under the terms and conditions of the Creative Commons Attribution (CC BY) license (http://creativecommons.org/licenses/by/4.0/).


