Submitted:
18 April 2023
Posted:
20 April 2023
You are already at the latest version
Abstract
Keywords:
1. Introduction
2. Evidence of Network Criticality
3. Methods
- FIX: fixed signal timing, 50-50 split,
- LQF: “longest queue first” gives the green to the direction with the longest queue; it is a greedy method used here as a proxy for the “best” control,
- RND: “random” control gives the green with equal probability to both directions, akin to no control.
4. Results
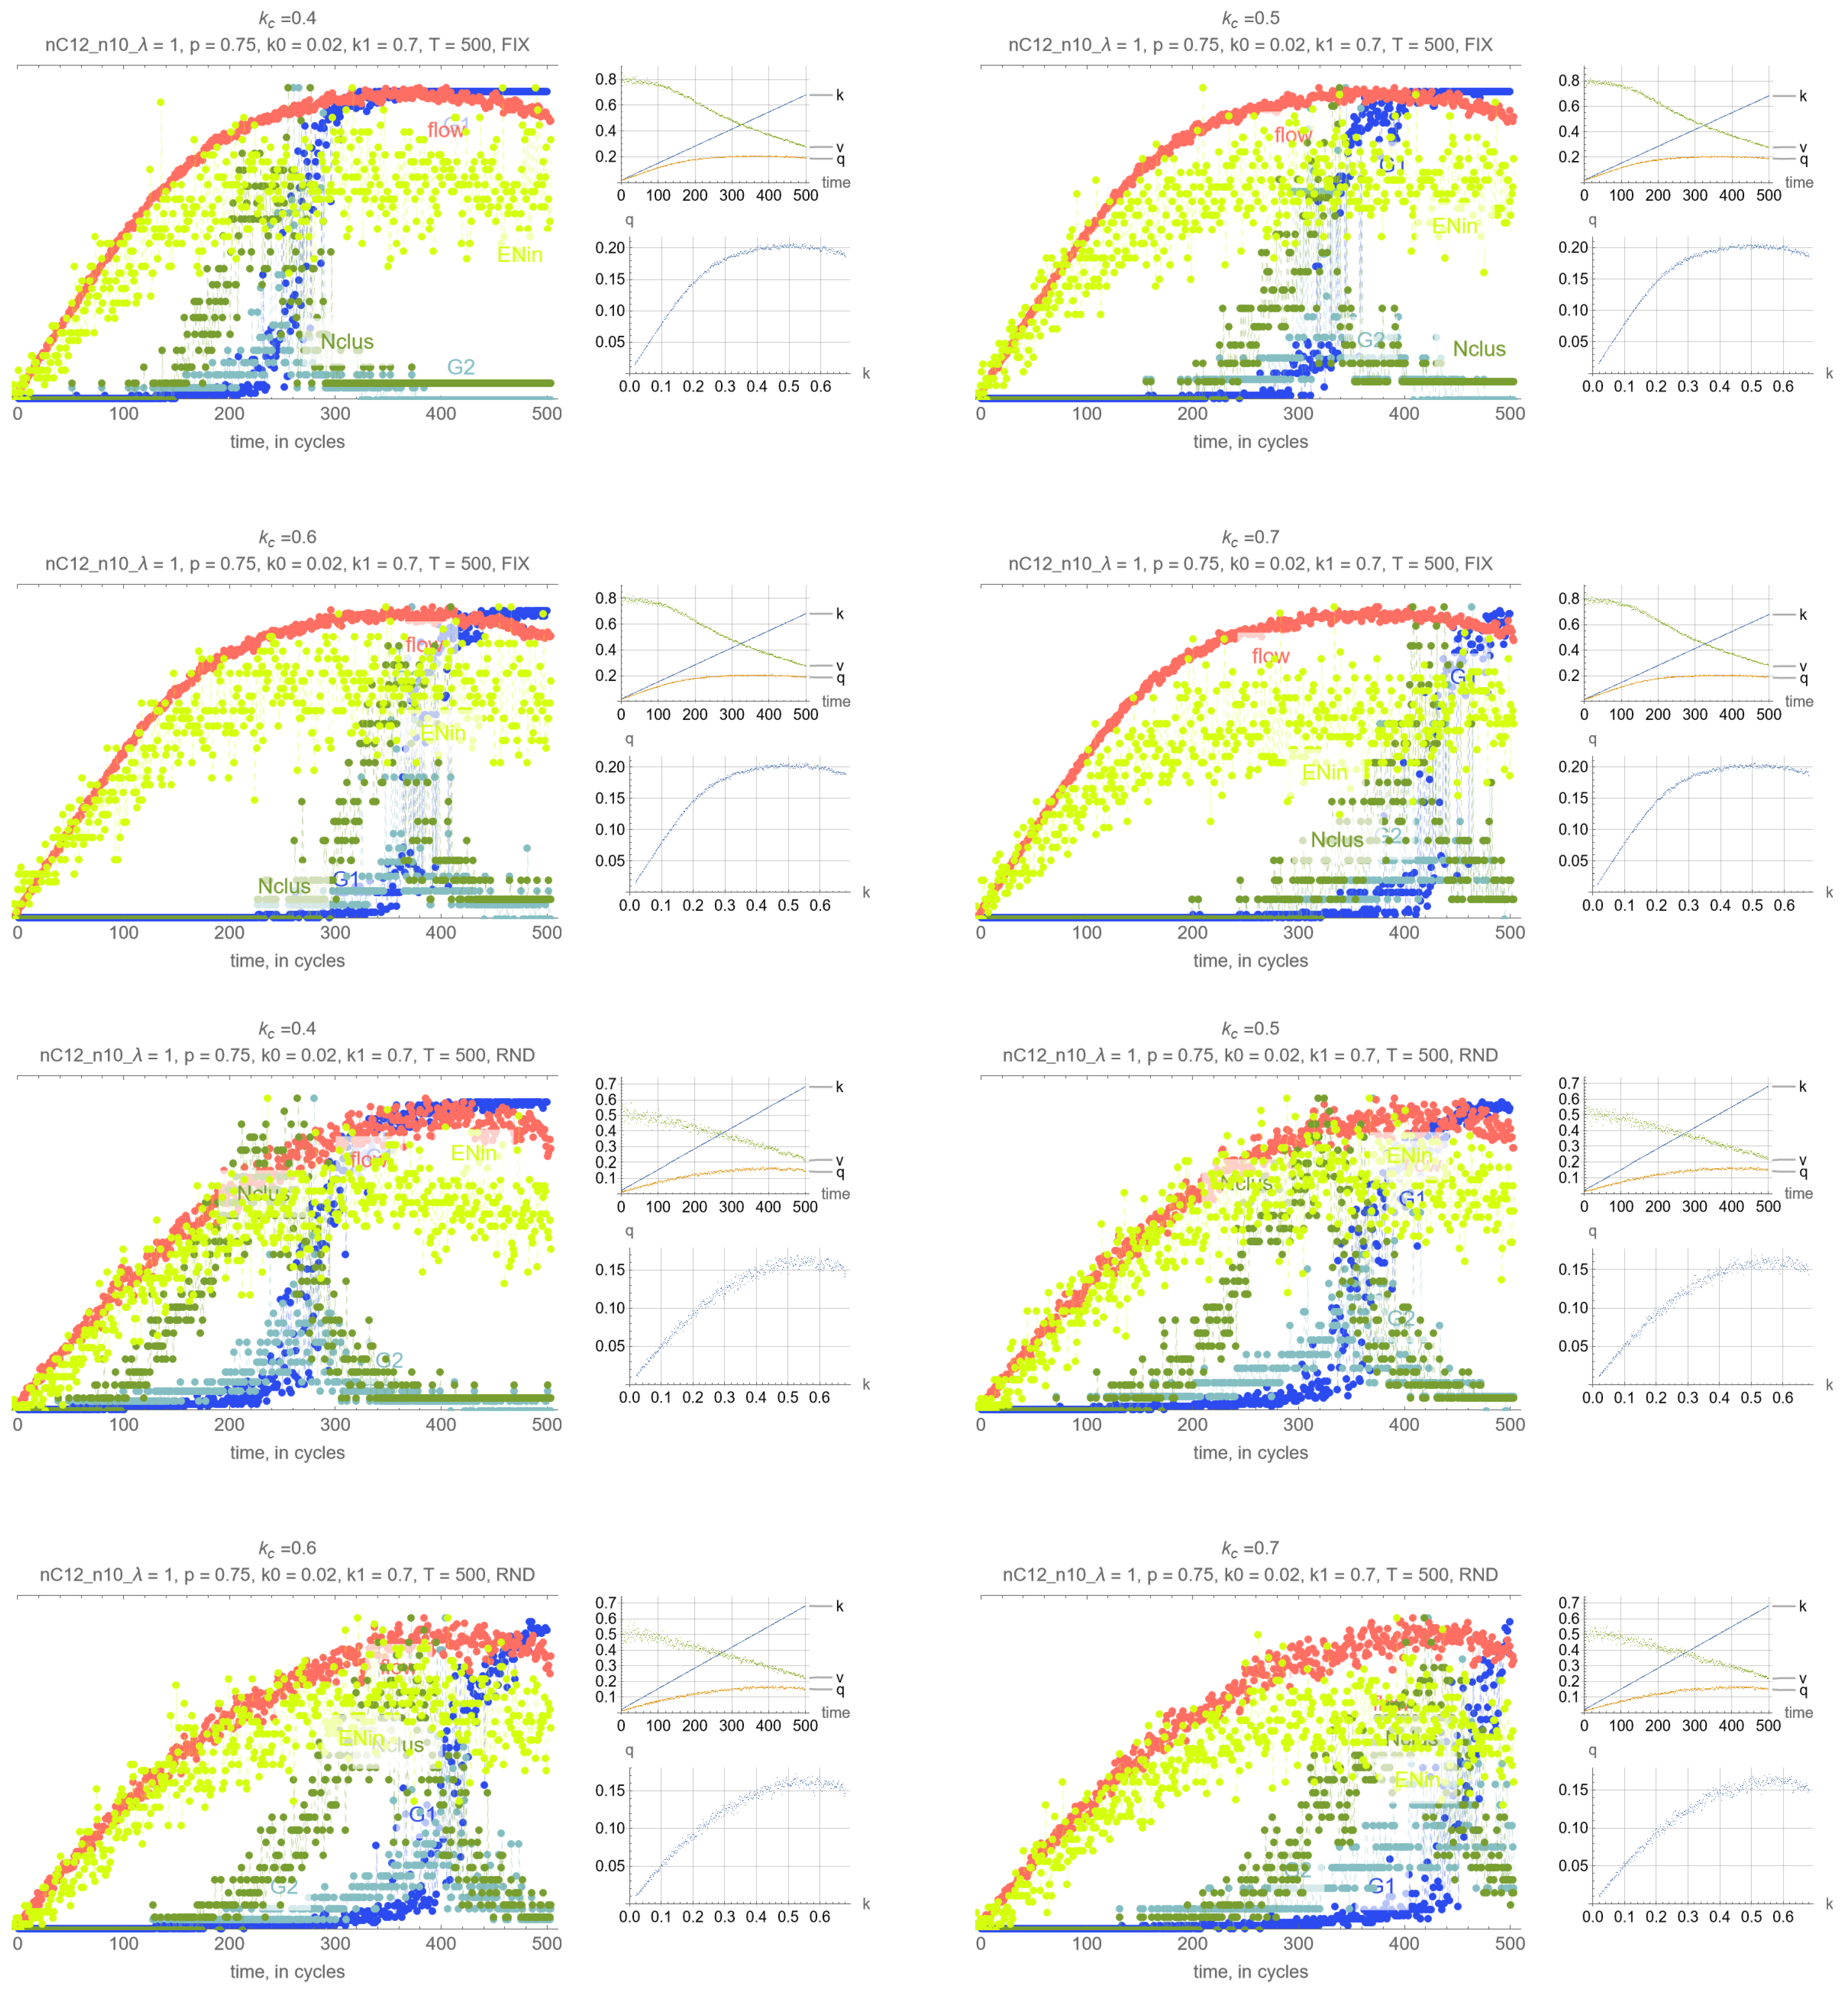
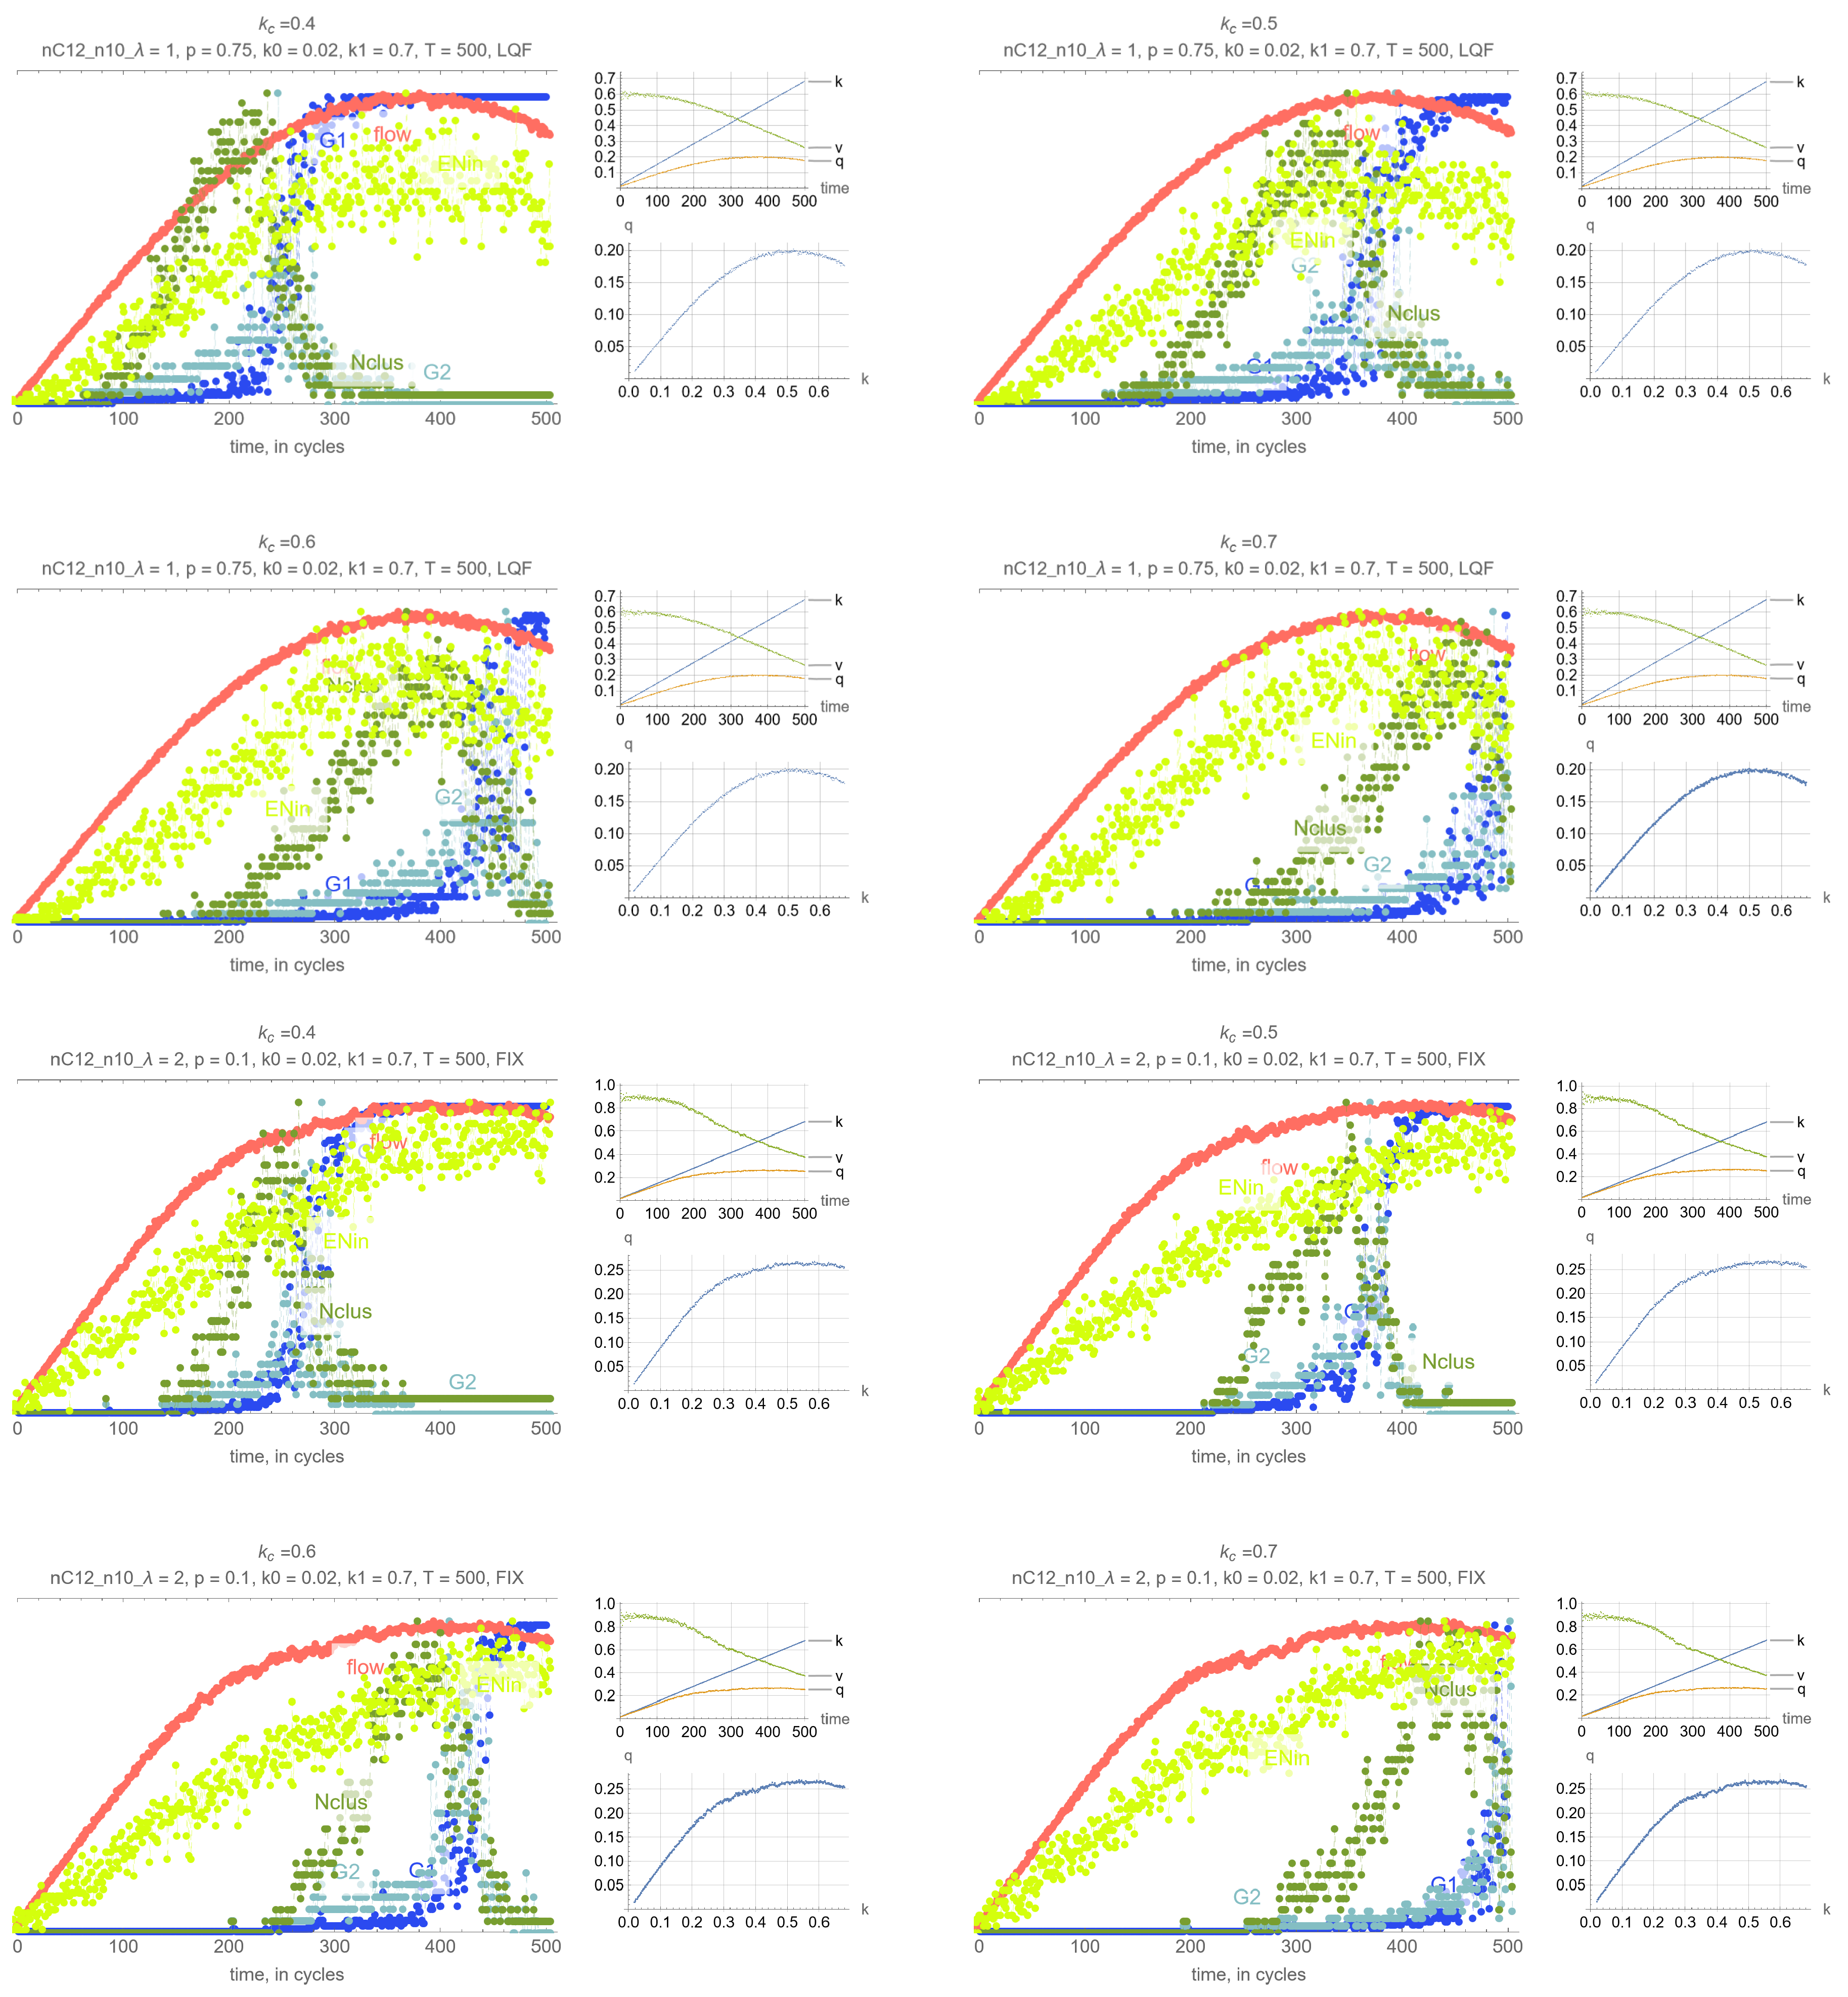
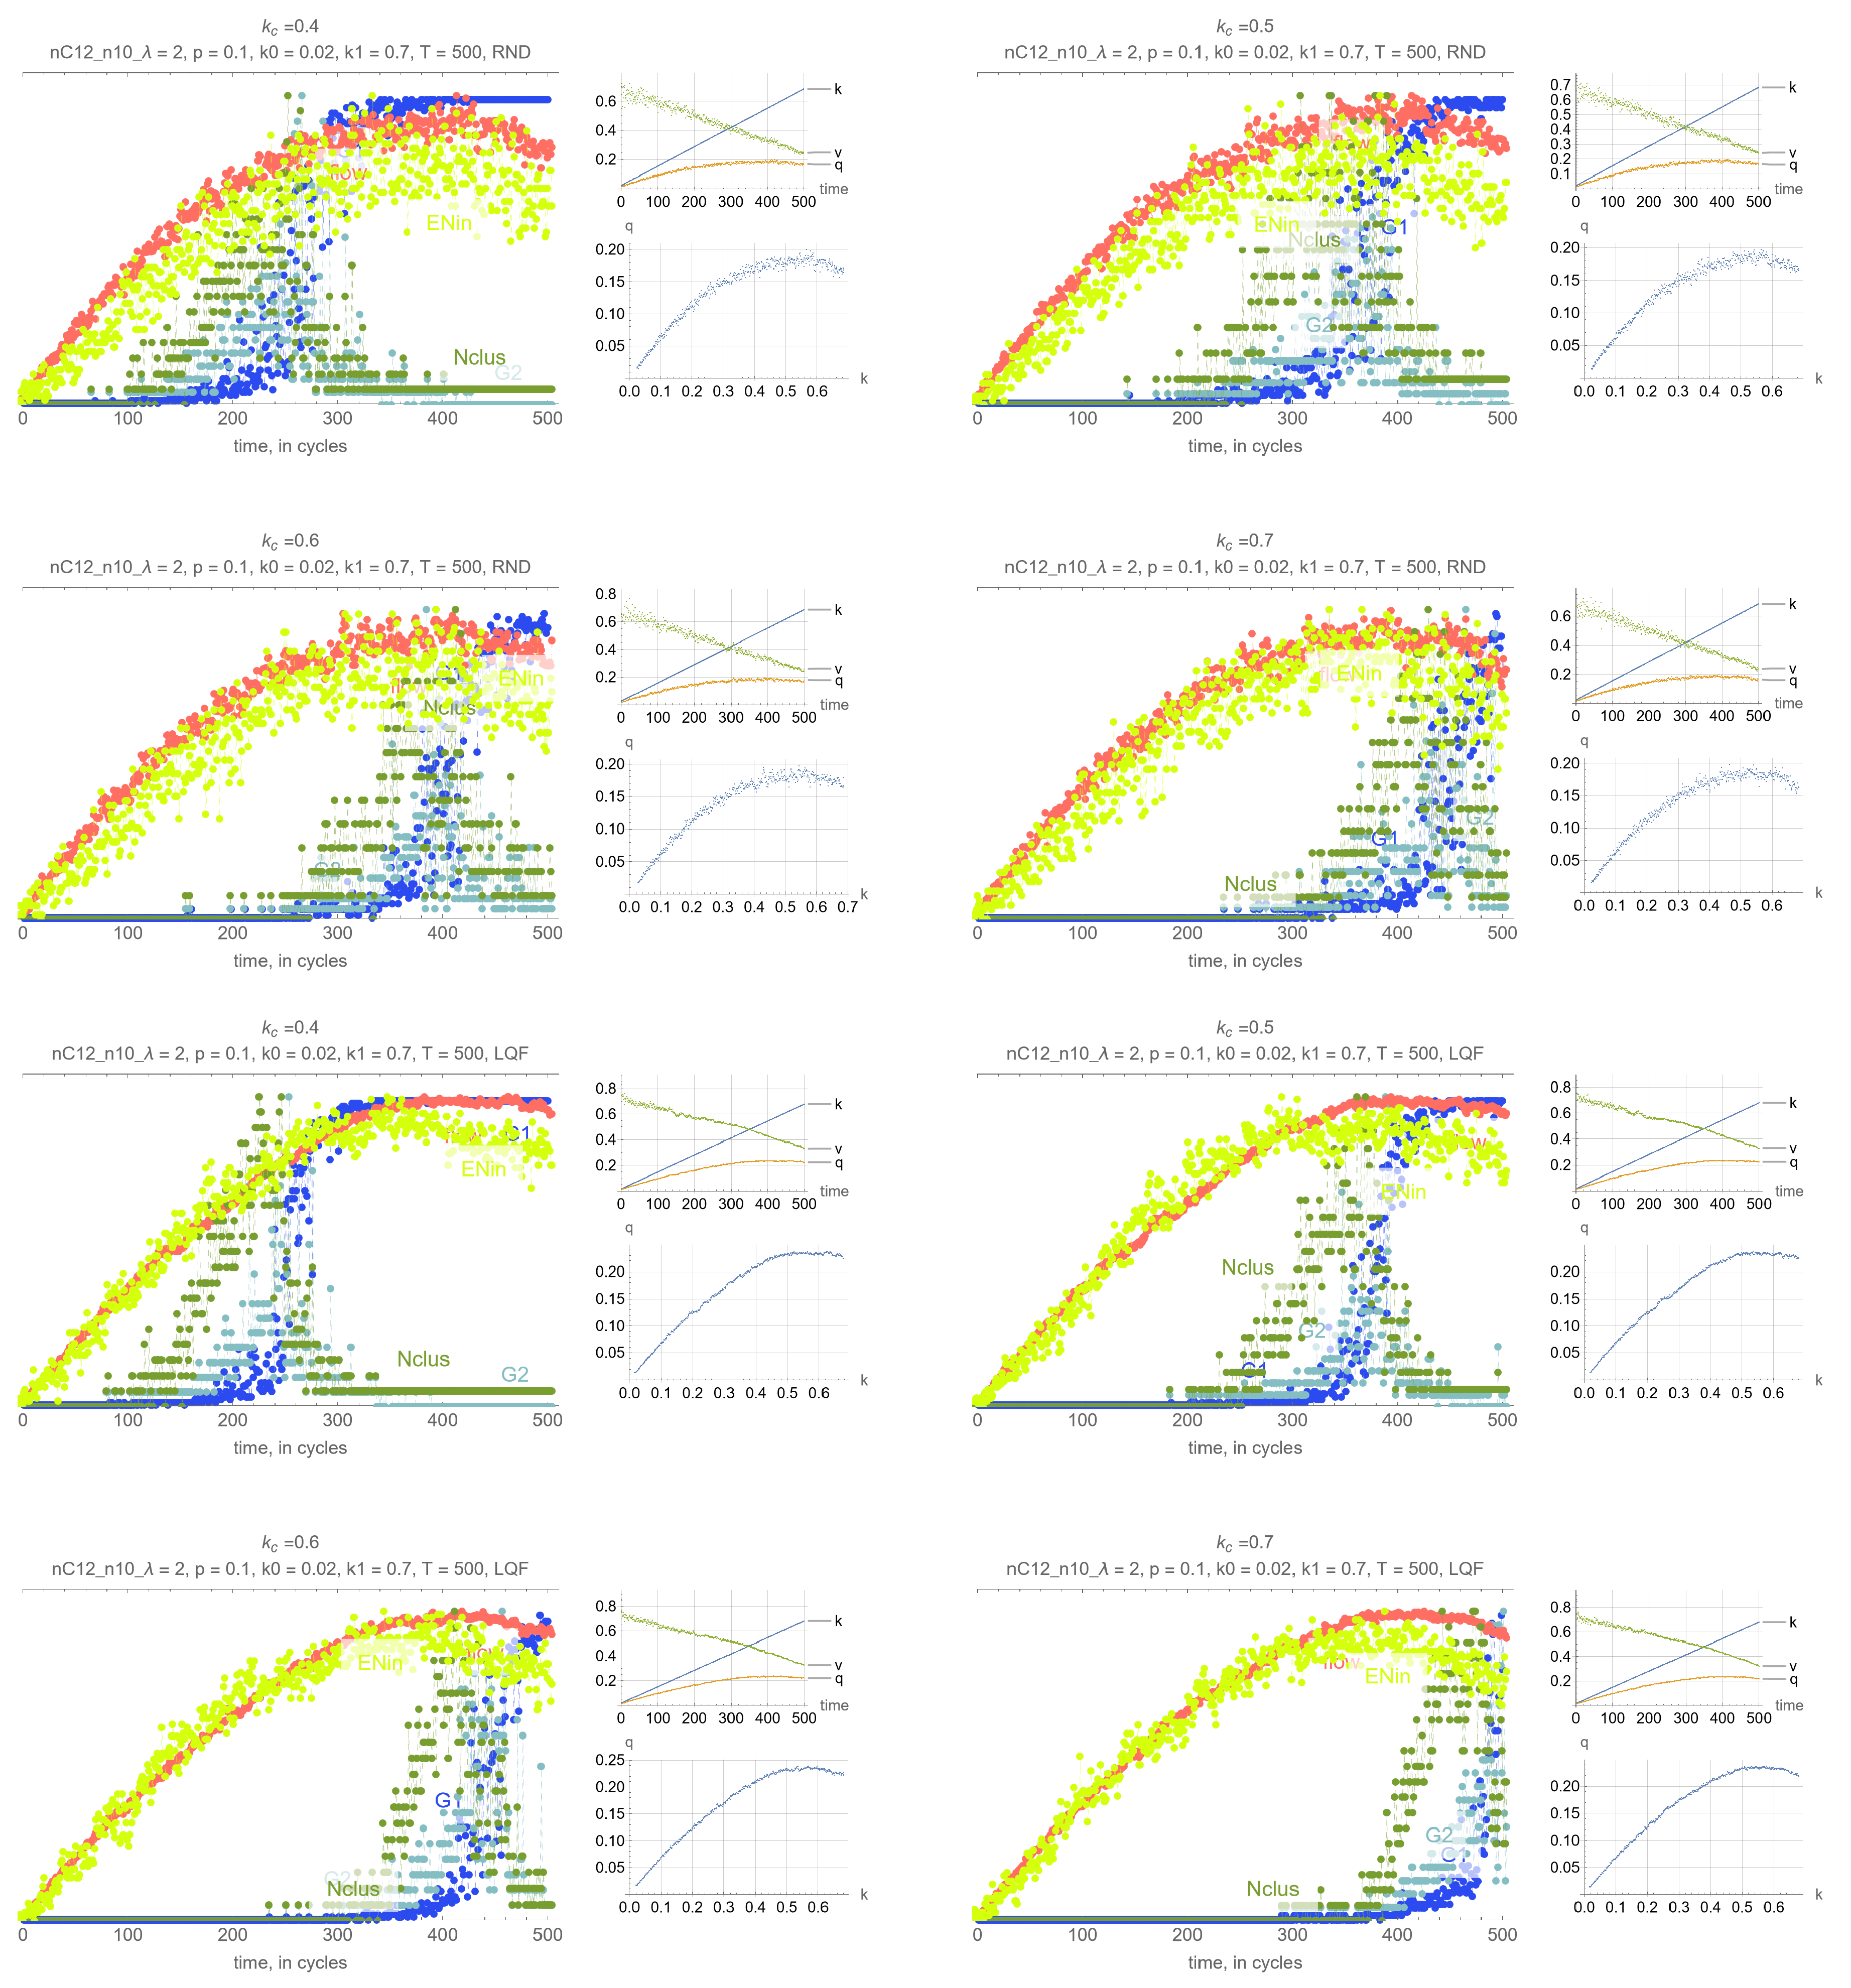
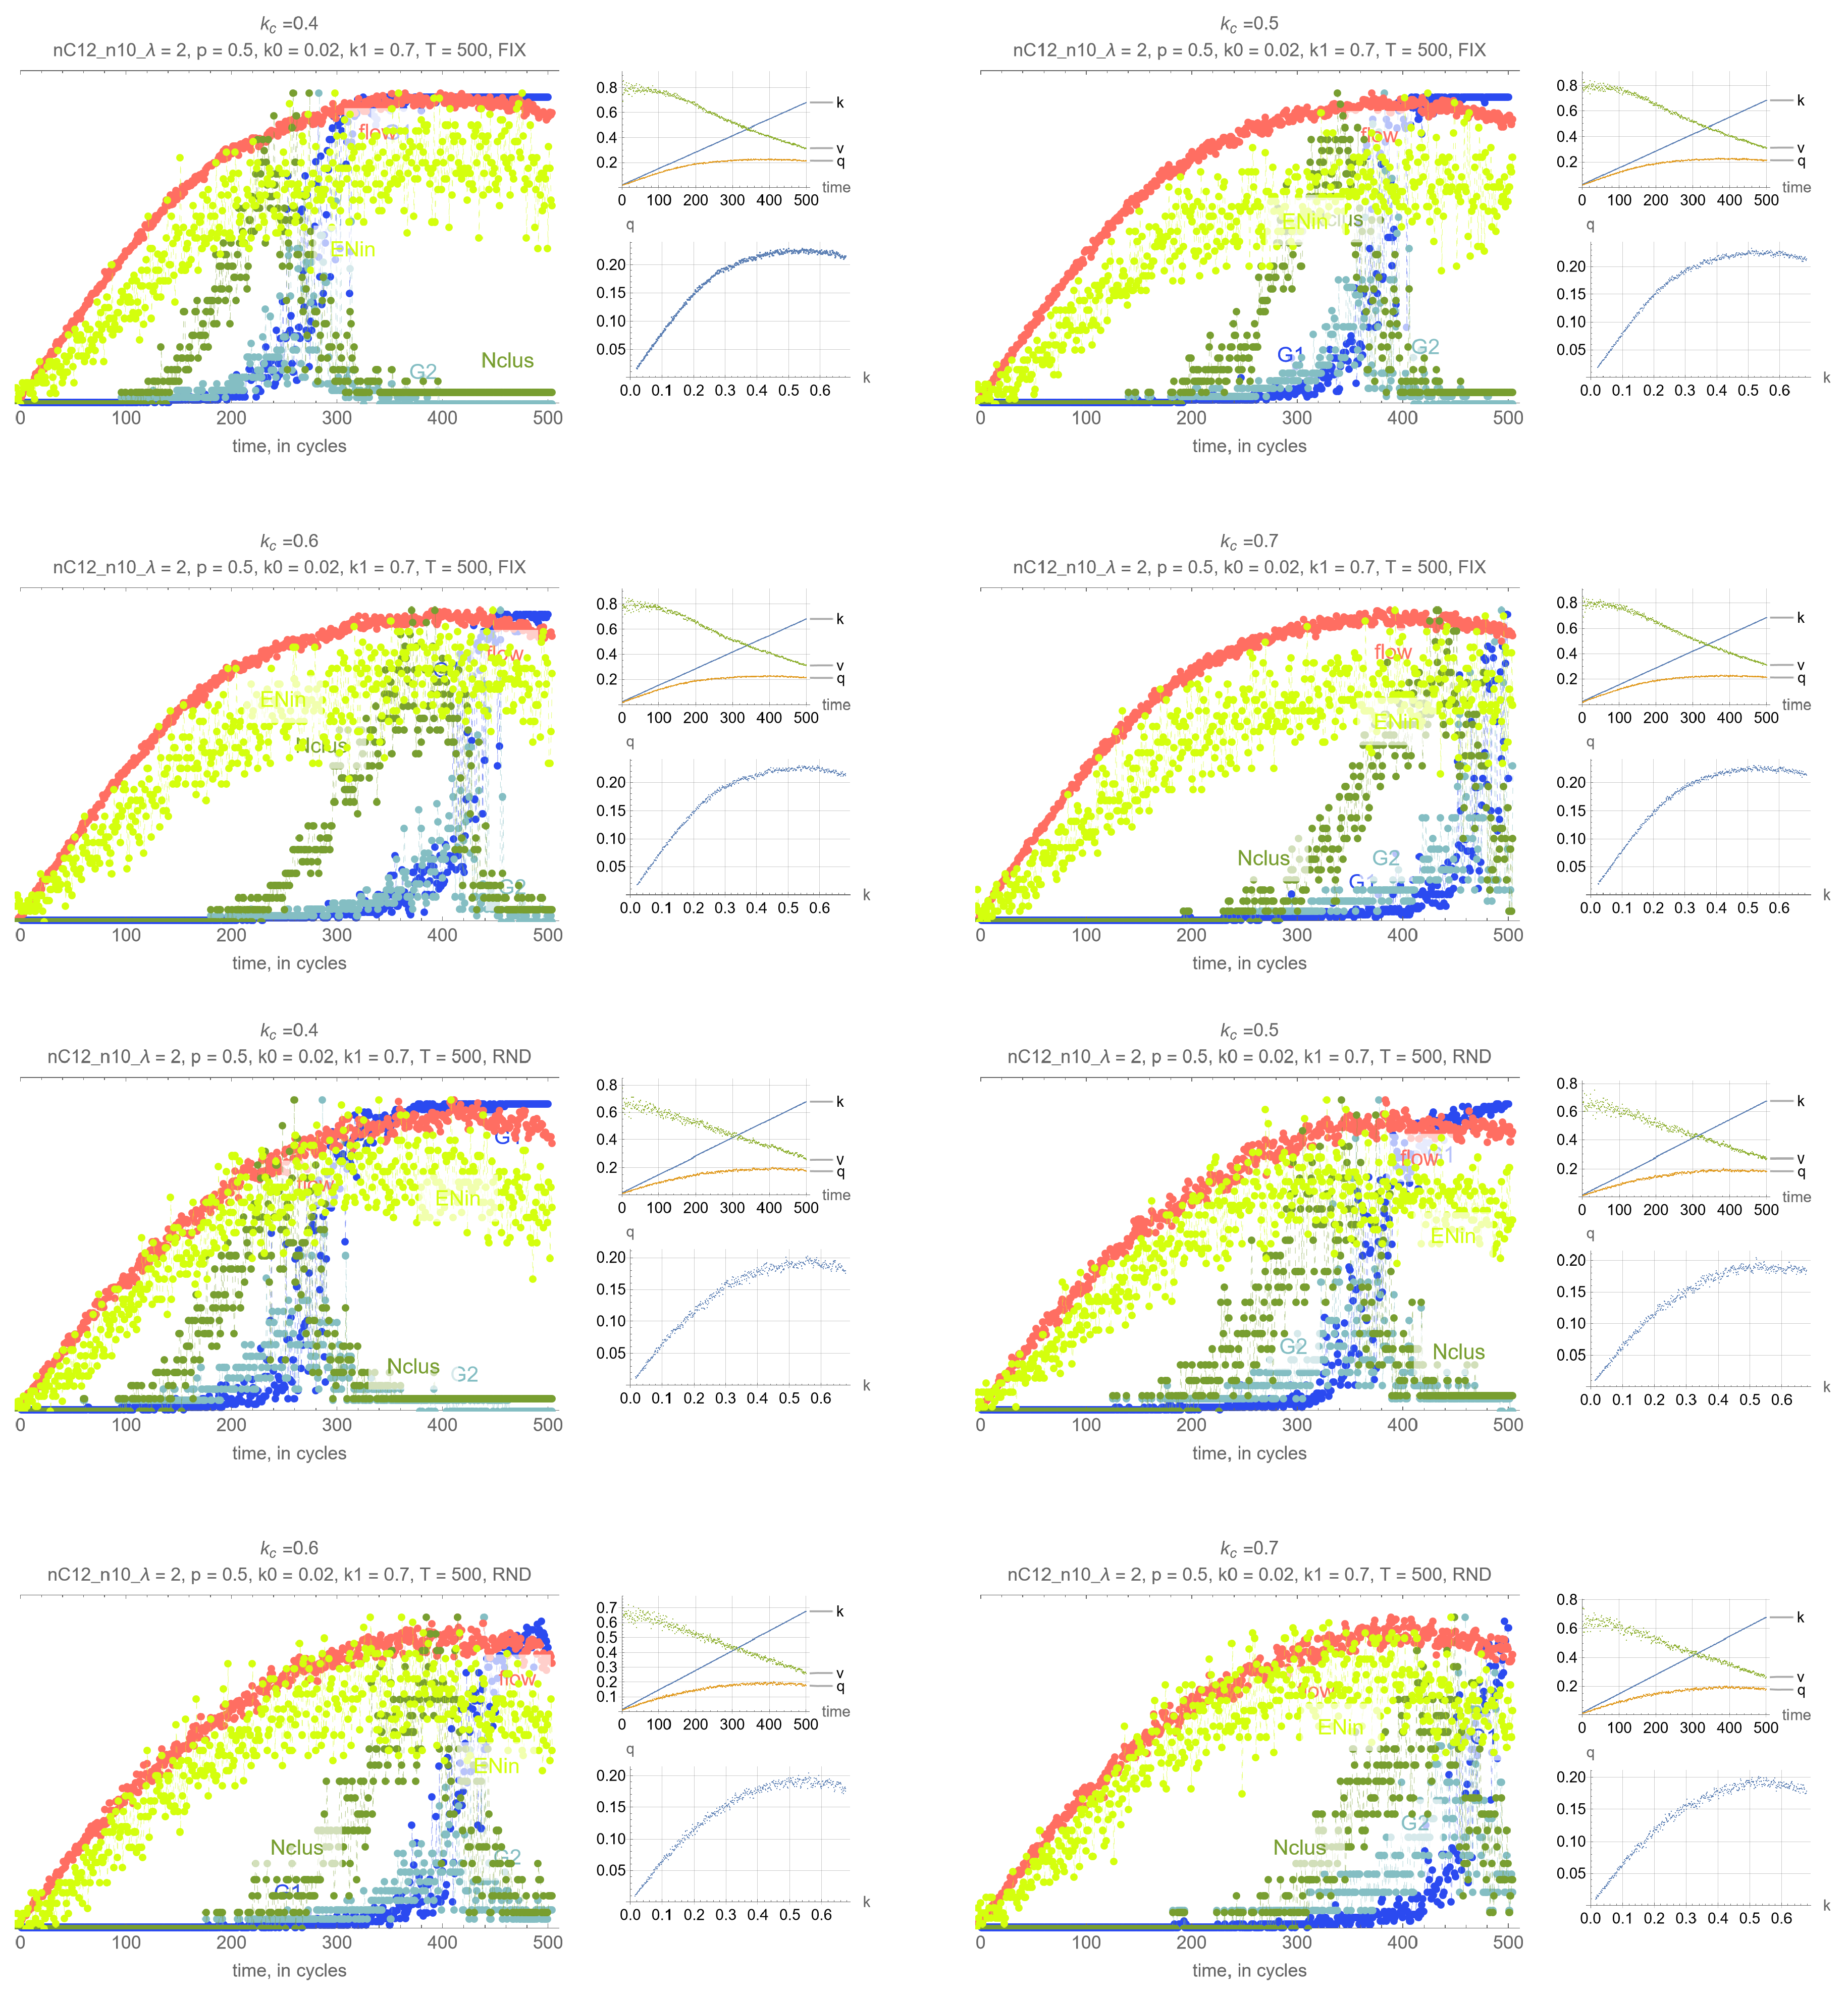
- G: size of the largest connected component (cluster)
- G: size of the 2nd largest component (cluster)
- N: number of clusters
- R-1
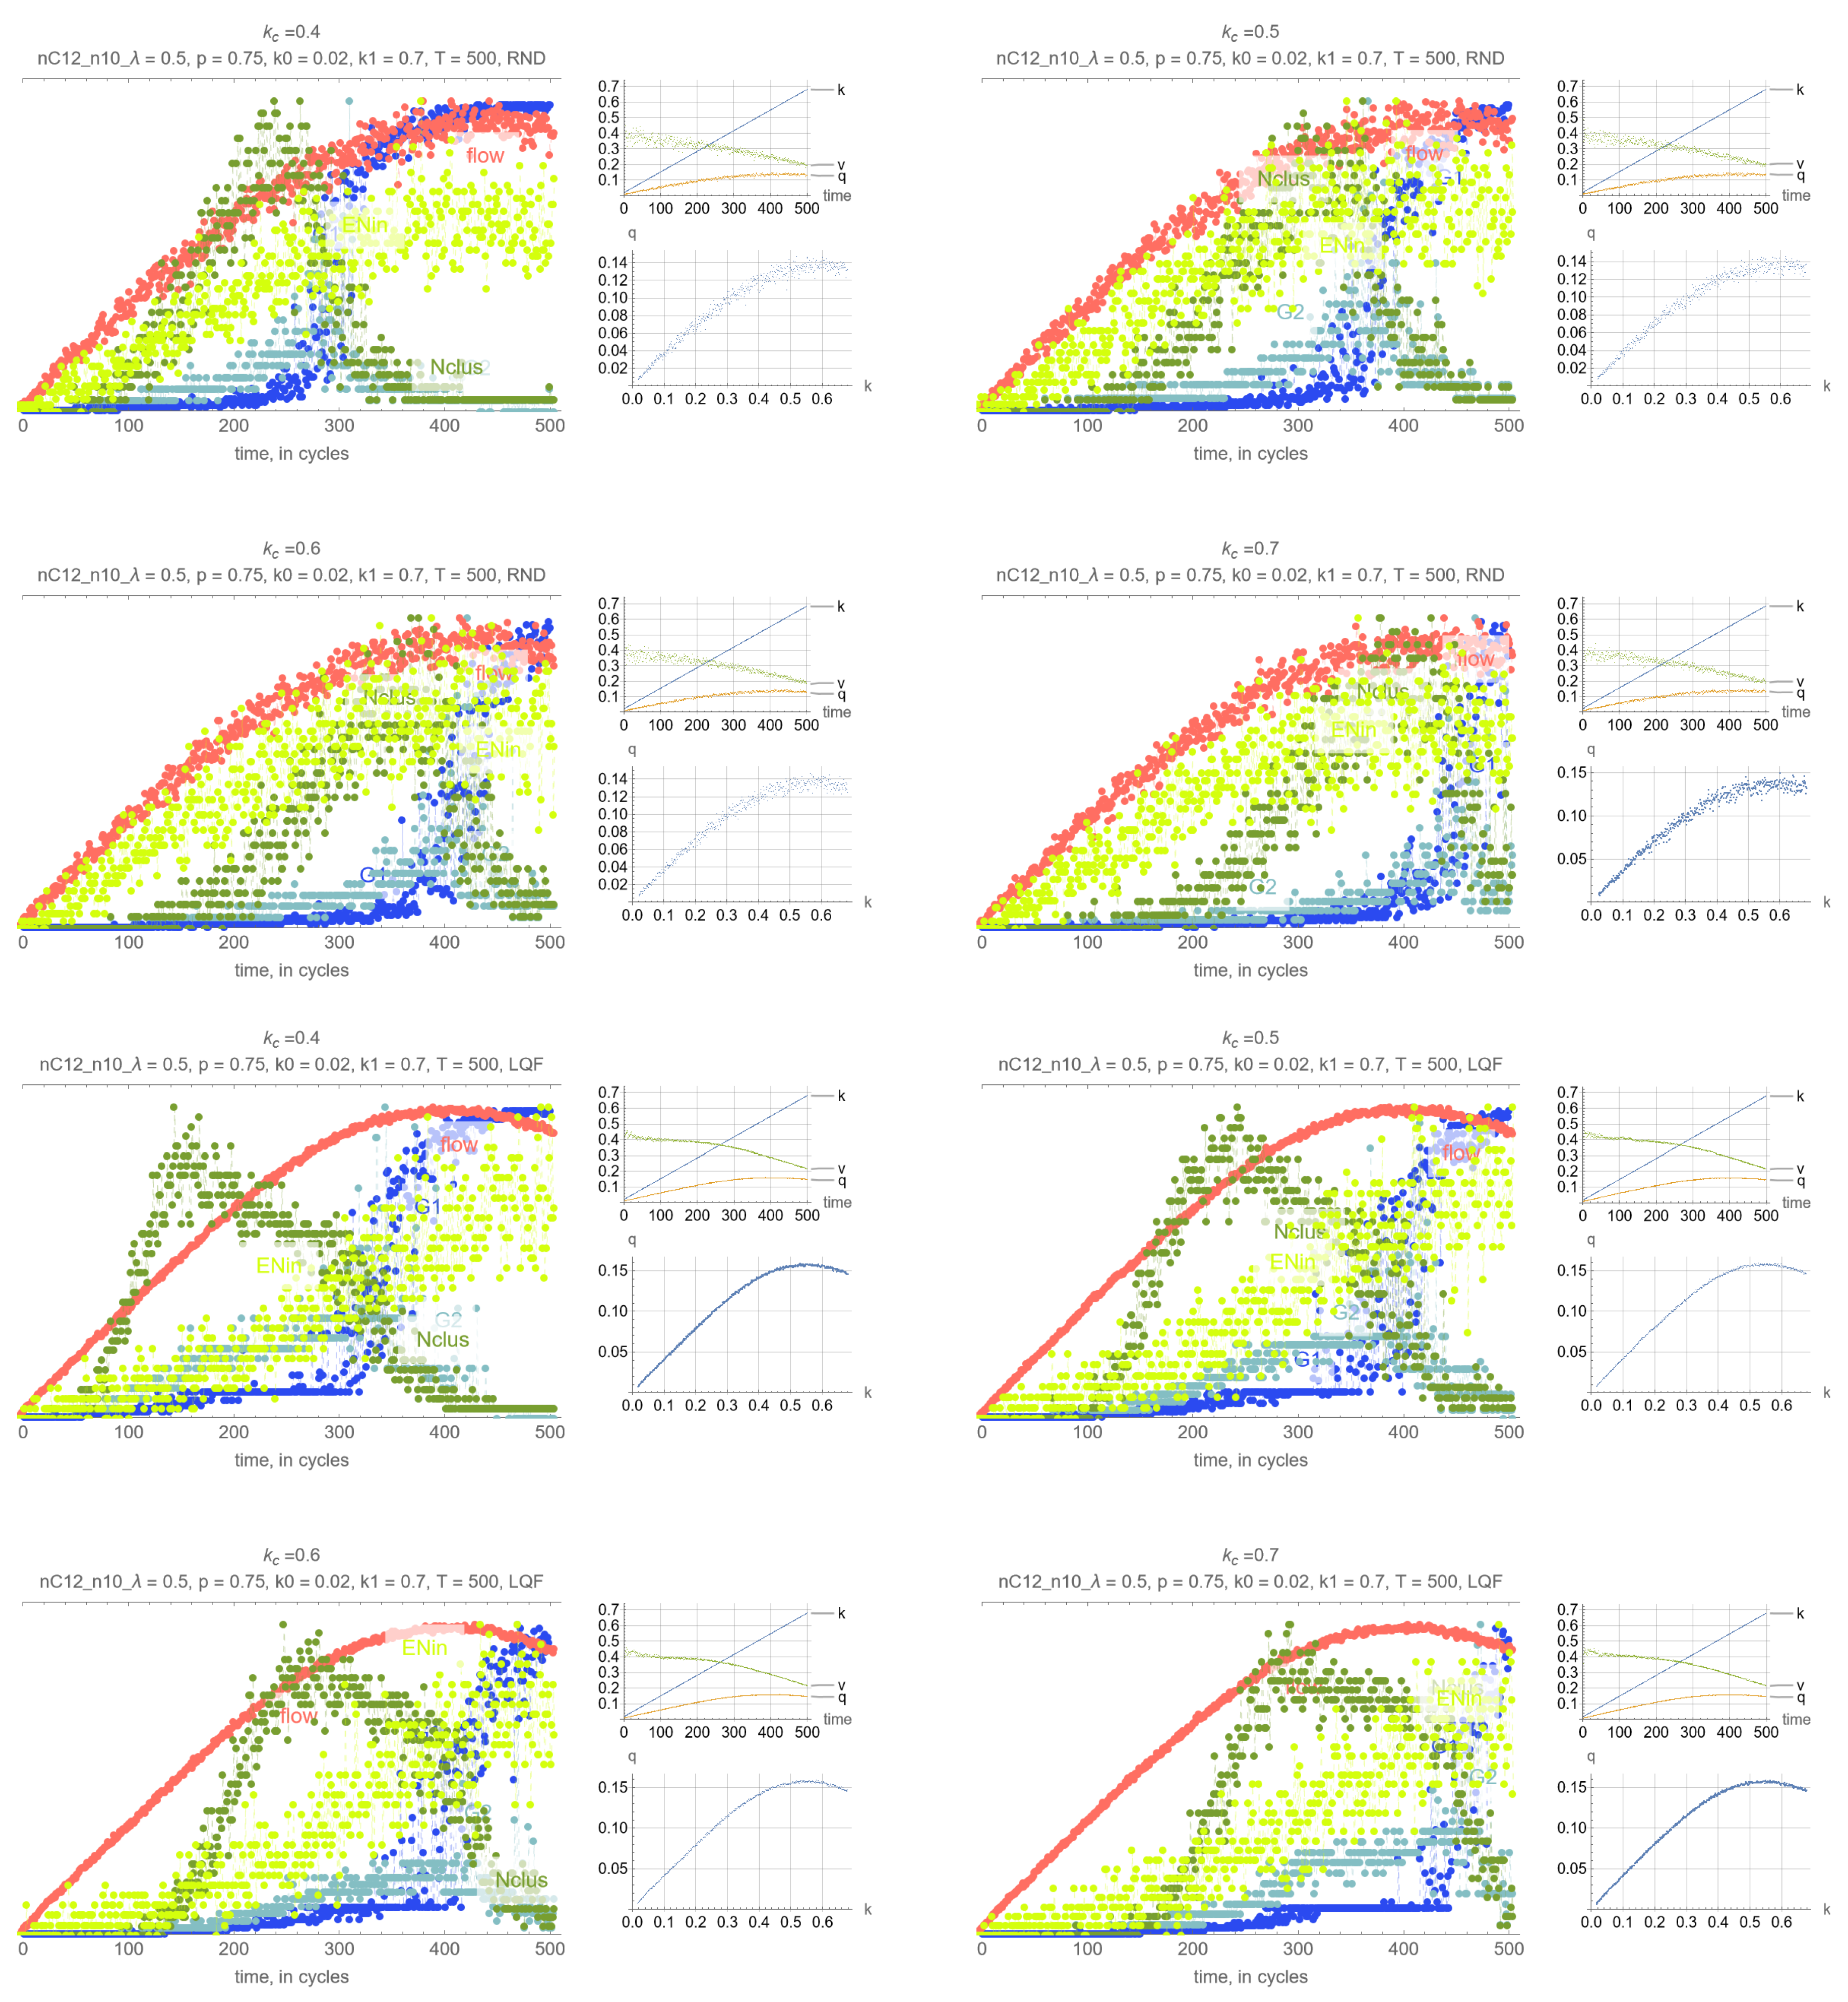
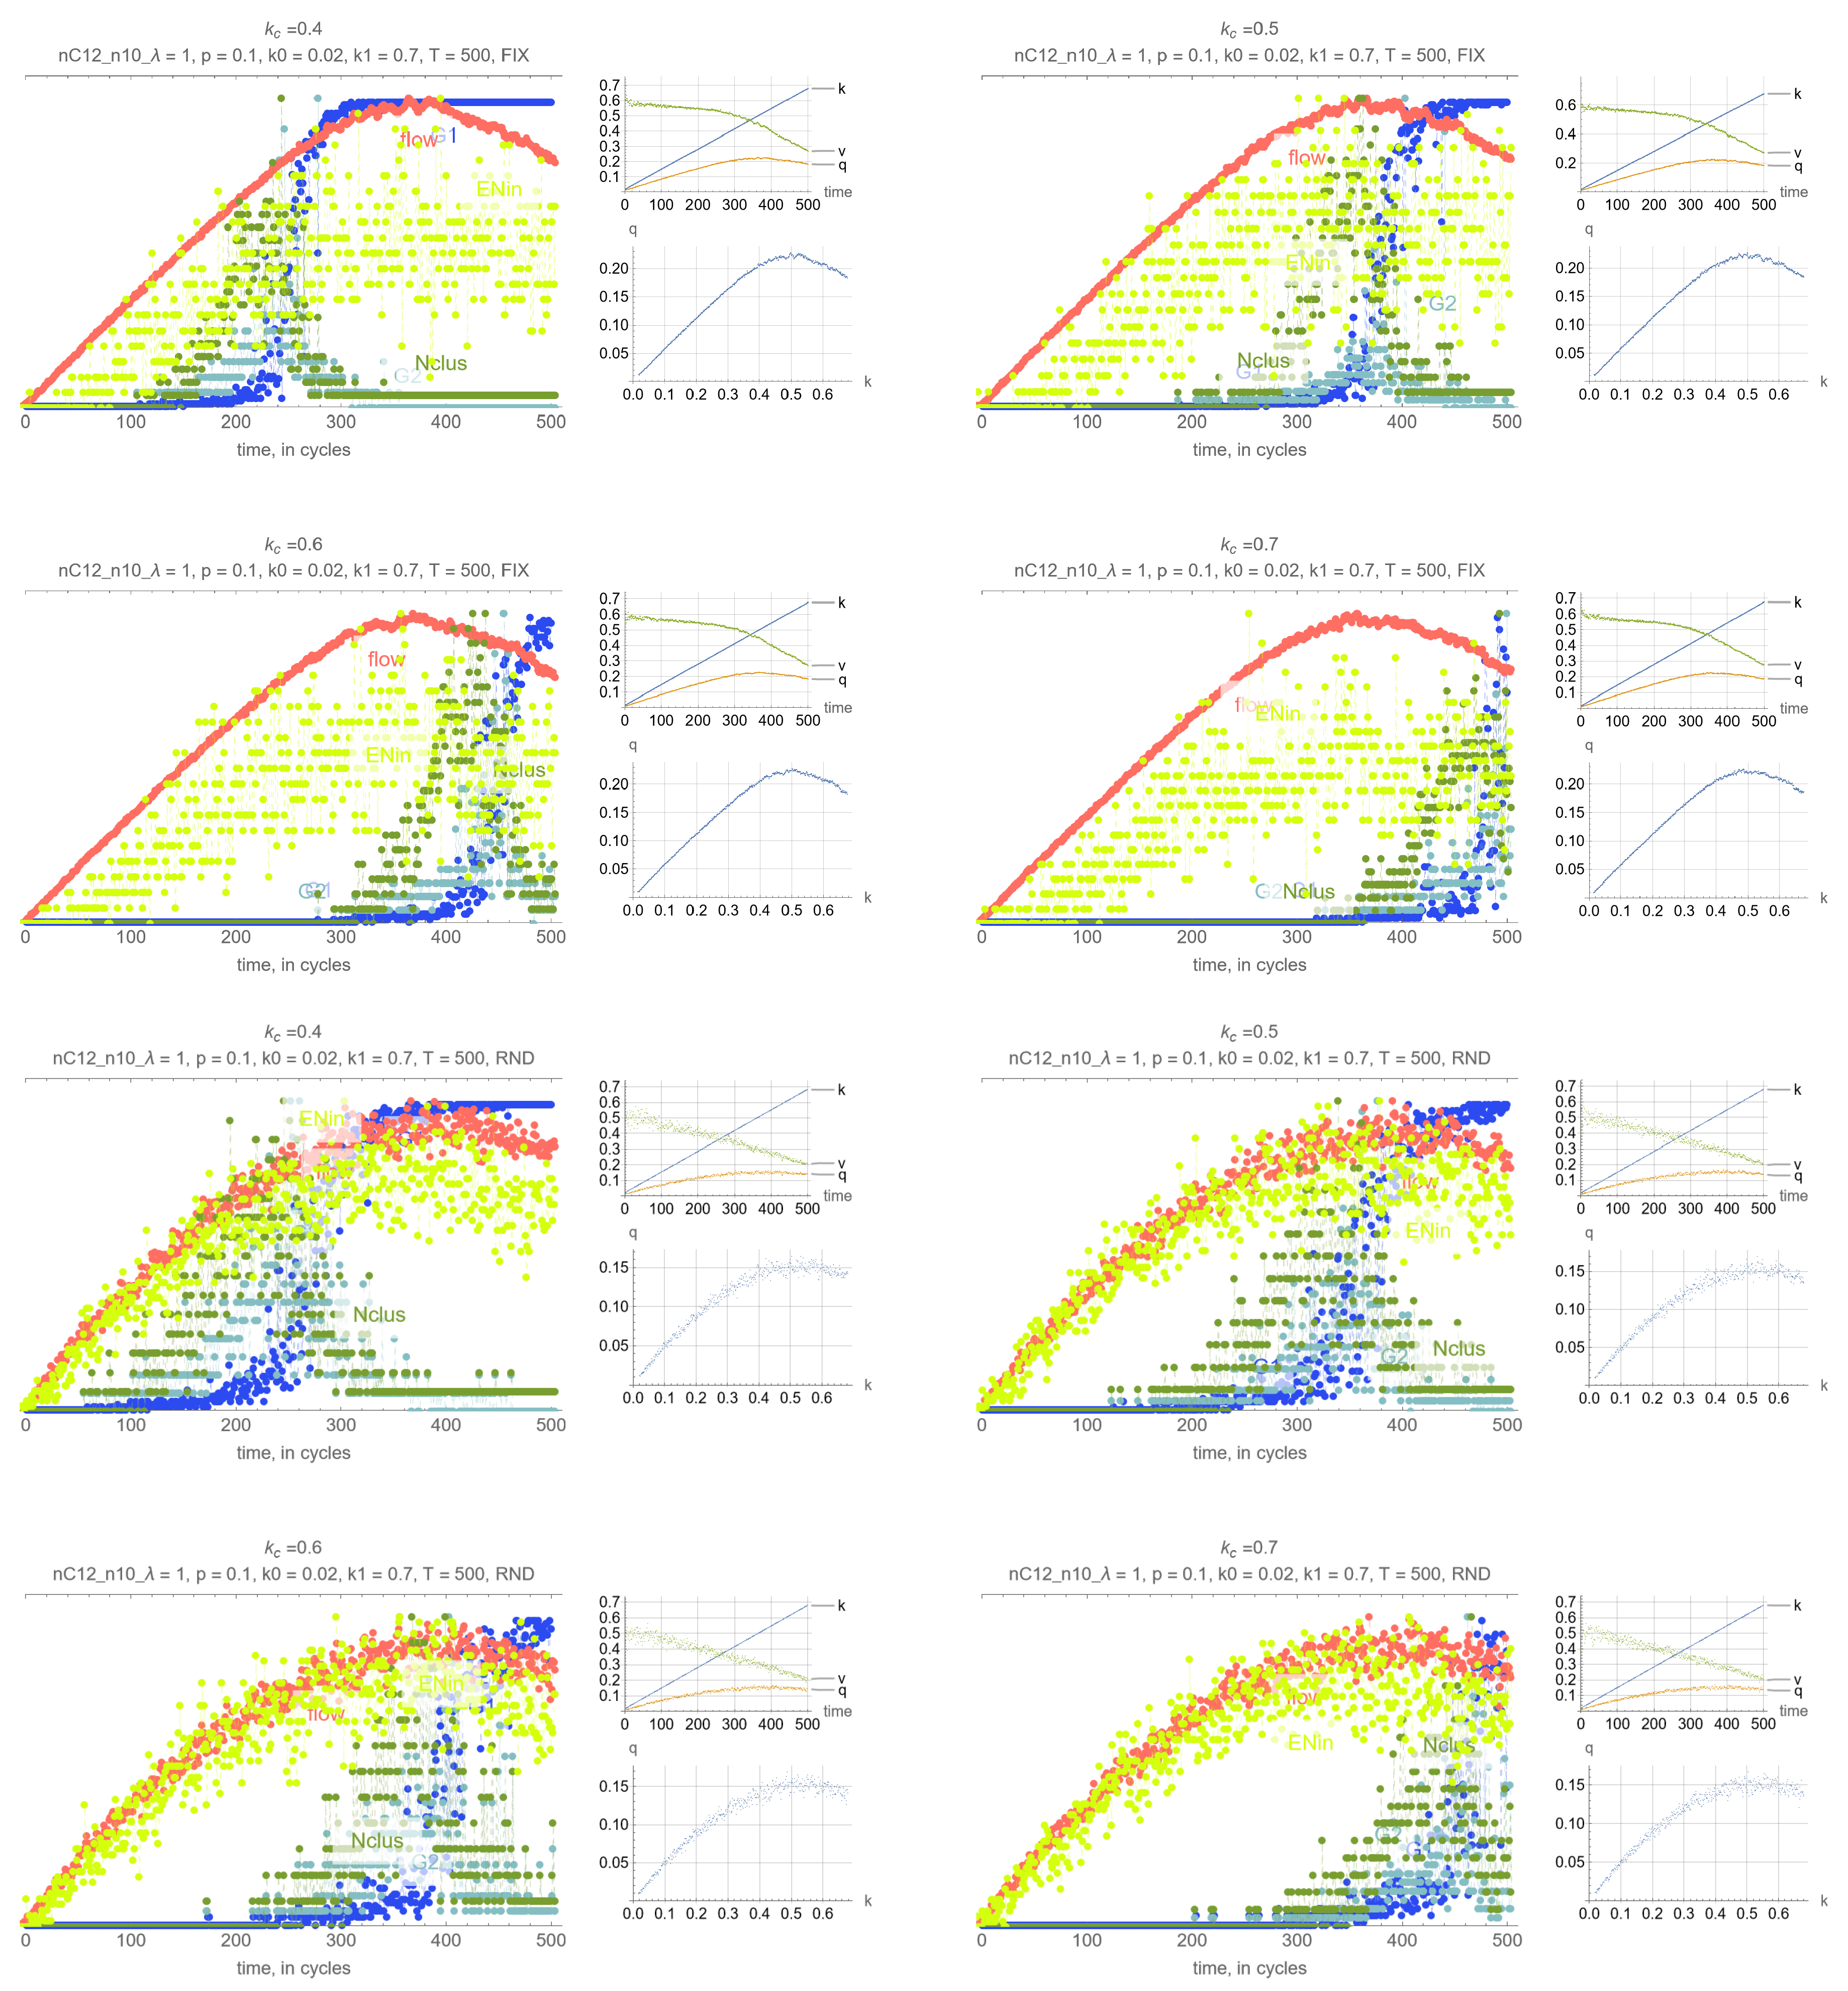
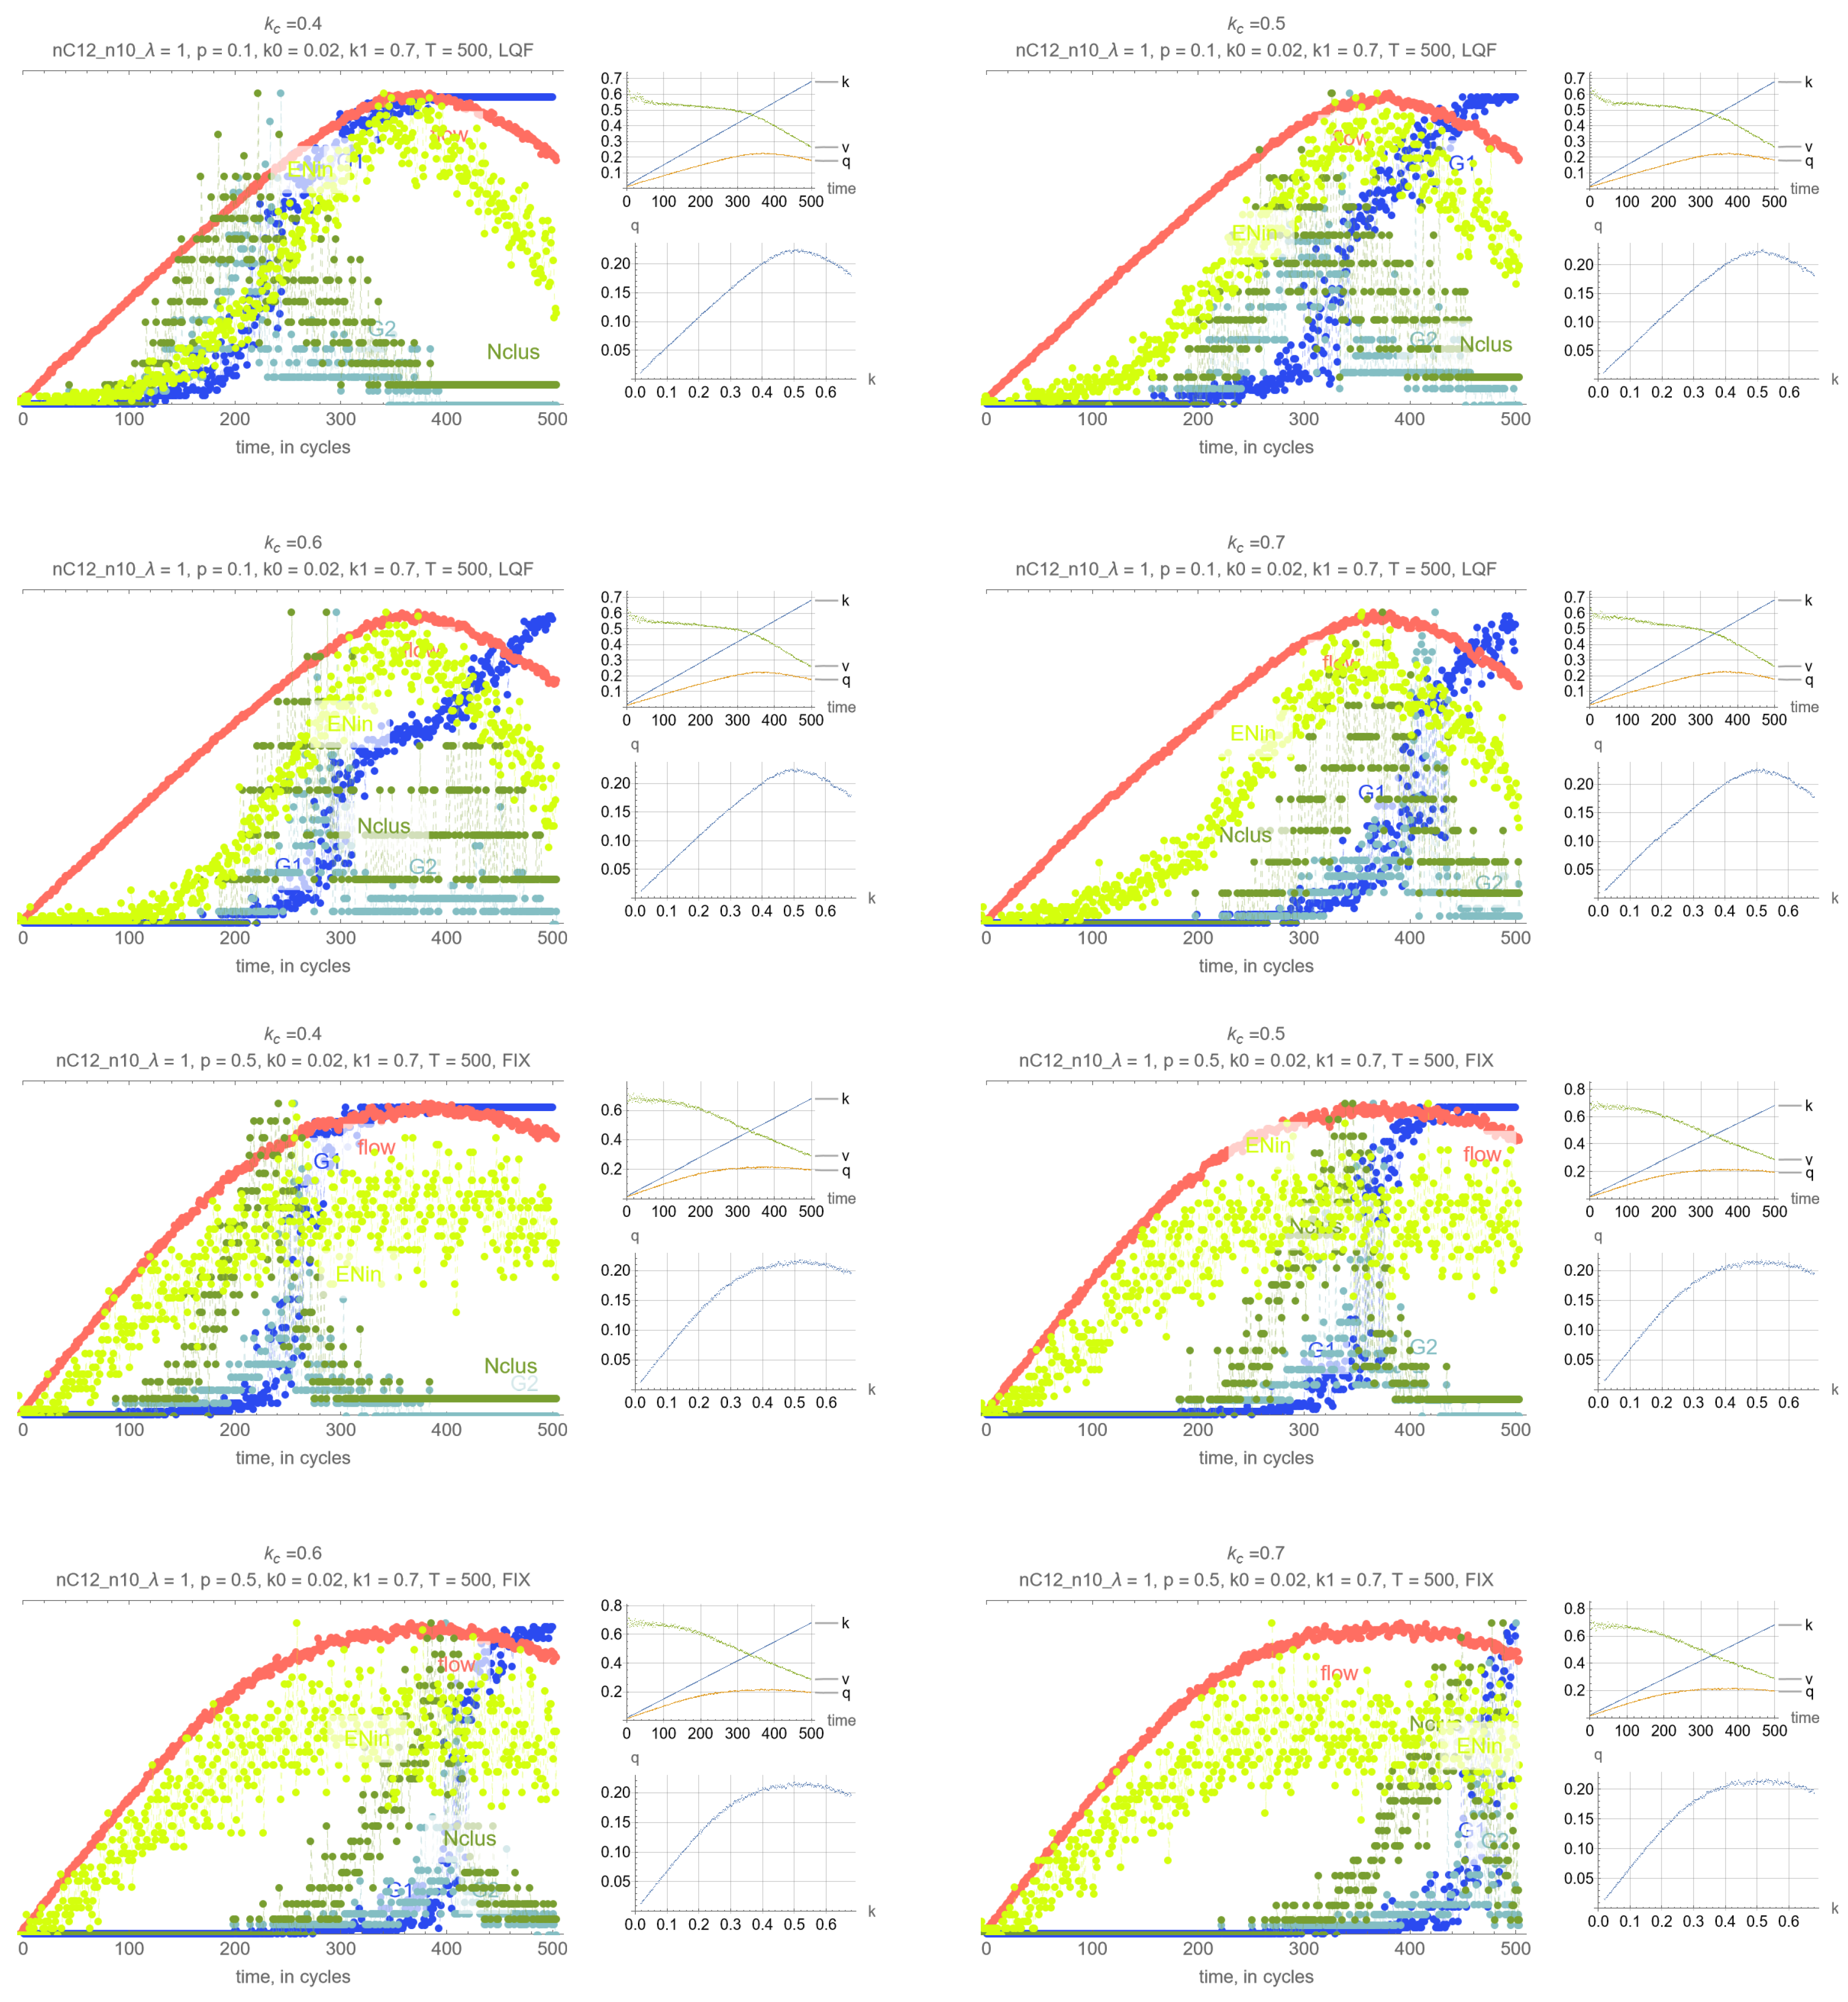
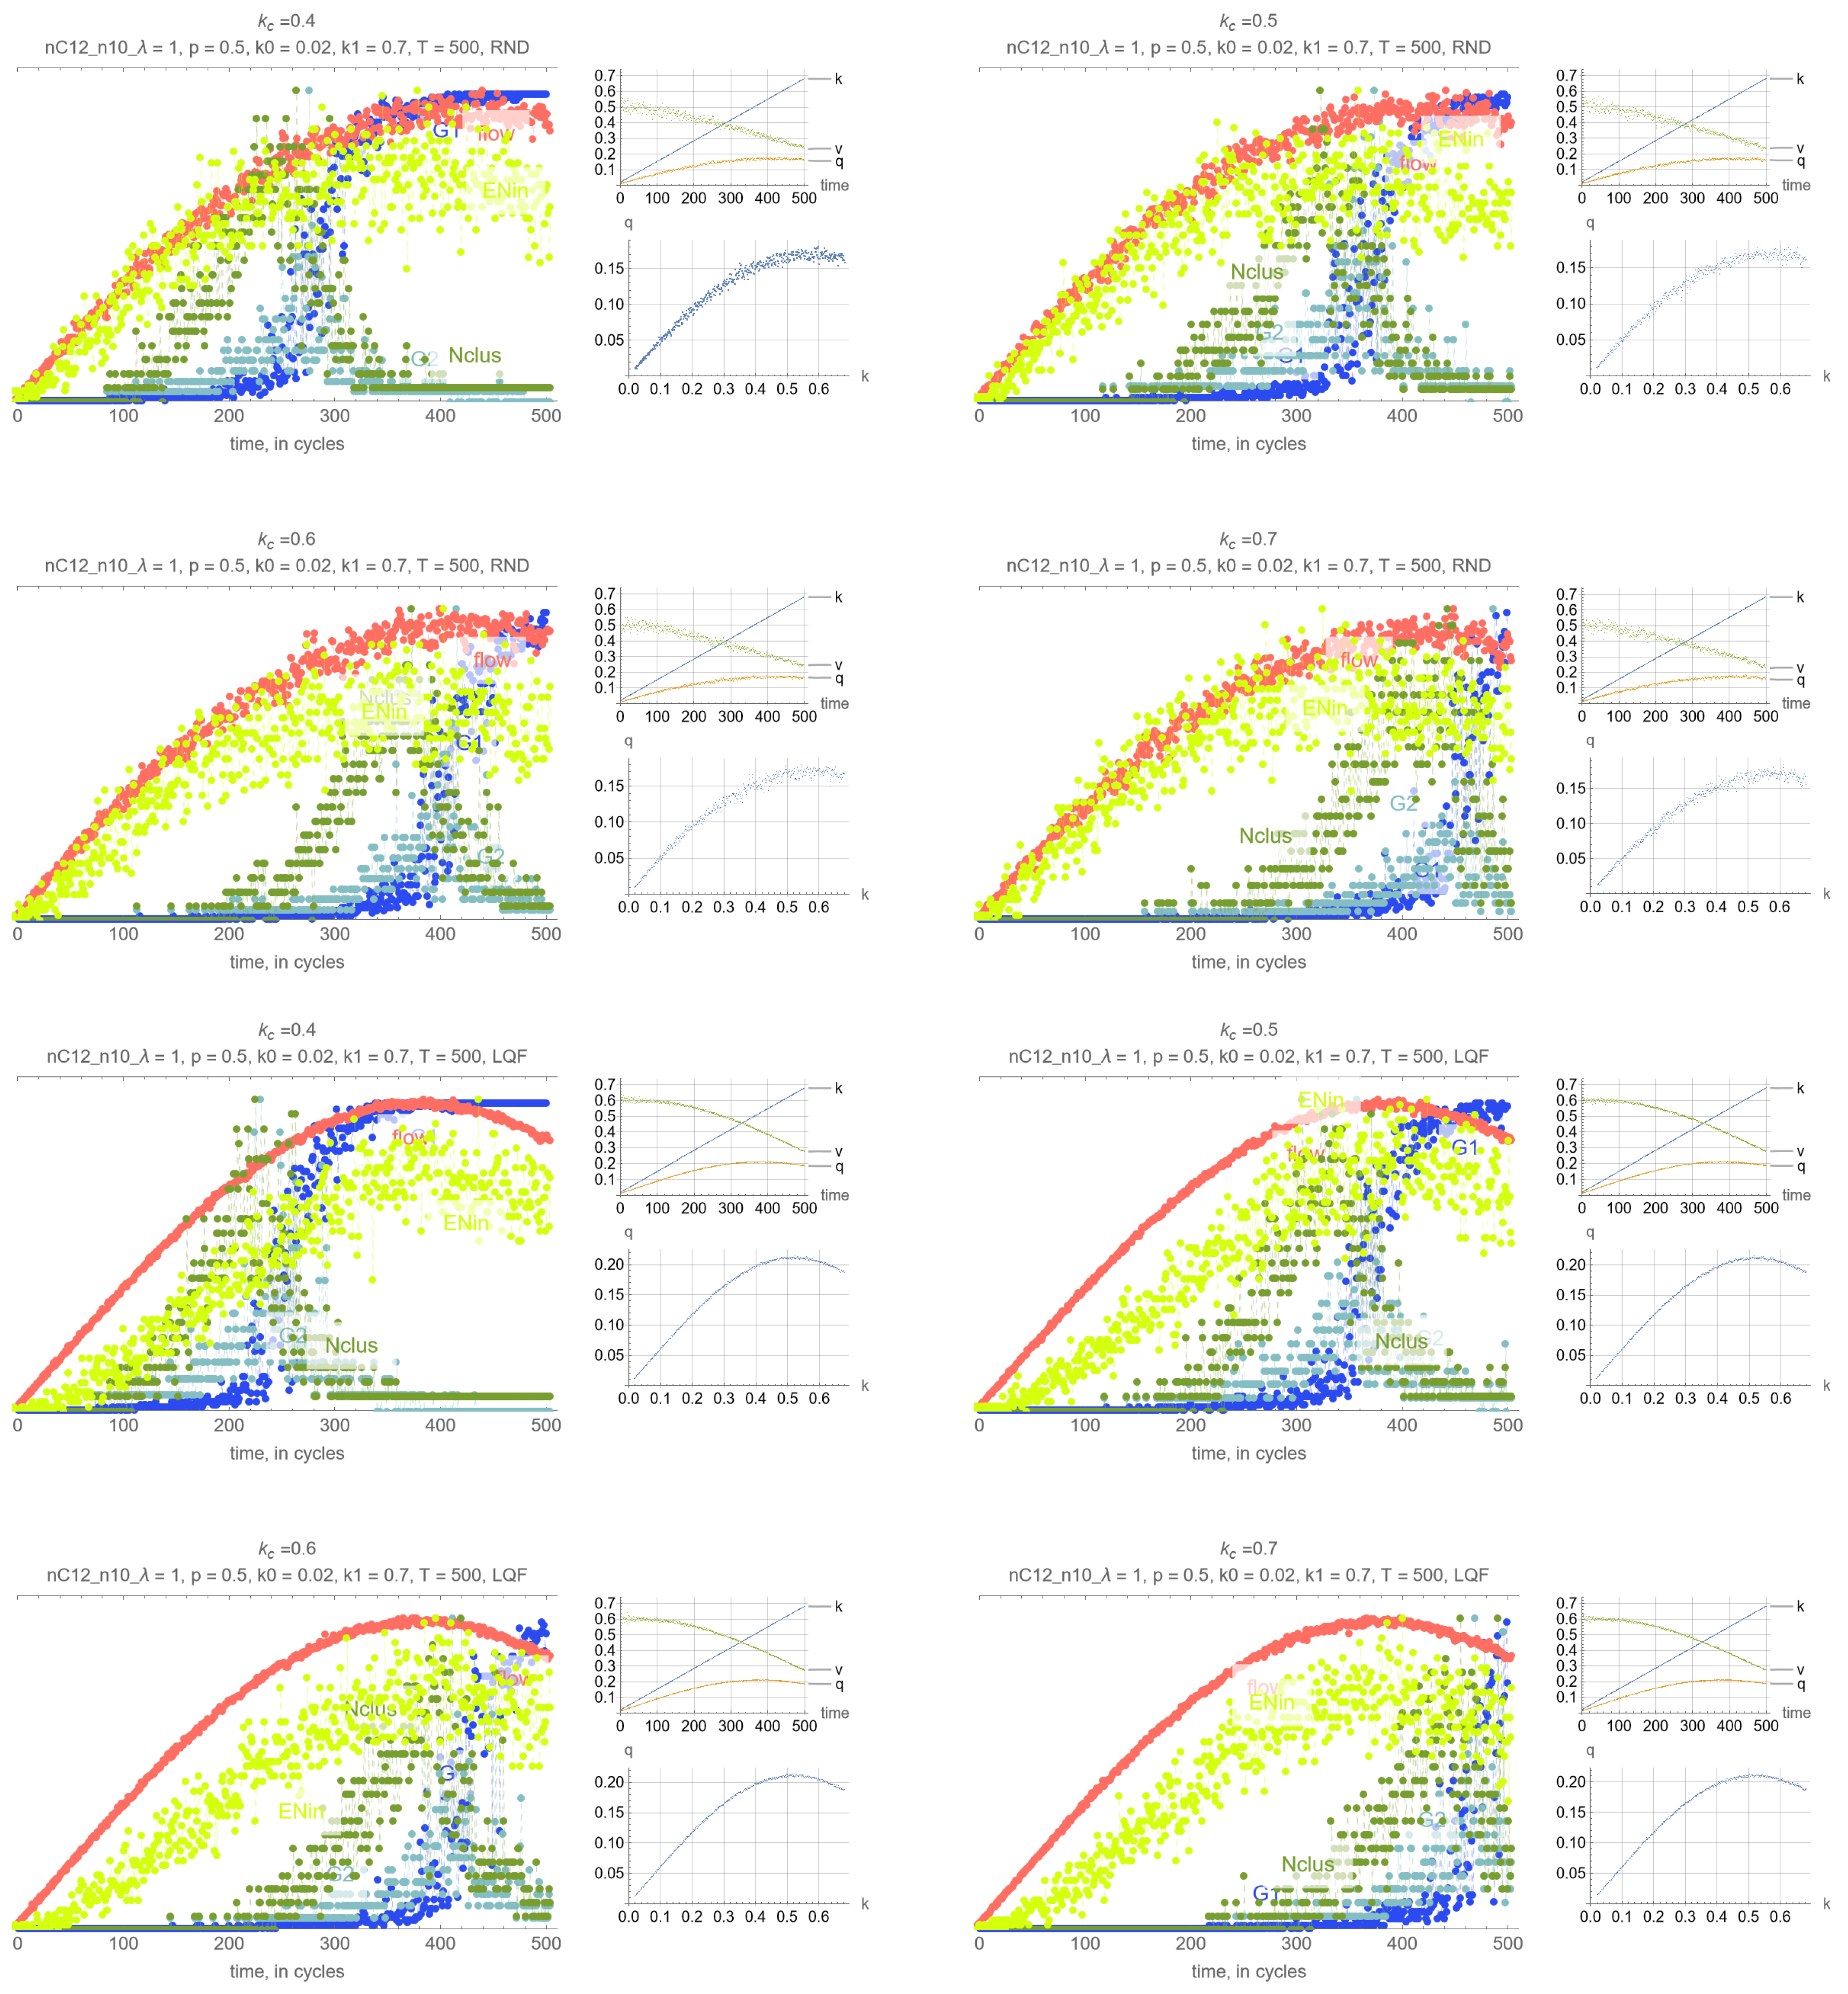
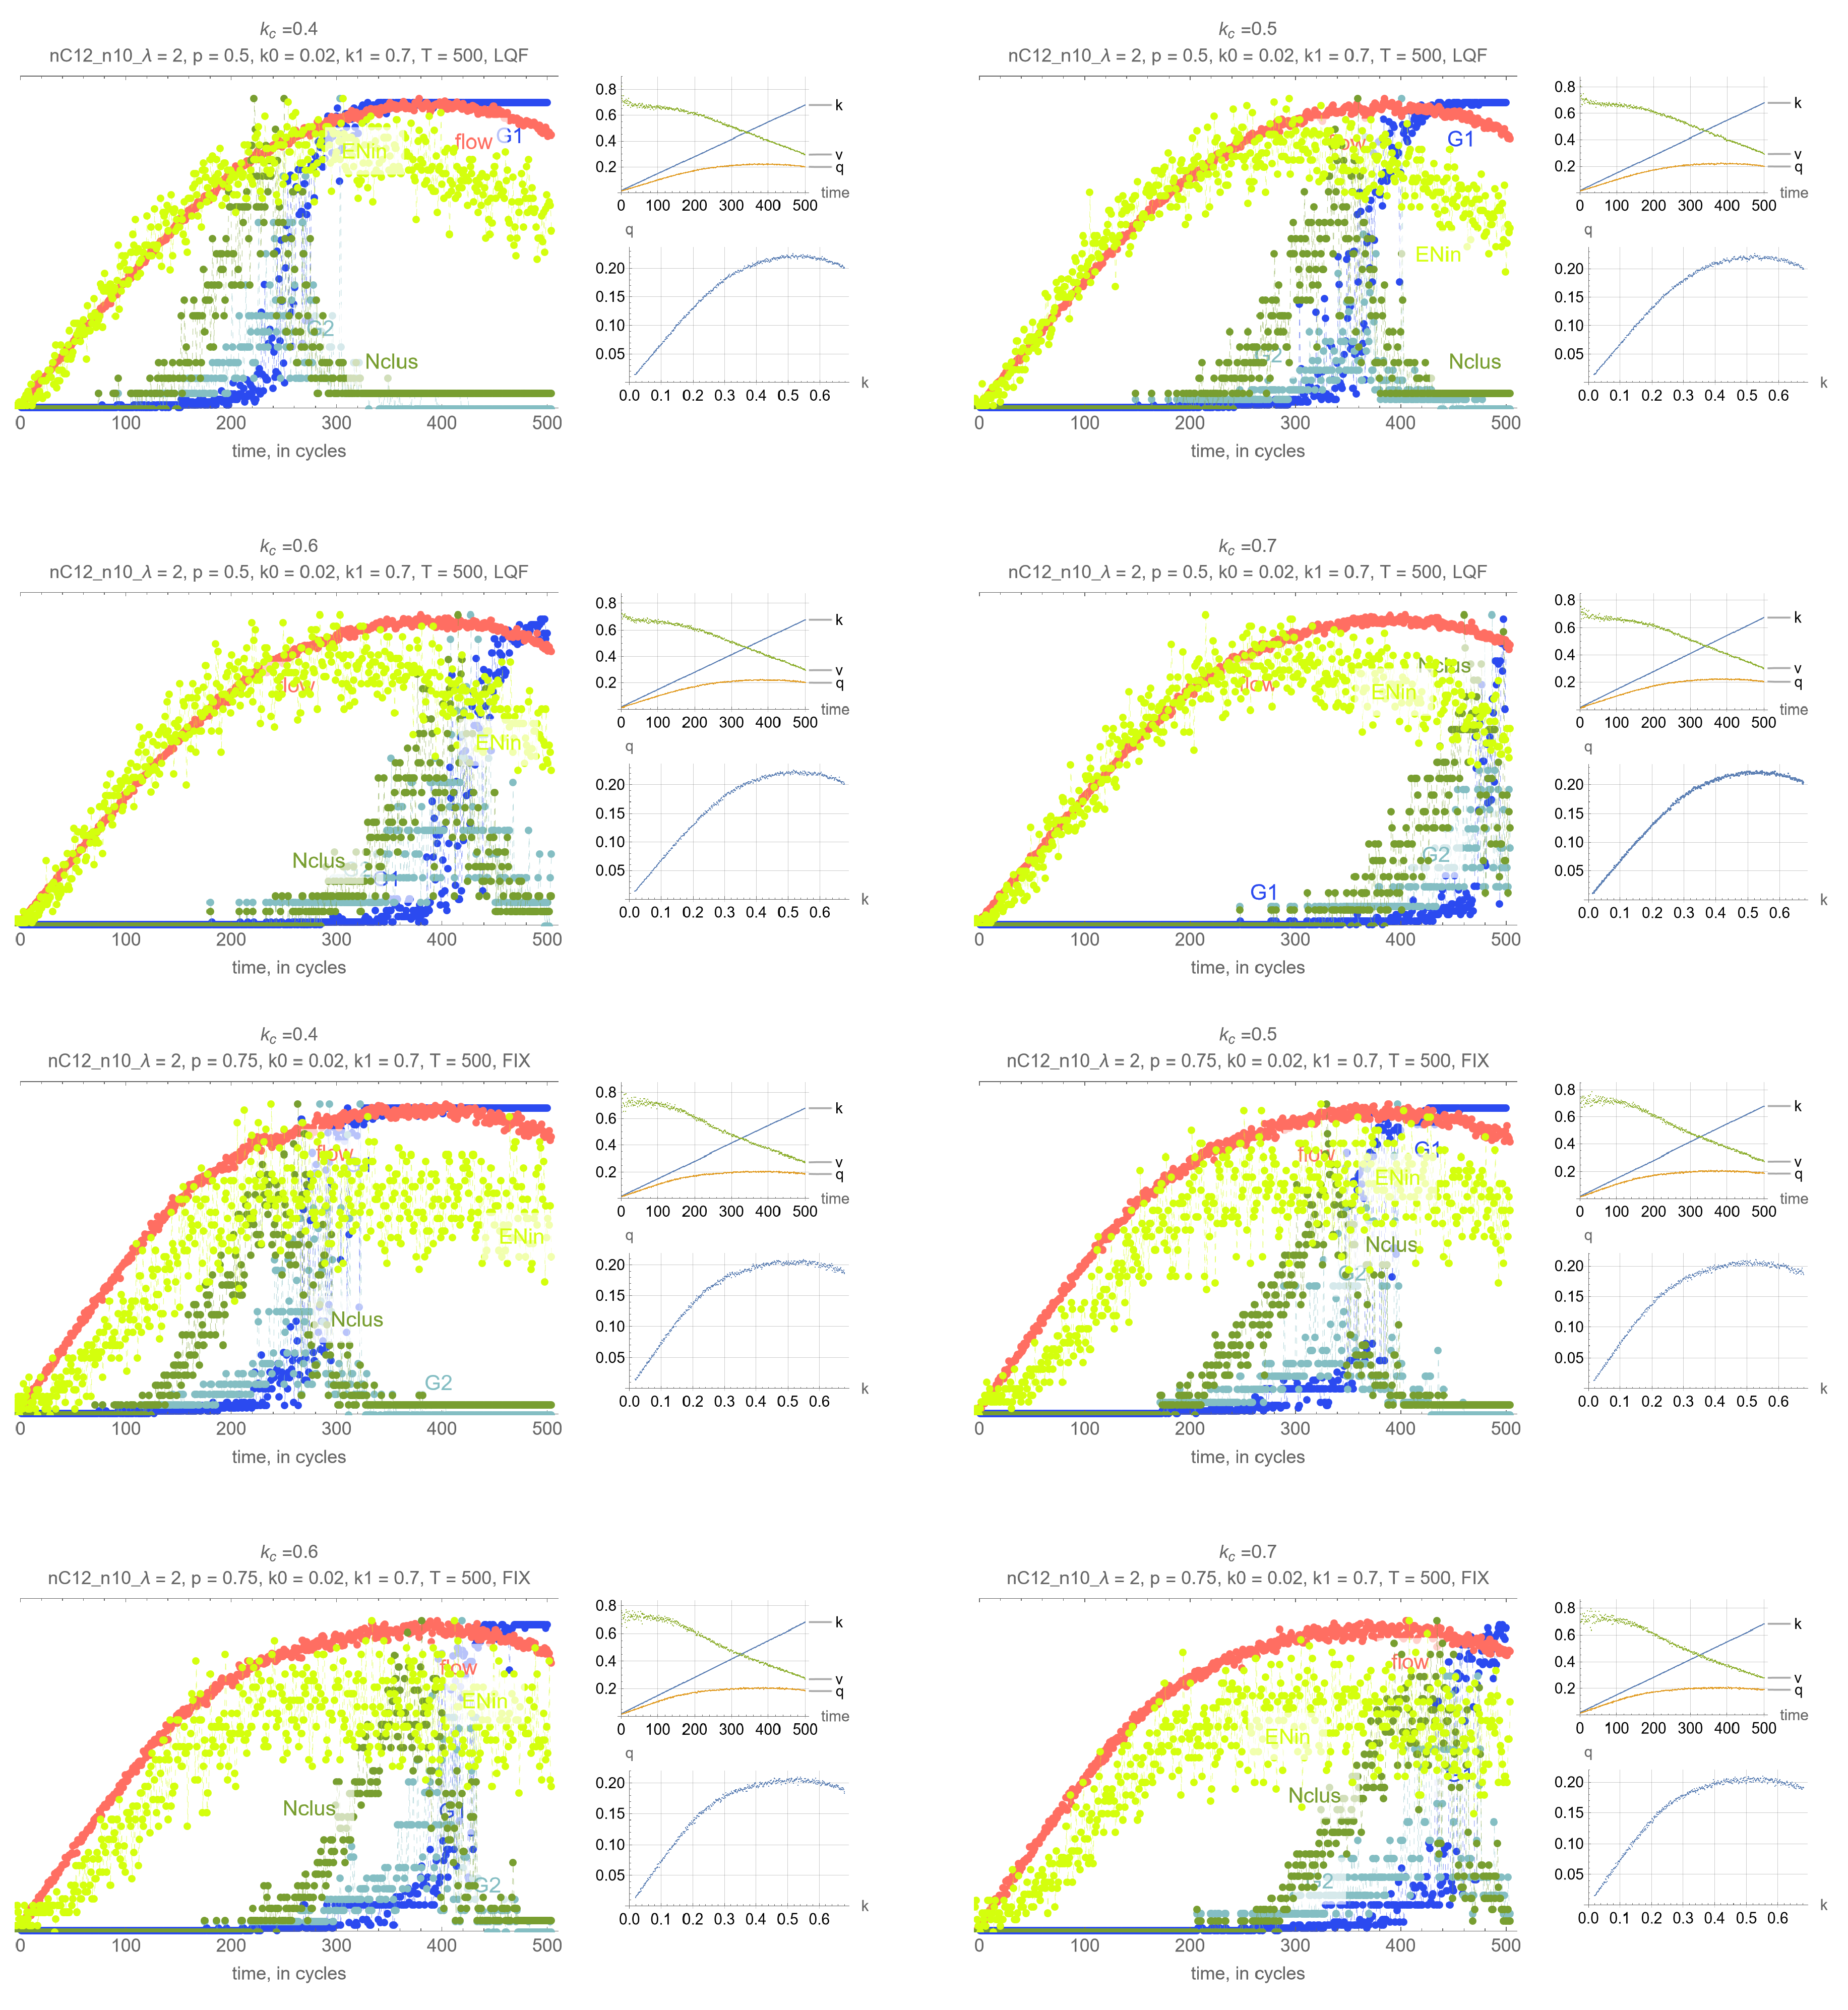
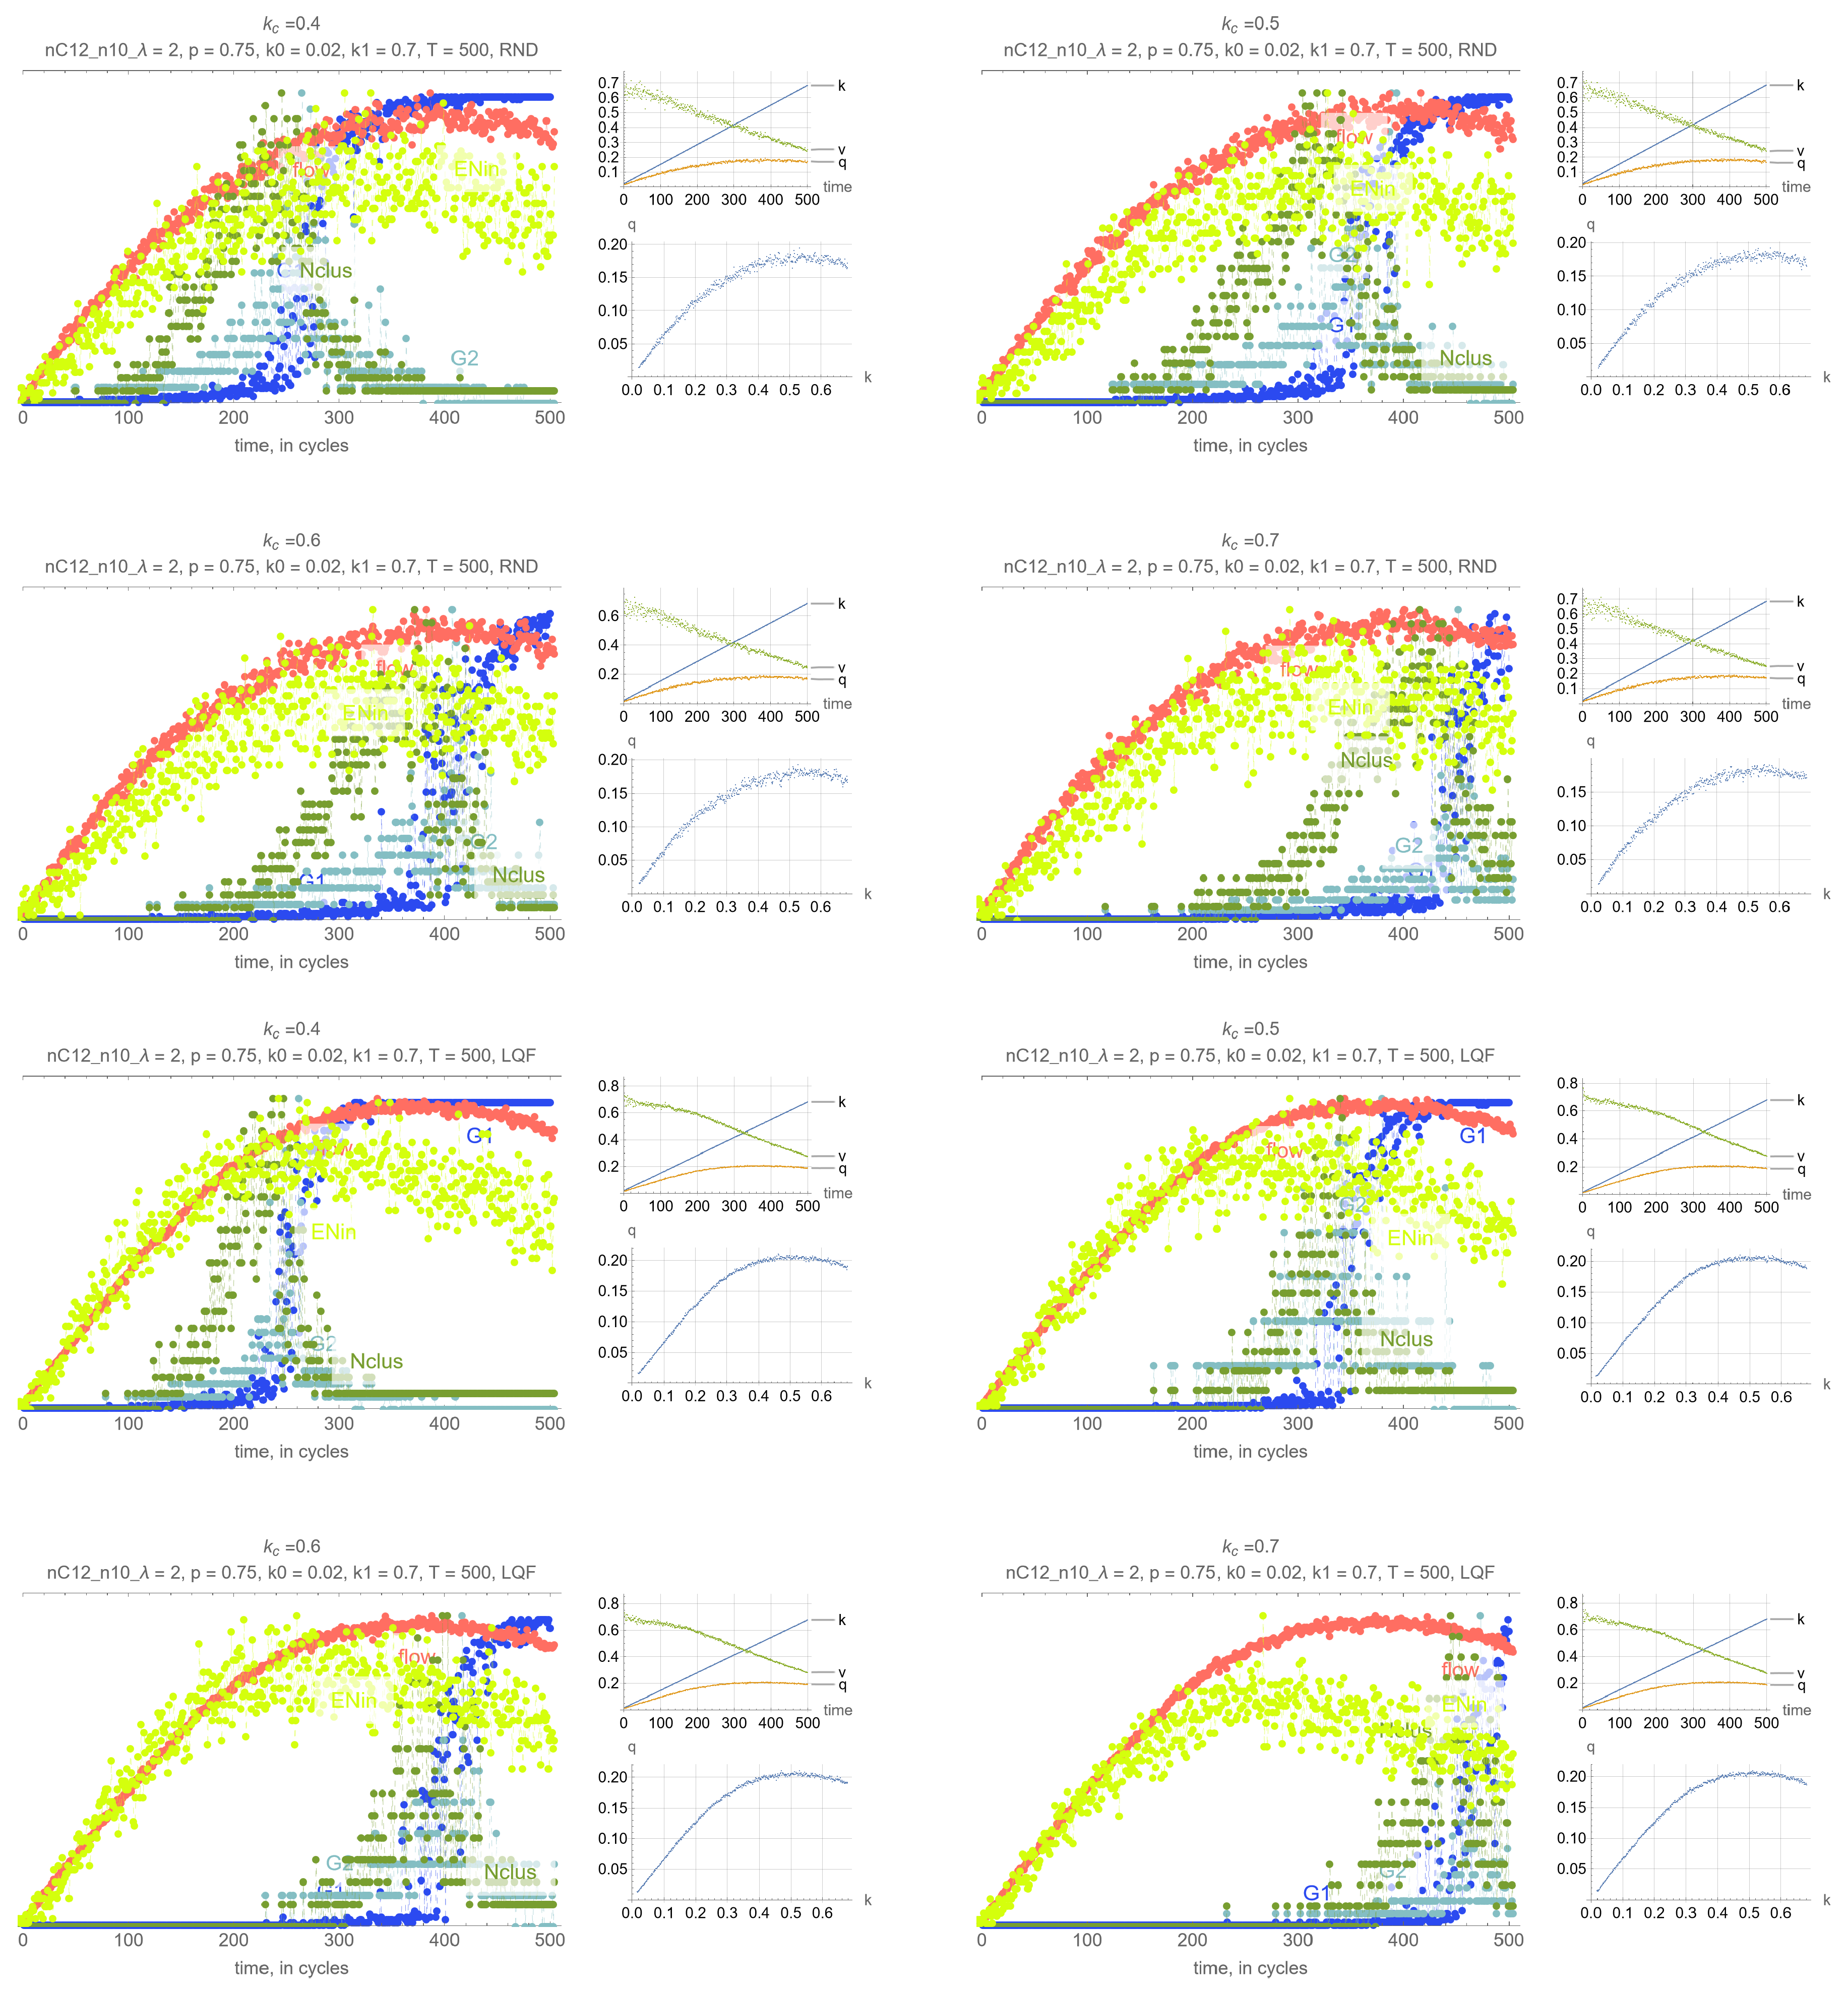
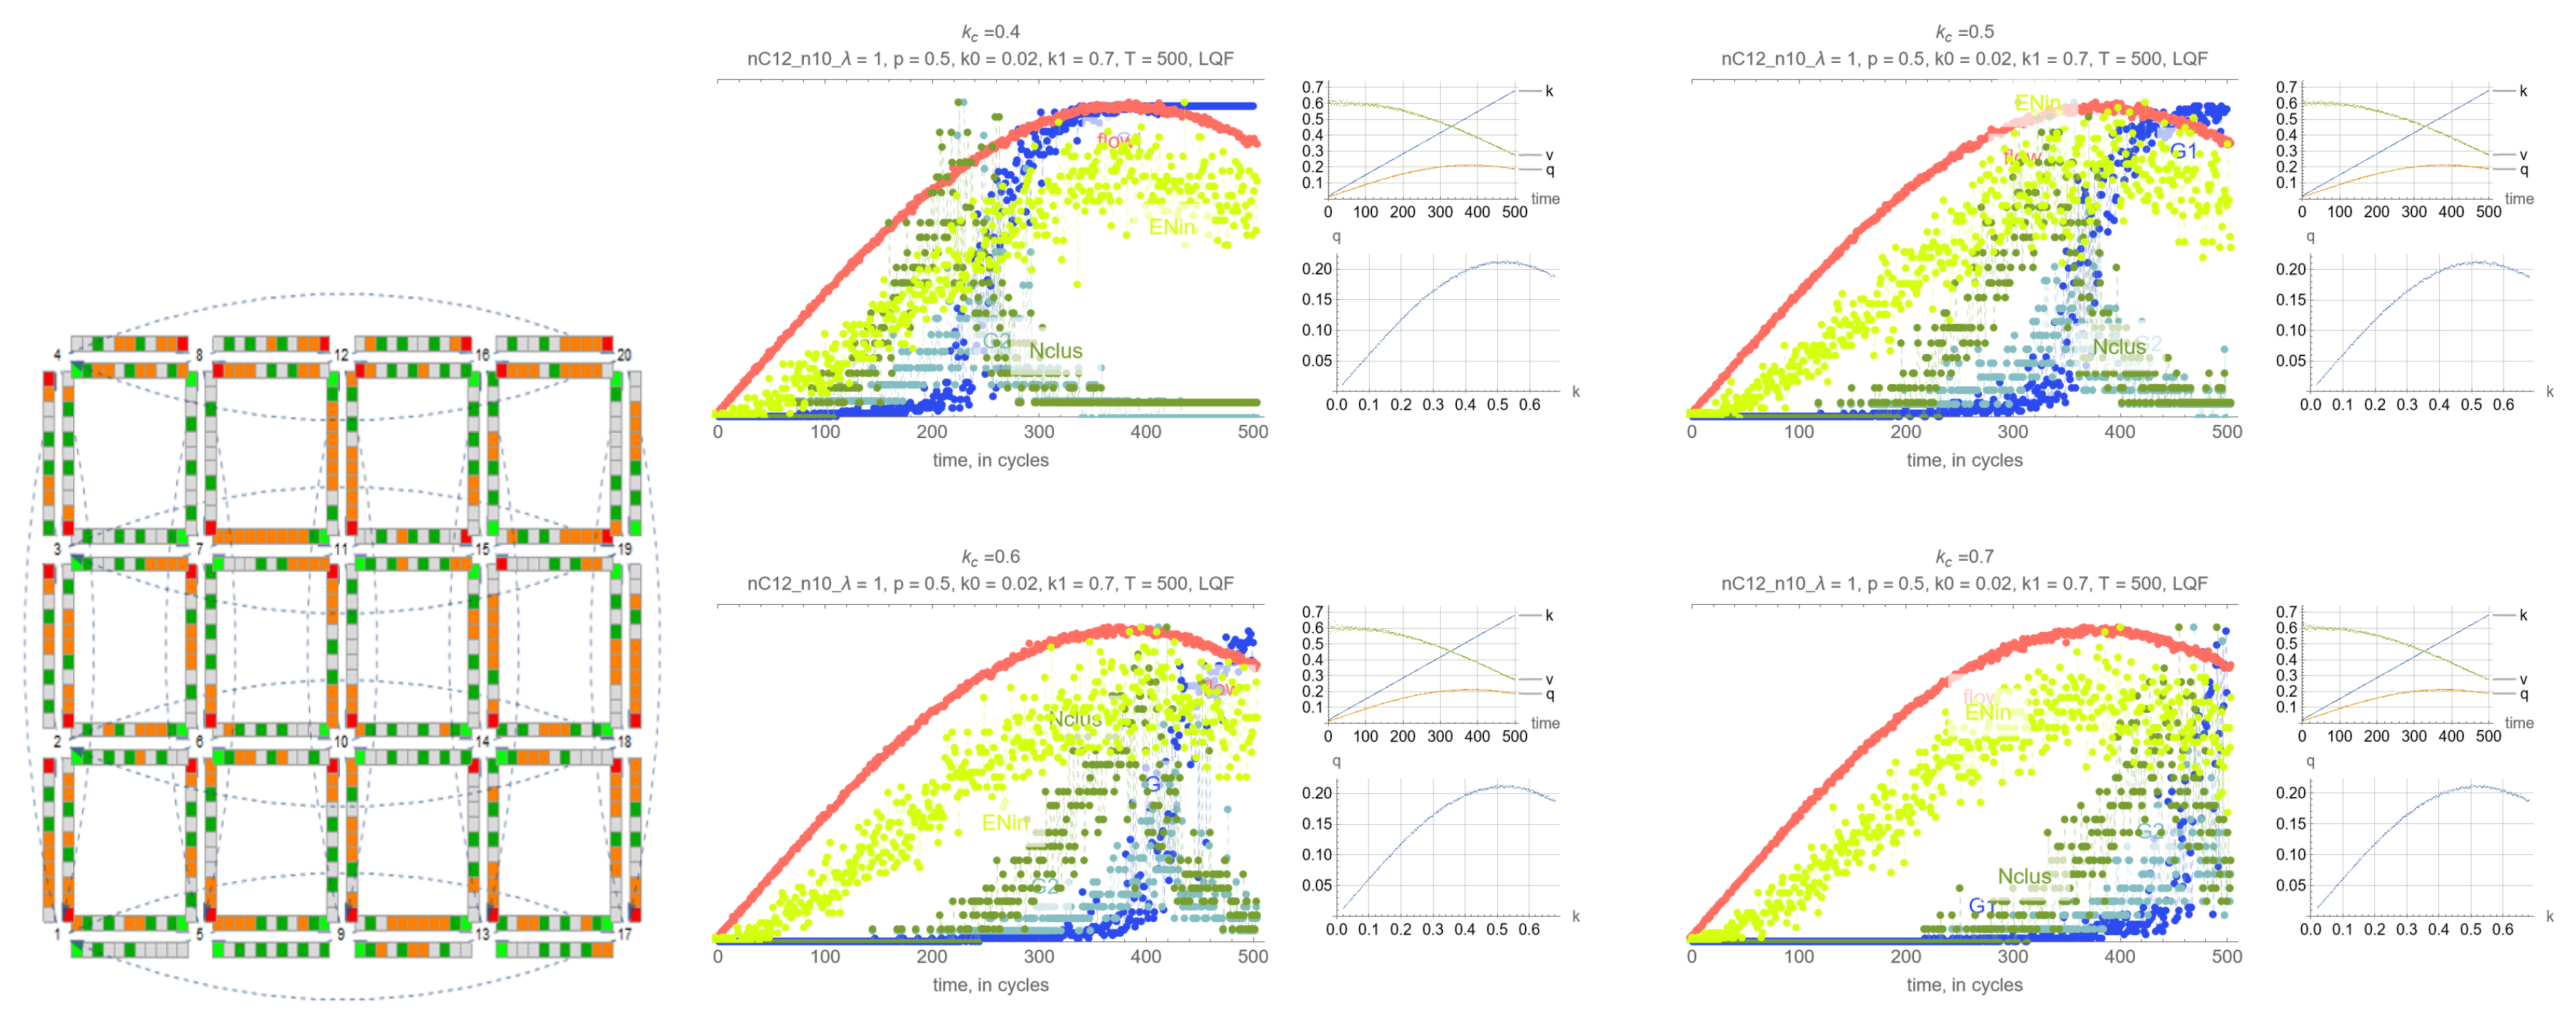
- Effects of . Perhaps unsurprisingly, the threshold density has the main impact on the timing of the percolation transition, where lower values of lead to earlier percolation transitions. Therefore, one can leverage this remark so that the percolation transitions happens before the SOC critical point and avoid network collapse.
- R-2
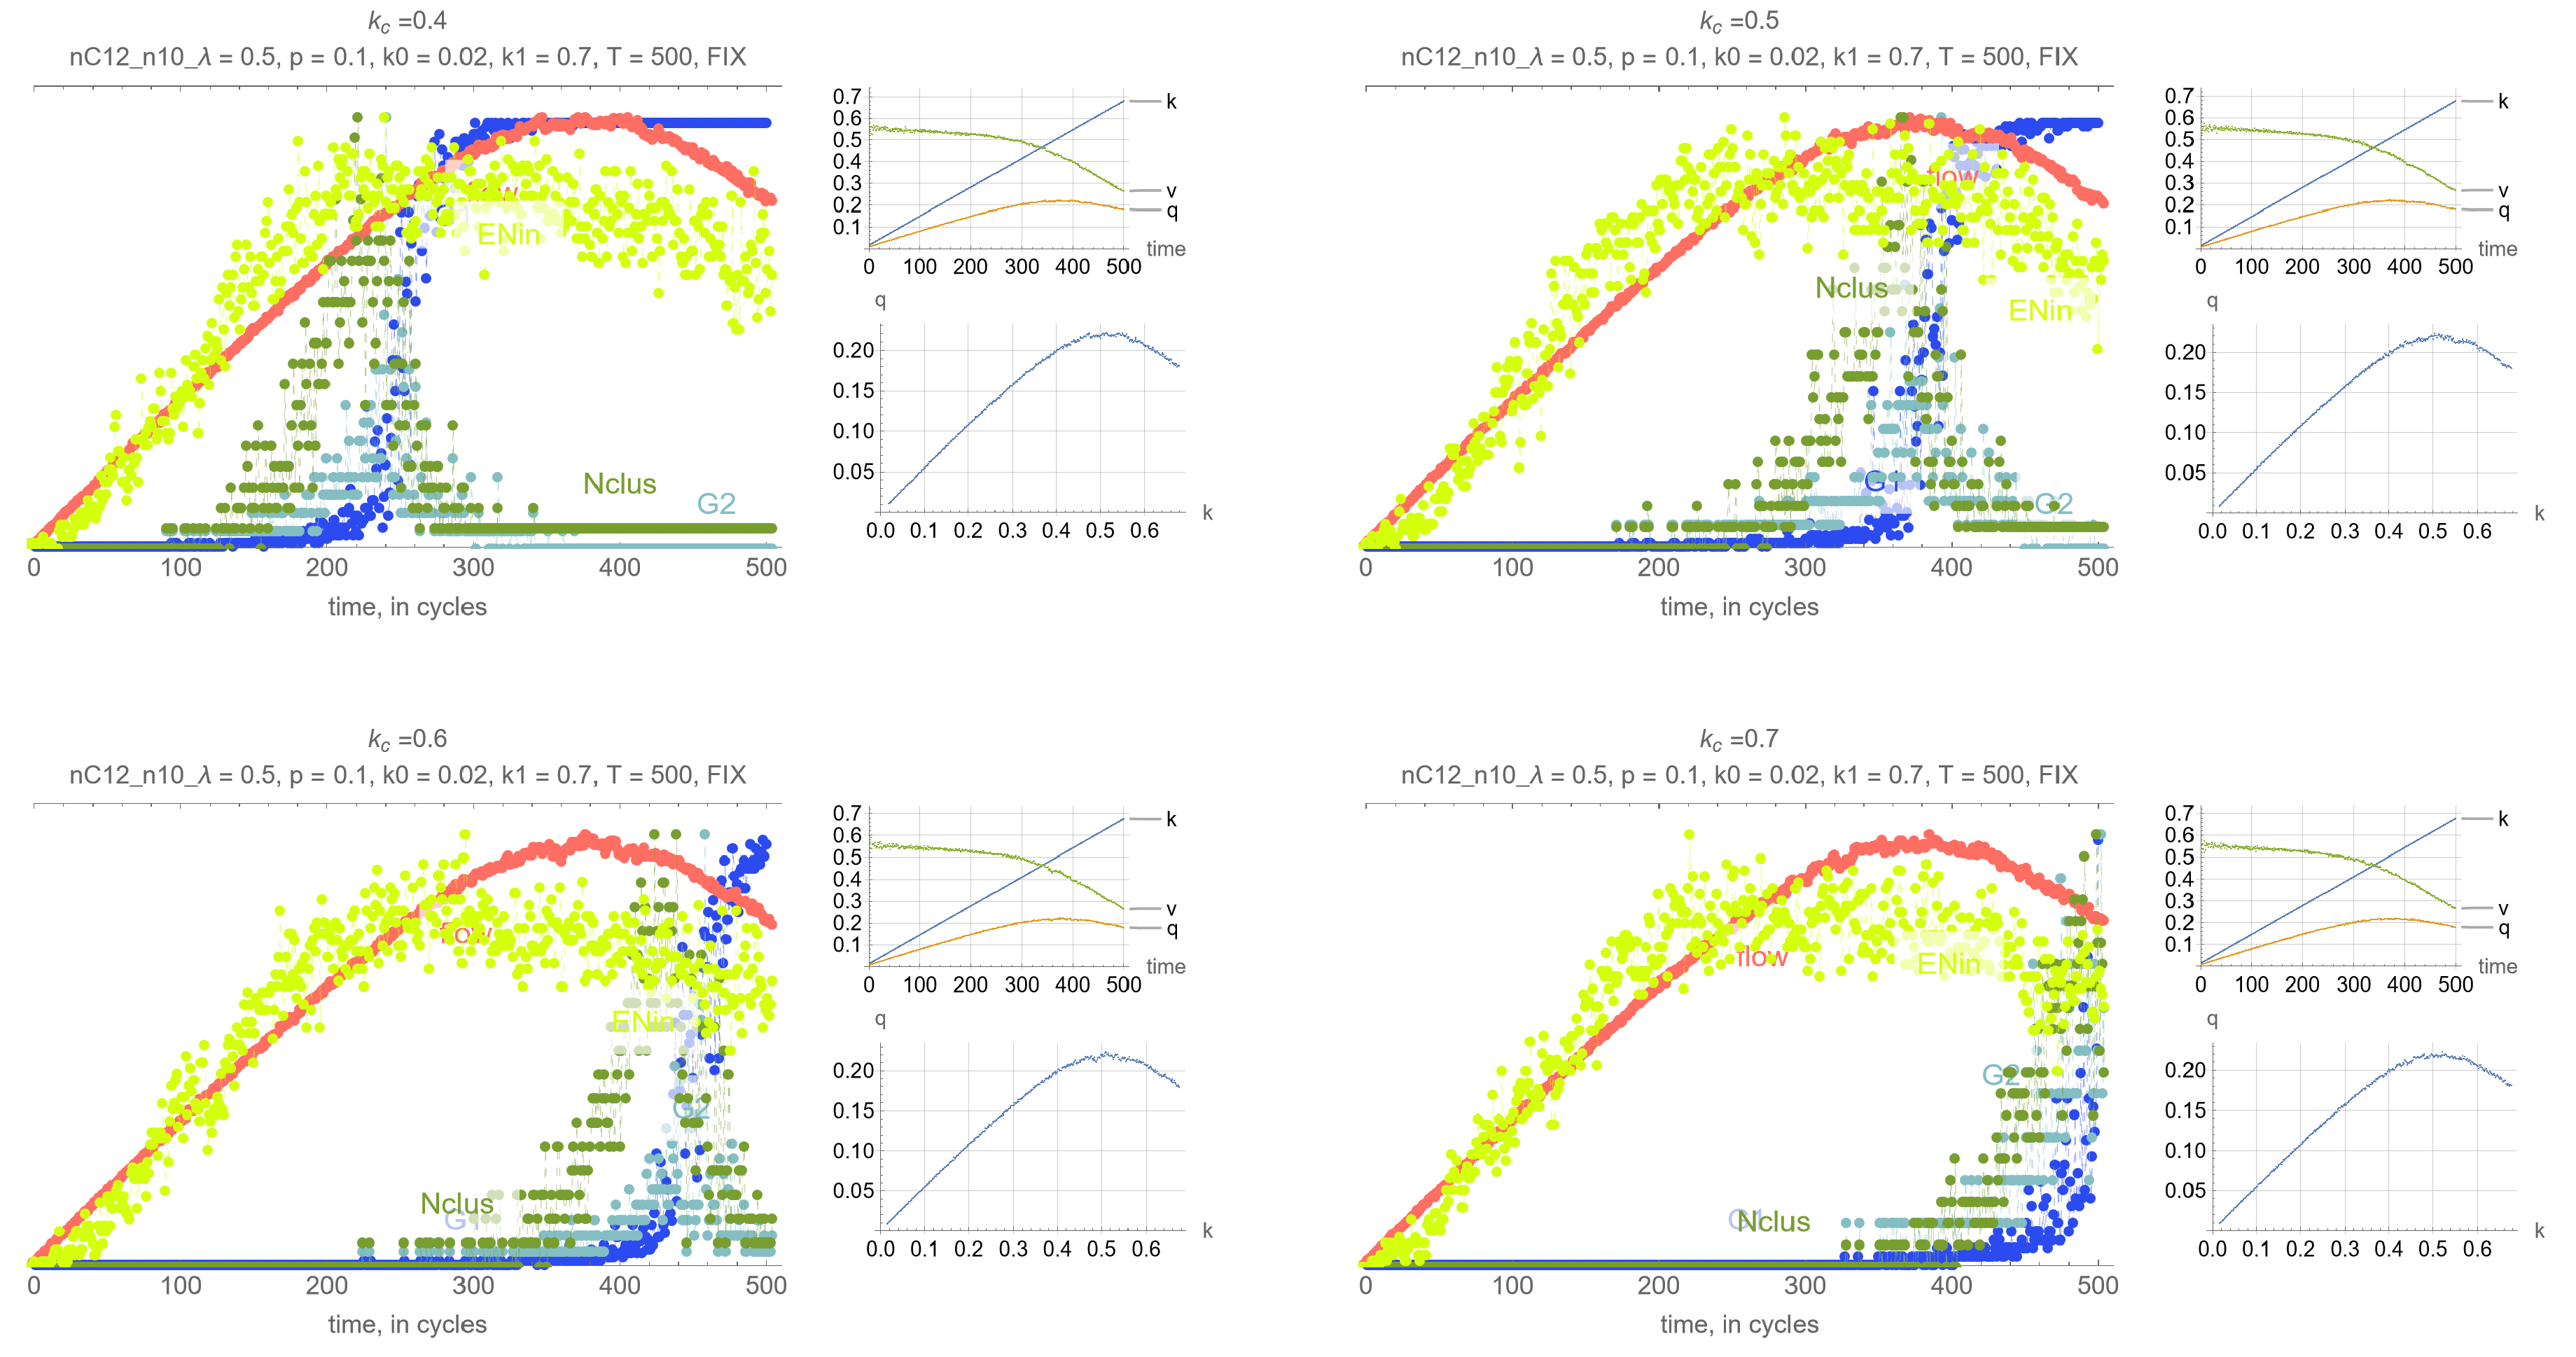
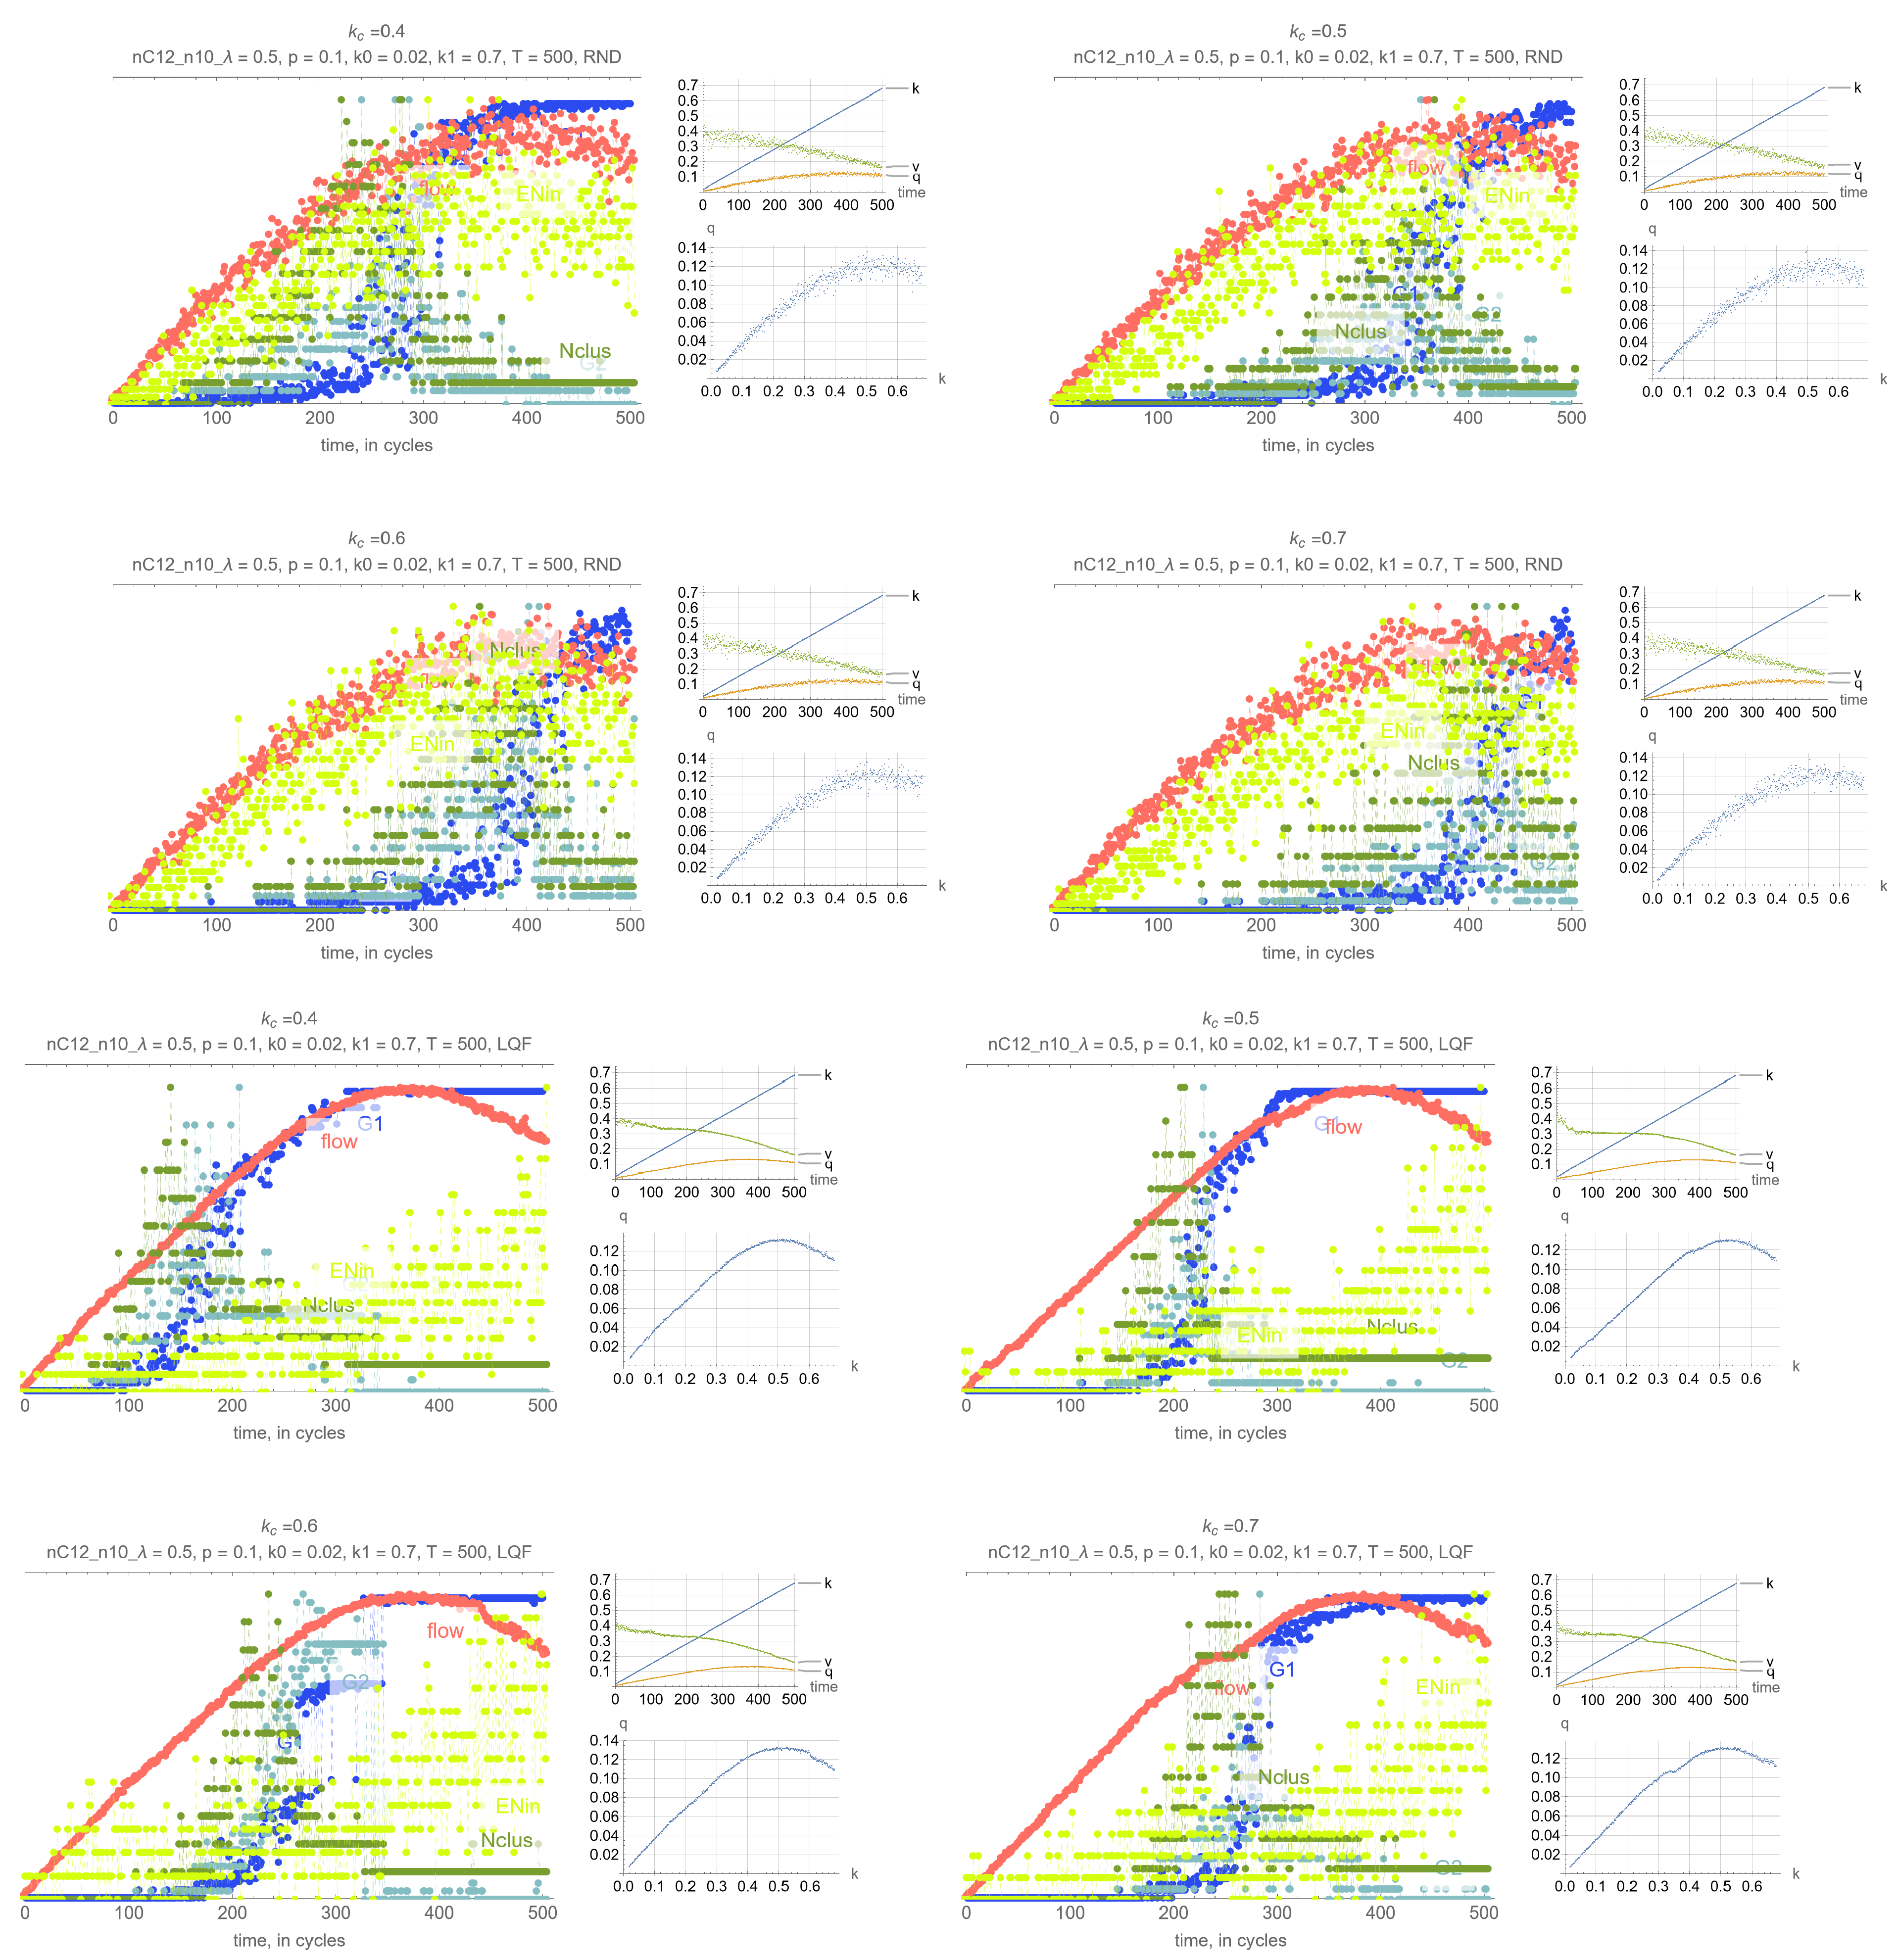
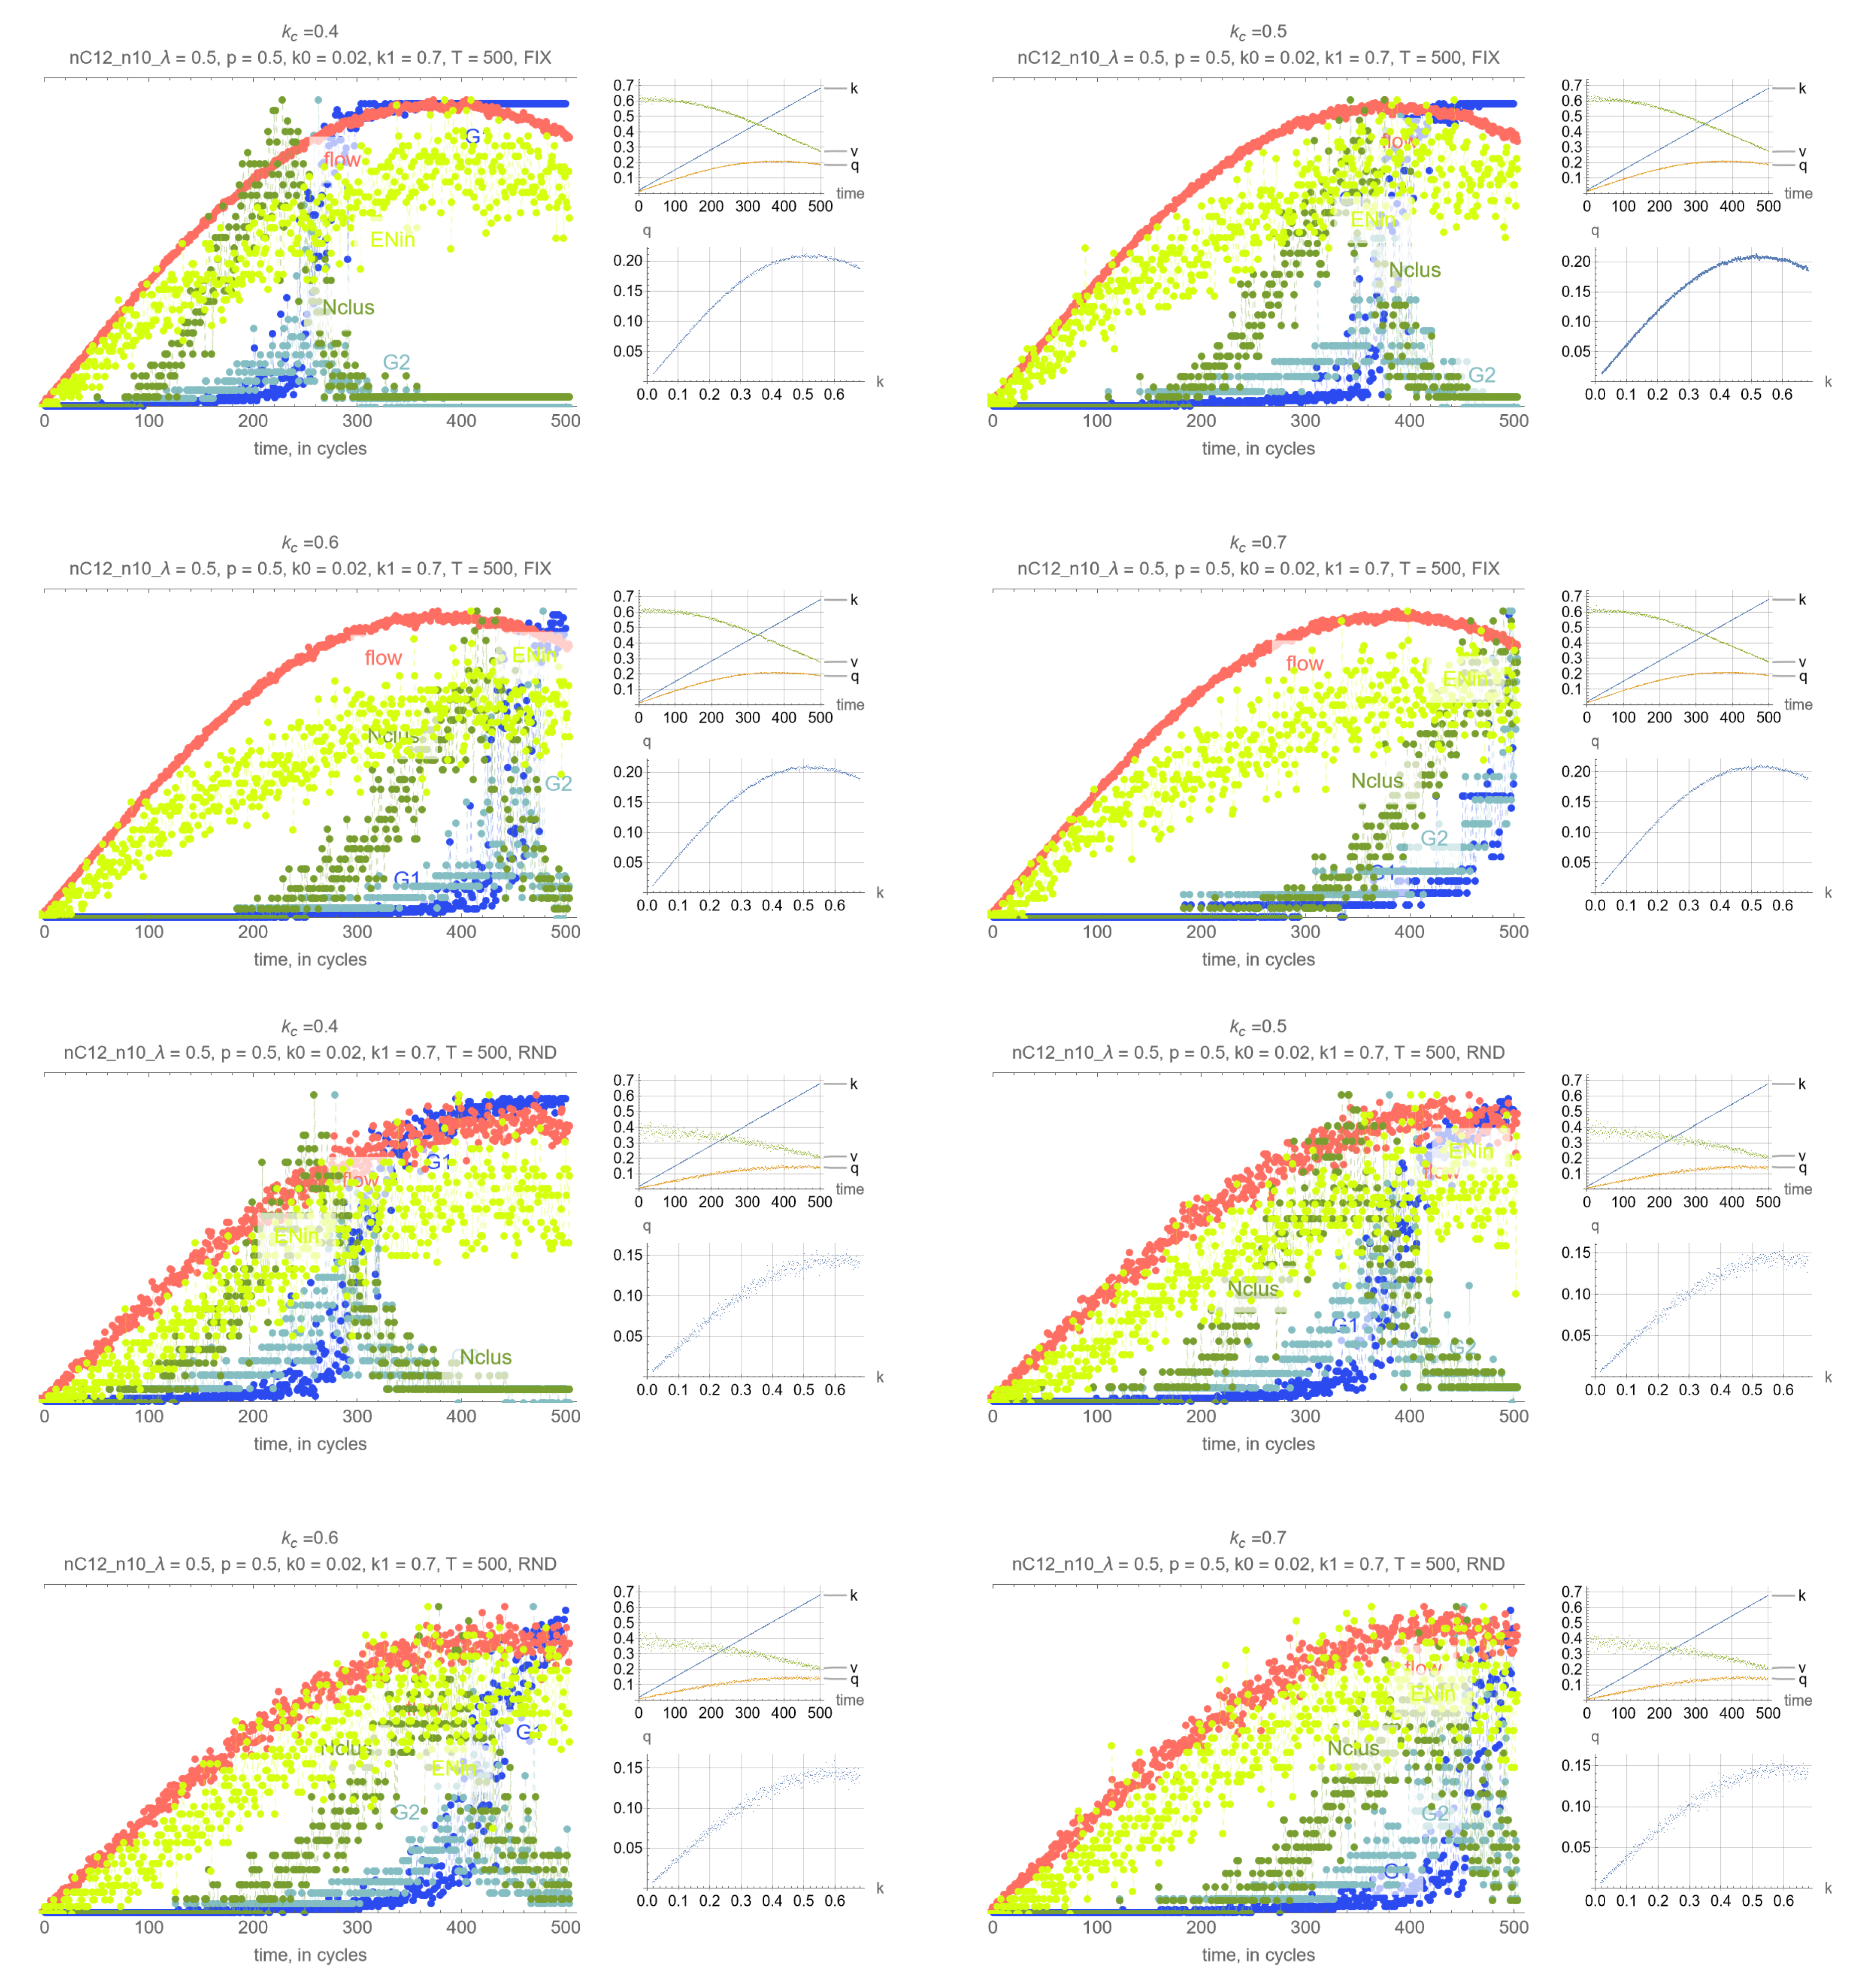
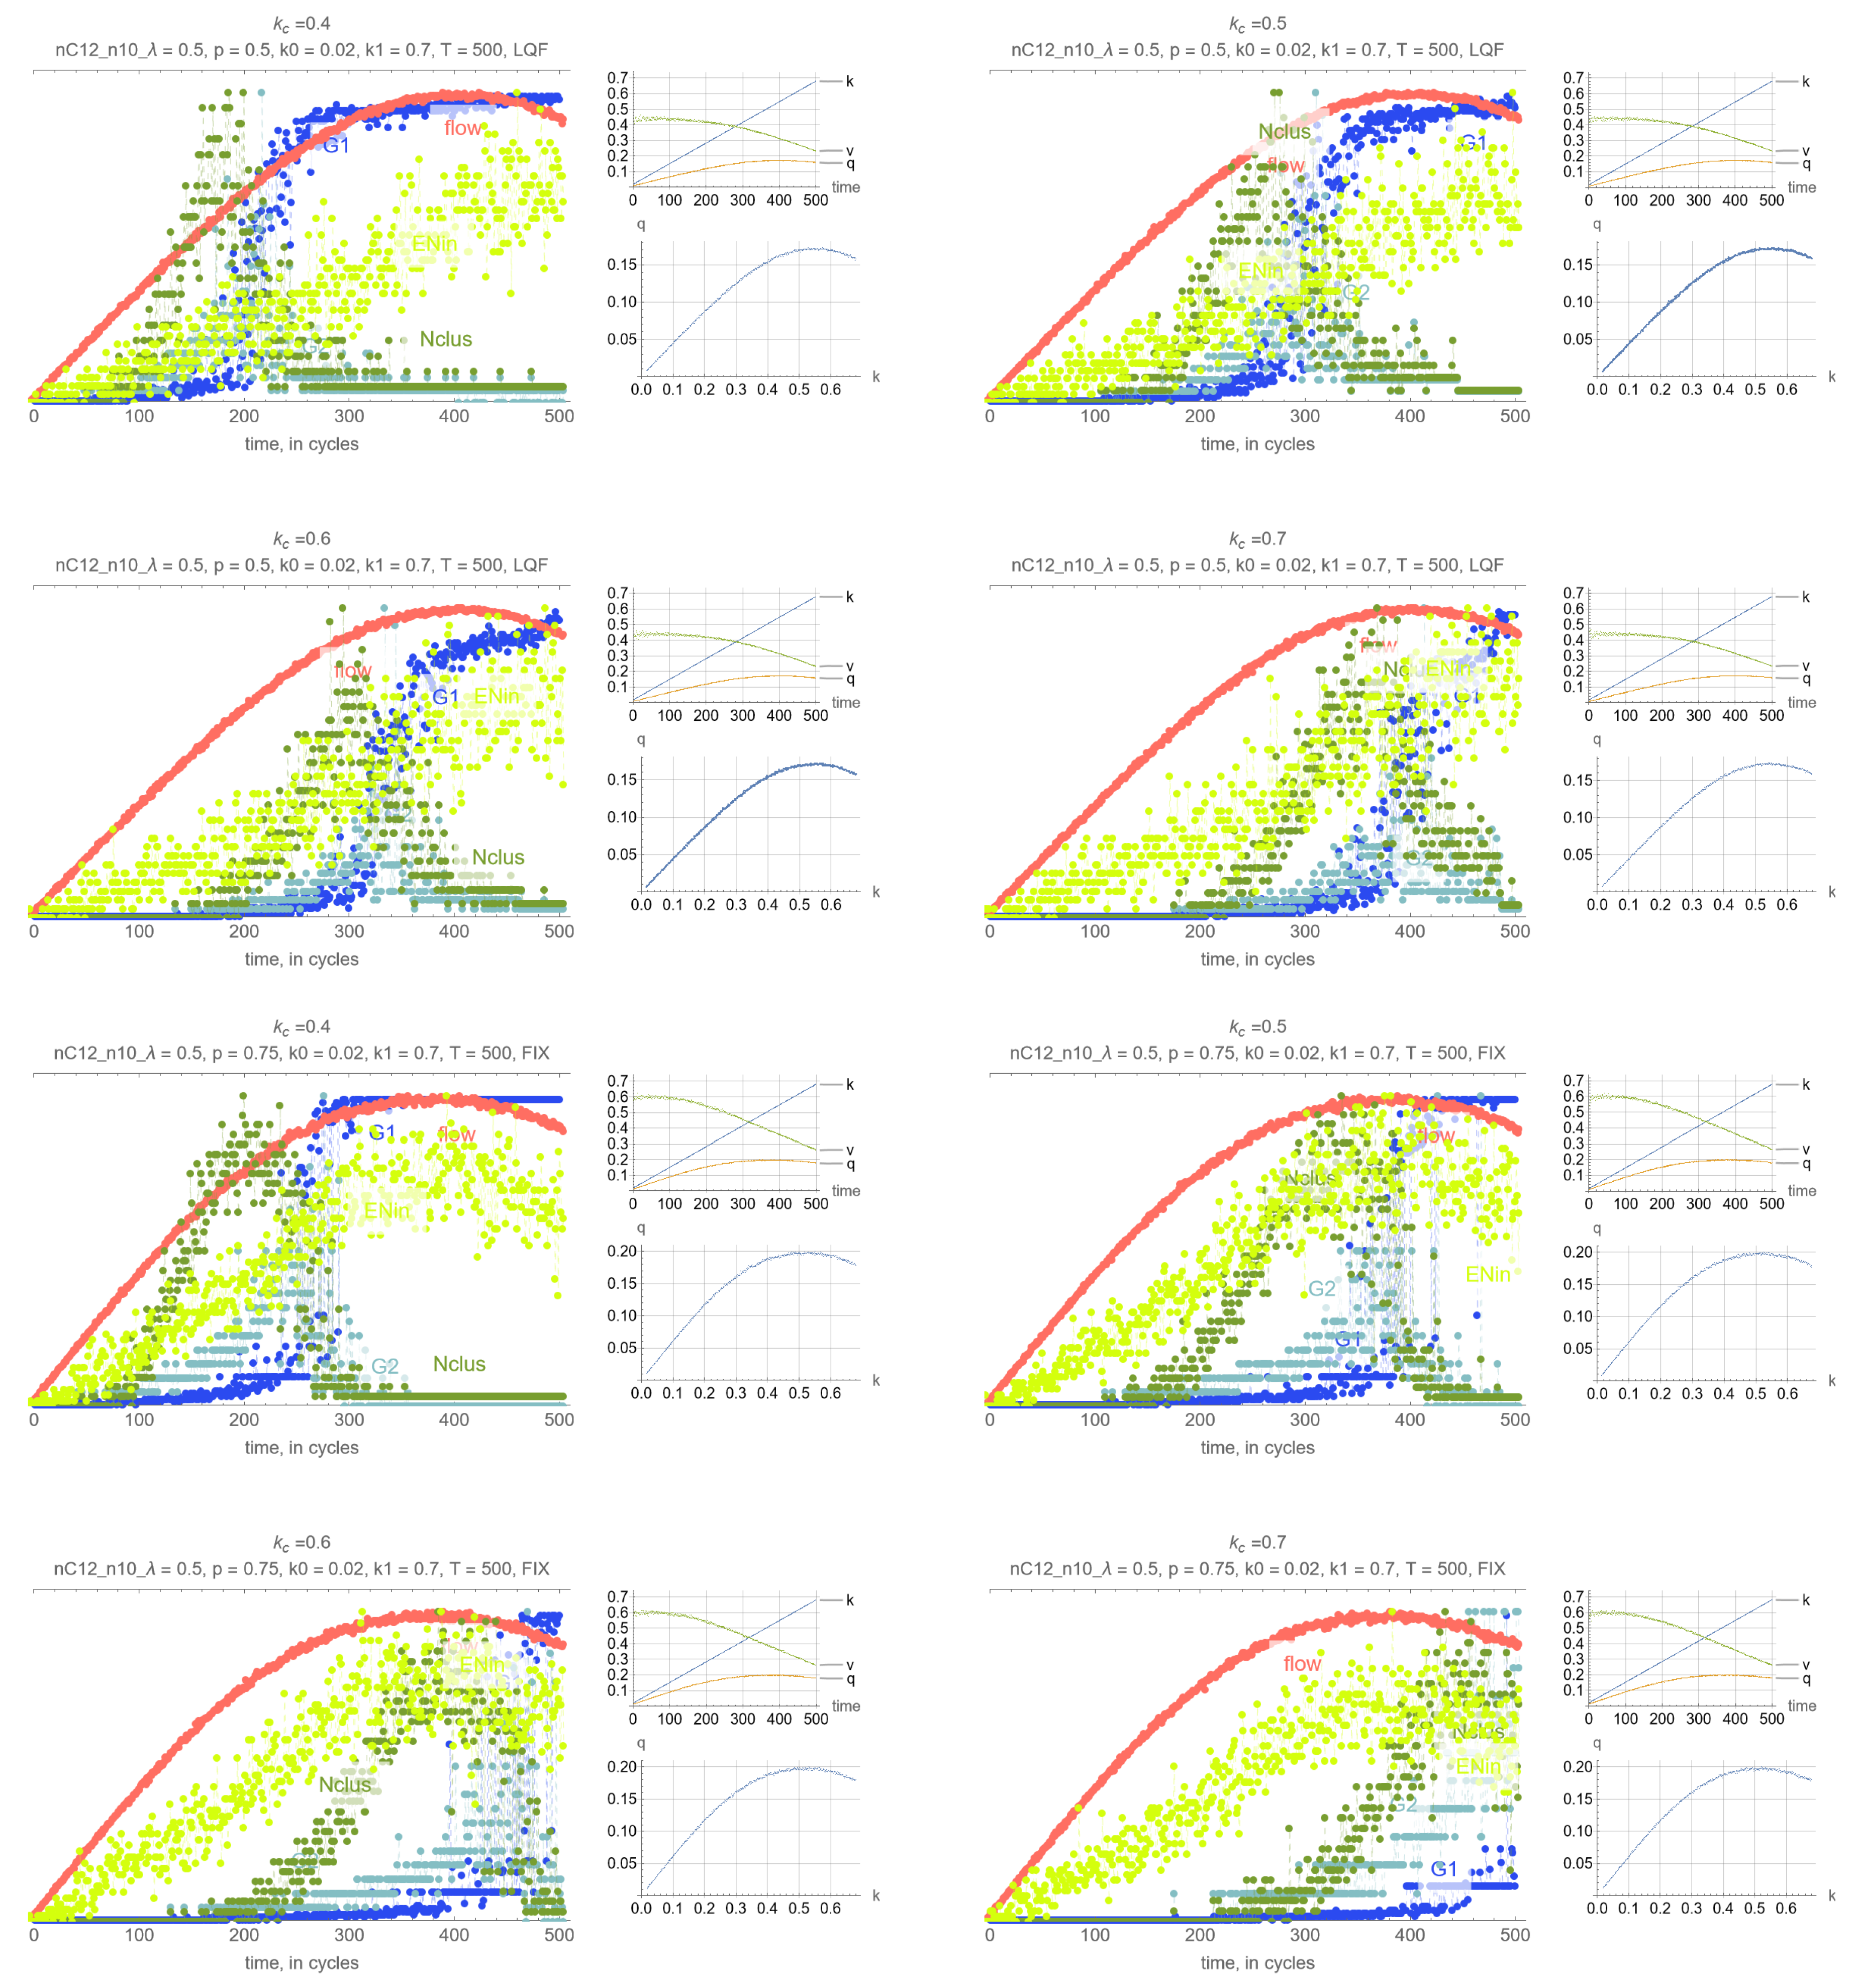
- Synchrony of critical points. If is set to the MFD critical density, maximum network throughput and the percolation transition happen simultaneously.
- R-3
- Synchrony of percolation variables. G, G and N exhibit the phase transition at the same time.
- R-4
- Possible precursors. The maximum value of N always precedes the percolation phase transition, by an amount that depends on network parameters mostly, but which can be too small in some cases to be effective. More promising perhaps is EN, the average number of cars across all intersections that are delayed when merging, whose maximum precedes the maximum flow critical point perhaps more consistently than N. This, however, is not a percolation-related variable, but clearly reflects the traffic conditions in the system, and could be very useful for traffic control.
- R-4
- Effects of network parameters. Surprisingly, it appears that these results, and more generally, the relationship between the percolation and flow processes is independent of the network type and signal control. The only exception appears to be short-block networks with low turning probability and LQF signal control, + LQF in the figure, where one can see that the percolation transitions happens before the maximum flow
5. Discussion
Acknowledgments
Appendix A. Simulation Output Figures
References
- Zeng, G.; Li, D.; Guo, S.; Gao, L.; Gao, Z.; Stanley, H.E.; Havlin, S. Switch between critical percolation modes in city traffic dynamics. Proc. Natl. Acad. Sci. USA 2019, 116, 23–28. [Google Scholar] [CrossRef] [PubMed]
- Zhang, L.; Zeng, G.; Li, D.; Huang, H.J.; Stanley, H.E.; Havlin, S. Scale-free resilience of real traffic jams. Proc. Natl. Acad. Sci. usa 2019, 116, 8673–8678. [Google Scholar] [CrossRef] [PubMed]
- Zeng, G.; Gao, J.; Shekhtman, L.; Guo, S.; Lv, W.; Wu, J.; Liu, H.; Levy, O.; Li, D.; Gao, Z.; et al. Multiple metastable network states in urban traffic. Proc. Natl. Acad. Sci. usa 2020, 117, 17528–17534. [Google Scholar] [CrossRef] [PubMed]
- Laval, J.A. Self-organized criticality of traffic flow: Implications for congestion management technologies. Transp. Res. Part C Emerg. Technol. 2023, 149, 104056. [Google Scholar] [CrossRef]
- Wolfram, S. Cellular automata as models of complexity. Nature 1984, 311, 419. [Google Scholar] [CrossRef]
- Nagel, K.; Paczuski, M. Emergent traffic jams. Phys. Rev. E 1995, 51, 2909. [Google Scholar] [CrossRef]
- Nagel, K.; Wagner, P.; Woesler, R. Still flowing: Approaches to traffic flow and traffic jam modeling. Oper. Res. 2003, 51, 681–710. [Google Scholar] [CrossRef]
- Stauffer, D.; Aharony, A. Introduction to Percolation Theory; CRC press, 2018. [Google Scholar]
- Bak, P.; Chen, K.; Creutz, M. Self-organized criticality in the’Game of Life. Nature 1989, 342, 780–782. [Google Scholar] [CrossRef]
- Paczuski, M.; Nagel, K. Self-organized criticality and 1/f noise in traffic. In Traffic and Granular Flow; World Scientific: Singapore, 1996; p. 73. [Google Scholar]
- Ambühl, L.; Menendez, M.; González, M.C. Understanding congestion propagation by combining percolation theory with the macroscopic fundamental diagram. Commun. Phys. 2023, 6, 26. [Google Scholar] [CrossRef]
- Nagel, K.; Schreckenberg, M. A cellular automaton model for freeway traffic. J. De Phys. I 1992, 2, 2221–2229. [Google Scholar] [CrossRef]
- Nagel, K.; Rasmussen, S.; Barrett, C.L. Network Traffic as a Self-Organized Critical Phenomena; Technical report; Los Alamos National Lab.: NM, USA, 1996. [Google Scholar]
- Daganzo, C.F. A Variational Formulation of Kinematic Wave Theory: Basic theory and complex boundary conditions. Transp. Res. Part B 2005, 39, 187–196. [Google Scholar] [CrossRef]
- Nagel, K. Personal communication, 2021.
- Schadschneider, A. Personal communication, 2021.
- Rieser, M.; Nagel, K. Network breakdown “at the edge of chaos” in multi-agent traffic simulations. Eur. Phys. J. B 2008, 63, 321–327. [Google Scholar] [CrossRef]
- Olmos, L.E.; Çolak, S.; Shafiei, S.; Saberi, M.; González, M.C. Macroscopic dynamics and the collapse of urban traffic. Proc. Natl. Acad. Sci. USA 2018, 115, 12654–12661. [Google Scholar] [CrossRef] [PubMed]
- Petri, G.; Expert, P.; Jensen, H.J.; Polak, J.W. Entangled communities and spatial synchronization lead to criticality in urban traffic. Sci. Rep. 2013, 3, 1798. [Google Scholar] [CrossRef] [PubMed]
- Li, D.; Fu, B.; Wang, Y.; Lu, G.; Berezin, Y.; Stanley, H.E.; Havlin, S. Percolation transition in dynamical traffic network with evolving critical bottlenecks. Proc. Natl. Acad. Sci. USA 2015, 112, 669–672. [Google Scholar] [CrossRef]
- Laval, J.; Zhou, H. Congested urban networks tend to be insensitive to signal settings: Implications for learning-based control. IEEE Trans. Intell. Transp. Syst. 2022, 23, 24904–24917. [Google Scholar] [CrossRef]
- Lighthill, M.J.; Whitham, G.B. On kinematic waves II. A theory of traffic flow on long crowded roads. Proc. R. Soc. Lond. Ser. A Math. Phys. Sci. 1955, 229, 317–345. [Google Scholar]
- Richards, P.I. Shock waves on the highway. Oper. Res. 1956, 4, 42–51. [Google Scholar] [CrossRef]
- Newell, G.F. A simplified car-following theory: A lower order model. Transp. Res. Part B Methodol. 2002, 36, 195–205. [Google Scholar] [CrossRef]
- Laval, J.A.; Chilukuri, B.R. Symmetries in the kinematic wave model and a parameter-free representation of traffic flow. Transp. Res. Part B Methodol. 2016, 89, 168–177. [Google Scholar] [CrossRef]
- Daganzo, C.F.; Gayah, V.V.; Gonzales, E.J. Macroscopic relations of urban traffic variables: Bifurcations, multivaluedness and instability. Transp. Res. Part B Methodol. 2011, 45, 278–288. [Google Scholar] [CrossRef]
- Mühlich, N.; Gayah, V.; Menendez, M. Use of microsimulation for examination of Macroscopic Fundamental Diagram hysteresis patterns for hierarchical urban street networks. Transp. Res. Rec. 2015, 2491, 117–126. [Google Scholar] [CrossRef]
- Laval, J. Traffic Flow as a Simple Fluid: Towards a Scaling Theory of Urban Congestion. Preprints 2022, 2022060377. [Google Scholar] [CrossRef]
- Laval, J.A. Effect of the trip-length distribution on network-level traffic dynamics: Exact and statistical results. Transp. Res. Part C Emerg. Technol. 2023, 148, 104036. [Google Scholar] [CrossRef]
Disclaimer/Publisher’s Note: The statements, opinions and data contained in all publications are solely those of the individual author(s) and contributor(s) and not of MDPI and/or the editor(s). MDPI and/or the editor(s) disclaim responsibility for any injury to people or property resulting from any ideas, methods, instructions or products referred to in the content. |
© 2023 by the authors. Licensee MDPI, Basel, Switzerland. This article is an open access article distributed under the terms and conditions of the Creative Commons Attribution (CC BY) license (http://creativecommons.org/licenses/by/4.0/).


