Submitted:
18 April 2023
Posted:
19 April 2023
You are already at the latest version
Abstract

Keywords:
1. Introduction
2. Results and Discussion
2.1. Characterization
4. Materials and Methods
4.1 Materials
4.2 Synthesis of modified Ketjenblack carbon (mKB)
4.3 Synthesis of NiDMOF
4.4 Synthesis of Ni(Fe)DMOF
4.5 Synthesis of NiDMOF/mKBx and Ni(Fe)DMOF/mKB14
4.6. Materials Characterization
5. Conclusions
Supplementary Materials
Author Contributions
Funding
Institutional Review Board Statement
Informed Consent Statement
Data Availability Statement
Acknowledgments
Conflicts of Interest
References
- Lianos, P. Review of recent trends in photoelectrocatalytic conversion of solar energy to electricity and hydrogen. Appl. Catal. B 2017, 210, 235–254. [Google Scholar] [CrossRef]
- Chu, S.; Cui, Y.; Liu, N. Opportunities and challenges for a sustainable energy future. Nat. Mater. 2017, 16, 16–22. [Google Scholar] [CrossRef] [PubMed]
- Wang, J.; Zhang, H.; Wang, X. Recent Methods for the Synthesis of Noble-Metal-Free Hydrogen-Evolution Electrocatalysts: From Nanoscale to Sub-nanoscale. Small Methods 2017, 1, 1700118. [Google Scholar] [CrossRef]
- Shrivastav, V.; Sundriyal, S.; Goel, P.; Kaur, H.; Tuteja, S.K.; Vikrant, K.; Kim, K.-H.; Tiwari, U.K.; Deep, A. Metal-organic frameworks (MOFs) and their composites as electrodes for lithium battery applications: Novel means for alternative energy storage. Coord. Chem. Rev. 2019, 393, 48–78. [Google Scholar] [CrossRef]
- Lee, Y.; Suntivich, J.; May, K.J.; Perry, E.E.; Shao-Horn, Y. Synthesis and Activities of Rutile IrO2 and RuO2 Nanoparticles for Oxygen Evolution in Acid and Alkaline Solutions. J. Phys. Chem. Lett. 2012, 3, 399–404. [Google Scholar] [CrossRef] [PubMed]
- Pi, Y.; Zhang, N.; Guo, S.; Guo, J.; Huang, X. Ultrathin Laminar Ir Superstructure as Highly Efficient Oxygen Evolution Electrocatalyst in Broad pH Range. Nano Lett. 2016, 16, 4424–4430. [Google Scholar] [CrossRef] [PubMed]
- Hu, C.; Zhang, L.; Gong, J. Recent progress made in the mechanism comprehension and design of electrocatalysts for alkaline water splitting. Energy Environ. Sci. 2019, 12, 2620–2645. [Google Scholar] [CrossRef]
- Miao, X.; Wu, L.; Lin, Y.; Yuan, X.; Zhao, J.; Yan, W.; Zhou, S.; Shi, L. The Role of Oxygen Vacancies in Water Oxidation for Perovskite Cobalt Oxide Electrocatalysts: Are More Better? Chem. Commun. 2019, 55, 1442. [Google Scholar] [CrossRef]
- Li, X.; Hao, X.; Wang, Z.; Abudula, A.; Guan, G. In-situ intercalation of NiFe LDH materials: an efficient approach to improve electrocatalytic activity and stability for water splitting. J. Power Sources 2017, 347, 193–200. [Google Scholar] [CrossRef]
- Han, L.; Dong, S.; Wang, E. Transition-Metal (Co, Ni, and Fe)-Based Electrocatalysts for the Water Oxidation Reaction. Adv. Mater. 2016, 28, 9266–9291. [Google Scholar] [CrossRef]
- Saha, S.; Ganguli, A.K. FeCoNi Alloy as Noble Metal-Free Electrocatalyst for Oxygen Evolution Reaction (OER). ChemistrySelect 2017, 2, 1630–1636. [Google Scholar] [CrossRef]
- Chen, Y.; Rui, K.; Zhu, J.; Dou, S.X.; Sun, W. Recent Progress on Nickel-Based Oxide/(Oxy) Hydroxide Electrocatalysts for the Oxygen Evolution Reaction. Eur. J. Chem 2019, 25, 703–713. [Google Scholar] [CrossRef]
- Yu, M.; Budiyanto, E.; Tüysüz, H. Principles of water electrolysis and recent progress in cobalt-, nickel-, and iron-based oxides for the oxygen evolution reaction. Angew. Chem. Int. Ed. 2022, 61, e202103824. [Google Scholar] [CrossRef] [PubMed]
- Vij, V.; Sultan, S.; Harzandi, A.M.; Meena, A.; Tiwari, J.N.; Lee, W.-G.; Yoon, T.; Kim, K.S. Nickel-based electrocatalysts for energy-related applications: oxygen reduction, oxygen evolution, and hydrogen evolution reactions. ACS Catal. 2017, 7, 7196–7225. [Google Scholar] [CrossRef]
- Hall, D.S.; Lockwood, D.J.; Bock, C.; MacDougall, B.R. Nickel hydroxides and related materials: a review of their structures, synthesis and properties. Proc. Math. Phys. Eng. Sci. 2015, 471, 20140792. [Google Scholar] [CrossRef] [PubMed]
- Landon, J.; Demeter, E.; İnoğlu, N.; Keturakis, C.; Wachs, I.E.; Vasić, R.; Frenkel, A.I.; Kitchin, J.R. Spectroscopic Characterization of Mixed Fe–Ni Oxide Electrocatalysts for the Oxygen Evolution Reaction in Alkaline Electrolytes. ACS Catal. 2012, 2, 1793–1801. [Google Scholar] [CrossRef]
- Subbaraman, R.; Tripkovic, D.; Chang, K.-C.; Strmcnik, D.; Paulikas, A.P.; Hirunsit, P.; Chan, M.; Greeley, J.; Stamenkovic, V.; Markovic, N.M. Trends in activity for the water electrolyser reactions on 3 d M (Ni, Co, Fe, Mn) hydr(oxy)oxide catalysts. Nat. Mater. 2012, 11, 550–557. [Google Scholar] [CrossRef]
- Stern, L.-A.; Hu, X. Enhanced oxygen evolution activity by NiOx and Ni(OH)2 nanoparticles. Faraday Discuss. 2014, 176, 363–379. [Google Scholar] [CrossRef]
- Corrigan, D.A. The Catalysis of the Oxygen Evolution Reaction by Iron Impurities in Thin Film Nickel Oxide Electrodes. J. Electrochem. Soc. 1987, 134, 377–384. [Google Scholar] [CrossRef]
- Louie, M.W.; Bell, A.T. An Investigation of Thin-Film Ni–Fe Oxide Catalysts for the Electrochemical Evolution of Oxygen. J. Am. Chem. Soc. 2013, 135, 12329–12337. [Google Scholar] [CrossRef]
- Qi, J.; Zhang, W.; Xiang, R.; Liu, K.; Wang, H.-Y.; Chen, M.; Han, Y.; Cao, R. Porous Nickel–Iron Oxide as a Highly Efficient Electrocatalyst for Oxygen Evolution Reaction. Adv. Sci. 2015, 2, 1500199. [Google Scholar] [CrossRef]
- Stevens, M.B.; Trang, C.D.M.; Enman, L.J.; Deng, J.; Boettcher, S.W. Reactive Fe-Sites in Ni/Fe (Oxy)hydroxide Are Responsible for Exceptional Oxygen Electrocatalysis Activity. J. Electrochem. Soc. 2017, 139, 11361–11364. [Google Scholar] [CrossRef] [PubMed]
- Yu, M.; Moon, G.; Bill, E.; Tüysüz, H. Optimizing Ni–Fe Oxide Electrocatalysts for Oxygen Evolution Reaction by Using Hard Templating as a Toolbox. ACS Appl. Energy Mater. 2019, 2, 1199–1209. [Google Scholar] [CrossRef]
- Fominykh, K.; Chernev, P.; Zaharieva, I.; Sicklinger, J.; Stefanic, G.; Döblinger, M.; Müller, A.; Pokharel, A.; Böcklein, S.; Scheu, C.; et al. Iron-Doped Nickel Oxide Nanocrystals as Highly Efficient Electrocatalysts for Alkaline Water Splitting. ACS nano 2015, 9, 5180–5188. [Google Scholar] [CrossRef] [PubMed]
- Burke, M.S.; Enman, L.J.; Batchellor, A.S.; Zou, S.; Boettcher, S.W. Oxygen Evolution Reaction Electrocatalysis on Transition Metal Oxides and (Oxy)hydroxides: Activity Trends and Design Principles. Chem. Mater. 2015, 27, 7549–7558. [Google Scholar] [CrossRef]
- Burke, M.S.; Kast, M.G.; Trotochaud, L.; Smith, A.M.; Boettcher, S.W. Cobalt–Iron (Oxy)hydroxide Oxygen Evolution Electrocatalysts: The Role of Structure and Composition on Activity, Stability, and Mechanism. J. Am. Chem. Soc. 2015, 137, 3638–3648. [Google Scholar] [CrossRef] [PubMed]
- Ray, C.; Lee, S.C.; Jin, B.; Kundu, A.; Park, J.H.; Jun, S.C. Stacked Porous Iron-Doped Nickel Cobalt Phosphide Nanoparticle: An Efficient and Stable Water Splitting Electrocatalyst. ACS Sustain. Chem. Eng. 2018, 6, 6146–6156. [Google Scholar] [CrossRef]
- Li, B.; Wen, H.-M.; Zhou, W.; Chen, B. Porous metal–organic frameworks for gas storage and separation: what, how, and why? J. Phys. Chem. Lett. 2014, 5, 3468–3479. [Google Scholar] [CrossRef]
- Ma, S.; Zhou, H.-C. Gas storage in porous metal–organic frameworks for clean energy applications. Chem. Commun. 2010, 46, 44–53. [Google Scholar] [CrossRef]
- Yaghi, O.M.; Li, H. Hydrothermal Synthesis of a Metal-Organic Framework Containing Large Rectangular Channels. J. Am. Chem. Soc. 1995, 117, 10401–10402. [Google Scholar] [CrossRef]
- Yaghi, O.M.; Li, G.; Li, H. Selective binding and removal of guests in a microporous metal–organic framework. Nature 1995, 378, 703–706. [Google Scholar] [CrossRef]
- Scheurle, P.I.; Mähringer, A.; Jakowetz, A.C.; Hosseini, P.; Richter, A.F.; Wittstock, G.; Medina, D.D.; Bein, T. A highly crystalline anthracene-based MOF-74 series featuring electrical conductivity and luminescence. Nanoscale 2019, 11, 20949–20955. [Google Scholar] [CrossRef]
- Allendorf, M.D.; Schwartzberg, A.; Stavila, V.; Talin, A.A. A roadmap to implementing metal–organic frameworks in electronic devices: challenges and critical directions. Chem. Eur. J. 2011, 17, 11372–11388. [Google Scholar] [CrossRef] [PubMed]
- Wu, H.B.; Lou, X.W. Metal-Organic Frameworks and Their Derived Materials for Electrochemical Energy Storage and Conversion: Promises and Challenges. Sci. Adv. 2017, 3, eaap9252. [Google Scholar] [CrossRef] [PubMed]
- Zheng, W.; Lee, L.Y.S. Metal–organic frameworks for electrocatalysis: catalyst or precatalyst? ACS Energy Lett. 2021, 6, 2838–2843. [Google Scholar] [CrossRef]
- Singh, B.; Yadav, A.; Indra, A. Realizing electrochemical transformation of a metal–organic framework precatalyst into a metal hydroxide–oxy (hydroxide) active catalyst during alkaline water oxidation. J. Mater. Chem. A 2022, 10, 3843–3868. [Google Scholar] [CrossRef]
- Sondermann, L.; Jiang, W.; Shviro, M.; Spieß, A.; Woschko, D.; Rademacher, L.; Janiak, C. Nickel-Based Metal-Organic Frameworks as Electrocatalysts for the Oxygen Evolution Reaction (OER). Molecules 2022, 27, 1241. [Google Scholar] [CrossRef]
- Wang, J.; Kim, S.-J.; Liu, J.; Gao, Y.; Choi, S.; Han, J.; Shin, H.; Jo, S.; Kim, J.; Ciucci, F. Redirecting dynamic surface restructuring of a layered transition metal oxide catalyst for superior water oxidation. Nat. Catal. 2021, 4, 212–222. [Google Scholar] [CrossRef]
- Gong, L.; Yang, H.; Wang, H.; Qi, R.; Wang, J.; Chen, S.; You, B.; Dong, Z.; Liu, H.; Xia, B.Y. Corrosion formation and phase transformation of nickel-iron hydroxide nanosheets array for efficient water oxidation. Nano Res. 2021, 14, 4528–4533. [Google Scholar] [CrossRef]
- Hassan, M.H.; Soliman, A.B.; Elmehelmey, W.A.; Abugable, A.A.; Karakalos, S.G.; Elbahri, M.; Hassanien, A.; Alkordi, M.H. A Ni-loaded, metal–organic framework–graphene composite as a precursor for in situ electrochemical deposition of a highly active and durable water oxidation nanocatalyst. Chem. Commun. 2019, 55, 31–34. [Google Scholar] [CrossRef]
- Meng, J.; Zhou, Y.; Chi, H.; Li, K.; Wan, J.; Hu, Z. Bimetallic porphyrin mof anchored onto rgo nanosheets as a highly efficient 2d electrocatalyst for oxygen evolution reaction in alkaline conditions. ChemistrySelect 2019, 4, 8661–8670. [Google Scholar] [CrossRef]
- Zheng, X.; Cao, Y.; Liu, D.; Cai, M.; Ding, J.; Liu, X.; Wang, J.; Hu, W.; Zhong, C. Bimetallic metal–organic-framework/reduced graphene oxide composites as bifunctional electrocatalysts for rechargeable Zn–air batteries. ACS Appl. Mater. Interfaces 2019, 11, 15662–15669. [Google Scholar] [CrossRef] [PubMed]
- Srinivas, K.; Chen, Y.; Wang, X.; Wang, B.; Karpuraranjith, M.; Wang, W.; Su, Z.; Zhang, W.; Yang, D. Constructing Ni/NiS heteronanoparticle-embedded metal–organic framework-derived nanosheets for enhanced water-splitting catalysis. ACS Sustain. Chem. Eng. 2021, 9, 1920–1931. [Google Scholar] [CrossRef]
- Sohrabi, S.; Dehghanpour, S.; Ghalkhani, M. A cobalt porphyrin-based metal organic framework/multi-walled carbon nanotube composite electrocatalyst for oxygen reduction and evolution reactions. J. Mater. Sci. 2018, 53, 3624–3639. [Google Scholar] [CrossRef]
- Wang, C.; Zhou, M.; Ma, Y.; Tan, H.; Wang, Y.; Li, Y. Hybridized Polyoxometalate-Based Metal–Organic Framework with Ketjenblack for the Nonenzymatic Detection of H2O2. Chem. Asian J. 2018, 13, 2054–2059. [Google Scholar] [CrossRef]
- Peng, H.; Yang, X.; Ma, Y.; Liu, J.; Wang, Y.; Tan, H.; Li, Y. Polyoxometalate-based metal–organic framework loaded with an ultra-low amount of Pt as an efficient electrocatalyst for hydrogen production. CrystEngComm 2018, 20, 5387–5394. [Google Scholar] [CrossRef]
- Huang, Z.-H.; Xie, N.-H.; Zhang, M.; Xu, B.-Q. Nonpyrolyzed Fe− N Coordination-Based Iron Triazolate Framework: An Efficient and Stable Electrocatalyst for Oxygen Reduction Reaction. ChemSusChem 2019, 12, 200–207. [Google Scholar] [CrossRef] [PubMed]
- Öztürk, S.; Moon, G.-H.; Spieß, A.; Budiyanto, E.; Roitsch, S.; Tüysüz, H.; Janiak, C. A Highly-Efficient Oxygen Evolution Electrocatalyst Derived from a Metal-Organic Framework and Ketjenblack Carbon Material. ChemPlusChem 2021, 86, 1106–1115. [Google Scholar] [CrossRef]
- Maniam, P.; Stock, N. Investigation of Porous Ni-Based Metal–Organic Frameworks Containing Paddle-Wheel Type Inorganic Building Units via High-Throughput Methods. Inorg. Chem. 2011, 50, 5085–5097. [Google Scholar] [CrossRef]
- Zhang, Q.; Li, T.; Liang, J.; Wang, N.; Kong, X.; Wang, J.; Qian, H.; Zhou, Y.; Liu, F.; Wei, C. Highly wettable and metallic NiFe-phosphate/phosphide catalyst synthesized by plasma for highly efficient oxygen evolution reaction. J. Mater. Chem. A 2018, 6, 7509–7516. [Google Scholar] [CrossRef]
- Qiu, Y.; Le Xin; Li, W. Electrocatalytic oxygen evolution over supported small amorphous Ni–Fe nanoparticles in alkaline electrolyte. Langmuir 2014, 30, 7893–7901. [Google Scholar] [CrossRef] [PubMed]
- Li, D.-J.; Li, Q.-H.; Gu, Z.-G.; Zhang, J. A surface-mounted MOF thin film with oriented nanosheet arrays for enhancing the oxygen evolution reaction. J. Mater. Chem. A 2019, 7, 18519–18528. [Google Scholar] [CrossRef]
- Henke, S.; Schneemann, A.; Wütscher, A.; Fischer, R.A. Directing the Breathing Behavior of Pillared-Layered Metal–Organic Frameworks via a Systematic Library of Functionalized Linkers Bearing Flexible Substituents. J. Am. Chem. Soc. 2012, 134, 9464–9474. [Google Scholar] [CrossRef] [PubMed]
- Asgharnejad, L.; Abbasi, A.; Shakeri, A. Ni-based metal-organic framework/GO nanocomposites as selective adsorbent for CO2 over N2. Microporous Mesoporous Mater. 2018, 262, 227–234. [Google Scholar] [CrossRef]
- Qi, J.; Zhang, W.; Cao, R. Porous Materials as Highly Efficient Electrocatalysts for the Oxygen Evolution Reaction. ChemCatChem 2018, 10, 1206–1220. [Google Scholar] [CrossRef]
- Thommes, M.; Kaneko, K.; Neimark, A.V.; Olivier, J.P.; Rodriguez-Reinoso, F.; Rouquerol, J.; Sing, K.S.W. Physisorption of gases, with special reference to the evaluation of surface area and pore size distribution (IUPAC Technical Report). Pure Appl. Chem. 2015, 87, 1051–1069. [Google Scholar] [CrossRef]
- Wang, X.; Niu, Z.; Al-Enizi, A.M.; Nafady, A.; Wu, Y.; Aguila, B.; Verma, G.; Wojtas, L.; Chen, Y.-S.; Li, Z.; et al. Pore environment engineering in metal–organic frameworks for efficient ethane/ethylene separation. J. Mater. Chem. A 2019, 7, 13585–13590. [Google Scholar] [CrossRef]
- Jiang, X.; Deng, S.; Sun, L.; Liu, J.; Qi, N.; Chen, Z. Pillared nickel-based metal-organic frameworks as electrode material with high electrochemical performance. J. Electroanal. Chem. 2020, 879, 114802. [Google Scholar] [CrossRef]
- Hungerford, J.; Bhattacharyya, S.; Tumuluri, U.; Nair, S.; Wu, Z.; Walton, K.S. DMOF-1 as a representative MOF for SO2 adsorption in both humid and dry conditions. J. Phys. Chem. C 2018, 122, 23493–23500. [Google Scholar] [CrossRef]
- McIntyre, N.S.; Cook, M.G. X-ray photoelectron studies on some oxides and hydroxides of cobalt, nickel, and copper. Anal. Chem. 1975, 47, 2208–2213. [Google Scholar] [CrossRef]
- Jiang, H.; Guo, Y.; Wang, T.; Zhu, P.-L.; Yu, S.; Yu, Y.; Fu, X.-Z.; Sun, R.; Wong, C.-P. Electrochemical fabrication of Ni(OH)2/Ni 3D porous composite films as integrated capacitive electrodes. RSC Adv. 2015, 5, 12931–12936. [Google Scholar] [CrossRef]
- Lee, J.W.; Ahn, T.; Soundararajan, D.; Ko, J.M.; Kim, J.-D. Non-aqueous approach to the preparation of reduced graphene oxide/α-Ni(OH)2 hybrid composites and their high capacitance behavior. Chem. Commun. 2011, 47, 6305–6307. [Google Scholar] [CrossRef] [PubMed]
- Yan, J.; Fan, Z.; Sun, W.; Ning, G.; Wei, T.; Zhang, Q.; Zhang, R.; Zhi, L.; Wei, F. Advanced asymmetric supercapacitors based on Ni(OH)2/graphene and porous graphene electrodes with high energy density. Adv. Funct. Mater. 2012, 22, 2632–2641. [Google Scholar] [CrossRef]
- Yamashita, T.; Hayes, P. Analysis of XPS spectra of Fe2+ and Fe3+ ions in oxide materials. Appl. Surf. Sci. 2008, 254, 2441–2449. [Google Scholar] [CrossRef]
- Biesinger, M.C.; Payne, B.P.; Grosvenor, A.P.; Lau, L.W.M.; Gerson, A.R.; Smart, R.S.C. Resolving surface chemical states in XPS analysis of first row transition metals, oxides and hydroxides: Cr, Mn, Fe, Co and Ni. Appl. Surf. Sci. 2011, 257, 2717–2730. [Google Scholar] [CrossRef]
- Yin, L.I.; Yellin, E.; Adler, I. X-Ray Excited LMM Auger Spectra of Copper, Nickel, and Iron. J. Appl. Phys. 1971, 42, 3595–3600. [Google Scholar] [CrossRef]
- Zhou, C.; Chen, X.; Liu, S.; Han, Y.; Meng, H.; Jiang, Q.; Zhao, S.; Wei, F.; Sun, J.; Tan, T.; et al. Superdurable Bifunctional Oxygen Electrocatalyst for High-Performance Zinc–Air Batteries. J. Am. Chem. Soc. 2022, 144, 2694–2704. [Google Scholar] [CrossRef]
- Shinagawa, T.; Garcia-Esparza, A.T.; Takanabe, K. Insight on Tafel slopes from a microkinetic analysis of aqueous electrocatalysis for energy conversion. Sci. Rep. 2015, 5, 13801. [Google Scholar] [CrossRef]
- Matsumoto, Y.; Sato, E. Electrocatalytic properties of transition metal oxides for oxygen evolution reaction. Materials Chemistry and Physics 1986, 14, 397–426. [Google Scholar] [CrossRef]
- Li, G.; Anderson, L.; Chen, Y.; Pan, M.; Chuang, P.-Y.A. New insights into evaluating catalyst activity and stability for oxygen evolution reactions in alkaline media. Sustain. Energy Fuels 2018, 2, 237–251. [Google Scholar] [CrossRef]
- Matsumoto, Y.; Sato, E. Electrocatalytic properties of transition metal oxides for oxygen evolution reaction. Mater. Chem. Phys. 1986, 14, 397–426. [Google Scholar] [CrossRef]
- Möller, S.; Barwe, S.; Masa, J.; Wintrich, D.; Seisel, S.; Baltruschat, H.; Schuhmann, W. Online Monitoring of Electrochemical Carbon Corrosion in Alkaline Electrolytes by Differential Electrochemical Mass Spectrometry. Angew. Chem. Int. Ed. 2020, 59, 1585–1589. [Google Scholar] [CrossRef] [PubMed]
- Li, J.; Zhou, N.; Song, J.; Fu, L.; Yan, J.; Tang, Y.; Wang, H. Cu–MOF-Derived Cu/Cu2O Nanoparticles and CuNxCy Species to Boost Oxygen Reduction Activity of Ketjenblack Carbon in Al–Air Battery. ACS Sustain. Chem. Eng. 2018, 6, 413–421. [Google Scholar] [CrossRef]
- Tee, S.Y.; Win, K.Y.; Teo, W.S.; Koh, L.-D.; Liu, S.; Teng, C.P.; Han, M.-Y. Recent Progress in Energy-Driven Water Splitting. Adv. Sci. 2017, 4, 1600337. [Google Scholar] [CrossRef] [PubMed]
- Liu, Q.; Cong, H.; Deng, H. Deciphering the Spatial Arrangement of Metals and Correlation to Reactivity in Multivariate Metal–Organic Frameworks. J. Am. Chem. Soc. 2016, 138, 13822–13825. [Google Scholar] [CrossRef]
- Gao, M.-R.; Xu, Y.-F.; Jiang, J.; Yu, S.-H. Nanostructured metal chalcogenides: synthesis, modification, and applications in energy conversion and storage devices. Chem. Soc. Rev. 2013, 42, 2986–3017. [Google Scholar] [CrossRef] [PubMed]
- Doyle, R.L.; Lyons, M.E.G. An electrochemical impedance study of the oxygen evolution reaction at hydrous iron oxide in base. Phys. Chem. Chem. Phys. 2013, 15, 5224–5237. [Google Scholar] [CrossRef]
- Doyle, R.L.; Lyons, M.E.G. Kinetics and Mechanistic Aspects of the Oxygen Evolution Reaction at Hydrous Iron Oxide Films in Base. J. Am. Chem. Soc. 2013, 160, H142. [Google Scholar] [CrossRef]
- Doyle, R.L.; Godwin, I.J.; Brandon, M.P.; Lyons, M.E.G. Redox and electrochemical water splitting catalytic properties of hydrated metal oxide modified electrodes. Phys. Chem. Chem. Phys. 2013, 15, 13737–13783. [Google Scholar] [CrossRef]
- Miller, E.L.; Rocheleau, R.E. Electrochemical behavior of reactively sputtered iron-doped nickel oxide. J. Electrochem. Soc. 1997, 144, 3072. [Google Scholar] [CrossRef]
- Lin, Y.; Wan, H.; Wu, D.; Chen, G.; Zhang, N.; Liu, X.; Li, J.; Cao, Y.; Qiu, G.; Ma, R. Metal–organic framework hexagonal nanoplates: bottom-up synthesis, topotactic transformation, and efficient oxygen evolution reaction. J. Am. Chem. Soc. 2020, 142, 7317–7321. [Google Scholar] [CrossRef] [PubMed]
- Feng, J.-X.; Xu, H.; Dong, Y.-T.; Ye, S.-H.; Tong, Y.-X.; Li, G.-R. FeOOH/Co/FeOOH hybrid nanotube arrays as high-performance electrocatalysts for the oxygen evolution reaction. Angew. Chem. Int. Ed. 2016, 55, 3694–3698. [Google Scholar] [CrossRef] [PubMed]
- Lu, C.; Tranca, D.; Zhang, J.; Rodrı́guez Hernández, F.; Su, Y.; Zhuang, X.; Zhang, F.; Seifert, G.; Feng, X. Molybdenum carbide-embedded nitrogen-doped porous carbon nanosheets as electrocatalysts for water splitting in alkaline media. ACS nano 2017, 11, 3933–3942. [Google Scholar] [CrossRef] [PubMed]
- Luo, J.; Im, J.-H.; Mayer, M.T.; Schreier, M.; Nazeeruddin, M.K.; Park, N.-G.; Tilley, S.D.; Fan, H.J.; Grätzel, M. Water photolysis at 12.3% efficiency via perovskite photovoltaics and Earth-abundant catalysts. Science 2014, 345, 1593–1596. [Google Scholar] [CrossRef] [PubMed]
- Dong, G.; Fang, M.; Zhang, J.; Wei, R.; Shu, L.; Liang, X.; Yip, S.; Wang, F.; Guan, L.; Zheng, Z.; et al. In situ formation of highly active Ni–Fe based oxygen-evolving electrocatalysts via simple reactive dip-coating. J. Mater. Chem. A 2017, 5, 11009–11015. [Google Scholar] [CrossRef]
- Y. F. Yuan; X.H. Xia; J.B. Wu; J.L. Yang; Y.B. Chen; S.Y. Guo. Nickel foam-supported porous Ni(OH)2/NiOOH composite film as advanced pseudocapacitor material. Electrochim. Acta. 2011, 56, 2627–2632. [Google Scholar] [CrossRef]
- Lee, S.-Y.; Kim, I.-S.; Cho, H.-S.; Kim, C.-H.; Lee, Y.-K. Resolving Potential-Dependent Degradation of Electrodeposited Ni(OH)2 Catalysts in Alkaline Oxygen Evolution Reaction (OER): In Situ XANES Studies. Appl. Catal. B 2021, 284, 119729. [Google Scholar] [CrossRef]
- Klaus, S.; Cai, Y.; Louie, M.W.; Trotochaud, L.; Bell, A.T. Effects of Fe electrolyte impurities on Ni (OH)2/NiOOH structure and oxygen evolution activity. Open J. Phys. Chem. C 2015, 119, 7243–7254. [Google Scholar] [CrossRef]
- Nadesan, J.B.; Tseung, A.C. Oxygen evolution on nickel oxide electrodes. J. Electrochem. Soc. 1985, 132, 2957. [Google Scholar] [CrossRef]
- Fominykh, K.; Feckl, J.M.; Sicklinger, J.; Döblinger, M.; Böcklein, S.; Ziegler, J.; Peter, L.; Rathousky, J.; Scheidt, E.-W.; Bein, T. Ultrasmall dispersible crystalline nickel oxide nanoparticles as high-performance catalysts for electrochemical water splitting. Adv. Funct. Mater. 2014, 24, 3123–3129. [Google Scholar] [CrossRef]
- Subbaraman, R.; Tripkovic, D.; Chang, K.-C.; Strmcnik, D.; Paulikas, A.P.; Hirunsit, P.; Chan, M.; Greeley, J.; Stamenkovic, V.; Markovic, N.M. Trends in activity for the water electrolyser reactions on 3 d M (Ni, Co, Fe, Mn) hydr(oxy)oxide catalysts. Nat. Mater. 2012, 11, 550–557. [Google Scholar] [CrossRef] [PubMed]
- Xu, P.; Han, X.J.; Zhang, B.; Lv, Z.S.; Liu, X.R. Characterization of an ultrafine β-nickel hydroxide from supersonic co-precipitation method. J. Alloys Compd. 2007, 436, 369–374. [Google Scholar] [CrossRef]
- Jiang, X.; Deng, S.; Liu, J.; Qi, N.; Chen, Z. Enhanced Electrochemical Performance of Bimetallic Doped Ni-Based Metal–Organic Frameworks by Redox Additives in an Alkaline Electrolyte. ACS Appl. Energy Mater. 2021, 4, 4610–4619. [Google Scholar] [CrossRef]
- Qu, C.; Jiao, Y.; Zhao, B.; Chen, D.; Zou, R.; Walton, K.S.; Liu, M. Nickel-based pillared MOFs for high-performance supercapacitors: design, synthesis and stability study. Nano Energy 2016, 26, 66–73. [Google Scholar] [CrossRef]
- Jiao, Y.; Qu, C.; Zhao, B.; Liang, Z.; Chang, H.; Kumar, S.; Zou, R.; Liu, M.; Walton, K.S. High-Performance Electrodes for a Hybrid Supercapacitor Derived from a Metal–Organic Framework/Graphene Composite. ACS Appl. Energy Mater. 2019, 2, 5029–5038. [Google Scholar] [CrossRef]
- Anantharaj, S.; Karthik, P.E.; Kundu, S. Petal-like hierarchical array of ultrathin Ni(OH)2 nanosheets decorated with Ni(OH)2 nanoburls: a highly efficient OER electrocatalyst. Catal. Sci. Technol. 2017, 7, 882–893. [Google Scholar] [CrossRef]
- Gao, M.; Sheng, W.; Zhuang, Z.; Fang, Q.; Gu, S.; Jiang, J.; Yan, Y. Efficient Water Oxidation Using Nanostructured α-Nickel-Hydroxide as an Electrocatalyst. Journal of the American Chemical Society 2014, 136, 7077–7084. [Google Scholar] [CrossRef] [PubMed]
- Smith, R.D.L.; Prévot, M.S.; Fagan, R.D.; Trudel, S.; Berlinguette, C.P. Water Oxidation Catalysis: Electrocatalytic Response to Metal Stoichiometry in Amorphous Metal Oxide Films Containing Iron, Cobalt, and Nickel. J. Am. Chem. Soc. 2013, 135, 11580–11586. [Google Scholar] [CrossRef]
- Tian, J.; Jiang, F.; Yuan, D.; Zhang, L.; Chen, Q.; Hong, M. Electric-field assisted in situ hydrolysis of bulk metal–organic frameworks (MOFs) into ultrathin metal oxyhydroxide nanosheets for efficient oxygen evolution. Angew. Chem. Int. Ed. 2020, 59, 13101–13108. [Google Scholar] [CrossRef]
- Singh, B.; Prakash, O.; Maiti, P.; Menezes, P.W.; Indra, A. Electrochemical transformation of Prussian blue analogues into ultrathin layered double hydroxide nanosheets for water splitting. Chemical Communications 2020, 56, 15036–15039. [Google Scholar] [CrossRef]
- Kou, Z.; Li, X.; Zhang, L.; Zang, W.; Gao, X.; Wang, J. Dynamic surface chemistry of catalysts in oxygen evolution reaction. Small Science 2021, 1, 2100011. [Google Scholar] [CrossRef]
- Li, J.; Huang, W.; Wang, M.; Xi, S.; Meng, J.; Zhao, K.; Jin, J.; Xu, W.; Wang, Z.; Liu, X. Low-crystalline bimetallic metal–organic framework electrocatalysts with rich active sites for oxygen evolution. ACS Energy Lett. 2018, 4, 285–292. [Google Scholar] [CrossRef]
- Jahan, M.; Liu, Z.; Loh, K.P. A Graphene oxide and copper-centered metal organic framework composite as a tri-functional catalyst for HER, OER, and ORR. Adv. Funct. Mater. 2013, 23, 5363–5372. [Google Scholar] [CrossRef]
- Brandenburg, K. Diamond (Version 4.6), Crystal and Molecular Structure Visualization, Crystal Impact; K. Brandenburg & H. Putz Gbr: Bonn, Germany, 2009-2022. [Google Scholar]
- Zhang, C.; Liang, Y.; Wang, Y.; He, Y.; Majeed, A.; Yang, Z.; Yao, S.; Shen, X.; Li, T.; Qin, S. Polyamidoamine dendrimer modified Ketjen Black mixed sulfur coated cathode for enhancing polysulfides adsorbability in Li-S batteries. Ionics 2021, 27, 2997–3005. [Google Scholar] [CrossRef]
- Xing, S.; Liang, J.; Brandt, P.; Schäfer, F.; Nuhnen, A.; Heinen, T.; Boldog, I.; Möllmer, J.; Lange, M.; Weingart, O. Capture and separation of SO2 traces in metal–organic frameworks via pre-synthetic pore environment tailoring by methyl groups. Angew. Chem. Int. Ed. 2021, 60, 17998–18005. [Google Scholar] [CrossRef] [PubMed]
- Wu, Y.; Song, X.; Xu, S.; Chen, Y.; Oderinde, O.; Gao, L.; Wei, R.; Xiao, G. Chemical fixation of CO2 into cyclic carbonates catalyzed by bimetal mixed MOFs: the role of the interaction between Co and Zn. Dalton Trans. 2020, 49, 312–321. [Google Scholar] [CrossRef] [PubMed]
- Grosvenor, A.P.; Kobe, B.A.; Biesinger, M.C.; McIntyre, N.S. Investigation of multiplet splitting of Fe 2p XPS spectra and bonding in iron compounds. Surf. Interface Anal. 2004, 36, 1564–1574. [Google Scholar] [CrossRef]
- Paolella, A.; Bertoni, G.; Hovington, P.; Feng, Z.; Flacau, R.; Prato, M.; Colombo, M.; Marras, S.; Manna, L.; Turner, S. Cation exchange mediated elimination of the Fe-antisites in the hydrothermal synthesis of LiFePO4. Nano Energy 2015, 16, 256–267. [Google Scholar] [CrossRef]
- Pang, W.; Shao, B.; Tan, X.-Q.; Tang, C.; Zhang, Z.; Huang, J. Exfoliation of metal–organic frameworks into efficient single-layer metal–organic nanosheet electrocatalysts by the synergistic action of host–guest interactions and sonication. Nanoscale 2020, 12, 3623–3629. [Google Scholar] [CrossRef]
- Zhao, X.; Ding, X.; Xia, Y.; Jiao, X.; Chen, D. Coupling-Effect-Induced Acceleration of Electron Transfer for α-Ni(OH)2 with Enhanced Oxygen Evolution Reaction Activity. ACS Appl. Nano Mater. 2018, 1, 1476–1483. [Google Scholar] [CrossRef]
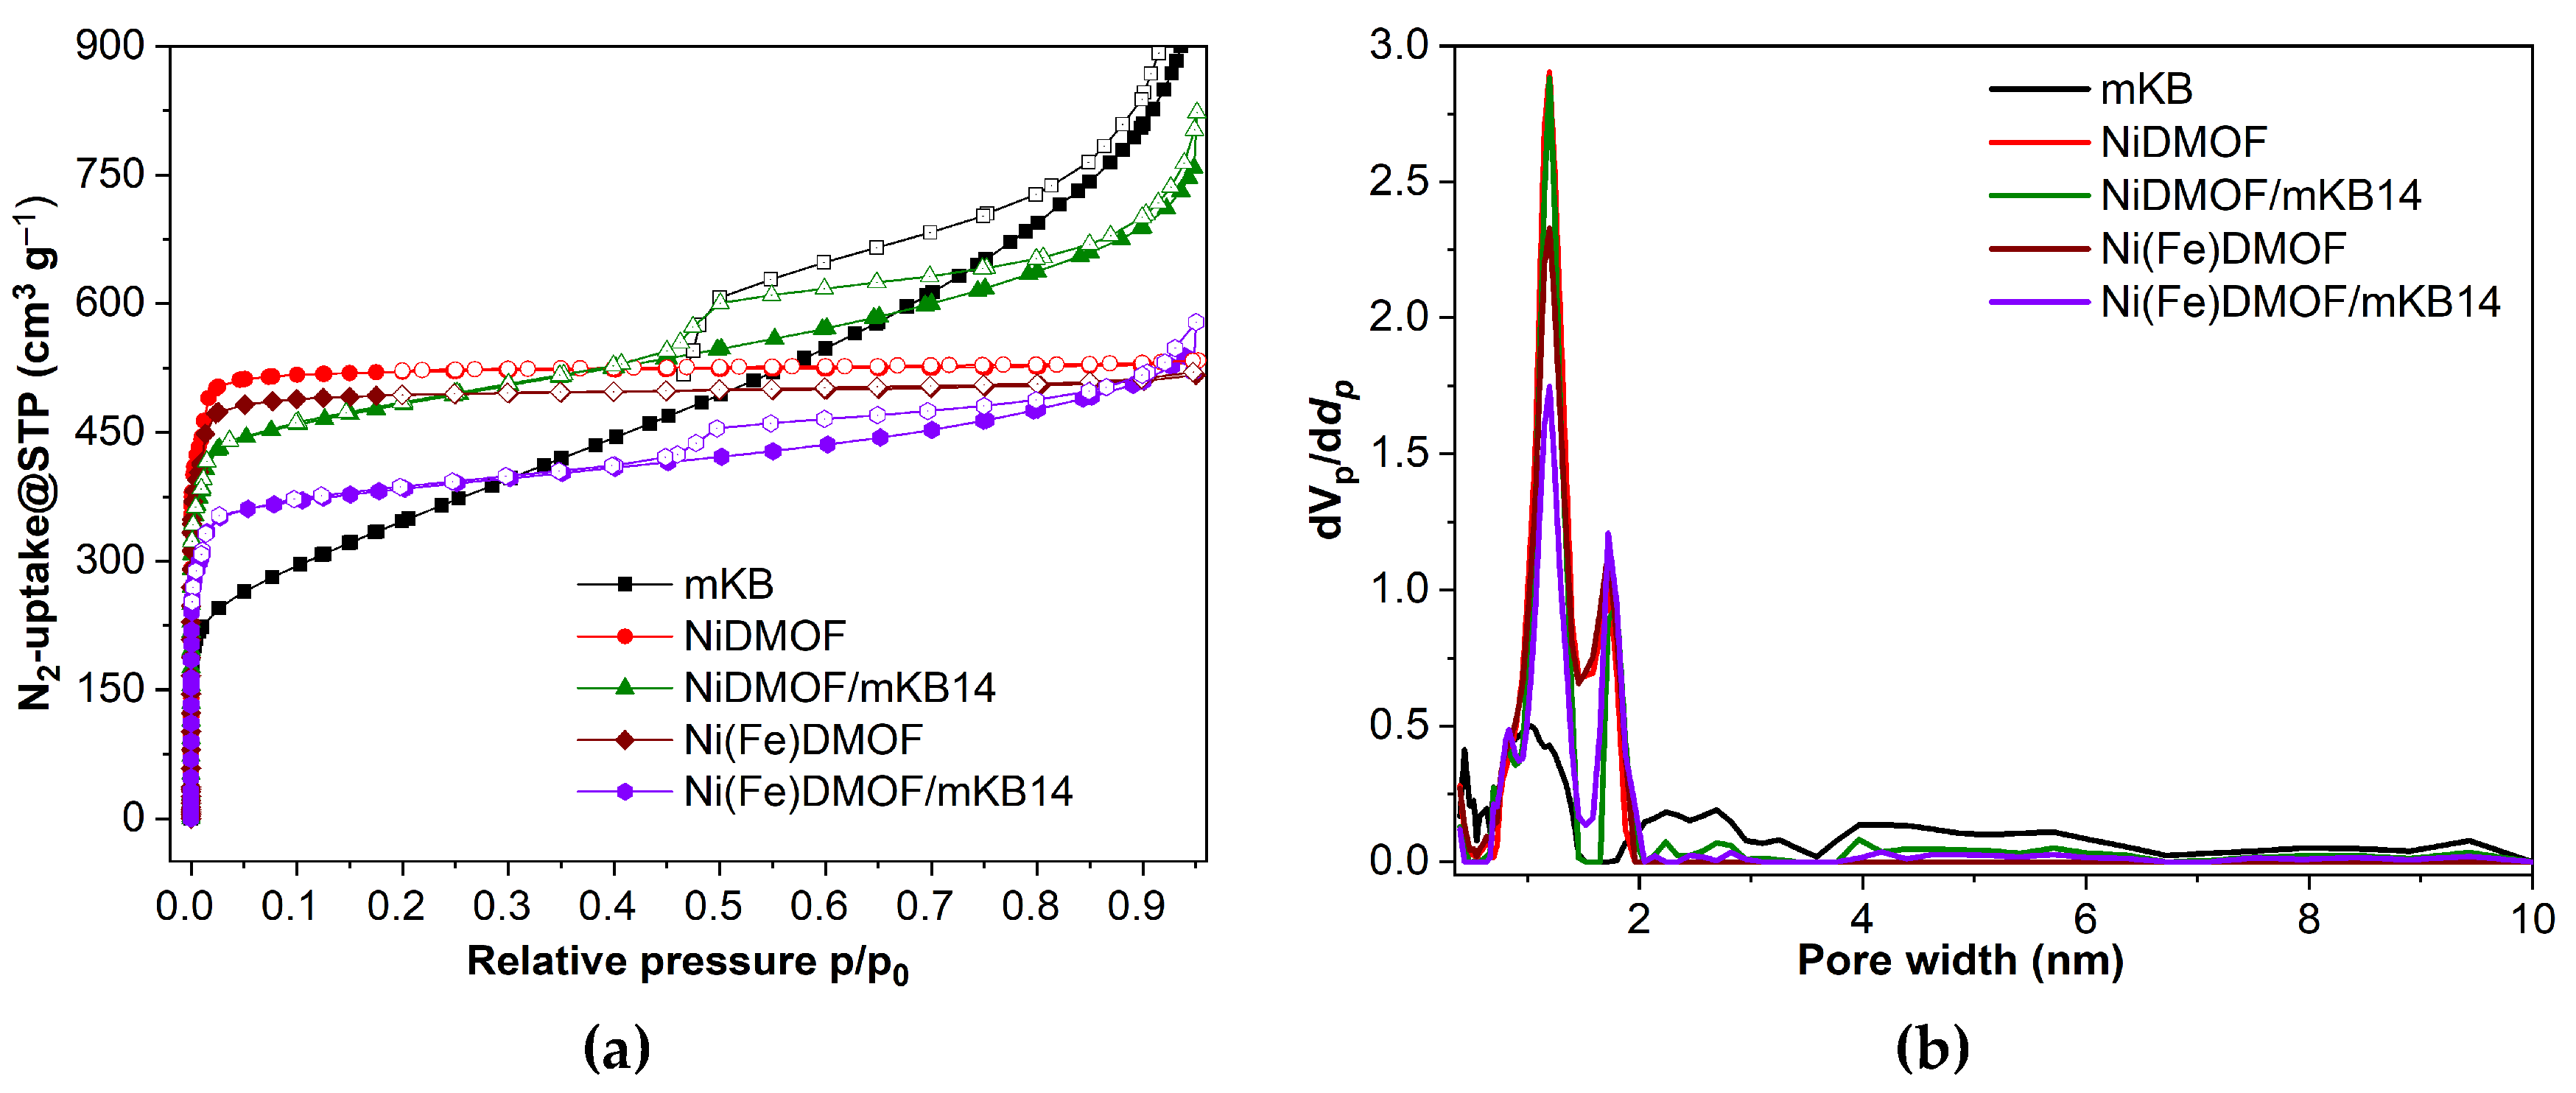
| Material | BET surface area a (estimated) c (m2 g−1) |
Total pore volume b (estimated) c (cm3 g−1) |
|---|---|---|
| NiDMOF-Literature[57] | 2050 | 0.80 |
| NiDMOF | 2104 | 0.82 |
| NiDMOF/mKB7 | 1897(2043) | 0.86(0.87) |
| NiDMOF/mKB14 | 1773(1982) | 1.18(0.92) |
| NiDMOF/mKB22 | 1106(1913) | 0.70(0.97) |
| NiDMOF/mKB34 | 1087(1808) | 0.85(1.05) |
| Ni(Fe)DMOF | 1942 | 0.80 |
| Ni(Fe)DMOF/mKB14 | 1486(1843) | 0.86(0.90) |
| KB | 1300 | 1.76 |
| mKB | 1234 | 1.50 |
Disclaimer/Publisher’s Note: The statements, opinions and data contained in all publications are solely those of the individual author(s) and contributor(s) and not of MDPI and/or the editor(s). MDPI and/or the editor(s) disclaim responsibility for any injury to people or property resulting from any ideas, methods, instructions or products referred to in the content. |
© 2023 by the authors. Licensee MDPI, Basel, Switzerland. This article is an open access article distributed under the terms and conditions of the Creative Commons Attribution (CC BY) license (https://creativecommons.org/licenses/by/4.0/).


