1. Introduction
Voltage Source Converter (VSC) is a dominant conversion equipment for the grid connection of renewable power resources. In the power system with high penetration of renewable resources, the performance of VSC interfaced generation plays a key role in system stability. The results of current research shows the overall performance of VSC interfaced generation is dominated by the control system. The improper settings of control parameters could cause unstable interaction between power elctronic devices system, including low-frequency oscillations [
1], sub-synchronous oscillations, super-synchronous oscillations [
2,
3,
4], and even wideband oscillations with high frequency [
5,
6,
7]. Therefore, studying proper control parameter settings of VSC interfaced equipment is crucial for ensuring system stability and analyzing the wideband frequency spectrum characteristics of the power system.
At present, Modal analysis and impedance analysis are the well known and widely used method for the study of VSC stability[
8]. The modal analysis based on linearized state-space modeling is an effective method that provides valuable information about the dynamics of the system,
i.e. the frequency and damping factor of the dominant oscillatory modes. Reference [
9] uses the modal analysis method for analyzing the sub-synchronous oscillation problem caused by the rosonance between the wind farm and the series compensation capacitors. .However, this method highly depends on the complete and accurate modeling of the system. Hence, for complex systems with high penetration of converter interfaced generations (CIGs), the problem of dimension disaster makes big diffulty for solving the linear characteristic equation [
10].
The impedance method provides a clear physical observation of the electric system and is widely used in engineering. Two impedance models have been developed,
e.g., sequence impedance model and dq-axis impedance model. References [
11,
12] apply the classical Nyquist criterion on the system’s sequence impedance model for system stability analysis. However, the sequence impedance method is built on the three-phase symmetrical system [
13], and a small disturbance from PLL could impact the accuracy of the sequence impedance method [
14].
The dq-axis impedance method using Parker transformation converts the three-phase rotating component of the system into a component that is stationary relative to the dq axis [
15]. This method deliver more clear vision of the coupling between the components in the system [
16].
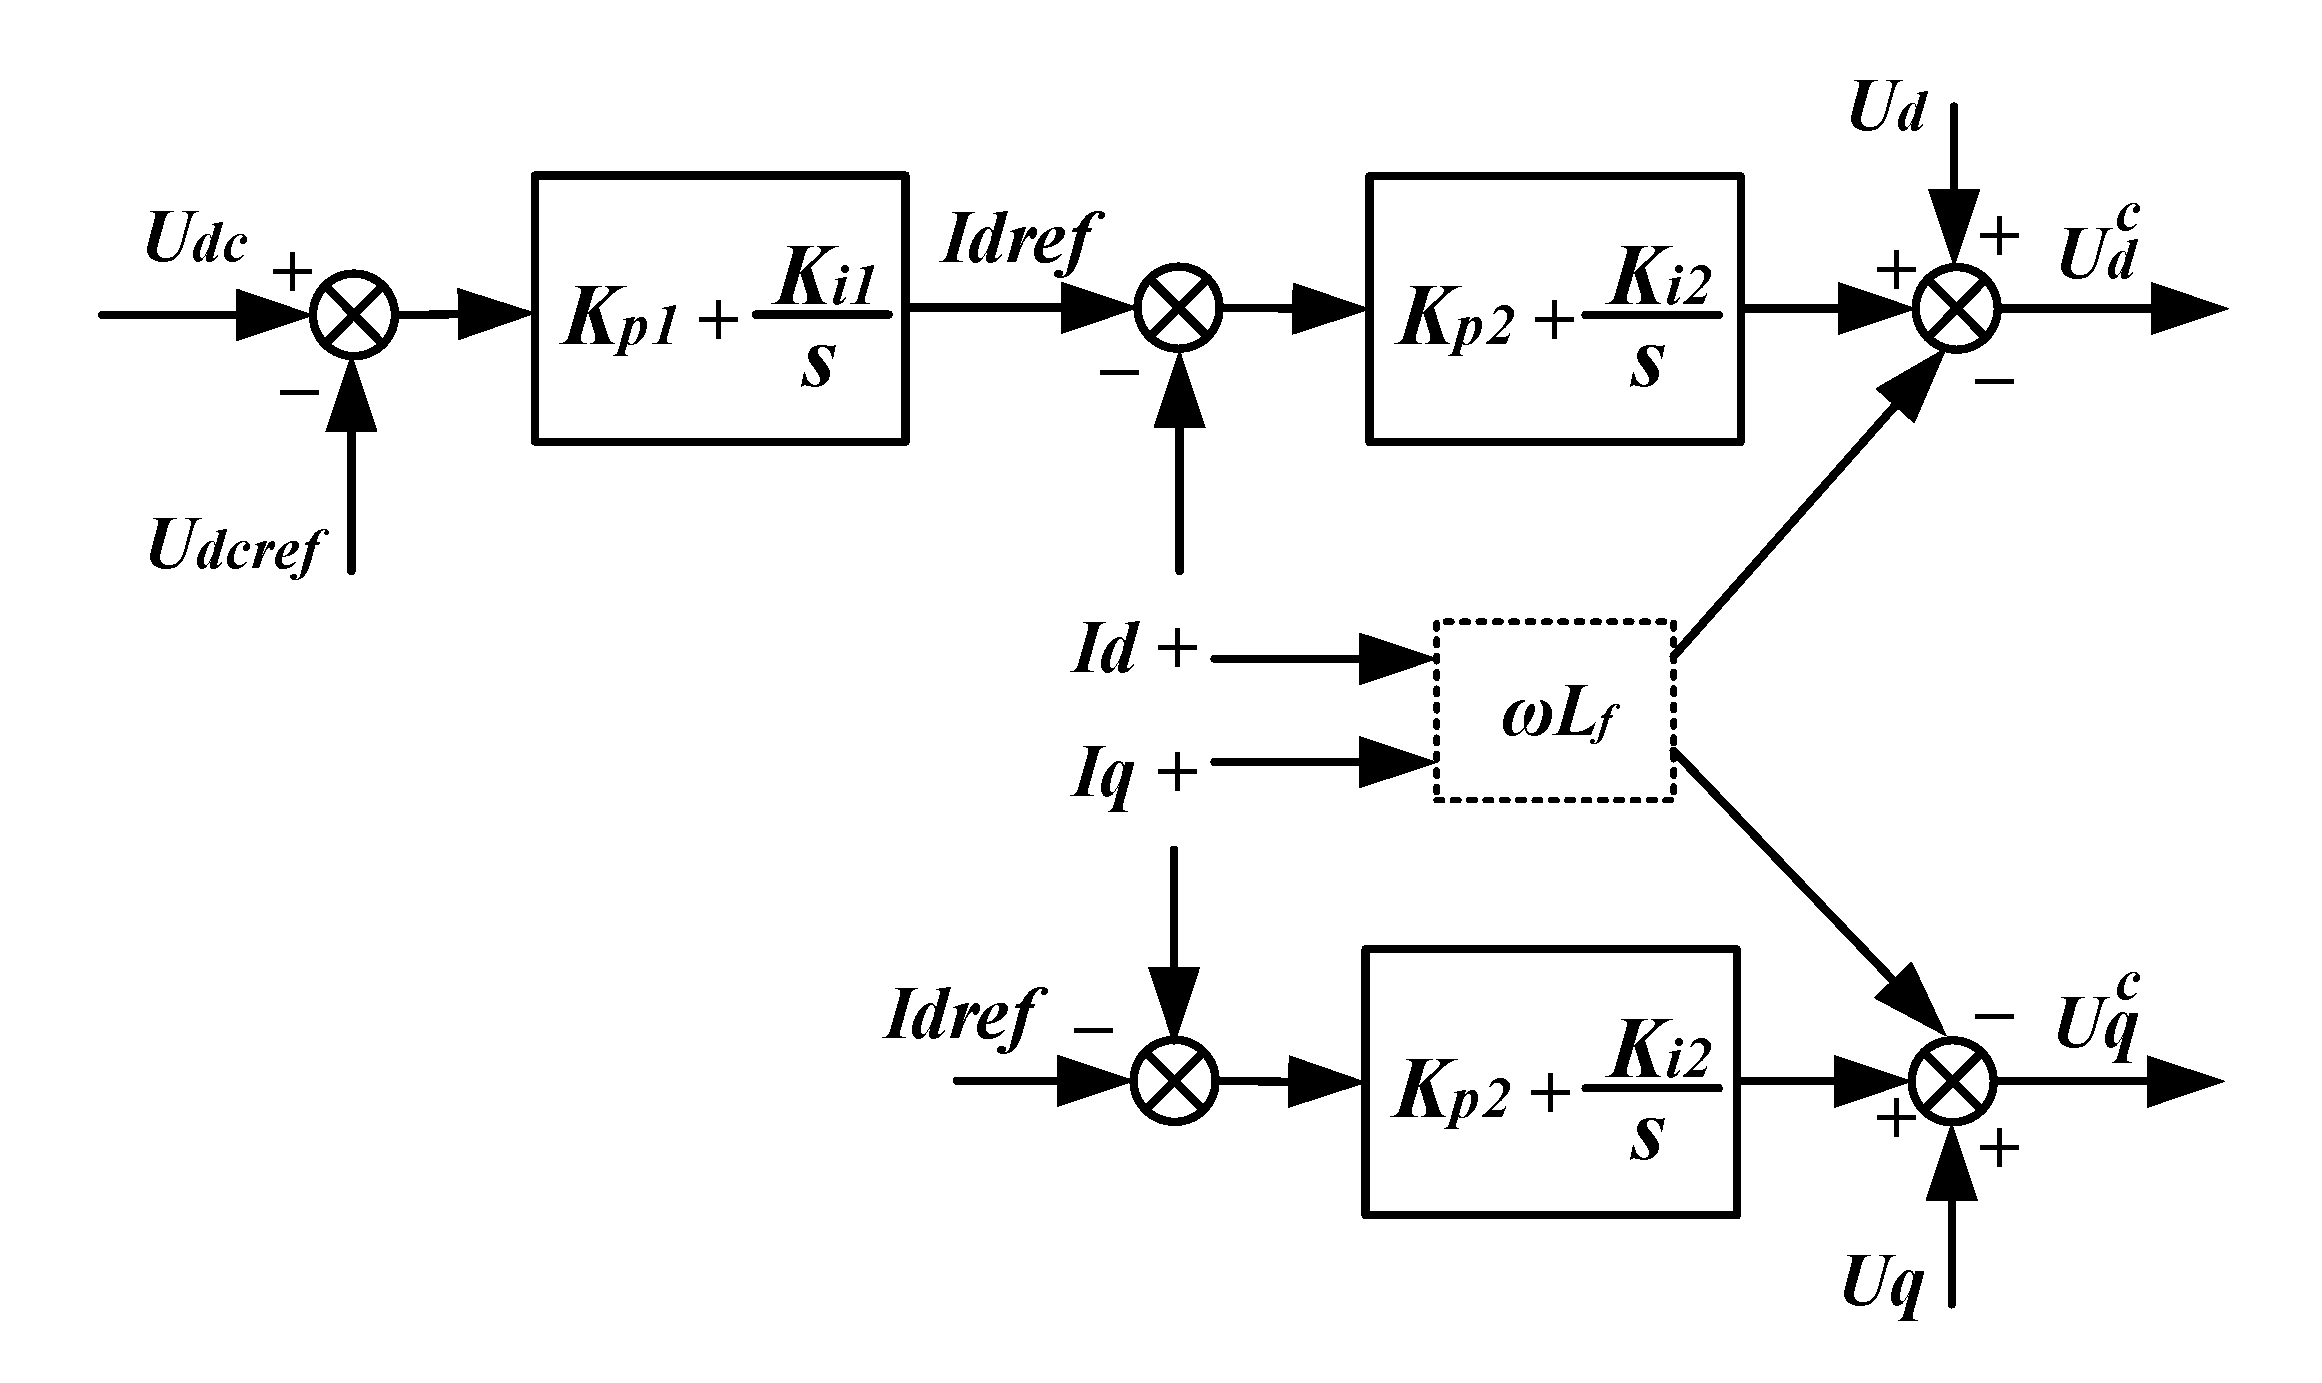
Figure 1 presents a block diagram of a typical VSC control system, and there are coupling terms between dq-axis system. The coupling terms bring significant challenges for the mathematical resolution, and lots of research efforts has been made to solve the problems. Reference [
17] transforms a typical VSC test system to a composite equivalent current loop to offset the coupling terms. Reference [
18] applies the Nyquist criterion to d-axis and q-axis impedances separately, and proposes that the system is stable when the corresponding criteria are satisfied; however, the conclusion is supported in Reference [
19].
This paper presents a new methodology for simplifying the impedance model by shifting the observation of the output of the VSC control system, so that then coupling terms doesn’t exist in the mathematical derivations for impedance modeling. Using the new simplified model, the stability and the spectrum characteristic of the performance of the VSC can be clearly analyzed. The paper is structured as follows: Section II and III presents the derivation of the proposed second-order dq impedance model and stability criterion of VSC, Section VI presents the impact of the control parameters on the wideband oscillatory stability of VSC using modal analysis, and Section V concludes the paper.
2. Linearized impedance model of VSC grid-connected inverter system.
2.1. Impedance modelling of VSC
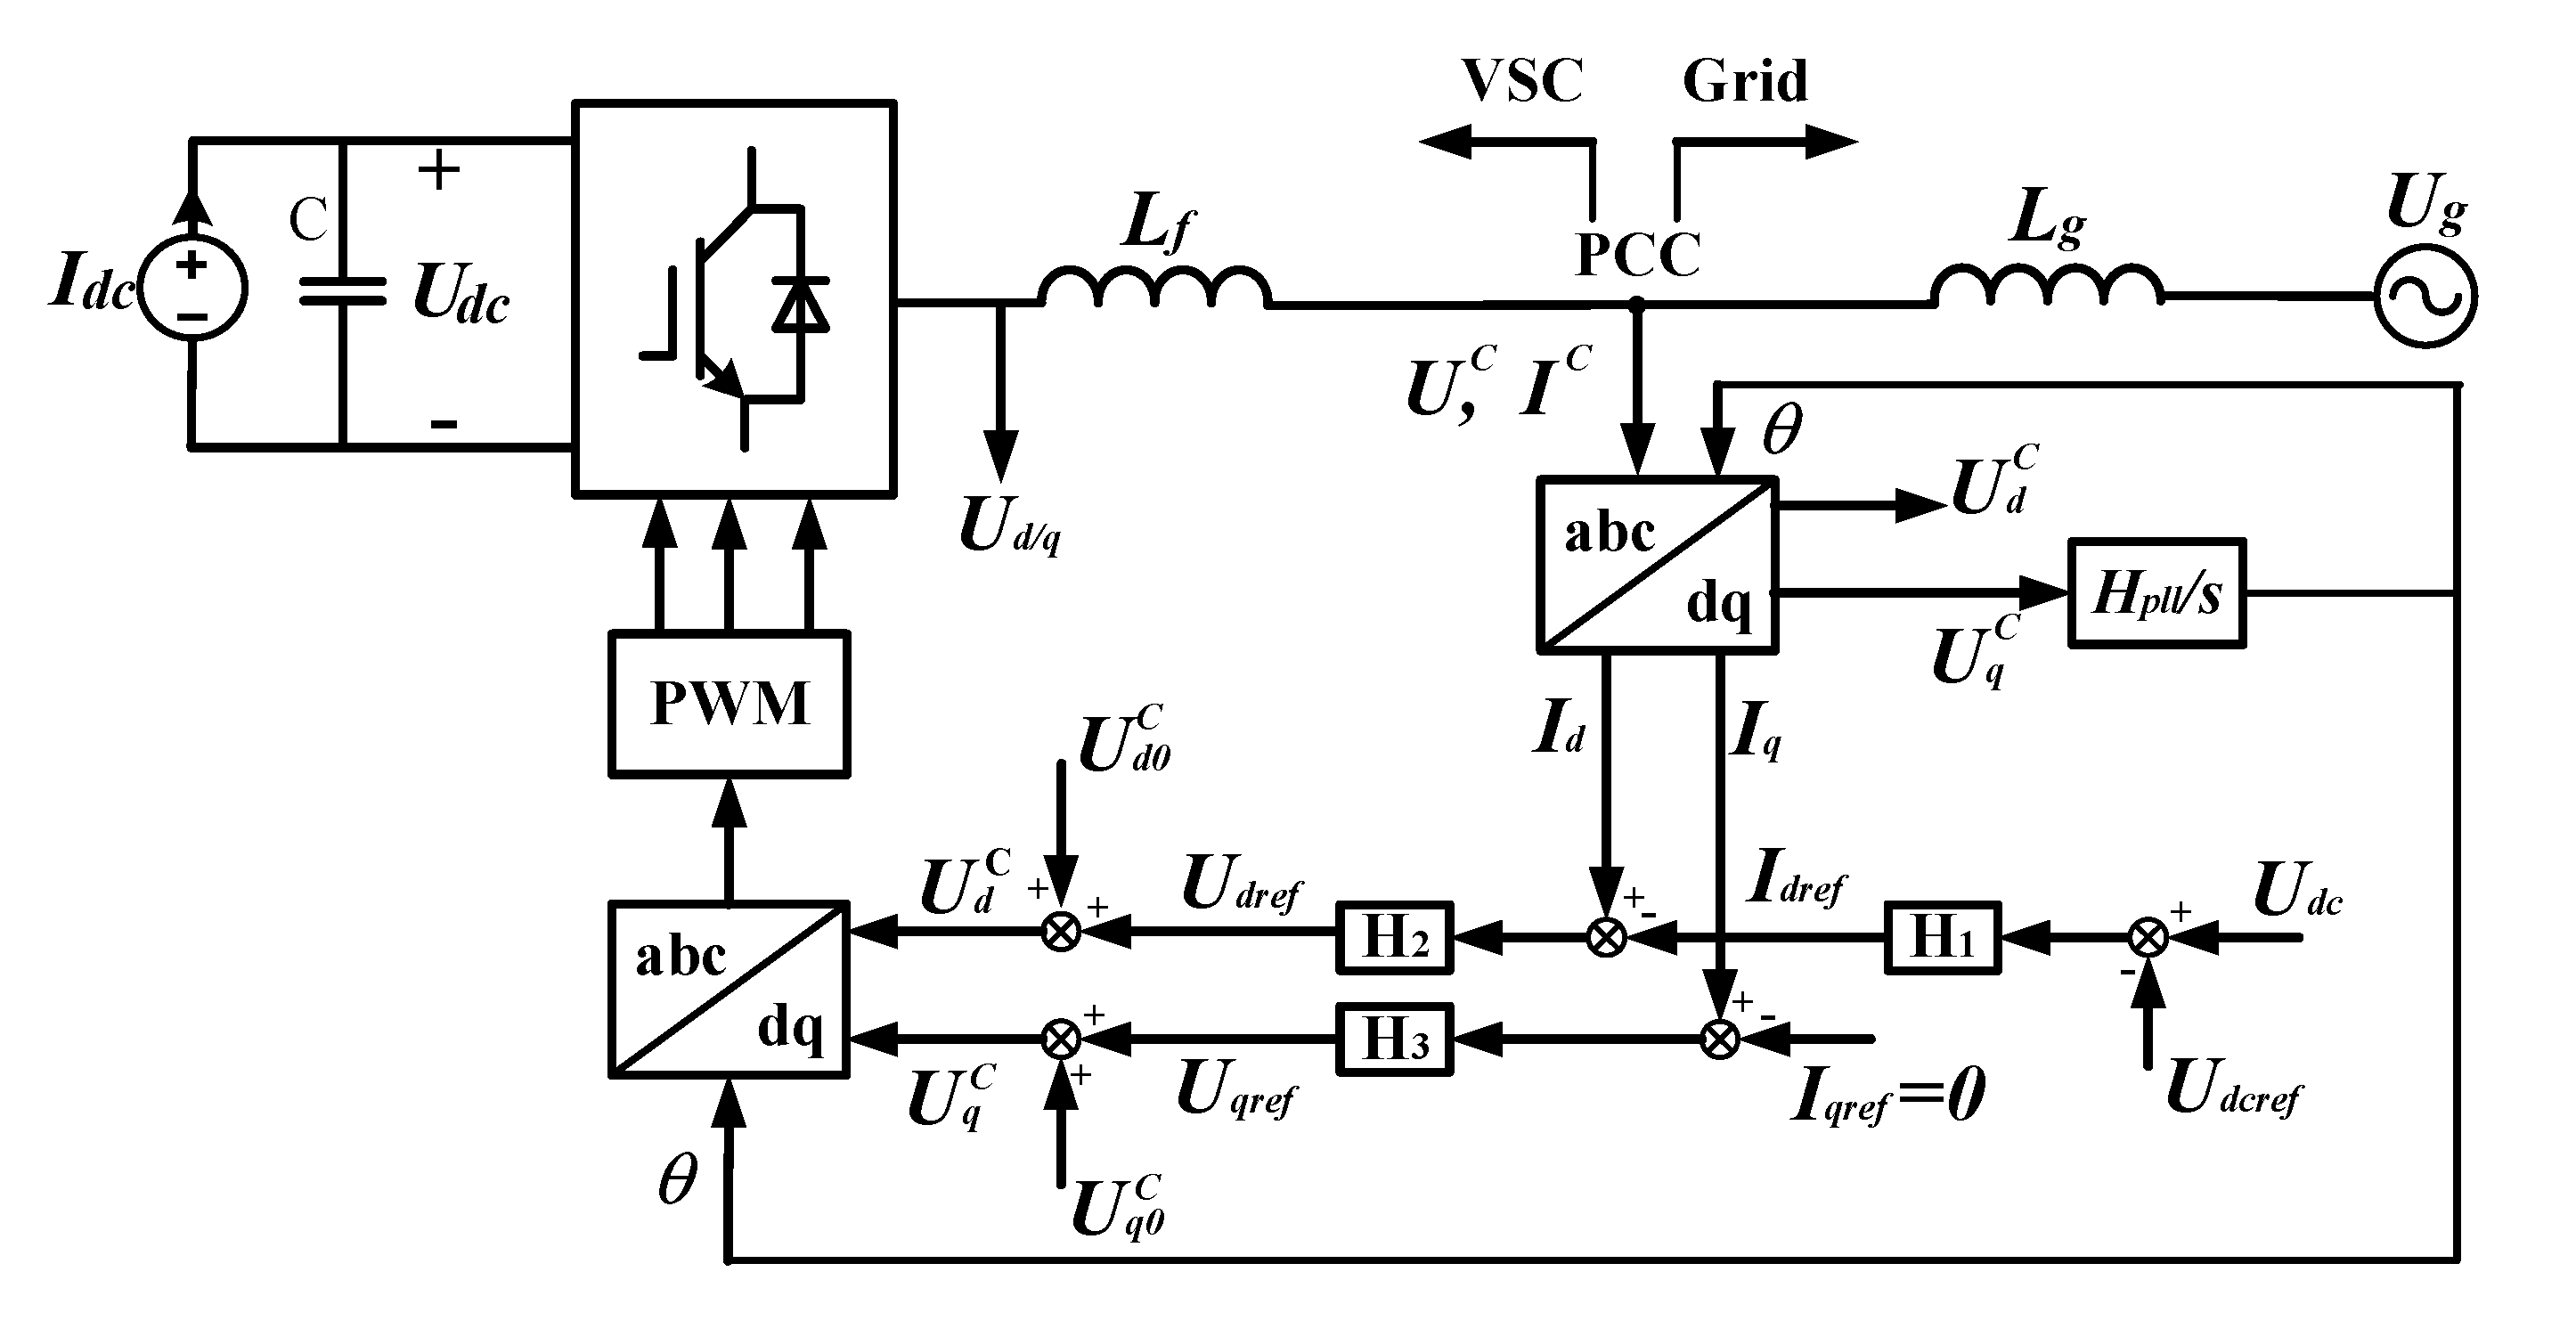
Figure 2 presents the structure of the test system for the grid-connected VSC, which consists of the main circuit and control schemes. The VSC control consists of the d-axis control and the q-axis control, the d-axis control ensures the DC voltage of the capacitor remaining at a constant value, and the q-axis control regulates the q-axis current feeding into the power grid at expected value. As seen in
Figure 2,
Udc represents the DC voltage on the VSC side, and
Idc represents the DC current on the DC side.
and
represent the voltage at the terminal of the VSC. The
and
are the initial values at PCC in steady state.
Lf represents the filtering inductance, and
Lg represents the equivalent impedance of the external grid.
and
represent the voltage at the PCC and the voltage on the grid side respectively. The
θ is the phase angle of the voltage at PCC that provide by the PLL.
Based on the VSC control equations at each stage in the VSC grid-connected structure shown in
Figure 2, the second-order impedance model of the VSC can be obtained by taking the output voltage and input current of the VSC in the dq-axis rotating coordinate system as the output and input variables, respectively.
The dynamics of the DC capacitor of VSC can be described by the following equation:
where,
Pm is the power injected into the DC capacitor, and
Pe is the active power output of the VSC. At steady state, the small-signal expression for the equation (1) is obtained as follows:
where
,
,
Id, and
Iq are the electric components at PCC in the rotating coordinate system. When a small disturbance occurs, by letting
Hence, the new equation is obtained:
,, Id0 and Iq0 are the initial values.
Here,
Iq0 and Iqref is set to zero, hence:
Taking the Laplace transform of equation (2) and combining it with equation (6), equation (7) is obtained:
As shown in
Figure 2, the dynamics of
Iqref is described by:
Since
and
are constants, hence:
where,
Combining equations (7), (8) and (9), the following equations are obtained:
where
Z(s) is a 2D impedance matrix, as follows:
2.2. The influence of PLL on VSC impedance modelling
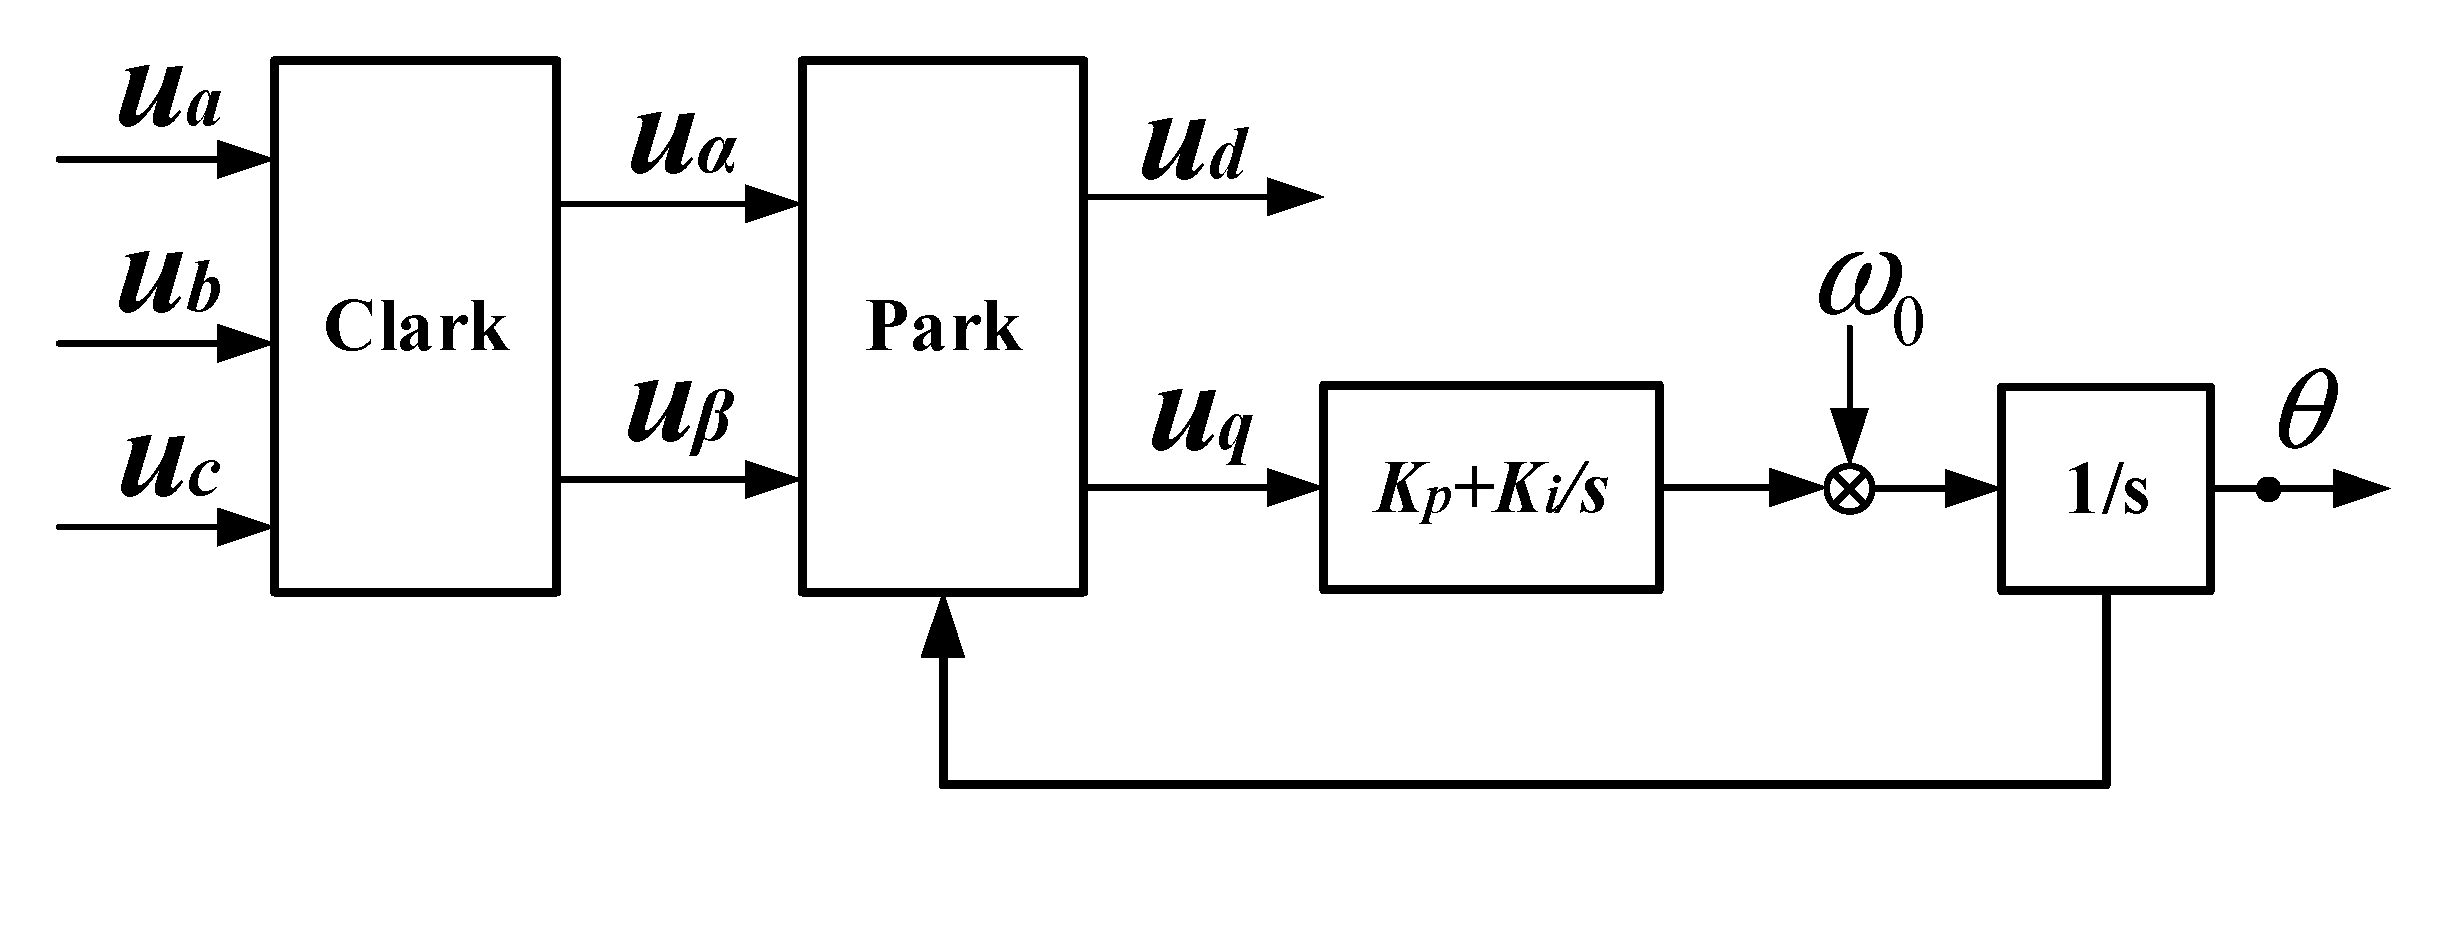
Figure 3 presents the control block diagram of a typical PLL. When the PLL is integrated into the control loop of the VSC, the impedance matrix shown in (11) is restructured.
Assuming a symmetric three-phase sinusoidal voltage with an amplitude of
, the time-domain expression is given as follows when the grid operates at a steady-state frequency of
f0:
Performing Clark transformation on the equation (12):
Then, the Clark transformation matrix is:
According to Euler formula, in the time-domain, the voltage can be expressed in exponential form in a two-phase stationary coordinate system:
Taking Park transformation of (15), expression (16) is obtained, and
udq is the term defined in rotating d-q reference frame system:
Here, the Park transformation matrix is:
According to Euler formula, the exponential form of
Tdq is obtained on the complex plane:
f and
θ (
θ=2)
represent PLL output frequency and angle. Then, substituting equation (18) into equation (16), we have:
Now, a small perturbation with frequency
fp (
wp=
2πfp) is applied to the equation (12) and setting
=0, expression (20) is obtained:
Correspondingly, (21) and (22) represent the form of (20) in the stationary coordinate system and the rotating coordinate system respectively:
The perturbation error frequency
and phase angle
of the system are represented by:
Then using Euler formula and equivalent infinitesimal, we can obtain:
Substituting equations (25), (24), and (23) into equation (22) and neglecting the high-order infinitesimal in
, equation (26) is obtained:
As seen from equation (26), when the system is subjected to a small disturbance, the system will produce two disturbance components caused by the phase-locked loop. The first component is defined as
, and the second component is defined as
.
is the mapped disturbance voltage on the q-axis caused by the phase angle disturbance.
is the complex space voltage component caused by the frequency disturbance. which can be further decomposed into d-axis and q-axis components:
where
and
are the voltage disturbance components in the rotating coordinate system at the presence of the phase-locked loop.
By combining equations (30) and (31), equations (33) and (34) are obtained:
Similar to the voltage expressions, the linearized model of the perturbation current considering the dynamics of PLL is obtained:
Then combining equations (10), (11), (30), and (35), the impedance model of VSC considering the dynamics of PLL is obtained:
Transforming equations (36) and (37) yields the admittance model, where
and
are inverse matrices of each other.
2.3. The impedance model of the external power grid.
By taking the PCC point in
Figure 2 as the input, we can obtain the voltage equation on the grid side:
By letting the voltage source
to zero and combine it with equation (40), the impedance model of the external power grid,
is:
2.4. Symmetry analysis of wideband oscillatory spectra.
Taking
in equation (21) as an example, we can analyze the characteristics of the wideband oscillation spectrum. By ignoring the fundamental frequency component
in
and setting
and
, we can obtain:
According to Euler formula, the time-domain voltage
can be expressed in trigonometric form in the two-phase rotating coordinate system:
The output variable of the perturbation current in the stationary coordinate system is:
Using the prosthaphaeresis on equation (48):
As seen in equation (49), when a small perturbation with frequency fp (wp=2πfp) exists, a corresponding component with frequency of emerges during the coordinate transformation. Similarly, if the frequency of perturbation is , the output of the system contain two components with frequencies and . Therefore, the oscillatory components not only emerge in pairs, but also symmetry with the fundamental frequency as the centre. The magnitude of each component depends on the magnitude of the positive-sequence admittance and negative-sequence admittance. When the frequency of perturbation is negative, the output amplitude of the negative-sequence oscillatory component will coincide with some positive-sequence oscillatory components (oscillatory frequency is more than 0). Therefore, it is difficult to identify the pairs of oscillatory components in the frequency spectrum of the wideband oscillatory signals.
Stability criterion and frequency spectrum symmetry verification for VSC.
3.1. Stability criterion for grid-connected VSC
Using circuit theory on the system presented in
Figure 2, a second-order nodal voltage equation in the
dq rotating coordinate system is derived at the PCC point:
In the above equation,
E represents the second-order identity matrix.
L represents the sum of
and
E. When the determinant of matrix
L approaches zero, the system impedance exhibits the "negative resistance" effect, which can cause the voltage at PCC to oscillate continuously and lead to oscillations with wideband frequency. The characteristic equation for the grid-connected VSC is:
Due to the non-commutative property of matrix multiplication,
could take on two forms:
or
. Substituting either of the form into the characteristic equation for the system, a simplified equiation is obtained:
Equation (52) is consistent with the conclusions of references [29–31]. Reference [29] uses a reversible transformation matrix T to simplify and analyze equation (52) and obtains the sequence impedance stability criterion:
In equation (53), is a second-order diagonal matrix, and the diagonal elements represent the positive and negative sequence impedances of the power grid, respectively.
When analyzing the impedance stability of grid connected VSC, different impedance modeling correspond to different stability criteria. Although the emphasis of each criterion is different, their physical meaning is ultimately the same. For the basic control theory, the main purpose of stability criteria is to simplify complex systems and analyze the stability from different perspectives. As long as the mathematical derivation is rigorous, the conclusion of the system’s stability is consistant.
The roots of the characteristic equation (51) or (52) correspond to the closed-loop poles of the system, and the characteristic roots can be expressed by equation (55):
Here, the real part of the characteristic roots represents the oscillatory damping, and the imaginary part represents the oscillatory frequency.
3.2. Verification of the system impedance criterion and the symmetry of the wideband oscillation frequency spectrum.
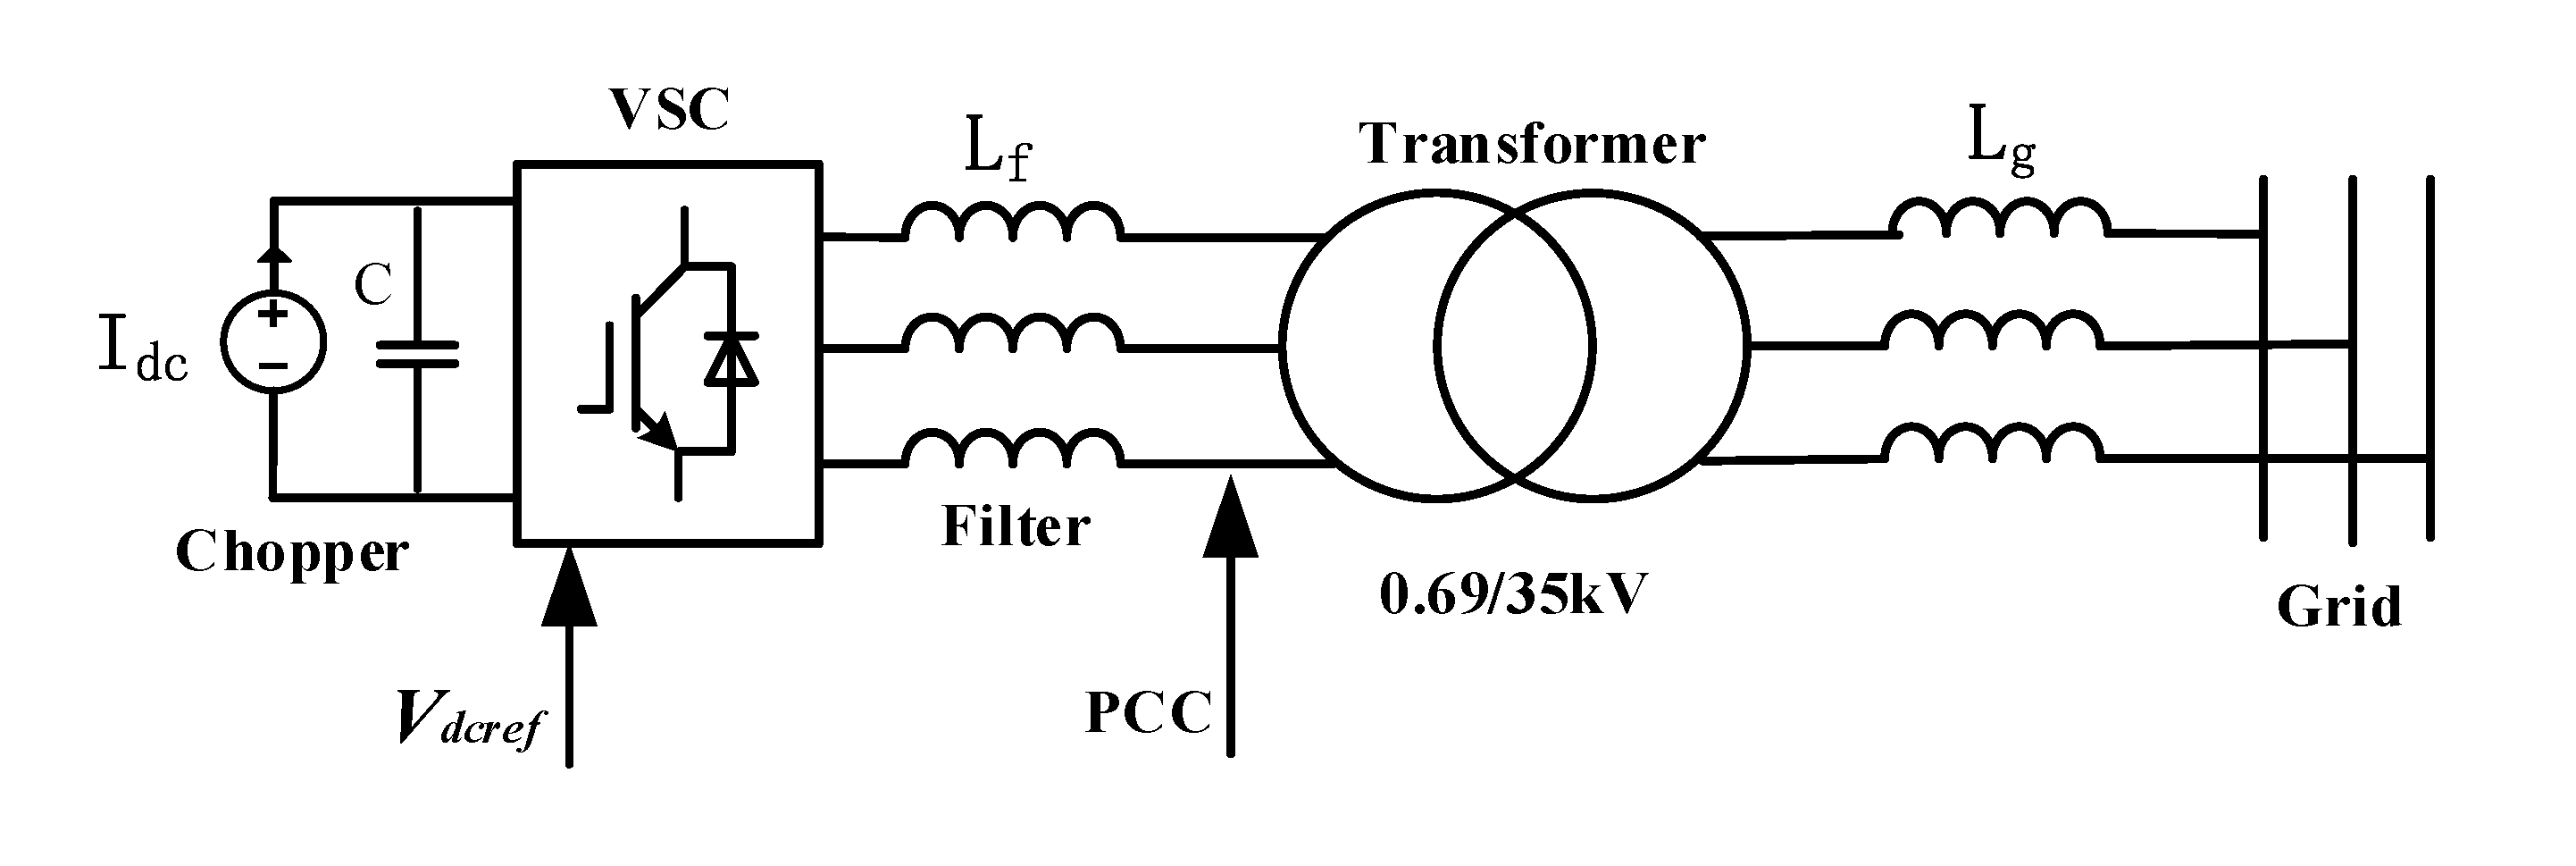
To verify the effectiveness of the characteristic equation (51) or (52), a typical grid connected VSC test system is constructed using ‘DIgSILENT Powfactory’, as shown in
Figure 4. The system consists of an ideal DC current source
, a DC side capacitor C, a grid side VSC, a filter inductance
Lf, a transformer, an equivalent impedance of the external grid
, and the external grid (an ideal voltage source
). The control structure of the VSC is given in
Figure 2, and the detailed parameters of the test system are given in
Table 1.
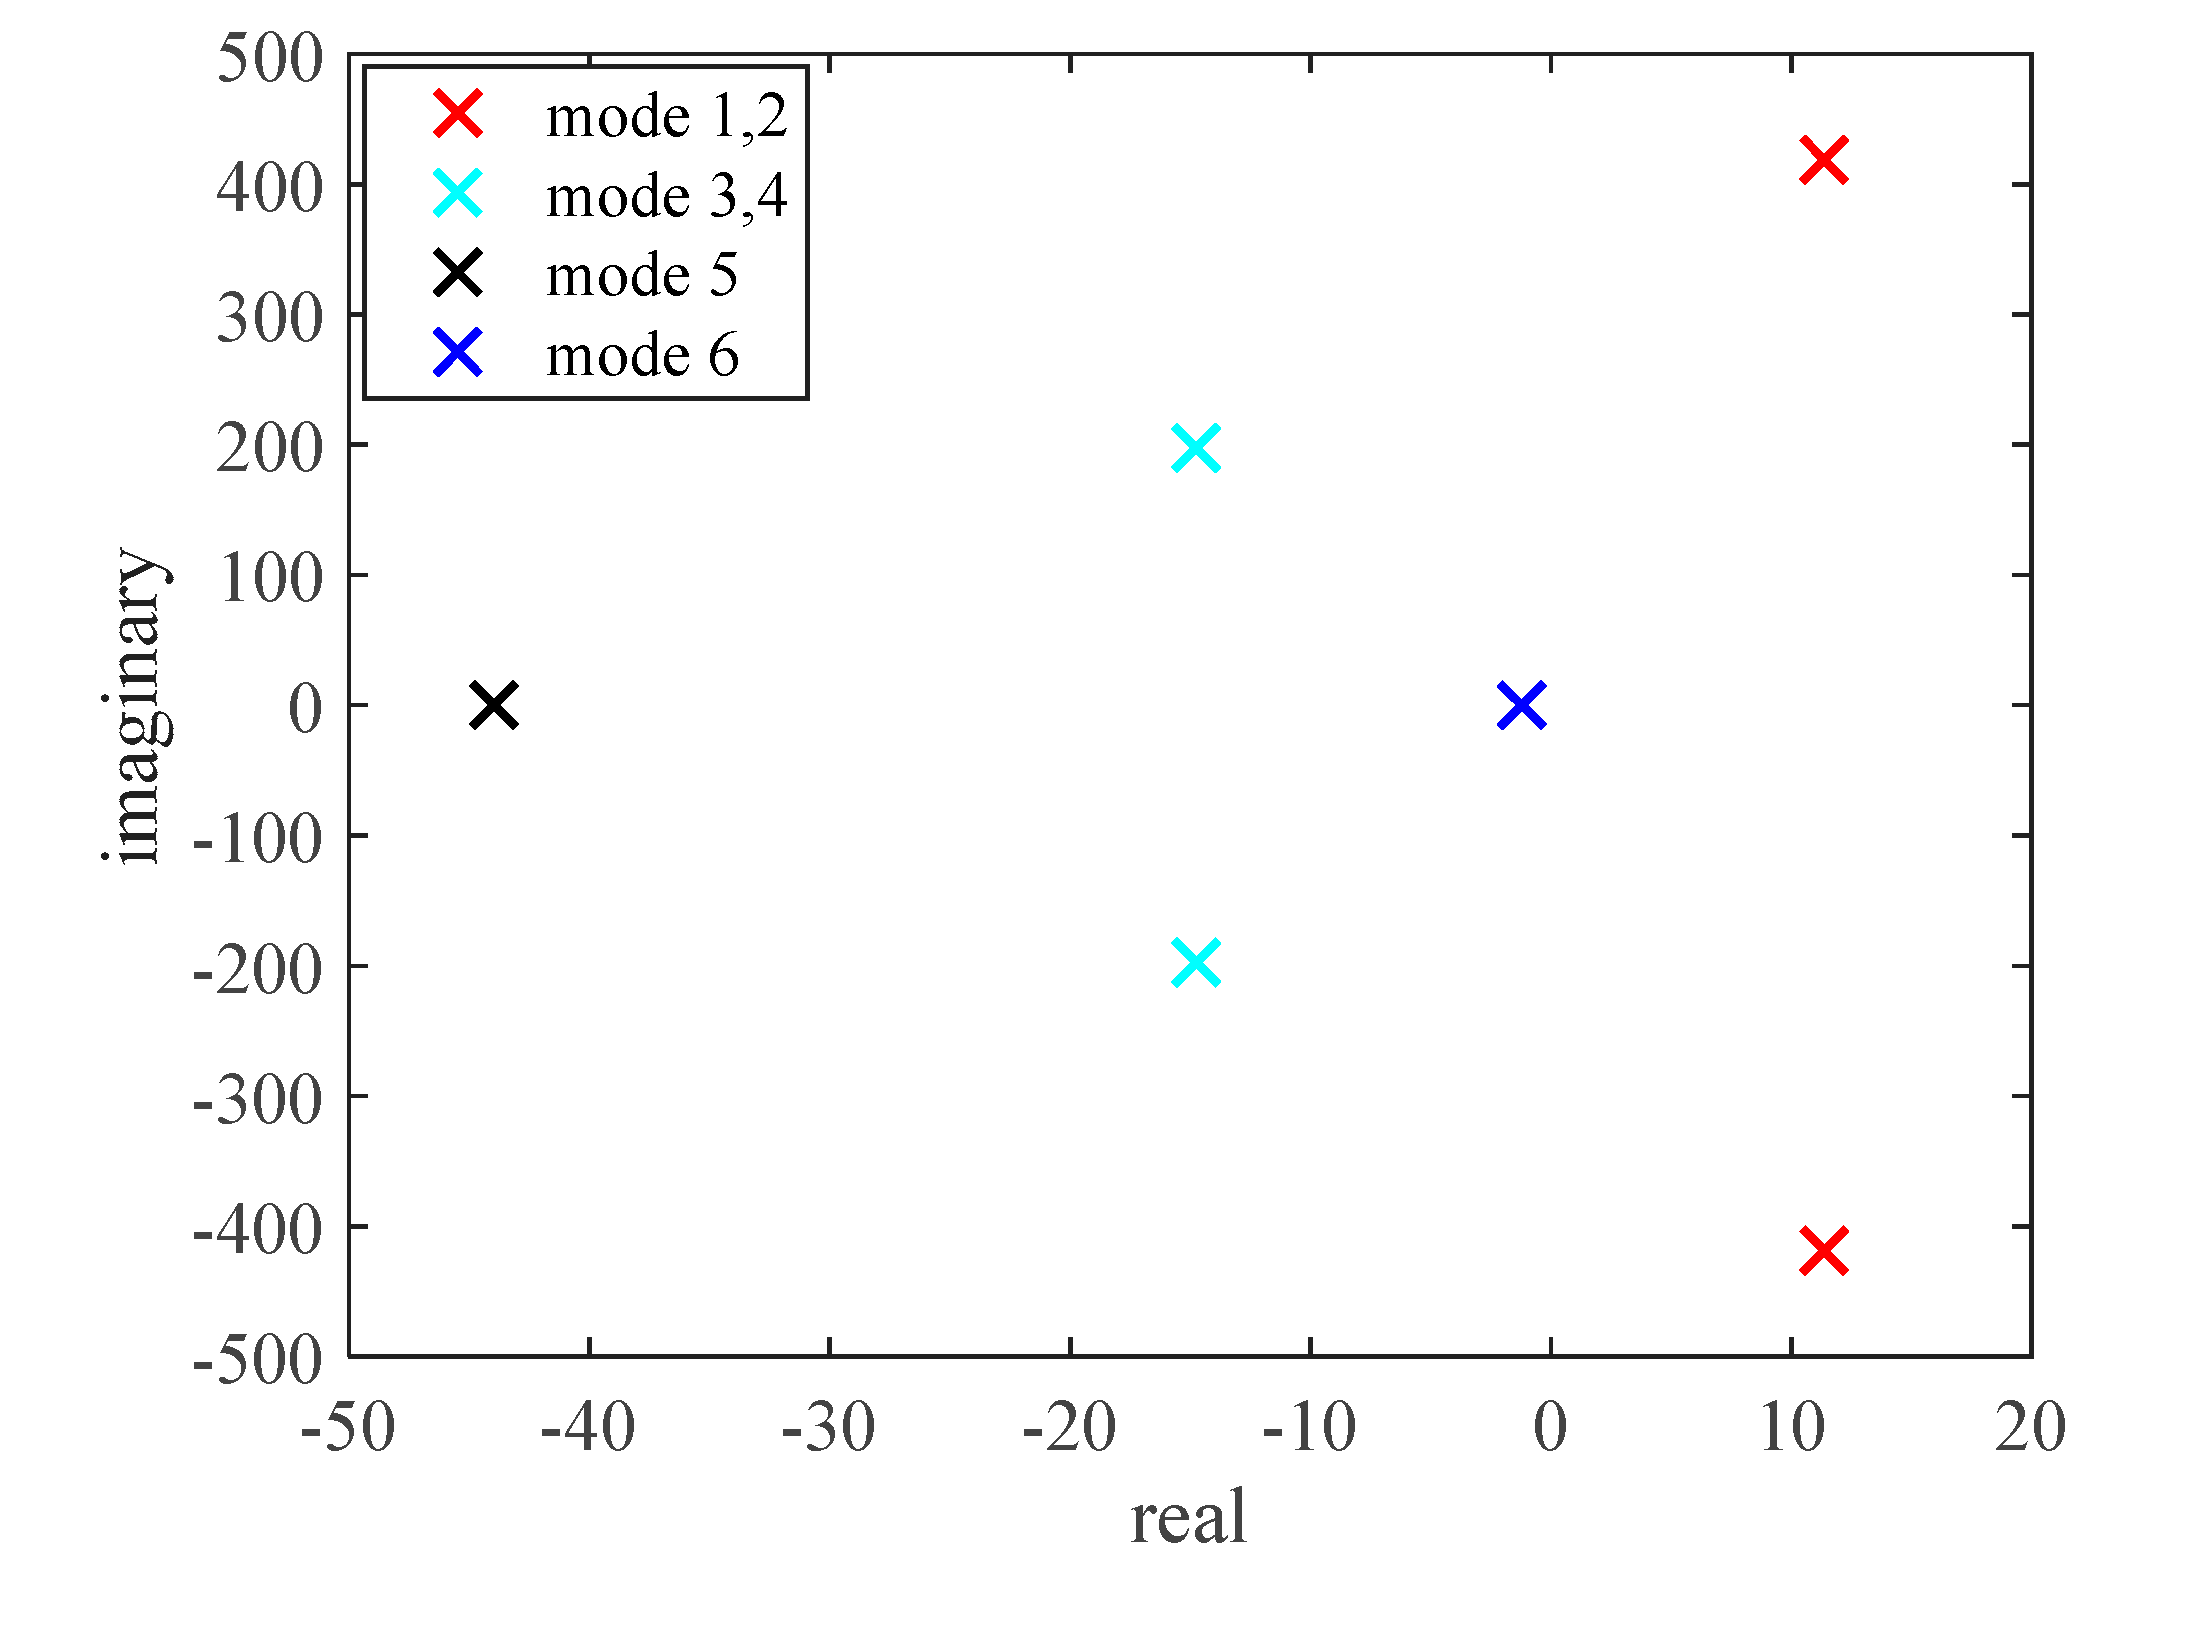
At a steady state, A classic modal analysis was performed to find the system’s oscillatory modes, 6 eigenvalues were found in the system, as shown in
Table 2. The layouts of the eigenvalues that are associated with the oscillatory modes are presented in a complex panel (see
Figure 5).
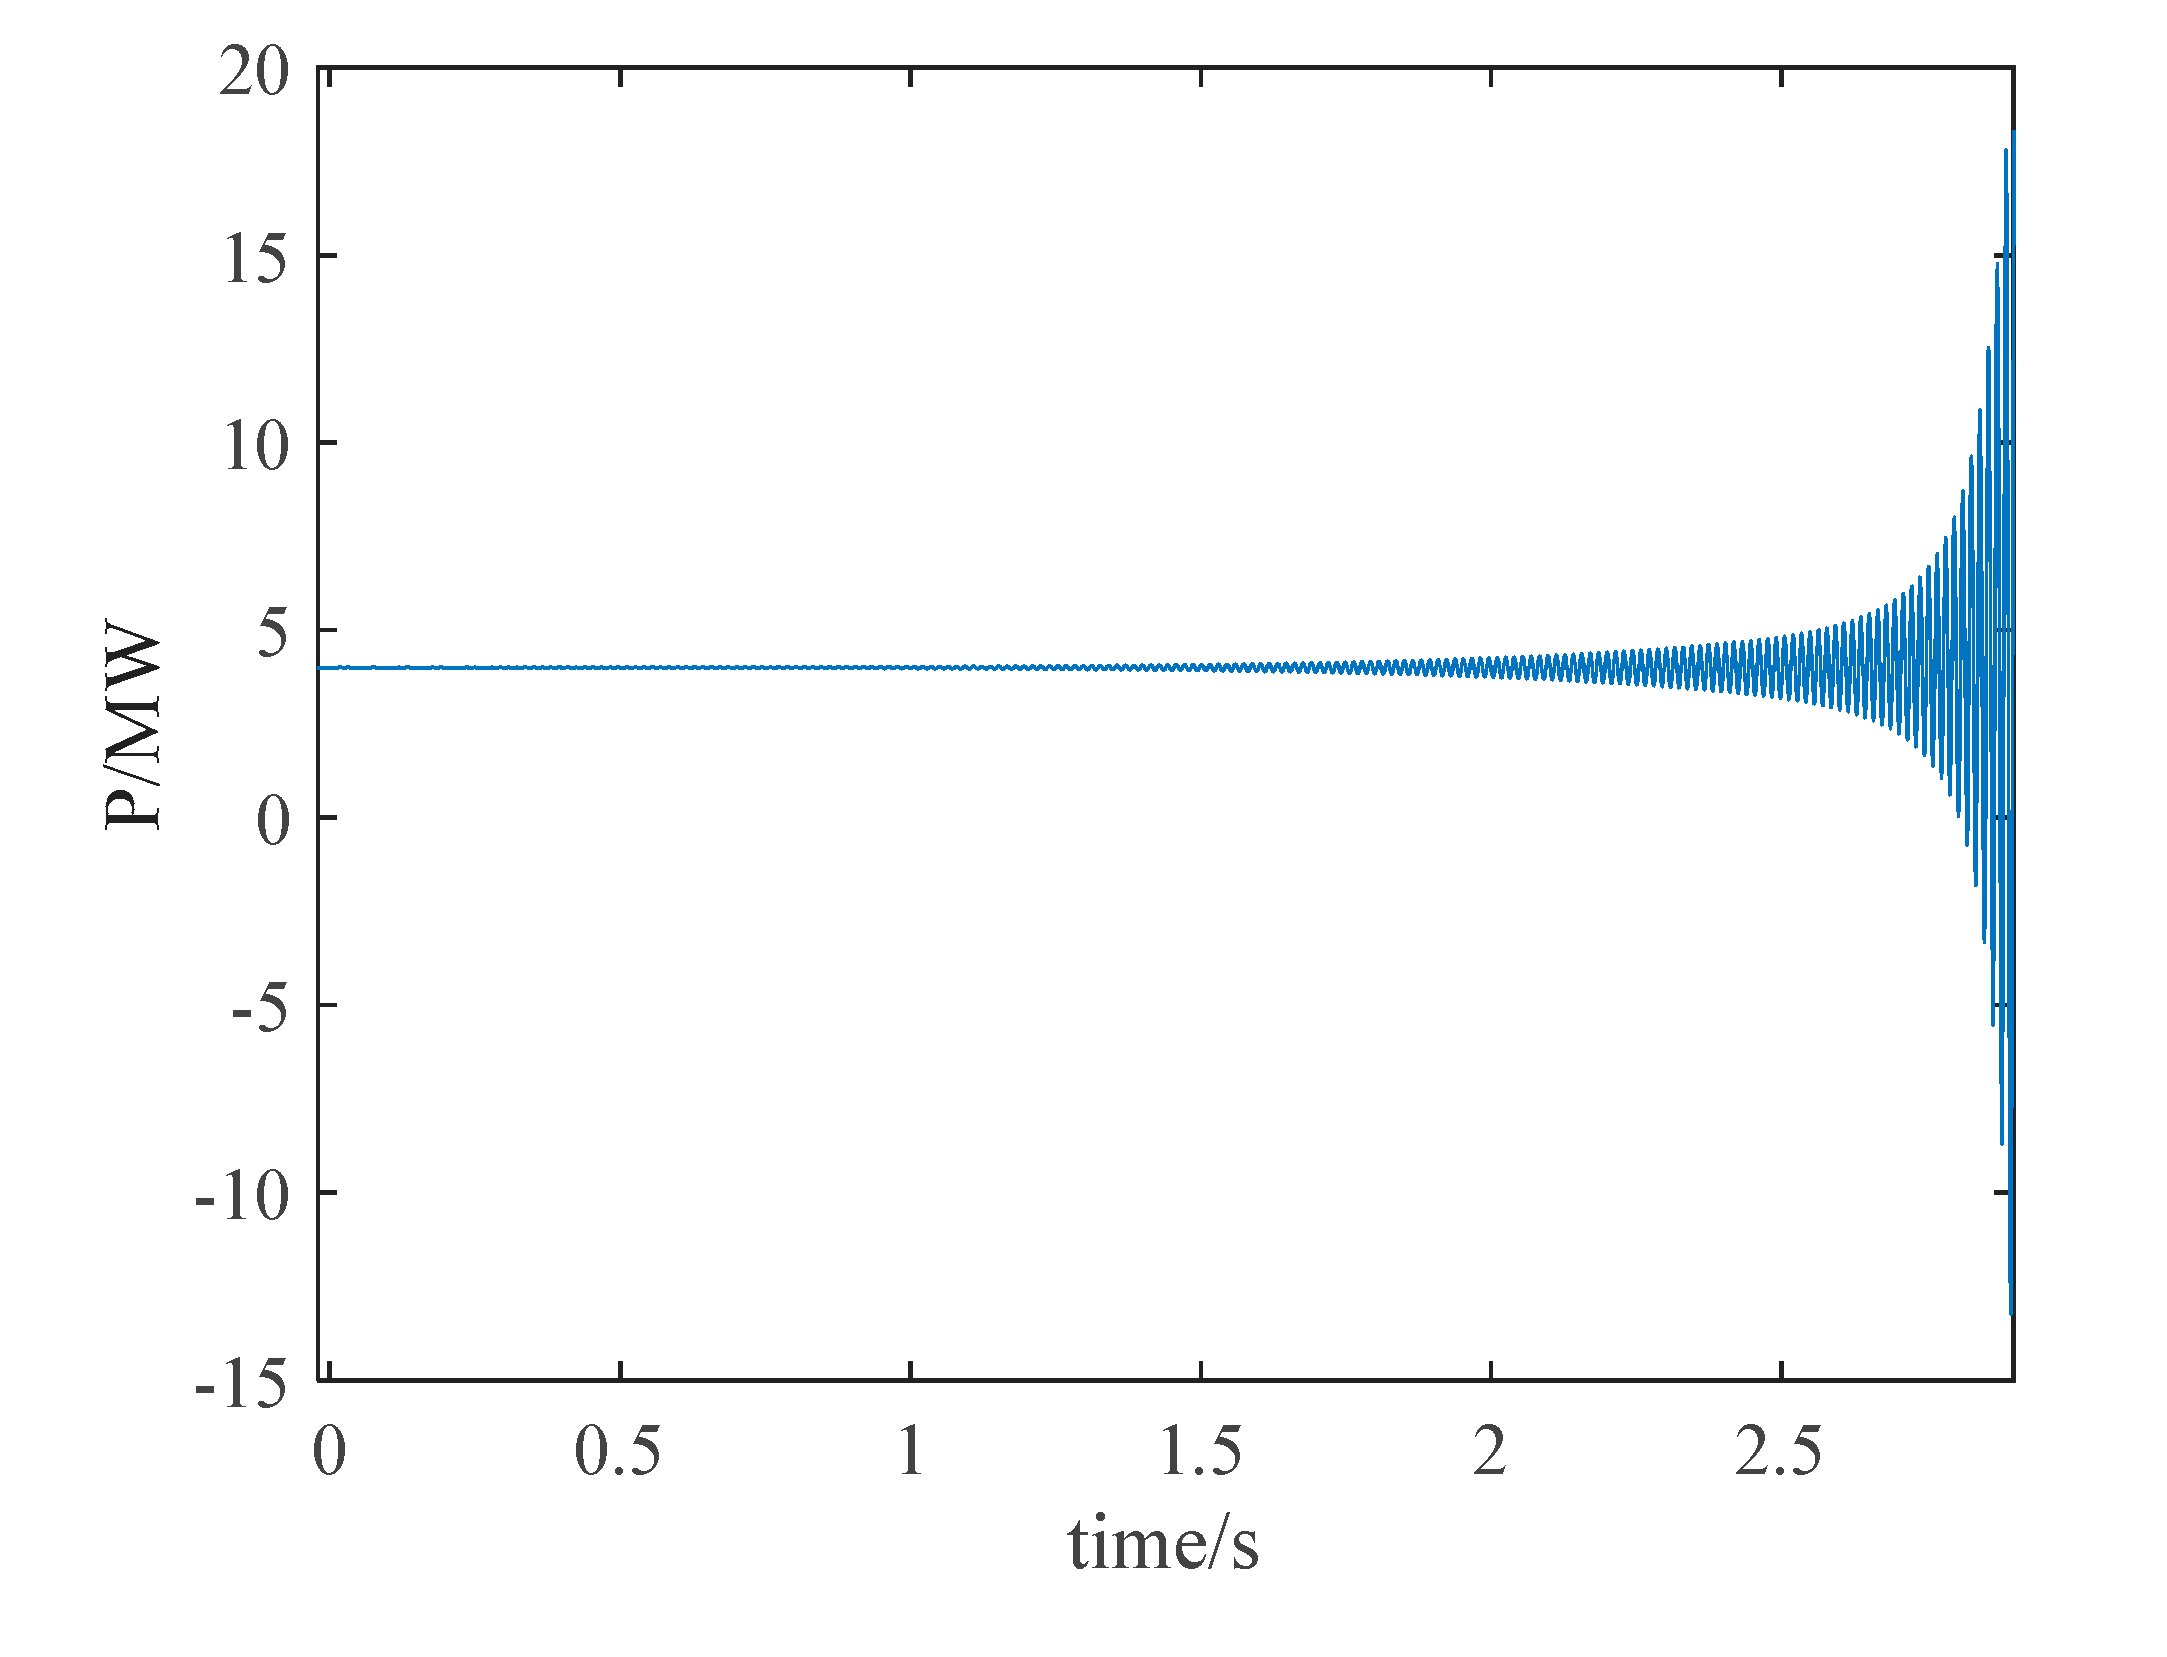
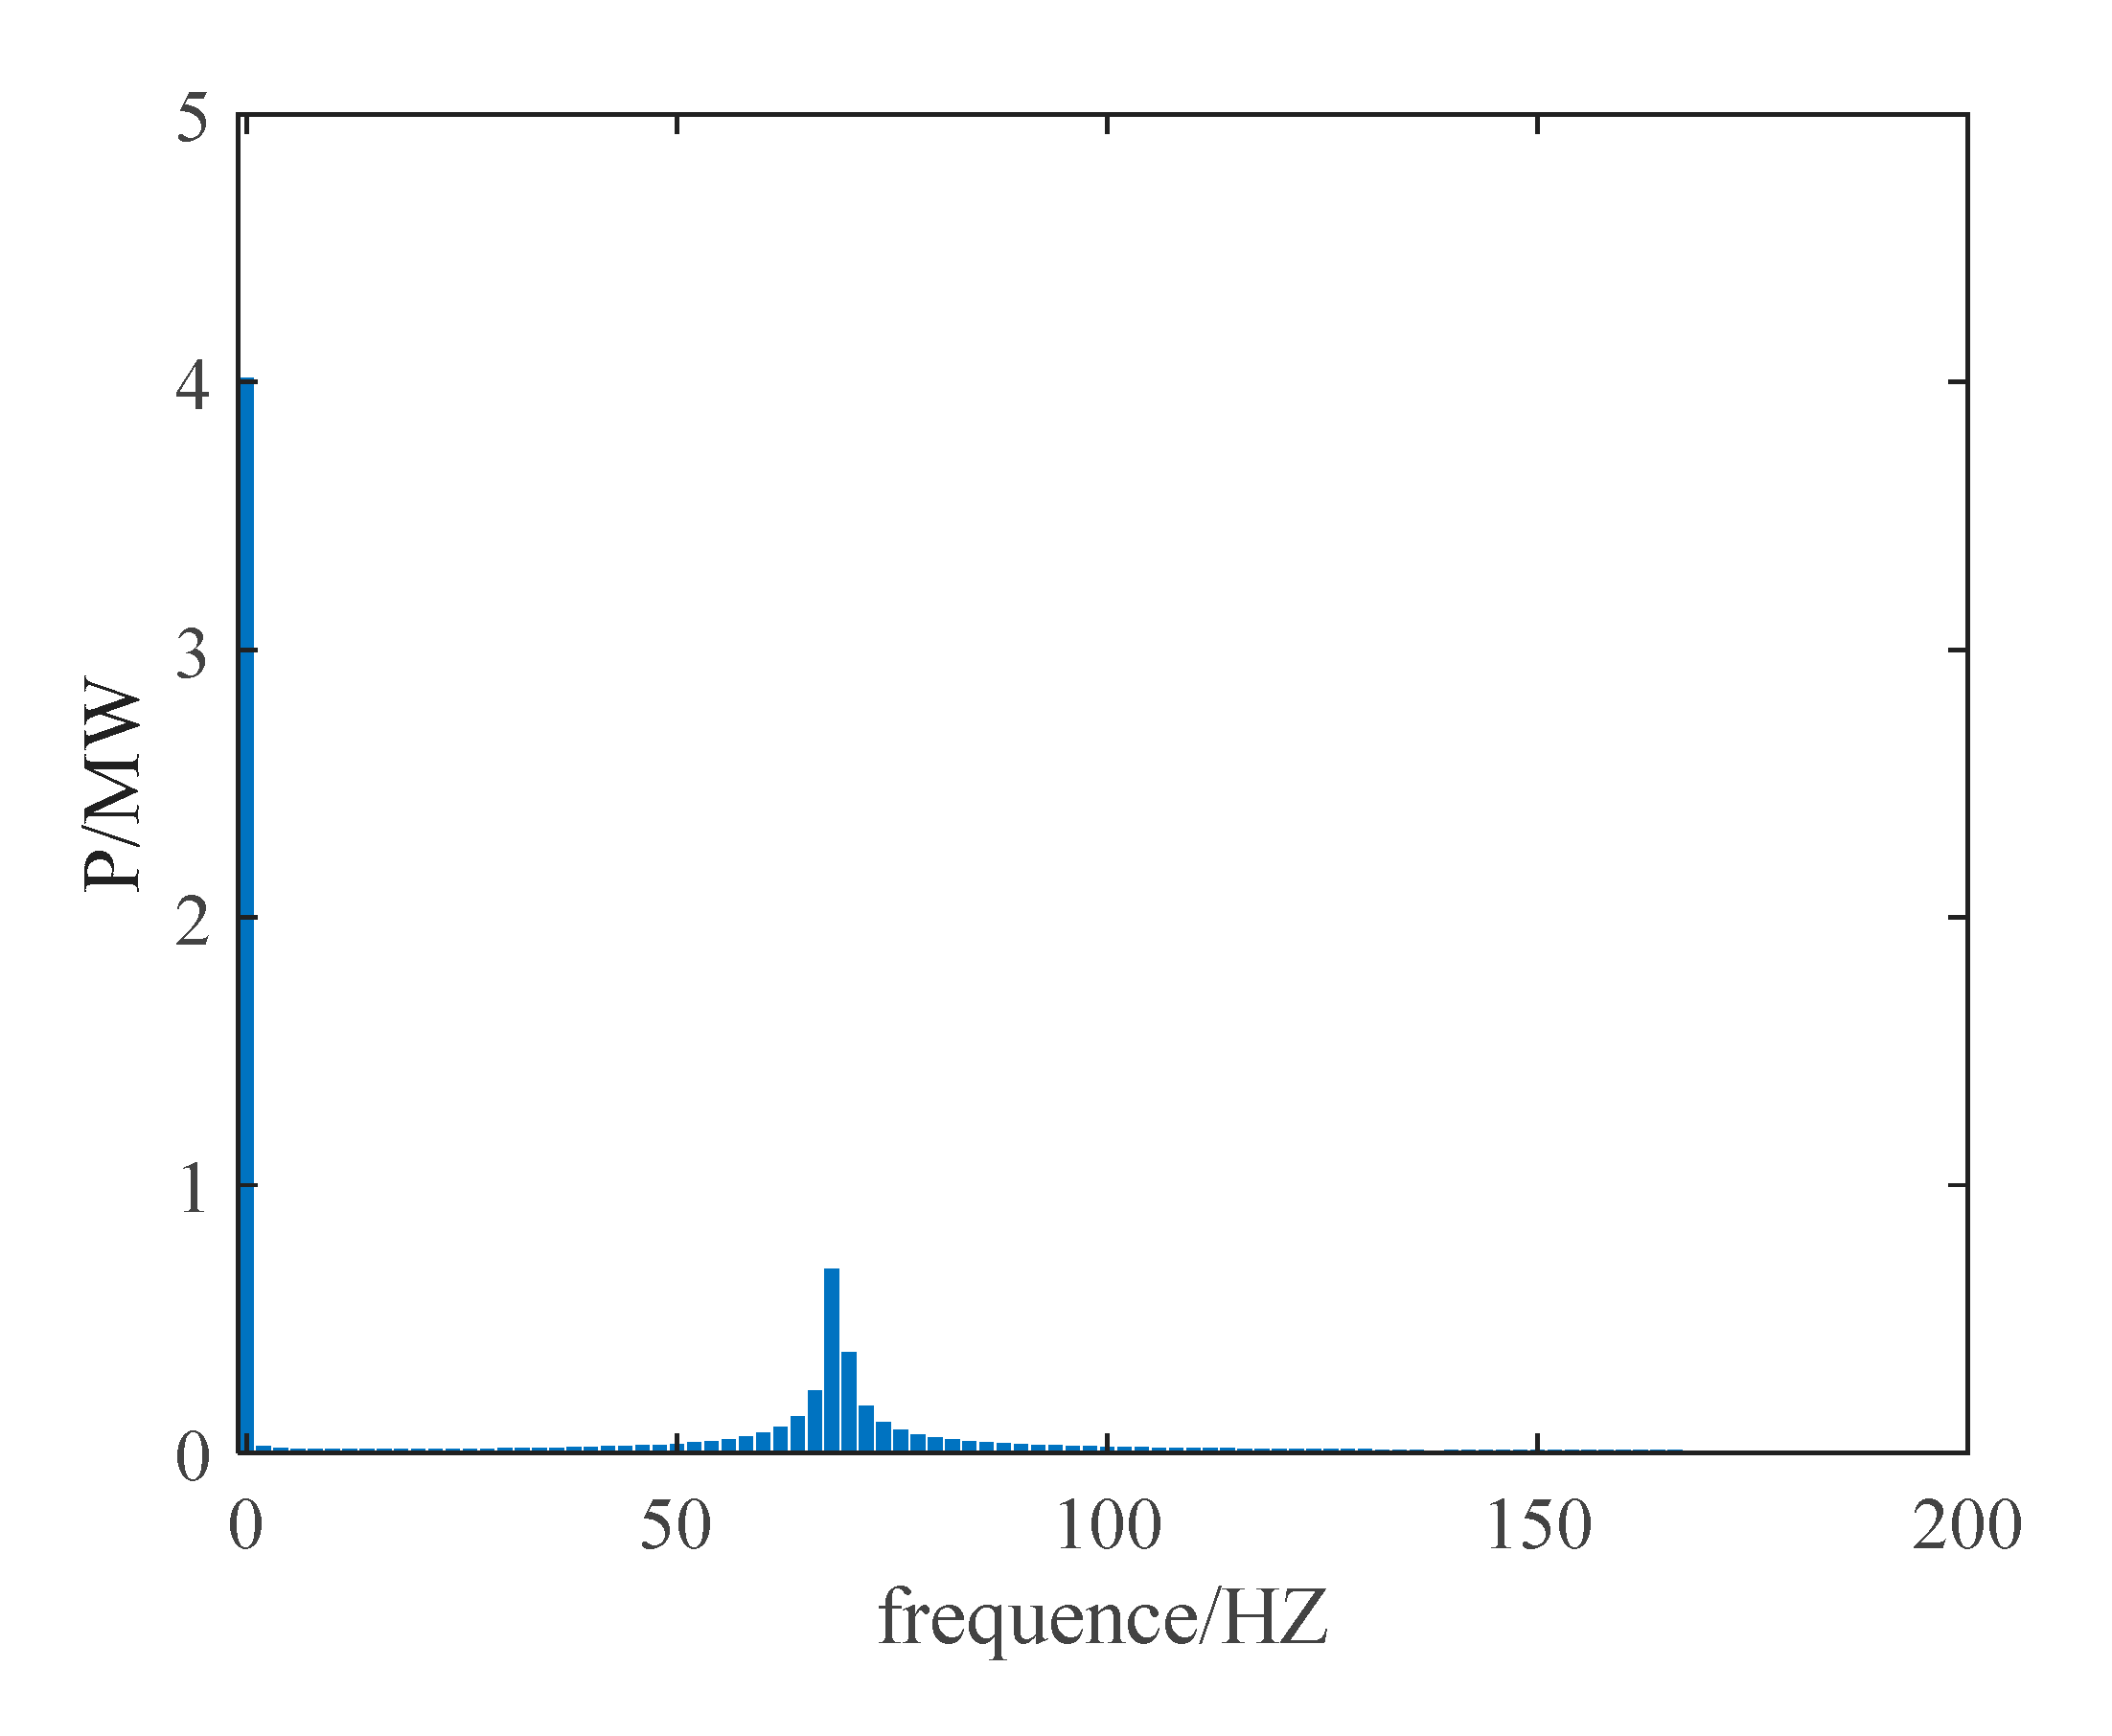
The presence of a pair of positive real part eigenvalues indicates the existence of unstable oscillatory modes in the system. Nonlinear time-domain was used to demonstate the results of the eigenvalue analysis.
Figure 6 presents the the active power at the PCC point, and
Figure 7 presents the results of FFT analysis of the oscillatory signal. As confirmed by the FFT results, there is an oscillatory mode of 68Hz in the system, which is consistent with the eigenvalue analysis.
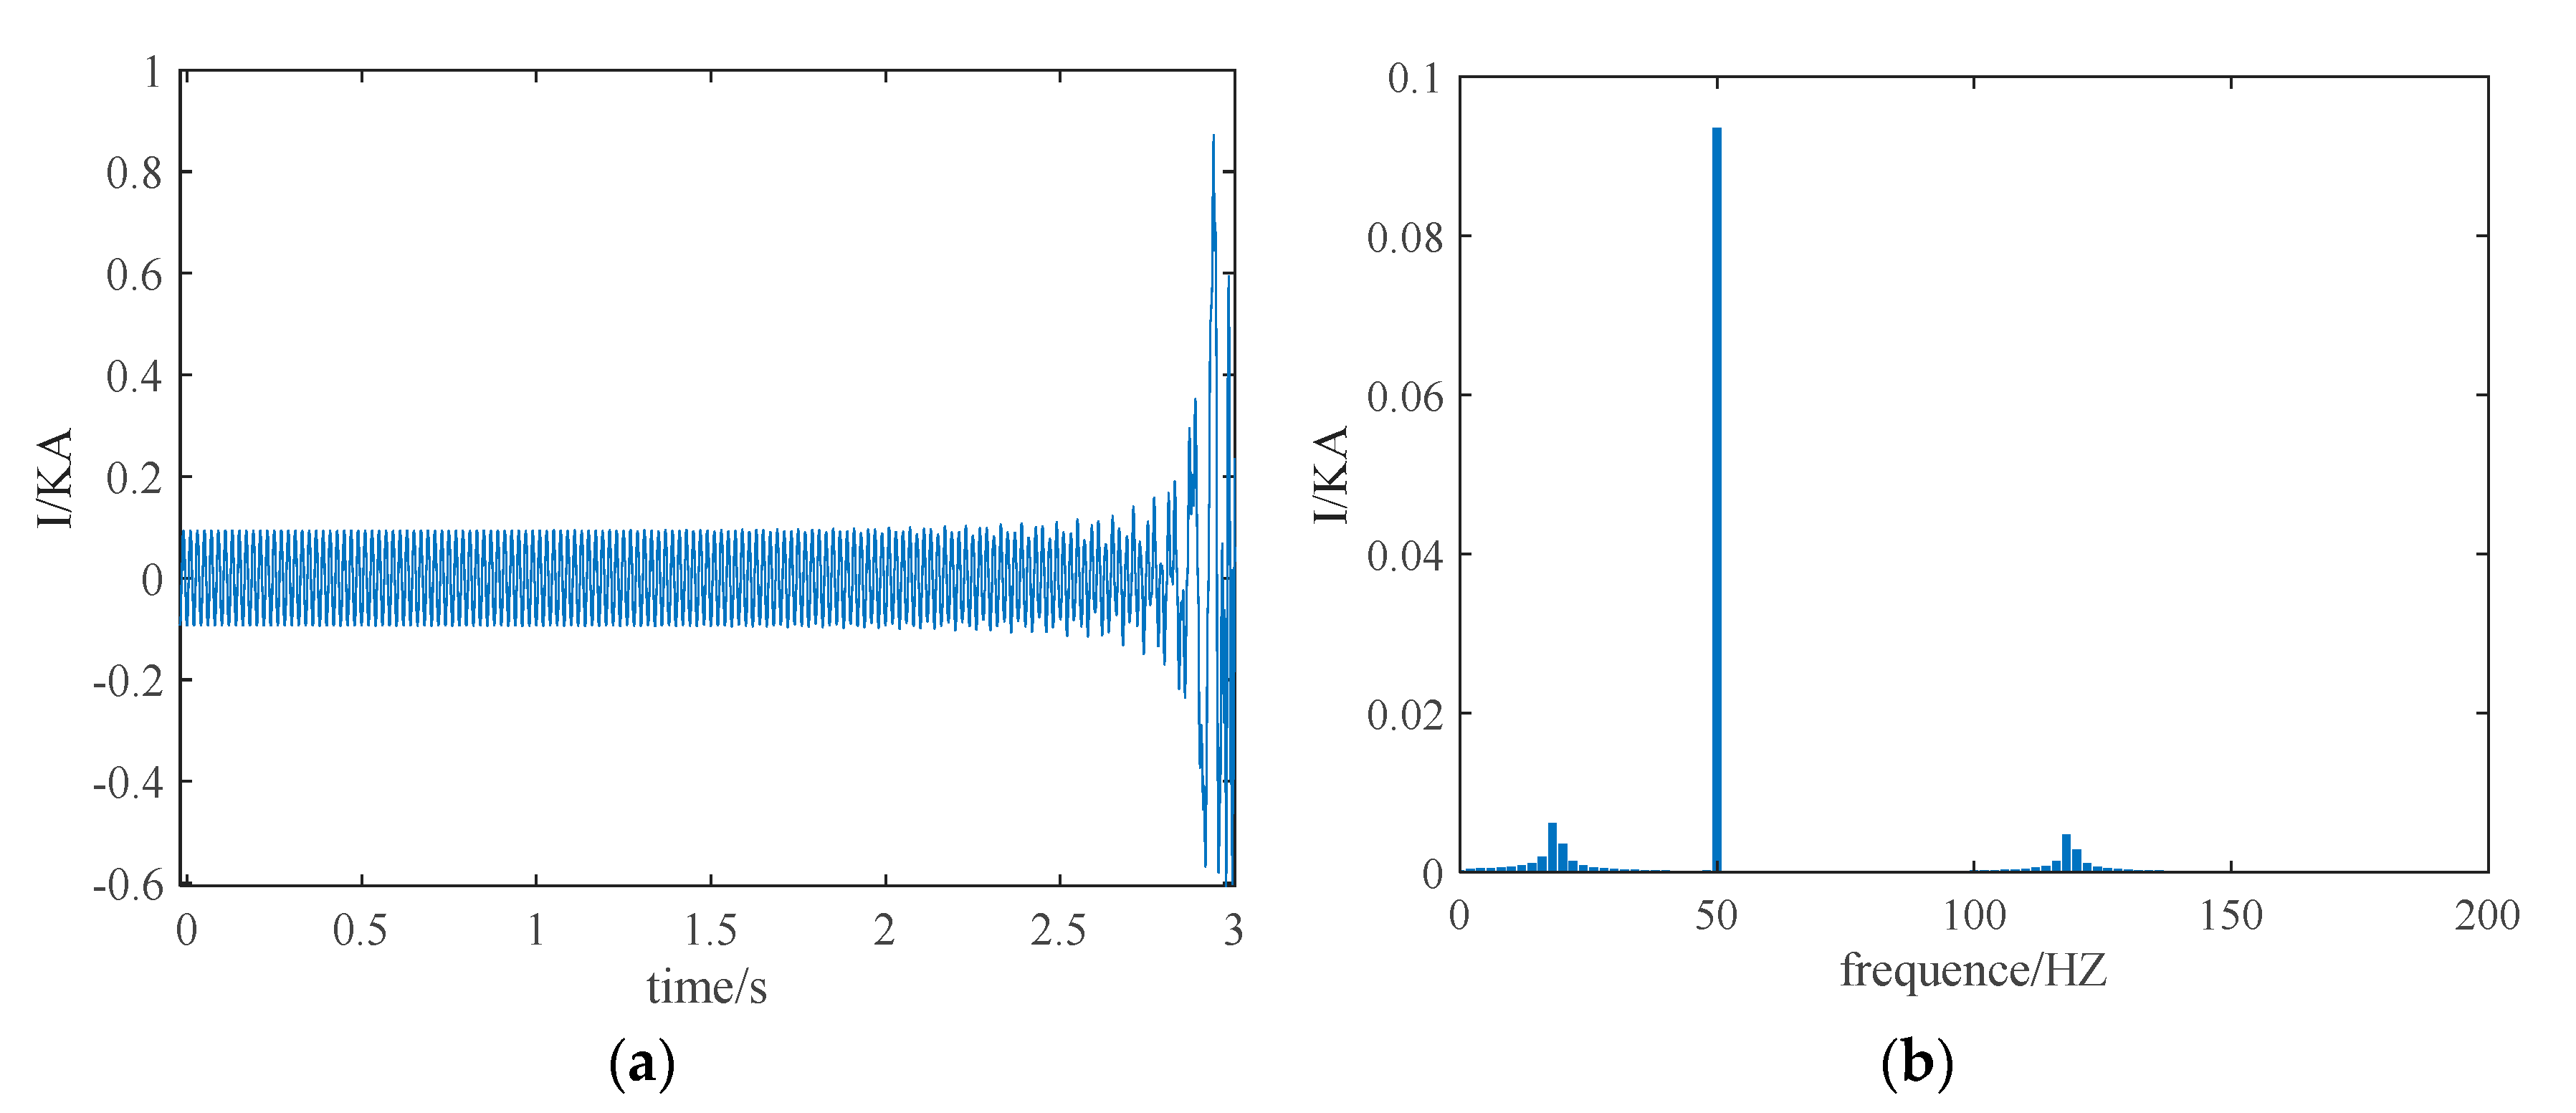
Figure 8 and
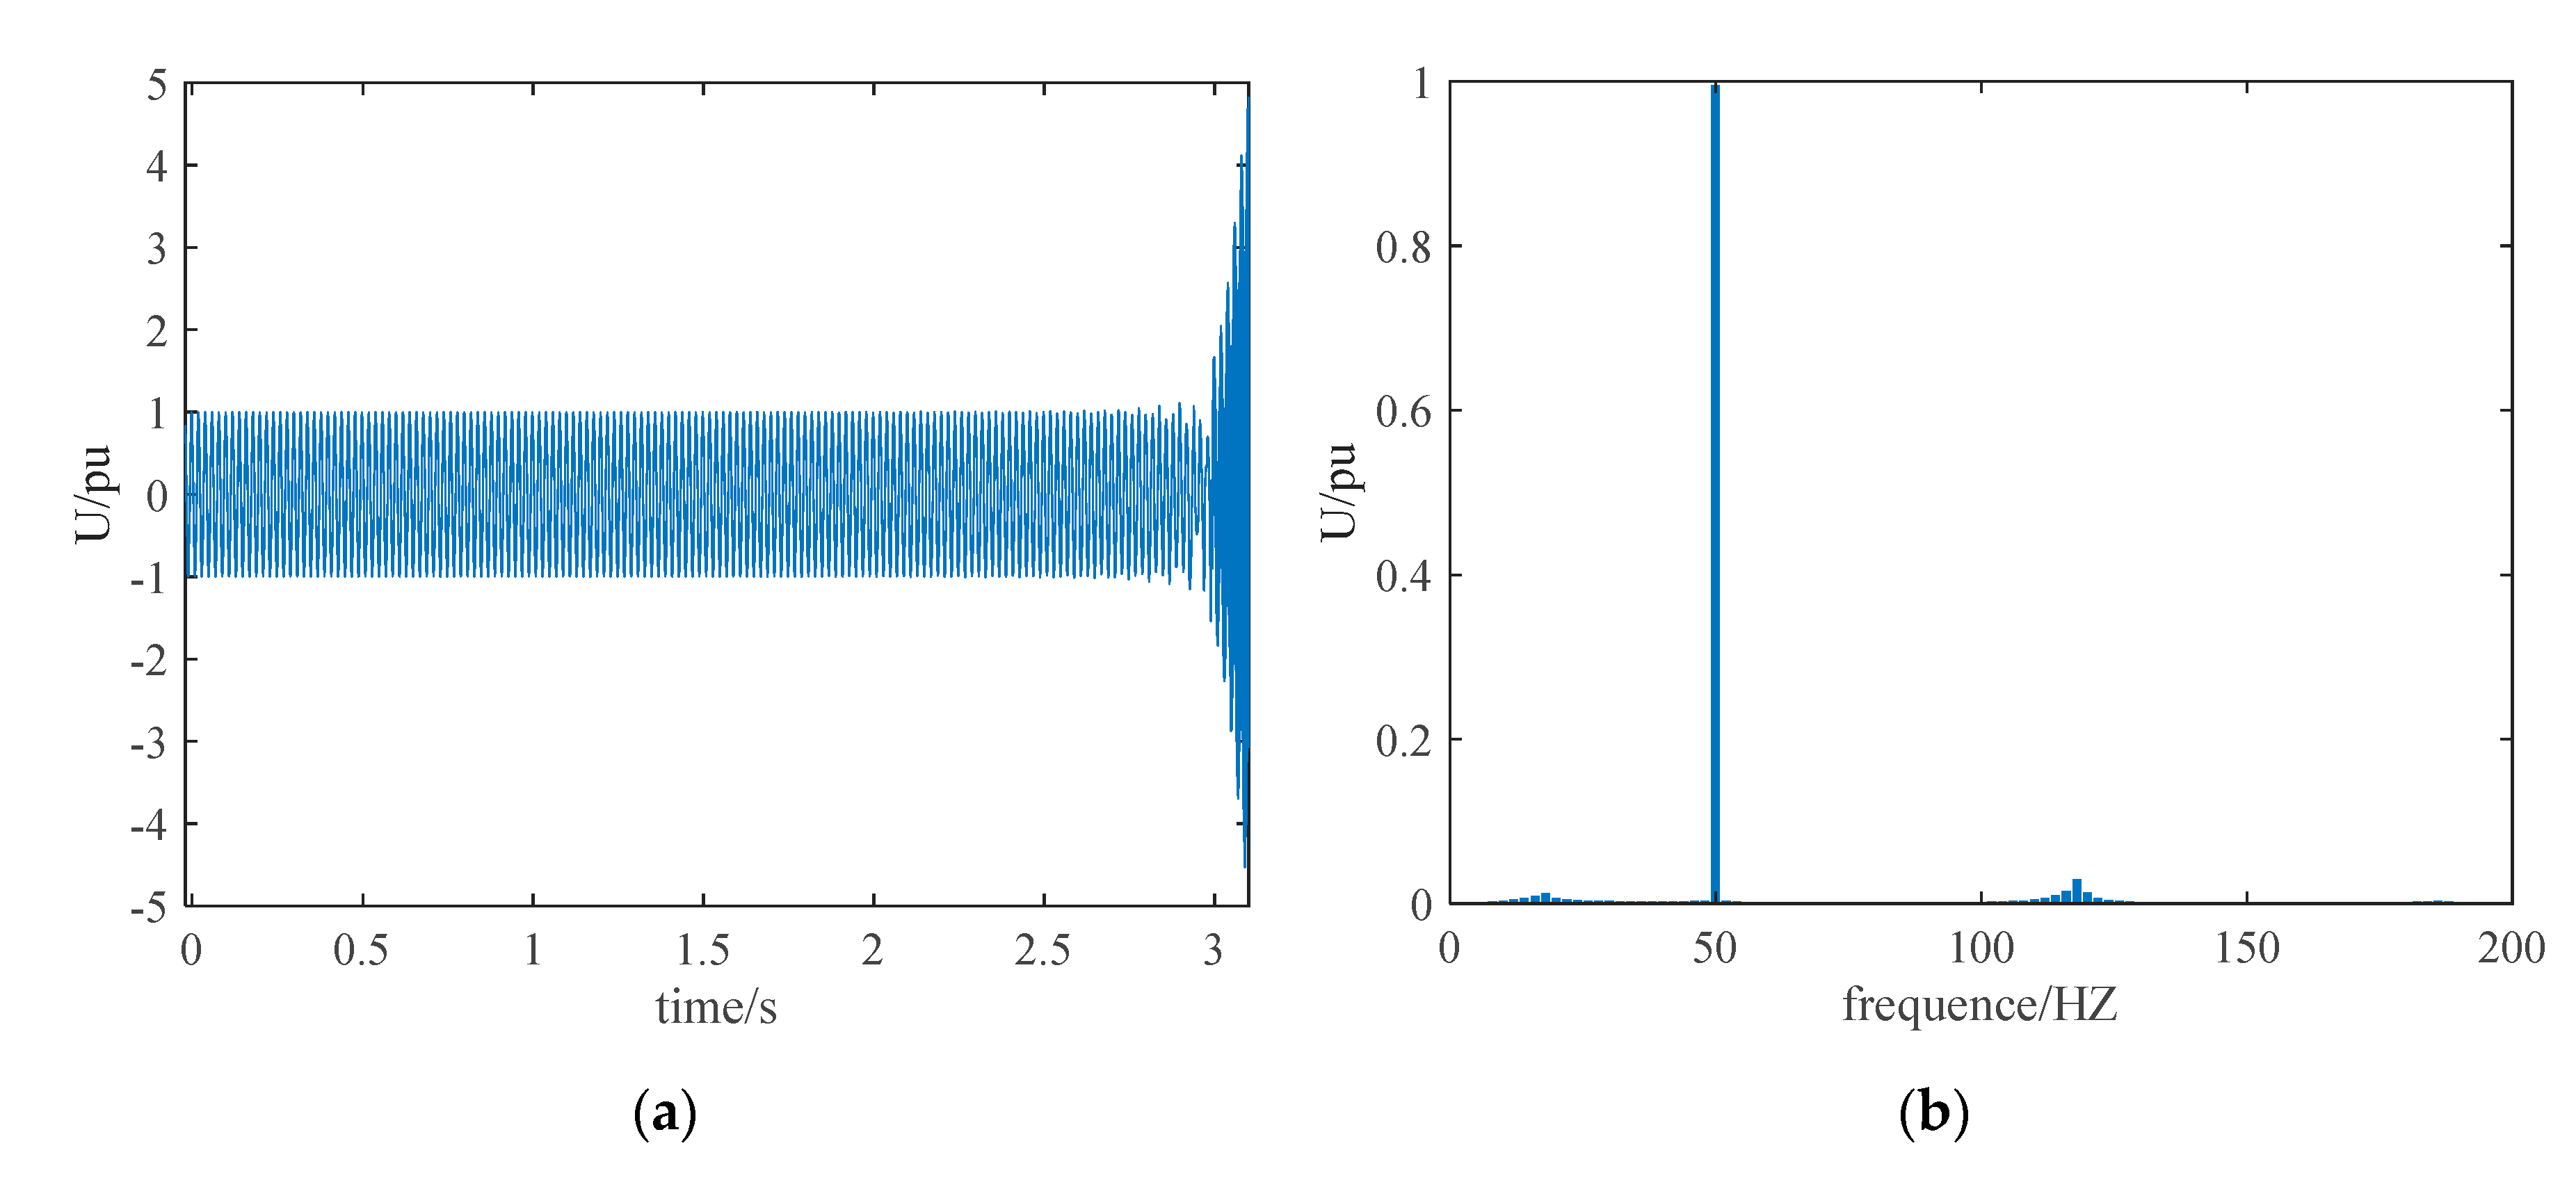
Figure 9 present the instantaneous signals of voltage and current and the results of the corresponding FFT analysis.
As seen from the simulation results in
Figure 8 and
Figure 9, there are two dominant oscillatory modes in the test system,
i.e., 1)118 Hz (50 Hz + 68 Hz) and 2) 18 Hz (50 Hz - 68 Hz). The oscillation frequency of 68 Hz is symmetrical to the fundamental frequency of 50 Hz, which is consistent with the analysis in section 2.4, confirming the accuracy of the impedance model and criteria.
4. The sensitivity of the spectrum to control parameters
The control parameters of VSC and the grid-side equivalent impedance directly affect the spectral characteristics of the wideband oscillations. In this section, the sensitivity of the spectrum to some key parameters is analyzed.
4.1. The influence of Kp1 and Kp2
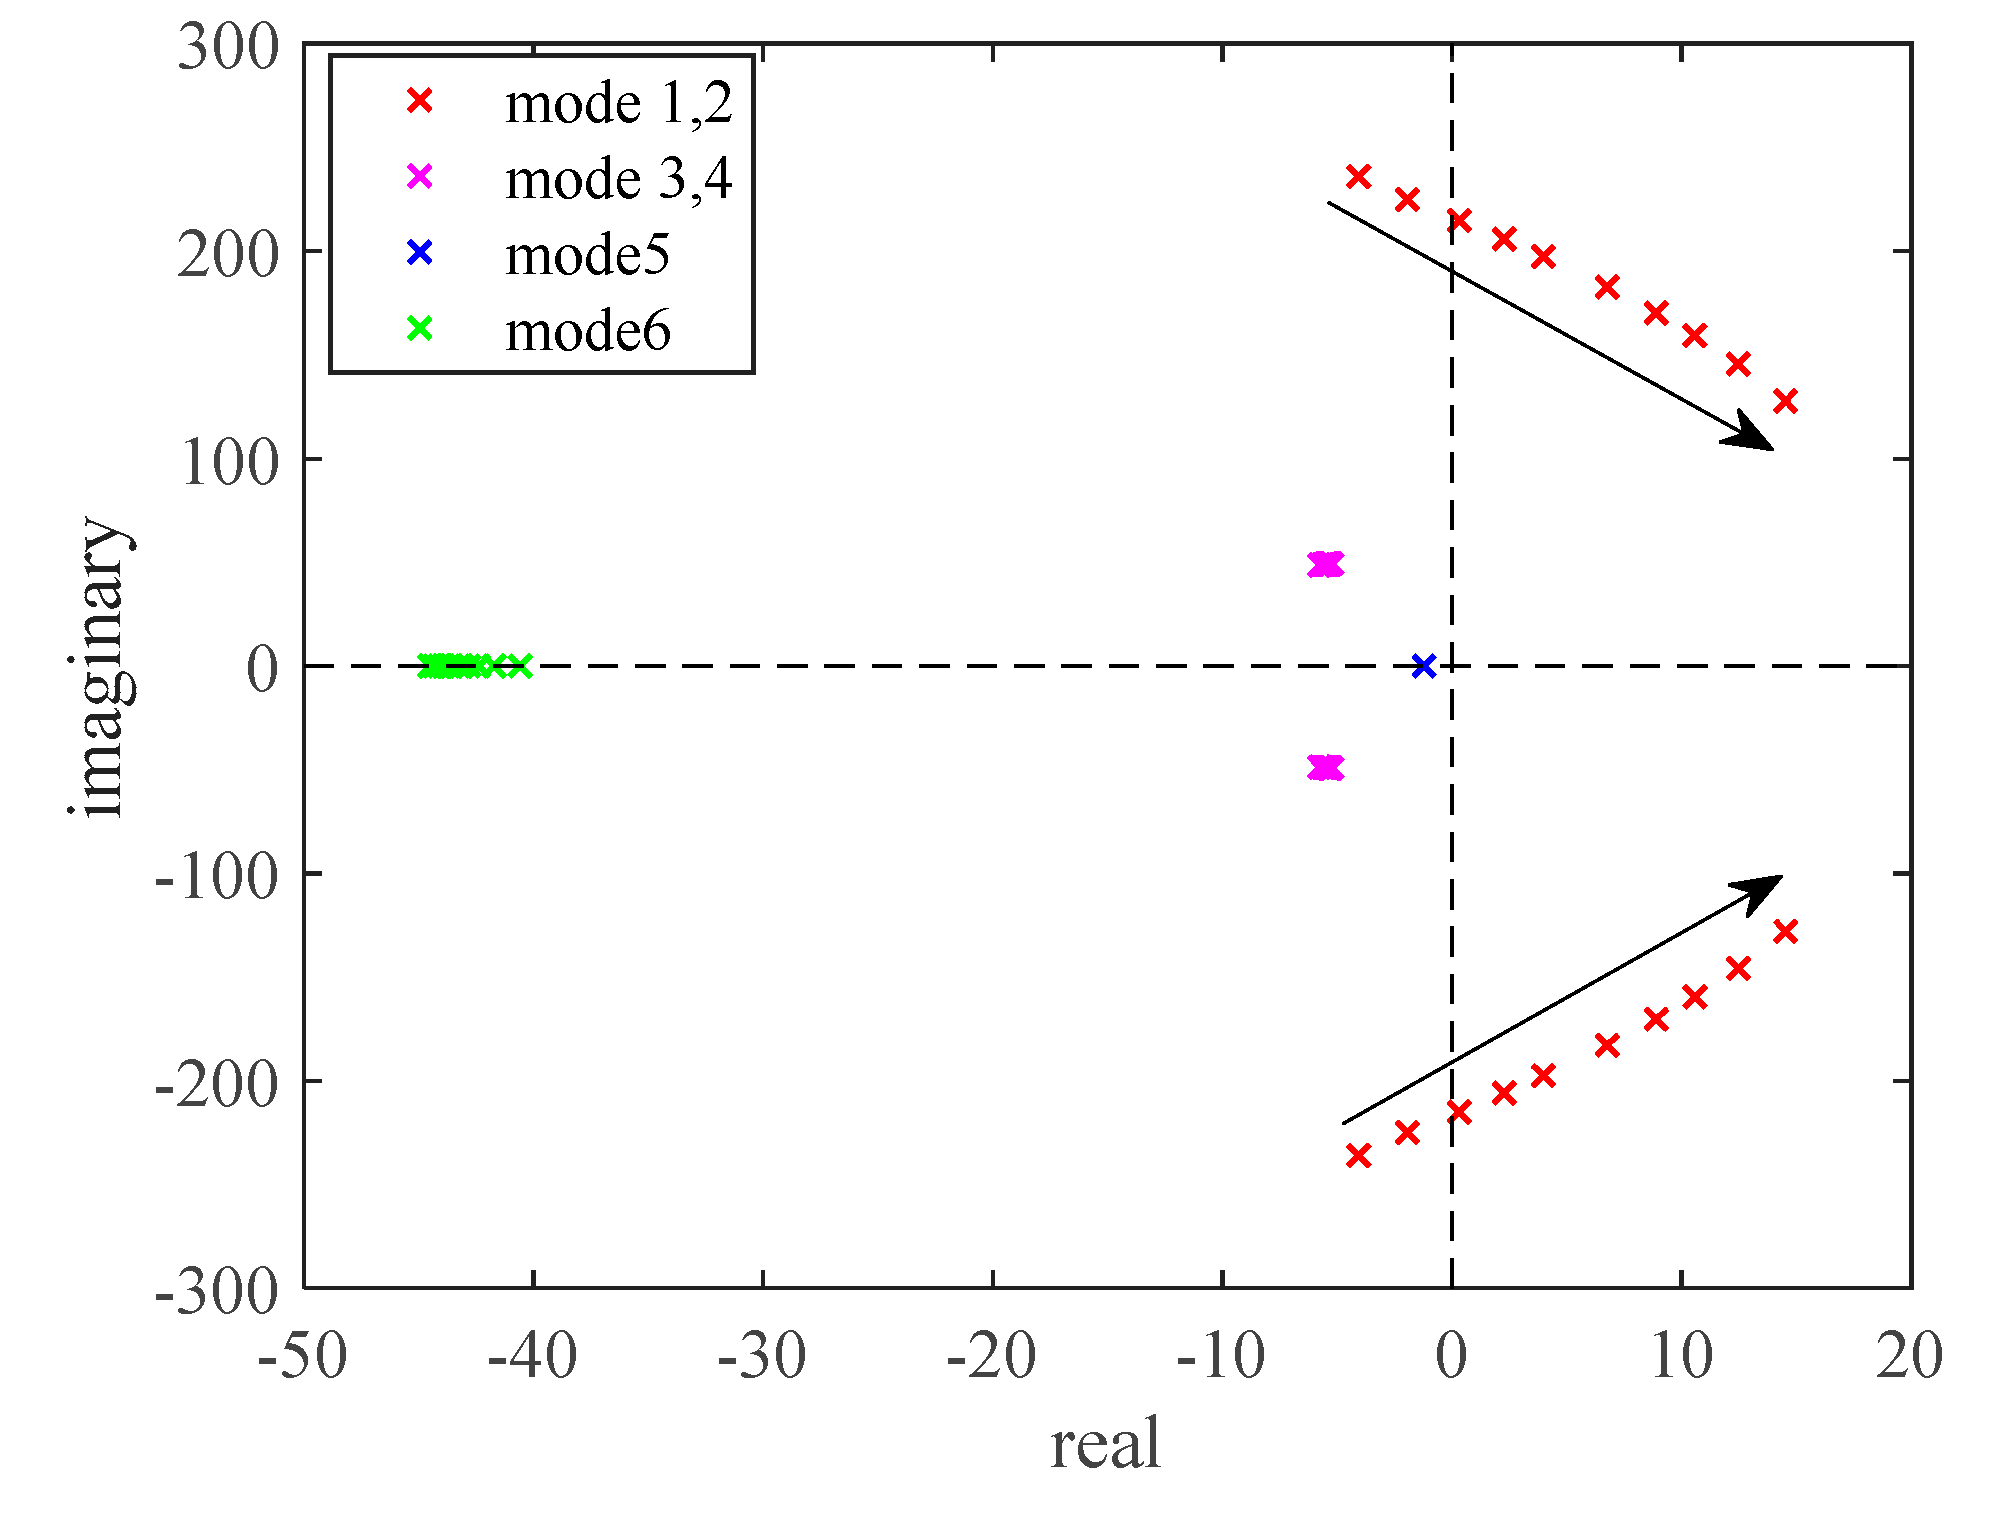
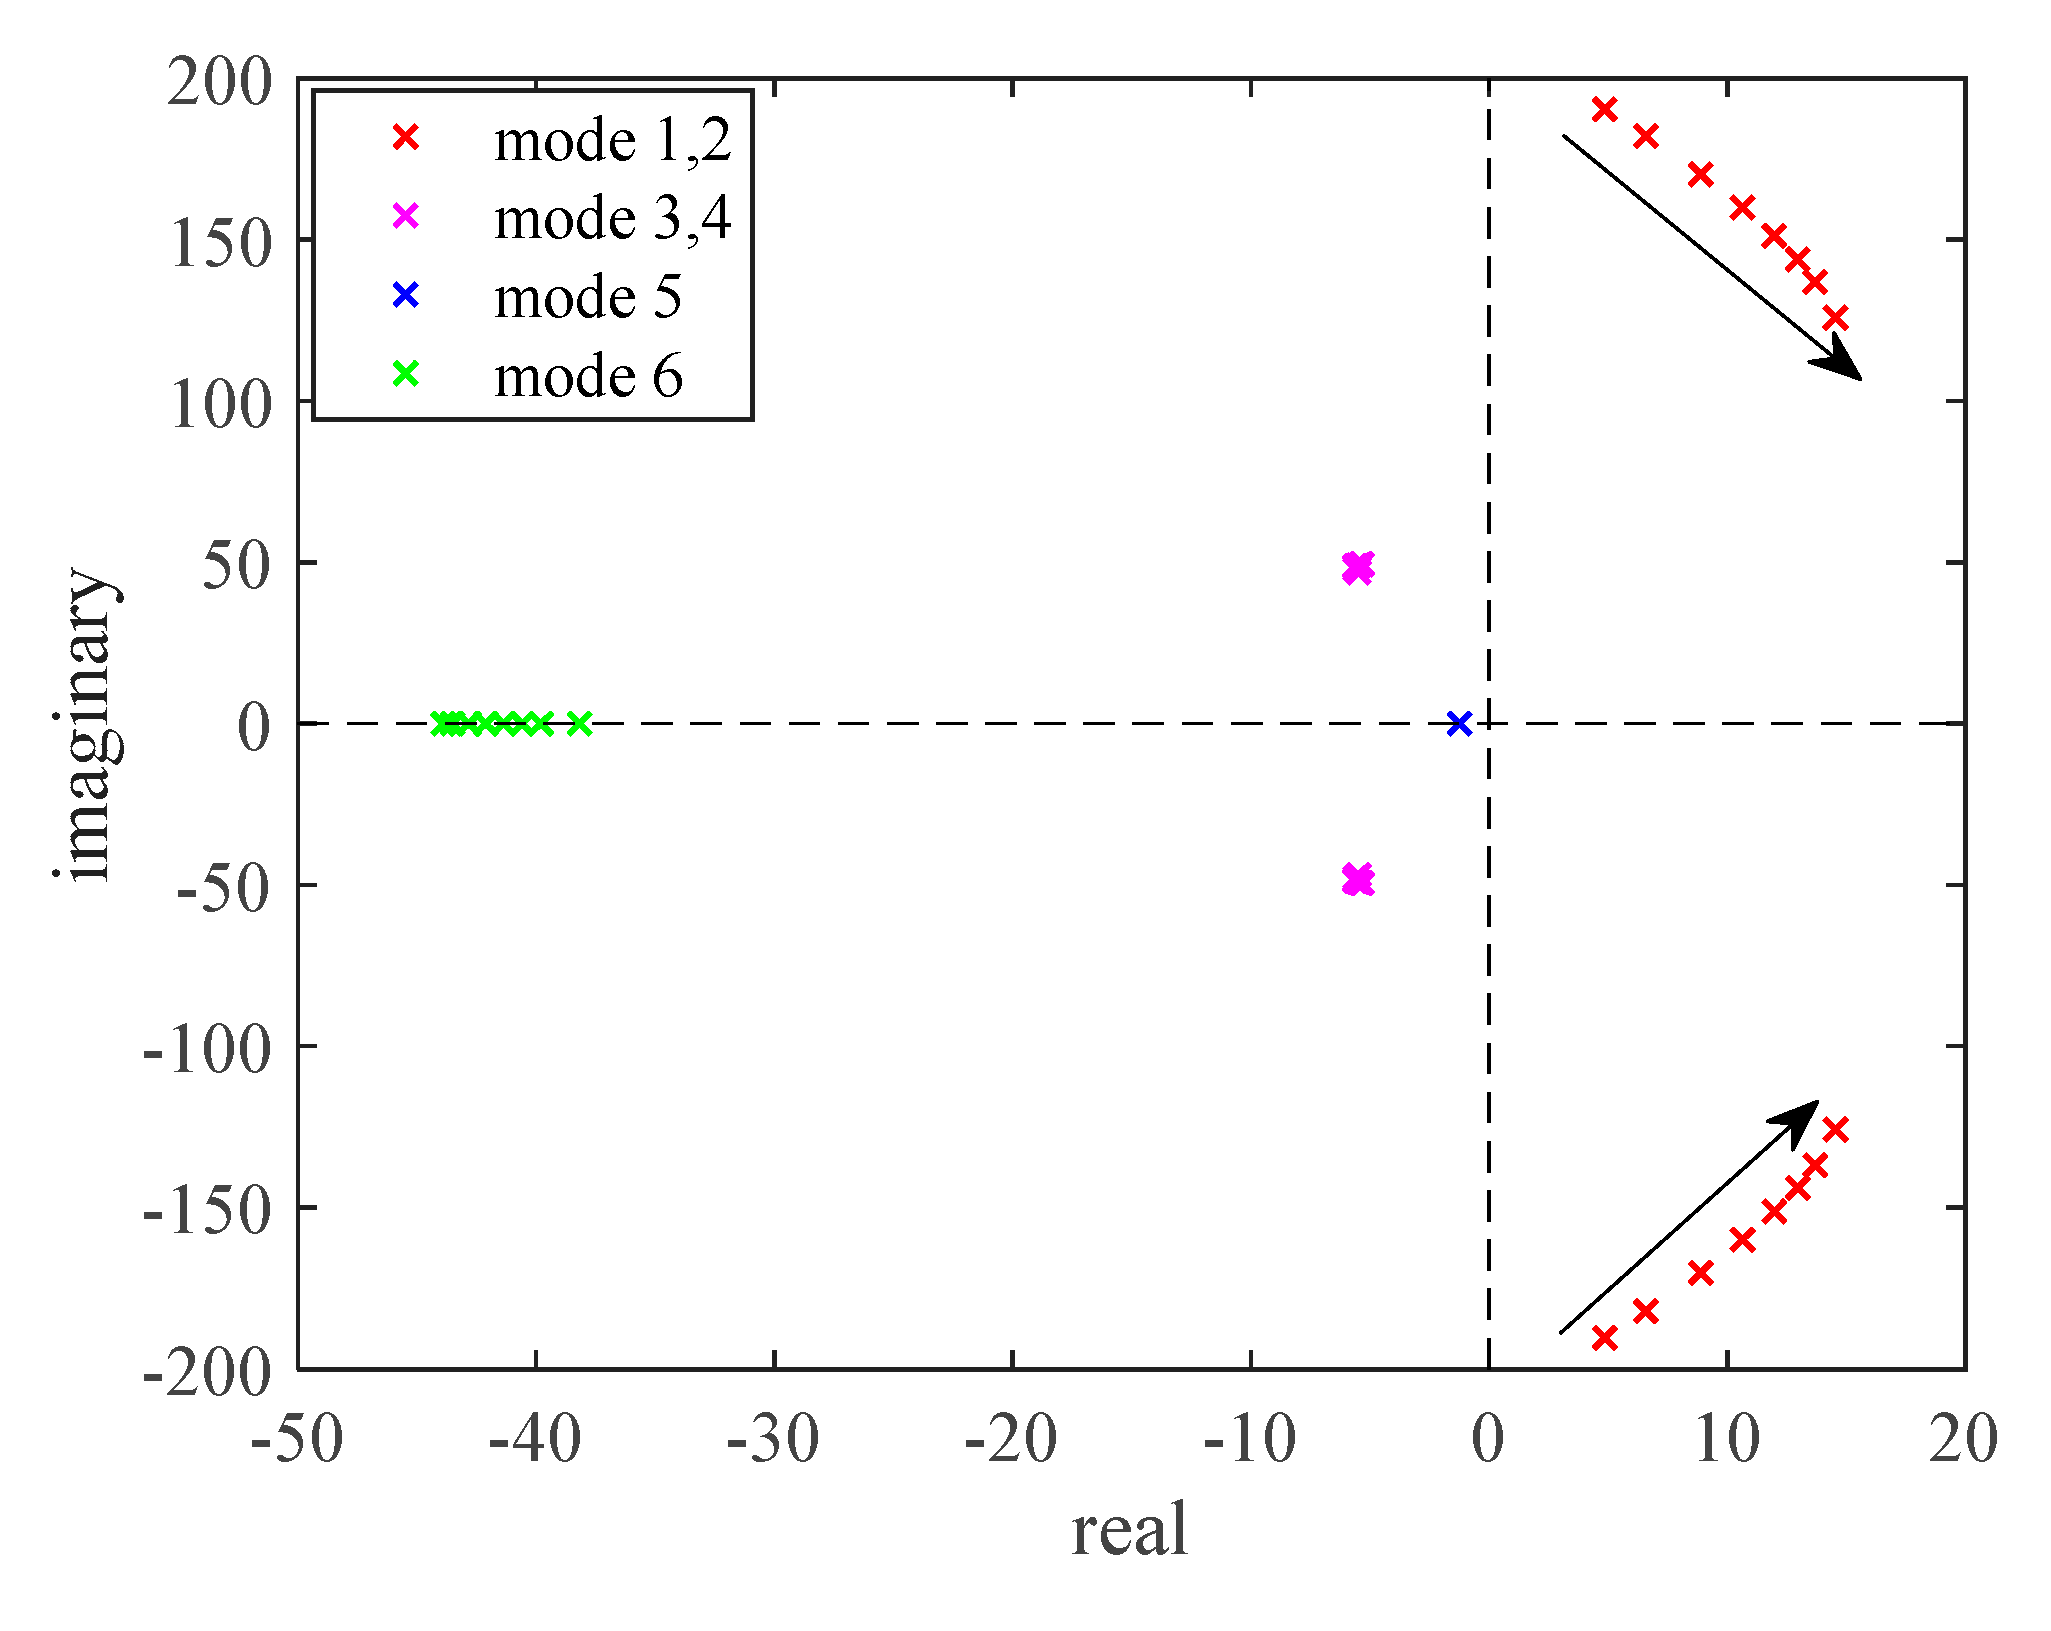
Eigenvalue analysis was again applied to the test system; Setting
Kp=10, Ki=50, Ki1=Ki2=25, and keeping other parameters consistent with
Table 1. Then setting
Kp2=0.025 and increasing
Kp1 from 0.01 to 0.027, and
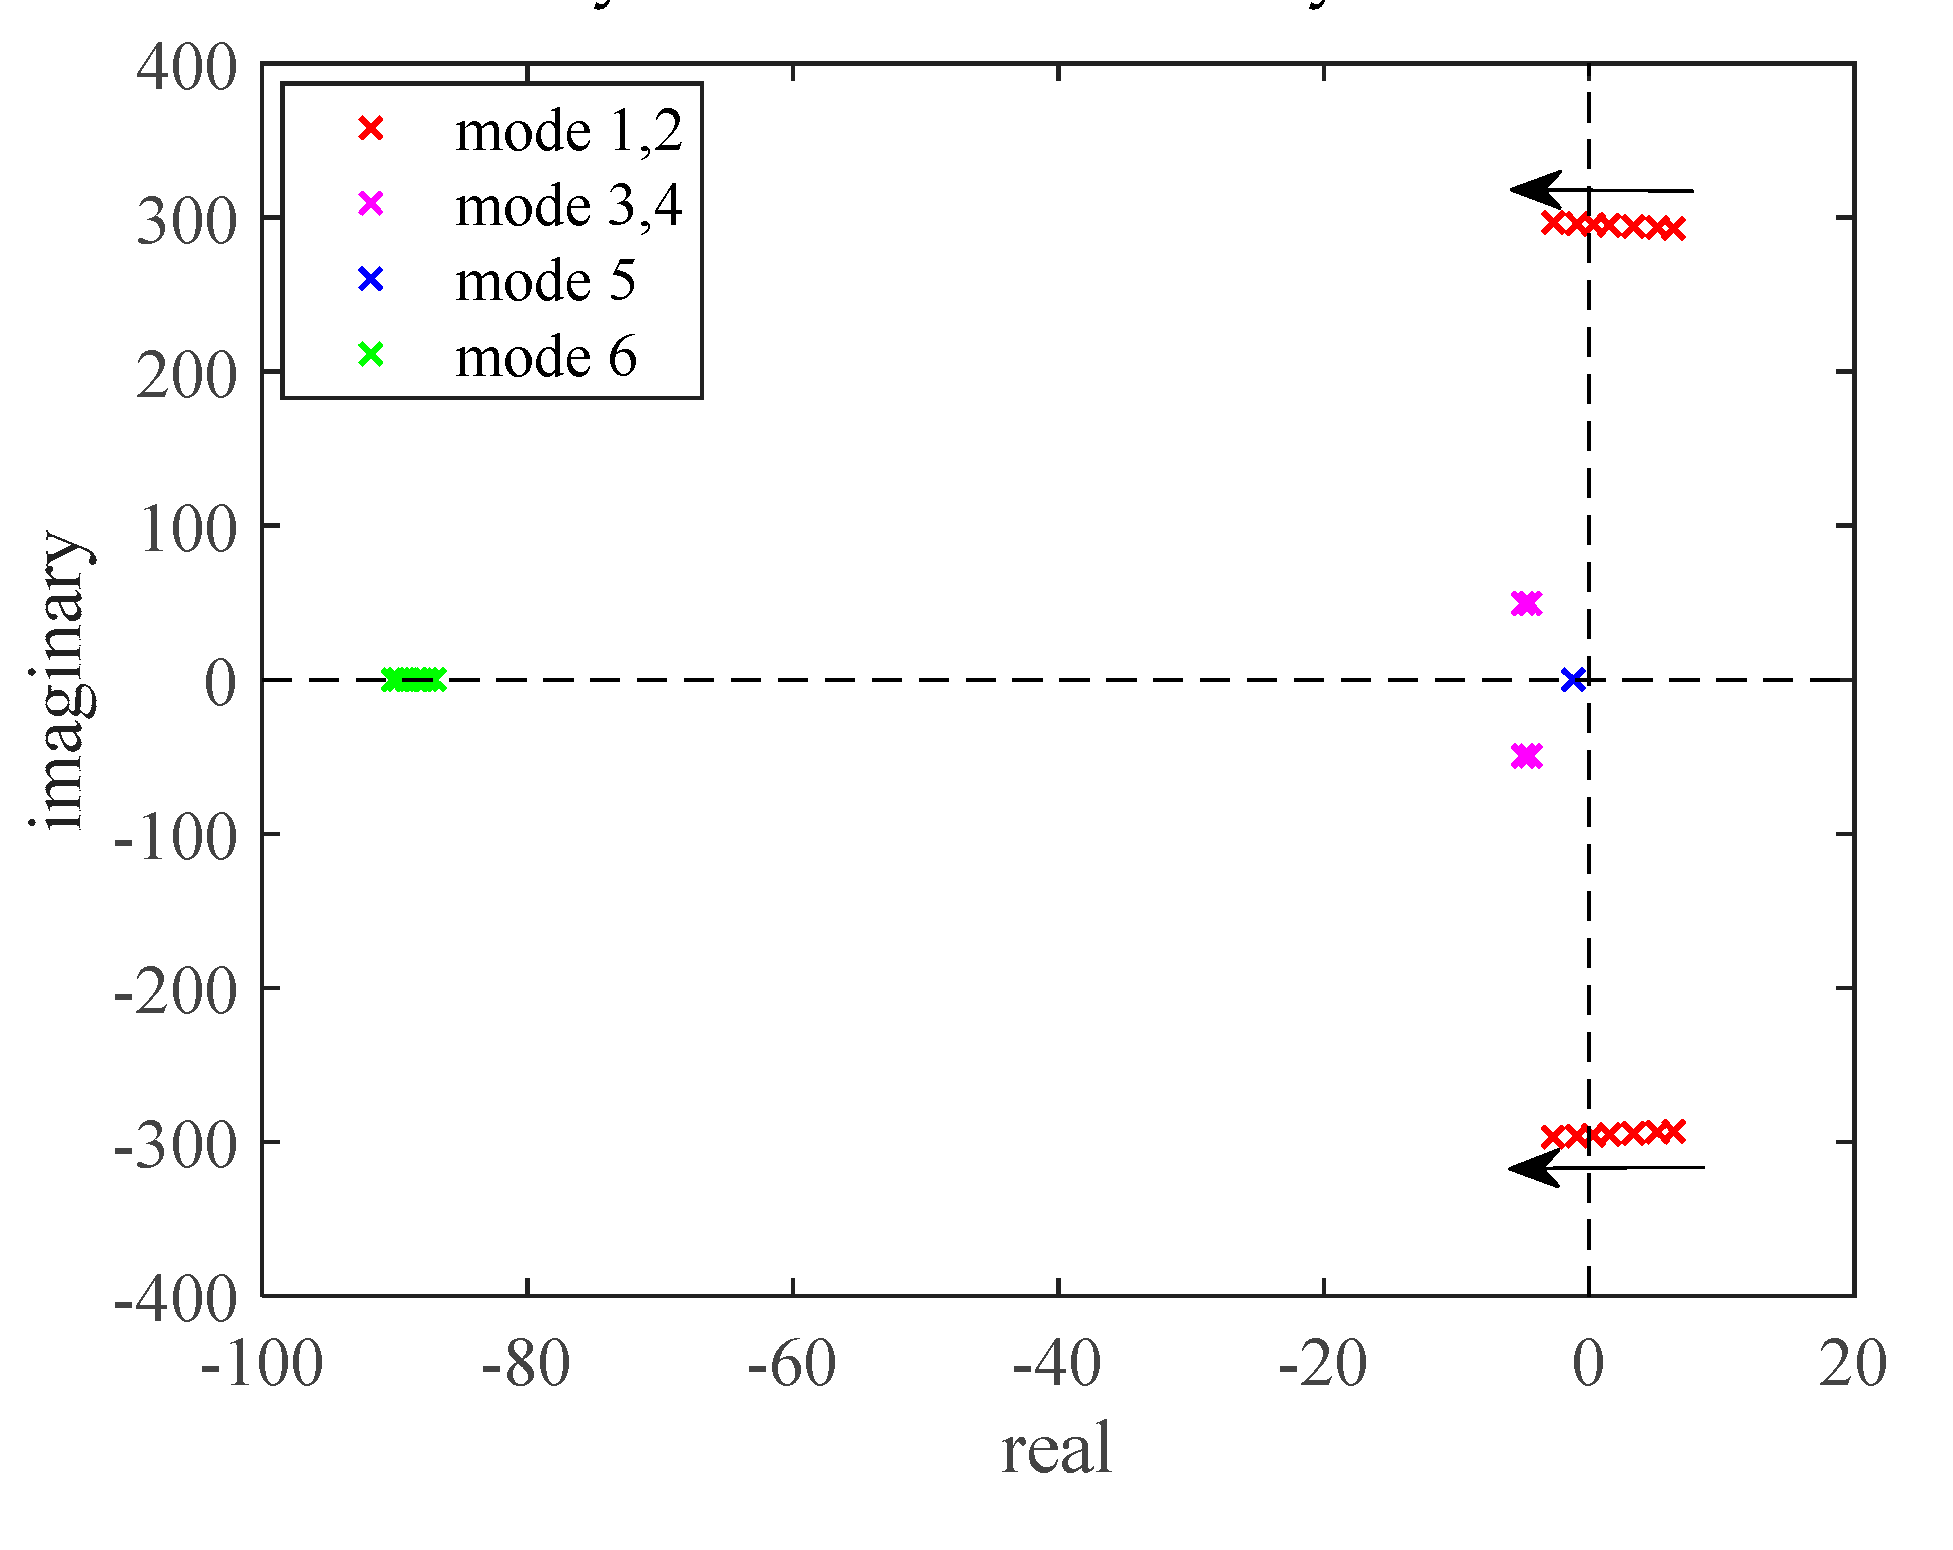
Figure 10 shows the system’s oscillatory modes for different
Kp1. Similarly, setting
Kp1=0.025 and increasing
Kp2 from 0.01 to 0.027, and
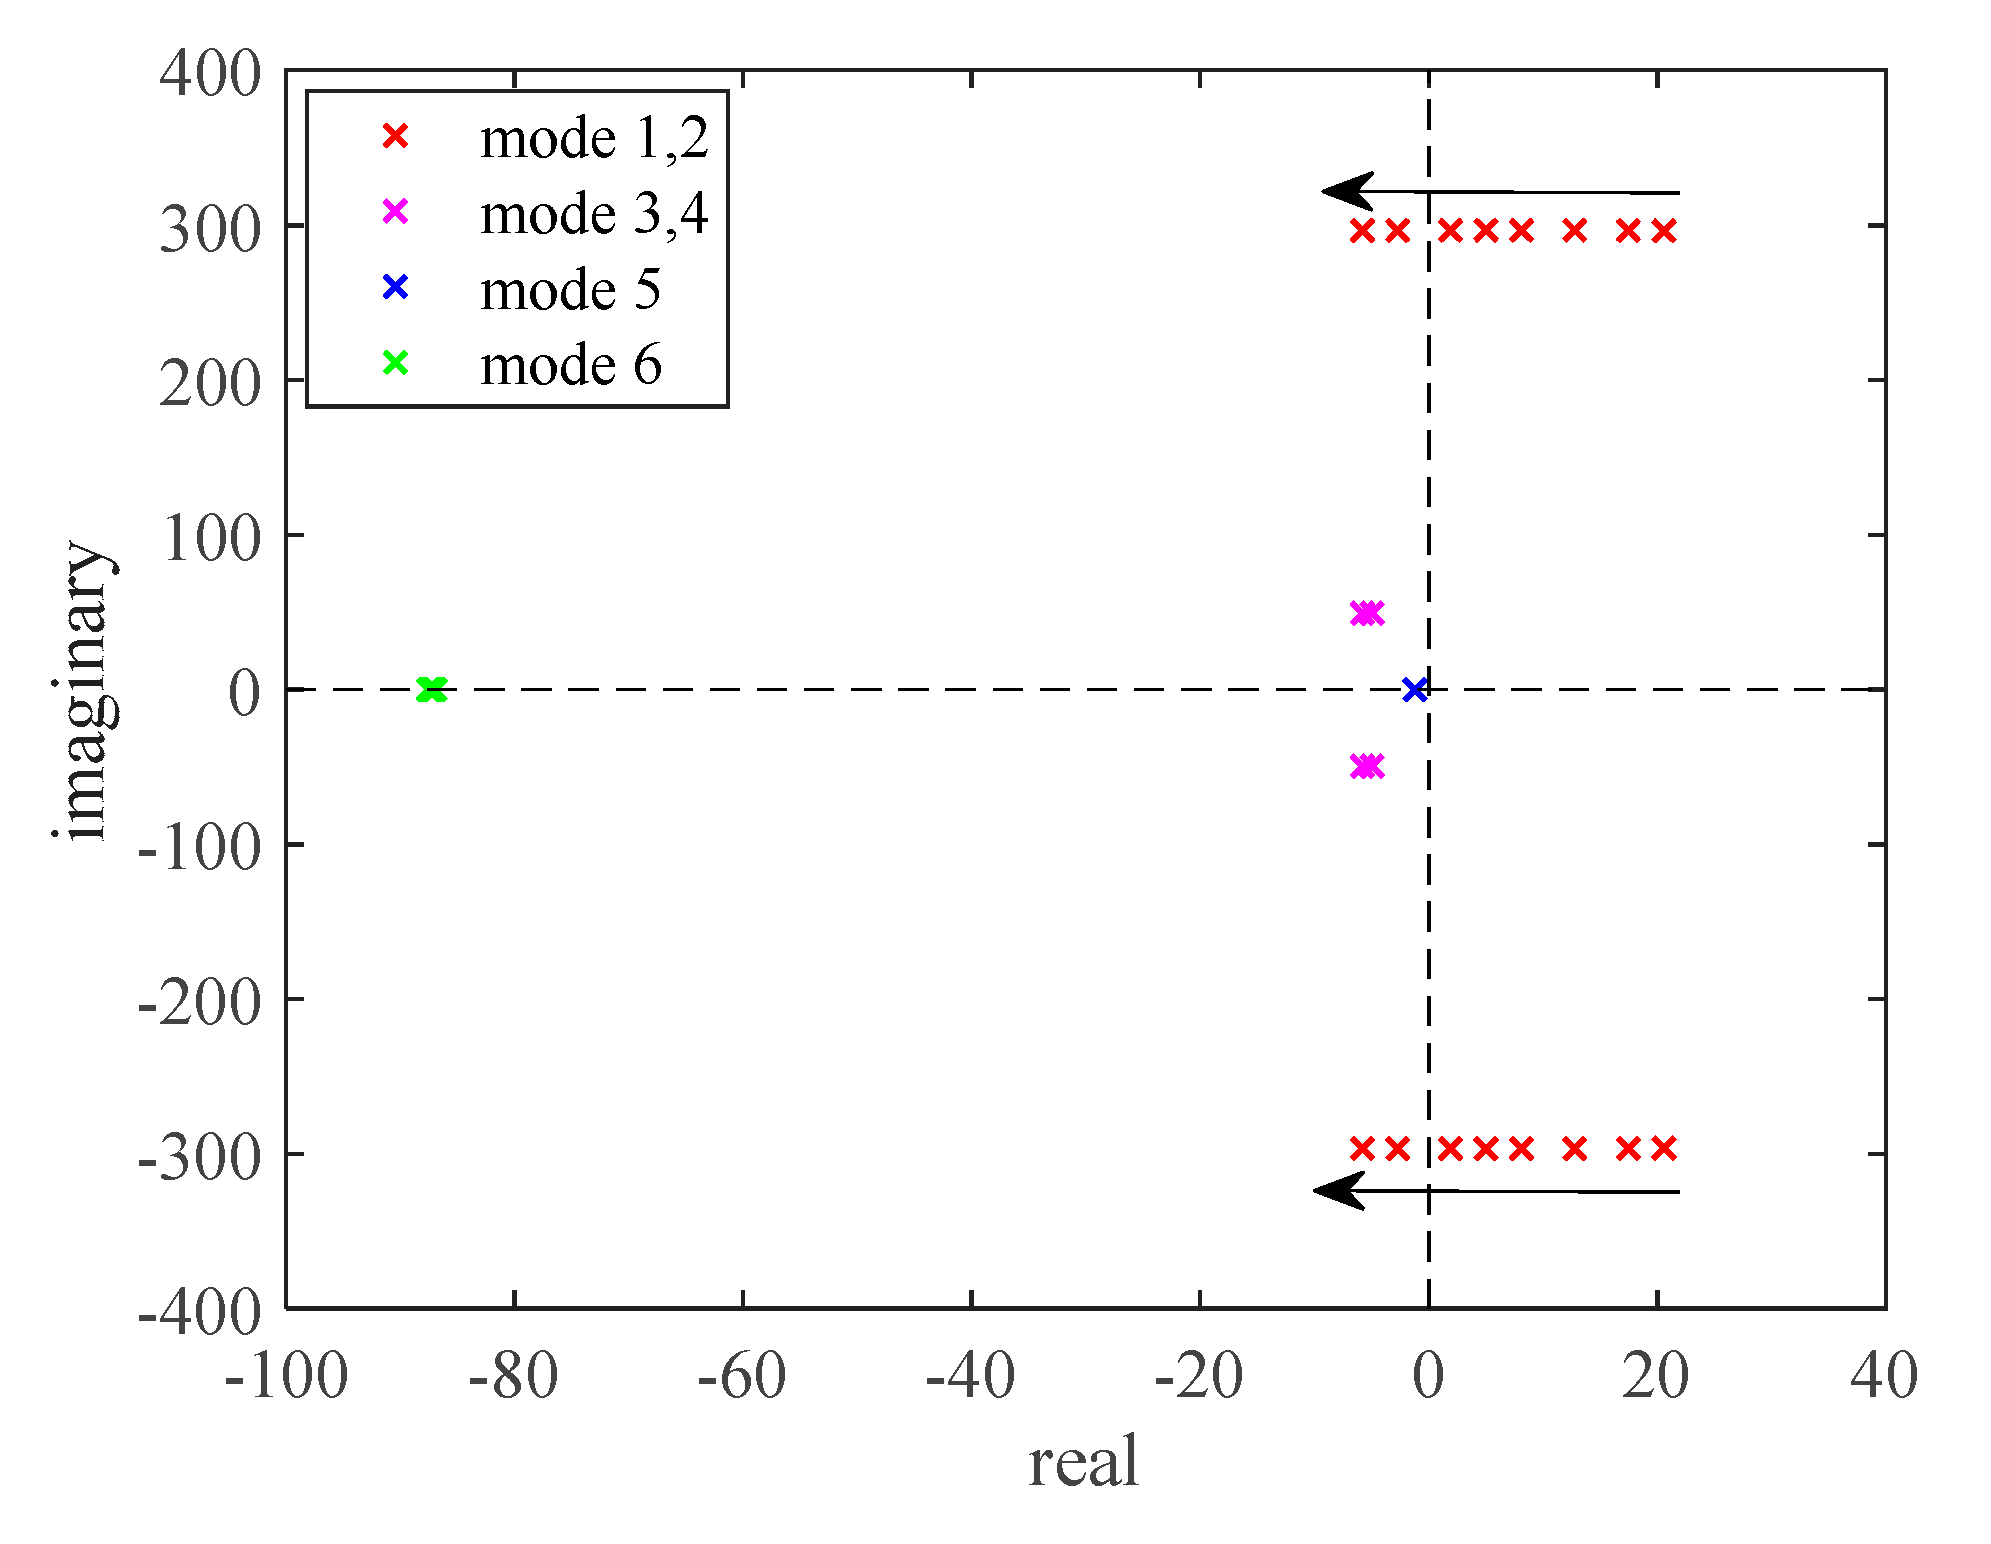
Figure 11 presents the system’s oscillatory modes for different
Kp2. As
Kp1 and
Kp2 increase, the oscillatory modes 1 and 2 gradually move to the left, then enter to the left-half panel, and the other oscillation modes hardly move. As seen from
Figure 10 and
Figure 11, the damping of the dominant oscillatory modes is sensitive to the
p1 and
Kp2, whereas the frequency of the dominant oscillatory modes is relatively insensitive.
4.2. The influence of Ki1 and Ki2
Setting
p=10, Ki=50, and keeping other parameters consistent with
Table 1.Then setting
Ki2=200 and increasing
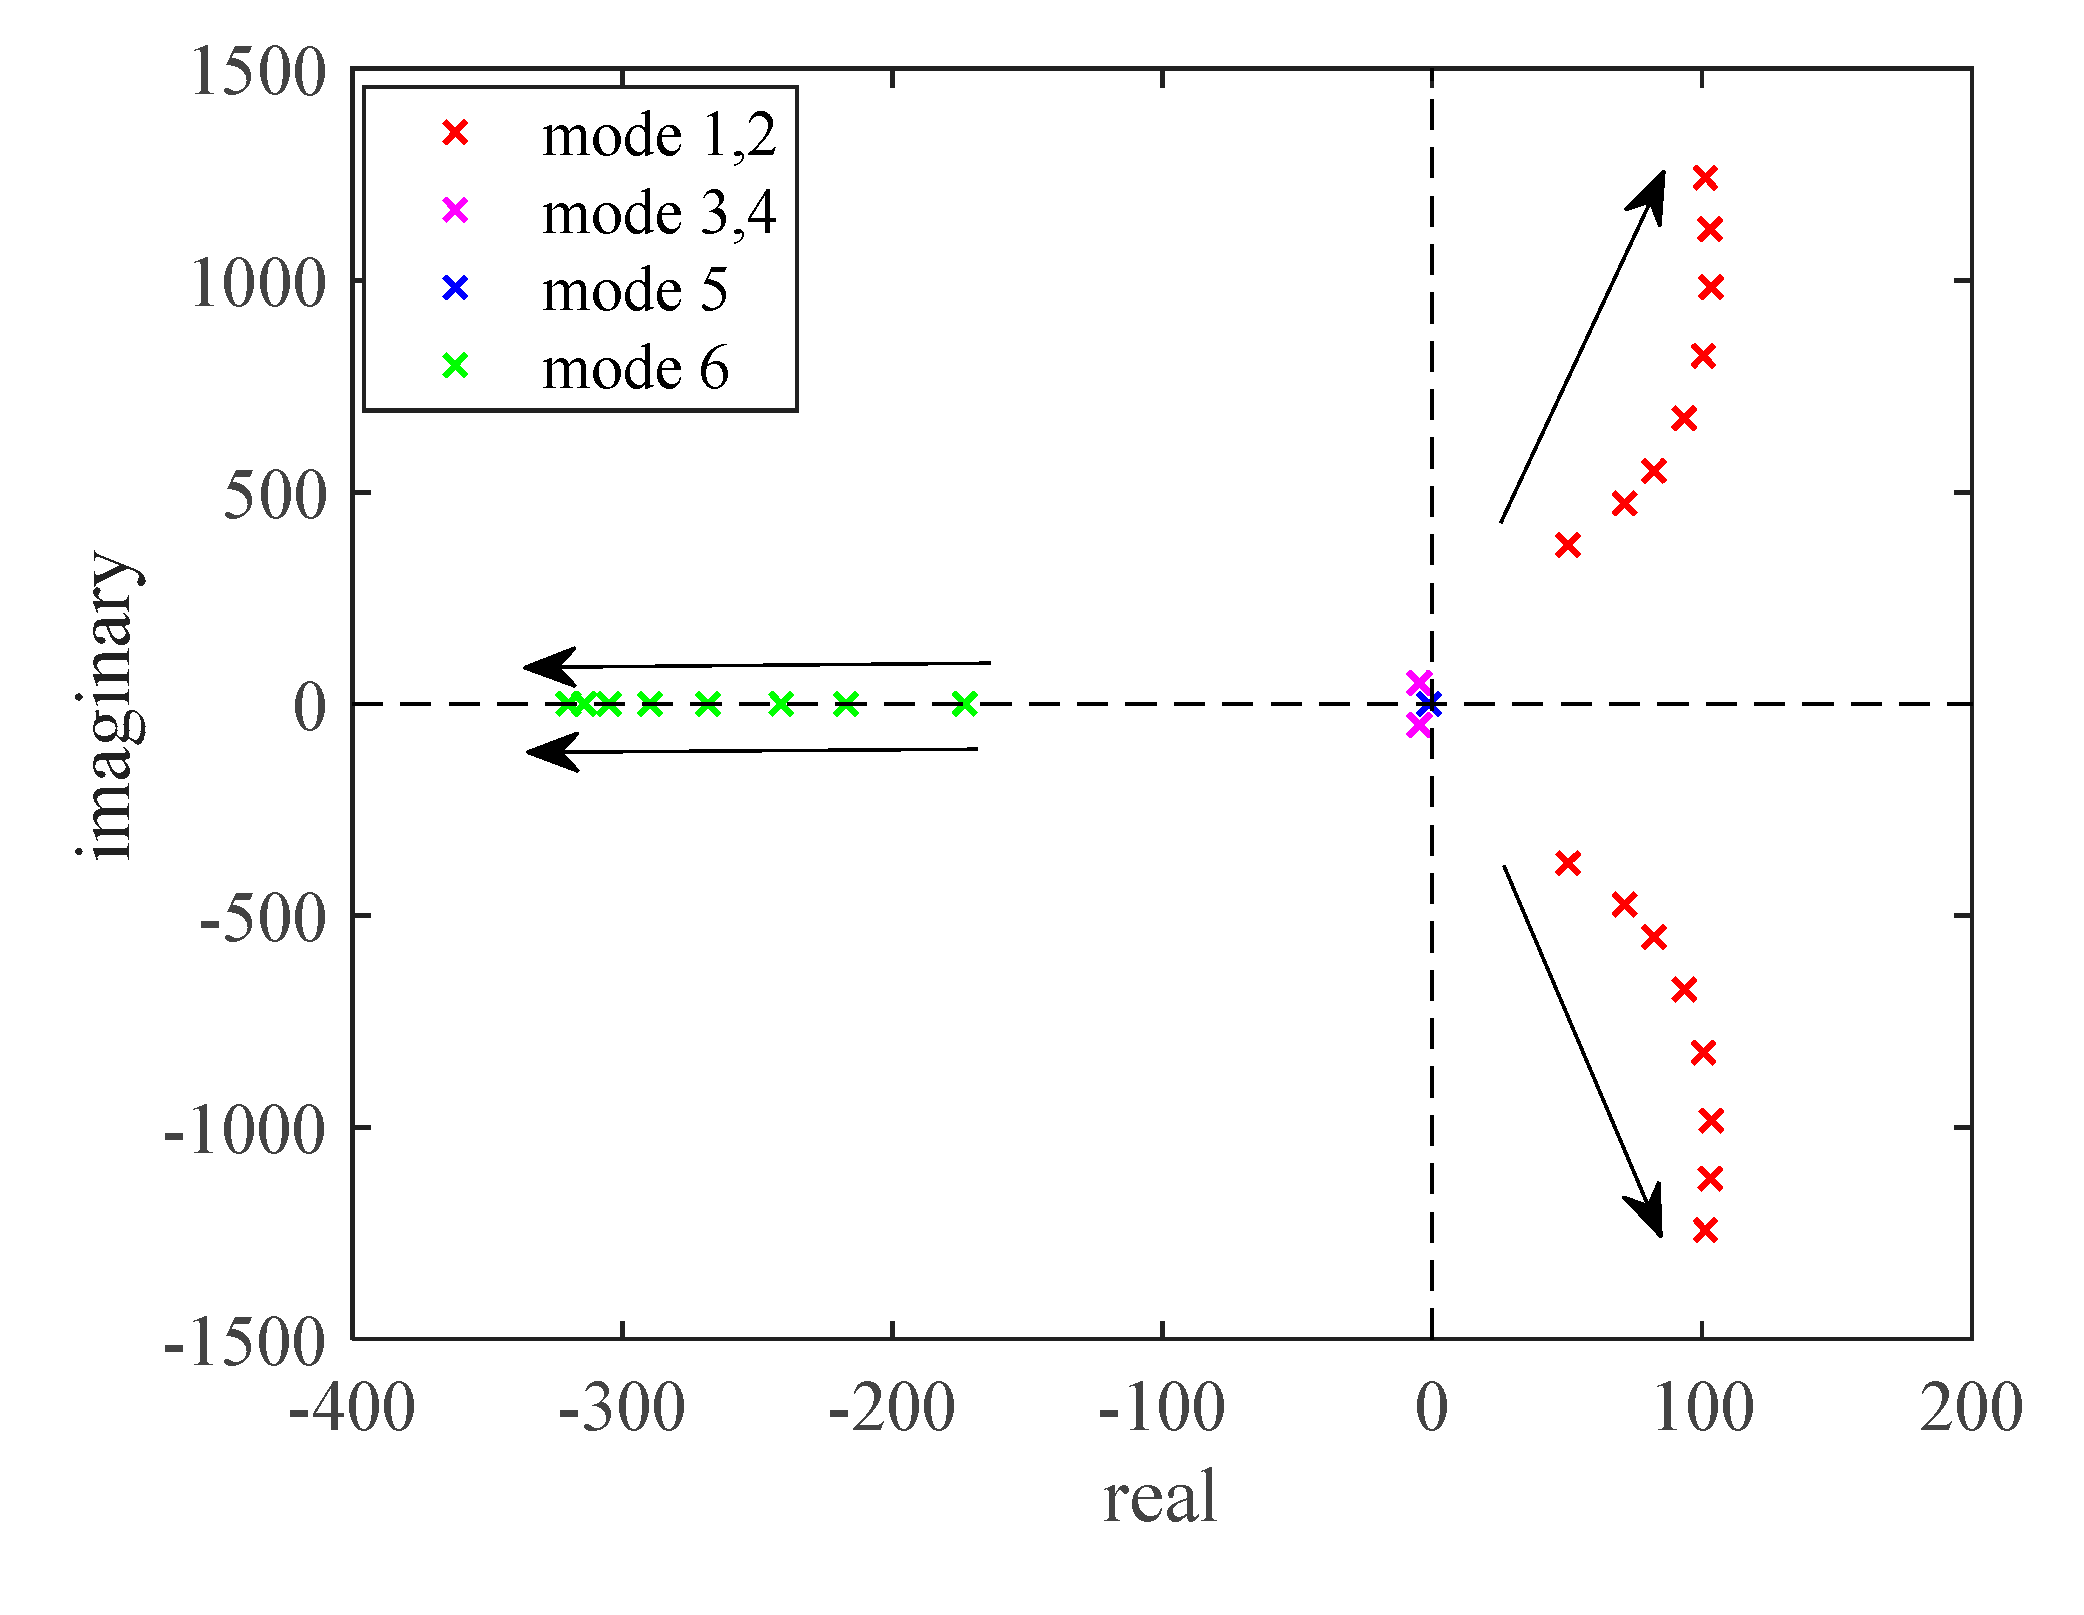
Ki1 from 10 to 200, and
Figure 12 shows the system’s oscillatory modes for different
Ki1. Similarly, setting
Ki1=200 and increasing
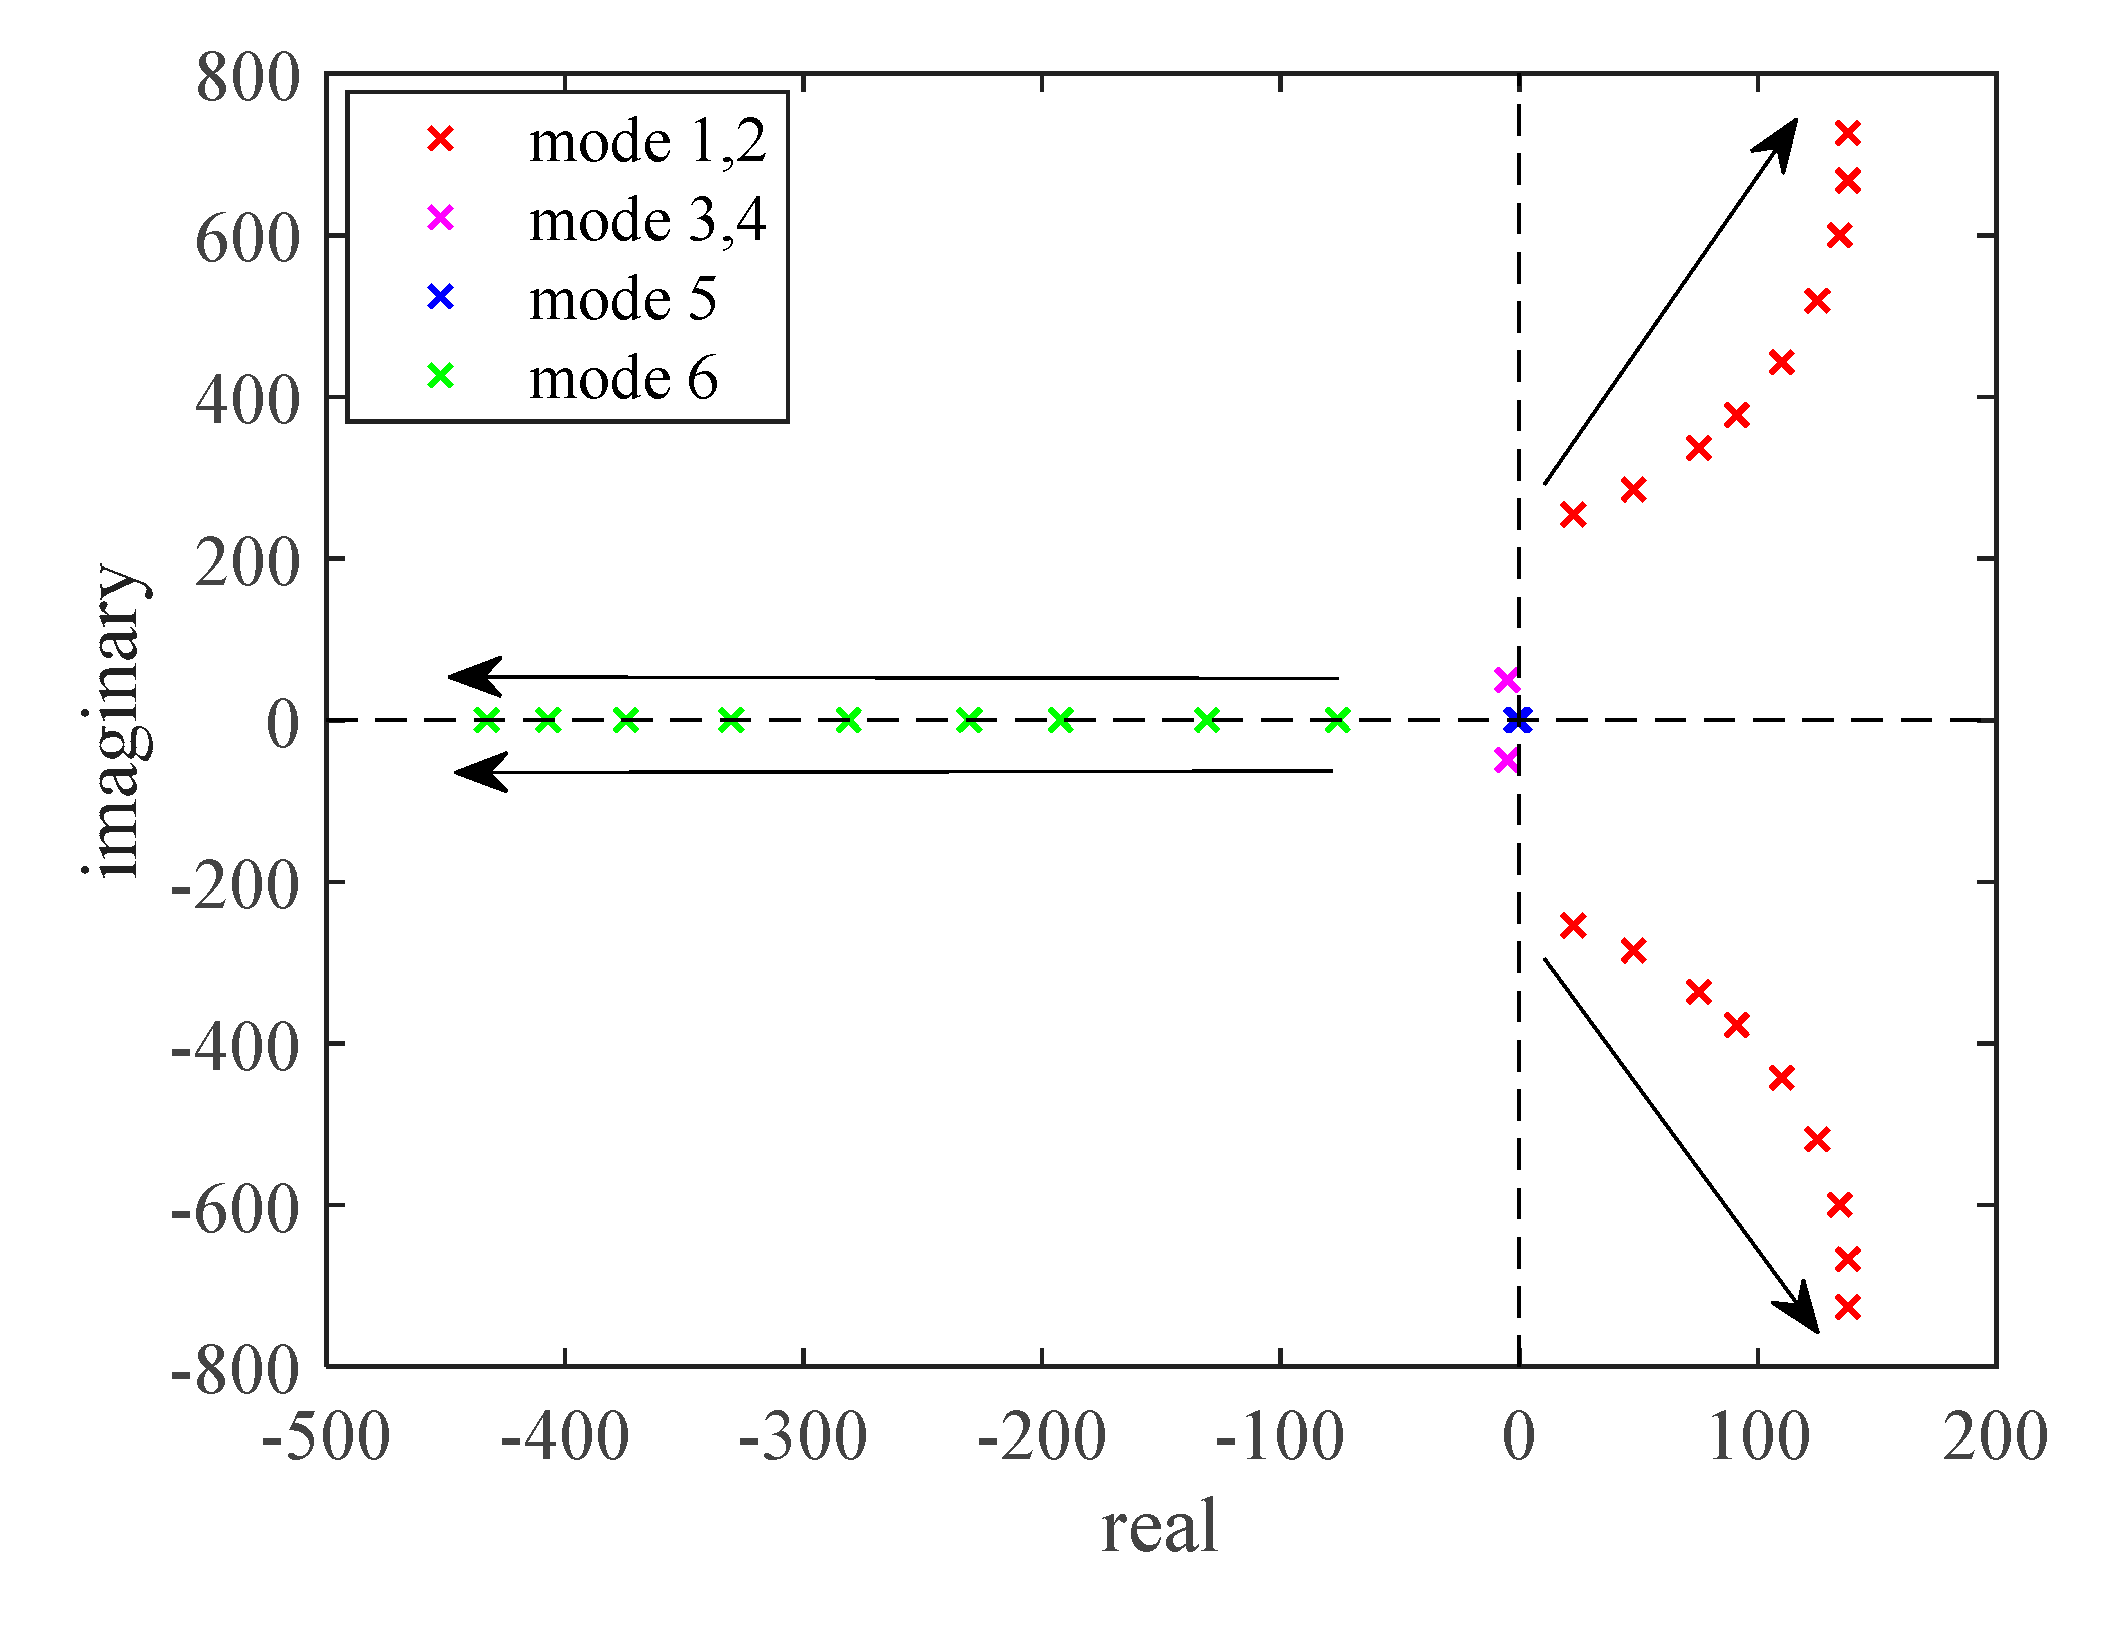
Ki2 from 10 to 200, and
Figure 13 presents the system’s oscillatory modes for different
Ki2. As
Ki1 and
Ki2 increase, the damping and oscillatory frequency of modes 1 and 2 gradually increase, mode 5 gradually moves to the left and the other oscillation modes hardly changes.
4.3. The influence of Kp3 and Ki3
Setting
Kp=10, Ki=50, Ki1=Ki2=20, and keeping other parameters consistent with
Table 1. Then setting
Ki3=5 and increasing
Kp3 from 5 to 200, and
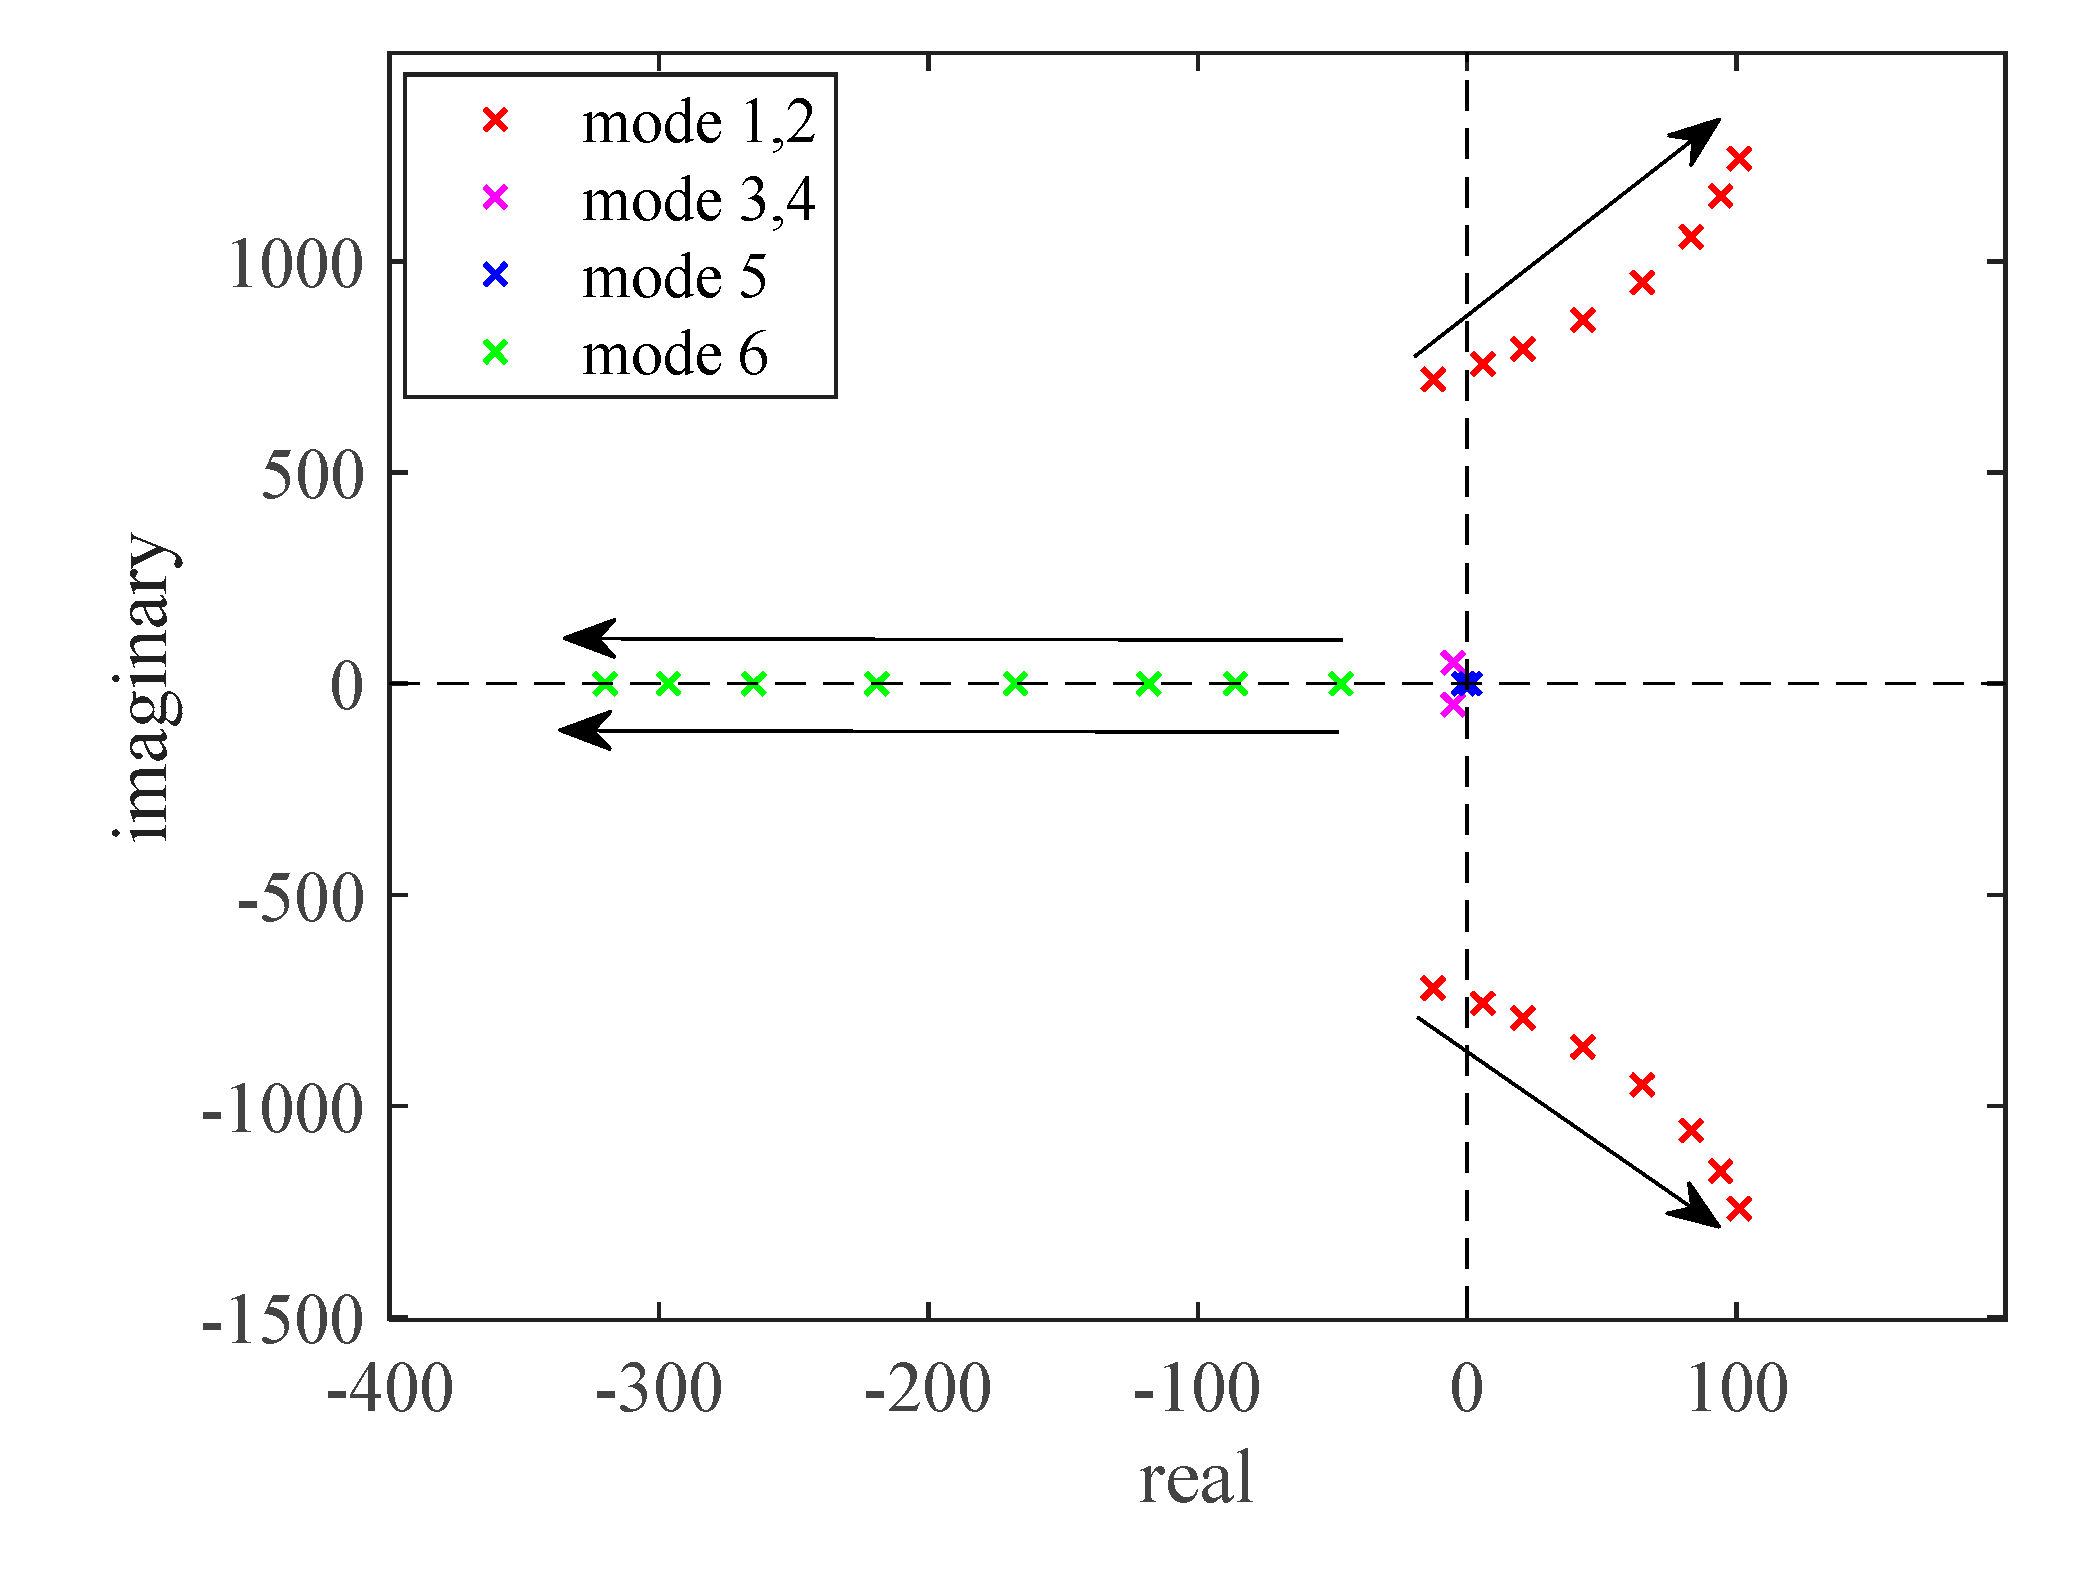
Figure 14 shows the system’s oscillatory modes for different
Kp3. Similar to the
Ki1 and
Ki2, the oscillatory frequency and damping of modes 1 and 2 increase, mode 4 gradually moves to the left and the other oscillation modes hardly change.
Kp3 has a significant impact on both the oscillatory damping and frequency of modes 1 and 2.
Setting
Kp=10, Ki=50, Ki1=Ki2=20, and keeping other parameters consistent with
Table 1. Then setting
Kp3=5 and increasing
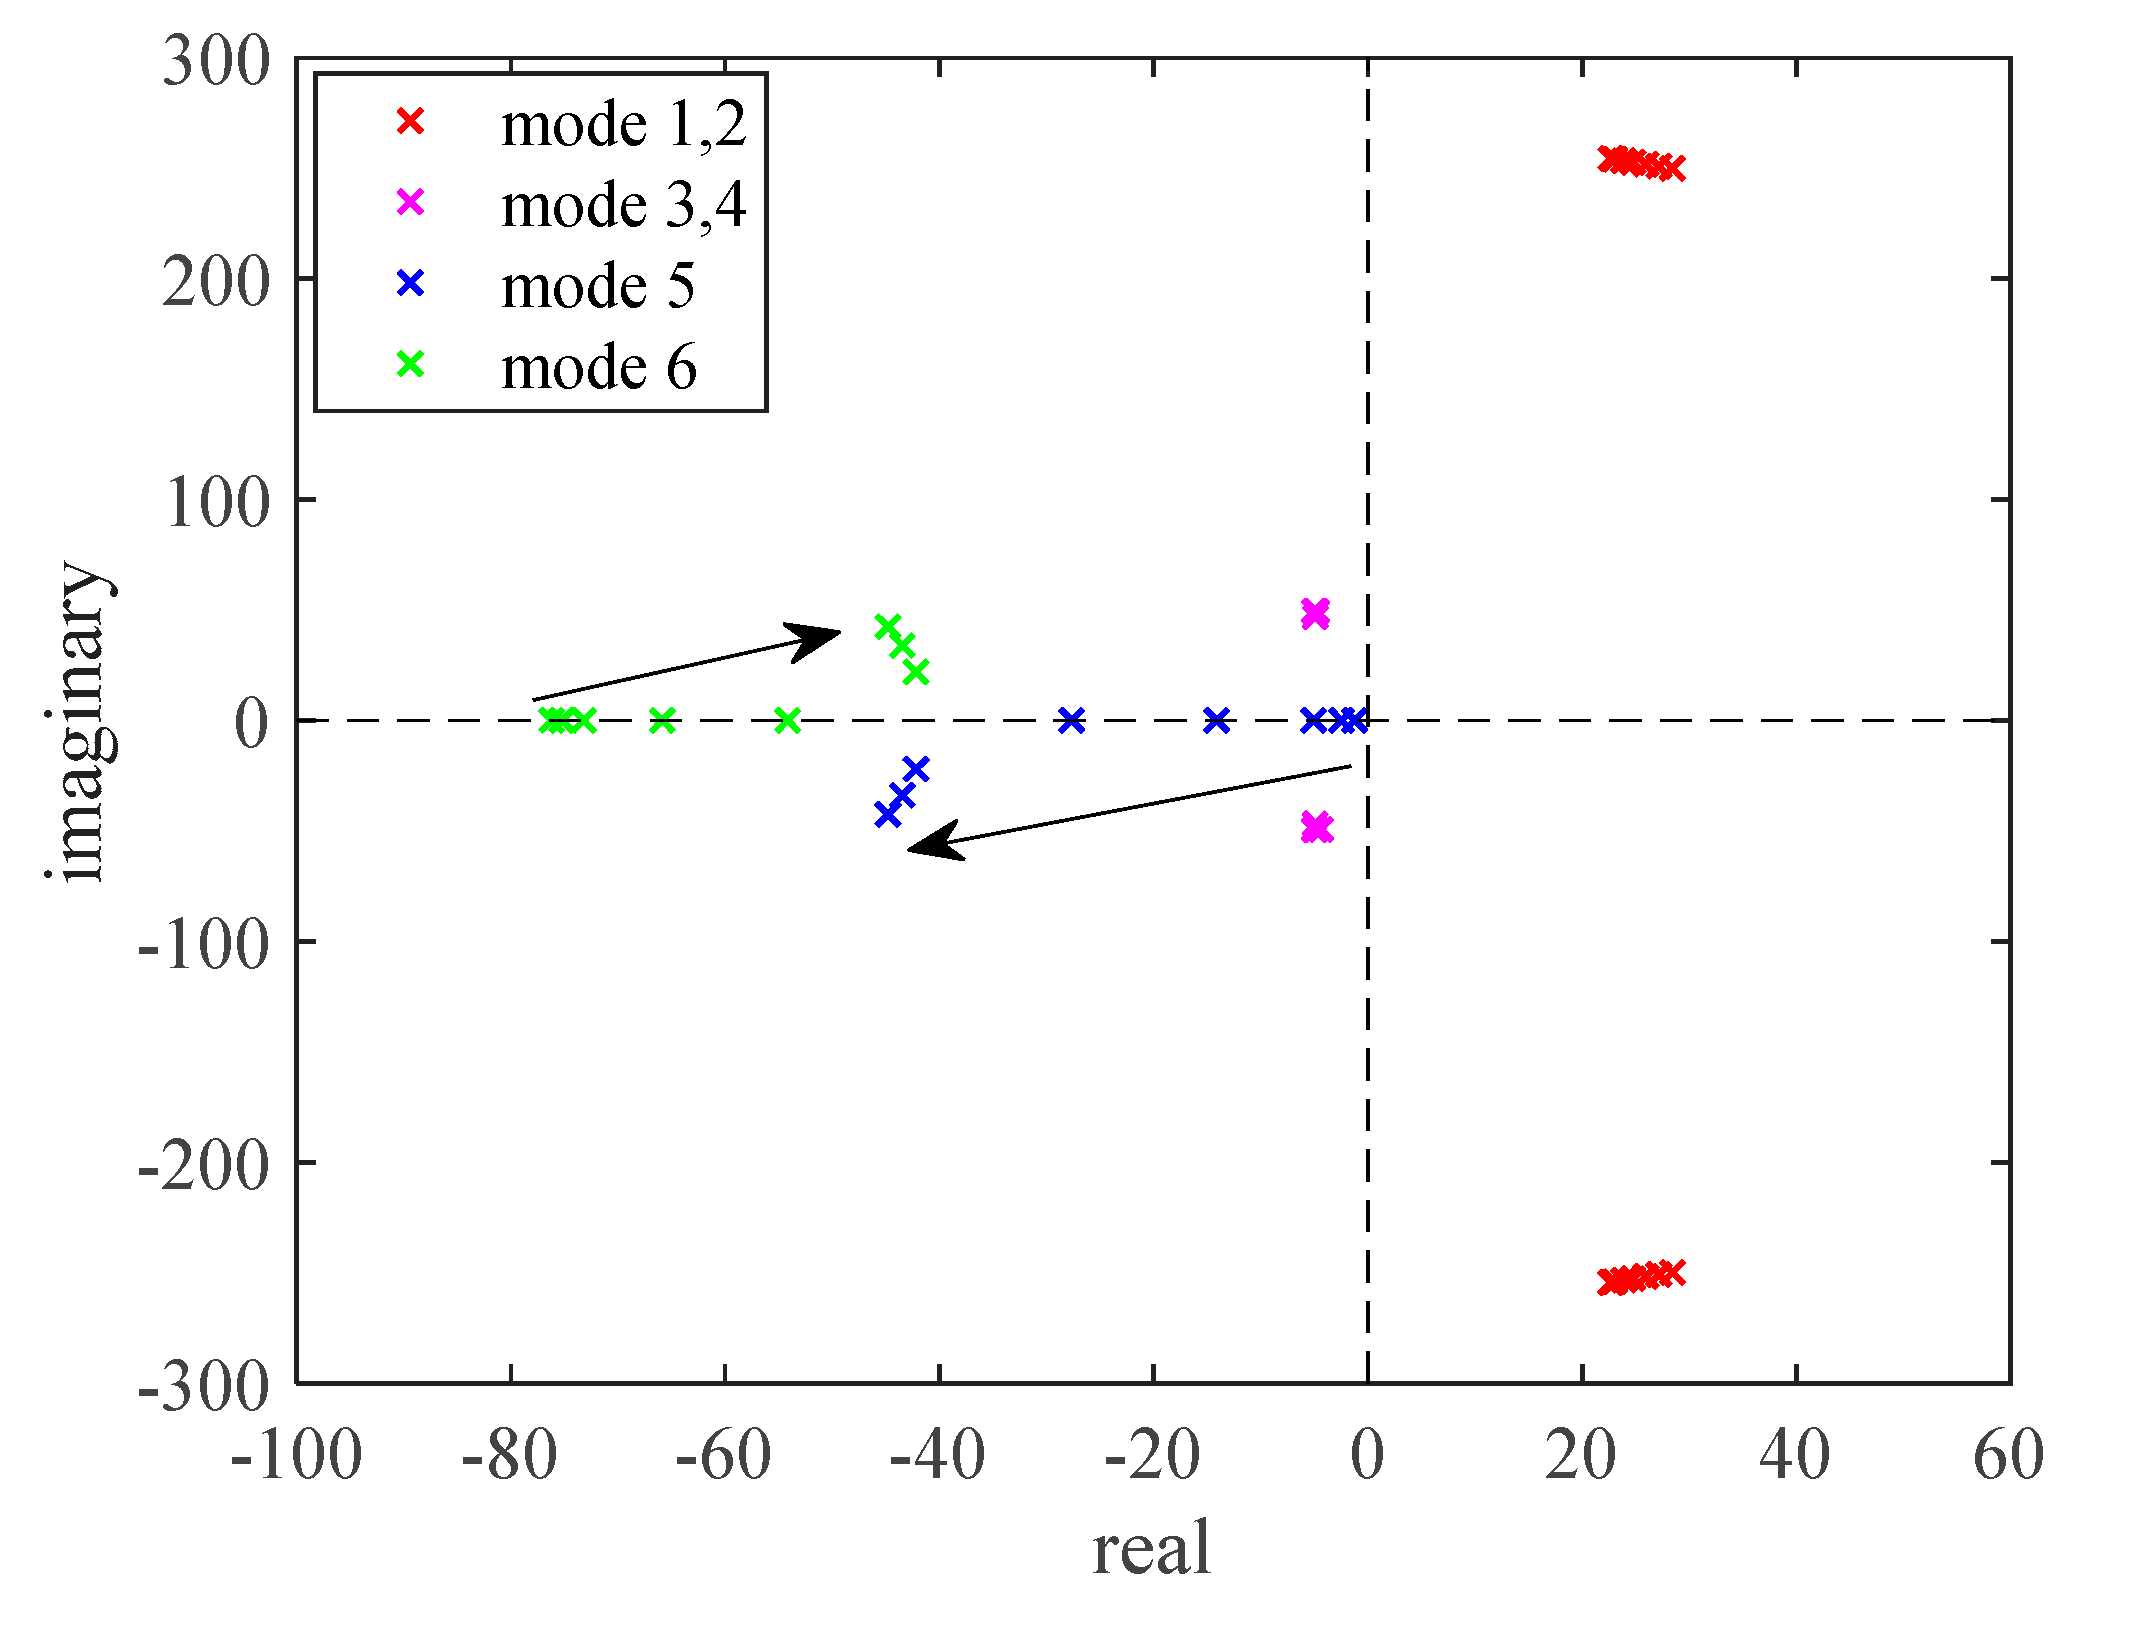
Ki3 from 5 to 200, and
Figure 15 shows the system’s oscillatory modes for different
Ki3. As seen from Figures 15, oscillatory modes 1, 2, 3 and 4 are insensitive to the
Ki3, As
increases, modes 5 and mode 6 become complex eigenvalues and occur in conjugate pairs.
4.4. The influence of the coefficients of the PLL
In this section, the influence of the coefficients of the control loop of the PLL,
i.e. Kp and
Ki is analyzed. For the three-phase PLL (SRF-PLL) based on the dq synchronous rotating coordinate transformation:
Here, represents the natural frequency of the PLL, and β represents the damping coefficient, which is taken as in this paper. Here, a basic structure of PLL is used, the setting of the
Kp and Ki were obtained from current research and engineering experience.
Setting
Ki1=Ki2=18,
Ki3=150, and keeping other parameters consistent with
Table 1, and changing
ωn from 18.4 to 42.4.
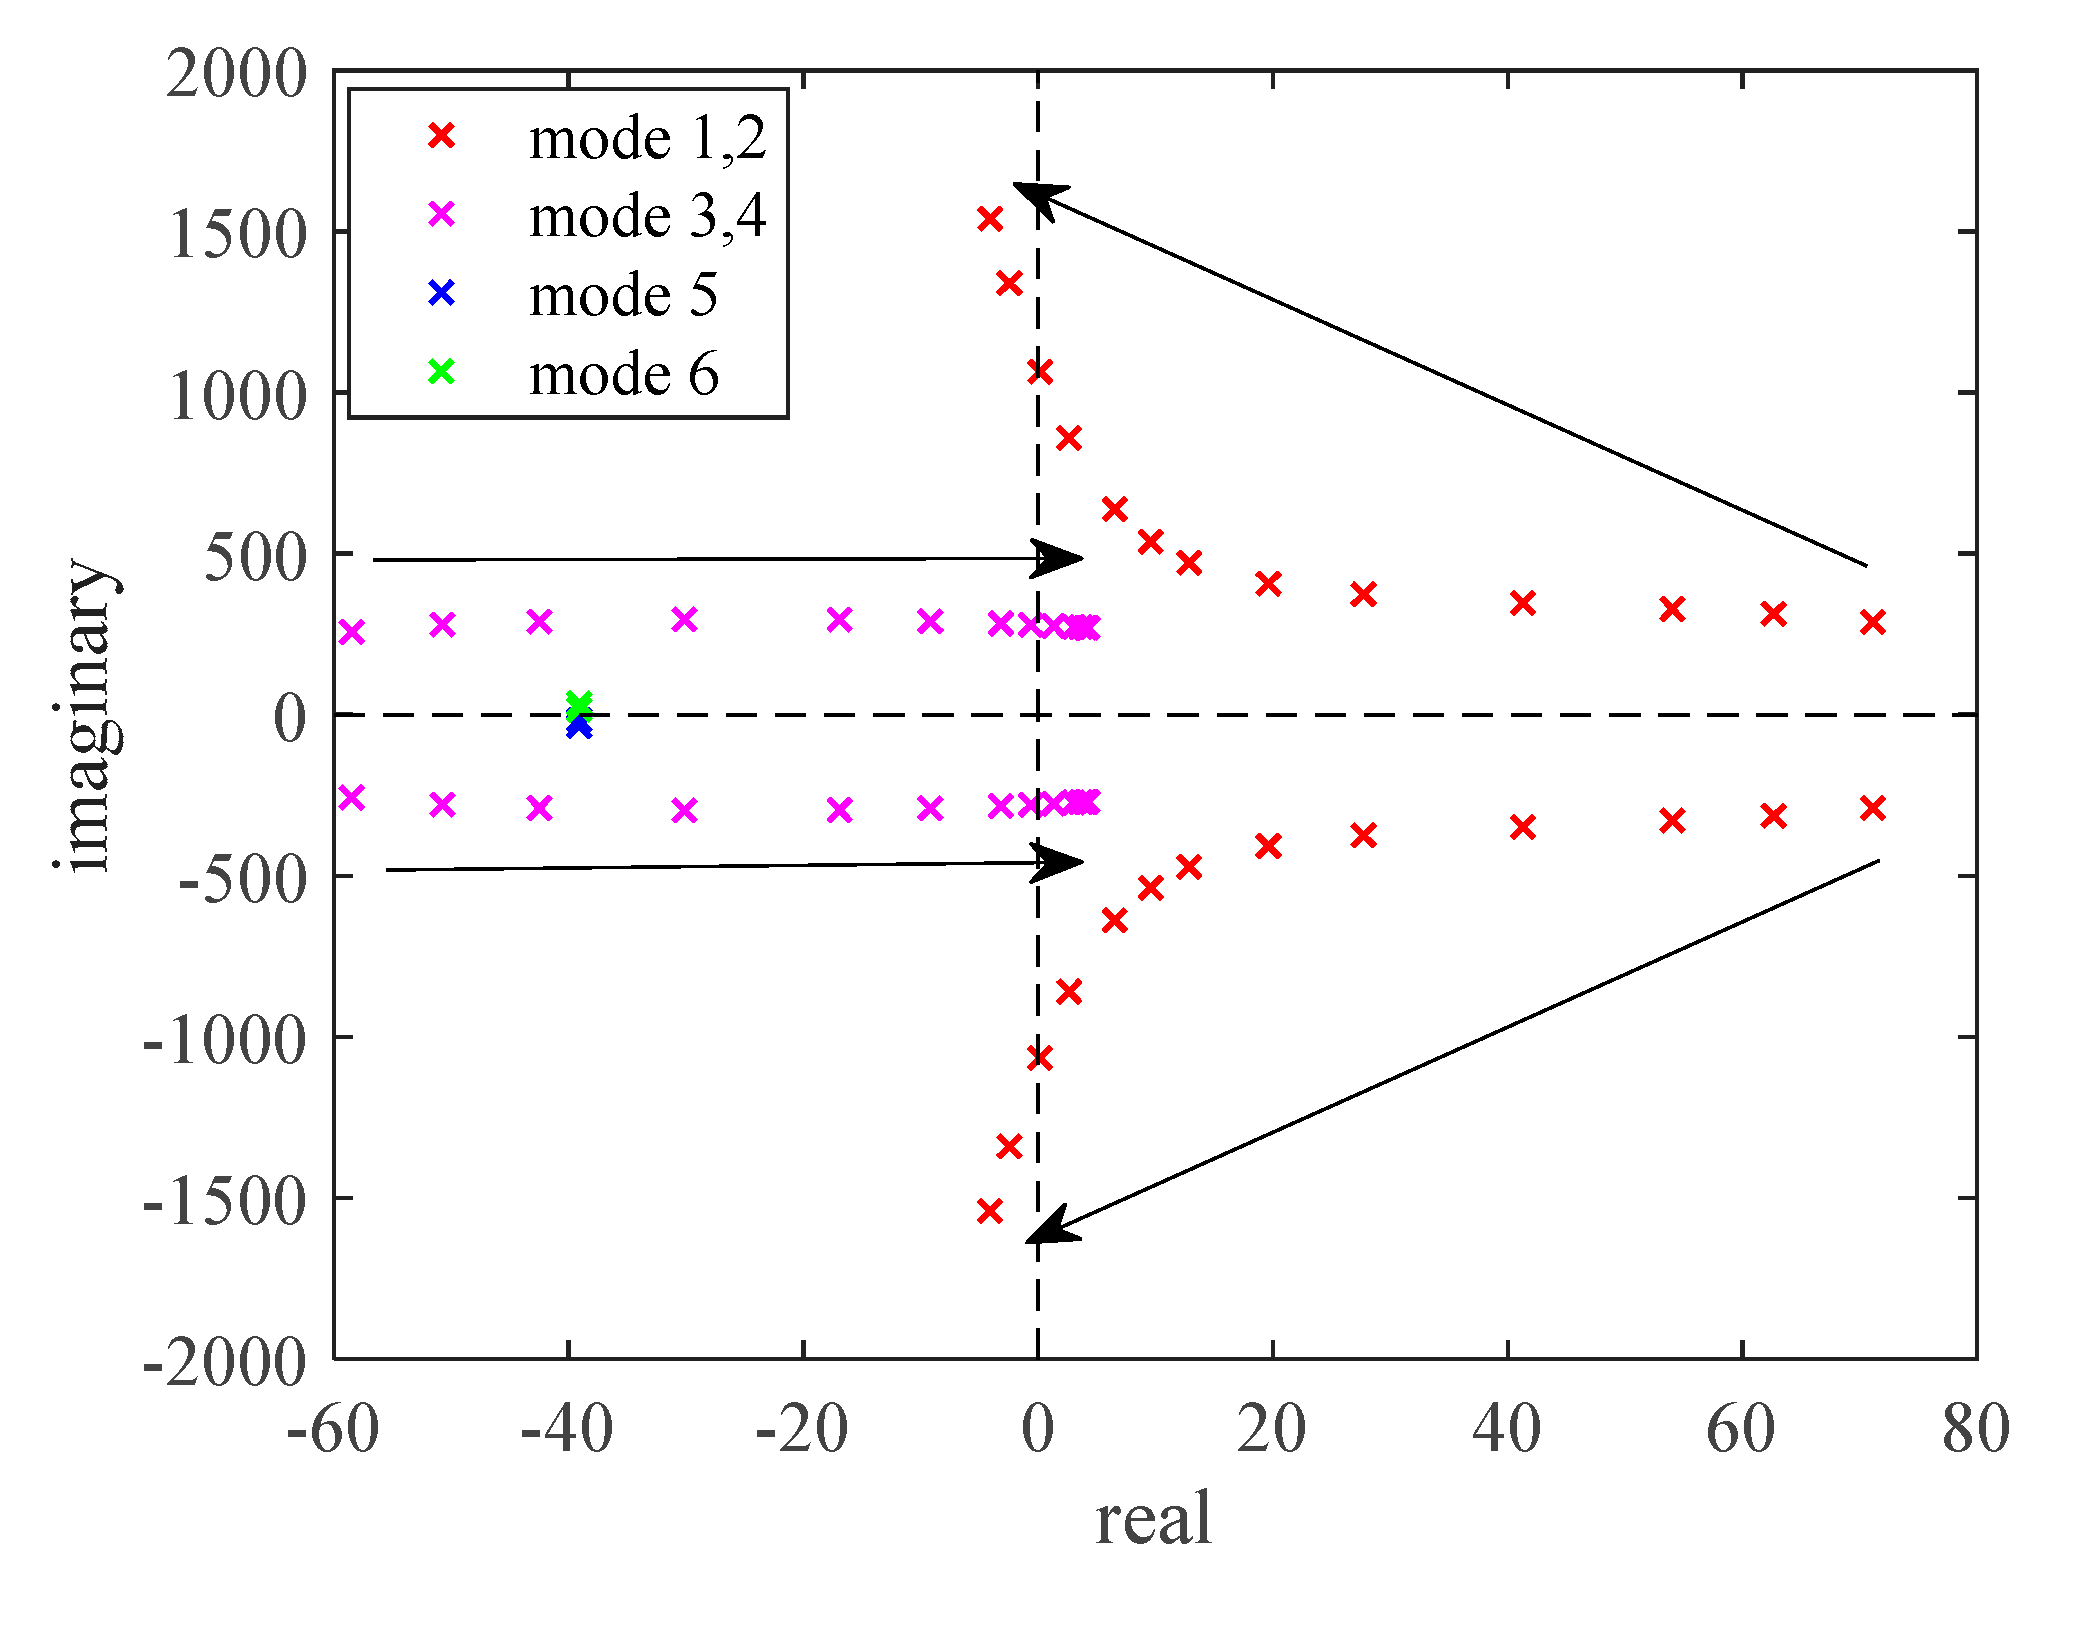
Figure 16 presents the system’s oscillatory modes for different
Kp and
Ki. As
Kp and
Ki increase, the oscillatory modes 1 and 2 move to the left, then enter to the left-half plane. Whereas, the oscillatory modes 3 and 4 move gradually to the right and enter to the right-half panel. The oscillatory modes 5 and 6 hardly change as
Kp and
Ki increases.
4.5. The influence of Lf and Lg
For the grid-connected VSC system in
Figure 4, the
Lf and
Lg are in series connection between the VSC inverter and the grid. Therefore, the values of
Lf and
Lg have the same impact on the stability of the system. Settinng
Kp=10, Ki=50, and keeping other parameters consistent with
Table 1.
Setting
mH and increasing
Lf from 9mH to 22.50mH, and
Figure 17 shows the system’s oscillatory modes for different
.Similarly,Setting
mH and increasing
from 6.37mH to 127.32mH,and
Figure 18 presents the system’s oscillatory modes for different
Lg. As
Lf and
Lg increase, the damping of modes 1 and 2 increase and the oscillatory frequency of modes 1 and 2 decrease. There is no significant changes in the other oscillatory modes.
5. Conclusions
This paper has developed a second-order impedance model of the grid connected VSC, which has mathematically proved the symmetry of the frequency spectrum of wideband oscillations in the VSC grid-connected system, and the physical essence of the characteristic equation of the system has been explained. In the end, the effects of the various parameters on the frequency spectrum were analyzed. The main conclusions are as follows:
- 1)
The influence of d-axis control loop
1.1) The proportional gains Kp1 and Kp2 of the d-axis control loop have a relatively small impact on the frequency of the dominant oscillatory modes, but mainly affect the damping factor. As Kp1 and Kp2 increase, the system stability is improved.
1.2) The integral gains Ki1 and Ki2 of the d-axis control loop have impacts on both the frequency and damping factor of the dominant oscillatory modes. When the larger Ki1 and Ki2 are used, the higher the oscillation frequency and the damping factor are obtained. The damping factor is more sensitive to Ki1, and the oscillatory frequency is more sensitive to Ki2.
- 2)
The influence of q-axis control loop
The proportional gain Kp3 of the q-axis control loop has a significant impact on the system dominant oscillatory modes. As Kp3 increases, both the oscillatory frequency and damping factor increases, which making the system more unstable. The q-axis integral gain Ki3 has a relatively small impact on dominant oscillatory modes. Whereas, modes 5 6 will appear in pairs as Ki3 increases.
- 3)
The influence of PLL control loop
The proportional gain Kp and integral gain Ki of the PLL has large influence on the two pairs of oscillatory modes. When Kp and Ki increases, one pair of oscillatory modes moved to the left, whereas another pairs of oscillatory modes move to the right of the panel.
- 4)
The influence of external grid
As Lf and Lg increase, the oscillatory frequency decreases, and damping factor increases. Lf represents a simplified filter inductance, which depends on the design of the filter circuit; whereas Lg represents the equivalent impedance of the external grid, which depend on the configuration and operational modes of the external grid.
References
- Hu Jiabing, Wang Bo, Wang Weisheng,et al. Small signal dynamics of DFIG-based wind turbines during riding through symmetrical faults in weak AC grid. IEEE Transactions on Energy Conversion 2017, 32, 720-730.
- Song Yipeng, Frede Blaabjerg, Overview of DFIG-based wind power system resonances under weak networks. IEEE Transactions on Power Electronics 2017, 32, 4370-4394.
- Song Yipeng, Wang Xiongfei, Frede Blaabjerg, Impedance-based high-frequency resonance analysis of DFIG system in weak grids. IEEE Transactions on Power Electronics 2017, 32, 3536-3548.
- Liu Huakun, Xie Xiaorong, He Jingbo, et al . Subsynchronous interaction between direct-drive PMSG based wind farms and weak AC networks. IEEE Transactions on Power Systems 2017, 32, 4708-4720.
- BODIN A.HVDC Light® -a preferable power transmission system for renewable energies[C]//Proceedings of the 2011 3rd International Youth Conference on Energetics (IYCE).Leiria,Portugal,2011, 1-4.
- CHI Yongning,TANG Bingjie,HU Jiabing,et al.Overview of mechanism and mitigation measures on multi-frequency oscillation caused by large-scale integration of wind power[J].CSEE Journal of Power and Energy Systems,2019,5(4), 433-443.
- YIN Congqi,XIE Xiaorong,LIU Hui,et al.Analysis and control of the oscillation phenomenon in VSC-HVDC transmission system[J].Power System Technology,2018, 42(4), 1117-1123.
- WANG Weisheng,ZHANG Chong,HE Guoqing,et al. Overview of research on subsynchronous oscillations in large-scale wind farm integrated system[J].Power System Technology,2017,41(4), 1050-1060.
- DONG Xiaoliang,TIAN Xu,ZHANG Yong,et al. Practical SSR incidence and influencing factor analysis of DFIG-based series-compensated transmission system in Guyuan farms[J].High Voltage Engineering,2017,43(1), 321-328.
- BIAN Xiaoyan,SHI Lei,ZONG Xiuhong,et al.Analysis and mitigation of wind turbine converters in subsynchronous interaction under multi-operating conditions [J].Transactions of China Electrotechnical Society,2017, 32(11), 38-47.
- SHEN Yangwu, GE Yunxia, CUI Ting, et al. A stability analysis method for the gird-connected permanent magnet synchronous generator based on impedance ratio criterions[J]. Power System Protection and Control, 2017, 45, 45-53.
- WU Heng,RUAN Xinbo,YANG Dongsheng.Research on the stability caused by phase-locked loop for LCL-type grid-connected inverter in weak grid condition[J] . Proceedings of the CSEE,2014,34(30), 5259-5268.
- NIAN Heng,YANG Hongyu.Impedance modeling and stability analysis of grid-connected inverters under unbalanced operation conditions[J] . Automation of Electric Power Systems,2016,40(10), 76-83.
- Wang Yuncheng,Chen Xin,Zhang Yang,et al.Frequency characteristics analysis and stability research of phase locked loop for three-phase grid-connected inverters[J]. Proceedings of the CSEE,2017,37(13), 3843-3853.
- WANG Shike,LIU Zeng,LIU Jinjun,et al.Small-signal modeling and stability prediction of parallel droopcontrolled inverters based on terminal characteristics of individual inverters[J] . IEEE Transactions on Power Electronics,2020,35(1), 1045-1063.
- WEN Bo,BURGOS R,BOROYEVICH D,et al.AC stability analysis and dq frame impedance specifications in power-electronics-based distributed power systems 3584 [J].IEEE Journal of Emerging and Selected Topics in Power Electronics,2017,5(4), 1455-1465.
- Wang Hui,Li Ying,Li Wenfeng,et al.Mechanism research of subsynchronous and supersynchronous oscillations caused by compound current loop of grid-connected inverter[J].Power System Technology, 2017,41(4), 1061-1067.
- ZHAO Jinghan , YU Miao , LIU Jianing , et al . Decentralized impedance criteria for stability analysis of multi-converter AC microgrid[J]. Proceedings of the CSEE,2021,41(10), 3575-3584.
- ZHOU Peipeng,LI Guangfan,SONG Ruihua,et al. Subsynchronous oscillation characteristics and interactions of direct drive permanent magnet synchronous generator and static var generator[J].Proceedings of the CSEE,2018,38(15), 4369-4378.
Figure 1.
Typical control block diagram of a VSC circuit.
Figure 1.
Typical control block diagram of a VSC circuit.
Figure 2.
The structure diagram of the VSC grid-connected system.
Figure 2.
The structure diagram of the VSC grid-connected system.
Figure 3.
Control block diagram of a typical PLL.
Figure 3.
Control block diagram of a typical PLL.
Figure 4.
A simplified grid-connected VSC test system l.
Figure 4.
A simplified grid-connected VSC test system l.
Figure 5.
The oscillatory modes in the grid-connected VSC test system.
Figure 5.
The oscillatory modes in the grid-connected VSC test system.
Figure 6.
The oscillatory active power at PCC point.
Figure 6.
The oscillatory active power at PCC point.
Figure 7.
The FFT frequency analysis result of the active power at the PCC point.
Figure 7.
The FFT frequency analysis result of the active power at the PCC point.
Figure 8.
(a) The simulation waveform of A phase current at PCC point.; (b) The FFT frequency analysis result of the A phase current at the PCC point.
Figure 8.
(a) The simulation waveform of A phase current at PCC point.; (b) The FFT frequency analysis result of the A phase current at the PCC point.
Figure 9.
(a) The simulation waveform of A phase voltage at PCC point.; (b) The FFT frequency analysis result of the A phase voltage at the PCC point.
Figure 9.
(a) The simulation waveform of A phase voltage at PCC point.; (b) The FFT frequency analysis result of the A phase voltage at the PCC point.
Figure 10.
Oscillatory modes versus different Kp1.
Figure 10.
Oscillatory modes versus different Kp1.
Figure 11.
Oscillatory modes versus different Kp2.
Figure 11.
Oscillatory modes versus different Kp2.
Figure 12.
Oscillatory modes versus different Ki1.
Figure 12.
Oscillatory modes versus different Ki1.
Figure 13.
Oscillatory modes versus different Ki2.
Figure 13.
Oscillatory modes versus different Ki2.
Figure 14.
Oscillatory modes versus different Kp3.
Figure 14.
Oscillatory modes versus different Kp3.
Figure 15.
Oscillatory modes versus different Ki3.
Figure 15.
Oscillatory modes versus different Ki3.
Figure 16.
Oscillatory modes versus different Kp and Ki.
Figure 16.
Oscillatory modes versus different Kp and Ki.
Figure 17.
Oscillatory modes versus different Lf.
Figure 17.
Oscillatory modes versus different Lf.
Figure 18.
Oscillatory modes versus different Lg.
Figure 18.
Oscillatory modes versus different Lg.
Table 1.
Parameter table for the grid-connected VSC test system.
Table 1.
Parameter table for the grid-connected VSC test system.
| Parameters |
Numeric value |
| Proportional gain of the outer loop |
0.01 |
| Integral gain of the outer loop |
10 |
| Proportional gain of the inner loop d-axis |
0.01 |
| Integral gain of inner d-axis loop |
10 |
| Proportional gain of the inner loop q-axis |
5 |
| Integral gain of inner q-axis loop |
5 |
| Phase-locked loop proportional parameter |
30 |
| Phase-locked loop integral parameter |
500 |
| DC-side capacitance C/mF |
3 |
| Grid-side inductance |
31.83099 |
| Rated power of VSC/MW |
5 |
| DC-side voltage /KV |
1.5 |
| The filter inductor Lf of VSC/mH |
15 |
Table 2.
The eigenvalues in the grid-connected VSC test system.
Table 2.
The eigenvalues in the grid-connected VSC test system.
| No of oscillatory mode |
Real parts of the eigenvalues(1/s) |
Imaginary part of eigenvalues (Hz) |
| 1,2 |
11.360662 |
±66.6547 |
| 3,4 |
-14.761669 |
±31.4314 |
| 5 |
-43.963275 |
0 |
| 6 |
-1.221247 |
0 |
|
Disclaimer/Publisher’s Note: The statements, opinions and data contained in all publications are solely those of the individual author(s) and contributor(s) and not of MDPI and/or the editor(s). MDPI and/or the editor(s) disclaim responsibility for any injury to people or property resulting from any ideas, methods, instructions or products referred to in the content. |
© 2023 by the authors. Licensee MDPI, Basel, Switzerland. This article is an open access article distributed under the terms and conditions of the Creative Commons Attribution (CC BY) license (http://creativecommons.org/licenses/by/4.0/).
