Submitted:
19 April 2023
Posted:
20 April 2023
You are already at the latest version
Abstract
Keywords:
Introduction
Materials and Methods
Results
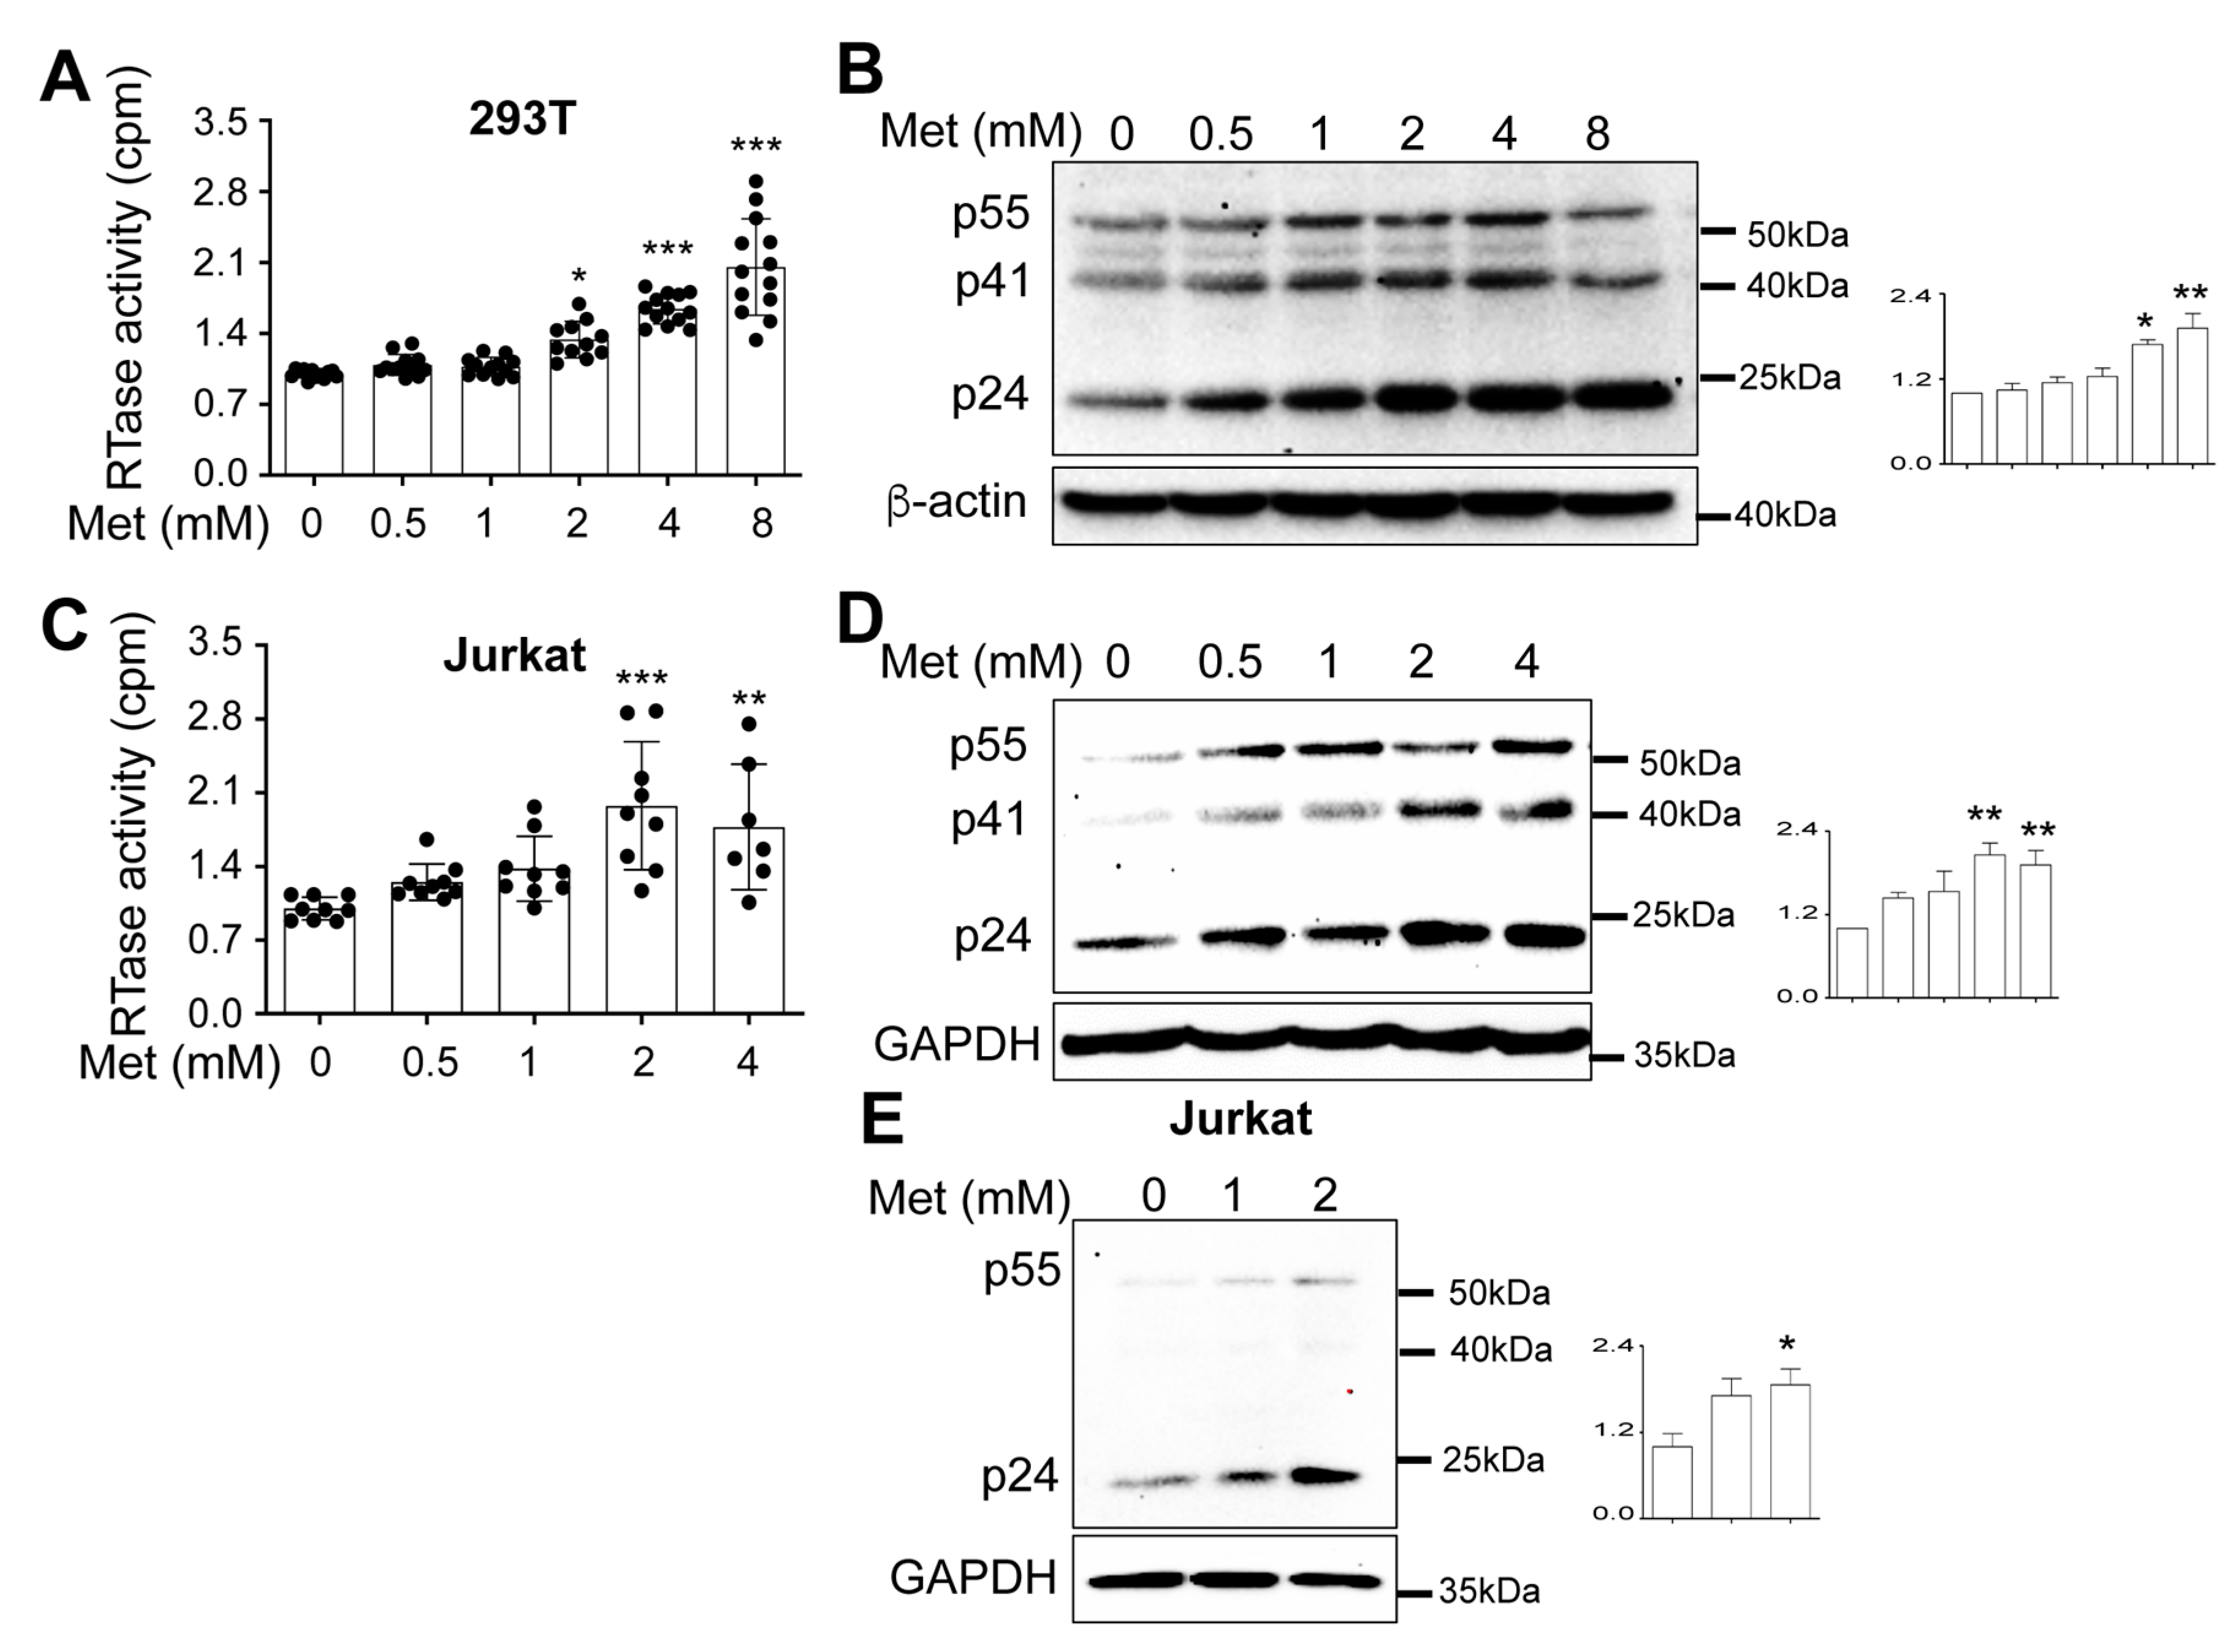
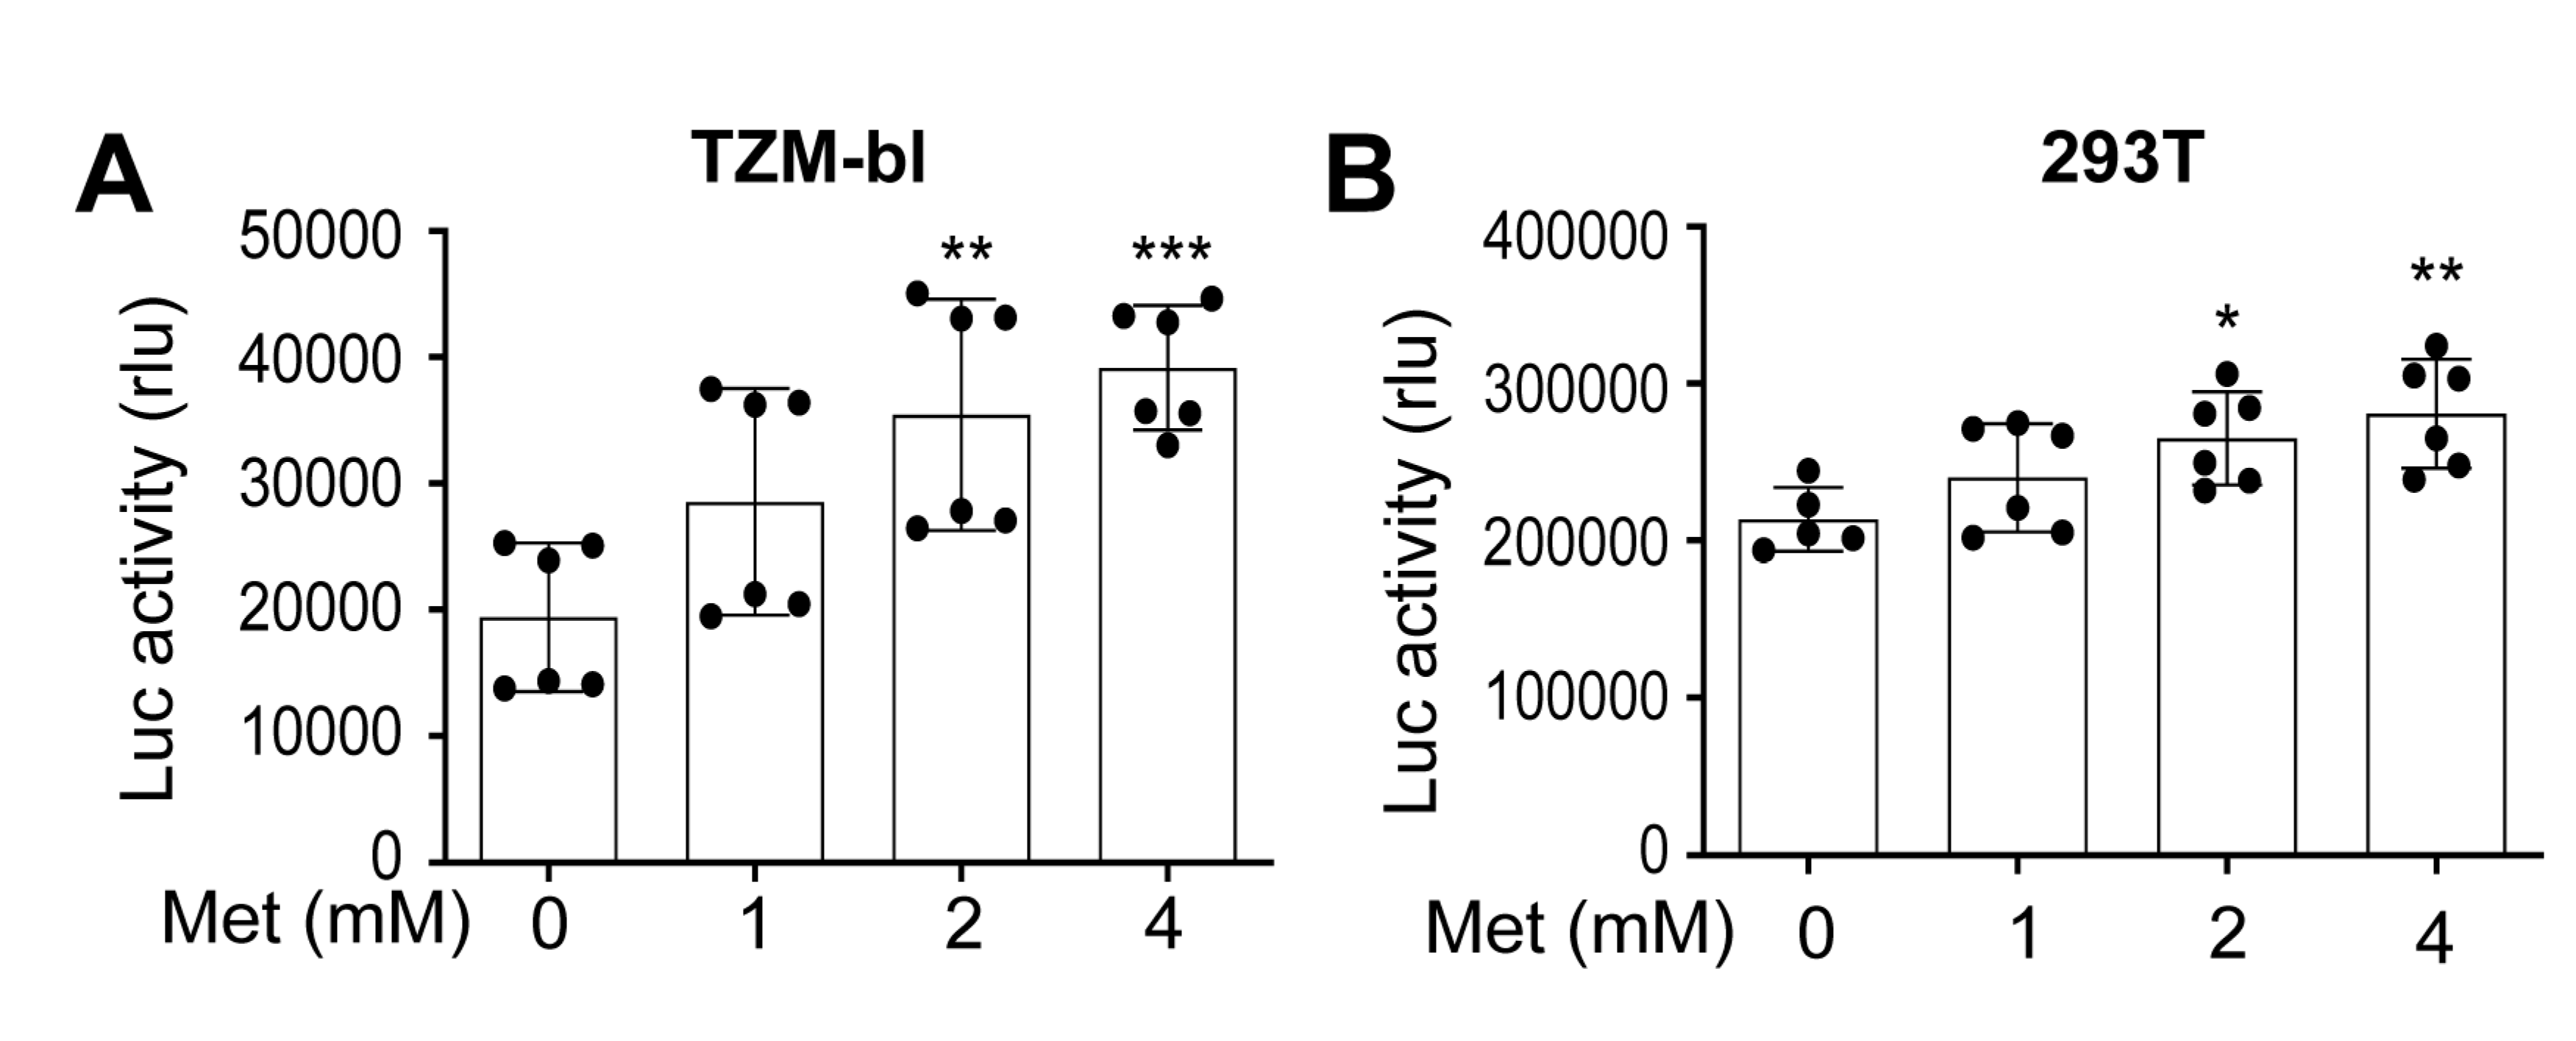
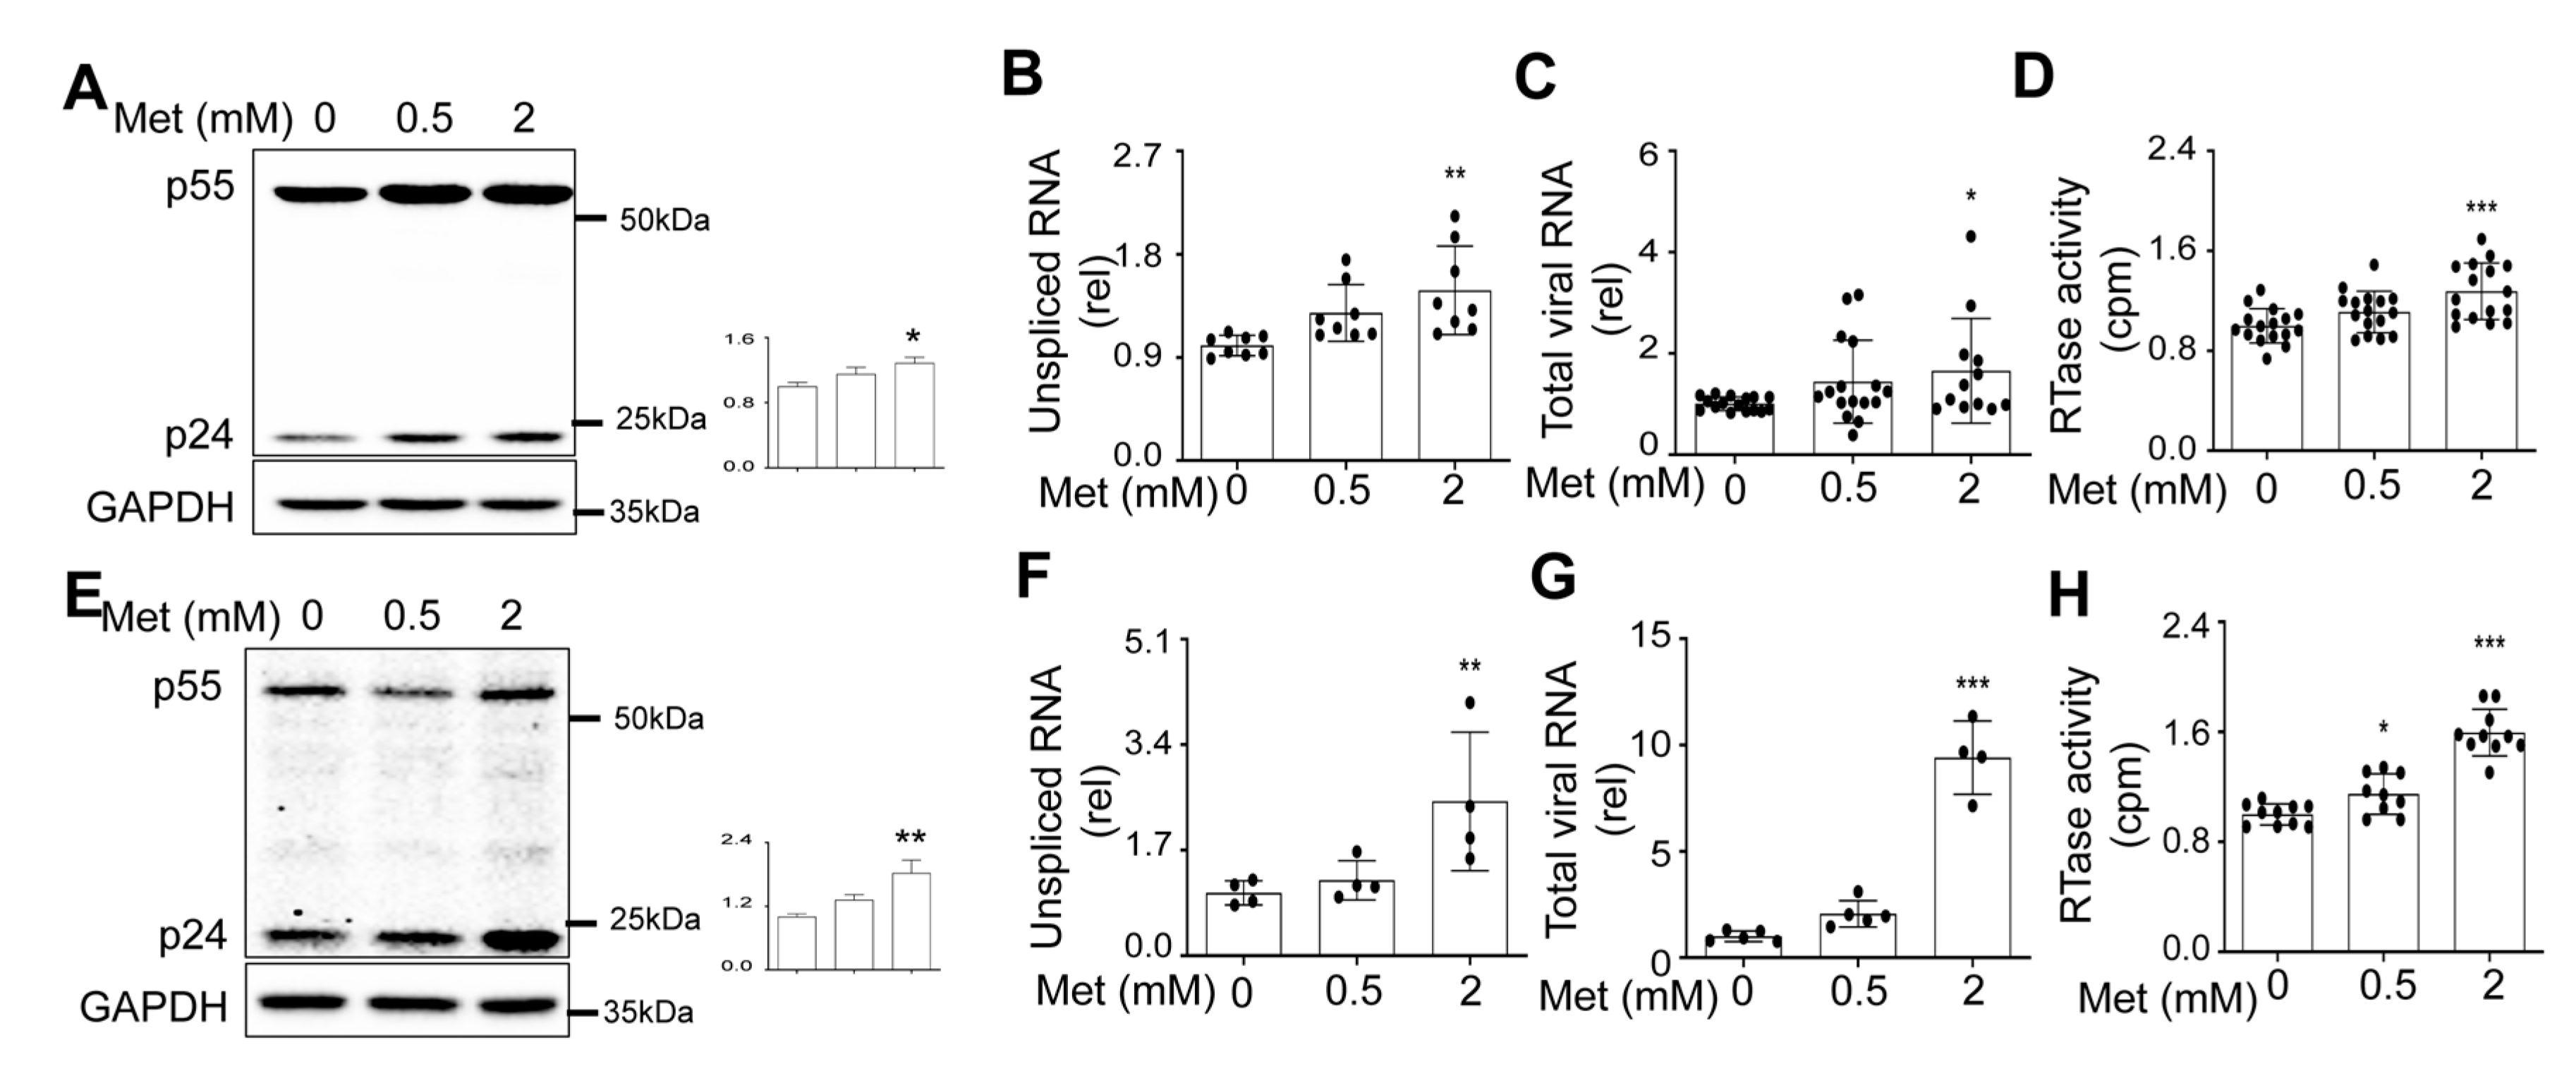
Metformin treatment increased HIV production and intracellular HIV gene expression.
Metformin treatment increased HIV RNA expression and transcription.
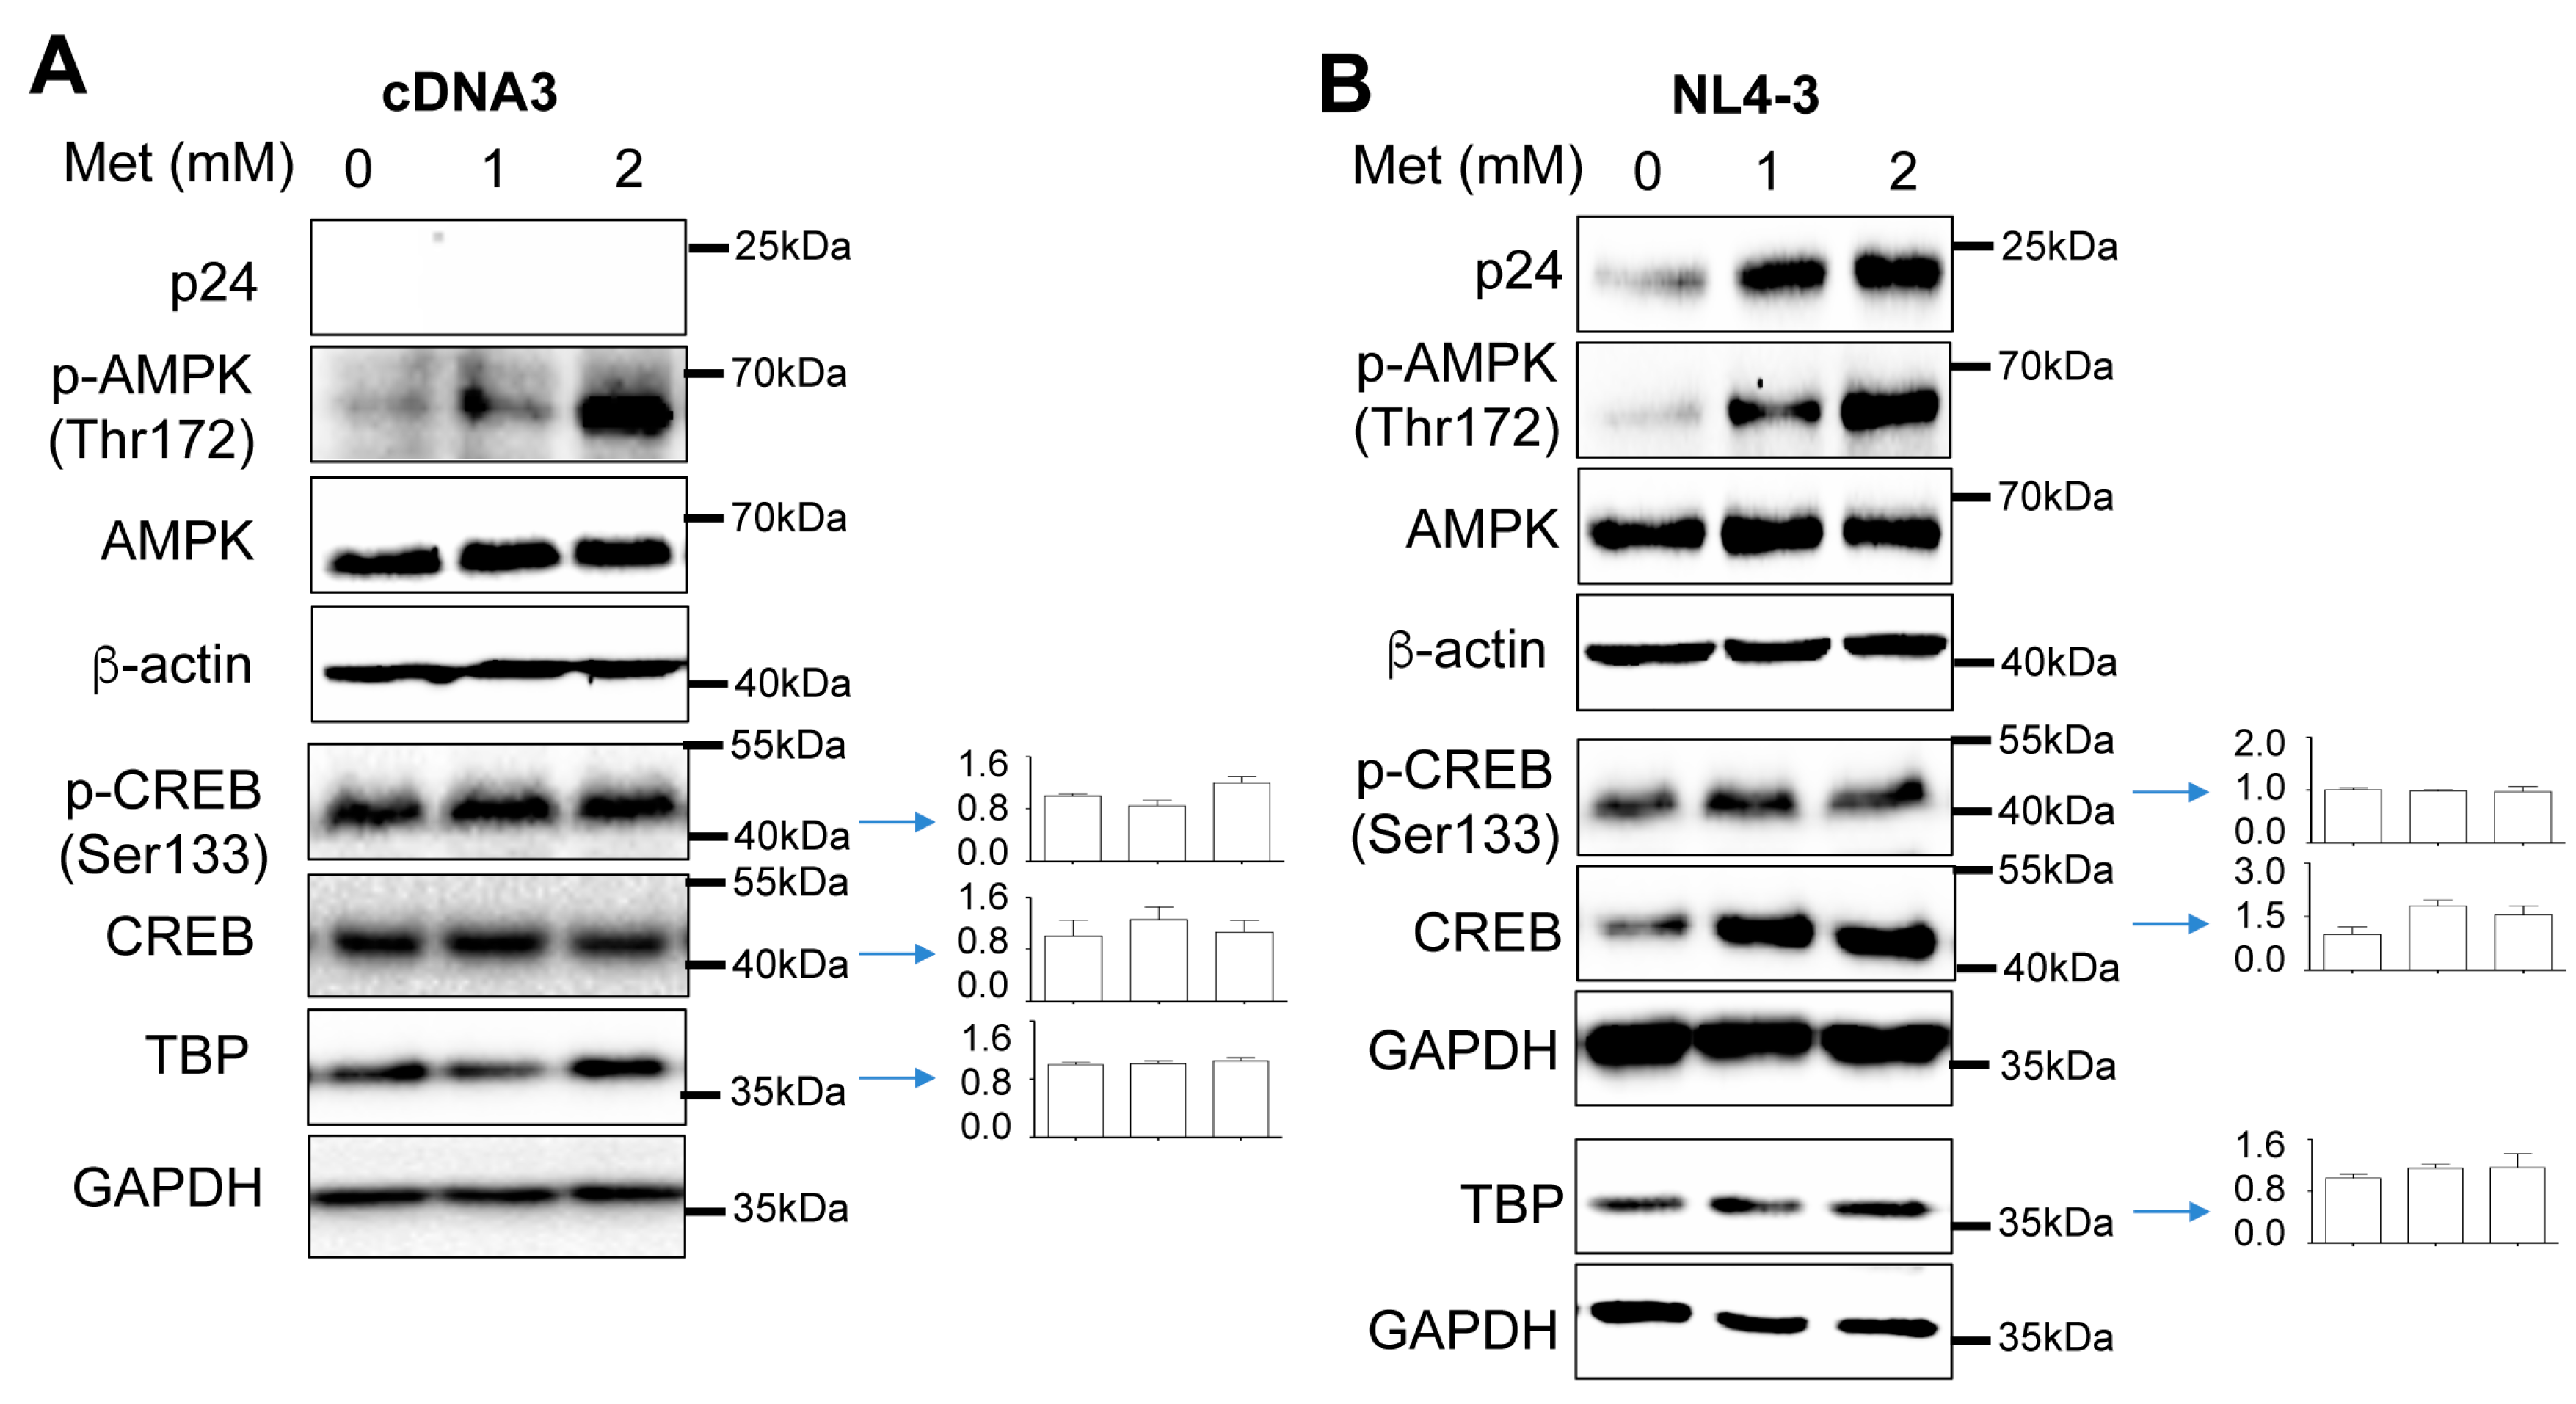
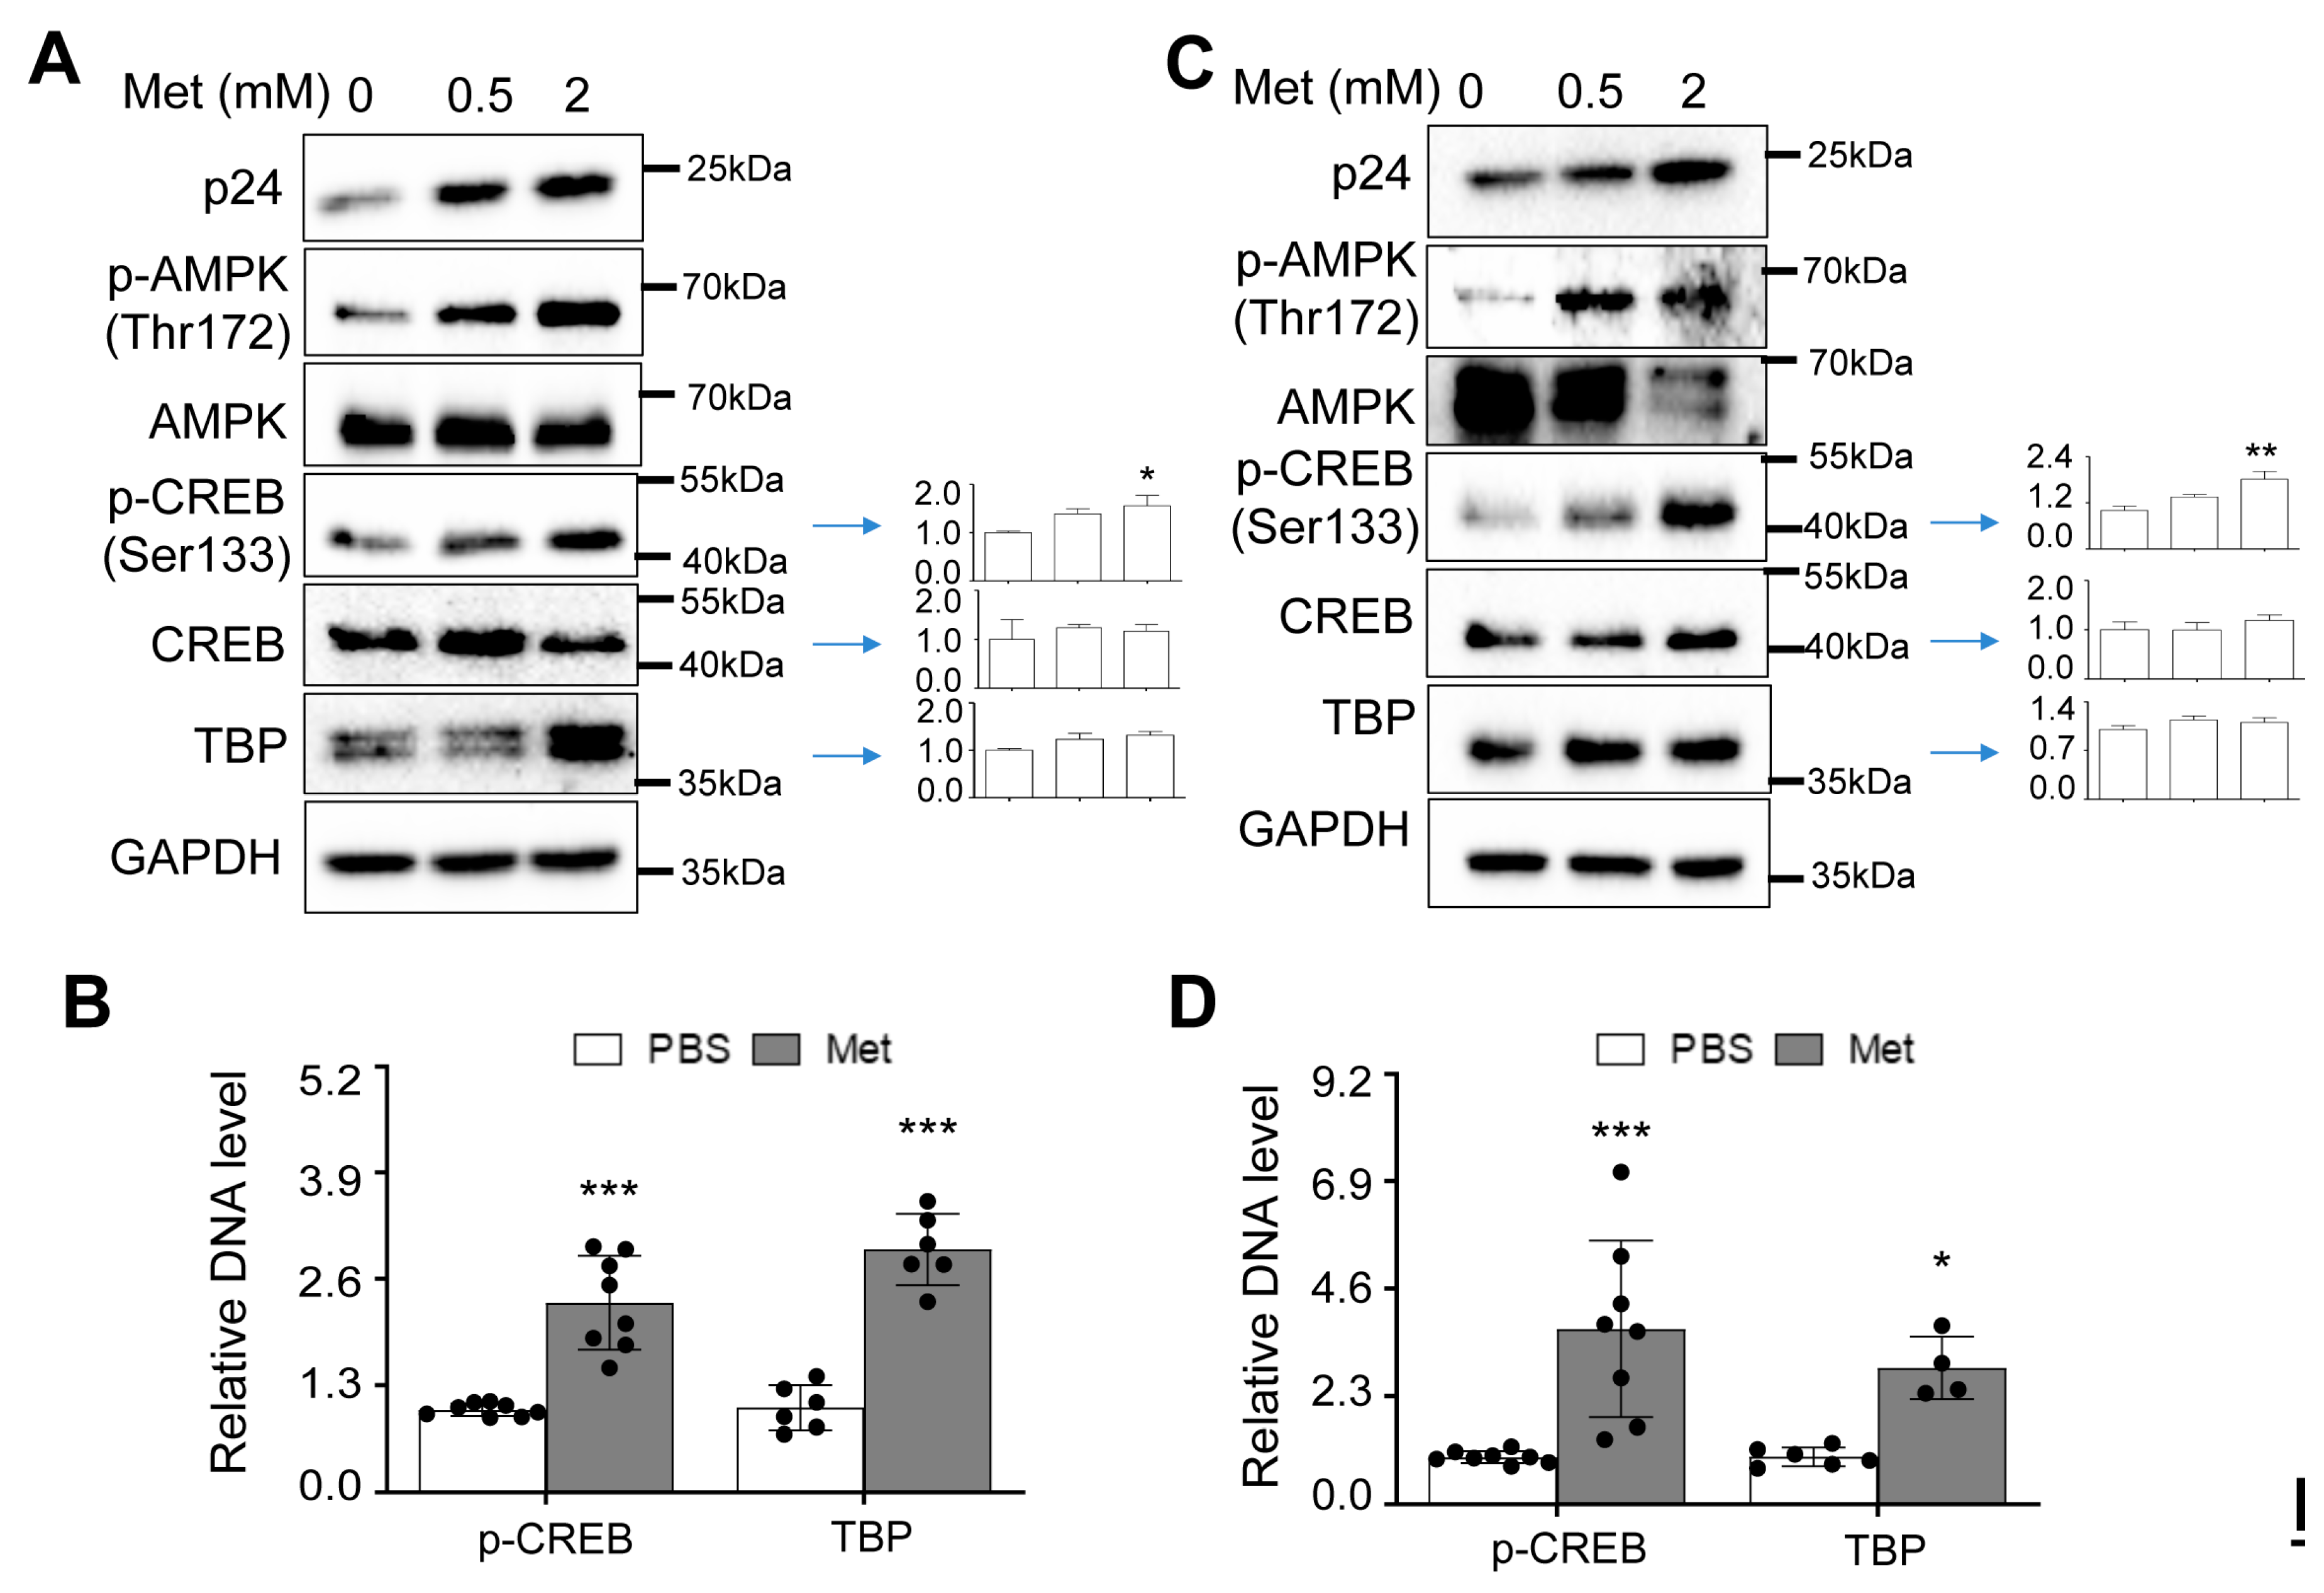
Increased CREB expression and phosphorylation and TBP expression by Metformin and HIV
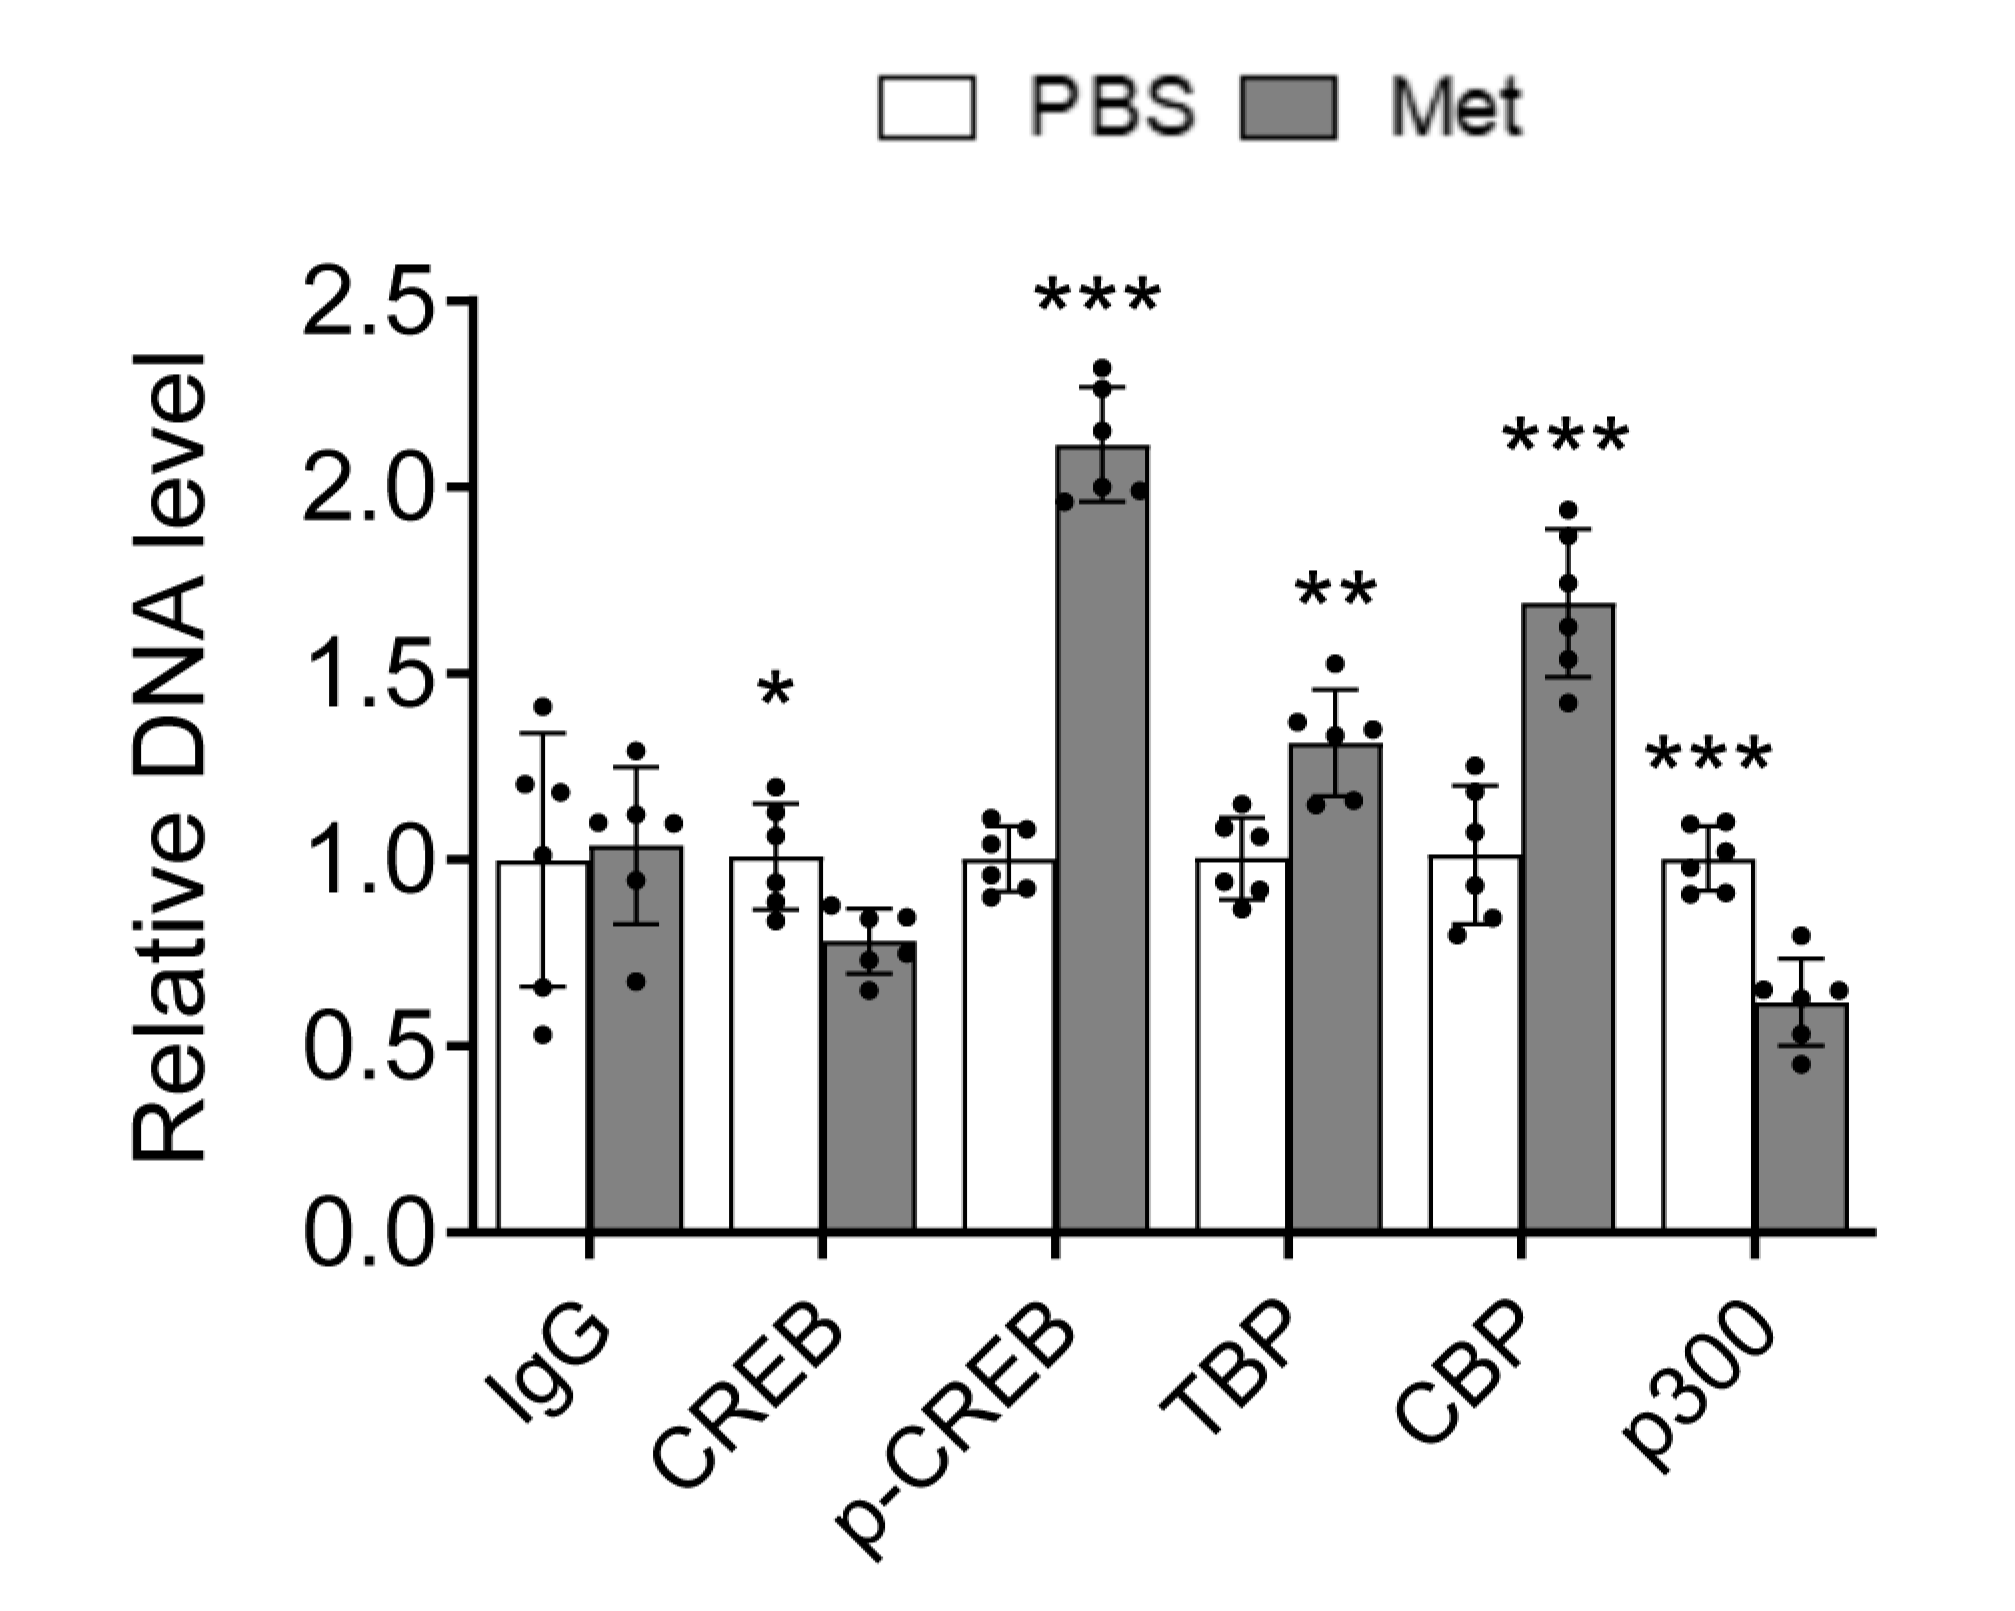
Increased recruitment of phosphorylated CREB and TBP to the HIV LTR promoter by Metformin
Metformin treatment increased HIV gene expression, transcription, and production in human PBMC.
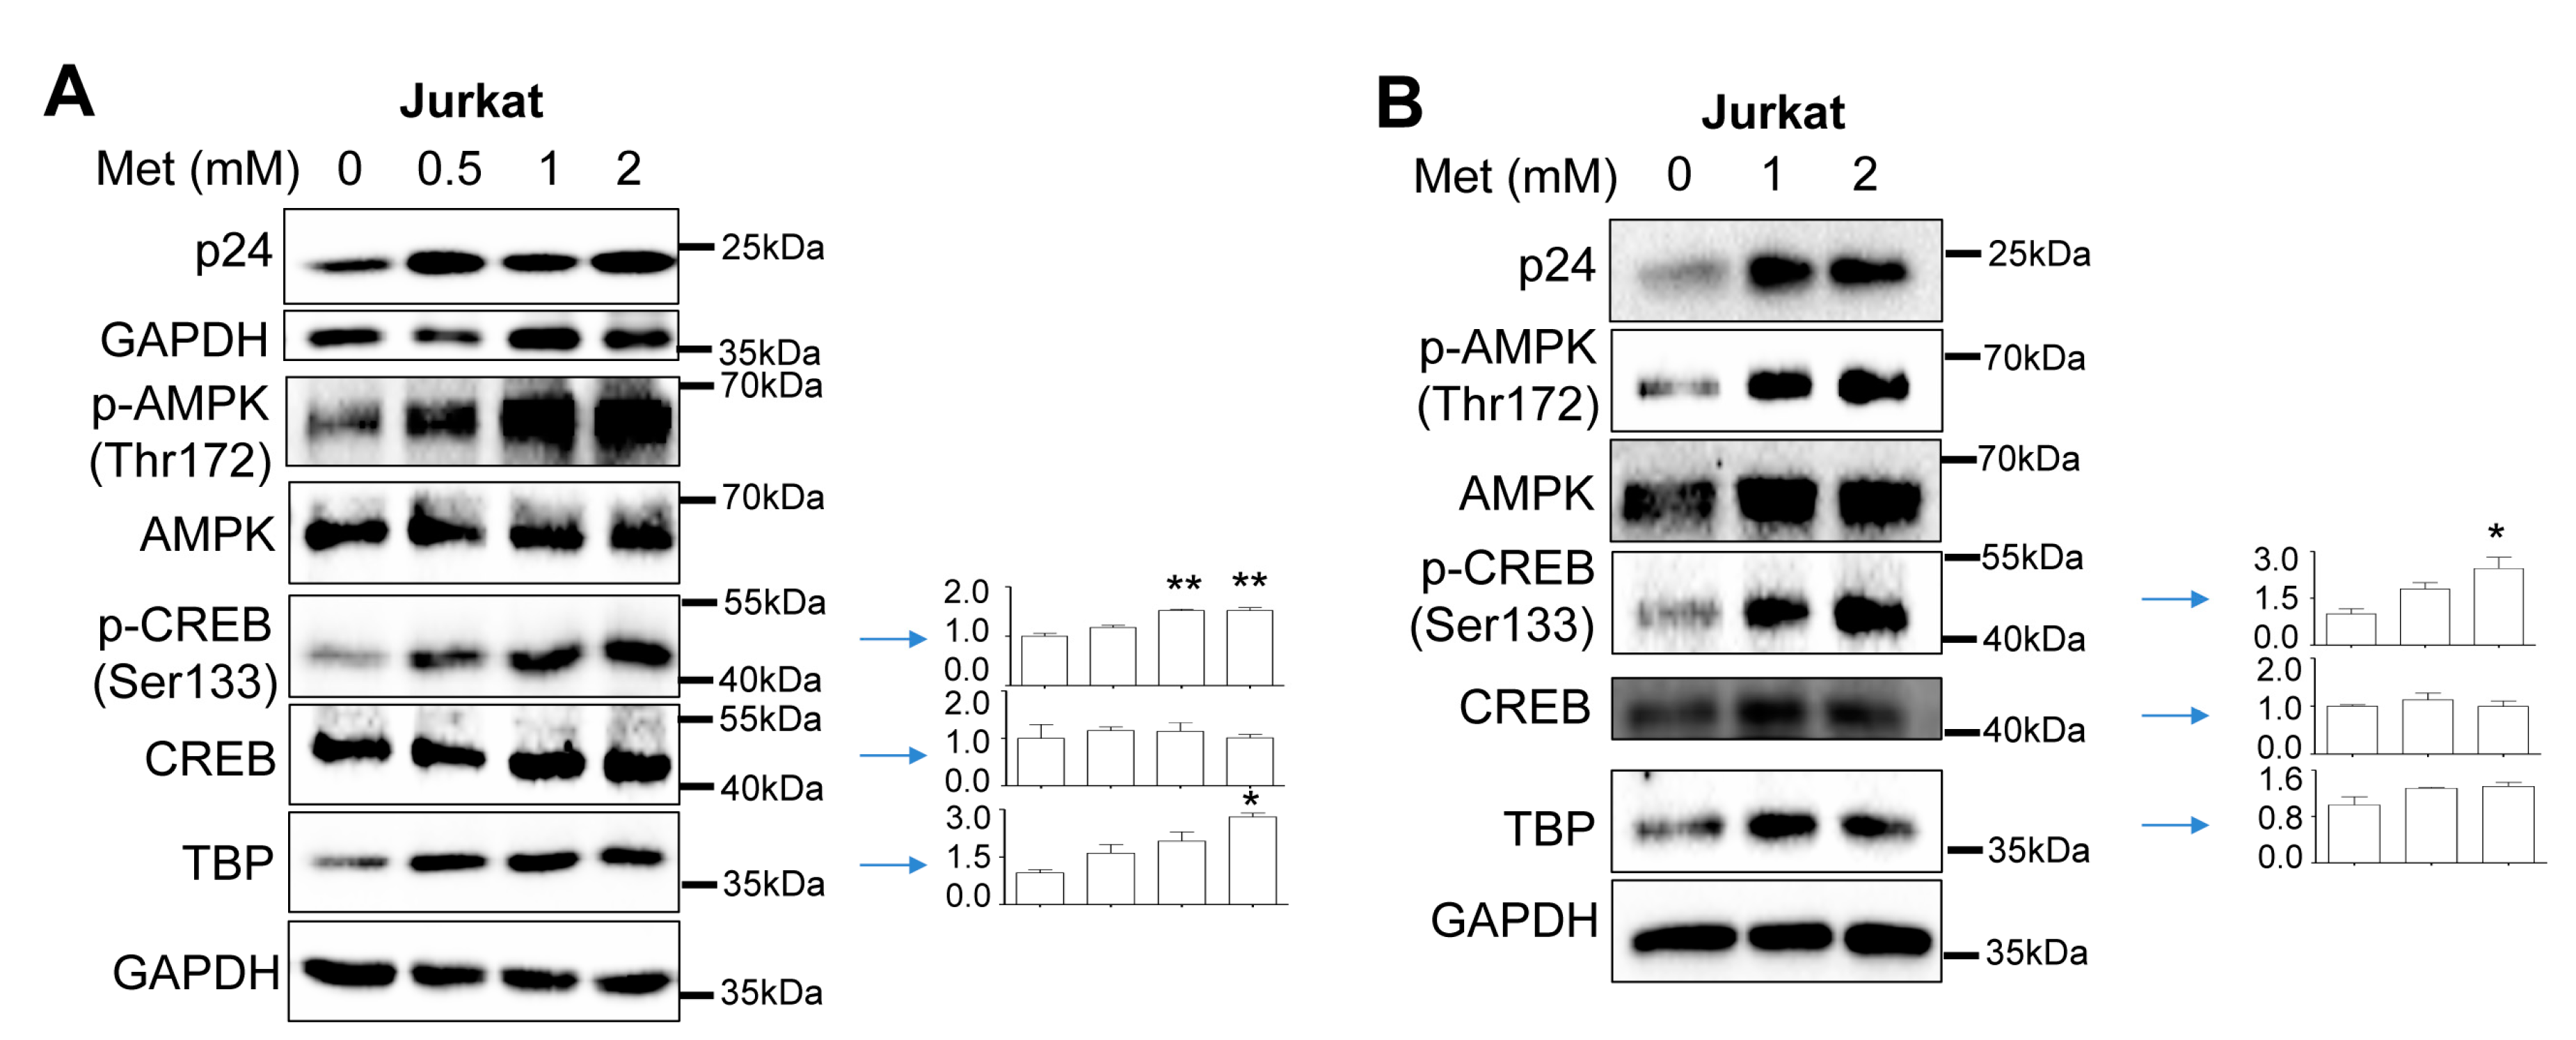
Metformin treatment increased CREB expression and phosphorylation and TBP expression and their recruitment to the HIV LTR promoter in human PBMC.
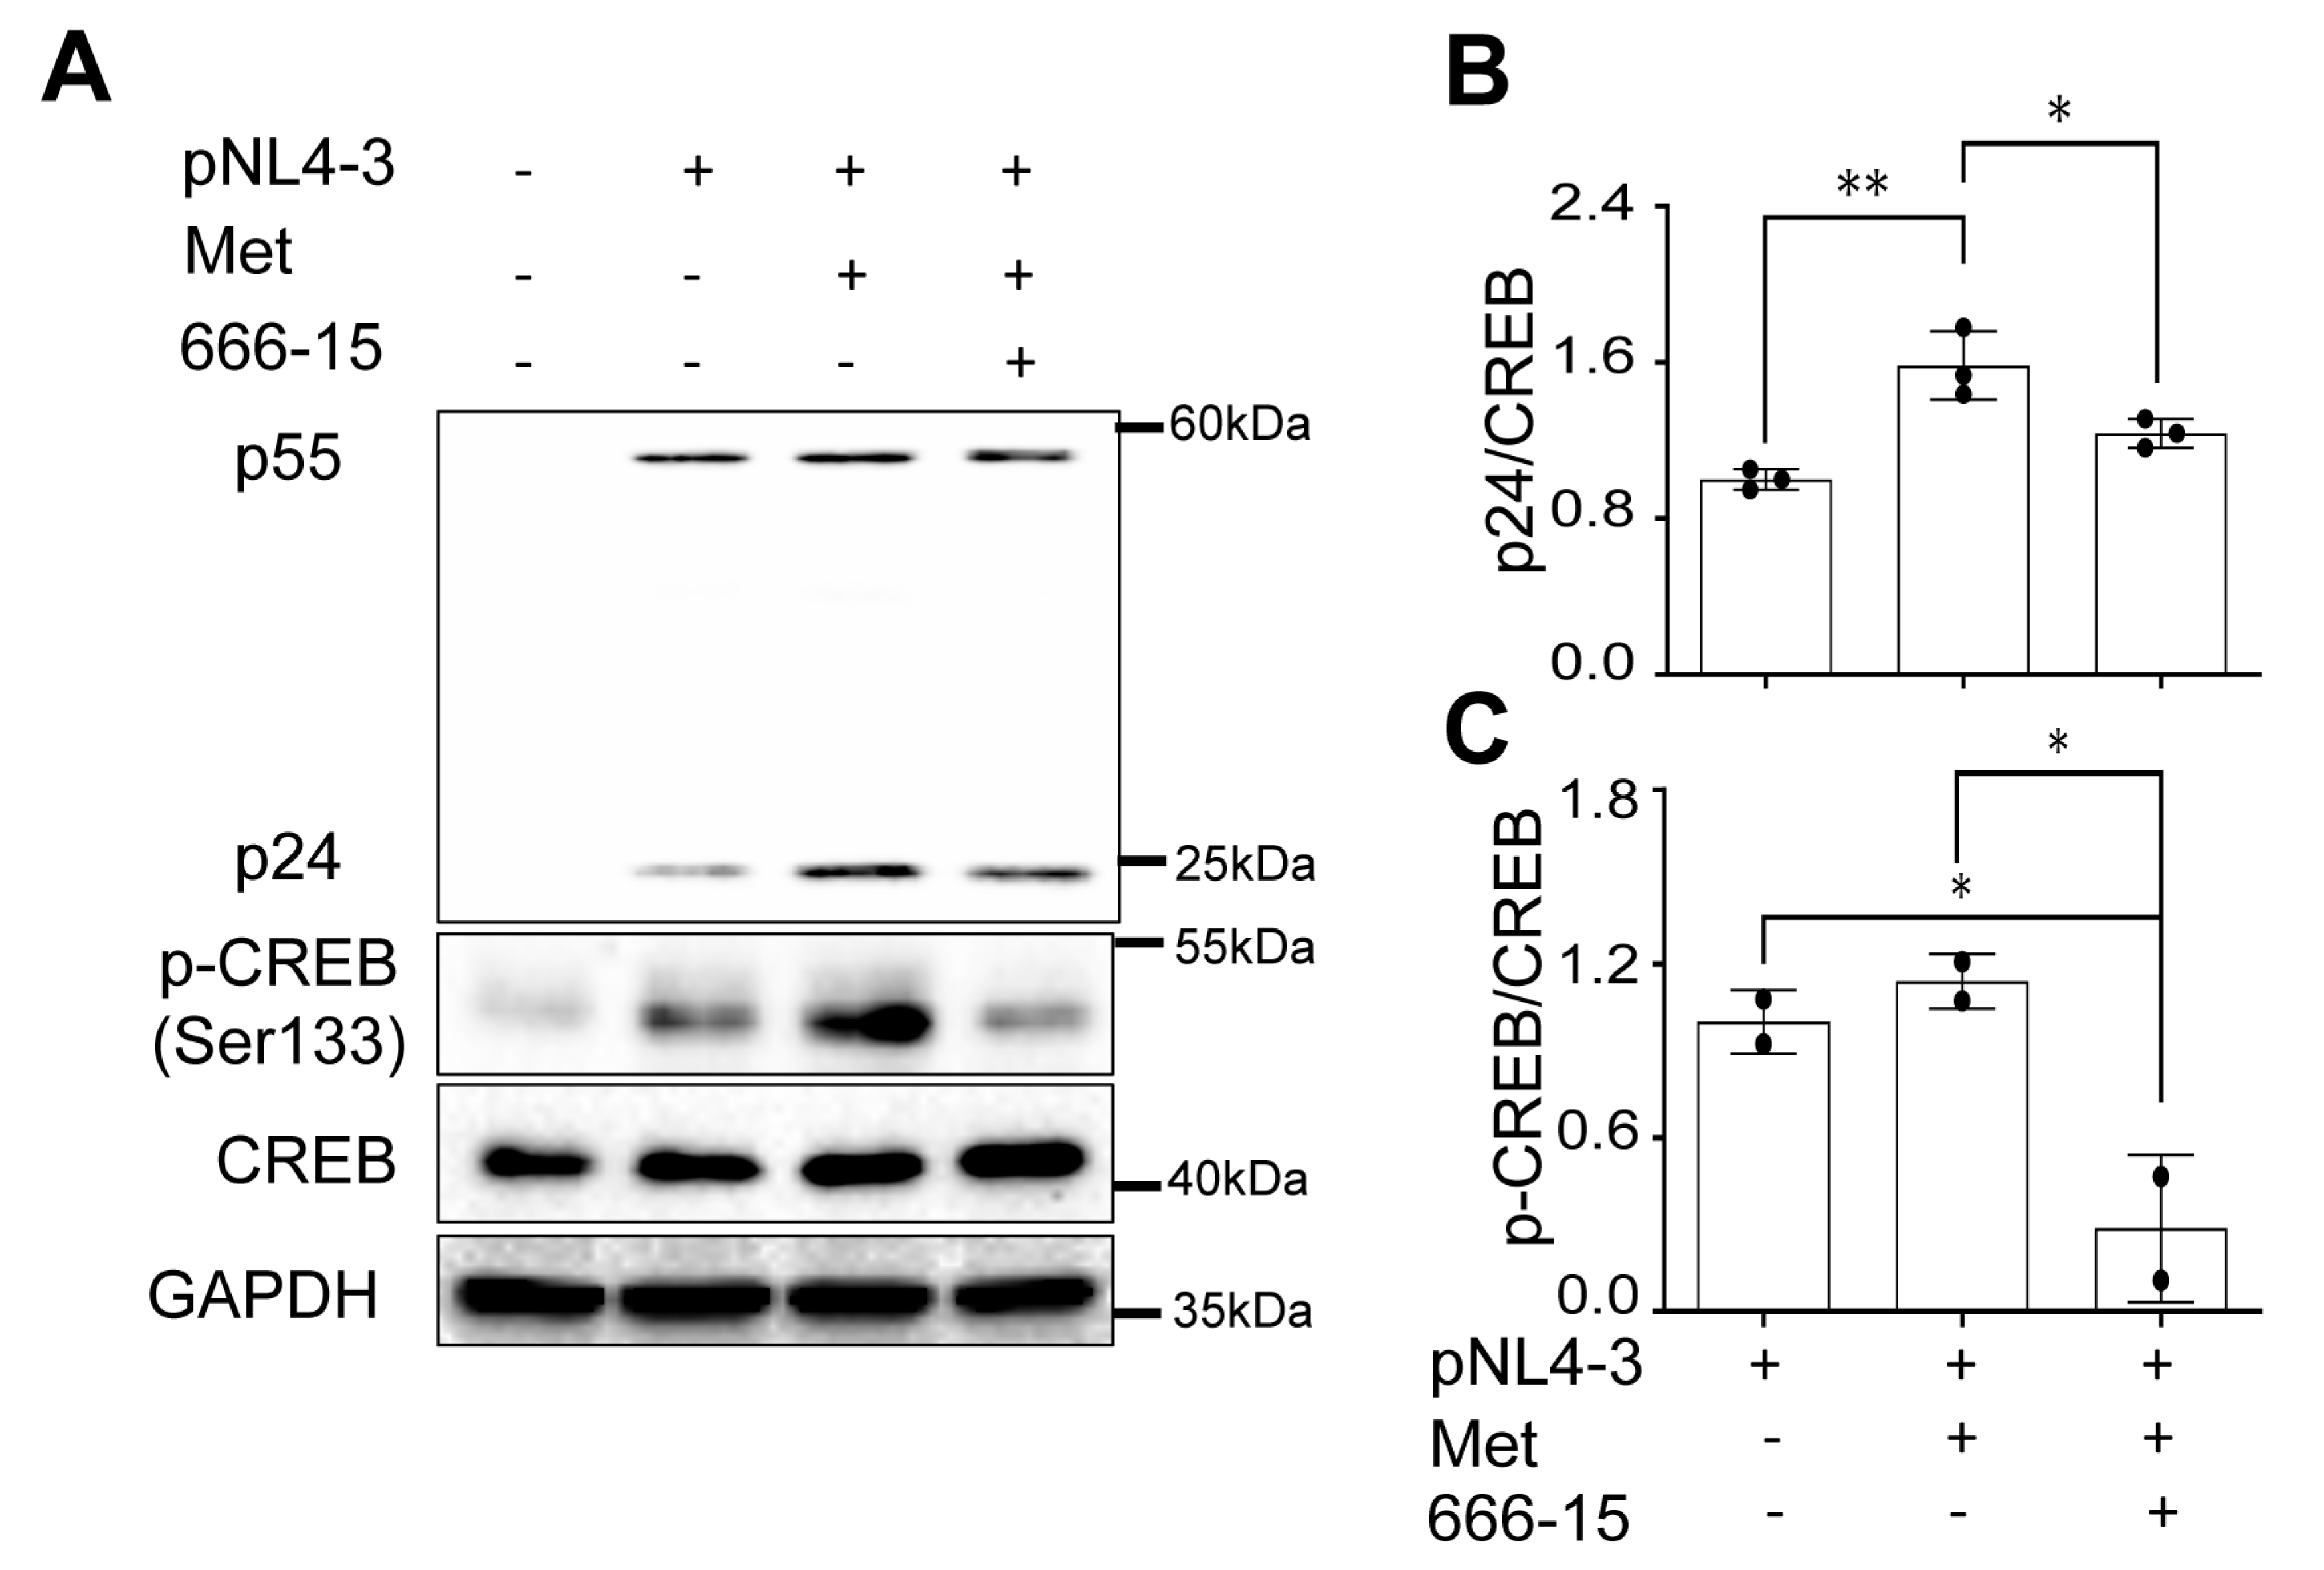
666-15. treatment abrogated Metformin-enhanced HIV gene expression
Discussion
Author Contributions
Funding
Institutional Review Board Statement
Informed Consent Statement
Data Availability Statement
Acknowledgments
Conflicts of Interest
References
- Life expectancy of individuals on combination antiretroviral therapy in high-income countries: a collaborative analysis of 14 cohort studies. Lancet 2008, 372, 293–299. [CrossRef] [PubMed]
- Thaker, H.K.; Snow, M.H. HIV viral suppression in the era of antiretroviral therapy. Postgraduate Medical Journal 2003, 79, 36–42. [Google Scholar] [CrossRef] [PubMed]
- Sáez-Cirión, A.; Sereti, I. Immunometabolism and HIV-1 pathogenesis: food for thought. Nature Reviews Immunology 2021, 21, 5–19. [Google Scholar] [CrossRef] [PubMed]
- Hsu, D.C.; Sereti, I. Serious Non-AIDS Events: Therapeutic Targets of Immune Activation and Chronic Inflammation in HIV Infection. Drugs 2016, 76, 533–549. [Google Scholar] [CrossRef] [PubMed]
- Hsue, P.Y.; Waters, D.D. HIV infection and coronary heart disease: mechanisms and management. Nature Reviews Cardiology 2019, 16, 745–759. [Google Scholar] [CrossRef] [PubMed]
- Protogerou, A.D.; Fransen, J.; Zampeli, E.; Argyris, A.A.; Aissopou, E.; Arida, A.; Konstantonis, G.D.; Tentolouris, N.; Makrilakis, K.; Psichogiou, M.; et al. The Additive Value of Femoral Ultrasound for Subclinical Atherosclerosis Assessment in a Single Center Cohort of 962 Adults, Including High Risk Patients with Rheumatoid Arthritis, Human Immunodeficiency Virus Infection and Type 2 Diabetes Mellitus. PLoS One 2015, 10, e0132307. [Google Scholar] [CrossRef] [PubMed]
- Savès, M.; Chêne, G.; Ducimetière, P.; Leport, C.; Le Moal, G.; Amouyel, P.; Arveiler, D.; Ruidavets, J.B.; Reynes, J.; Bingham, A.; et al. Risk factors for coronary heart disease in patients treated for human immunodeficiency virus infection compared with the general population. Clin Infect Dis 2003, 37, 292–298. [Google Scholar] [CrossRef]
- Triant, V.A.; Lee, H.; Hadigan, C.; Grinspoon, S.K. Increased acute myocardial infarction rates and cardiovascular risk factors among patients with human immunodeficiency virus disease. The Journal of clinical endocrinology and metabolism 2007, 92, 2506–2512. [Google Scholar] [CrossRef]
- Overton, E.T.; Nurutdinova, D.; Freeman, J.; Seyfried, W.; Mondy, K.E. Factors associated with renal dysfunction within an urban HIV-infected cohort in the era of highly active antiretroviral therapy. HIV Med 2009, 10, 343–350. [Google Scholar] [CrossRef]
- Mocroft, A.; Lundgren, J.D.; Ross, M.; Fux, C.A.; Reiss, P.; Moranne, O.; Morlat, P.; Monforte, A.; Kirk, O.; Ryom, L. Cumulative and current exposure to potentially nephrotoxic antiretrovirals and development of chronic kidney disease in HIV-positive individuals with a normal baseline estimated glomerular filtration rate: a prospective international cohort study. Lancet HIV 2016, 3, e23–e32. [Google Scholar] [CrossRef]
- Bonnet, E. New and emerging agents in the management of lipodystrophy in HIV-infected patients. HIV AIDS (Auckl) 2010, 2, 167–178. [Google Scholar] [CrossRef] [PubMed]
- Moreno, S.; Miralles, C.; Negredo, E.; Domingo, P.; Estrada, V.; Gutierrez, F.; Lozano, F.; Martinez, E. Disorders of body fat distribution in HIV-1-infected patients. AIDS Rev 2009, 11, 126–134. [Google Scholar] [PubMed]
- Brown, T.T. Approach to the human immunodeficiency virus-infected patient with lipodystrophy. J Clin Endocrinol Metab 2008, 93, 2937–2945. [Google Scholar] [CrossRef] [PubMed]
- Coll, B.; van Wijk, J.P.; Parra, S.; Castro Cabezas, M.; Hoepelman, I.M.; Alonso-Villaverde, C.; de Koning, E.J.; Camps, J.; Ferre, N.; Rabelink, T.J.; et al. Effects of rosiglitazone and metformin on postprandial paraoxonase-1 and monocyte chemoattractant protein-1 in human immunodeficiency virus-infected patients with lipodystrophy. Eur J Pharmacol 2006, 544, 104–110. [Google Scholar] [CrossRef] [PubMed]
- van Wijk, J.P.; de Koning, E.J.; Cabezas, M.C.; op’t Roodt, J.; Joven, J.; Rabelink, T.J.; Hoepelman, A.I. Comparison of rosiglitazone and metformin for treating HIV lipodystrophy: a randomized trial. Ann Intern Med 2005, 143, 337–346. [Google Scholar] [CrossRef] [PubMed]
- Riddler, S.A.; Smit, E.; Cole, S.R.; Li, R.; Chmiel, J.S.; Dobs, A.; Palella, F.; Visscher, B.; Evans, R.; Kingsley, L.A. Impact of HIV infection and HAART on serum lipids in men. Jama 2003, 289, 2978–2982. [Google Scholar] [CrossRef] [PubMed]
- Fourie, C.M.; Van Rooyen, J.M.; Kruger, A.; Schutte, A.E. Lipid abnormalities in a never-treated HIV-1 subtype C-infected African population. Lipids 2010, 45, 73–80. [Google Scholar] [CrossRef]
- Gross, Andrew M. ; Jaeger, Philipp A.; Kreisberg, Jason F.; Licon, K.; Jepsen, Kristen L.; Khosroheidari, M.; Morsey, Brenda M.; Swindells, S.; Shen, H.; Ng, Cherie T.; et al. Methylome-wide Analysis of Chronic HIV Infection Reveals Five-Year Increase in Biological Age and Epigenetic Targeting of HLA. Molecular Cell 2016, 62, 157–168. [Google Scholar] [CrossRef]
- De Francesco, D.; Wit, F.W.; Bürkle, A.; Oehlke, S.; Kootstra, N.A.; Winston, A.; Franceschi, C.; Garagnani, P.; Pirazzini, C.; Libert, C.; et al. Do people living with HIV experience greater age advancement than their HIV-negative counterparts? AIDS 2019, 33. [Google Scholar] [CrossRef]
- Han, J.H.; Gordon, K.; Womack, J.A.; Gibert, C.L.; Leaf, D.A.; Rimland, D.; Rodriguez-Barradas, M.C.; Bisson, G.P. Comparative Effectiveness of Diabetic Oral Medications Among HIV-Infected and HIV-Uninfected Veterans. Diabetes Care 2017, 40, 218–225. [Google Scholar] [CrossRef]
- Mathabire Rücker, S.C.; Tayea, A.; Bitilinyu-Bangoh, J.; Bermúdez-Aza, E.H.; Salumu, L.; Quiles, I.A.; Szumilin, E.; Chirwa, Z.; Rick, F.; Maman, D. High rates of hypertension, diabetes, elevated low-density lipoprotein cholesterol, and cardiovascular disease risk factors in HIV-infected patients in Malawi. Aids 2018, 32, 253–260. [Google Scholar] [CrossRef] [PubMed]
- Kalra, S.; Kalra, B.; Agrawal, N.; Unnikrishnan, A.G. Understanding diabetes in patients with HIV/AIDS. Diabetology & Metabolic Syndrome 2011, 3, 2. [Google Scholar] [CrossRef]
- da Cunha, J.; Maselli, L.M.F.; Stern, A.C.B.; Spada, C.; Bydlowski, S.P. Impact of antiretroviral therapy on lipid metabolism of human immunodeficiency virus-infected patients: Old and new drugs. World J Virol 2015, 4, 56–77. [Google Scholar] [CrossRef] [PubMed]
- Avari, P.; Devendra, S. Human immunodeficiency virus and type 2 diabetes. London J Prim Care (Abingdon) 2017, 9, 38–42. [Google Scholar] [CrossRef] [PubMed]
- Monroe, A.K.; Glesby, M.J.; Brown, T.T. Diagnosing and Managing Diabetes in HIV-Infected Patients: Current Concepts. Clinical Infectious Diseases 2014, 60, 453–462. [Google Scholar] [CrossRef] [PubMed]
- Brown, T.T.; Cole, S.R.; Li, X.; Kingsley, L.A.; Palella, F.J.; Riddler, S.A.; Visscher, B.R.; Margolick, J.B.; Dobs, A.S. Antiretroviral therapy and the prevalence and incidence of diabetes mellitus in the multicenter AIDS cohort study. Arch Intern Med 2005, 165, 1179–1184. [Google Scholar] [CrossRef] [PubMed]
- Galli, L.; Salpietro, S.; Pellicciotta, G.; Galliani, A.; Piatti, P.; Hasson, H.; Guffanti, M.; Gianotti, N.; Bigoloni, A.; Lazzarin, A.; et al. Risk of type 2 diabetes among HIV-infected and healthy subjects in Italy. Eur J Epidemiol 2012, 27, 657–665. [Google Scholar] [CrossRef] [PubMed]
- Viollet, B.; Guigas, B.; Garcia, N.S.; Leclerc, J.; Foretz, M.; Andreelli, F. Cellular and molecular mechanisms of metformin: an overview. Clinical Science 2011, 122, 253–270. [Google Scholar] [CrossRef]
- Shaw, R.J.; Lamia, K.A.; Vasquez, D.; Koo, S.-H.; Bardeesy, N.; Depinho, R.A.; Montminy, M.; Cantley, L.C. The kinase LKB1 mediates glucose homeostasis in liver and therapeutic effects of metformin. Science (New York, N.Y.) 2005, 310, 1642–1646. [Google Scholar] [CrossRef]
- Pernicova, I.; Korbonits, M. Metformin—mode of action and clinical implications for diabetes and cancer. Nature Reviews Endocrinology 2014, 10, 143–156. [Google Scholar] [CrossRef]
- Gunton, J.E.; Delhanty, P.J.; Takahashi, S.; Baxter, R.C. Metformin rapidly increases insulin receptor activation in human liver and signals preferentially through insulin-receptor substrate-2. J Clin Endocrinol Metab 2003, 88, 1323–1332. [Google Scholar] [CrossRef] [PubMed]
- Detaille, D.; Guigas, B.; Leverve, X.; Wiernsperger, N.; Devos, P. Obligatory role of membrane events in the regulatory effect of metformin on the respiratory chain function. Biochem Pharmacol 2002, 63, 1259–1272. [Google Scholar] [CrossRef] [PubMed]
- El-Mir, M.Y.; Nogueira, V.; Fontaine, E.; Averet, N.; Rigoulet, M.; Leverve, X. Dimethylbiguanide inhibits cell respiration via an indirect effect targeted on the respiratory chain complex I. J Biol Chem 2000, 275, 223–228. [Google Scholar] [CrossRef] [PubMed]
- Leclerc, G.M.; Leclerc, G.J.; Kuznetsov, J.N.; DeSalvo, J.; Barredo, J.C. Metformin induces apoptosis through AMPK-dependent inhibition of UPR signaling in ALL lymphoblasts. PLoS One 2013, 8, e74420. [Google Scholar] [CrossRef]
- Zhou, G.; Myers, R.; Li, Y.; Chen, Y.; Shen, X.; Fenyk-Melody, J.; Wu, M.; Ventre, J.; Doebber, T.; Fujii, N.; et al. Role of AMP-activated protein kinase in mechanism of metformin action. J Clin Invest 2001, 108, 1167–1174. [Google Scholar] [CrossRef]
- Owen, M.R.; Doran, E.; Halestrap, A.P. Evidence that metformin exerts its anti-diabetic effects through inhibition of complex 1 of the mitochondrial respiratory chain. Biochem J 2000, 348 Pt 3, 607–614. [Google Scholar] [CrossRef]
- Salpeter, S.R.; Buckley, N.S.; Kahn, J.A.; Salpeter, E.E. Meta-analysis: metformin treatment in persons at risk for diabetes mellitus. Am J Med 2008, 121, 149–157. [Google Scholar] [CrossRef]
- Gokcel, A.; Gumurdulu, Y.; Karakose, H.; Melek Ertorer, E.; Tanaci, N.; BascilTutuncu, N.; Guvener, N. Evaluation of the safety and efficacy of sibutramine, orlistat and metformin in the treatment of obesity. Diabetes Obes Metab 2002, 4, 49–55. [Google Scholar] [CrossRef]
- Andrews, M.; Soto, N.; Arredondo, M. [Effect of metformin on the expression of tumor necrosis factor-alpha, Toll like receptors 2/4 and C reactive protein in obese type-2 diabetic patients]. Rev Med Chil 2012, 140, 1377–1382. [Google Scholar] [CrossRef]
- Nath, N.; Khan, M.; Paintlia, M.K.; Singh, I.; Hoda, M.N.; Giri, S. Metformin attenuated the autoimmune disease of the central nervous system in animal models of multiple sclerosis. J Immunol 2009, 182, 8005–8014. [Google Scholar] [CrossRef]
- Lee, J.H.; Kim, T.I.; Jeon, S.M.; Hong, S.P.; Cheon, J.H.; Kim, W.H. The effects of metformin on the survival of colorectal cancer patients with diabetes mellitus. Int J Cancer 2012, 131, 752–759. [Google Scholar] [CrossRef] [PubMed]
- He, X.; Esteva, F.J.; Ensor, J.; Hortobagyi, G.N.; Lee, M.H.; Yeung, S.C. Metformin and thiazolidinediones are associated with improved breast cancer-specific survival of diabetic women with HER2+ breast cancer. Ann Oncol 2012, 23, 1771–1780. [Google Scholar] [CrossRef] [PubMed]
- Leclercq, P.; Blanc, M. [Metabolic abnormalities, lipodystrophy and cardiovascular risk in HIV-infected patients]. Rev Prat 2006, 56, 987–994. [Google Scholar] [PubMed]
- Fitch, K.; Abbara, S.; Lee, H.; Stavrou, E.; Sacks, R.; Michel, T.; Hemphill, L.; Torriani, M.; Grinspoon, S. Effects of lifestyle modification and metformin on atherosclerotic indices among HIV-infected patients with the metabolic syndrome. Aids 2012, 26, 587–597. [Google Scholar] [CrossRef] [PubMed]
- Driscoll, S.D.; Meininger, G.E.; Lareau, M.T.; Dolan, S.E.; Killilea, K.M.; Hadigan, C.M.; Lloyd-Jones, D.M.; Klibanski, A.; Frontera, W.R.; Grinspoon, S.K. Effects of exercise training and metformin on body composition and cardiovascular indices in HIV-infected patients. Aids 2004, 18, 465–473. [Google Scholar] [CrossRef] [PubMed]
- Hoel, H.; Hove-Skovsgaard, M.; Hov, J.R.; Gaardbo, J.C.; Holm, K.; Kummen, M.; Rudi, K.; Nwosu, F.; Valeur, J.; Gelpi, M.; et al. Impact of HIV and Type 2 diabetes on Gut Microbiota Diversity, Tryptophan Catabolism and Endothelial Dysfunction. Sci Rep 2018, 8, 6725. [Google Scholar] [CrossRef] [PubMed]
- Forslund, K.; Hildebrand, F.; Nielsen, T.; Falony, G.; Le Chatelier, E.; Sunagawa, S.; Prifti, E.; Vieira-Silva, S.; Gudmundsdottir, V.; Pedersen, H.K.; et al. Corrigendum: Disentangling type 2 diabetes and metformin treatment signatures in the human gut microbiota. Nature 2017, 545, 116. [Google Scholar] [CrossRef] [PubMed]
- Routy, J.P.; Isnard, S.; Mehraj, V.; Ostrowski, M.; Chomont, N.; Ancuta, P.; Ponte, R.; Planas, D.; Dupuy, F.P.; Angel, J.B. Effect of metformin on the size of the HIV reservoir in non-diabetic ART-treated individuals: single-arm non-randomised Lilac pilot study protocol. BMJ Open 2019, 9, e028444. [Google Scholar] [CrossRef]
- Planas, D.; Pagliuzza, A.; Ponte, R.; Fert, A.; Marchand, L.R.; Massanella, M.; Gosselin, A.; Mehraj, V.; Dupuy, F.P.; Isnard, S.; et al. LILAC pilot study: Effects of metformin on mTOR activation and HIV reservoir persistence during antiretroviral therapy. EBioMedicine 2021, 65, 103270. [Google Scholar] [CrossRef]
- Shikuma, C.M.; Chew, G.M.; Kohorn, L.; Souza, S.A.; Chow, D.; SahBandar, I.N.; Park, E.Y.; Hanks, N.; Gangcuangco, L.M.A.; Gerschenson, M.; et al. Short Communication: Metformin Reduces CD4 T Cell Exhaustion in HIV-Infected Adults on Suppressive Antiretroviral Therapy. AIDS Res Hum Retroviruses 2020, 36, 303–305. [Google Scholar] [CrossRef]
- Weiss, A.; Wiskocil, R.L.; Stobo, J.D. The role of T3 surface molecules in the activation of human T cells: a two-stimulus requirement for IL 2 production reflects events occurring at a pre-translational level. J Immunol 1984, 133, 123–128. [Google Scholar] [CrossRef] [PubMed]
- Perez, V.L.; Rowe, T.; Justement, J.S.; Butera, S.T.; June, C.H.; Folks, T.M. An HIV-1-infected T cell clone defective in IL-2 production and Ca2+ mobilization after CD3 stimulation. J Immunol 1991, 147, 3145–3148. [Google Scholar] [CrossRef] [PubMed]
- Folks, T.M.; Justement, J.; Kinter, A.; Dinarello, C.A.; Fauci, A.S. Cytokine-induced expression of HIV-1 in a chronically infected promonocyte cell line. Science 1987, 238, 800–802. [Google Scholar] [CrossRef] [PubMed]
- Folks, T.M.; Clouse, K.A.; Justement, J.; Rabson, A.; Duh, E.; Kehrl, J.H.; Fauci, A.S. Tumor necrosis factor alpha induces expression of human immunodeficiency virus in a chronically infected T-cell clone. Proc Natl Acad Sci U S A 1989, 86, 2365–2368. [Google Scholar] [CrossRef] [PubMed]
- Derdeyn, C.A.; Decker, J.M.; Sfakianos, J.N.; Wu, X.; O’Brien, W.A.; Ratner, L.; Kappes, J.C.; Shaw, G.M.; Hunter, E. Sensitivity of human immunodeficiency virus type 1 to the fusion inhibitor T-20 is modulated by coreceptor specificity defined by the V3 loop of gp120. J Virol 2000, 74, 8358–8367. [Google Scholar] [CrossRef]
- Platt, E.J.; Wehrly, K.; Kuhmann, S.E.; Chesebro, B.; Kabat, D. Effects of CCR5 and CD4 cell surface concentrations on infections by macrophagetropic isolates of human immunodeficiency virus type 1. J Virol 1998, 72, 2855–2864. [Google Scholar] [CrossRef]
- Wang, S.; Zhou, Q.; Chen, X.; Luo, R.H.; Li, Y.; Liu, X.; Yang, L.M.; Zheng, Y.T.; Wang, P. Modification of N-terminal α-amine of proteins via biomimetic ortho-quinone-mediated oxidation. Nat Commun 2021, 12, 2257. [Google Scholar] [CrossRef]
- Jeeninga, R.E.; Hoogenkamp, M.; Armand-Ugon, M.; de Baar, M.; Verhoef, K.; Berkhout, B. Functional differences between the long terminal repeat transcriptional promoters of human immunodeficiency virus type 1 subtypes A through G. J Virol 2000, 74, 3740–3751. [Google Scholar] [CrossRef]
- Klaver, B.; Berkhout, B. Comparison of 5’ and 3’ long terminal repeat promoter function in human immunodeficiency virus. J Virol 1994, 68, 3830–3840. [Google Scholar] [CrossRef]
- He, J.; Choe, S.; Walker, R.; Di Marzio, P.; Morgan, D.O.; Landau, N.R. Human immunodeficiency virus type 1 viral protein R (Vpr) arrests cells in the G2 phase of the cell cycle by inhibiting p34cdc2 activity. J Virol 1995, 69, 6705–6711. [Google Scholar] [CrossRef]
- Chen, C.; Okayama, H. High-efficiency transformation of mammalian cells by plasmid DNA. Mol Cell Biol 1987, 7, 2745–2752. [Google Scholar] [CrossRef] [PubMed]
- Liu, Y.; Kim, B.O.; Kao, C.; Jung, C.; Dalton, J.T.; He, J.J. Tip110, the human immunodeficiency virus type 1 (HIV-1) Tat-interacting protein of 110 kDa as a negative regulator of androgen receptor (AR) transcriptional activation. J Biol Chem 2004, 279, 21766–21773. [Google Scholar] [CrossRef] [PubMed]
- He, J.; Chen, Y.; Farzan, M.; Choe, H.; Ohagen, A.; Gartner, S.; Busciglio, J.; Yang, X.; Hofmann, W.; Newman, W.; et al. CCR3 and CCR5 are co-receptors for HIV-1 infection of microglia. Nature 1997, 385, 645–649. [Google Scholar] [CrossRef] [PubMed]
- Cohen, G.B.; Gandhi, R.T.; Davis, D.M.; Mandelboim, O.; Chen, B.K.; Strominger, J.L.; Baltimore, D. The Selective Downregulation of Class I Major Histocompatibility Complex Proteins by HIV-1 Protects HIV-Infected Cells from NK Cells. Immunity 1999, 10, 661–671. [Google Scholar] [CrossRef] [PubMed]
- Zheng, W.; Guo, J.; Lu, X.; Qiao, Y.; Liu, D.; Pan, S.; Liang, L.; Liu, C.; Zhu, H.; Liu, Z.; et al. cAMP-response element binding protein mediates podocyte injury in diabetic nephropathy by targeting lncRNA DLX6-AS1. Metabolism 2022, 129, 155155. [Google Scholar] [CrossRef] [PubMed]
- Wang, X.; Li, Y.; Qiang, G.; Wang, K.; Dai, J.; McCann, M.; Munoz, M.D.; Gil, V.; Yu, Y.; Li, S.; et al. Secreted EMC10 is upregulated in human obesity and its neutralizing antibody prevents diet-induced obesity in mice. Nature Communications 2022, 13, 7323. [Google Scholar] [CrossRef] [PubMed]
- Chesebro, B.; Wehrly, K.; Nishio, J.; Perryman, S. Macrophage-tropic human immunodeficiency virus isolates from different patients exhibit unusual V3 envelope sequence homogeneity in comparison with T-cell-tropic isolates: definition of critical amino acids involved in cell tropism. J Virol 1992, 66, 6547–6554. [Google Scholar] [CrossRef]
- Shugars, D.C.; Smith, M.S.; Glueck, D.H.; Nantermet, P.V.; Seillier-Moiseiwitsch, F.; Swanstrom, R. Analysis of human immunodeficiency virus type 1 nef gene sequences present in vivo. J Virol 1993, 67, 4639–4650. [Google Scholar] [CrossRef]
- Rahimian, P.; He, J.J. Exosome-associated release, uptake, and neurotoxicity of HIV-1 Tat protein. J Neurovirol 2016, 22, 774–788. [Google Scholar] [CrossRef]
- Zheng, L.; Yang, W.; Wu, F.; Wang, C.; Yu, L.; Tang, L.; Qiu, B.; Li, Y.; Guo, L.; Wu, M.; et al. Prognostic significance of AMPK activation and therapeutic effects of metformin in hepatocellular carcinoma. Clin Cancer Res 2013, 19, 5372–5380. [Google Scholar] [CrossRef]
- Naitou, H.; Mimaya, J.-i.; Horikoshi, Y.; Morita, T. Quantitative Detection of Human Immunodeficiency Virus Type 1 (HIV-1) RNA by PCR and Use as a Prognostic Marker and for Evaluating Antiretroviral Therapy. Biological & Pharmaceutical Bulletin 1997, 20, 1317–1320. [Google Scholar] [CrossRef]
- ten Haaft, P.; Cornelissen, M.; Goudsmit, J.; Koornstra, W.; Dubbes, R.; Niphuis, H.; Peeters, M.; Thiriart, C.; Bruck, C.; Heeney, J.L. Virus load in chimpanzees infected with human immunodeficiency virus type 1: effect of pre-exposure vaccination. J Gen Virol 1995, 76 ( Pt 4) Pt 4, 1015–1020. [Google Scholar] [CrossRef]
- Zhao, W.; Liu, Y.; Timani, K.A.; He, J.J. Tip110 Protein Binds to Unphosphorylated RNA Polymerase II and Promotes Its Phosphorylation and HIV-1 Long Terminal Repeat Transcription *. Journal of Biological Chemistry 2014, 289, 190–202. [Google Scholar] [CrossRef] [PubMed]
- Pedro, K.D.; Agosto, L.M.; Sewell, J.A.; Eberenz, K.A.; He, X.; Bass, J.I.F.; Henderson, A.J. A functional screen identifies transcriptional networks that regulate HIV-1 and HIV-2. Proceedings of the National Academy of Sciences 2021, 118, e2012835118. [Google Scholar] [CrossRef] [PubMed]
- Elbezanti, W.; Lin, A.; Schirling, A.; Jackson, A.; Marshall, M.; Duyne, R.V.; Maldarelli, F.; Sardo, L.; Klase, Z. Benzodiazepines Drive Alteration of Chromatin at the Integrated HIV-1 LTR. Viruses 2020, 12. [Google Scholar] [CrossRef] [PubMed]
- Shan, L.; Rabi, S.A.; Laird, G.M.; Eisele, E.E.; Zhang, H.; Margolick, J.B.; Siliciano, R.F. A Novel PCR Assay for Quantification of HIV-1 RNA. Journal of Virology 2013, 87, 6521. [Google Scholar] [CrossRef] [PubMed]
- Pereira, L.A.; Bentley, K.; Peeters, A.; Churchill, M.J.; Deacon, N.J. A compilation of cellular transcription factor interactions with the HIV-1 LTR promoter. Nucleic Acids Res 2000, 28, 663–668. [Google Scholar] [CrossRef]
- Li, L.; Dahiya, S.; Kortagere, S.; Aiamkitsumrit, B.; Cunningham, D.; Pirrone, V.; Nonnemacher, M.R.; Wigdahl, B. Impact of Tat Genetic Variation on HIV-1 Disease. Adv Virol 2012, 2012, 123605–123605. [Google Scholar] [CrossRef]
- Chiang, C.M.; Ge, H.; Wang, Z.; Hoffmann, A.; Roeder, R.G. Unique TATA-binding protein-containing complexes and cofactors involved in transcription by RNA polymerases II and III. The EMBO Journal 1993, 12, 2749–2762. [Google Scholar] [CrossRef]
- Ferreri, K.; Gill, G.; Montminy, M. The cAMP-regulated transcription factor CREB interacts with a component of the TFIID complex. Proc Natl Acad Sci U S A 1994, 91, 1210–1213. [Google Scholar] [CrossRef]
- Altarejos, J.Y.; Montminy, M. CREB and the CRTC co-activators: sensors for hormonal and metabolic signals. Nat Rev Mol Cell Biol 2011, 12, 141–151. [Google Scholar] [CrossRef] [PubMed]
- Saluja, D.; Vassallo, M.F.; Tanese, N. Distinct subdomains of human TAFII130 are required for interactions with glutamine-rich transcriptional activators. Molecular and cellular biology 1998, 18, 5734–5743. [Google Scholar] [CrossRef] [PubMed]
- Ma, L.; Chen, S.; Wang, Z.; Guo, S.; Zhao, J.; Yi, D.; Li, Q.; Liu, Z.; Guo, F.; Li, X.; et al. The CREB Regulated Transcription Coactivator 2 Suppresses HIV-1 Transcription by Preventing RNA Pol II from Binding to HIV-1 LTR. Virol Sin 2021, 36, 796–809. [Google Scholar] [CrossRef] [PubMed]
- Miller, R.A.; Chu, Q.; Xie, J.; Foretz, M.; Viollet, B.; Birnbaum, M.J. Biguanides suppress hepatic glucagon signalling by decreasing production of cyclic AMP. Nature 2013, 494, 256. [Google Scholar] [CrossRef] [PubMed]
- Song, C.Z.; Keller, K.; Chen, Y.; Murata, K.; Stamatoyannopoulos, G. Transcription coactivator CBP has direct DNA binding activity and stimulates transcription factor DNA binding through small domains. Biochemical and biophysical research communications 2002, 296, 118–124. [Google Scholar] [CrossRef] [PubMed]
- Janknecht, R.; Hunter, T. Transcription. A growing coactivator network. Nature 1996, 383, 22–23. [Google Scholar] [CrossRef] [PubMed]
- He, Z.-X.; Wei, B.-F.; Zhang, X.; Gong, Y.-P.; Ma, L.-Y.; Zhao, W. Current development of CBP/p300 inhibitors in the last decade. European Journal of Medicinal Chemistry 2021, 209, 112861. [Google Scholar] [CrossRef]
- Xie, F.; Li, B.X.; Kassenbrock, A.; Xue, C.; Wang, X.; Qian, D.Z.; Sears, R.C.; Xiao, X. Identification of a Potent Inhibitor of CREB-Mediated Gene Transcription with Efficacious in Vivo Anticancer Activity. J Med Chem 2015, 58, 5075–5087. [Google Scholar] [CrossRef]
- Qin, Y.; Chen, W.; Jiang, G.; Zhou, L.; Yang, X.; Li, H.; He, X.; Wang, H.L.; Zhou, Y.B.; Huang, S.; et al. Interfering MSN-NONO complex-activated CREB signaling serves as a therapeutic strategy for triple-negative breast cancer. Sci Adv 2020, 6, eaaw9960. [Google Scholar] [CrossRef]
- Zhang, B.; Zhang, P.; Tan, Y.; Feng, P.; Zhang, Z.; Liang, H.; Duan, W.; Jin, Z.; Wang, X.; Liu, J.; et al. C1q-TNF-related protein-3 attenuates pressure overload-induced cardiac hypertrophy by suppressing the p38/CREB pathway and p38-induced ER stress. Cell Death Dis 2019, 10, 520. [Google Scholar] [CrossRef]
- Silwal, P.; Kim, J.K.; Yuk, J.-M.; Jo, E.-K. AMP-Activated Protein Kinase and Host Defense against Infection. Int J Mol Sci 2018, 19, 3495. [Google Scholar] [CrossRef] [PubMed]
- Green, V.A.; Pelkmans, L. A Systems Survey of Progressive Host-Cell Reorganization during Rotavirus Infection. Cell Host Microbe 2016, 20, 107–120. [Google Scholar] [CrossRef] [PubMed]
- Martin, C.; Leyton, L.; Arancibia, Y.; Cuevas, A.; Zambrano, A.; Concha, M.I.; Otth, C. Modulation of the AMPK/Sirt1 axis during neuronal infection by herpes simplex virus type 1. J Alzheimers Dis 2014, 42, 301–312. [Google Scholar] [CrossRef] [PubMed]
- Lo, A.K.; Lo, K.W.; Ko, C.W.; Young, L.S.; Dawson, C.W. Inhibition of the LKB1-AMPK pathway by the Epstein-Barr virus-encoded LMP1 promotes proliferation and transformation of human nasopharyngeal epithelial cells. J Pathol 2013, 230, 336–346. [Google Scholar] [CrossRef] [PubMed]
- Romero-Gomez, M.; Diago, M.; Andrade, R.J.; Calleja, J.L.; Salmeron, J.; Fernandez-Rodriguez, C.M.; Sola, R.; Garcia-Samaniego, J.; Herrerias, J.M.; De la Mata, M.; et al. Treatment of insulin resistance with metformin in naive genotype 1 chronic hepatitis C patients receiving peginterferon alfa-2a plus ribavirin. Hepatology 2009, 50, 1702–1708. [Google Scholar] [CrossRef] [PubMed]
- Chen, Y.; Gu, F.; Guan, J.-L. Metformin Might Inhibit Virus through Increasing Insulin Sensitivity. Chin Med J (Engl) 2018, 131, 376–377. [Google Scholar] [CrossRef] [PubMed]
- Cheng, F.; Ramos da Silva, S.; Huang, I.C.; Jung, J.U.; Gao, S.-J. Suppression of Zika Virus Infection and Replication in Endothelial Cells and Astrocytes by PKA Inhibitor PKI 14-22. Journal of Virology 2018, 92, e02019–e02017. [Google Scholar] [CrossRef] [PubMed]
- Htun, H.L.; Yeo, T.W.; Tam, C.C.; Pang, J.; Leo, Y.S.; Lye, D.C. Metformin Use and Severe Dengue in Diabetic Adults. Sci Rep 2018, 8, 3344. [Google Scholar] [CrossRef]
- Osuna-Ramos, J.F.; Reyes-Ruiz, J.M.; del Ángel, R.M. The Role of Host Cholesterol During Flavivirus Infection. Frontiers in Cellular and Infection Microbiology 2018, 8. [Google Scholar] [CrossRef]
- Soto-Acosta, R.; Bautista-Carbajal, P.; Cervantes-Salazar, M.; Angel-Ambrocio, A.H.; Del Angel, R.M. DENV up-regulates the HMG-CoA reductase activity through the impairment of AMPK phosphorylation: A potential antiviral target. PLoS Pathog 2017, 13, e1006257. [Google Scholar] [CrossRef]
- Zhang, H.S.; Wu, T.C.; Sang, W.W.; Ruan, Z. EGCG inhibits Tat-induced LTR transactivation: role of Nrf2, AKT, AMPK signaling pathway. Life Sci 2012, 90, 747–754. [Google Scholar] [CrossRef]
- Samikkannu, T.; Atluri, V.S.; Nair, M.P. HIV and Cocaine Impact Glial Metabolism: Energy Sensor AMP-activated protein kinase Role in Mitochondrial Biogenesis and Epigenetic Remodeling. Sci Rep 2016, 6, 31784. [Google Scholar] [CrossRef] [PubMed]
- Guo, H.; Wang, Q.; Ghneim, K.; Wang, L.; Rampanelli, E.; Holley-Guthrie, E.; Cheng, L.; Garrido, C.; Margolis, D.M.; Eller, L.A.; et al. Multi-omics analyses reveal that HIV-1 alters CD4+ T cell immunometabolism to fuel virus replication. Nature Immunology 2021, 22, 423–433. [Google Scholar] [CrossRef] [PubMed]
- Foretz, M.; Hebrard, S.; Leclerc, J.; Zarrinpashneh, E.; Soty, M.; Mithieux, G.; Sakamoto, K.; Andreelli, F.; Viollet, B. Metformin inhibits hepatic gluconeogenesis in mice independently of the LKB1/AMPK pathway via a decrease in hepatic energy state. J Clin Invest 2010, 120, 2355–2369. [Google Scholar] [CrossRef] [PubMed]
- Bridges, H.R.; Jones, A.J.; Pollak, M.N.; Hirst, J. Effects of metformin and other biguanides on oxidative phosphorylation in mitochondria. Biochem J 2014, 462, 475–487. [Google Scholar] [CrossRef]
- Ko, Y.; Choi, A.; Lee, M.; Lee, J.A. Metformin displays in vitro and in vivo antitumor effect against osteosarcoma. Korean J Pediatr 2016, 59, 374–380. [Google Scholar] [CrossRef]
- Hawley, S.A.; Gadalla, A.E.; Olsen, G.S.; Hardie, D.G. The antidiabetic drug metformin activates the AMP-activated protein kinase cascade via an adenine nucleotide-independent mechanism. Diabetes 2002, 51, 2420–2425. [Google Scholar] [CrossRef]
- Wilcock, C.; Bailey, C.J. Accumulation of metformin by tissues of the normal and diabetic mouse. Xenobiotica 1994, 24, 49–57. [Google Scholar] [CrossRef]
- Gormsen, L.C.; Sundelin, E.I.; Jensen, J.B.; Vendelbo, M.H.; Jakobsen, S.; Munk, O.L.; Hougaard Christensen, M.M.; Brøsen, K.; Frøkiær, J.; Jessen, N. In Vivo Imaging of Human 11C-Metformin in Peripheral Organs: Dosimetry, Biodistribution, and Kinetic Analyses. J Nucl Med 2016, 57, 1920–1926. [Google Scholar] [CrossRef]
- Wilcock, C.; Wyre, N.D.; Bailey, C.J. Subcellular distribution of metformin in rat liver. J Pharm Pharmacol 1991, 43, 442–444. [Google Scholar] [CrossRef]
- Mogavero, A.; Maiorana, M.V.; Zanutto, S.; Varinelli, L.; Bozzi, F.; Belfiore, A.; Volpi, C.C.; Gloghini, A.; Pierotti, M.A.; Gariboldi, M. Metformin transiently inhibits colorectal cancer cell proliferation as a result of either AMPK activation or increased ROS production. Scientific Reports 2017, 7, 15992. [Google Scholar] [CrossRef] [PubMed]
- Fromentin, R.; Bakeman, W.; Lawani, M.B.; Khoury, G.; Hartogensis, W.; DaFonseca, S.; Killian, M.; Epling, L.; Hoh, R.; Sinclair, E.; et al. CD4+ T Cells Expressing PD-1, TIGIT and LAG-3 Contribute to HIV Persistence during ART. PLoS pathogens 2016, 12, e1005761. [Google Scholar] [CrossRef] [PubMed]
- Chew, G.M.; Fujita, T.; Webb, G.M.; Burwitz, B.J.; Wu, H.L.; Reed, J.S.; Hammond, K.B.; Clayton, K.L.; Ishii, N.; Abdel-Mohsen, M.; et al. TIGIT Marks Exhausted T Cells, Correlates with Disease Progression, and Serves as a Target for Immune Restoration in HIV and SIV Infection. PLoS Pathog 2016, 12, e1005349. [Google Scholar] [CrossRef] [PubMed]
- Ruelas, D.S.; Greene, W.C. An integrated overview of HIV-1 latency. Cell 2013, 155, 519–529. [Google Scholar] [CrossRef]
- Coiras, M.; López-Huertas, M.R.; Pérez-Olmeda, M.; Alcamí, J. Understanding HIV-1 latency provides clues for the eradication of long-term reservoirs. Nature Reviews Microbiology 2009, 7, 798–812. [Google Scholar] [CrossRef] [PubMed]
- Deeks, S.G.; Lewin, S.R.; Ross, A.L.; Ananworanich, J.; Benkirane, M.; Cannon, P.; Chomont, N.; Douek, D.; Lifson, J.D.; Lo, Y.-R.; et al. International AIDS Society global scientific strategy: towards an HIV cure 2016. Nature Medicine 2016, 22, 839. [Google Scholar] [CrossRef] [PubMed]
- Lei, Y.; Yi, Y.; Liu, Y.; Liu, X.; Keller, E.T.; Qian, C.-N.; Zhang, J.; Lu, Y. Metformin targets multiple signaling pathways in cancer. Chin J Cancer 2017, 36, 17–17. [Google Scholar] [CrossRef]
- Li, Y.; Zhou, T.; Hsu, A.; Edwards, P.A.; Gao, H.; Qiao, X. Metformin reduces inflammation in diabetic human vitreous by activating AMPK and inhibiting NFκB signaling pathway. Investigative Ophthalmology & Visual Science 2019, 60, 6548–6548. [Google Scholar]
- Salminen, A.; Hyttinen, J.M.T.; Kaarniranta, K. AMP-activated protein kinase inhibits NF-κB signaling and inflammation: impact on healthspan and lifespan. J Mol Med (Berl) 2011, 89, 667–676. [Google Scholar] [CrossRef]
- Gillespie, Z.E.; Wang, C.; Vadan, F.; Yu, T.Y.; Ausió, J.; Kusalik, A.; Eskiw, C.H. Metformin induces the AP-1 transcription factor network in normal dermal fibroblasts. Scientific Reports 2019, 9, 5369. [Google Scholar] [CrossRef]
- Cristillo, A.D.; Highbarger, H.C.; Dewar, R.L.; Dimitrov, D.S.; Golding, H.; Bierer, B.E. Up-regulation of HIV coreceptor CXCR4 expression in human T lymphocytes is mediated in part by a cAMP-responsive element. Faseb j 2002, 16, 354–364. [Google Scholar] [CrossRef] [PubMed]
- Banerjee, A.; Luna, L.; Pirrone, V.; Krebs, F.C.; Wigdahl, B.; Nonnemacher, M.R. cAMP Signaling Enhances HIV-1 Long Terminal Repeat (LTR)-directed Transcription and Viral Replication in Bone Marrow Progenitor Cells. Clinical Medicine Insights: Pathology, 1177. [Google Scholar] [CrossRef]
- Krebs, F.C.; Goodenow, M.M.; Wigdahl, B. Neuroglial ATF/CREB factors interact with the human immunodeficiency virus type 1 long terminal repeat. J Neurovirol 1997, 3 Suppl 1, S28–32. [Google Scholar]
- Kim, H.G.; Hien, T.T.; Han, E.H.; Hwang, Y.P.; Choi, J.H.; Kang, K.W.; Kwon, K.-i.; Kim, B.-H.; Kim, S.K.; Song, G.Y.; et al. Metformin inhibits P-glycoprotein expression via the NF-κB pathway and CRE transcriptional activity through AMPK activation. Br J Pharmacol 2011, 162, 1096–1108. [Google Scholar] [CrossRef] [PubMed]
- Kang, H.; Khang, R.; Ham, S.; Jeong, G.R.; Kim, H.; Jo, M.; Lee, B.D.; Lee, Y.I.; Jo, A.; Park, C.; et al. Activation of the ATF2/CREB-PGC-1α pathway by metformin leads to dopaminergic neuroprotection. Oncotarget 2017, 8, 48603–48618. [Google Scholar] [CrossRef] [PubMed]
- Katila, N.; Bhurtel, S.; Park, P.H.; Hong, J.T.; Choi, D.Y. Activation of AMPK/aPKCζ/CREB pathway by metformin is associated with upregulation of GDNF and dopamine. Biochem Pharmacol 2020, 180, 114193. [Google Scholar] [CrossRef]
- Parker, D.; Ferreri, K.; Nakajima, T.; LaMorte, V.J.; Evans, R.; Koerber, S.C.; Hoeger, C.; Montminy, M.R. Phosphorylation of CREB at Ser-133 induces complex formation with CREB-binding protein via a direct mechanism. Mol Cell Biol 1996, 16, 694–703. [Google Scholar] [CrossRef]
- Nakajima, T.; Uchida, C.; Anderson, S.F.; Parvin, J.D.; Montminy, M. Analysis of a cAMP-responsive activator reveals a two-component mechanism for transcriptional induction via signal-dependent factors. Genes Dev 1997, 11, 738–747. [Google Scholar] [CrossRef]

Disclaimer/Publisher’s Note: The statements, opinions and data contained in all publications are solely those of the individual author(s) and contributor(s) and not of MDPI and/or the editor(s). MDPI and/or the editor(s) disclaim responsibility for any injury to people or property resulting from any ideas, methods, instructions or products referred to in the content. |
© 2023 by the authors. Licensee MDPI, Basel, Switzerland. This article is an open access article distributed under the terms and conditions of the Creative Commons Attribution (CC BY) license (http://creativecommons.org/licenses/by/4.0/).


