1. Introduction
With the development of economy, the contradiction between energy and environment is becoming more acute. The rising living standards of residents have intensified the energy consumption, especially in the construction sector. According to statistics, building energy consumption in developed countries accounts for 40% of the total social energy consumption, and the proportion continues to increase with the further development of urbanization. Making use of clean energy natural gas and vigorously developing urban gas is a way to balance resources and environmental problems.
Recently, due to the influence of low-carbon trend and energy security, more attention has been paid to the production and trade of liquefied natural gas (LNG)[
1]. Rich in marine natural resources, and offshore natural gas development has become the next mainstream of the natural gas industry. Restricted by both geographical and spatial factors, floating natural gas liquefaction (FLNG) plant has almost become the only choice for offshore natural gas development[
2]. FLNG is a mobile composite equipment for producing, refining, storing, loading and unloading LNG at sea. As a production device from drilling to liquefaction, it doesn’t need to set up land storage equipment or submarine pipelines, so it has the advantage of protecting the submarine ecosystem. As the core component of the liquefaction of natural gas, the spiral wound tube heat exchanger (SWHE) has the highest cost and the most difficulty in the FLNG system.
SWHE has been widely used in large-scale liquefaction plant because of its small area, high heat transfer efficiency and cross heat transfer of multiple streams[
3]. There are several groups of spirally wound spiral tubes in the SWHE. In the process of natural gas liquefaction, the hot fluid (hydrocarbon refrigerant) in the tube flows from bottom to top, and the cold fluid on the shell side flows from top to bottom between each layer of spiral tubes to realize countercurrent heat transfer. The flow around the tube side of the heat exchanger is mainly the condensation of hydrocarbon refrigerant, and the typical flow process of phase transition in the tube, especially for the mixed working fluid, the temperature slip aggravates the complexity of the flow process.
During the two-phase flow flows in the tube, the change of the shape of the gas-liquid interface forms different flow patterns, and the flow pattern is also affected by momentum and heat transfer in the condensation process. The chaotic characteristic of two-phase flow is obvious, so it is efficient to use the method of flow pattern graph to define flow pattern. In 1945, Baker et al.[
4] proposed a flow pattern diagram of two-phase flow in a horizontal tube, which divides the two-phase flow into bubble flow, slug flow, stratified flow, wave flow and fog flow. Mandhane [
5] extended the results of Govier and Aziz [
6] and took the reduced velocity as coordinate system of the flow pattern diagram, put forward a flow pattern diagram which is widely used at present. The flow pattern diagram well explains the influence of flow velocity and pipe size on the flow pattern, but can’t withdraw the effect of fluid physical properties. Therefore, Weisman[
7] studied the influence of physical parameters and pipe diameter on the flow pattern, used the combination of observation method and pressure signal to distinguish the flow pattern, and selected the modified gas-liquid phase reduced velocity as the coordinate. Then, Taitel [
8] put forward a theoretical criterion according to the actual transition physical mechanism of the flow pattern, and Barnea [
9] verified the flow pattern diagram of Taitel by experiments.
Compared with the horizontal tube, the study of the flow pattern in the spiral tube starts relatively late. Whilley et al.[
10] studied the stratified flow and annular flow in the air-water two-phase flow in the spiral tube, but they didn’t consider the secondary flow in the spiral tube, so the pressure drop data are quite different from the experimental data. Mujawar [
11] extended Lockhart and Martinelli’s correlations to spiral tubes. The results show that the slug flow is the most common flow pattern under the spiral tube, and the type of flow pattern in the tube is similar to that in the horizontal tube. Chen et al. [
12,
13] systematically studied the flow pattern in the spiral tube and drew the flow pattern diagram. At the same time, Weber number and liquid Dean number are introduced to characterize the effect of surface tension and secondary flow. Yan [
14] analyzed the air-water and R113 vapor-liquid two-phase flow in a spiral tube through a high-speed framing camera and found plug flow, slug flow and annular flow in the tube. Yan proposed that the stratified flow will not appear in the spiral upwelling and the original region in flow pattern map is occupied by the slug flow. Murai[
15] measured the two-phase flow in the helical tube by two high-speed framing cameras (front and vertical). It is found that the stratified flow did not appear in the spiral tube, and the bubble flow region becomes narrower with the decrease of the spiral diameter. However, the range of vapor velocity is small in Murai’s experiment, and the wave flow and annular flow are not involved.
When SWHE is used in the FLNG field, the heat exchanger will produce tilting, swing and undulation conditions due to the influence of ocean, which will affect the stability and internal flow of SWHE, and the existing correlation of friction pressure drop can’t well predict the friction pressure drop in the tube [
16]. In order to ensure the normal operation of the equipment, it is necessary to research the two-phase flow characteristics under offshore conditions. There is little research on the influence of offshore sloshing on the friction pressure drop of two-phase flow in a spiral tube. Zhu et al. [
17] analyzed the uniform distribution characteristics in the plate-fin heat exchanger during sloshing condition and found that sloshing reduces the uniform distribution of the system. Yu et al.[
18] analyzed the influence of rolling on the flow characteristics of working medium in a rectangular channel and considered that the angular velocity of rolling is the most important factor affecting the flow rate. Zhang et al.[
16] studied the influence of rolling motion on the friction pressure drop of single-phase working medium in a horizontal tube, and established a friction factor to reflect the influence of rolling motion on friction pressure drop.
At present, the influence of offshore sloshing on the two-phase flow and pressure drop in the spiral wound-tube heat exchanger for FLNG is unknown. According to the working characteristics of FLNG unit, it is necessary to analyze the influence of operation parameters and sloshing parameters on the condensation pressure drop of mixed hydrocarbon medium in spirally wound tubes. The impact trend and degree of sloshing condition on time-averaged friction pressure drop are obtained by experiments, and the quantitative analysis is given, which provides guidance for the study of condensation flow in this kind of wound tube.
2. Experiment system design
2.1. System design
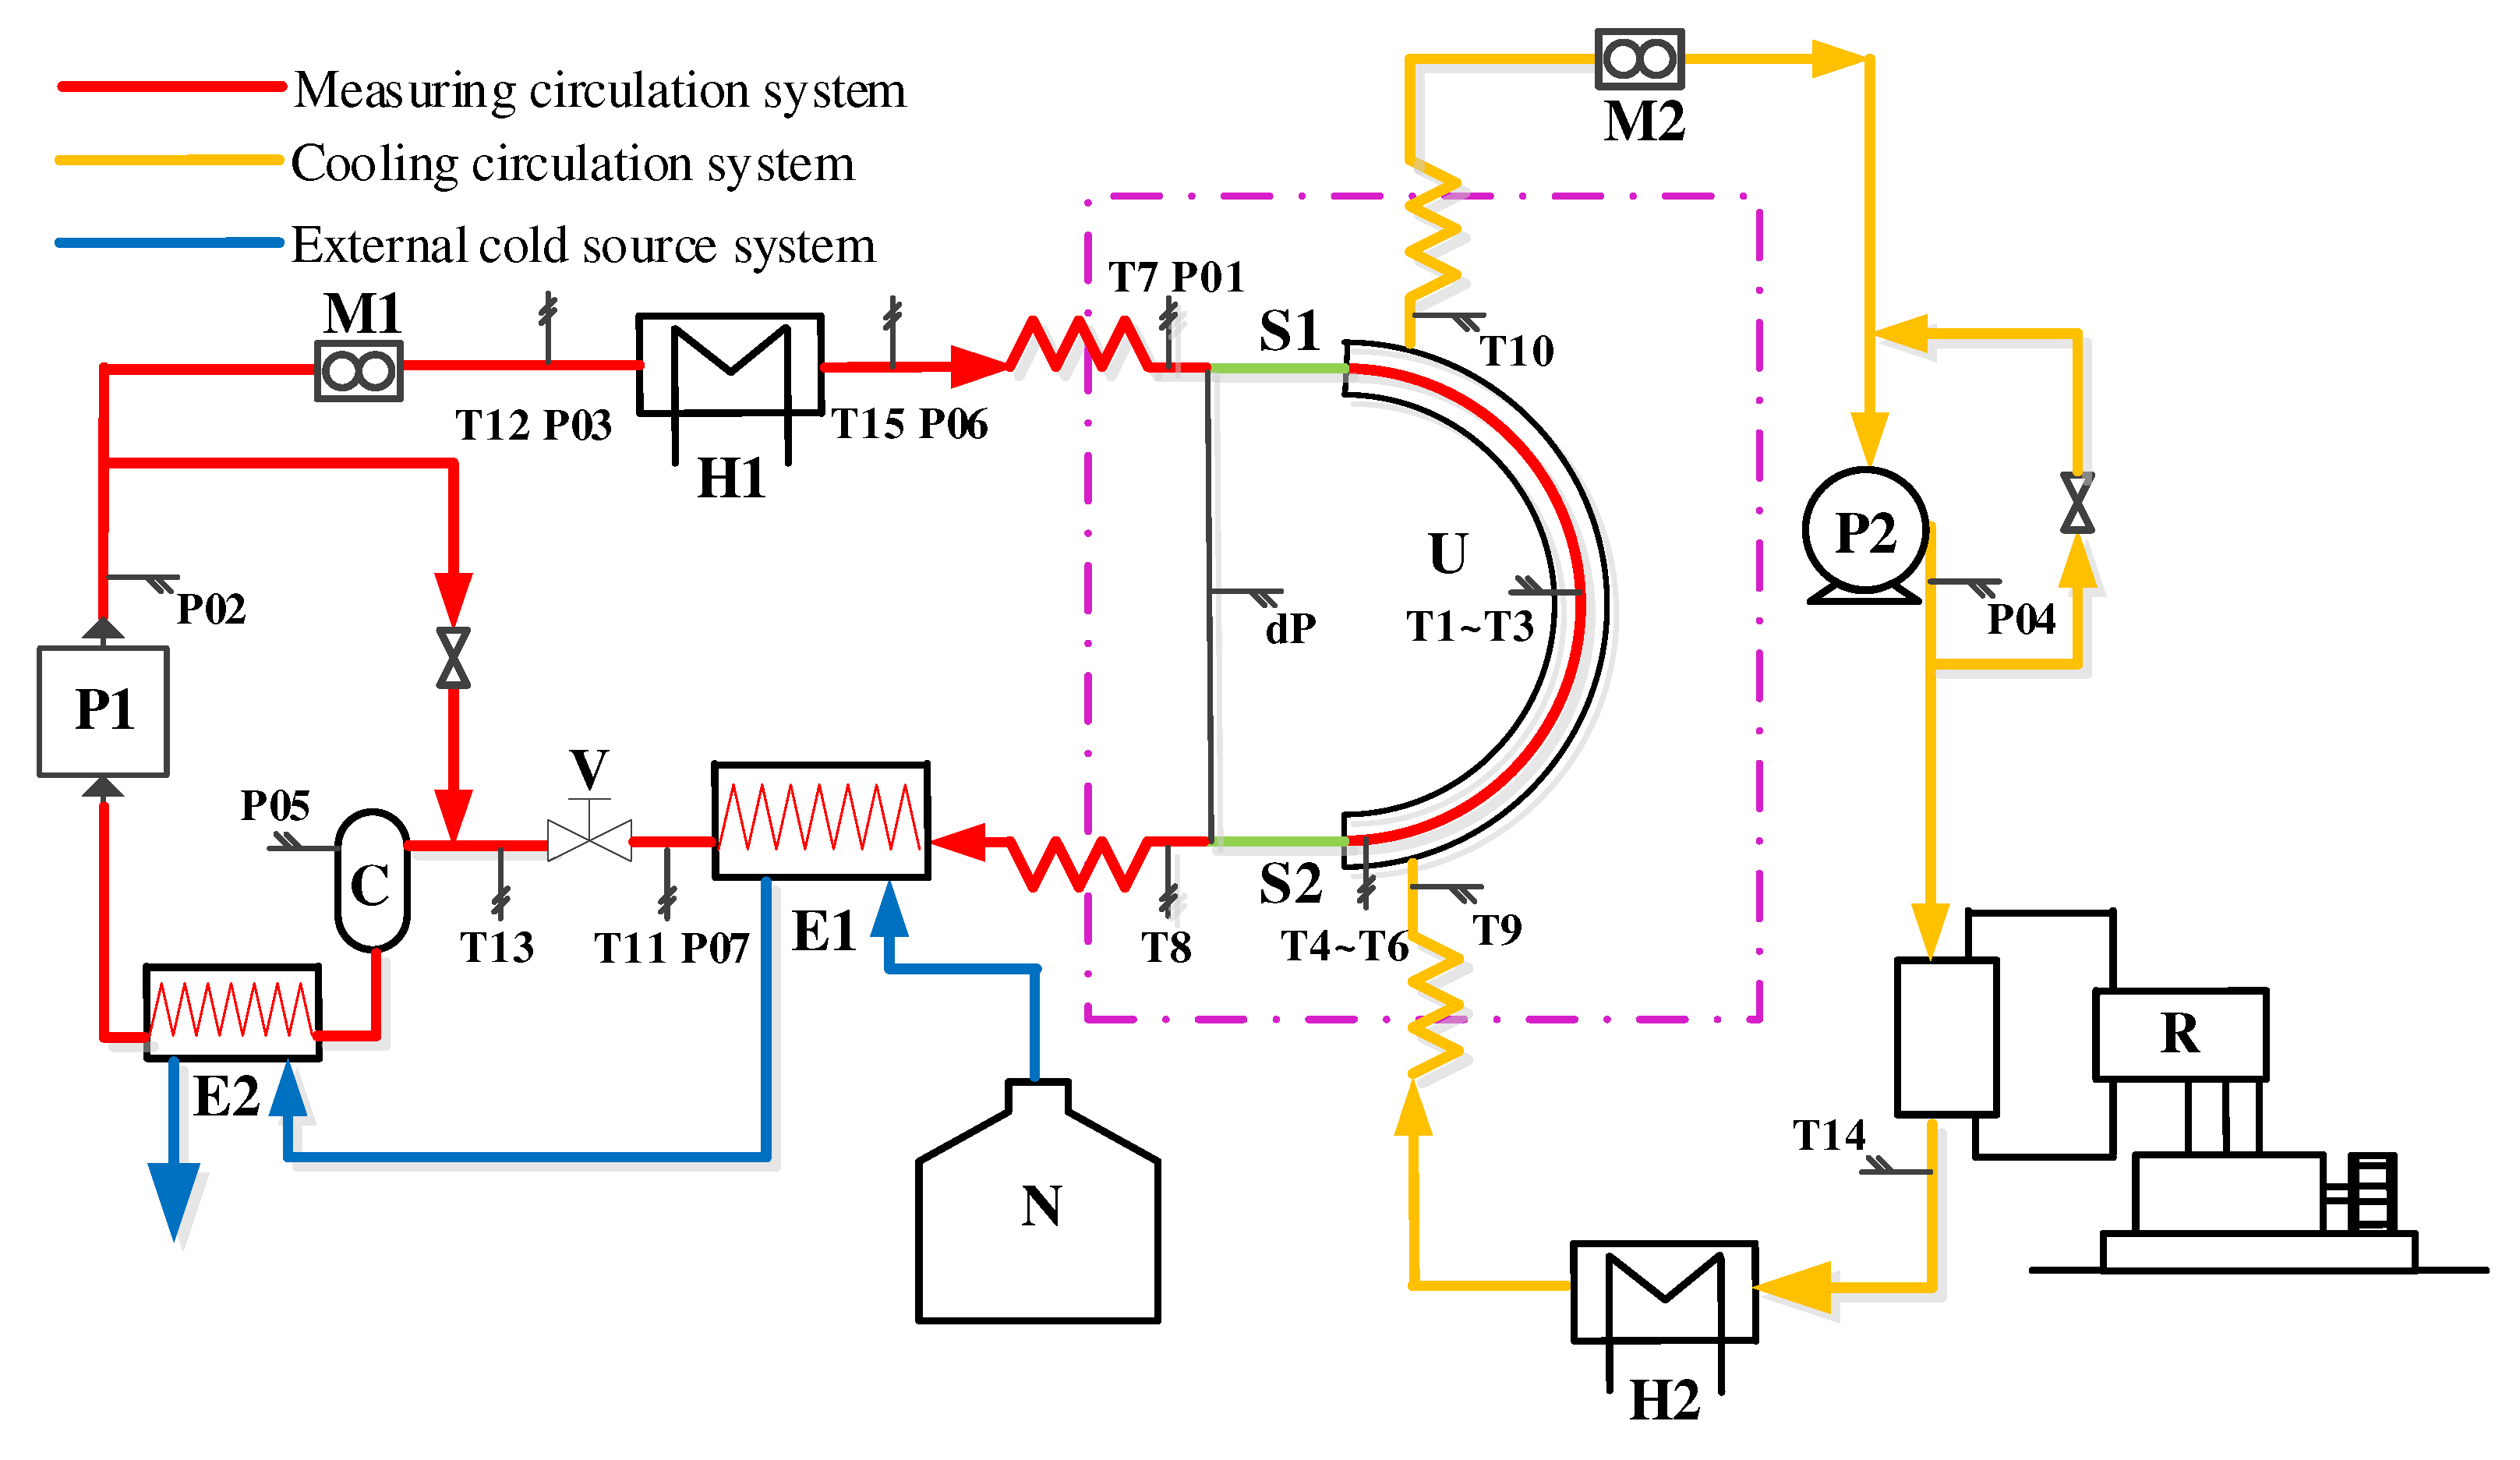
The experiment system consisted by three parts: measuring circulation system, cooling circulation system and external cold source system. The principle of the experimental system is shown in
Figure 1, and the main equipment of system are shown in
Table 1.
The working fluid in the measuring circulating system is methane/ethane mixture (C1/C2), the supercooled working medium (C1/C2) passes through the circulating pump (P1) and then enters the heater (H1). By adjusting the heating power of the H1, the evaporation of the circulating working medium can be controlled and the vapor quality of the inlet of the test sample can be controlled. The circulating medium at the outlet of the H1 is vapor-liquid two-phase, which will lead to inaccurate fluid temperature measurement due to the temperature-difference between vapor phase and liquid phase. When measuring the temperature of vapor-liquid two-phase flow, it is necessary to stir to make the phase state is uniform. After stirring, the original flow pattern is destroyed, and the flow pattern of working medium is reconstructed through the tube. After the flow pattern reconstruction is completed, it enters the observation window (S1), and then enters the test sample. In the test sample, the working fluid is partially condensed. After the test sample, the circulating fluid enters the observation window (S2). After passing through S2, the circulating fluid enters the liquid nitrogen heat exchangers (E1 and E2), and the two-phase flow is cooled into a supercooled liquid, then into the P1 to complete the cycle.
As the current research on single-phase flow has been relatively mature, the main research object of this experiment is the gas-liquid two-phase zone. In the measuring circulation system, the regulation of flow rate is mainly realized by frequency conversion and bypass of circulation pump P1; the regulation of pressure is mainly realized by adjusting valve V; the regulation of dryness is mainly achieved by regulating heating power of heater H1. Through the adjustment of the system to meet the requirements of different working conditions.
Cooling cycle system: The working fluid in the cooling cycle is isobutane, which remains liquid phase throughout the system. Firstly, the supercooled isobutane enters the test sample to cool C1/C2 refrigerant in the measuring circulating system. Before entering the test sample, isobutane adjusts its temperature through the heater (H2) to ensure that the isobutane temperature meets the requirements. In the cooling cycle system, the refrigerator (R) provides cooling capacity for the system. The lowest temperature provided by the R is -140°C, and the temperature control precision is 0.1°C. The control of the temperature outside the test sample tube by the cooling cycle ensures that the flow pattern shown in the flow pattern observation window S1/S2 in the circulation system is the same.
The external cold source system is liquid nitrogen. After testing the sample, the C1/C2 mixture refrigeration in the measuring system is a vapor-liquid two-phase. In order to ensure that the C1/C2 at the inlet of the circulating pump is liquid phase, a large amount of low-temperature cooling must be provided. Liquid nitrogen is stored in a liquid nitrogen tank, and the flow of liquid nitrogen into the heat exchanger E1 and E2 is controlled by the regulation of the flow control valve to provide cooling capacity for the C1/C2 working medium and supercool it.
2.2. Measuring system
The working fluid of this experiment system is C1/C2 mixture and the temperature is very low (<-100°C).To ensure the accurate determination of the data, there are higher requirements for the form of the sensor and the arrangement of the measuring points.
2.2.1. Measuring point
In the experiment, T1~T6 is the measuring point of wall temperature, T7~T15 is the measuring point of fluid temperature. For the test sample T1~T6, the tube wall temperature is measured, and T7 and T8 complete the measurement of fluid temperature. The arrangement of measuring points T1~T6 is the difficulty of this experiment.
The test sample is a section of copper casing with winding angle of 10 °, outer diameter of inner tube 14mm, wall thickness of 2mm and pressure 4MPa. The outer diameter of the outer tube is 32mm, the wall thickness is 1mm, and the pressure 1MPa is. The test sample adopts a sleeve heat transfer structure, the inner tube takes the test circulating working medium (mixed refrigerant), the outer tube moves the low temperature cooling medium (isobutane), the circulating working medium flows from bottom to top, and the cooling medium flows from top to bottom to form countercurrent heat exchange. in order to fully develop the flow pattern in the test sample, a flow pattern development section needs to be added before the circulating working medium enters the test sample. The flow pattern development section of this experiment is a 1m long inclined straight tube tangent to the entrance of the spiral tube. in order to observe the flow pattern, a flow pattern observation window S1 is added between the flow pattern development section and the measuring section. the observation window is made of double-layer vacuum quartz glass with high pressure and good thermal insulation to ensure that there is no additional heat flow when observing the flow pattern. in order to ensure that there is a certain flow pattern in the test sample, in addition to observing at the entrance. It is also necessary to observe the flow pattern at the exit, and if they are the same flow pattern, it can be considered that the working fluid in the tube condenses under a certain flow pattern. For this reason, a flow pattern observation window S 1 is also added at the outlet which is tangent to the outlet of the spiral tube.
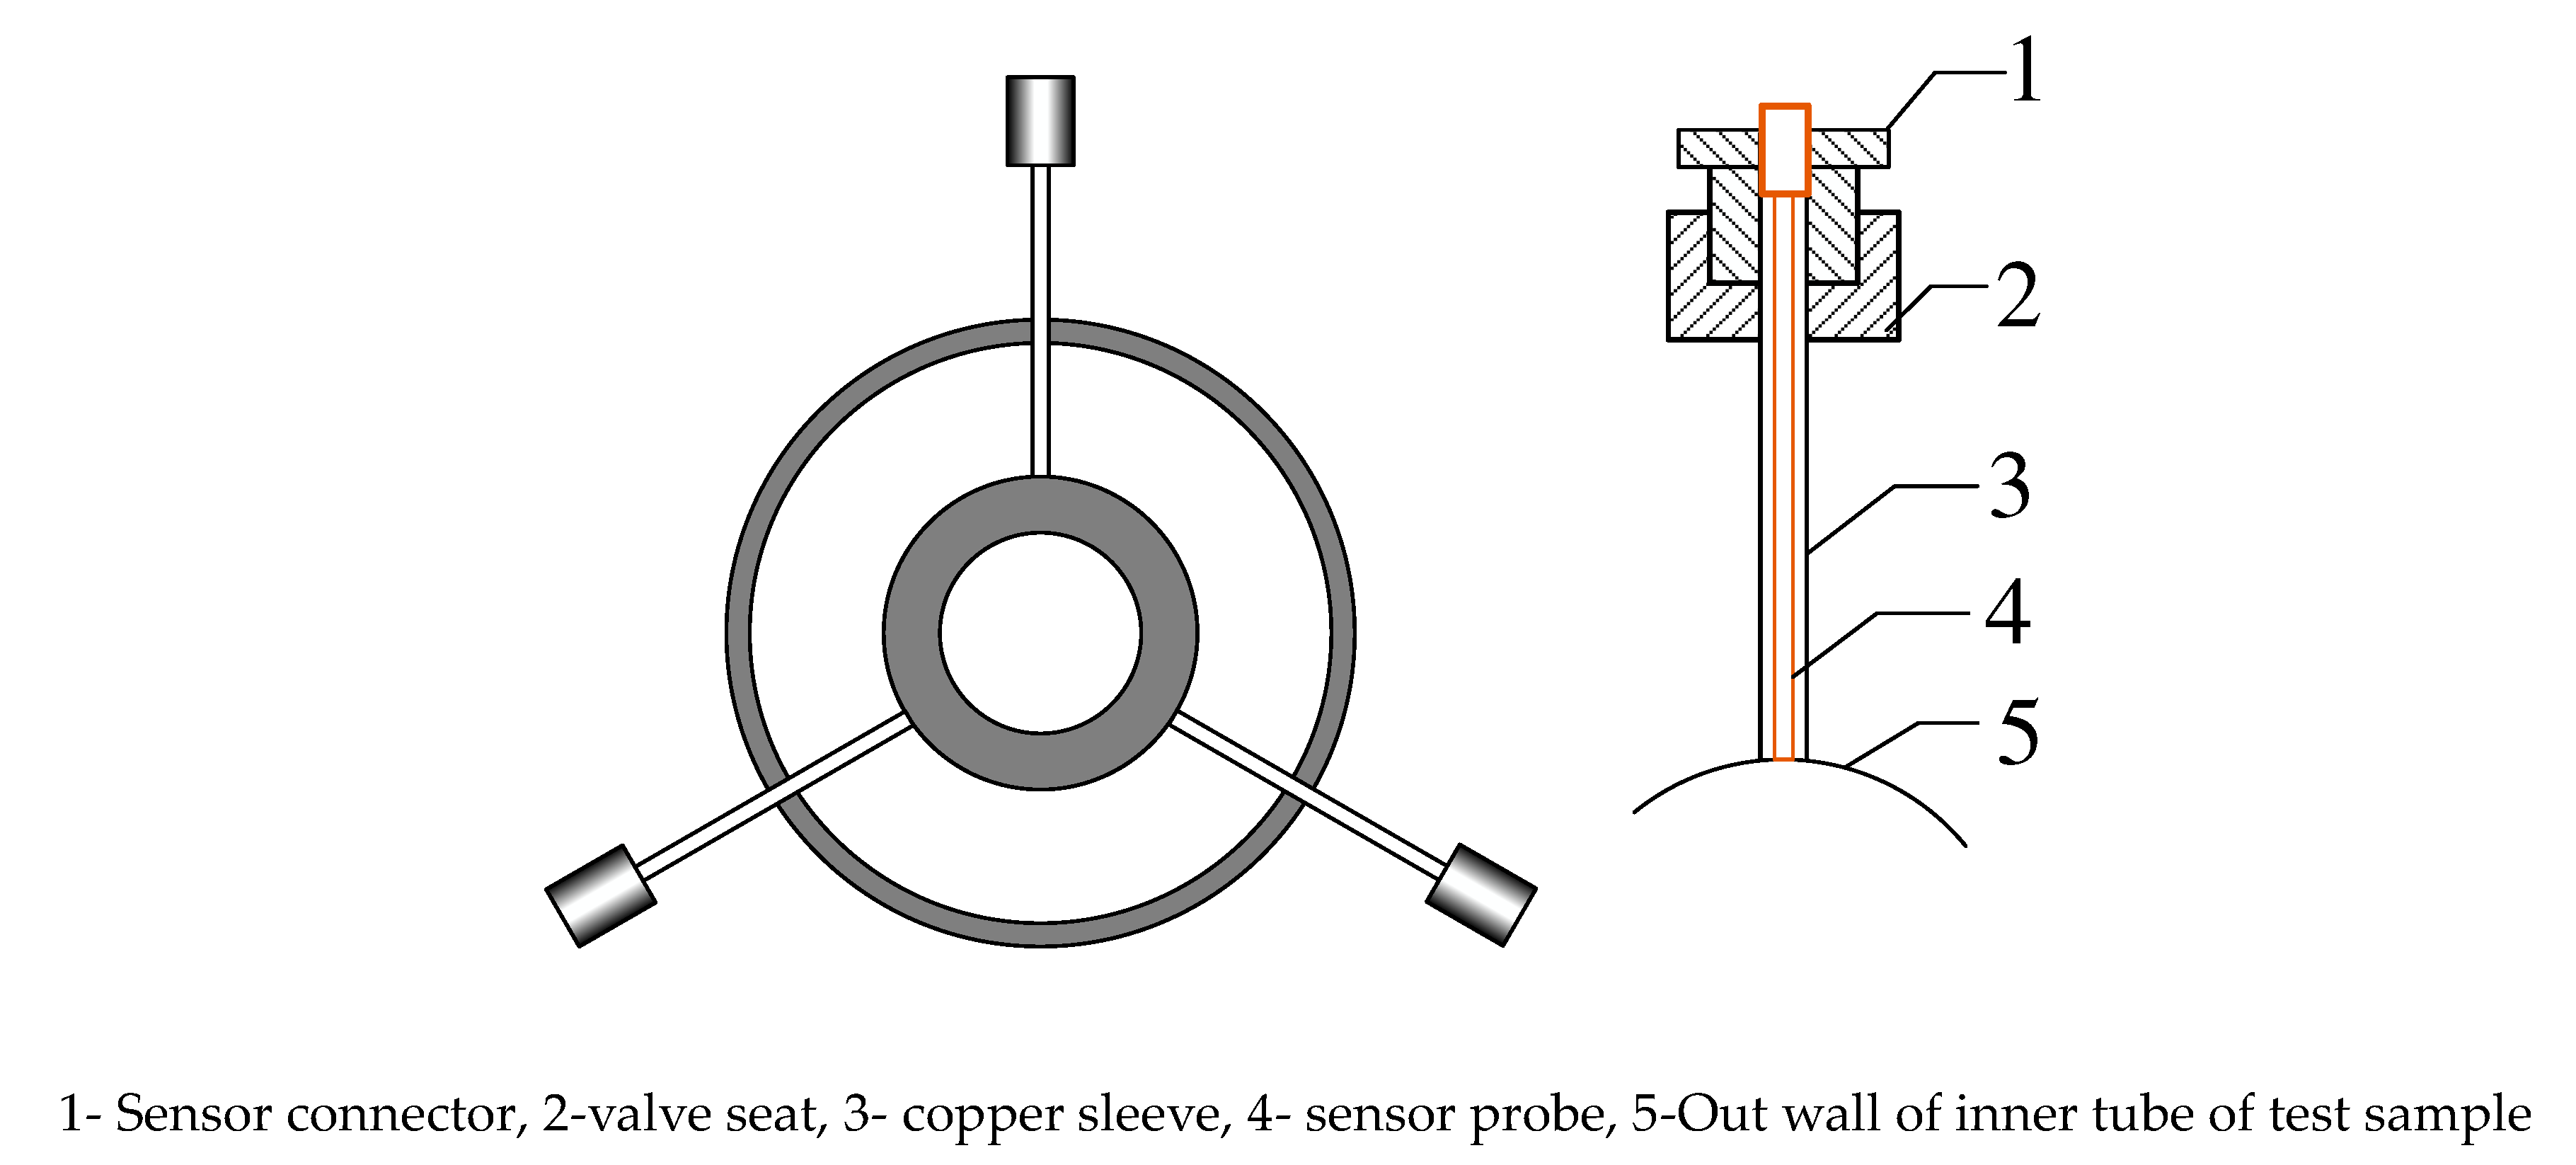
In order to accurately measure the wall temperature of the inner tube of the test sample, temperature measuring points are set up in the middle and outlet positions of the test sample. Each measuring point has three temperature sensors, which are uniformly arranged on the cross section of the tube, one every 120°. The average value of the three measured values is the inner tube wall temperature of the point, and the sensor arrangement is shown in
Figure 2.
2.2.2. Data acquisition system
The experimental test data are collected by Programmable Logic Controller (PLC), the host type is CPU 224XP, and the EM231 module is connected at the same time, which can realize the acquisition of multiple groups of analog and digital data. The experimental parameters to be tested are temperature, pressure, pressure difference and flow rate, which are tested by platinum resistance temperature sensor (PT100), pressure sensor, pressure difference sensor and mass flowmeter. The performance parameters of the sensor are shown in
Table 2.
2.2.3. Sloshing platform
The sloshing platform is designed to simulate the offshore nature gas liquefaction process. The sloshing platform can shake in three directions: rolling, pitching and heave. The operating parameters of the sloshing platform are shown in
Table 3.
3. Result and discuss
Based on the distribution law of condensation friction pressure drop in spiral smooth tube, this paper analyzes the effects of sloshing parameters (sloshing amplitude and sloshing period) and operation parameters (mass flux (m), saturation pressure(P), and vapor quality(x)) on the friction pressure drop of C1/C2 in spiral smooth tube. In the diagram of this section, the bar chart represents the friction pressure drop under the static condition (ΔPf,static) under the corresponding working conditions, which is only used as a comparison of the results under the sloshing condition. And the growth rate of time-averaged friction pressure drop (ΔPf,sloshing/ΔPf,static-1) is used to indicate the influence of sloshing conditions. The inner diameter (d), helix diameter(D), and helix angle (β) of test sample are 10mm, 2m, and 10°.
3.1. Impact of sloshing conditions
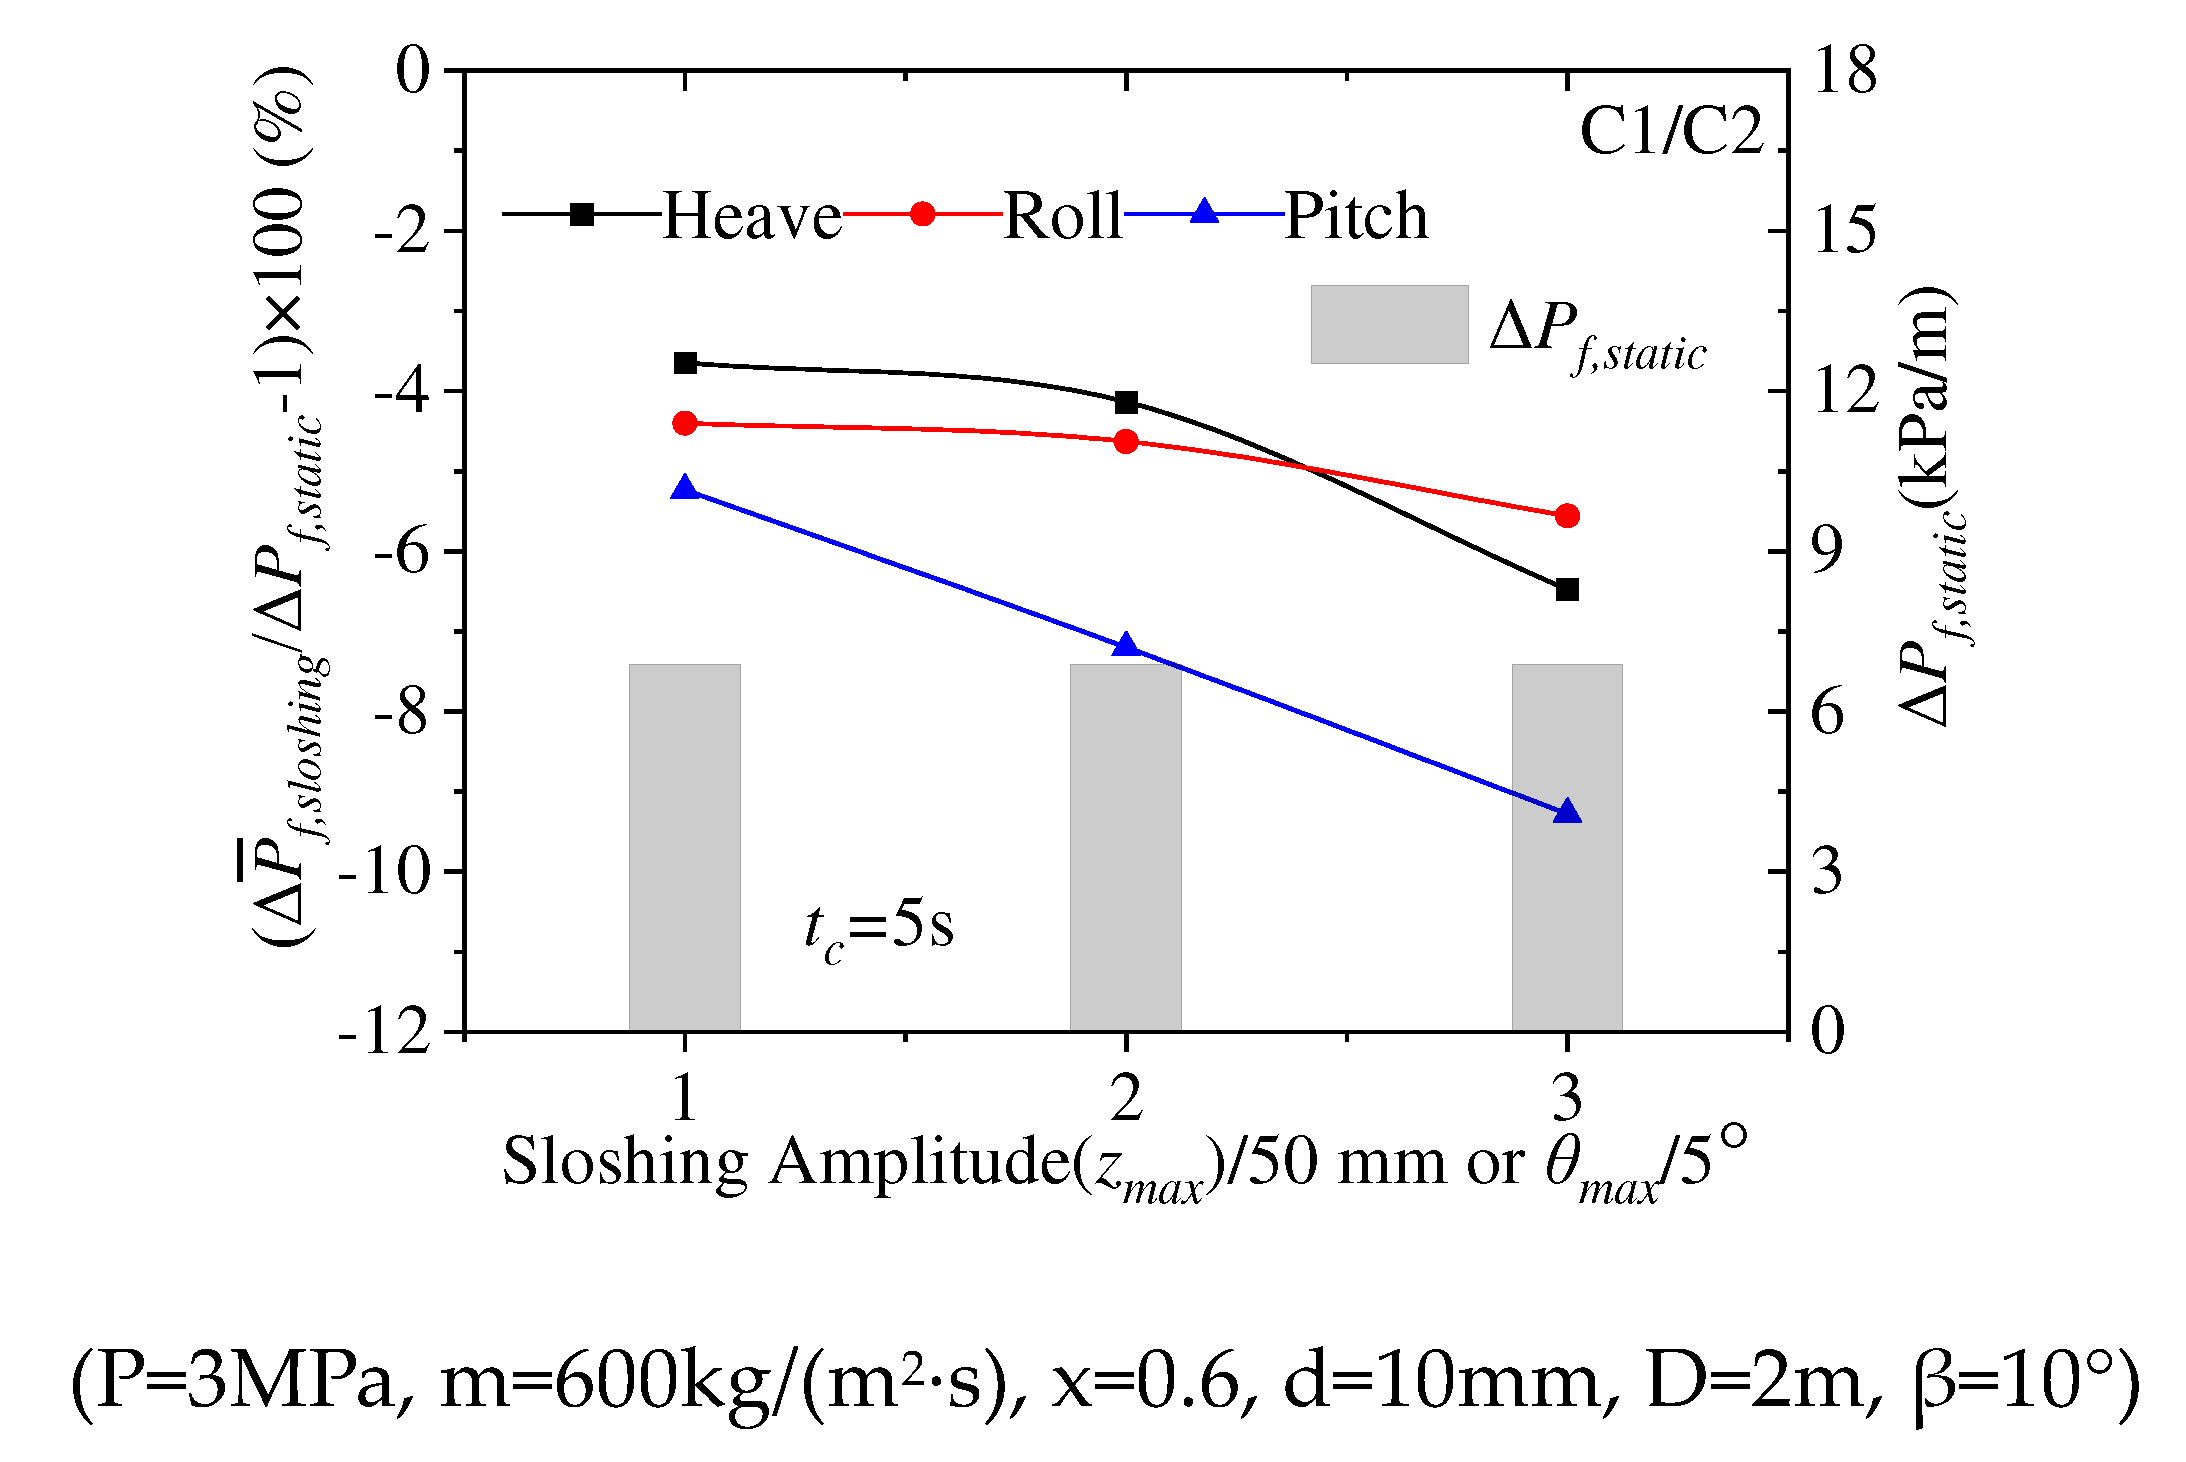
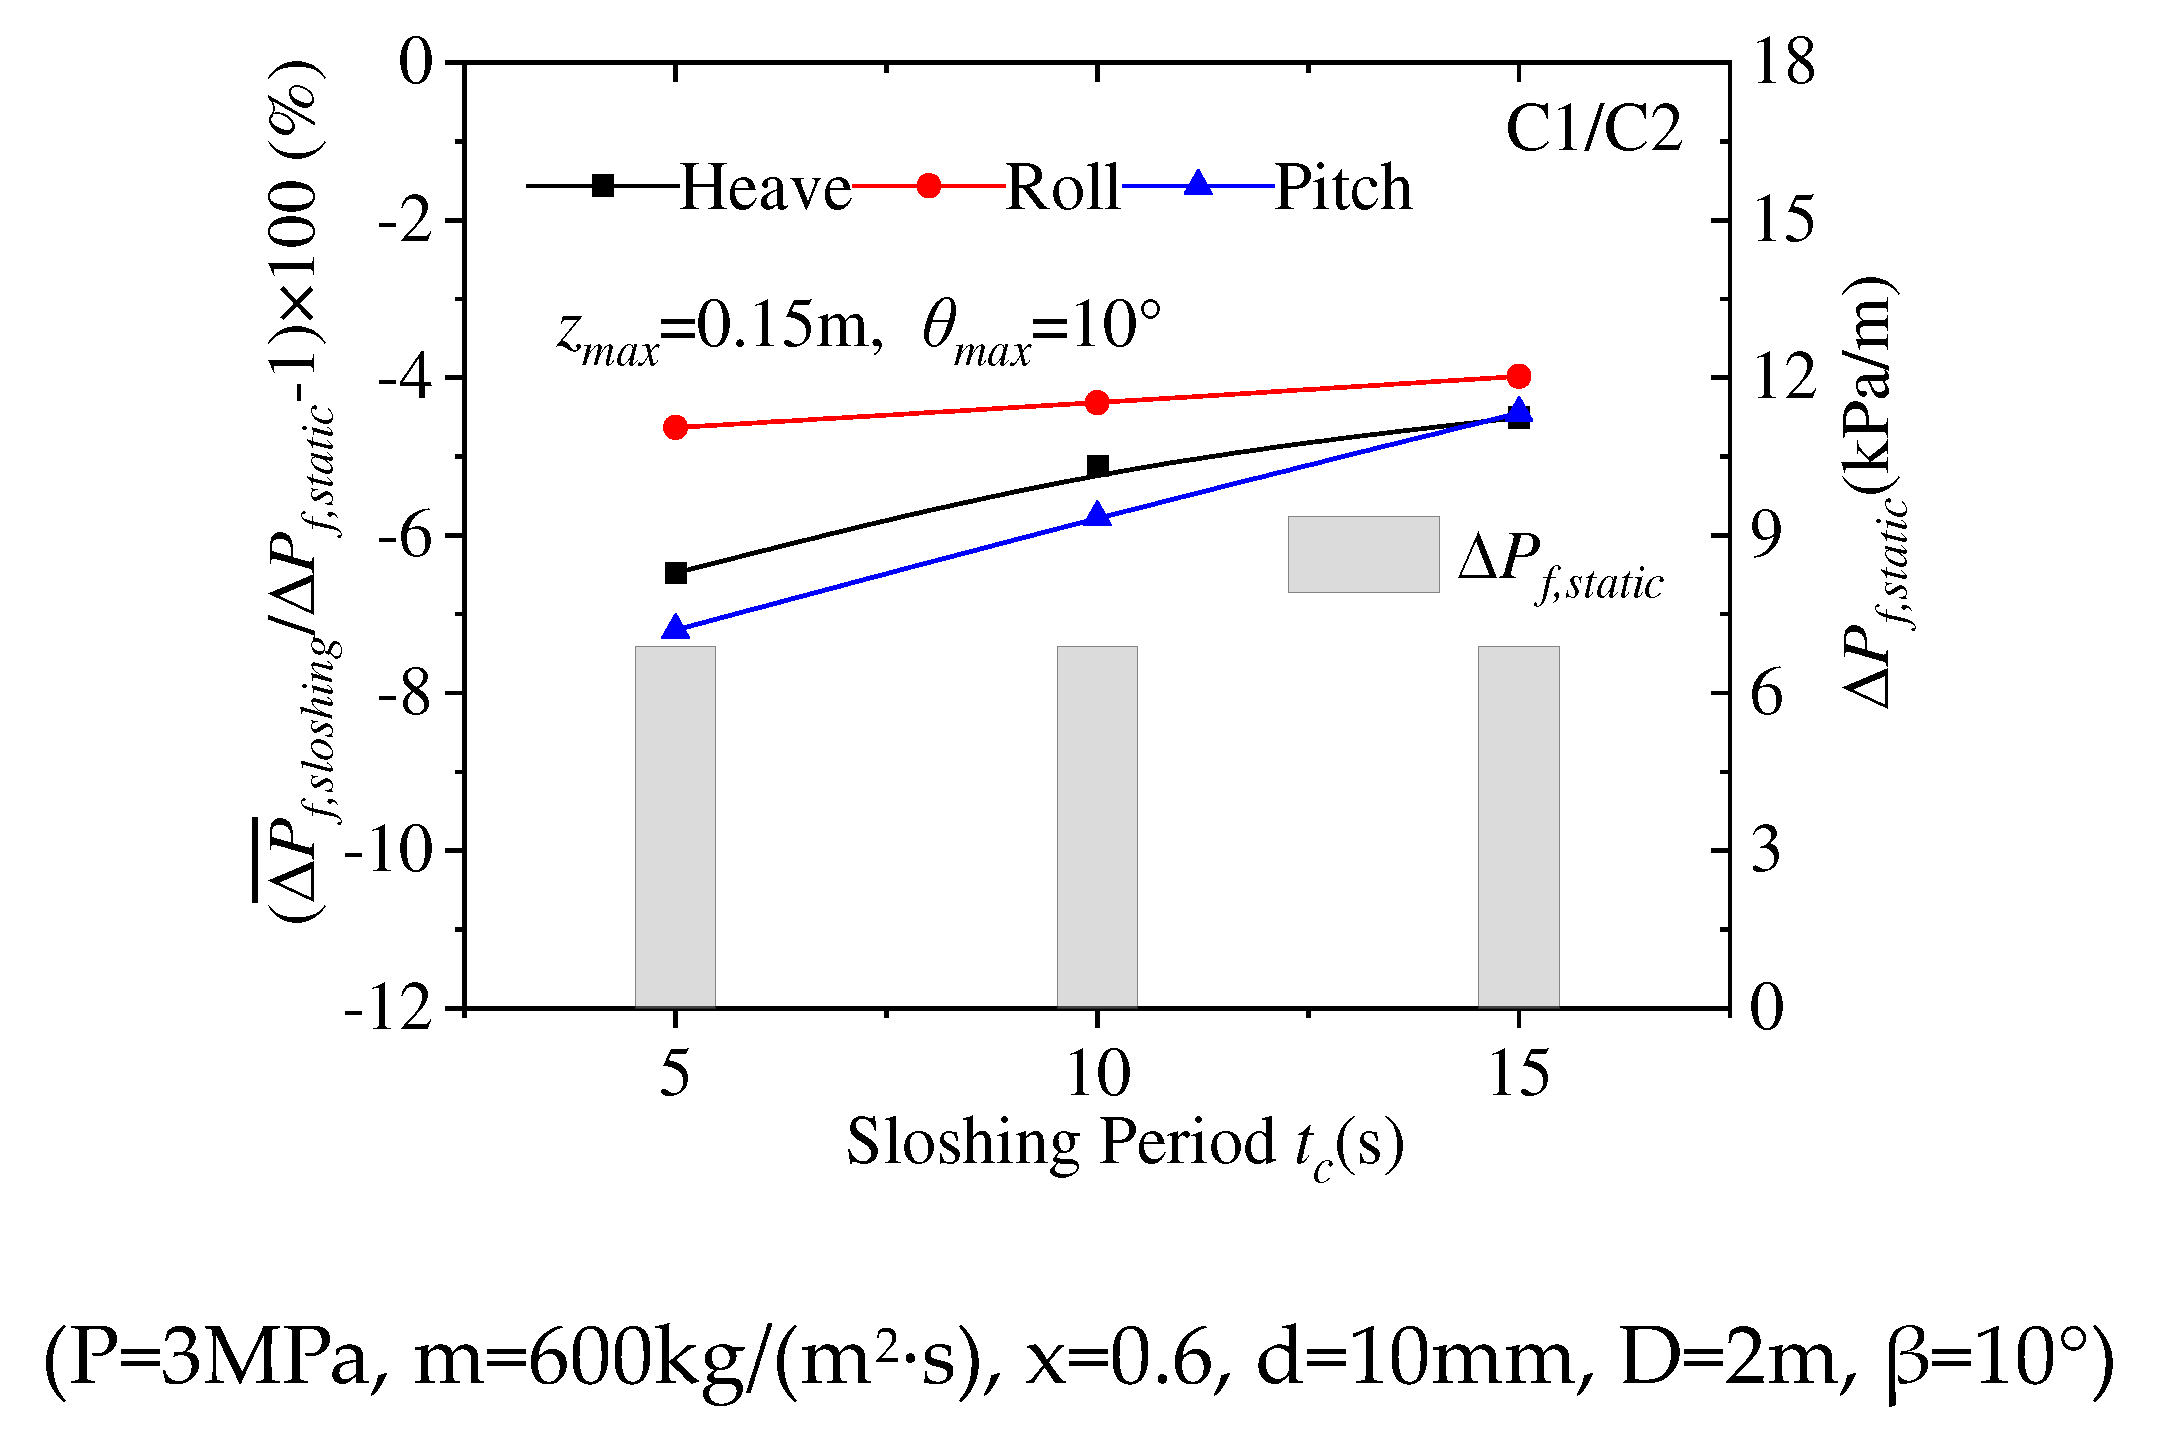
Figure 3 and
Figure 4 show the variation of the friction pressure drop of C1/C2 with sloshing amplitude (z
max or θ
max) at sloshing period (t
c) is 5s and sloshing period at z
max=0.15m or θ
max=10° when operating and structural parameters are constant (P=3MPa, m=600kg/(m
2·s), x=0.6, d=10mm, D=2m, β=10°). From
Figure 4 and
Figure 5, the growth rate of time-averaged friction pressure drop of heave, roll and pitch decreases with the increase of sloshing amplitude and the decrease of sloshing period, and is always less than 0. That means that sloshing will lead to drag reduction, and under large sloshing amplitude and small sloshing period, the gas-liquid slip ratio decreases more significantly, which makes the flow drag reduction more obvious, due to the increase of additional sloshing force.
In addition, the growth rate of time-averaged friction pressure drop under different sloshing parameters of heave, roll and pitch decreases by 4.78%, 4.58% and 6.39%, respectively, compared with static conditions.
3.2 Impact of operation conditions
From
Figure 5,
Figure 6 and
Figure 7, the growth rate of time-averaged friction pressure drop of sloshing condition are basically less than 0 under different operating parameters. That is, sloshing will always lead to drag reduction in different operation parameters, mainly due to the decrease of gas-liquid slip ratio caused by sloshing.
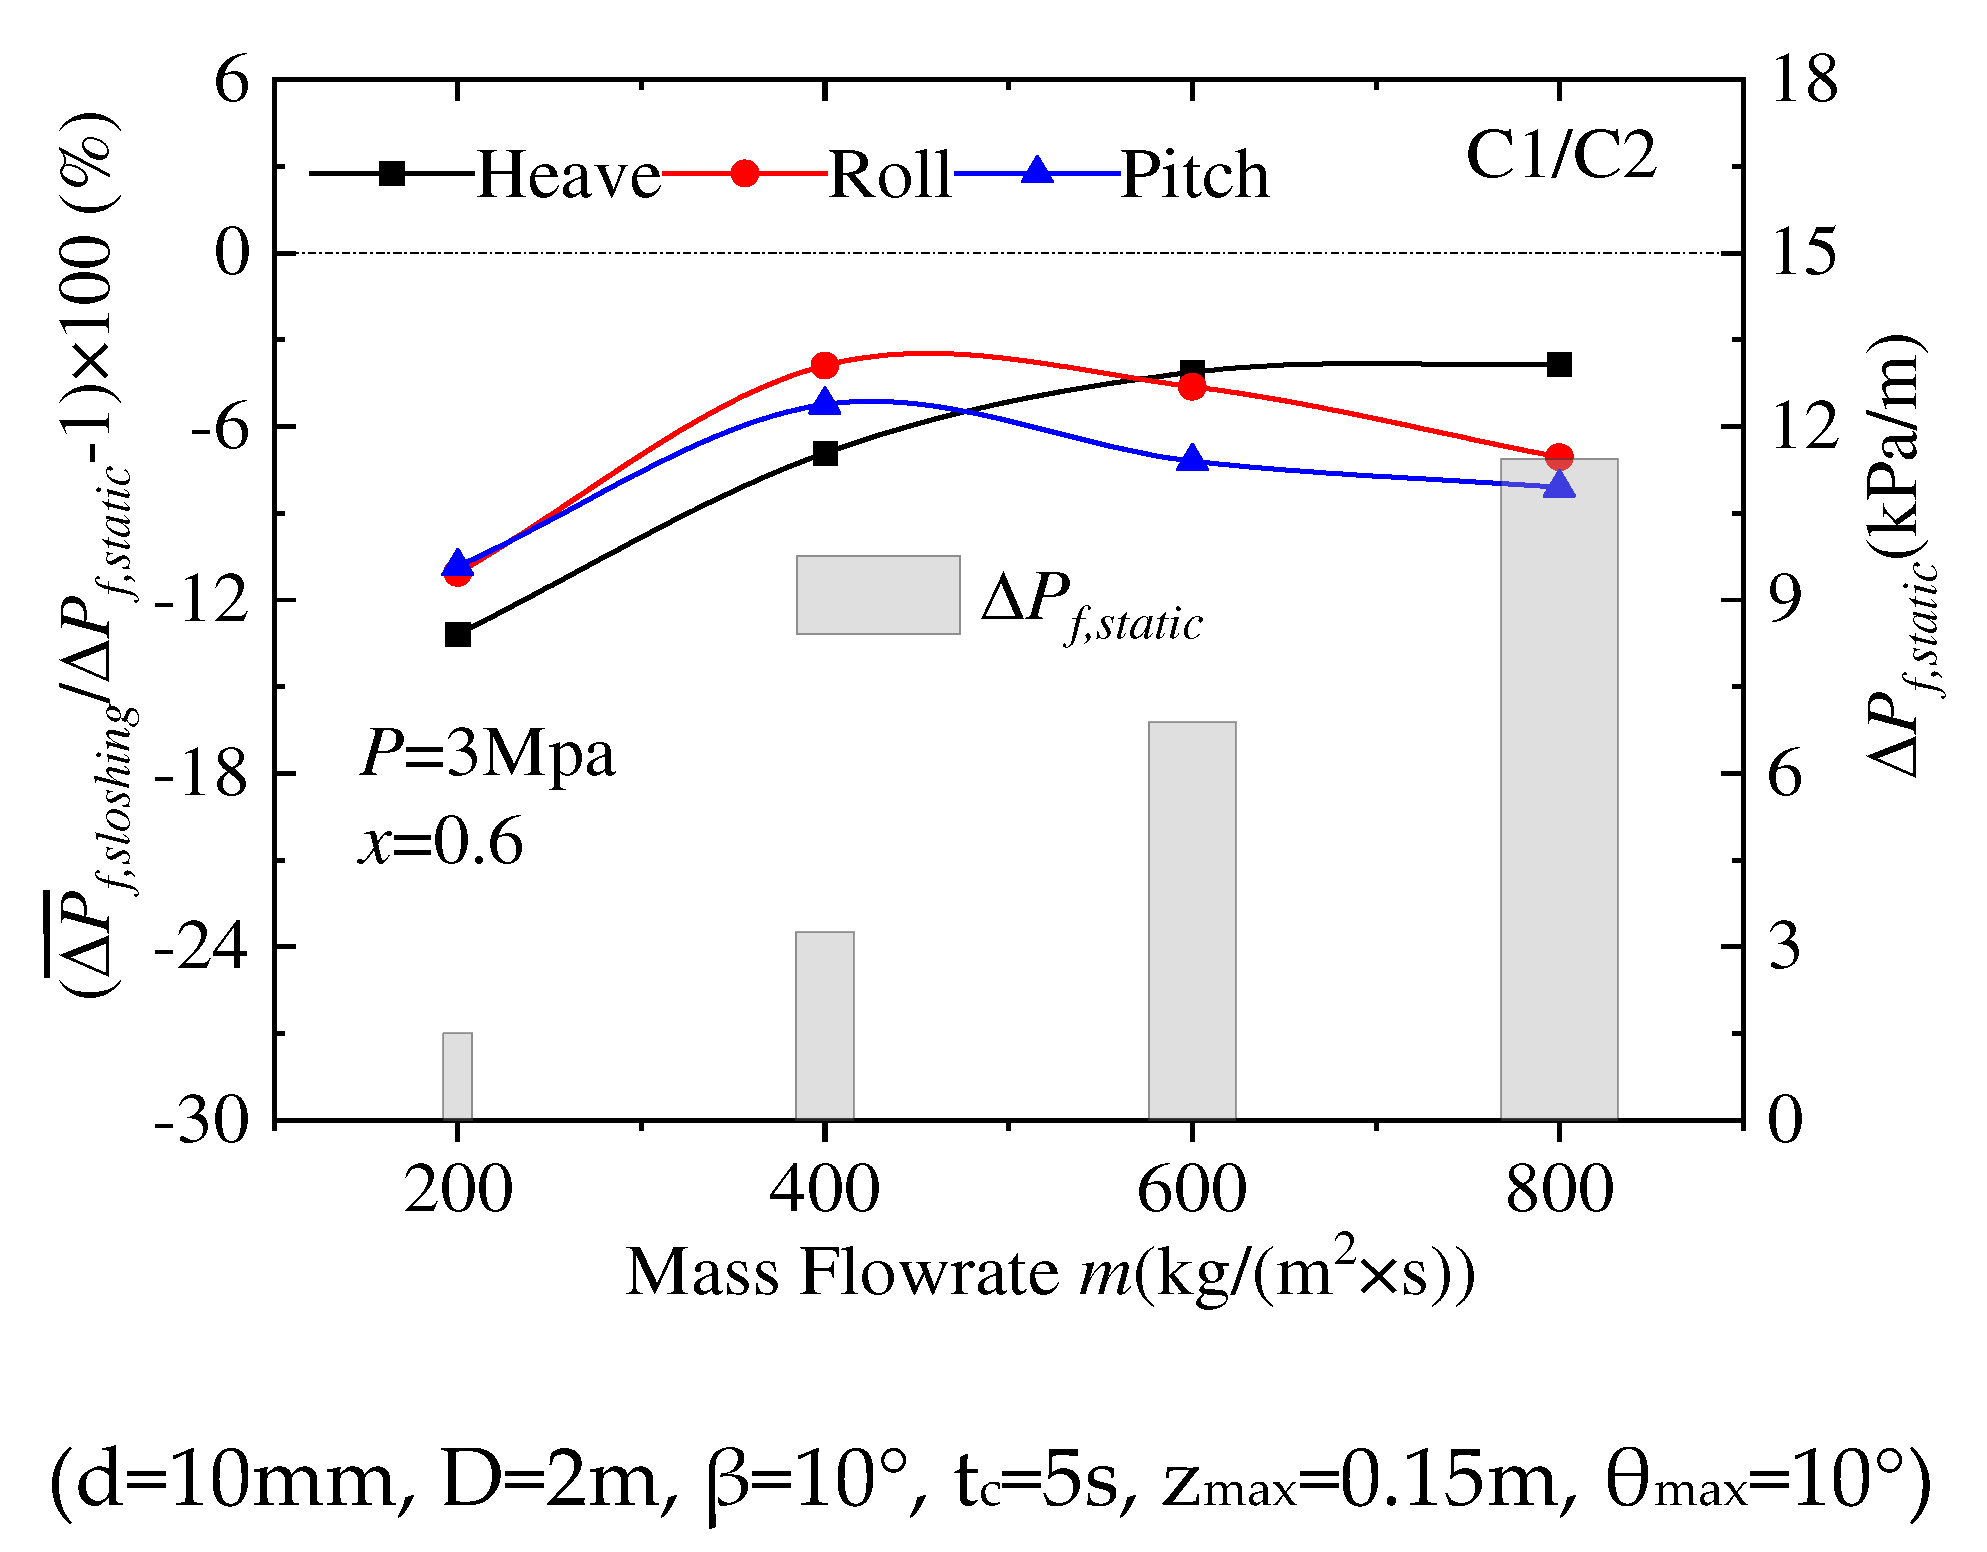
Figure 5 shows the variation of the friction pressure drop of C1/C2 with the mass flux when the sloshing and structural parameters are constant (d=10mm,D=2m,β=10°,t
c=5s,z
max=0.15m,θ
max=10°). With the increase of mass flux, the friction pressure drop increases obviously at static condition. It can be seen from these two pictures; the growth rate of time-averaged friction pressure drop under sloshing condition increases with the increase of mass flow rate and approaches to 0. And under small mass flux, the effect of heave, roll and pitch on friction pressure drop is significant, that because the shear force between vapor and liquid phase is much smaller than the additional force caused by sloshing.
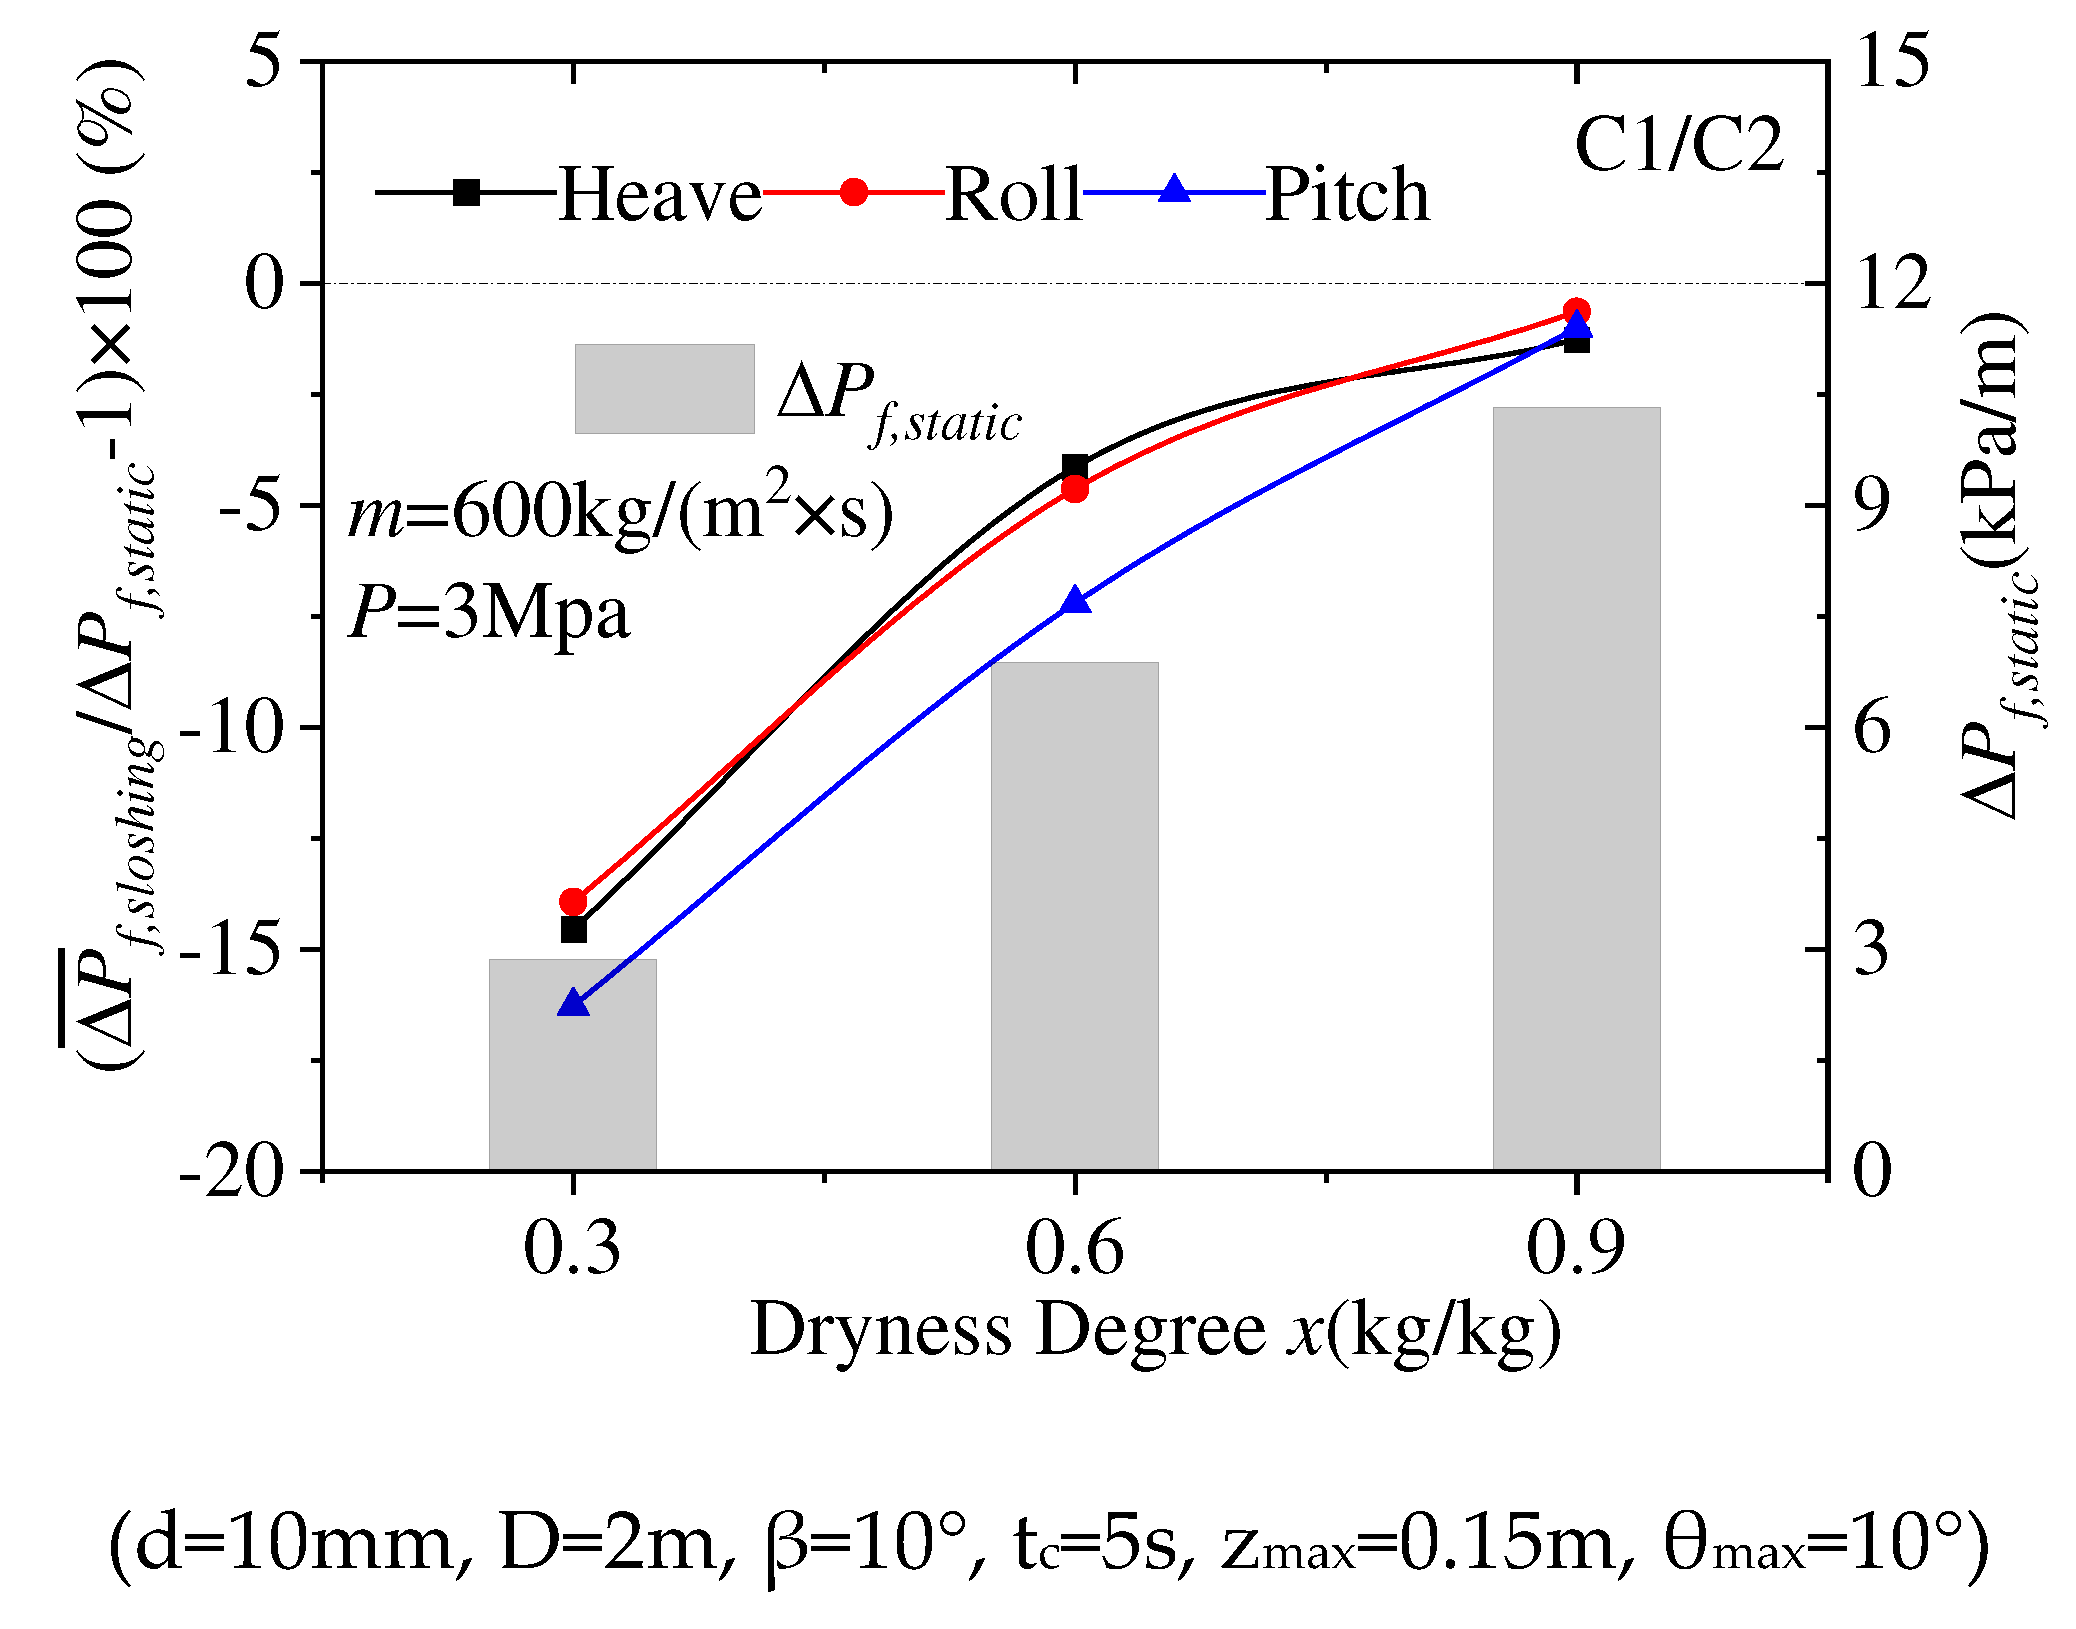
Figure 6 shows the variation of the time-average friction pressure drop of C1/C2 between sloshing and static conditions with P=3MPa,m=600kg/(m
2·s). Under the conditions of heave, roll and pitch, when the vapor quality increases, the friction pressure drop (ΔP
f,static) increases obviously. The growth factor of friction pressure drop in sloshing condition also increases, and the value is close to 0 at x=0.9. At the small vapor quality, sloshing has severe effect on the growth factor of friction pressure drop, and under the high vapor quality, the effect of sloshing is weak. Because when the vapor quality is large, the shear action between vapor and liquid phase is dominant, resulting in the effect of additional force on sloshing is not significant.
Figure 7 shows the variation of the time-average friction pressure drop of C1/C2 between sloshing and static conditions with saturation pressure at m=600kg/(m
2·s),x=0.6. From figure 7, ΔP
f,static decreases with the increasement of saturation pressure, and the saturation pressure has little effect on the growth rate of friction pressure drop under sloshing condition. At high saturation pressure, the vapor-liquid phase density ratio decreases, and the vapor-liquid slip velocity ratio also decreases obviously.
In addition, the drag reduction caused by sloshing is more significant at low saturation pressure, which is due to the decrease of gas-liquid slip ratio caused by sloshing at this condition.
The summary of relative difference on time-averaged frictional pressure drop under different sloshing conditions are shown in .
It can be seen from
Table 5 that heave, roll and pitch can all cause flow drag reduction. Among them, the range of the growth rate of average-time friction pressure drop caused by heave is -14.54% to -1.26%, with an average of-5.99%. And the range of the drag reduction caused by roll and pitch are -17.37%~-0.61% and -16.26%~-1.01%, respectively, with an average of -5.97% and -6.70%, respectively. Under the condition of sloshing, the total variation range of the increment of average friction pressure drop is -17.37%~ -0.61%, with an average of -6.22%.
4. Conclusions
To explore the characteristics of friction pressure drop of mixed hydrocarbon fluid in the spiral tube, an experimental system of condensation two-phase flow was designed. And the effects of sloshing condition (heave, roll and pitching) on the growth rate of time-averaged friction pressure drop of C1/C2 the spiral tube are analyzed emphatically. The specific conclusions are as follows:
(1) The growth rate of time-averaged friction pressure drop during condensation under sloshing condition is less than 0, which indicates that sloshing will lead to drag reduction. And with the increase of sloshing amplitude and the decrease of sloshing period, the flow drag reduction is more obvious. Under the three sloshing parameters, the growth rate of time-averaged friction pressure drop of C1/C2 is reduced by -5.99%%, 5.97% and -6.70% respectively.
(2) Under three kinds of sloshing conditions, the growth rate of time-averaged friction pressure drop increases with the increment of mass flow rate and approaches to 0 gradually. Under high mass flow rate, sloshing has little effect on friction pressure drop.
(3) The growth rate of time-averaged friction pressure drop increases with the increase of vapor quality under sloshing conditions, and the effect of sloshing on friction pressure drop is more significant under small vapor quality conditions. But the increase of saturation pressure has an inverse effect on the friction pressure drop.
