Submitted:
20 April 2023
Posted:
21 April 2023
You are already at the latest version
Abstract
Keywords:
1. Introduction
2. Materials and methods
2.1. Animals and treatment
2.2. Determination of the pancreatic blood flow
2.3. Biochemical analysis
2.4. Measurement of the pancreatic weight and pancreatic histology
- Pancreatic edema: 0 = no edema, 1 = interlobular edema, 2 = interlobular and moderate intralobular edema and 3 = severe interlobular and intralobular edema.
- Leukocyte infiltration: 0 = absent 1 = scarce perivascular infiltration, 2 = moderate perivascular and scarce diffuse infiltration, 3 = abundant diffuse infiltration.
- Vacuolization of acinar cells: 0 = absent, 1 = less than 25%, 2 = 25 – 50% and 3 = more than 50%.
- Acinar necrosis: 0 = absent, 1 = less than 15% of cells involved, 2 = from 15% to 35% of cells involved, 3 = more than 35% of cells involved.
- Hemorrhages: 0 = absent, 1 = from one to two foci per slide, 2 = from three to five foci per slide, 3 = more than five foci per slide.
2.5. Statistical analysis
3. Results
3.1. International normalized ratio (INR)
3.2. Pancreatic histology

3.3. Pancreatic weight
3.4. Serum activity of amylase
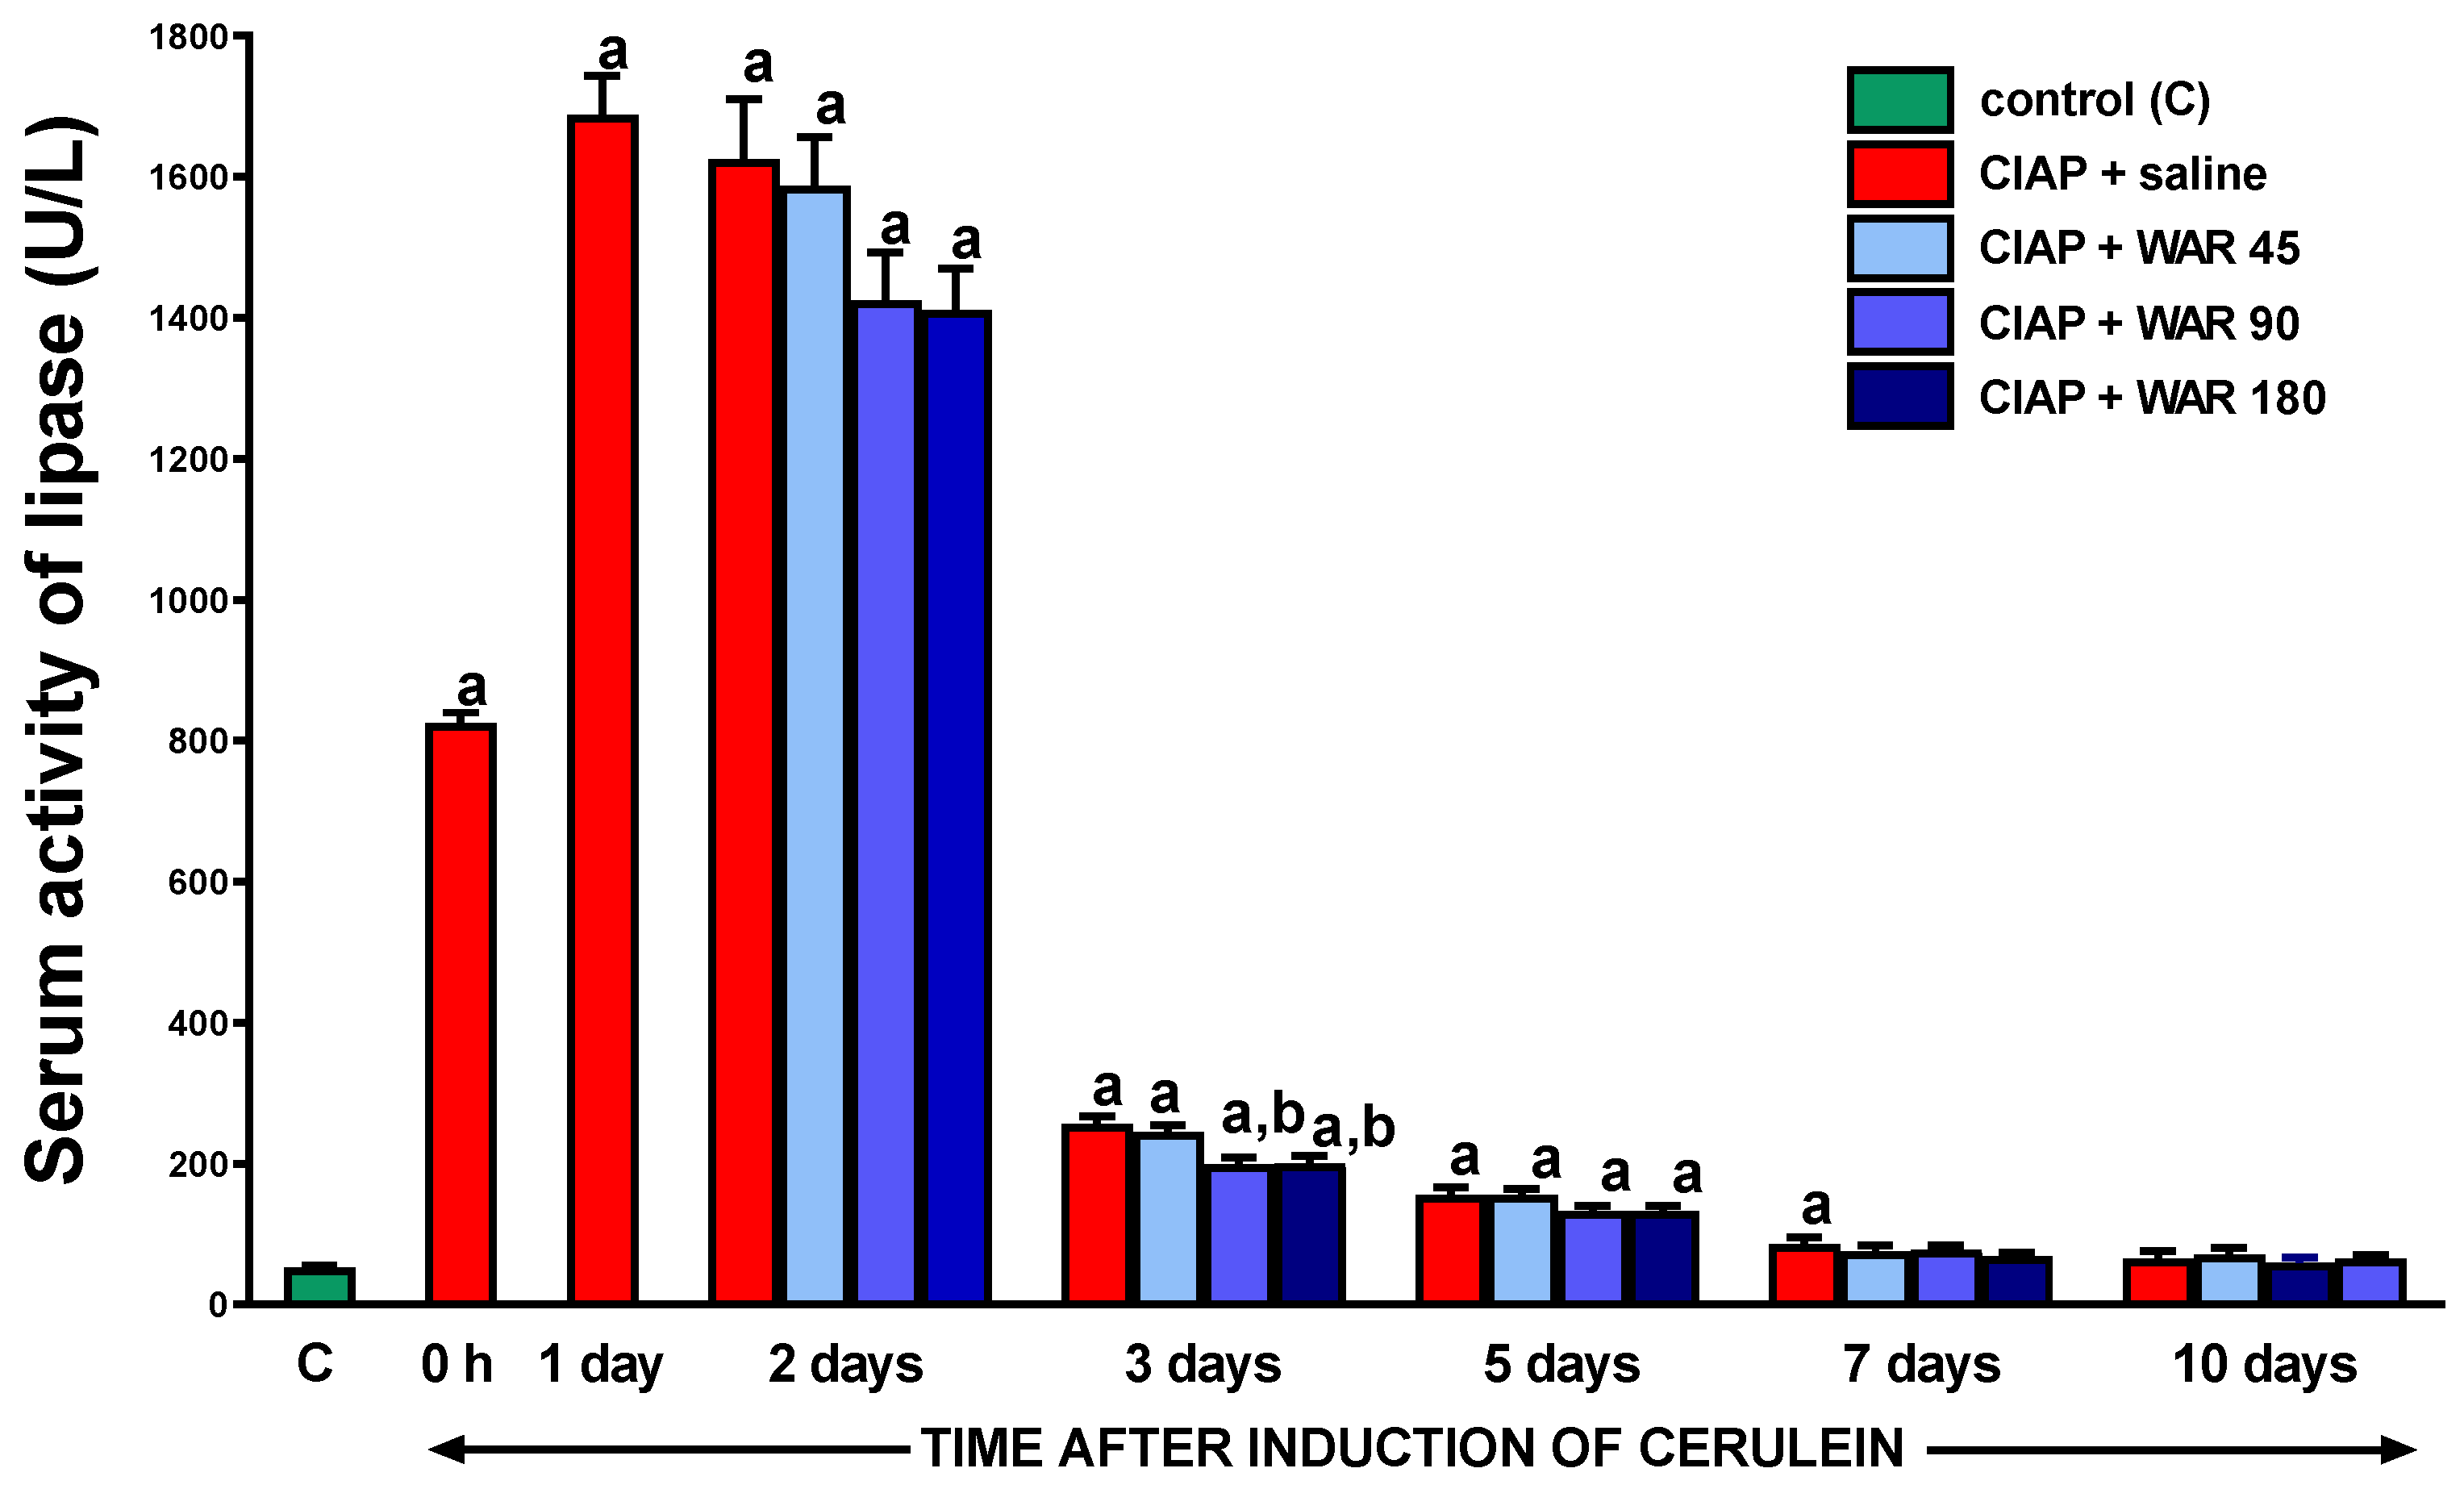
3.5. Serum activity of lipase
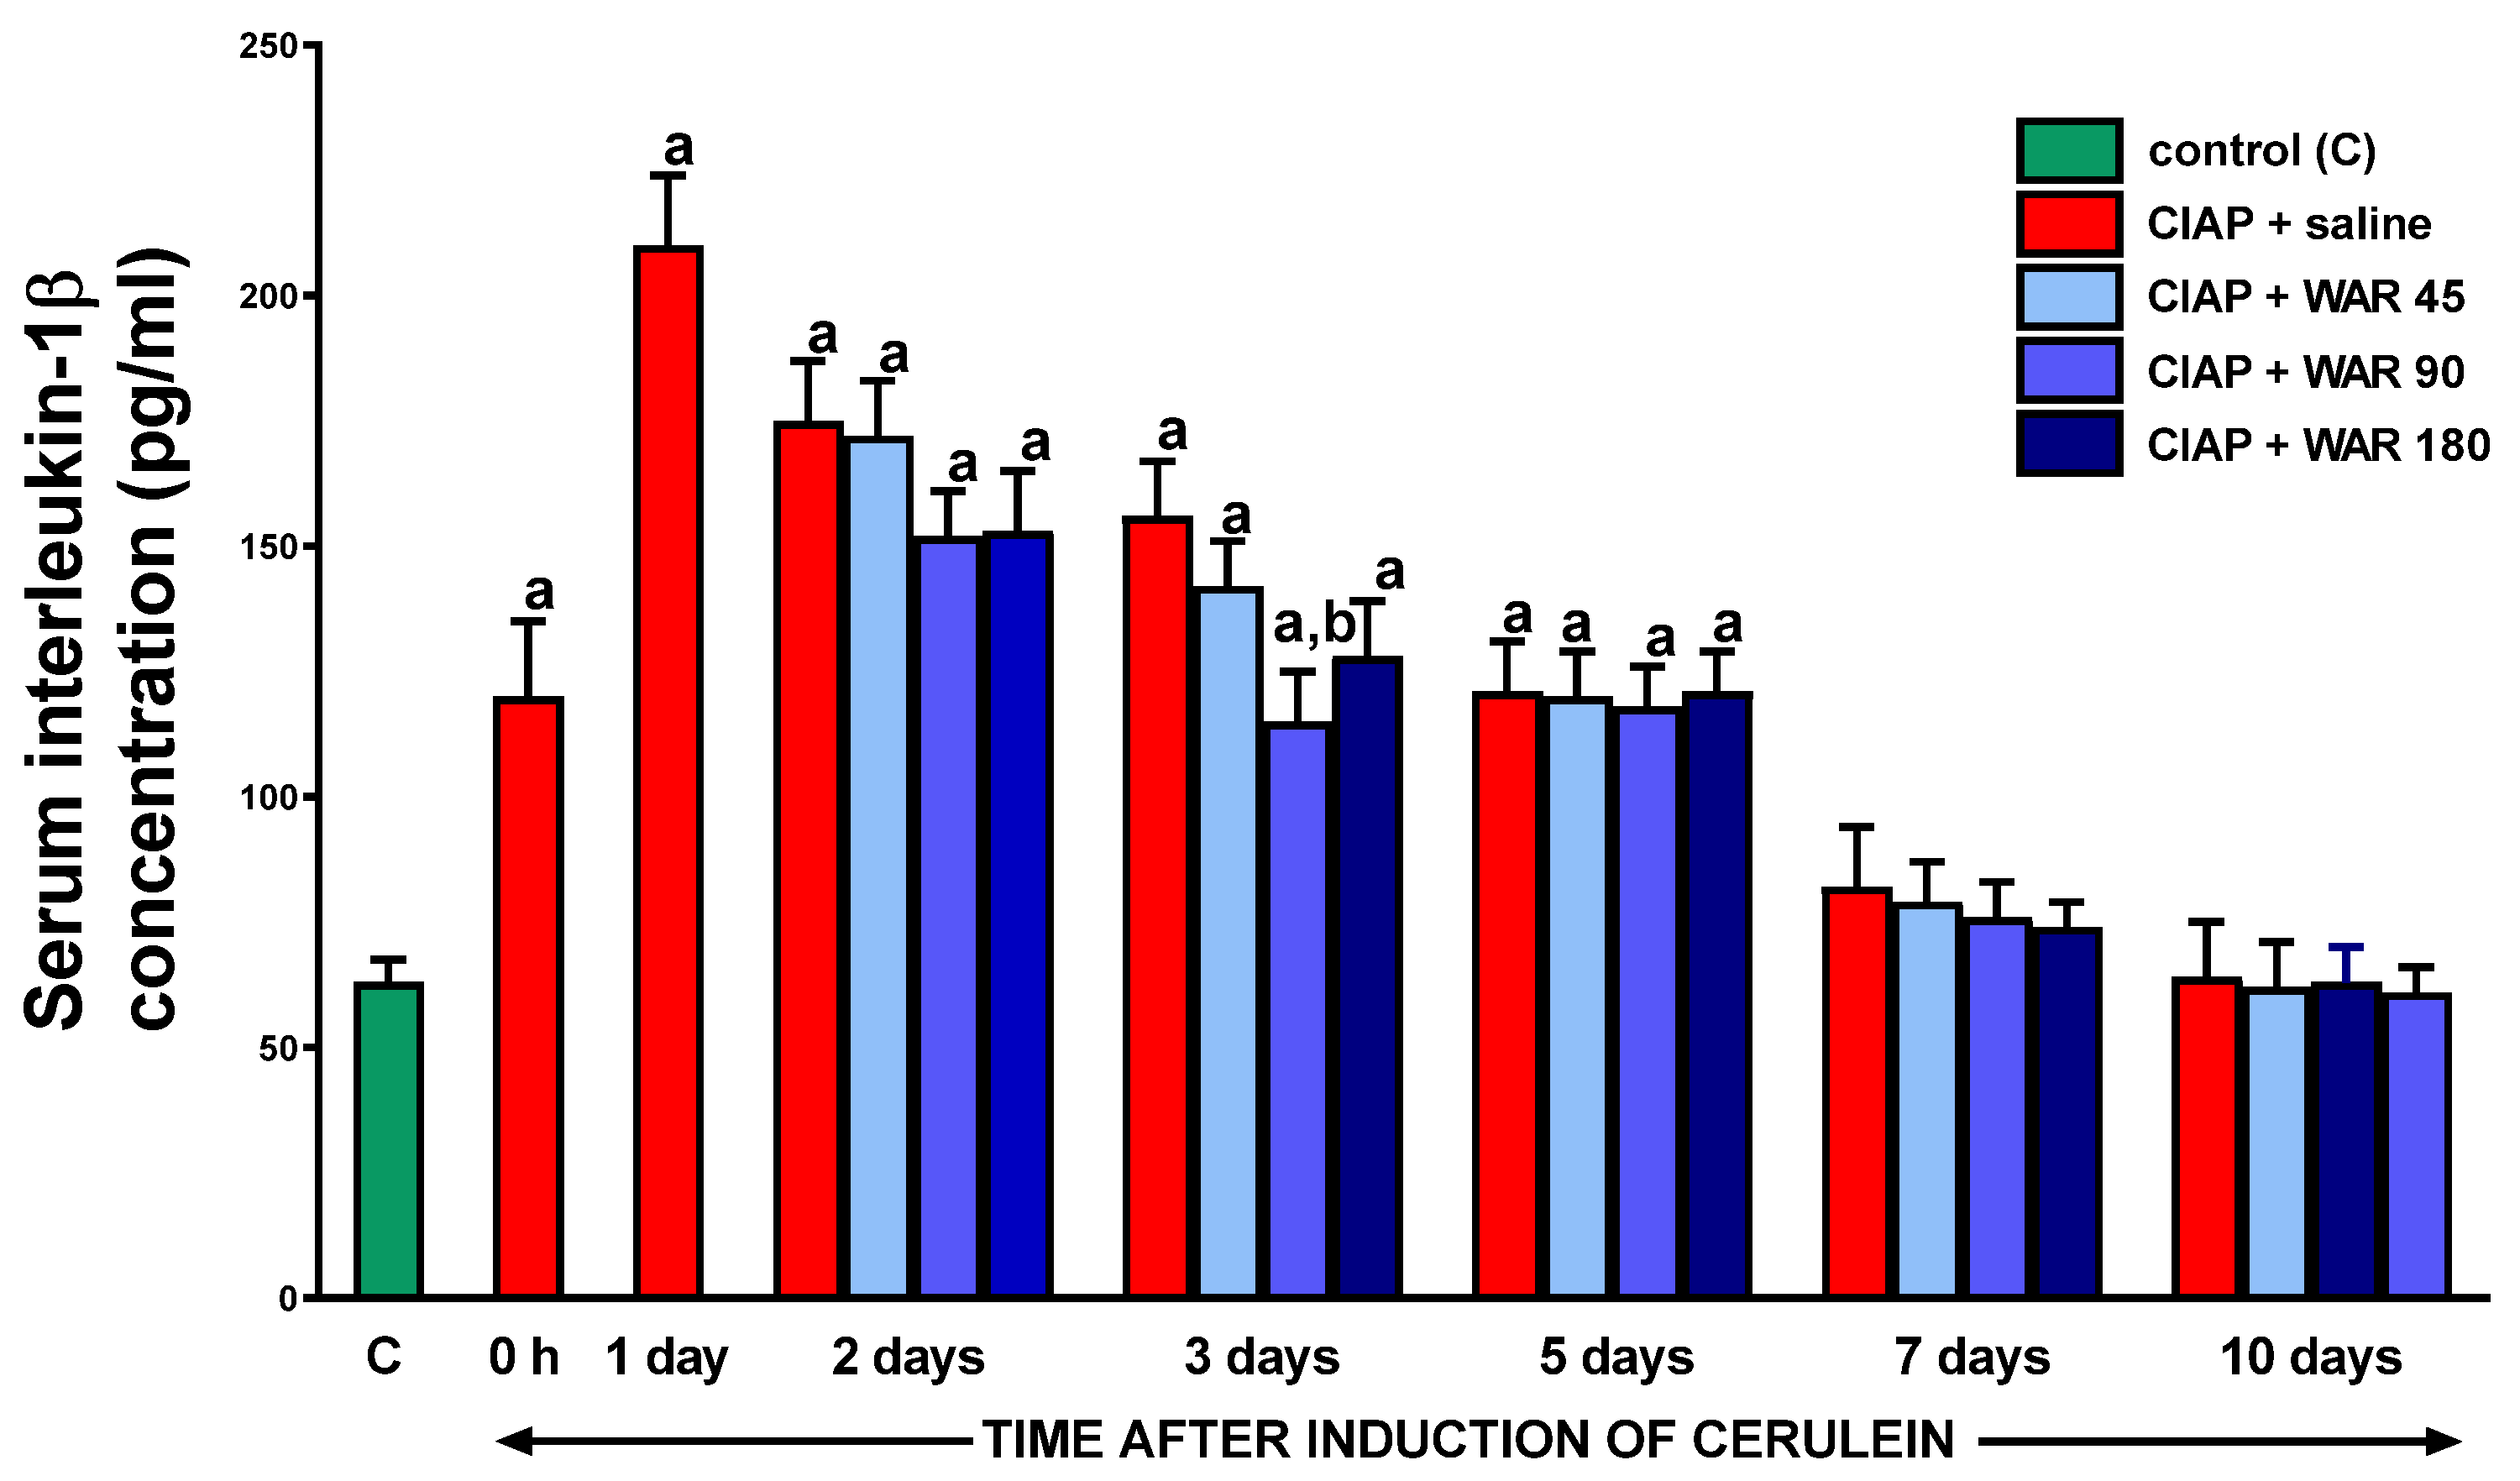
3.6. Serum concentration of interleukin-1β (IL-1β)
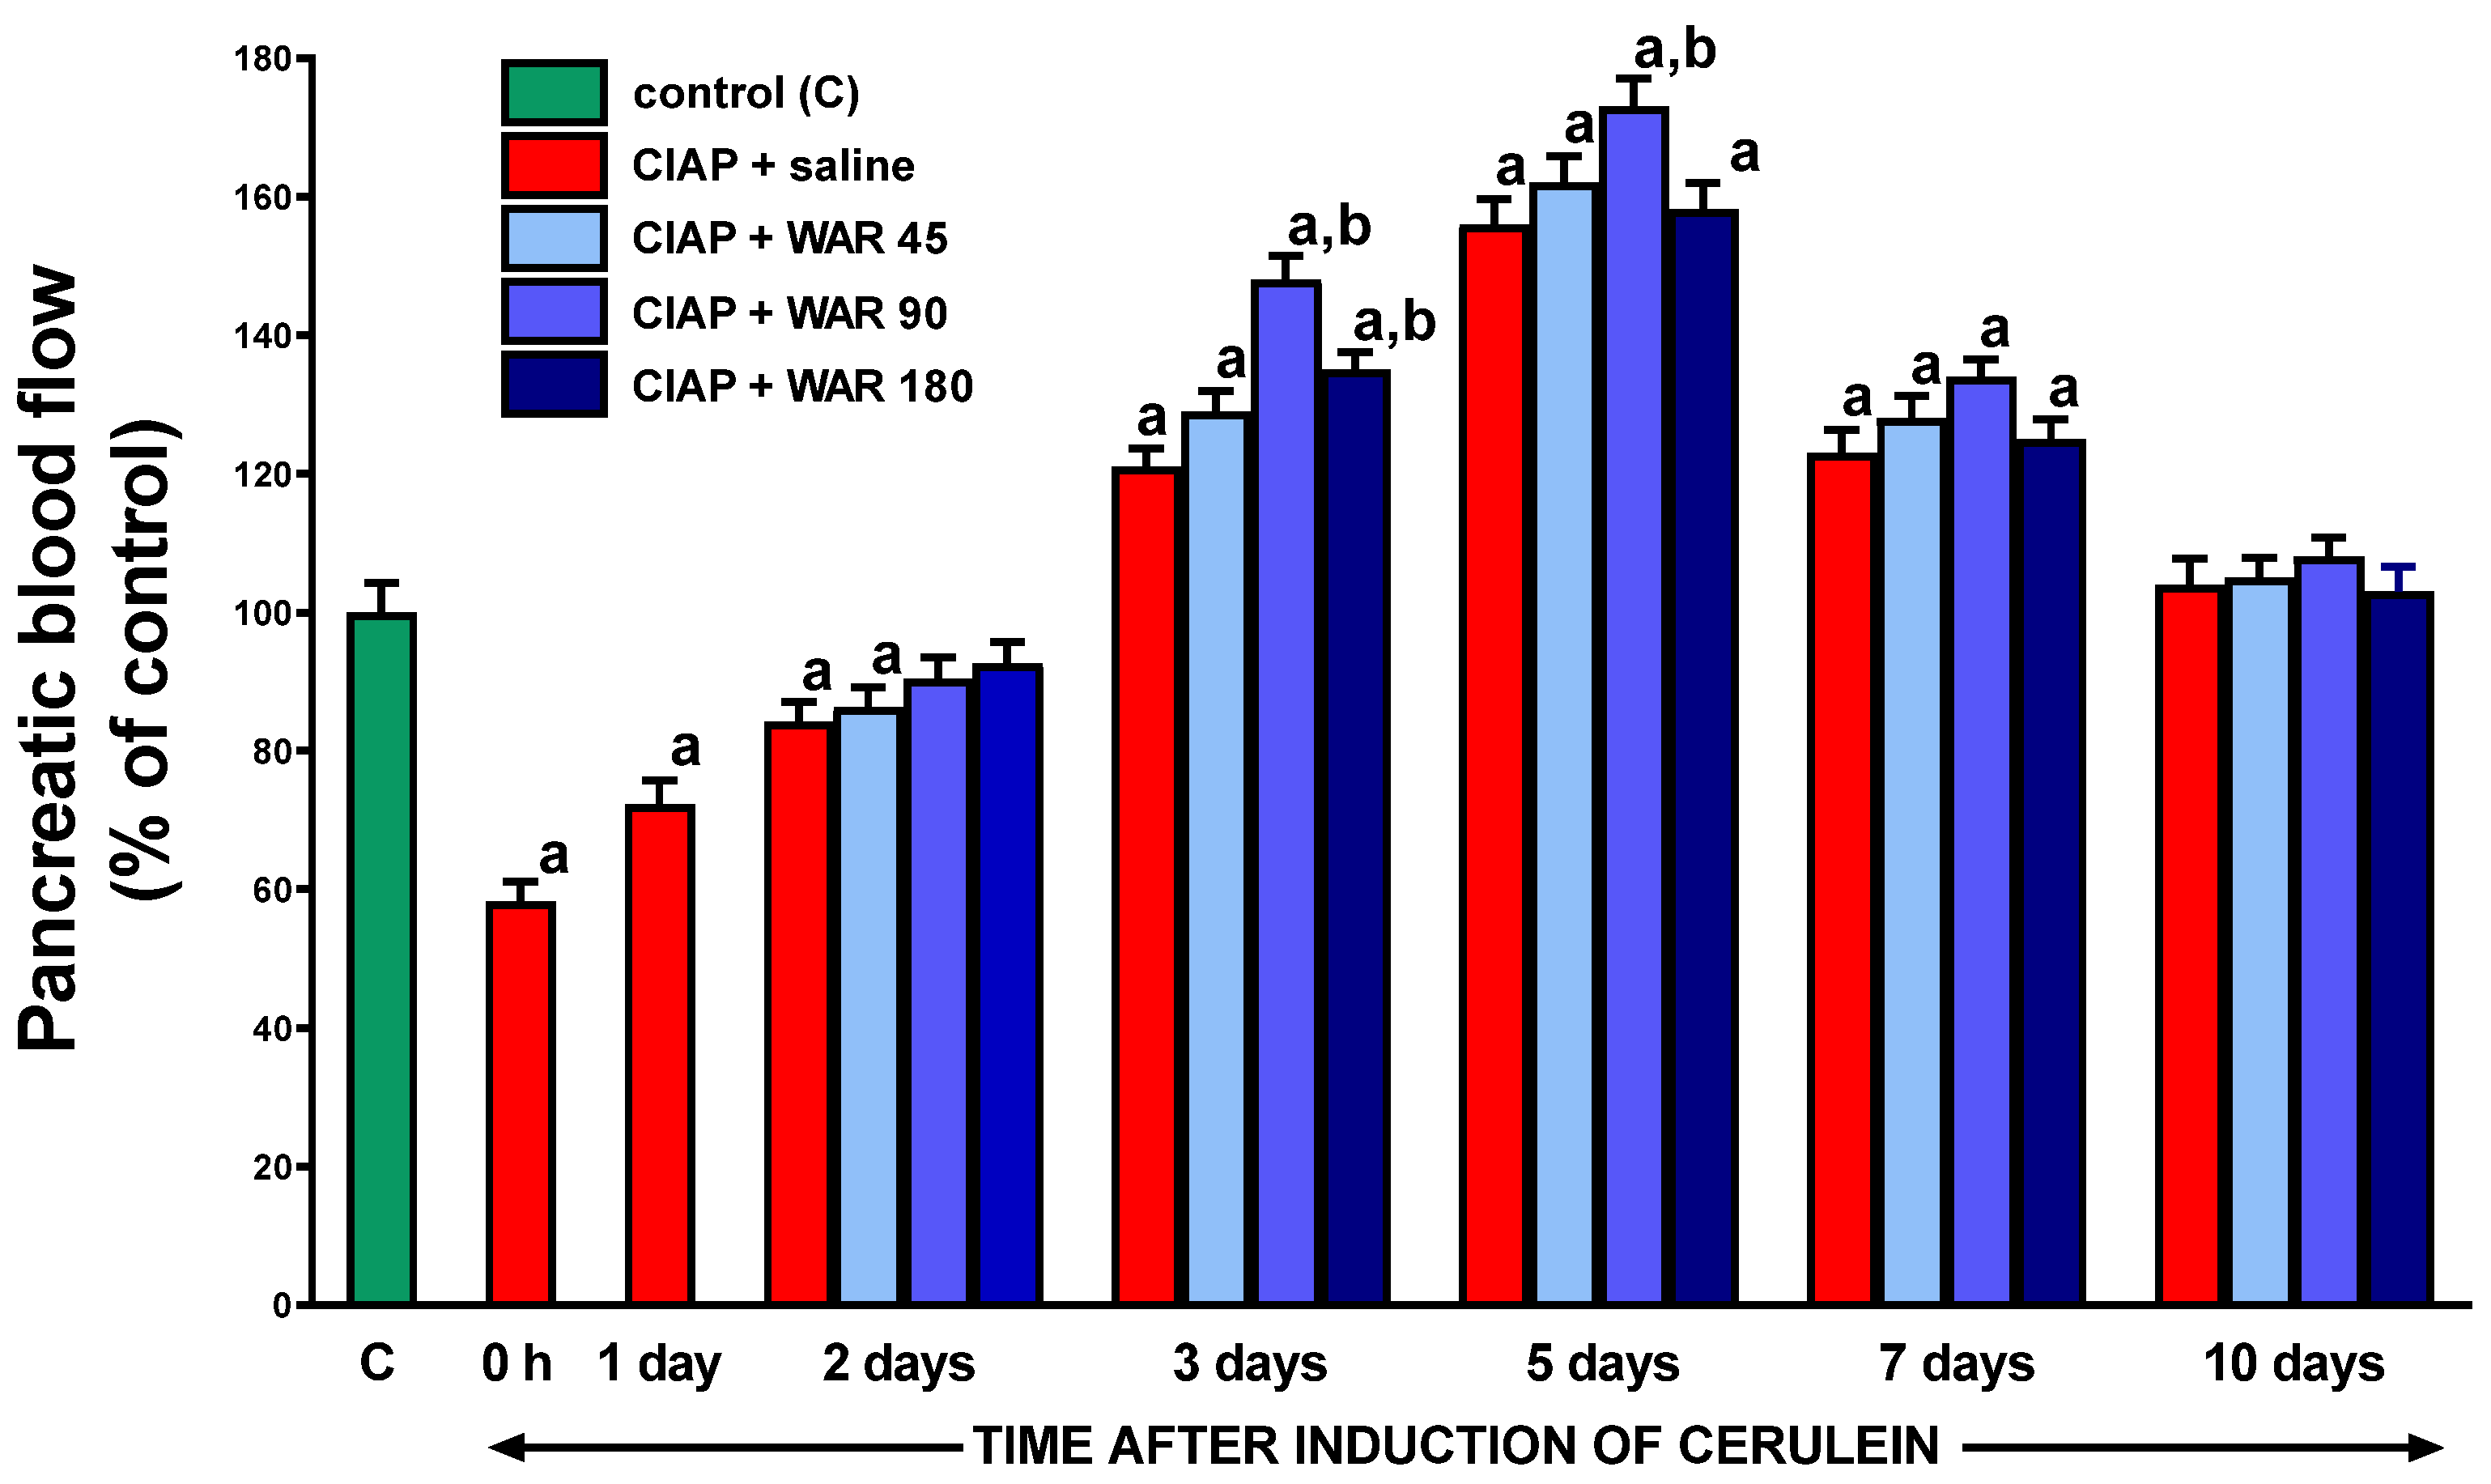
3.7. Pancreatic blood flow
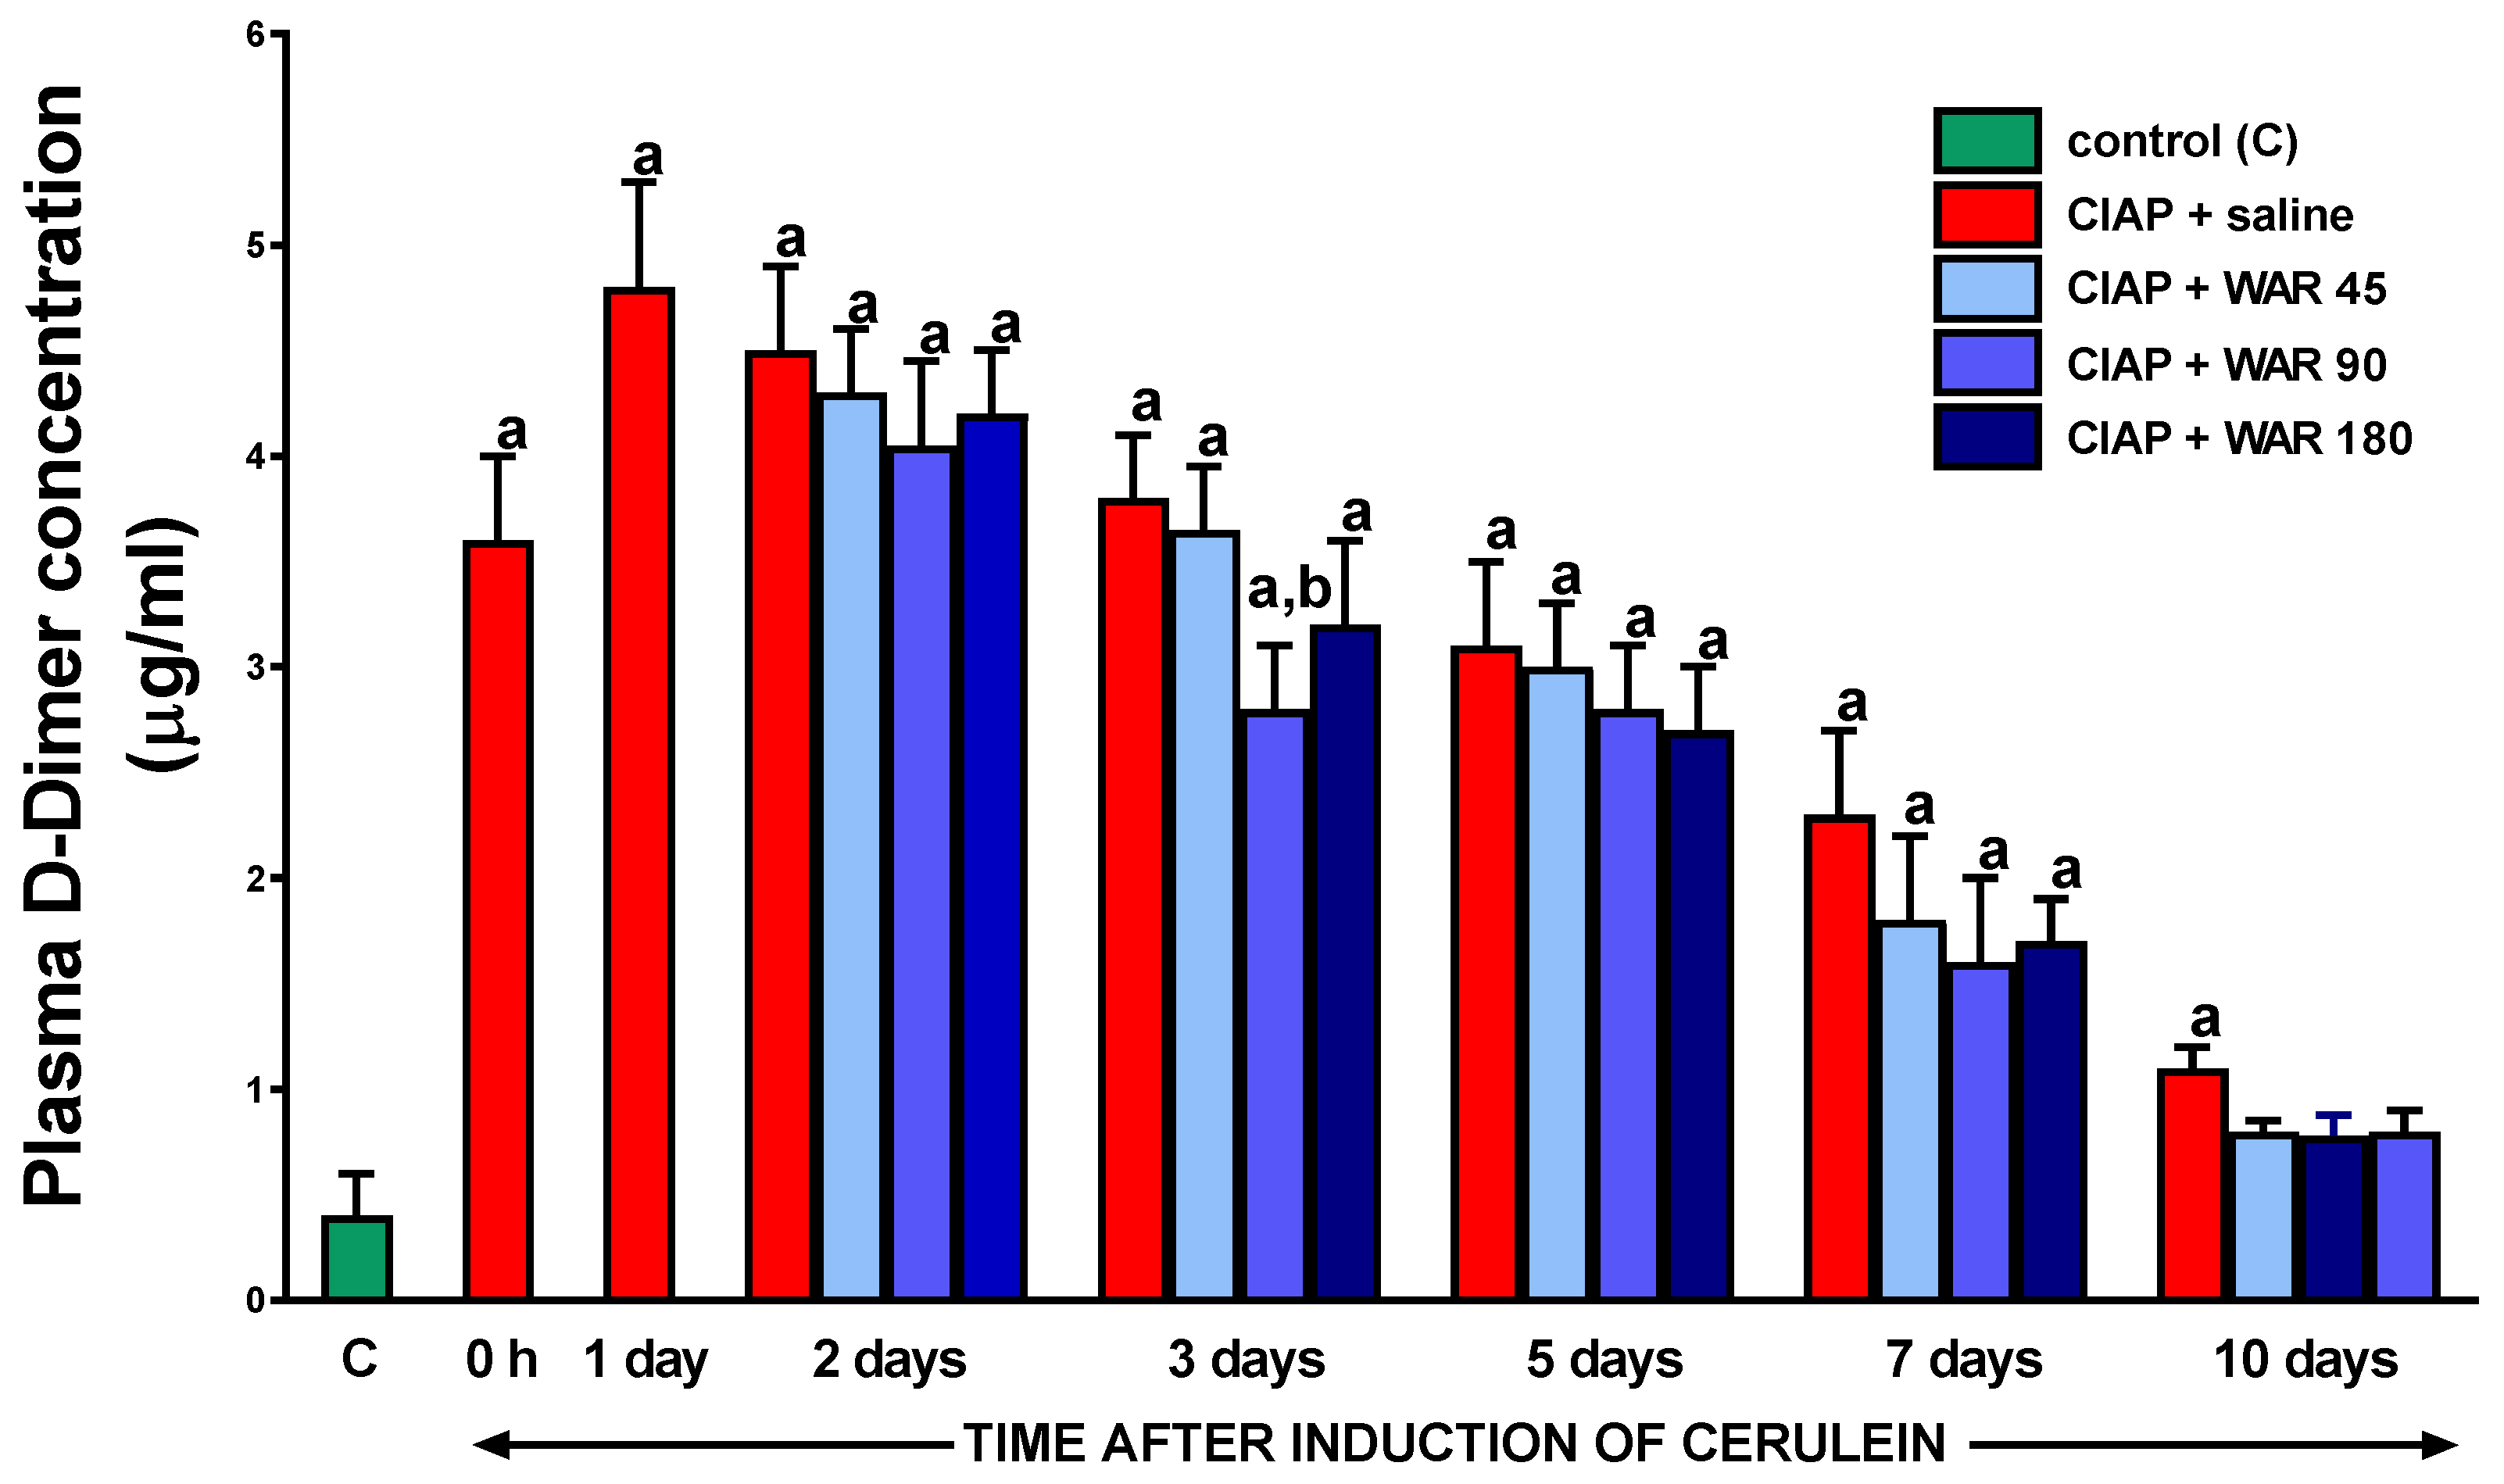
3.8. Plasma D-Dimer concentration
4. Discussion
5. Conclusions
Author Contributions
Funding
Conflicts of Interest
References
- Banks, P.A.; Bollen, T.L.; Dervenis, C.; Gooszen, H.G.; Johnson, C.D.; Sarr, M.G.; Tsiotos, G.G.; Vege, S.S. Acute Pancreatitis Classification Working Group Classification of Acute Pancreatitis--2012: Revision of the Atlanta Classification and Definitions by International Consensus. Gut 2013, 62, 102–111. [Google Scholar] [CrossRef] [PubMed]
- Krishna, S.G.; Kamboj, A.K.; Hart, P.A.; Hinton, A.; Conwell, D.L. The Changing Epidemiology of Acute Pancreatitis Hospitalizations: A Decade of Trends and the Impact of Chronic Pancreatitis. Pancreas 2017, 46, 482–488. [Google Scholar] [CrossRef] [PubMed]
- Konończuk, T.; Krzyżak, M.; Żendzian-Piotrowska, M.; Kurek, K. Epidemiology and etiology of acute pancreatitis. Med. Rodz. 2018. [Google Scholar]
- Petrov, M.S.; Yadav, D. Global Epidemiology and Holistic Prevention of Pancreatitis. Nat. Rev. Gastroenterol. Hepatol. 2019, 16, 175–184. [Google Scholar] [CrossRef] [PubMed]
- Schmid, S.W.; Uhl, W.; Friess, P.; Modlin, I.M.; Büchler, M.W. Experimental Models of Acute Pancreatitis and Their Clinical Relevance. In Acute pancreatitis. Novel concepts in biology and therapy.; Blackwell Wissenschafts-Verlag GmbH: Berlin-Vienna, 1999; pp. 51–62. [Google Scholar]
- Mayerle, J.; Lerch, M.S. and M.M. Secretagogue (Caerulein) Induced Pancreatitis in Rodents. Pancreapedia Exocrine Pancreas Knowl. Base 2013. [Google Scholar] [CrossRef]
- Warzecha, Z.; Dembinski, A.; Ceranowicz, P.; Konturek, S.-J.; Dembinski, M.; Pawlik, W.-W.; Tomaszewska, R.; Stachura, J.; Kusnierz-Cabala, B.; Naskalski, J.-W.; et al. Ischemic Preconditioning Inhibits Development of Edematous Cerulein-Induced Pancreatitis: Involvement of Cyclooxygenases and Heat Shock Protein 70. World J. Gastroenterol. 2005, 11, 5958–5965. [Google Scholar] [CrossRef] [PubMed]
- Lerch, M.M.; Gorelick, F.S. Models of Acute and Chronic Pancreatitis. Gastroenterology 2013, 144, 1180–1193. [Google Scholar] [CrossRef]
- Esmon, C.T. Crosstalk between Inflammation and Thrombosis. Maturitas 2008, 61, 122–131. [Google Scholar] [CrossRef]
- Danckwardt, S.; Hentze, M.W.; Kulozik, A.E. Pathologies at the Nexus of Blood Coagulation and Inflammation: Thrombin in Hemostasis, Cancer, and Beyond. J. Mol. Med. Berl. Ger. 2013, 91, 1257–1271. [Google Scholar] [CrossRef]
- Esmon, C.T. Possible Involvement of Cytokines in Diffuse Intravascular Coagulation and Thrombosis. Baillieres Best Pract. Res. Clin. Haematol. 1999, 12, 343–359. [Google Scholar] [CrossRef]
- Rapaport, S.I.; Rao, L.V. The Tissue Factor Pathway: How It Has Become a “Prima Ballerina”. Thromb. Haemost. 1995, 74, 7–17. [Google Scholar] [CrossRef] [PubMed]
- Grover, S.P.; Mackman, N. Tissue Factor: An Essential Mediator of Hemostasis and Trigger of Thrombosis. Arterioscler. Thromb. Vasc. Biol. 2018, 38, 709–725. [Google Scholar] [CrossRef] [PubMed]
- Banner, D.W.; D’Arcy, A.; Chène, C.; Winkler, F.K.; Guha, A.; Konigsberg, W.H.; Nemerson, Y.; Kirchhofer, D. The Crystal Structure of the Complex of Blood Coagulation Factor VIIa with Soluble Tissue Factor. Nature 1996, 380, 41–46. [Google Scholar] [CrossRef] [PubMed]
- Chen, V.M.; Hogg, P.J. Encryption and Decryption of Tissue Factor. J. Thromb. Haemost. JTH 2013, 11 Suppl 1, 277–284. [Google Scholar] [CrossRef]
- Morrissey, J.H. Tissue Factor Interactions with Factor VII: Measurement and Clinical Significance of Factor VIIa in Plasma. Blood Coagul. Fibrinolysis 1995, 6, S14. [Google Scholar] [CrossRef] [PubMed]
- Bogdanov, V.Y.; Versteeg, H.H. “Soluble Tissue Factor” in the 21st Century: Definitions, Biochemistry, and Pathophysiological Role in Thrombus Formation. Semin. Thromb. Hemost. 2015, 41, 700–707. [Google Scholar] [CrossRef] [PubMed]
- Riewald, M.; Ruf, W. Mechanistic Coupling of Protease Signaling and Initiation of Coagulation by Tissue Factor. Proc. Natl. Acad. Sci. U. S. A. 2001, 98, 7742–7747. [Google Scholar] [CrossRef]
- Foley, J.H.; Conway, E.M. Cross Talk Pathways Between Coagulation and Inflammation. Circ. Res. 2016, 118, 1392–1408. [Google Scholar] [CrossRef]
- Göbel, K.; Eichler, S.; Wiendl, H.; Chavakis, T.; Kleinschnitz, C.; Meuth, S.G. The Coagulation Factors Fibrinogen, Thrombin, and Factor XII in Inflammatory Disorders-A Systematic Review. Front. Immunol. 2018, 9, 1731. [Google Scholar] [CrossRef]
- Jin, Y.; Nonoyama, S.; Morio, T.; Imai, K.; Ochs, H.D.; Mizutani, S. Characterization of Soluble CD40 Ligand Released from Human Activated Platelets. J. Med. Dent. Sci. 2001, 48, 23–27. [Google Scholar]
- Croce, K.; Libby, P. Intertwining of Thrombosis and Inflammation in Atherosclerosis. Curr. Opin. Hematol. 2007, 14, 55–61. [Google Scholar] [CrossRef] [PubMed]
- Rizvi, M.; Pathak, D.; Freedman, J.E.; Chakrabarti, S. CD40-CD40 Ligand Interactions in Oxidative Stress, Inflammation and Vascular Disease. Trends Mol. Med. 2008, 14, 530–538. [Google Scholar] [CrossRef] [PubMed]
- Schönbeck, U.; Mach, F.; Libby, P. CD154 (CD40 Ligand). Int. J. Biochem. Cell Biol. 2000, 32, 687–693. [Google Scholar] [CrossRef]
- Levi, M.; Keller, T.T.; van Gorp, E.; ten Cate, H. Infection and Inflammation and the Coagulation System. Cardiovasc. Res. 2003, 60, 26–39. [Google Scholar] [CrossRef] [PubMed]
- Cuthbertson, C.M.; Christophi, C. Disturbances of the Microcirculation in Acute Pancreatitis. Br. J. Surg. 2006, 93, 518–530. [Google Scholar] [CrossRef]
- Hoffmann, T.F.; Leiderer, R.; Harris, A.G.; Messmer, K. Ischemia and Reperfusion in Pancreas. Microsc. Res. Tech. 1997, 37, 557–571. [Google Scholar] [CrossRef]
- Panek, J.; Zasada, J.; Poźniczek, M. Microcirculatory disturbance in the course of acute pancreatitis. Przegl. Lek. 2007, 64, 435–437. [Google Scholar]
- Gando, S.; Levi, M.; Toh, C.-H. Disseminated Intravascular Coagulation. Nat. Rev. Dis. Primer 2016, 2, 16037. [Google Scholar] [CrossRef]
- Komara, N.L.; Paragomi, P.; Greer, P.J.; Wilson, A.S.; Breze, C.; Papachristou, G.I.; Whitcomb, D.C. Severe Acute Pancreatitis: Capillary Permeability Model Linking Systemic Inflammation to Multiorgan Failure. Am. J. Physiol. Gastrointest. Liver Physiol. 2020, 319, G573–G583. [Google Scholar] [CrossRef]
- Hamada, S.; Masamune, A.; Kikuta, K.; Shimosegawa, T. Disseminated Intravascular Coagulation on Admission Predicts Complications and Poor Prognosis of Acute Pancreatitis: Analysis of the Nationwide Epidemiological Survey in Japan. Pancreas 2017, 46, e15. [Google Scholar] [CrossRef]
- Liu, C.; Zhou, X.; Ling, L.; Chen, S.; Zhou, J. Prediction of Mortality and Organ Failure Based on Coagulation and Fibrinolysis Markers in Patients with Acute Pancreatitis: A Retrospective Study. Medicine (Baltimore) 2019, 98, e15648. [Google Scholar] [CrossRef] [PubMed]
- Gurda-Duda, A.; Kuśnierz-Cabala, B.; Nowak, W.; Naskalski, J.W.; Kulig, J. Assessment of the Prognostic Value of Certain Acute-Phase Proteins and Procalcitonin in the Prognosis of Acute Pancreatitis. Pancreas 2008, 37, 449–453. [Google Scholar] [CrossRef] [PubMed]
- Gabryelewicz, A.; Niewiarowski, S.; Prokopowicz, J.; Chlebowski, J. Heparin and Protease Inhibitors in the Prevention of Experimental Acute Pancreatic Necrosis in Dogs. Digestion 1969, 2, 7–16. [Google Scholar] [CrossRef] [PubMed]
- Dobosz, M.; Wajda, Z.; Hac, S.; Mysliwska, J.; Mionskowska, L.; Bryl, E.; Roszkiewicz, A.; Mysliwski, A. Heparin and Nitric Oxide Treatment in Experimental Acute Pancreatitis in Rats. Forum Genoa Italy 1998, 8, 303–310. [Google Scholar] [PubMed]
- Ceranowicz, P.; Dembinski, A.; Warzecha, Z.; Dembinski, M.; Cieszkowski, J.; Rembisz, K.; Konturek, S.J.; Kusnierz-Cabala, B.; Tomaszewska, R.; Pawlik, W.W. Protective and Therapeutic Effect of Heparin in Acute Pancreatitis. J. Physiol. Pharmacol. Off. J. Pol. Physiol. Soc. 2008, 59 Suppl 4, 103–125. [Google Scholar]
- Ceranowicz, P.; Dembińsk, M.; Warzecha, Z.; Cieszkowski, J.; Kuśnierz-Cabala, B.; Tomaszewska, R.; Dembiński, A. Healing Effect of Heparin in the Course of Acute Cerulein-Induced Pancreatitis. Gastroenterol. Rev. Gastroenterol. 2009, 4, 199–205. [Google Scholar]
- Lu, X.-S.; Qiu, F.; Li, J.-Q.; Fan, Q.-Q.; Zhou, R.-G.; Ai, Y.-H.; Zhang, K.-C.; Li, Y.-X. Low Molecular Weight Heparin in the Treatment of Severe Acute Pancreatitis: A Multiple Centre Prospective Clinical Study. Asian J. Surg. 2009, 32, 89–94. [Google Scholar] [CrossRef]
- Twilla, J.D.; Mancell, J. Hypertriglyceridemia-Induced Acute Pancreatitis Treated with Insulin and Heparin. Am. J. Health-Syst. Pharm. AJHP Off. J. Am. Soc. Health-Syst. Pharm. 2012, 69, 213–216. [Google Scholar] [CrossRef]
- Jin, M.; Peng, J.M.; Zhu, H.D.; Zhang, H.M.; Lu, B.; Li, Y.; Qian, J.M.; Yu, X.Z.; Yang, H. Continuous Intravenous Infusion of Insulin and Heparin vs Plasma Exchange in Hypertriglyceridemia-Induced Acute Pancreatitis. J. Dig. Dis. 2018, 19, 766–772. [Google Scholar] [CrossRef]
- Li, S.; Cao, G.; Chen, X.; Wu, T. Low-Dose Heparin in the Prevention of Post Endoscopic Retrograde Cholangiopancreatography Pancreatitis: A Systematic Review and Meta-Analysis. Eur. J. Gastroenterol. Hepatol. 2012, 24, 477–481. [Google Scholar] [CrossRef]
- Schlüter, A.; Lamprecht, A. Current Developments for the Oral Delivery of Heparin. Curr. Pharm. Biotechnol. 2014, 15, 640–649. [Google Scholar] [CrossRef]
- Warzecha, Z.; Sendur, P.; Ceranowicz, P.; Dembinski, M.; Cieszkowski, J.; Kusnierz-Cabala, B.; Tomaszewska, R.; Dembinski, A. Pretreatment with Low Doses of Acenocoumarol Inhibits the Development of Acute Ischemia/Reperfusion-Induced Pancreatitis. J. Physiol. Pharmacol. Off. J. Pol. Physiol. Soc. 2015, 66, 731–740. [Google Scholar]
- Warzecha, Z.; Sendur, P.; Ceranowicz, P.; Cieszkowski, J.; Dembiński, M.; Sendur, R.; Bonior, J.; Jaworek, J.; Ambroży, T.; Olszanecki, R.; et al. Therapeutic Effect of Low Doses of Acenocoumarol in the Course of Ischemia/Reperfusion-Induced Acute Pancreatitis in Rats. Int. J. Mol. Sci. 2017, 18. [Google Scholar] [CrossRef] [PubMed]
- Warzecha, Z.; Sendur, P.; Ceranowicz, P.; Dembiński, M.; Cieszkowski, J.; Kuśnierz-Cabala, B.; Olszanecki, R.; Tomaszewska, R.; Ambroży, T.; Dembiński, A. Protective Effect of Pretreatment with Acenocoumarol in Cerulein-Induced Acute Pancreatitis. Int. J. Mol. Sci. 2016, 17. [Google Scholar] [CrossRef] [PubMed]
- Beinema, M.; Brouwers, J.R.B.J.; Schalekamp, T.; Wilffert, B. Pharmacogenetic Differences between Warfarin, Acenocoumarol and Phenprocoumon. Thromb. Haemost. 2008, 100, 1052–1057. [Google Scholar] [PubMed]
- Ufer, M. Comparative Pharmacokinetics of Vitamin K Antagonists: Warfarin, Phenprocoumon and Acenocoumarol. Clin. Pharmacokinet. 2005, 44, 1227–1246. [Google Scholar] [CrossRef]
- Verhoef, T.I.; Redekop, W.K.; Daly, A.K.; van Schie, R.M.F.; de Boer, A.; Maitland-van der Zee, A.-H. Pharmacogenetic-Guided Dosing of Coumarin Anticoagulants: Algorithms for Warfarin, Acenocoumarol and Phenprocoumon. Br. J. Clin. Pharmacol. 2014, 77, 626–641. [Google Scholar] [CrossRef]
- Barcellona, D.; Fenu, L.; Marongiu, F. Point-of-Care Testing INR: An Overview. Clin. Chem. Lab. Med. 2017, 55, 800–805. [Google Scholar] [CrossRef]
- Pattacini, C.; Manotti, C.; Pini, M.; Quintavalla, R.; Dettori, A.G. A Comparative Study on the Quality of Oral Anticoagulant Therapy (Warfarin versus Acenocoumarol). Thromb. Haemost. 1994, 71, 188–191. [Google Scholar]
- Maduzia, D.; Ceranowicz, P.; Cieszkowski, J.; Gałązka, K.; Kuśnierz-Cabala, B.; Warzecha, Z. Pretreatment with Warfarin Attenuates the Development of Ischemia/Reperfusion-Induced Acute Pancreatitis in Rats. Mol. Basel Switz. 2020, 25, E2493. [Google Scholar] [CrossRef]
- Maduzia, D.; Ceranowicz, P.; Cieszkowski, J.; Chmura, A.; Galazka, K.; Kusnierz-Cabala, B.; Warzecha, Z. Administration of Warfarin Accelerates the Recovery in Ischemia/Reperfusion-Induced Acute Pancreatitis. J. Physiol. Pharmacol. Off. J. Pol. Physiol. Soc. 2020, 71. [Google Scholar] [CrossRef]
- Dembinski, A.; Warzecha, Z.; Konturek, P.J.; Ceranowicz, P.; Konturek, S.J. Influence of Capsaicin-Sensitive Afferent Neurons and Nitric Oxide (NO) on Cerulein-Induced Pancreatitis in Rats. Int. J. Pancreatol. Off. J. Int. Assoc. Pancreatol. 1996, 19, 179–189. [Google Scholar] [CrossRef] [PubMed]
- Konturek, S.J.; Szlachcic, A.; Dembinski, A.; Warzecha, Z.; Jaworek, J.; Stachura, J. Nitric Oxide in Pancreatic Secretion and Hormone-Induced Pancreatitis in Rats. Int. J. Pancreatol. Off. J. Int. Assoc. Pancreatol. 1994, 15, 19–28. [Google Scholar] [CrossRef] [PubMed]
- Johansson, K.; Ahn, H.; Lindhagen, J.; Lundgren, O. Tissue Penetration and Measuring Depth of Laser Doppler Flowmetry in the Gastrointestinal Application. Scand. J. Gastroenterol. 1987, 22, 1081–1088. [Google Scholar] [CrossRef] [PubMed]
- Ceranowicz, P.; Cieszkowski, J.; Warzecha, Z.; Dembiński, A. [Experimental models of acute pancreatitis]. Postepy Hig. Med. Doswiadczalnej Online 2015, 69, 264–269. [Google Scholar] [CrossRef] [PubMed]
- Keck, T.; Friebe, V.; Warshaw, A.L.; Antoniu, B.A.; Waneck, G.; Benz, S.; Hopt, U.T.; Fernández-del-Castillo, C. Pancreatic Proteases in Serum Induce Leukocyte-Endothelial Adhesion and Pancreatic Microcirculatory Failure. Pancreatol. Off. J. Int. Assoc. Pancreatol. IAP Al 2005, 5, 241–250. [Google Scholar] [CrossRef]
- Dinarello, C.A. Biologic Basis for Interleukin-1 in Disease. Blood 1996, 87, 2095–2147. [Google Scholar] [CrossRef]
- Ferrero-Miliani, L.; Nielsen, O.H.; Andersen, P.S.; Girardin, S.E. Chronic Inflammation: Importance of NOD2 and NALP3 in Interleukin-1β Generation. Clin. Exp. Immunol. 2007, 147, 227–235. [Google Scholar] [CrossRef]
- Dinarello, C.A. Immunological and Inflammatory Functions of the Interleukin-1 Family. Annu. Rev. Immunol. 2009, 27, 519–550. [Google Scholar] [CrossRef]
- Norman, J.G.; Fink, G.W.; Denham, W.; Yang, J.; Carter, G.; Sexton, C.; Falkner, J.; Gower, W.R.; Franz, M.G. Tissue-Specific Cytokine Production during Experimental Acute Pancreatitis. A Probable Mechanism for Distant Organ Dysfunction. Dig. Dis. Sci. 1997, 42, 1783–1788. [Google Scholar] [CrossRef]
- Norman, J.; Franz, M.; Messina, J.; Riker, A.; Fabri, P.J.; Rosemurgy, A.S.; Gower, W.R. Interleukin-1 Receptor Antagonist Decreases Severity of Experimental Acute Pancreatitis. Surgery 1995, 117, 648–655. [Google Scholar] [CrossRef] [PubMed]
- Norman, J.G.; Franz, M.G.; Fink, G.S.; Messina, J.; Fabri, P.J.; Gower, W.R.; Carey, L.C. Decreased Mortality of Severe Acute Pancreatitis after Proximal Cytokine Blockade. Ann. Surg. 1995, 221, 625–634. [Google Scholar] [CrossRef] [PubMed]
- Norman, J.; Yang, J.; Fink, G.; Carter, G.; Ku, G.; Denham, W.; Livingston, D. Severity and Mortality of Experimental Pancreatitis Are Dependent on Interleukin-1 Converting Enzyme (ICE). J. Interferon Cytokine Res. Off. J. Int. Soc. Interferon Cytokine Res. 1997, 17, 113–118. [Google Scholar] [CrossRef] [PubMed]
- Rau, B.; Paszkowski, A.; Lillich, S.; Baumgart, K.; Möller, P.; Beger, H.G. Differential Effects of Caspase-1/Interleukin-1beta-Converting Enzyme on Acinar Cell Necrosis and Apoptosis in Severe Acute Experimental Pancreatitis. Lab. Investig. J. Tech. Methods Pathol. 2001, 81, 1001–1013. [Google Scholar] [CrossRef]
- Tomaszewska, R.; Dembiński, A.; Warzecha, Z.; Ceranowicz, P.; Konturek, S.J.; Stachura, J. The Influence of Epidermal Growth Factor on the Course of Ischemia-Reperfusion Induced Pancreatitis in Rats. J. Physiol. Pharmacol. Off. J. Pol. Physiol. Soc. 2002, 53, 183–198. [Google Scholar]
- Dembinski, A.; Warzecha, Z.; Ceranowicz, P.; Tomaszewska, R.; Stachura, J.; Konturek, S.J.; Konturek, P.C. Ghrelin Attenuates the Development of Acute Pancreatitis in Rat. J. Physiol. Pharmacol. Off. J. Pol. Physiol. Soc. 2003, 54, 561–573. [Google Scholar]
- Whitlon, D.S.; Sadowski, J.A.; Suttie, J.W. Mechanism of Coumarin Action: Significance of Vitamin K Epoxide Reductase Inhibition. Biochemistry 1978, 17, 1371–1377. [Google Scholar] [CrossRef]
- Wittkowsky, A.K. Warfarin and Other Coumarin Derivatives: Pharmacokinetics, Pharmacodynamics, and Drug Interactions. Semin. Vasc. Med. 2003, 3, 221–230. [Google Scholar] [CrossRef]
- Wu, S.; Chen, X.; Jin, D.-Y.; Stafford, D.W.; Pedersen, L.G.; Tie, J.-K. Warfarin and Vitamin K Epoxide Reductase: A Molecular Accounting for Observed Inhibition. Blood 2018, 132, 647–657. [Google Scholar] [CrossRef]
- Silva-Vaz, P.; Abrantes, A.M.; Morgado-Nunes, S.; Castelo-Branco, M.; Gouveia, A.; Botelho, M.F.; Tralhão, J.G. Evaluation of Prognostic Factors of Severity in Acute Biliary Pancreatitis. Int. J. Mol. Sci. 2020, 21. [Google Scholar] [CrossRef]
- Gill, J.R. Pancreatitis: A Forensic Perspective. Acad. Forensic Pathol. 2016, 6, 237–248. [Google Scholar] [CrossRef]
- Kumar, P.; Gupta, P.; Rana, S. Thoracic Complications of Pancreatitis. JGH Open Open Access J. Gastroenterol. Hepatol. 2018, 3, 71–79. [Google Scholar] [CrossRef] [PubMed]
- Easler, J.; Muddana, V.; Furlan, A.; Dasyam, A.; Vipperla, K.; Slivka, A.; Whitcomb, D.C.; Papachristou, G.I.; Yadav, D. Portosplenomesenteric Venous Thrombosis in Patients with Acute Pancreatitis Is Associated with Pancreatic Necrosis and Usually Has a Benign Course. Clin. Gastroenterol. Hepatol. Off. Clin. Pract. J. Am. Gastroenterol. Assoc. 2014, 12, 854–862. [Google Scholar] [CrossRef] [PubMed]
- Cohen, O.; Ageno, W. The Safety of Anticoagulant Therapy in the Treatment of Splanchnic Vein Thrombosis Associated with Acute Pancreatitis. Intern. Emerg. Med. 2020, 15, 929–931. [Google Scholar] [CrossRef] [PubMed]
- Pagliari, D.; Cianci, R.; Brizi, M.G.; Mancarella, F.A.; Musso, M.; Cintoni, M.; Franza, L.; Flore, R.A.; Gasbarrini, A.; Tondi, P. Anticoagulant Therapy in the Treatment of Splanchnic Vein Thrombosis Associated to Acute Pancreatitis: A 3-Year Single-Centre Experience. Intern. Emerg. Med. 2020, 15, 1021–1029. [Google Scholar] [CrossRef] [PubMed]
- Chandan, S.; Buddam, A.; Khan, S.R.; Mohan, B.P.; Ramai, D.; Bilal, M.; Dhindsa, B.; Bhogal, N.; Kassab, L.L.; Goyal, H.; et al. Use of Therapeutic Anticoagulation in Splanchnic Vein Thrombosis Associated with Acute Pancreatitis: A Systematic Review and Meta-Analysis. Ann. Gastroenterol. 2021, 34, 862–871. [Google Scholar] [CrossRef] [PubMed]
- Wan, J.; Yang, X.; He, W.; Zhu, Y.; Zhu, Y.; Zeng, H.; Liu, P.; Xia, L.; Lu, N. Serum D-Dimer Levels at Admission for Prediction of Outcomes in Acute Pancreatitis. BMC Gastroenterol. 2019, 19, 67. [Google Scholar] [CrossRef] [PubMed]
- Working Group IAP/APA Acute Pancreatitis Guidelines IAP/APA Evidence-Based Guidelines for the Management of Acute Pancreatitis. Pancreatol. Off. J. Int. Assoc. Pancreatol. IAP Al 2013, 13, e1–15. [CrossRef]
- Lankisch, P.G.; Burchard-Reckert, S.; Lehnick, D. Underestimation of Acute Pancreatitis: Patients with Only a Small Increase in Amylase/Lipase Levels Can Also Have or Develop Severe Acute Pancreatitis. Gut 1999, 44, 542–544. [Google Scholar] [CrossRef]
- Rompianesi, G.; Hann, A.; Komolafe, O.; Pereira, S.P.; Davidson, B.R.; Gurusamy, K.S. Serum Amylase and Lipase and Urinary Trypsinogen and Amylase for Diagnosis of Acute Pancreatitis. Cochrane Database Syst. Rev. 2017, 2017, CD012010. [Google Scholar] [CrossRef]
- Akkus, C.; Yilmaz, H.; Mizrak, S.; Adibelli, Z.; Akdas, O.; Duran, C. Development of Pancreatic Injuries in the Course of COVID-19. Acta Gastro-Enterol. Belg. 2020, 83, 585–592. [Google Scholar]
- De Hert, S. Physiology of Hemodynamic Homeostasis. Best Pract. Res. Clin. Anaesthesiol. 2012, 26, 409–419. [Google Scholar] [CrossRef] [PubMed]
- Rodrigues, M.; Kosaric, N.; Bonham, C.A.; Gurtner, G.C. Wound Healing: A Cellular Perspective. Physiol. Rev. 2019, 99, 665–706. [Google Scholar] [CrossRef] [PubMed]
- Bonior, J.; Warzecha, Z.; Ceranowicz, P.; Gajdosz, R.; Pierzchalski, P.; Kot, M.; Leja-Szpak, A.; Nawrot-Porąbka, K.; Link-Lenczowski, P.; Pędziwiatr, M.; et al. Capsaicin-Sensitive Sensory Nerves Are Necessary for the Protective Effect of Ghrelin in Cerulein-Induced Acute Pancreatitis in Rats. Int. J. Mol. Sci. 2017, 18. [Google Scholar] [CrossRef] [PubMed]
- Bukowczan, J.; Warzecha, Z.; Ceranowicz, P.; Kuśnierz-Cabala, B.; Tomaszewska, R. Obestatin Accelerates the Recovery in the Course of Ischemia/Reperfusion-Induced Acute Pancreatitis in Rats. PloS One 2015, 10, e0134380. [Google Scholar] [CrossRef] [PubMed]
- Bukowczan, J.; Warzecha, Z.; Ceranowicz, P.; Kusnierz-Cabala, B.; Tomaszewska, R.; Dembinski, A. Therapeutic Effect of Ghrelin in the Course of Ischemia/Reperfusion-Induced Acute Pancreatitis. Curr. Pharm. Des. 2015, 21, 2284–2290. [Google Scholar] [CrossRef] [PubMed]
- Warzecha, Z.; Dembiński, A.; Ceranowicz, P.; Dembiński, M.; Cieszkowski, J.; Kuśnierz-Cabala, B.; Naskalski, J.W.; Jaworek, J.; Konturek, S.J.; Pawlik, W.W.; et al. Influence of Ischemic Preconditioning on Blood Coagulation, Fibrinolytic Activity and Pancreatic Repair in the Course of Caerulein-Induced Acute Pancreatitis in Rats. J. Physiol. Pharmacol. Off. J. Pol. Physiol. Soc. 2007, 58, 303–319. [Google Scholar]
- Aloysius, M.M.; Thatti, A.; Gupta, A.; Sharma, N.; Bansal, P.; Goyal, H. COVID-19 Presenting as Acute Pancreatitis. Pancreatol. Off. J. Int. Assoc. Pancreatol. IAP Al 2020, 20, 1026–1027. [Google Scholar] [CrossRef]
- Anand, E.R.; Major, C.; Pickering, O.; Nelson, M. Acute Pancreatitis in a COVID-19 Patient. Br. J. Surg. 2020, 107, e182. [Google Scholar] [CrossRef]
- Stevens, J.P.; Brownell, J.N.; Freeman, A.J.; Bashaw, H. COVID-19-Associated Multisystem Inflammatory Syndrome in Children Presenting as Acute Pancreatitis. J. Pediatr. Gastroenterol. Nutr. 2020, 71, 669–671. [Google Scholar] [CrossRef]
- Suchman, K.; Raphael, K.L.; Liu, Y.; Wee, D.; Trindade, A.J. ; Northwell COVID-19 Research Consortium Acute Pancreatitis in Children Hospitalized with COVID-19. Pancreatol. Off. J. Int. Assoc. Pancreatol. IAP Al 2021, 21, 31–33. [Google Scholar] [CrossRef]
- Lazzaroni, M.G.; Piantoni, S.; Masneri, S.; Garrafa, E.; Martini, G.; Tincani, A.; Andreoli, L.; Franceschini, F. Coagulation Dysfunction in COVID-19: The Interplay between Inflammation, Viral Infection and the Coagulation System. Blood Rev. 2020, 100745. [Google Scholar] [CrossRef]
- Magro, G. COVID-19: Review on Latest Available Drugs and Therapies against SARS-CoV-2. Coagulation and Inflammation Cross-Talking. Virus Res. 2020, 286, 198070. [Google Scholar] [CrossRef] [PubMed]
- Ahmed, M.; Advani, S.; Moreira, A.; Zoretic, S.; Martinez, J.; Chorath, K.; Acosta, S.; Naqvi, R.; Burmeister-Morton, F.; Burmeister, F.; et al. Multisystem Inflammatory Syndrome in Children: A Systematic Review. EClinicalMedicine 2020, 26, 100527. [Google Scholar] [CrossRef] [PubMed]
- Couris, R.; Tataronis, G.; McCloskey, W.; Oertel, L.; Dallal, G.; Dwyer, J.; Blumberg, J.B. Dietary Vitamin K Variability Affects International Normalized Ratio (INR) Coagulation Indices. Int. J. Vitam. Nutr. Res. Int. Z. Vitam.- Ernahrungsforschung J. Int. Vitaminol. Nutr. 2006, 76, 65–74. [Google Scholar] [CrossRef] [PubMed]
- Rieder, M.J.; Reiner, A.P.; Gage, B.F.; Nickerson, D.A.; Eby, C.S.; McLeod, H.L.; Blough, D.K.; Thummel, K.E.; Veenstra, D.L.; Rettie, A.E. Effect of VKORC1 Haplotypes on Transcriptional Regulation and Warfarin Dose. N. Engl. J. Med. 2005, 352, 2285–2293. [Google Scholar] [CrossRef]
- Higashi, M.K.; Veenstra, D.L.; Kondo, L.M.; Wittkowsky, A.K.; Srinouanprachanh, S.L.; Farin, F.M.; Rettie, A.E. Association between CYP2C9 Genetic Variants and Anticoagulation-Related Outcomes during Warfarin Therapy. JAMA 2002, 287, 1690–1698. [Google Scholar] [CrossRef] [PubMed]
- Johnson, J.A.; Cavallari, L.H. Warfarin Pharmacogenetics. Trends Cardiovasc. Med. 2015, 25, 33–41. [Google Scholar] [CrossRef]
- Lubitz, S.A.; Scott, S.A.; Rothlauf, E.B.; Agarwal, A.; Peter, I.; Doheny, D.; Van Der Zee, S.; Jaremko, M.; Yoo, C.; Desnick, R.J.; et al. Comparative Performance of Gene-Based Warfarin Dosing Algorithms in a Multiethnic Population. J. Thromb. Haemost. JTH 2010, 8, 1018–1026. [Google Scholar] [CrossRef]
Disclaimer/Publisher’s Note: The statements, opinions and data contained in all publications are solely those of the individual author(s) and contributor(s) and not of MDPI and/or the editor(s). MDPI and/or the editor(s) disclaim responsibility for any injury to people or property resulting from any ideas, methods, instructions or products referred to in the content. |
© 2023 by the authors. Licensee MDPI, Basel, Switzerland. This article is an open access article distributed under the terms and conditions of the Creative Commons Attribution (CC BY) license (http://creativecommons.org/licenses/by/4.0/).


