1. Introduction
Currently, the application of high purity aluminum foil is predominantly observed in high voltage anode electrolytic capacitors [
1]. The aluminum electrolytic capacitor is a significant electronic part that possesses various features, including a vast capacity, affordable cost, and extensive application in fields such as communication, electronics, aviation, new energy vehicles, and solar energy, among others. As electronic component integration advances, the demand for higher quality and smaller capacitors increases, necessitating the development of superior capacitor foil to meet both domestic and international market requirements. A very important aspect that the capacitance value is a crucial parameter for assessing the quality of aluminum foils in terms of performance [
2,
3]. Under identical metallurgical quality and process parameters, the specific capacitance values are contingent upon the cubic orientation structure of the initial foil [
4], necessitating a cubic texture of at least 95% and a moderate grain size. Consequently, enhancing the quality of capacitors with high-purity aluminum foil entails investigating the evolution of cubic orientation grain during the annealing process, regulating the cubic texture components and grain size of the aluminum foil to govern the capacitance value of the final product, and ensuring that its quality aligns with the demands of practical production.
The production of aluminum foil involves a thorough investigation of various factors such as production technology [
5,
6], impurity elements [
7,
8,
9], and initial microstructures [
10]. These factors have a significant impact on the cubic texture and specific capacitance of high voltage anode capacitor aluminum foil. The researchers have conducted a detailed study on these aspects to ensure the preparation process of aluminum foil is optimized for maximum efficiency. Simultaneously, the present study employs the theory of recrystallization to examine the underlying mechanism responsible for the development of cubic texture. It is posited that the formation of cubic texture is primarily governed by surface energy [
11]. The impact of intermediate annealing on the texture resulting from cold rolled deformation was found to be insignificant by the researchers [
12]. However, it was observed that the cubic texture of the finished product after annealing was greatly influenced by this process. Despite this, there have been relatively few studies conducted on how varying heating rates after intermediate annealing can be utilized to control the annealing of aluminum foil. In light of this, the present study proposes a novel annealing process that differs from previous research and involves the use of varying heating rates for the finished product after intermediate annealing of aluminum foil. The microstructure and texture of samples subjected to different annealing states were analyzed using XRD and EBSD techniques, with a focus on the grain size and texture content of the cube orientation in aluminum foil.
1. Experiment
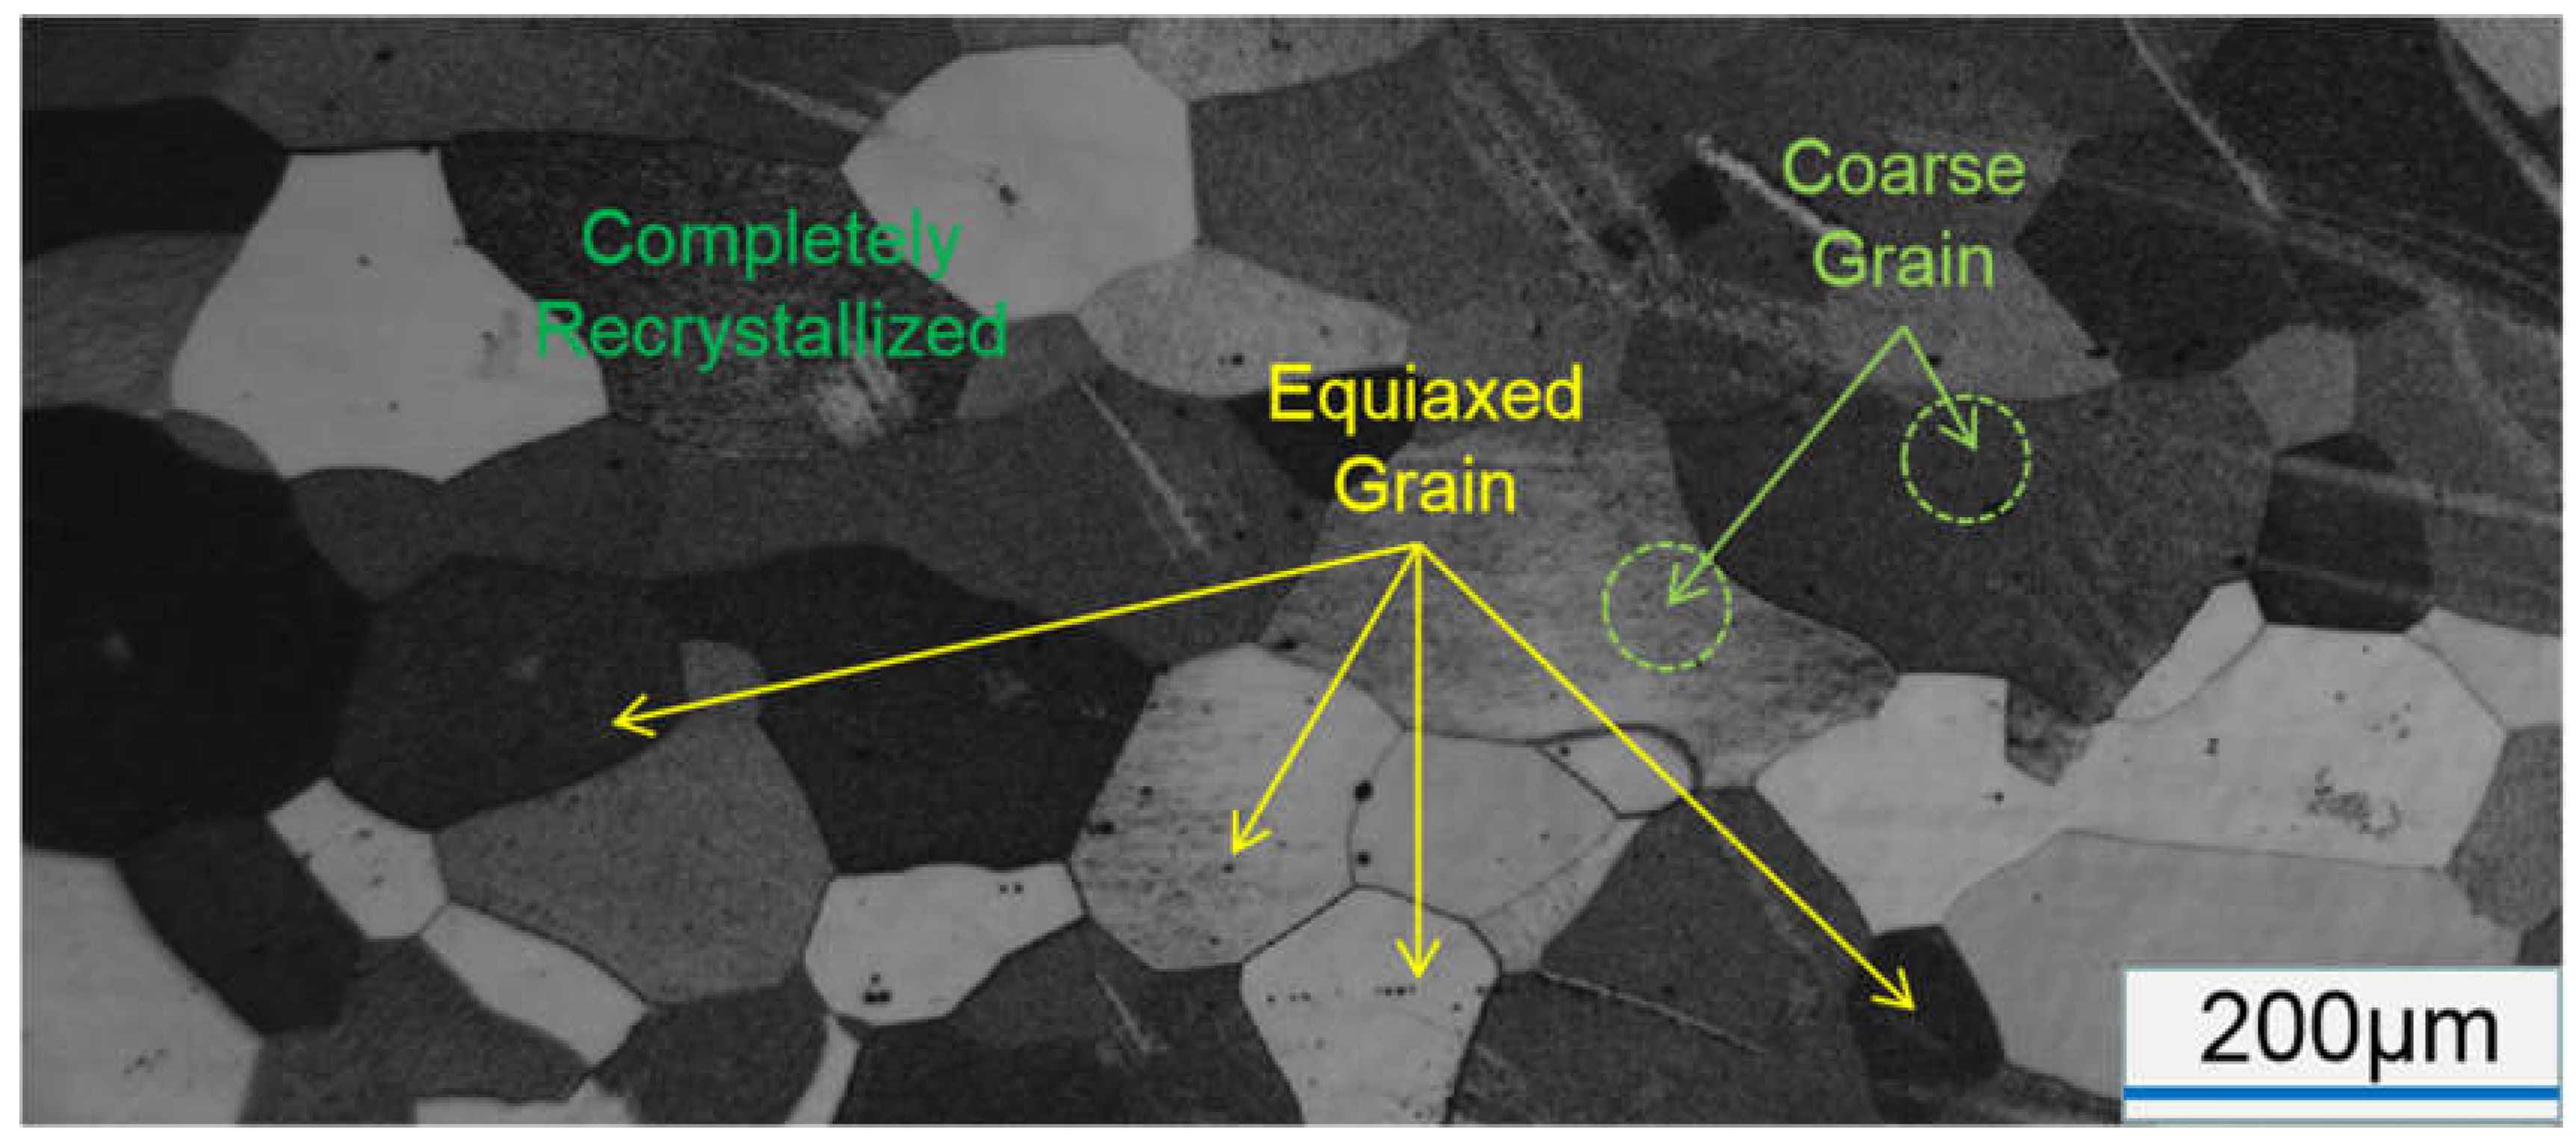
The experimental material utilized in this study consisted of hot rolled high purity aluminum, which was provided by Southwest Aluminum Industries Co., Ltd (Chongqing, China). The microstructure and chemical composition of the material were analyzed and presented in
Figure 1 and
Table 1, respectively.
The microstructure analysis revealed a fully recrystallized grain structure with uniform distribution, and an average grain size of approximately 185 μm. The chemical analysis indicated that the aluminum plate had a purity of 99.99% and contained only trace amounts of impurity elements.
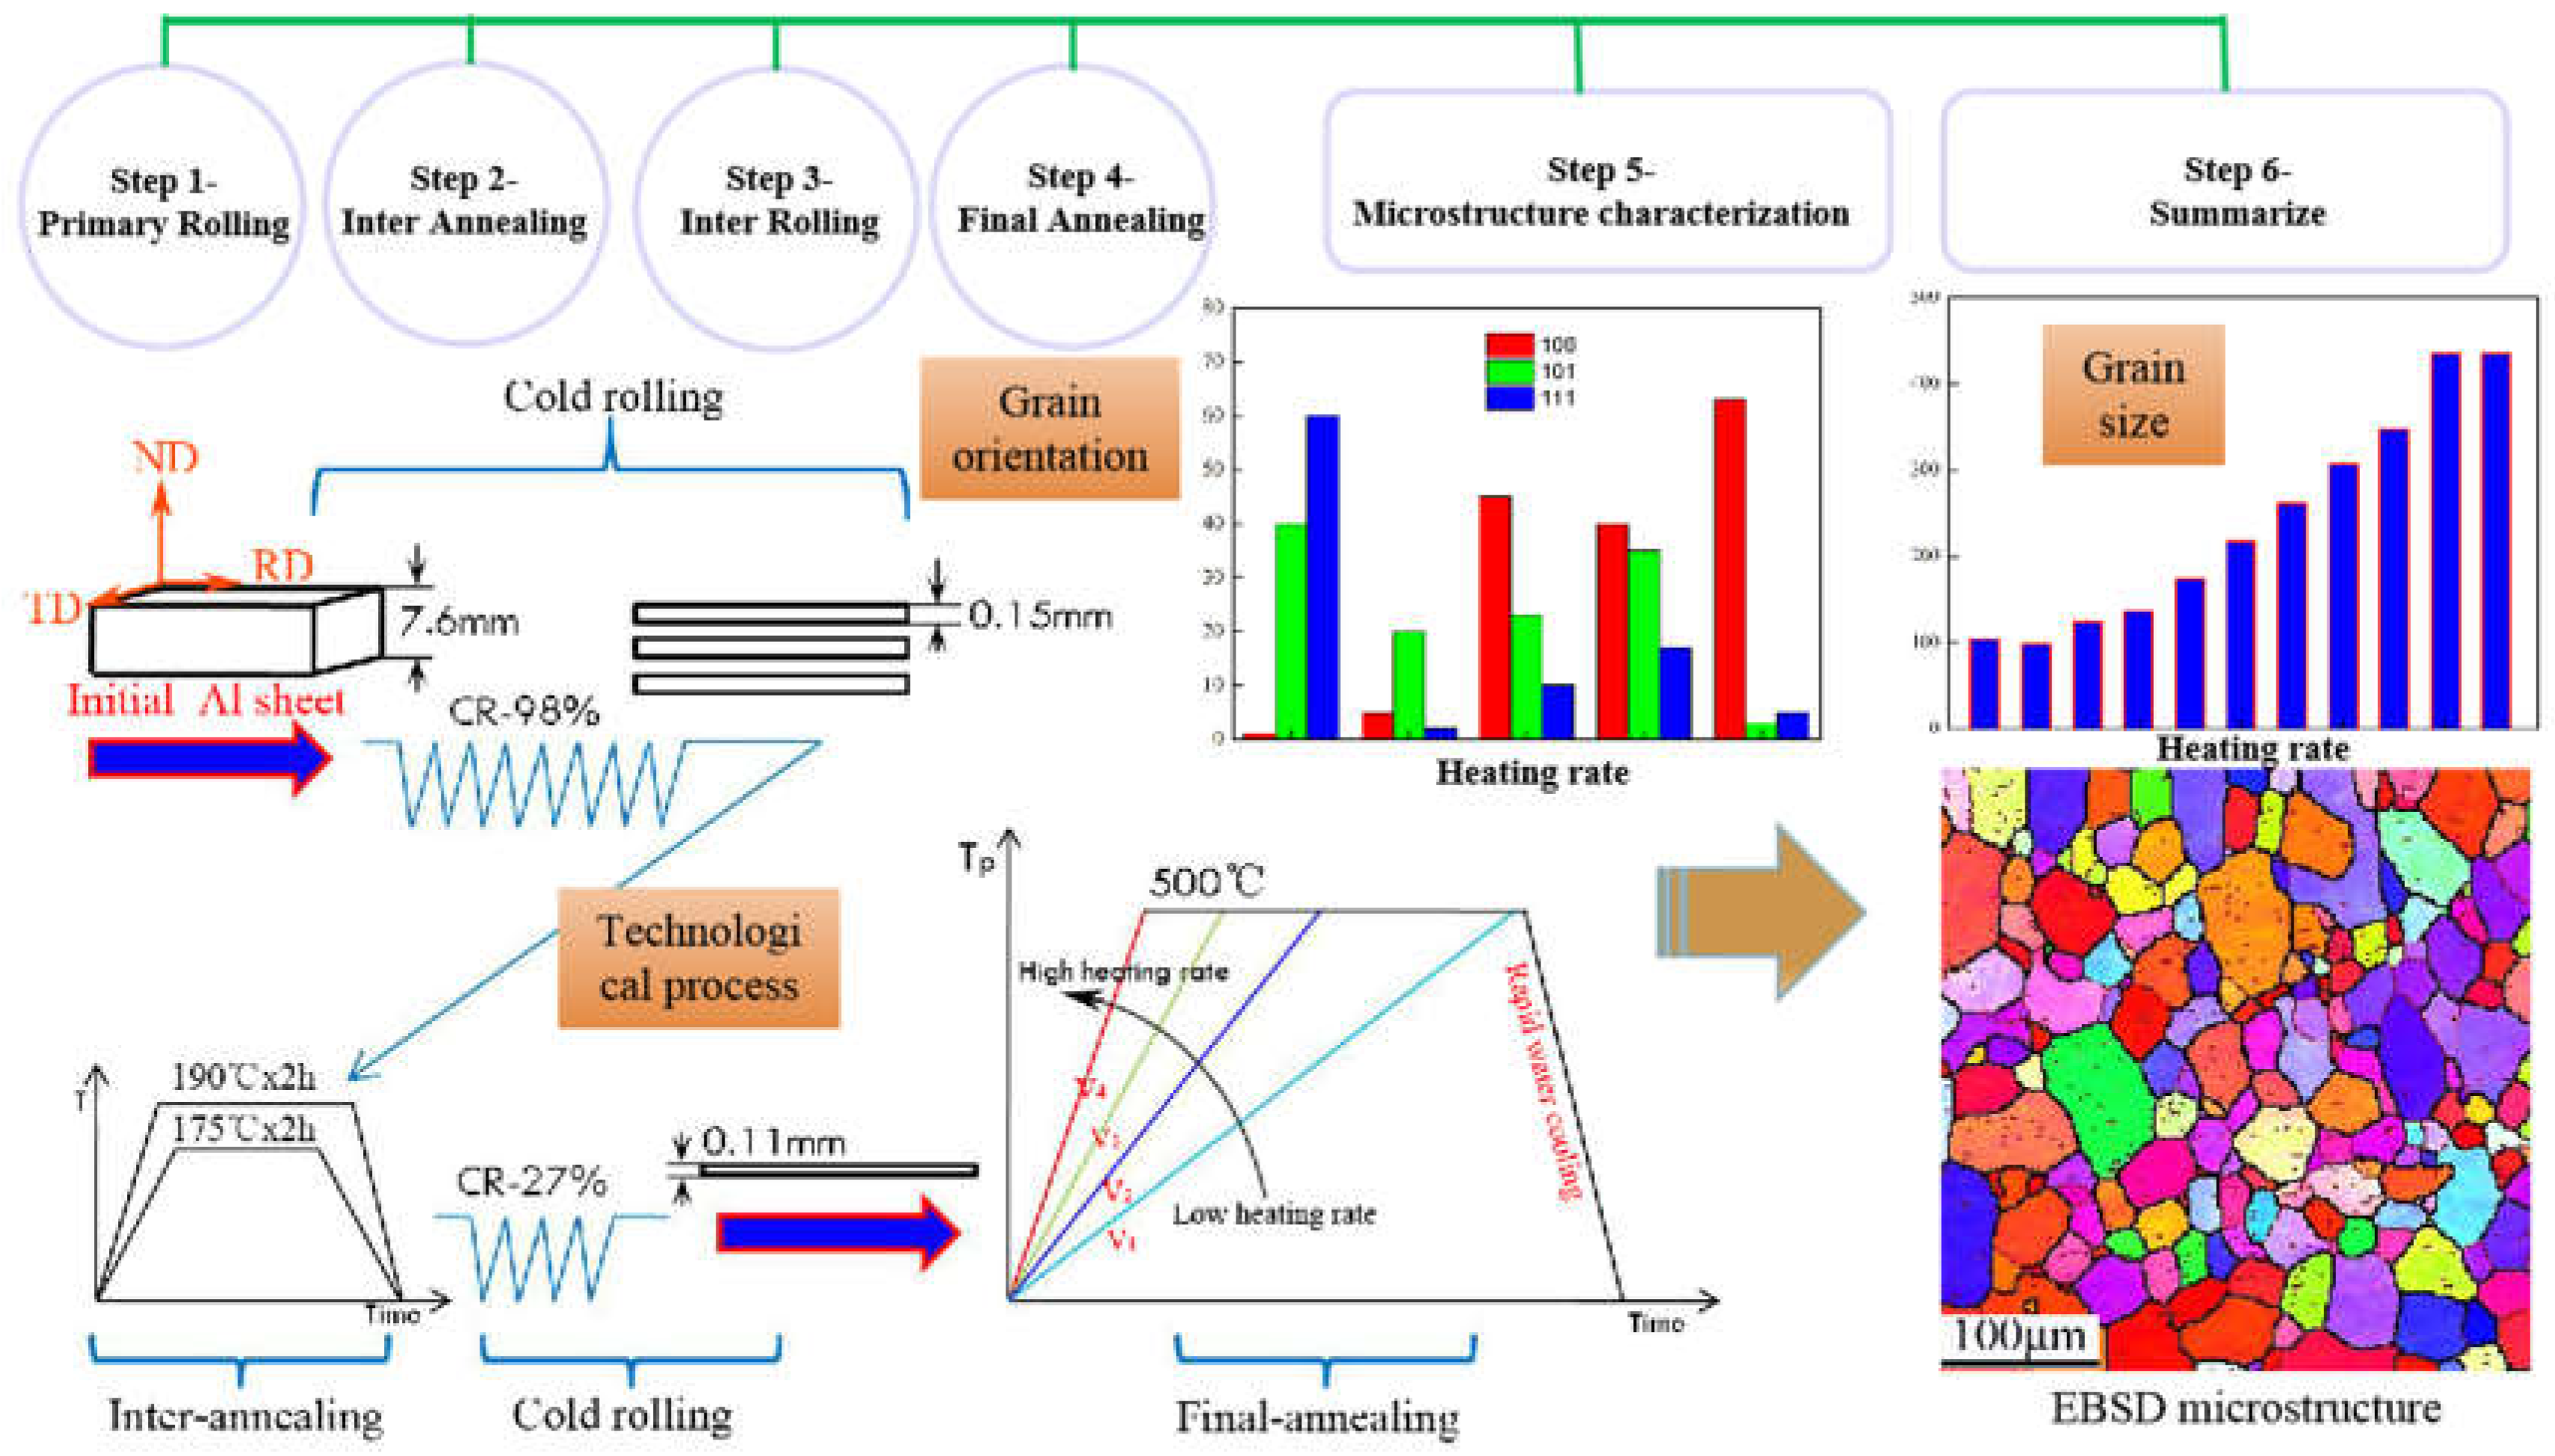
The experimental procedure involved subjecting a 7.6 mm plate to 98% cold deformation, resulting in a thickness of 0.15 mm. The plate was then subjected to intermediate annealing at either 175°C or 190°C for a duration of 2 hours. Subsequently, the aluminum foil was cold rolled to a thickness of 0.11mm with a deformation of 27%, followed by annealing at different heating speeds ranging from room temperature to 500°C, and rapidly cooled to room temperature. The specific cold deformation and heat treatment process curve is illustrated in
Figure 2.
Following the completion of product annealing, a sample size of 20×10×0.11 mm was obtained from aluminum foil. The RD/TD surface was subjected to dry grinding using 1000#, 2000#, and 4000# sandpaper until the surface was free of scratches. Subsequently, the surface was treated with alcohol and electrolytic polishing. The electrolytic polishing liquid comprised 10ml HClO4 and 90ml C2H5OH. The test samples were connected to the anode, while the cathode was connected to a stainless steel electrode. The polishing conditions involved a voltage of 18 v, current of 0.1~0.3 A, and polishing time of 50 s. The sample was then immediately removed, flushed with water and alcohol, and dried. The microstructures and macro-textures were characterized using EBSD technique (Oberkochen, Germany), the soft of HKL/Channel 5, and X-ray Diffractometer (XRD) of Righaku D/MAX-2500PC (Bruker, Germany).
2. Results
2.1. Evolution of macro-texture
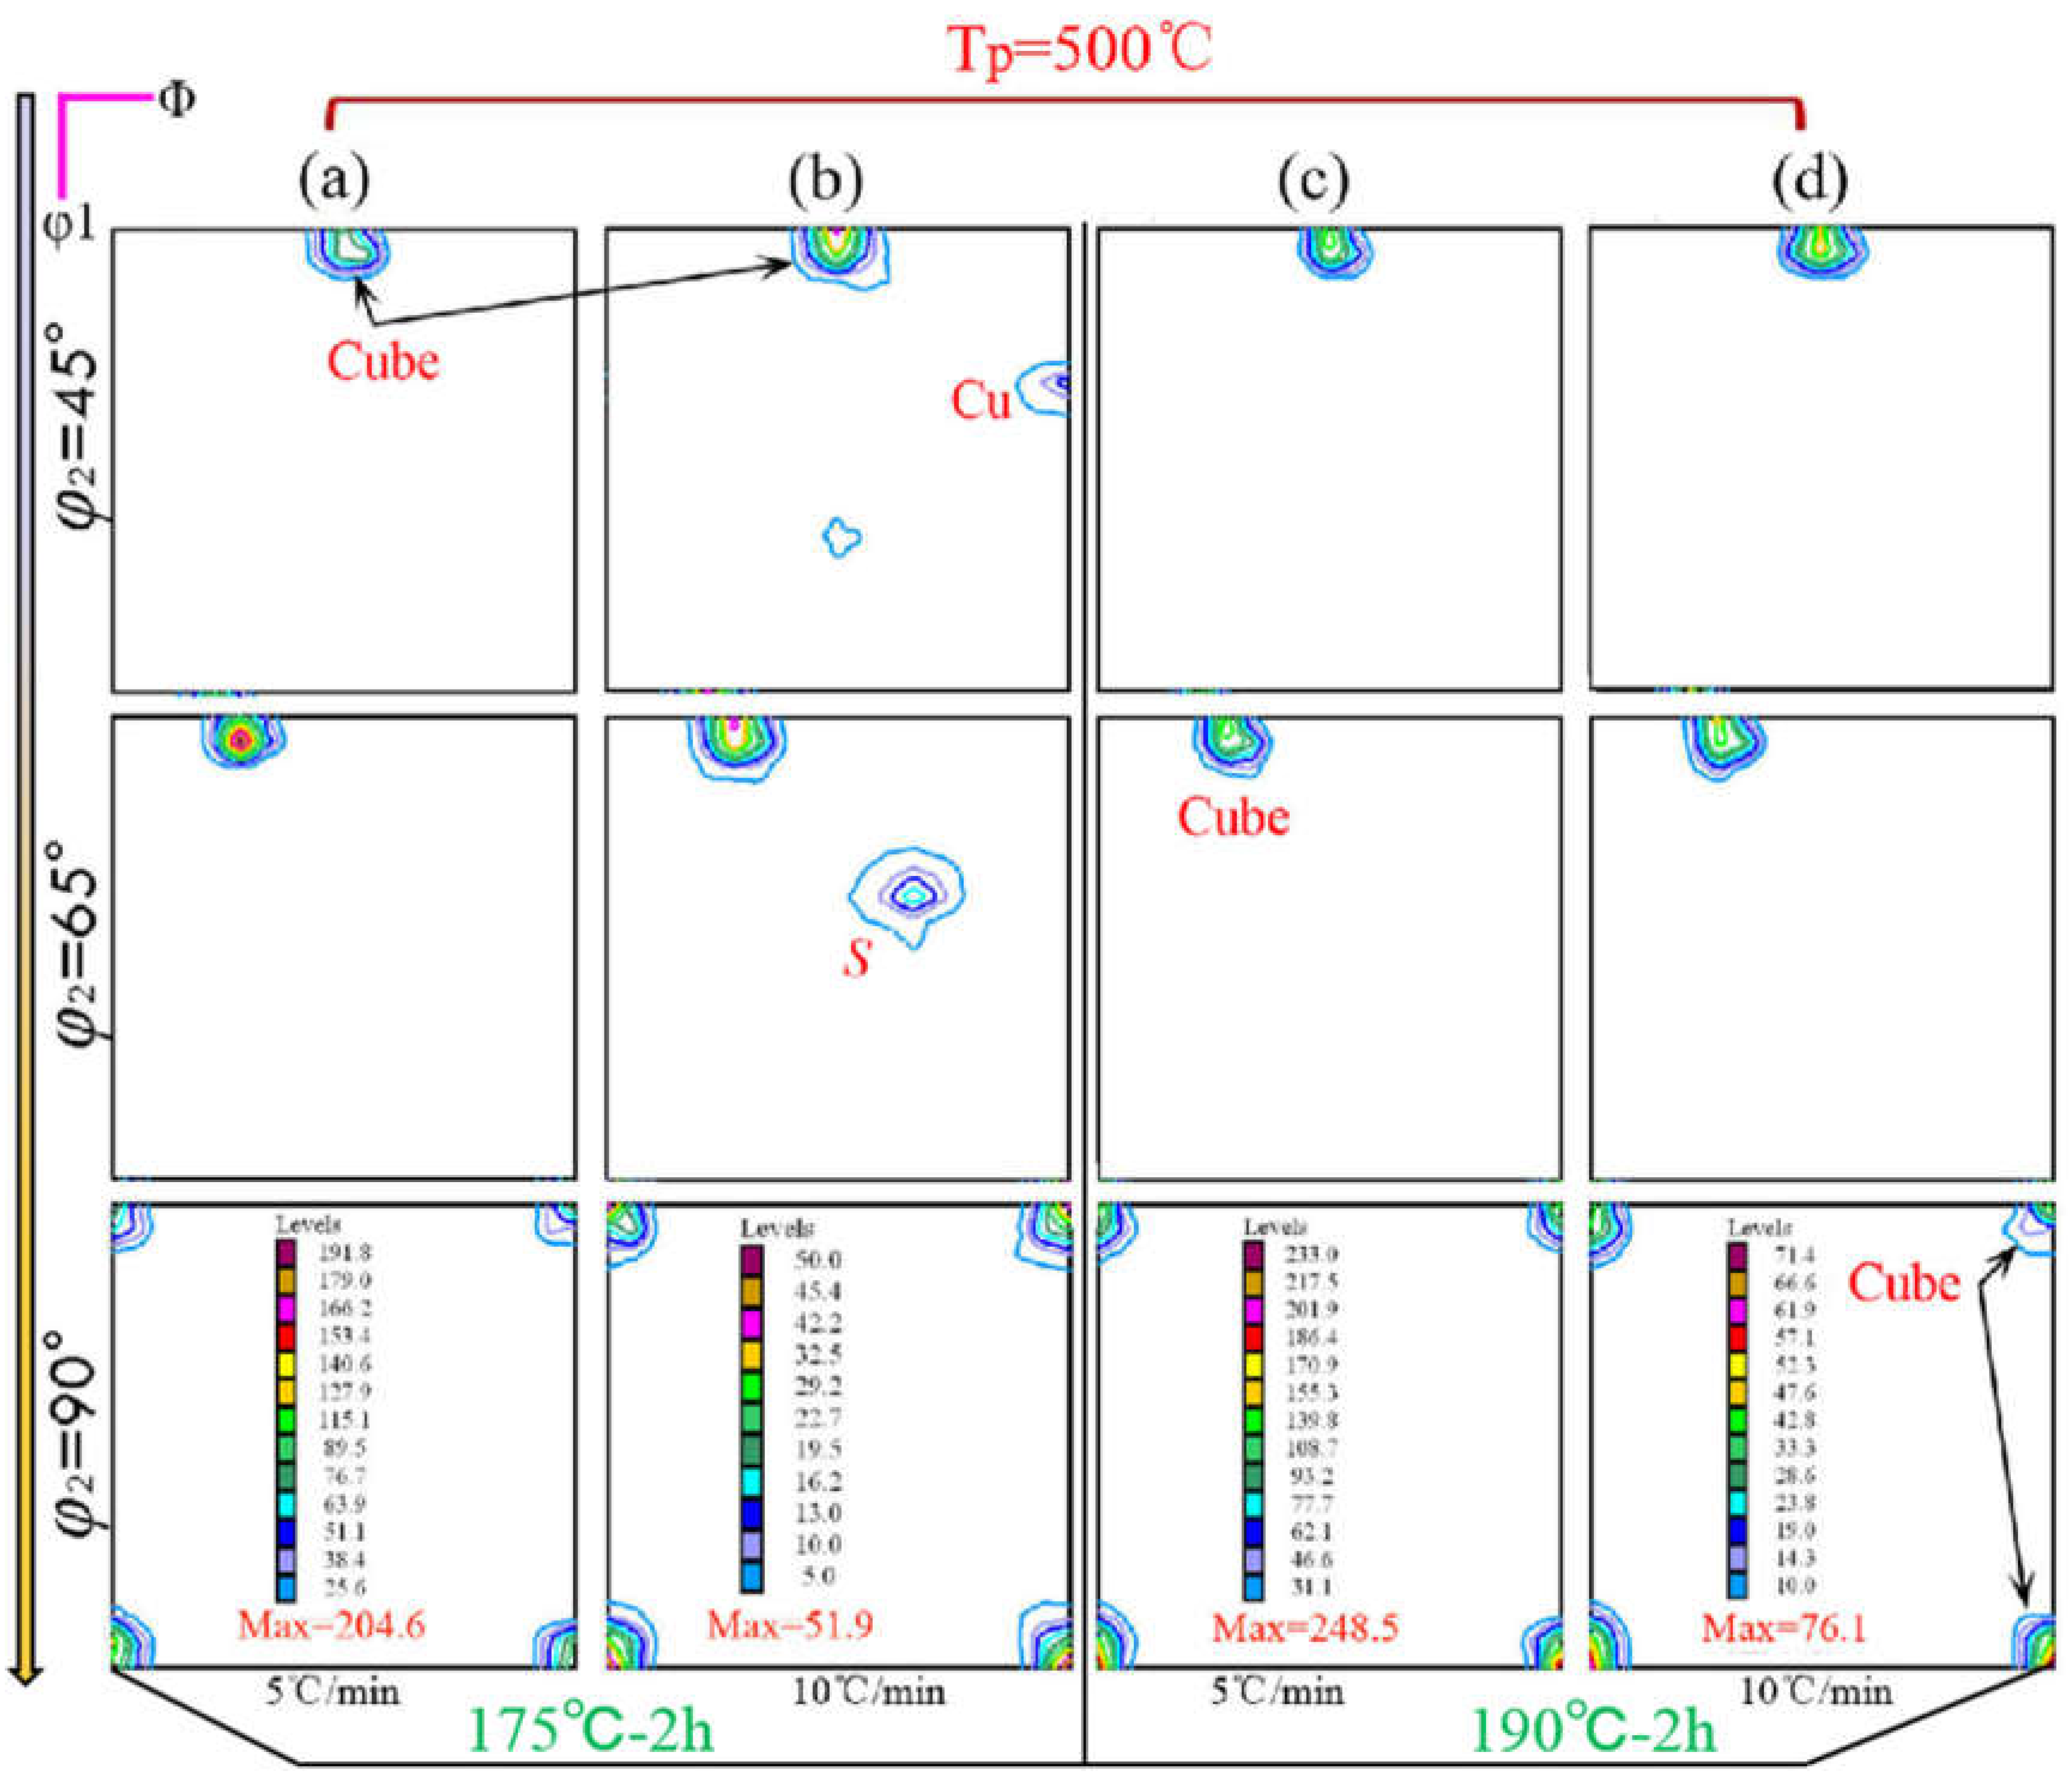
The XR) technique was employed to examine the macrostructure of the annealed finished product subjected to different heating rates. The results are presented in
Figure 3, with the sections of
φ2=45°, 65°, and 90° being selected for analysis. At a low heating rate, the aluminum foil underwent complete recrystallization, exhibiting a typical recrystallization texture, namely the cube-texture [
13,
14,
15].
The analysis of the selected sections revealed that the cube-texture was most prominent during the inter-annealing process at 175°C×2h of the finished product annealing. The S-texture was the next most prevalent, with a small amount of Cu-texture also observed. As the heating rate increased, the decomposition of the S-texture was delayed, leading to its transformation into the cube-texture.
2.2. Evolution of micro-texture
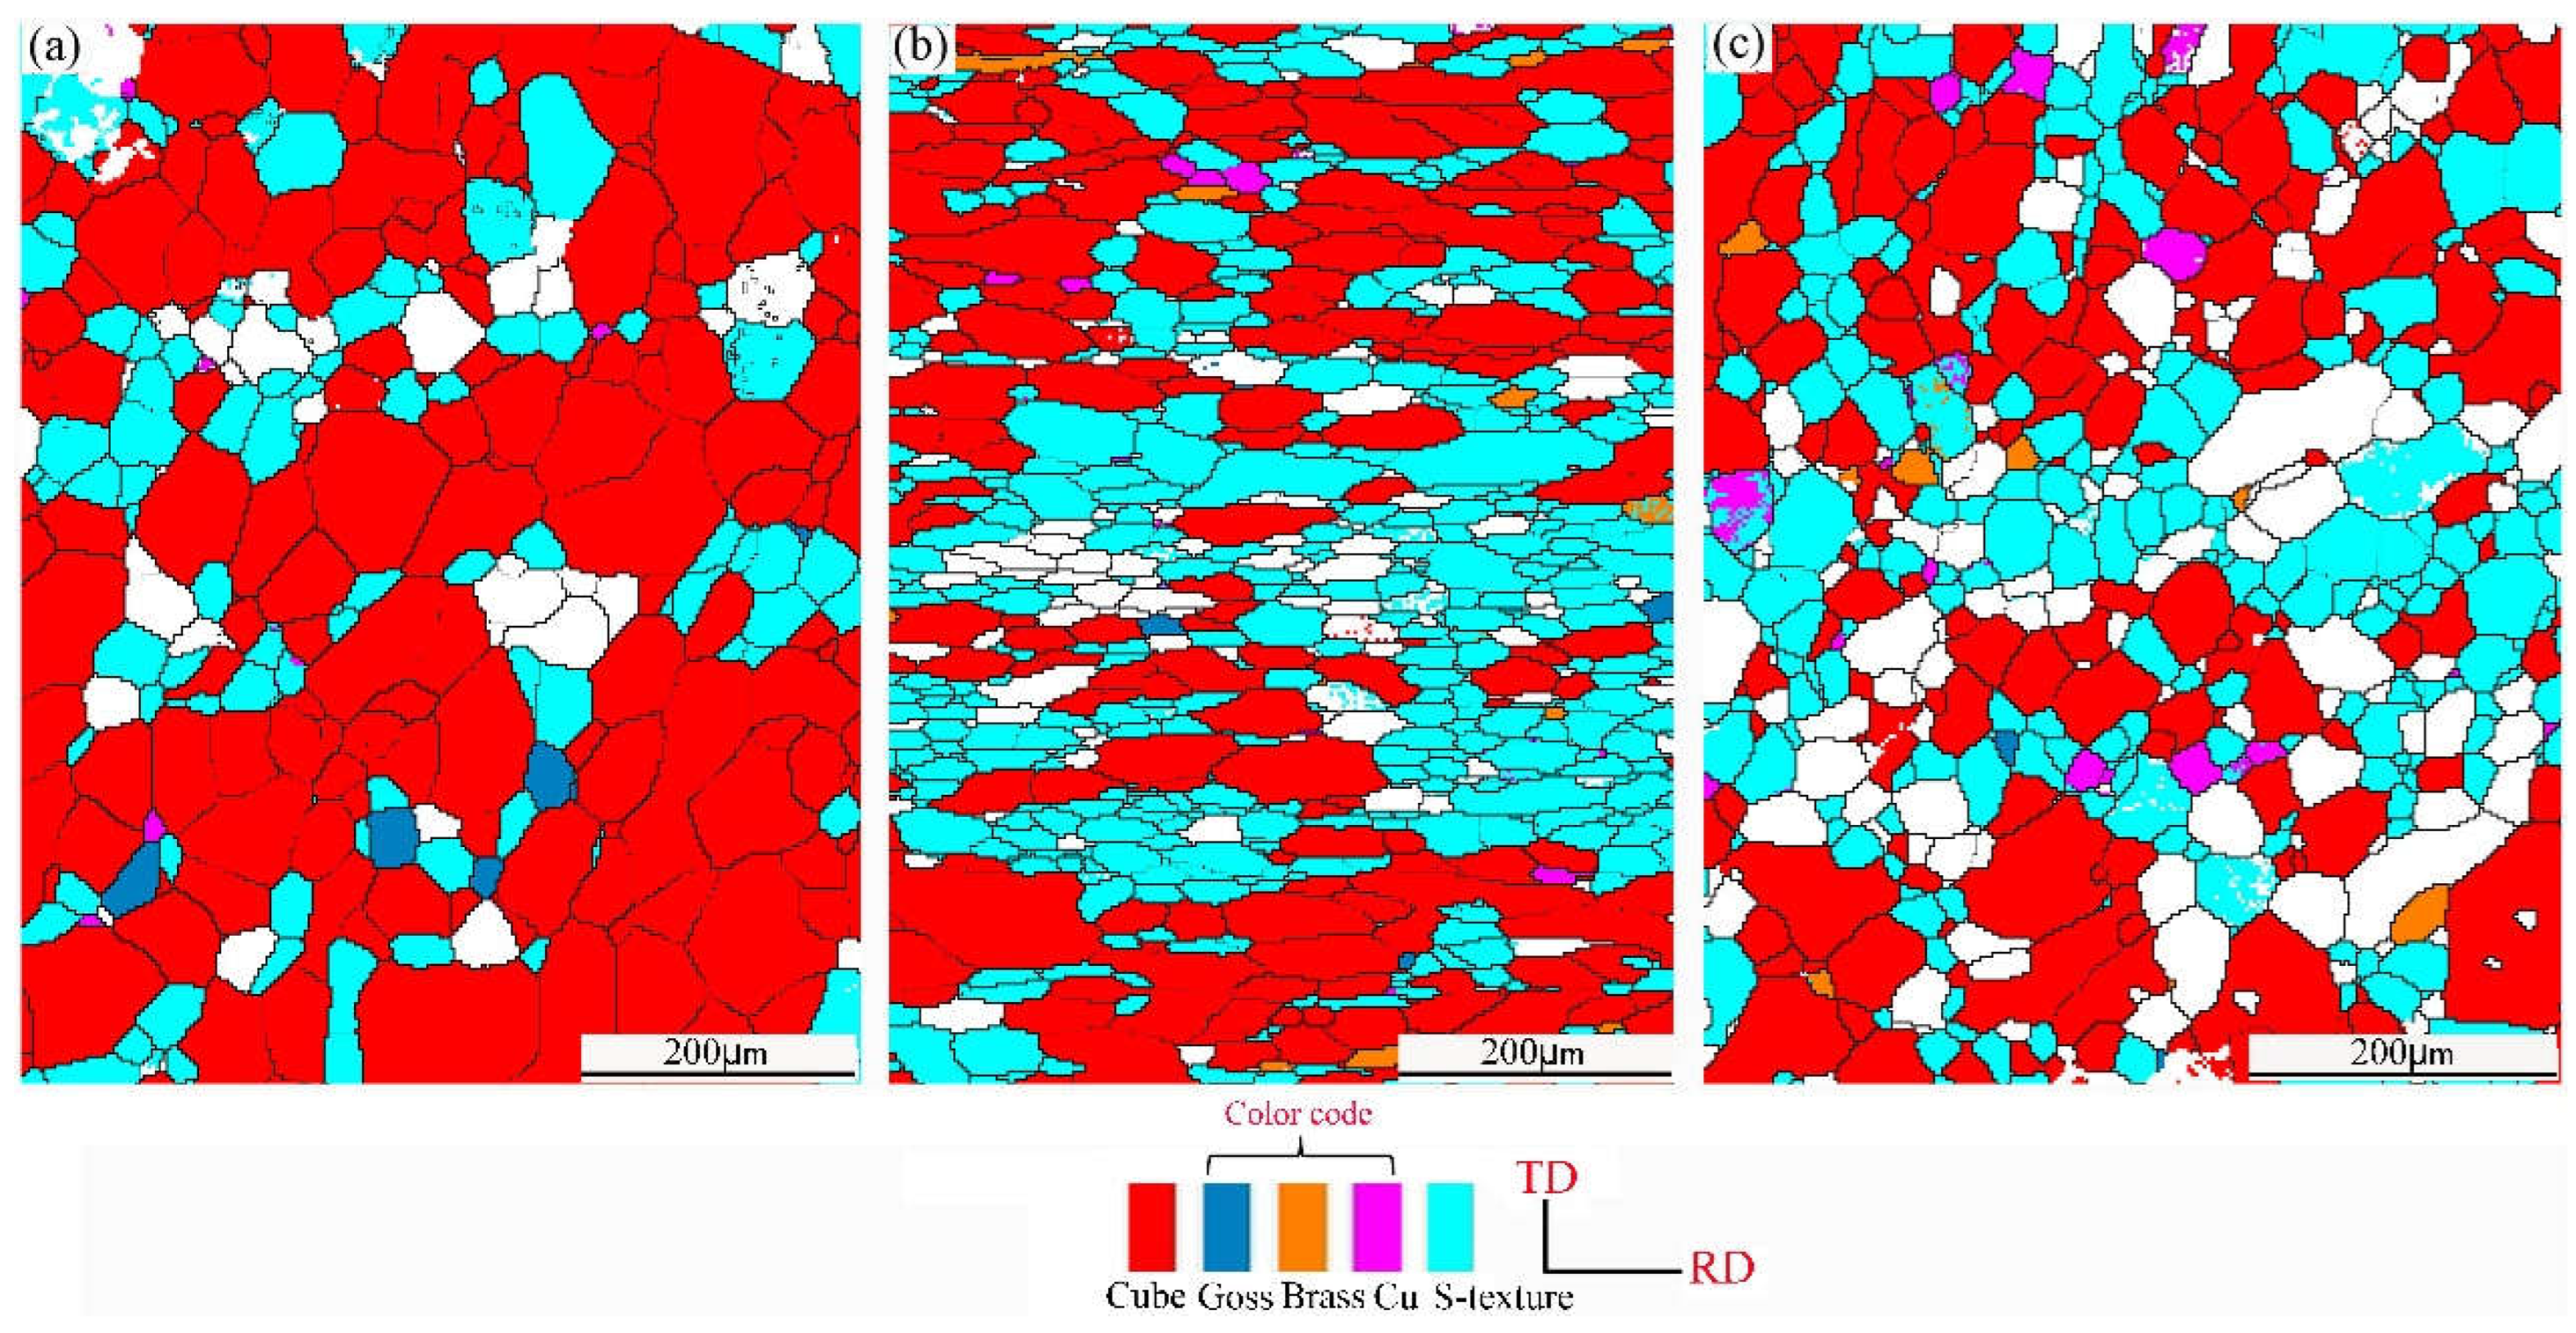
The present study investigates the microstructural changes in aluminum foil that has undergone cold rolling after inter-annealing at 175°C/2h, followed by finished product annealing with varying heating rates. The microstructures are analyzed using the EBSD technique, with thin aluminum foil areas of 800×650 μm
2 scanned by steps of 1.5 μm. The results, as depicted in
Figure 4, indicate that an increase in heating rate leads to a gradual reduction in cube texture and a corresponding increase in S-texture. However, the content of Goss-texture, Cu-texture, and Brass-texture remains relatively low, with no significant effect observed due to changes in heating rate. The shorter heating rate results in a greater heating time, which in turn leads to a shorter recrystallization time after recovery completion. Consequently, there is insufficient time to fully consume the deformation matrix, resulting in the retention of a significant amount of rolling texture.
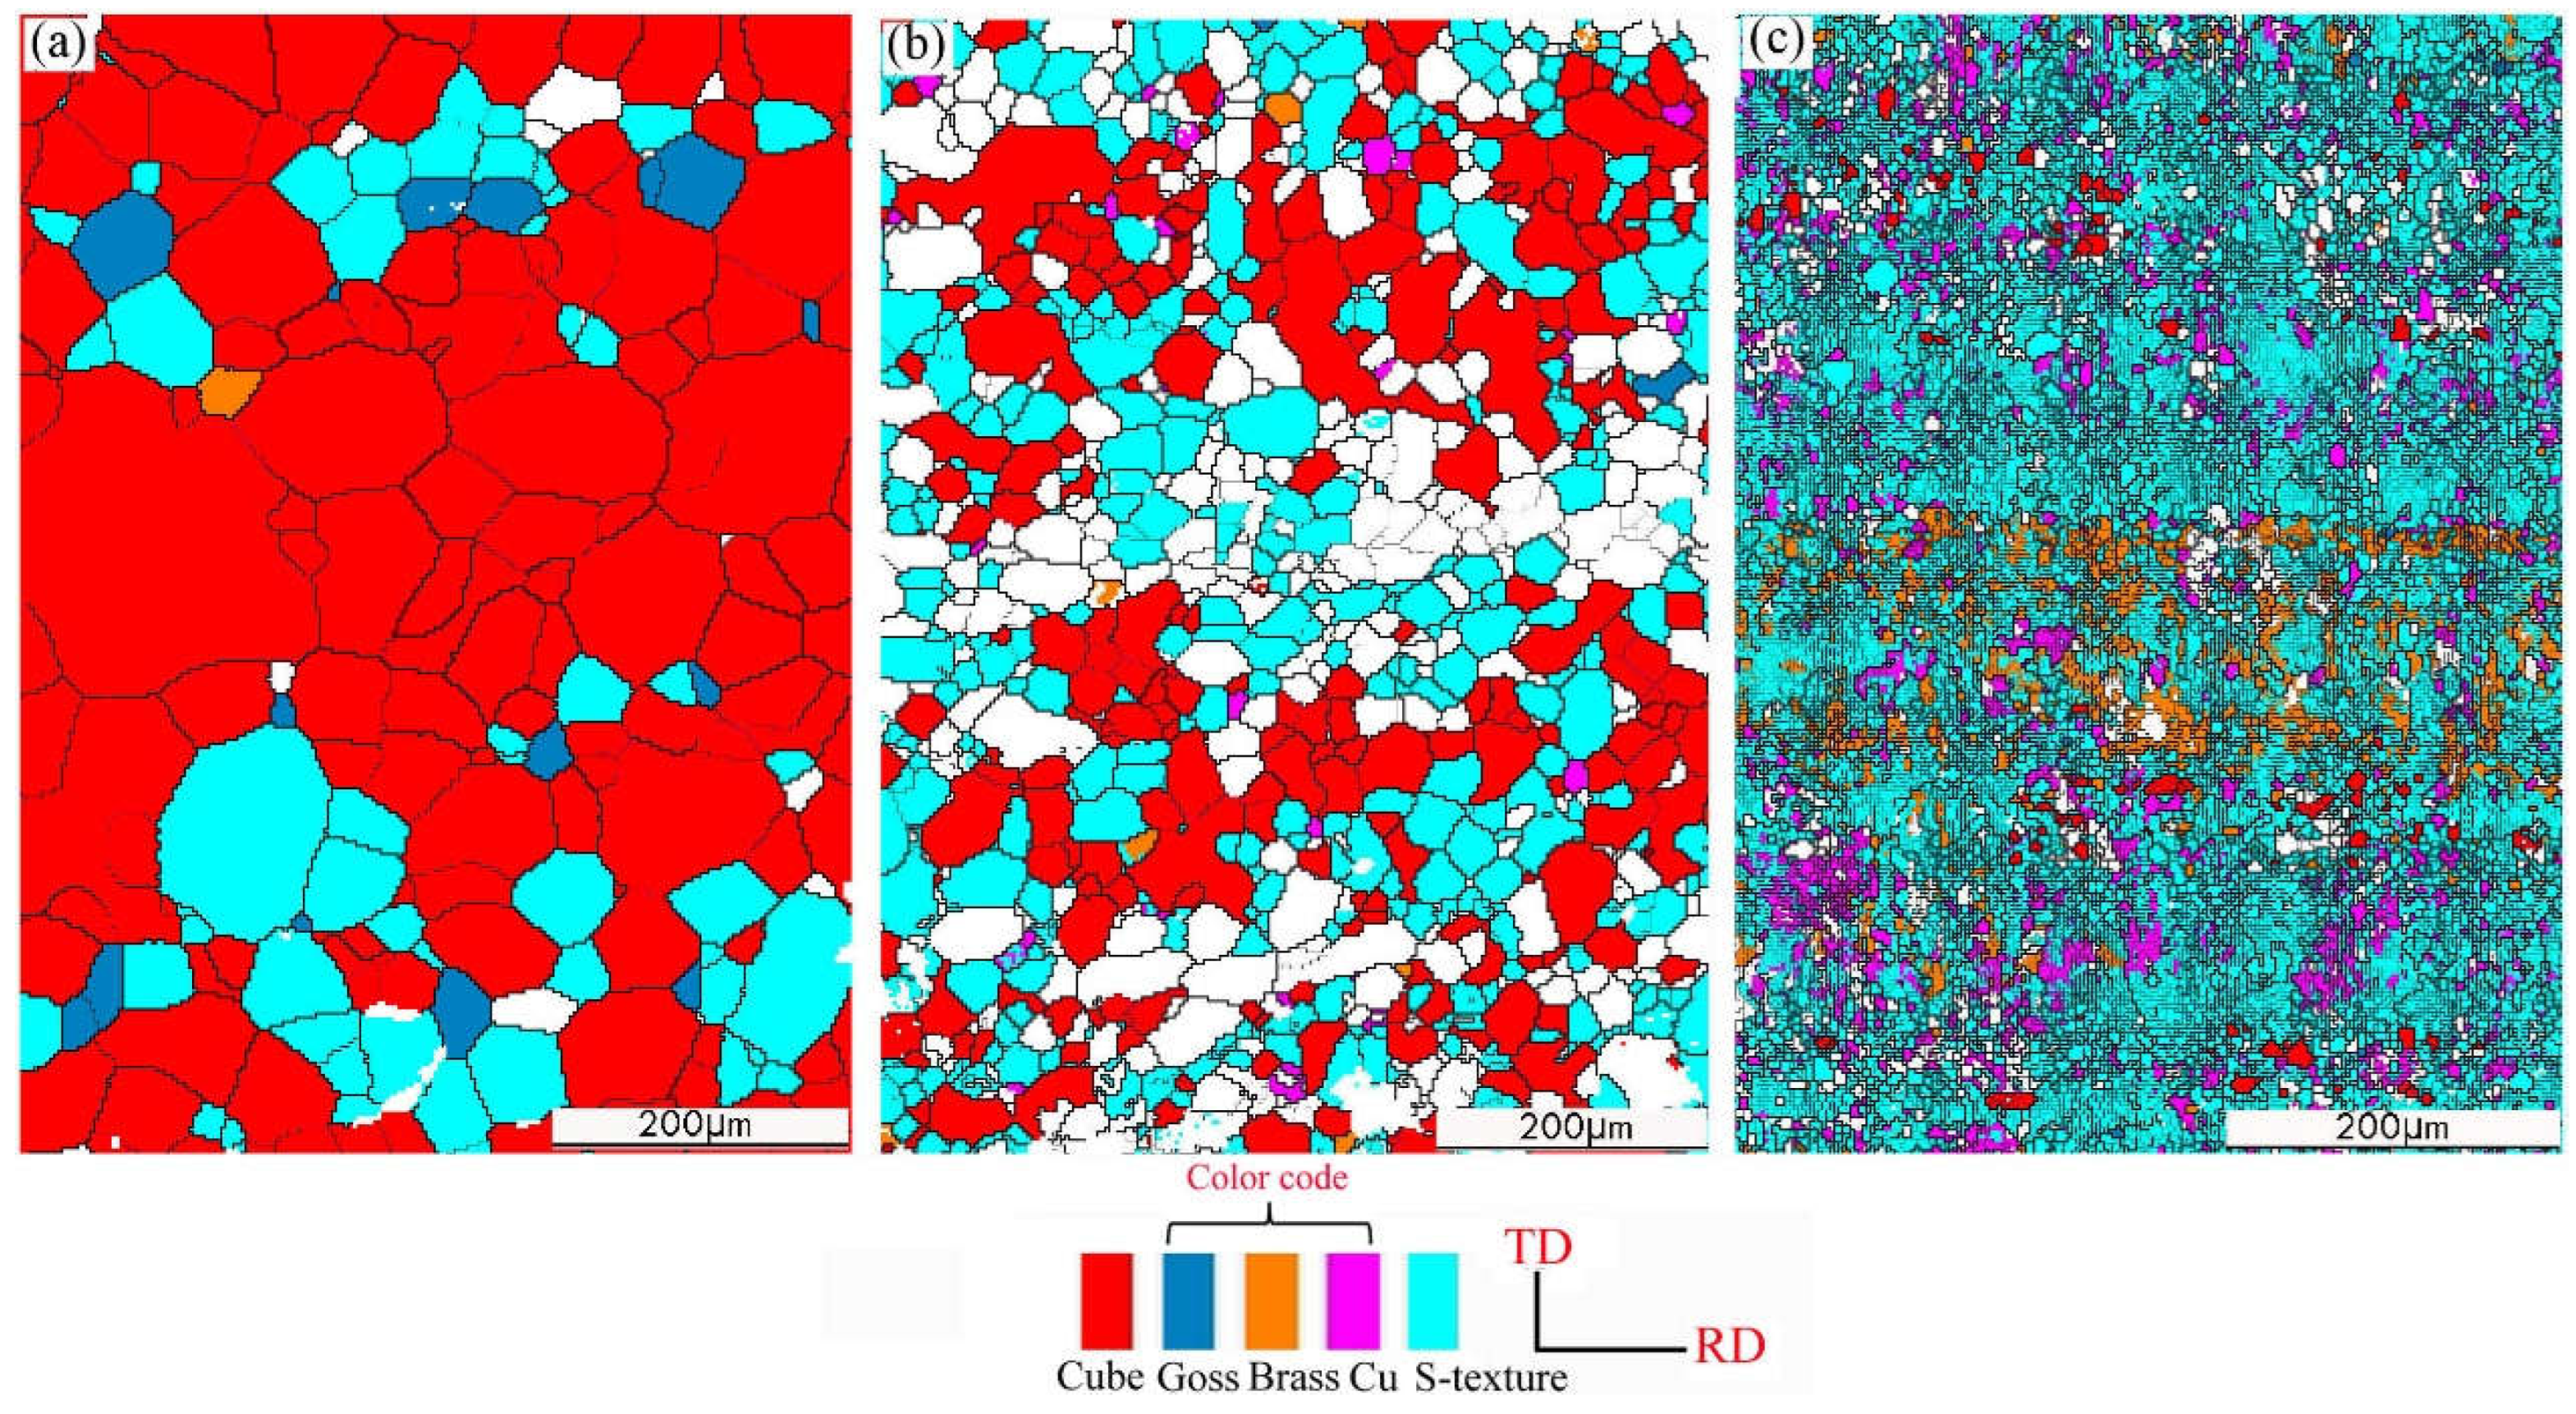
By maintaining all other parameters constant and increasing the intermediate annealing temperature to 190°C with a 2-hour insulation period, the microstructure of the annealed finished product was analyzed and the results are presented in
Figure 5. The cube-texture gradually decreased with an increase in heating rate, while the S-texture gradually increased. At a heating rate of 25°C/min, the sample was in a transitional state, with partial recrystallization and small grain size, averaging about 12 μm. Some parts of the sample were still in a recovery state, exhibiting a deformation texture dominated by S-texture and Cu-texture throughout the sample space, as shown in
Figure 5c.
The deflection of micro-texture can serve as an indicator of the mechanism behind texture formation to a certain degree, as noted in reference [
16]. This serves as a fundamental basis for the analysis of the regularity of microstructure evolution.
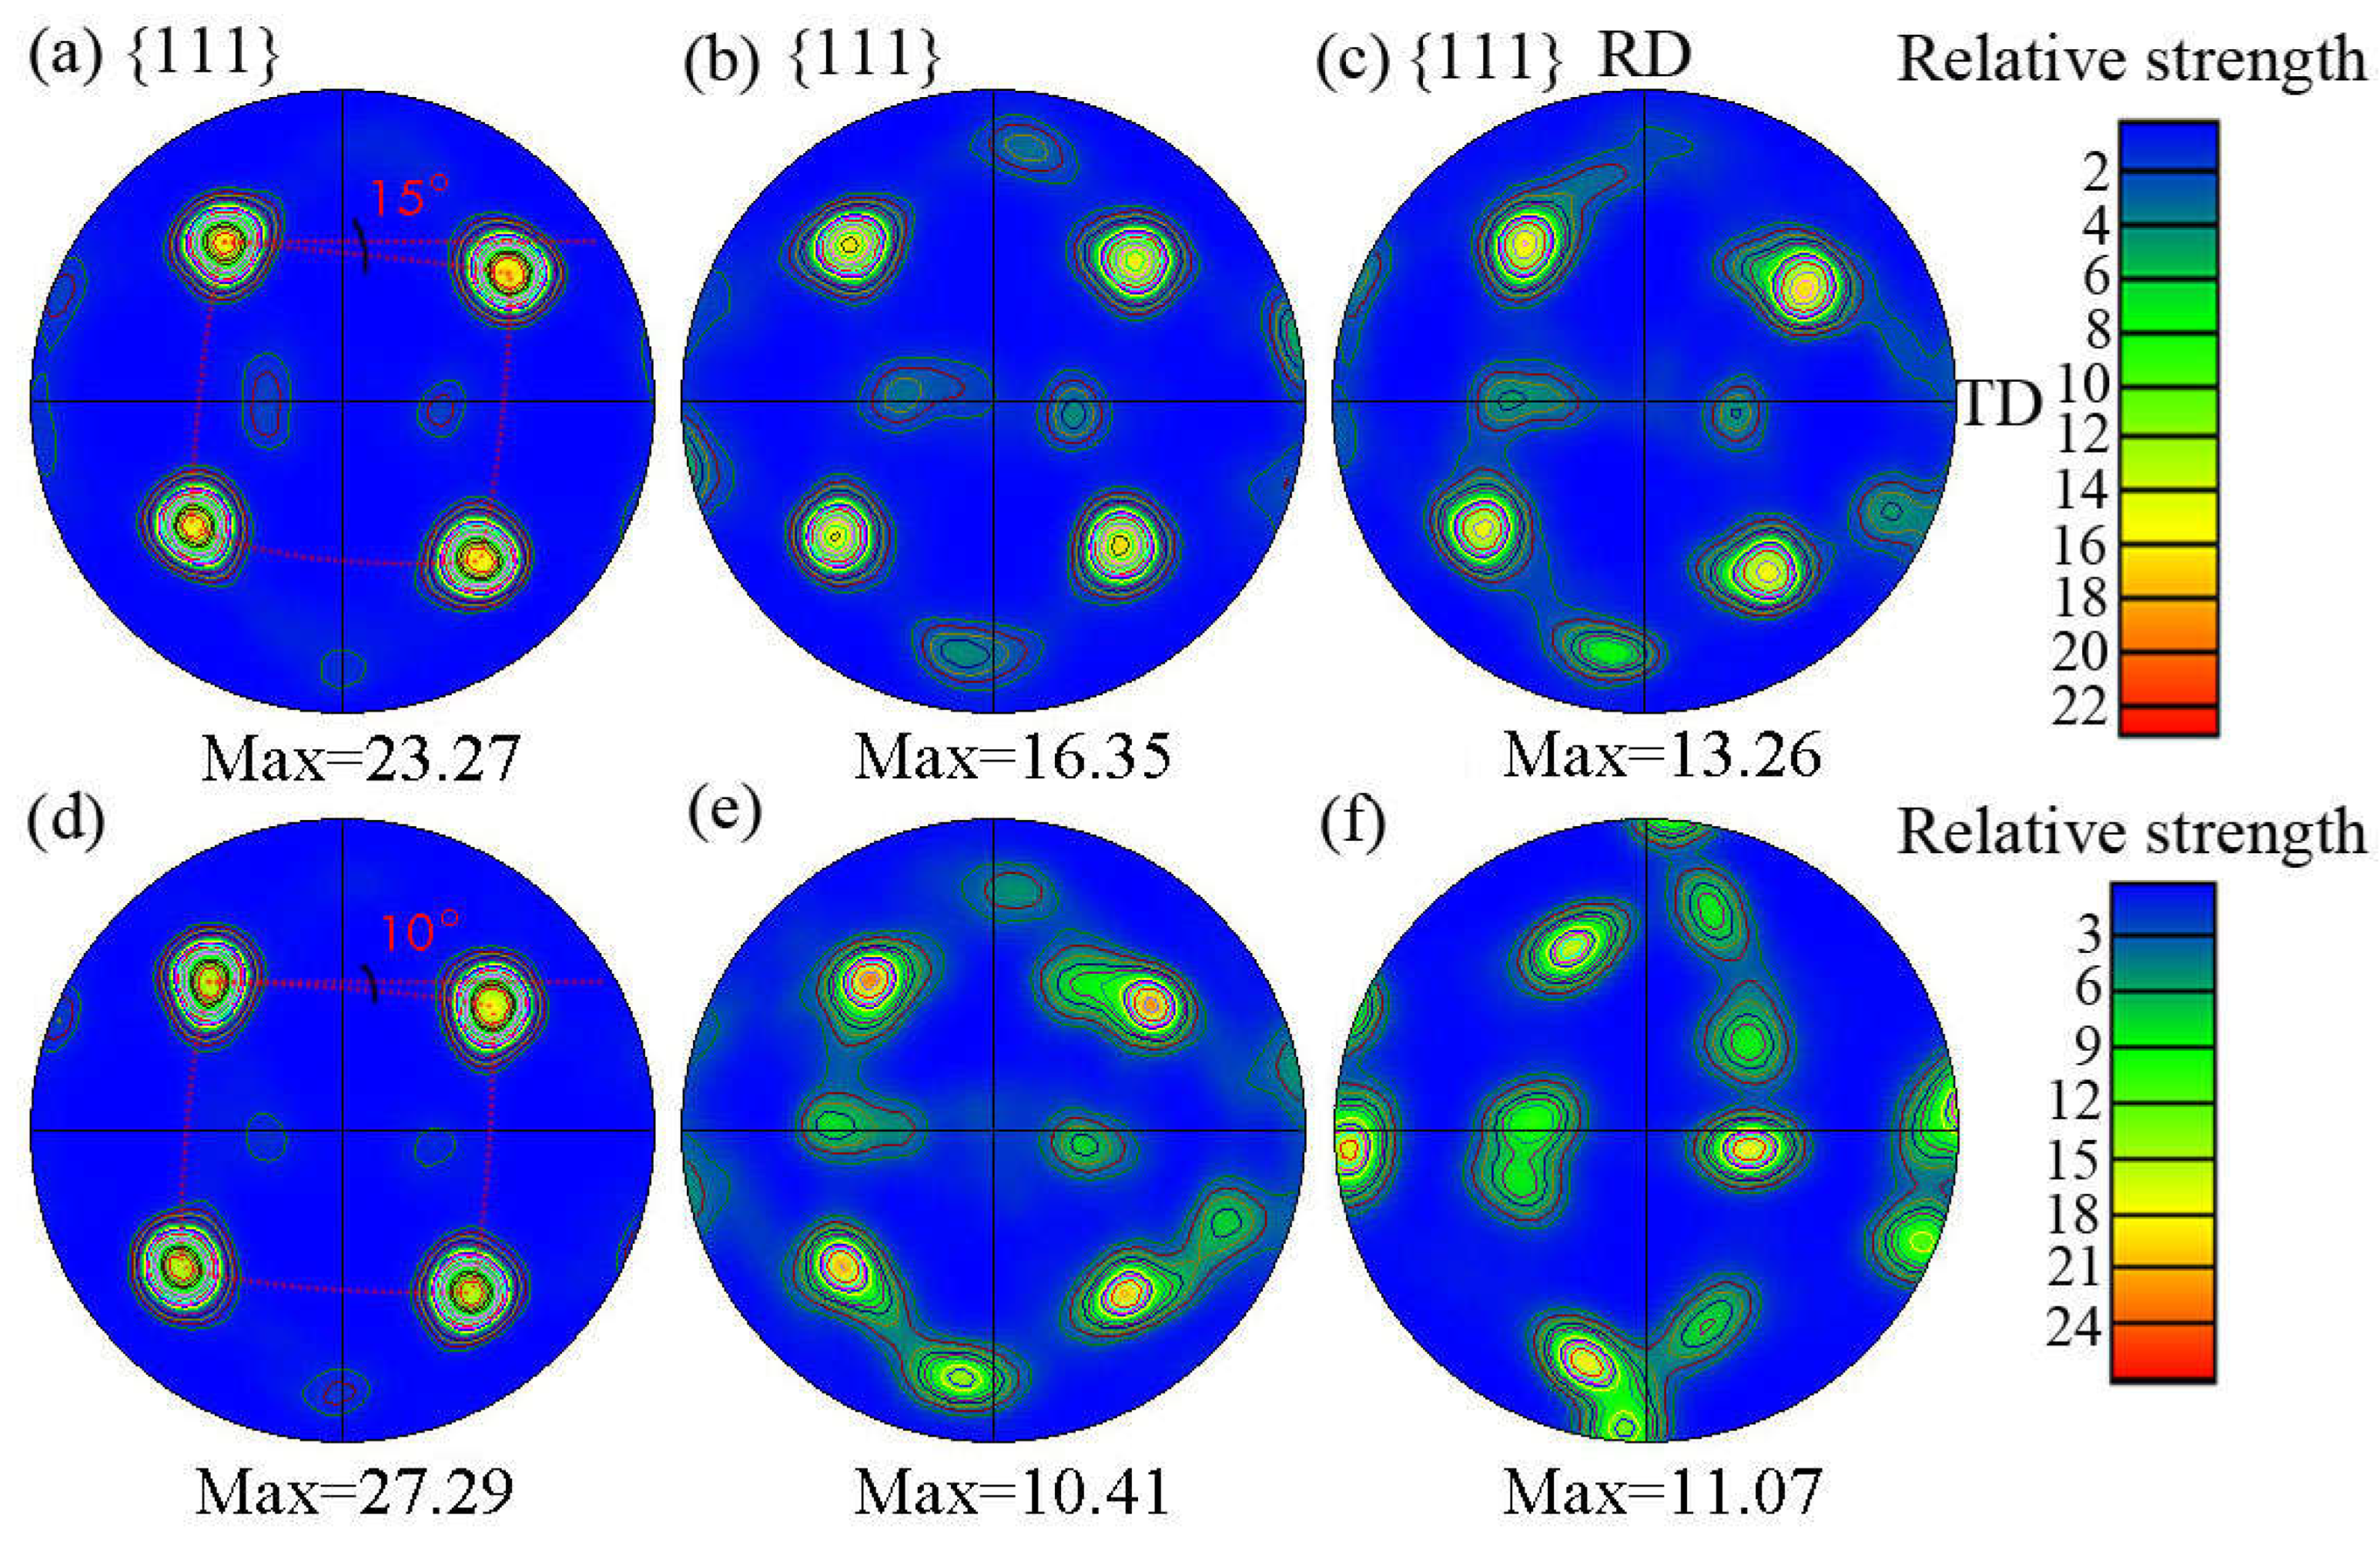
Figure 6 illustrates the impact of finished product annealing, with two intermediate annealing stages at varying heating rates, on the degree of micro-texture deflection. As depicted in
Figure 6(a) and (d), when the heating rate is 5°C/min, the cube texture exhibits a deflection of 15° following inter-annealing at 175°C, which is greater than the 5° deflection observed after inter-annealing at 195°C. This suggests that under significant deformation, the original recrystallization texture of the hot-rolled state is once again decomposed, resulting in the formation of rolling texture.
Subsequently, during the annealing process, this texture transforms into recrystallization texture [
17,
18,
19,
20,
21]. A novel type of recrystallization texture may exhibit a certain degree of deviation from the ideal position, which is influenced by the annealing temperature and the degree of deformation. The cube texture, which represents the ideal position, is depicted by the horizontal line in
Figure 6(a) and (d). As the heating rate during the annealing process increases, the intensity of the texture decreases and the deviation of the cube texture increases.
3. Analysis and discussion
The size of electric capacities is a crucial metric for evaluating the effectiveness of aluminum electrolytic capacitors. This metric is primarily influenced by the specific capacitance per unit area C of the anode foil. The expression for capacitance C, as outlined in reference [
22], is a key determinant of this value:
In this context, the specific capacitance
C is determined by the dielectric constant
ε, electrode surface area
S, and the thickness of the Al
2O
3 dielectric insulation layer, denoted as
t. Specifically,
C is directly proportional to
ε and
S, while inversely proportional to
t. Typically,
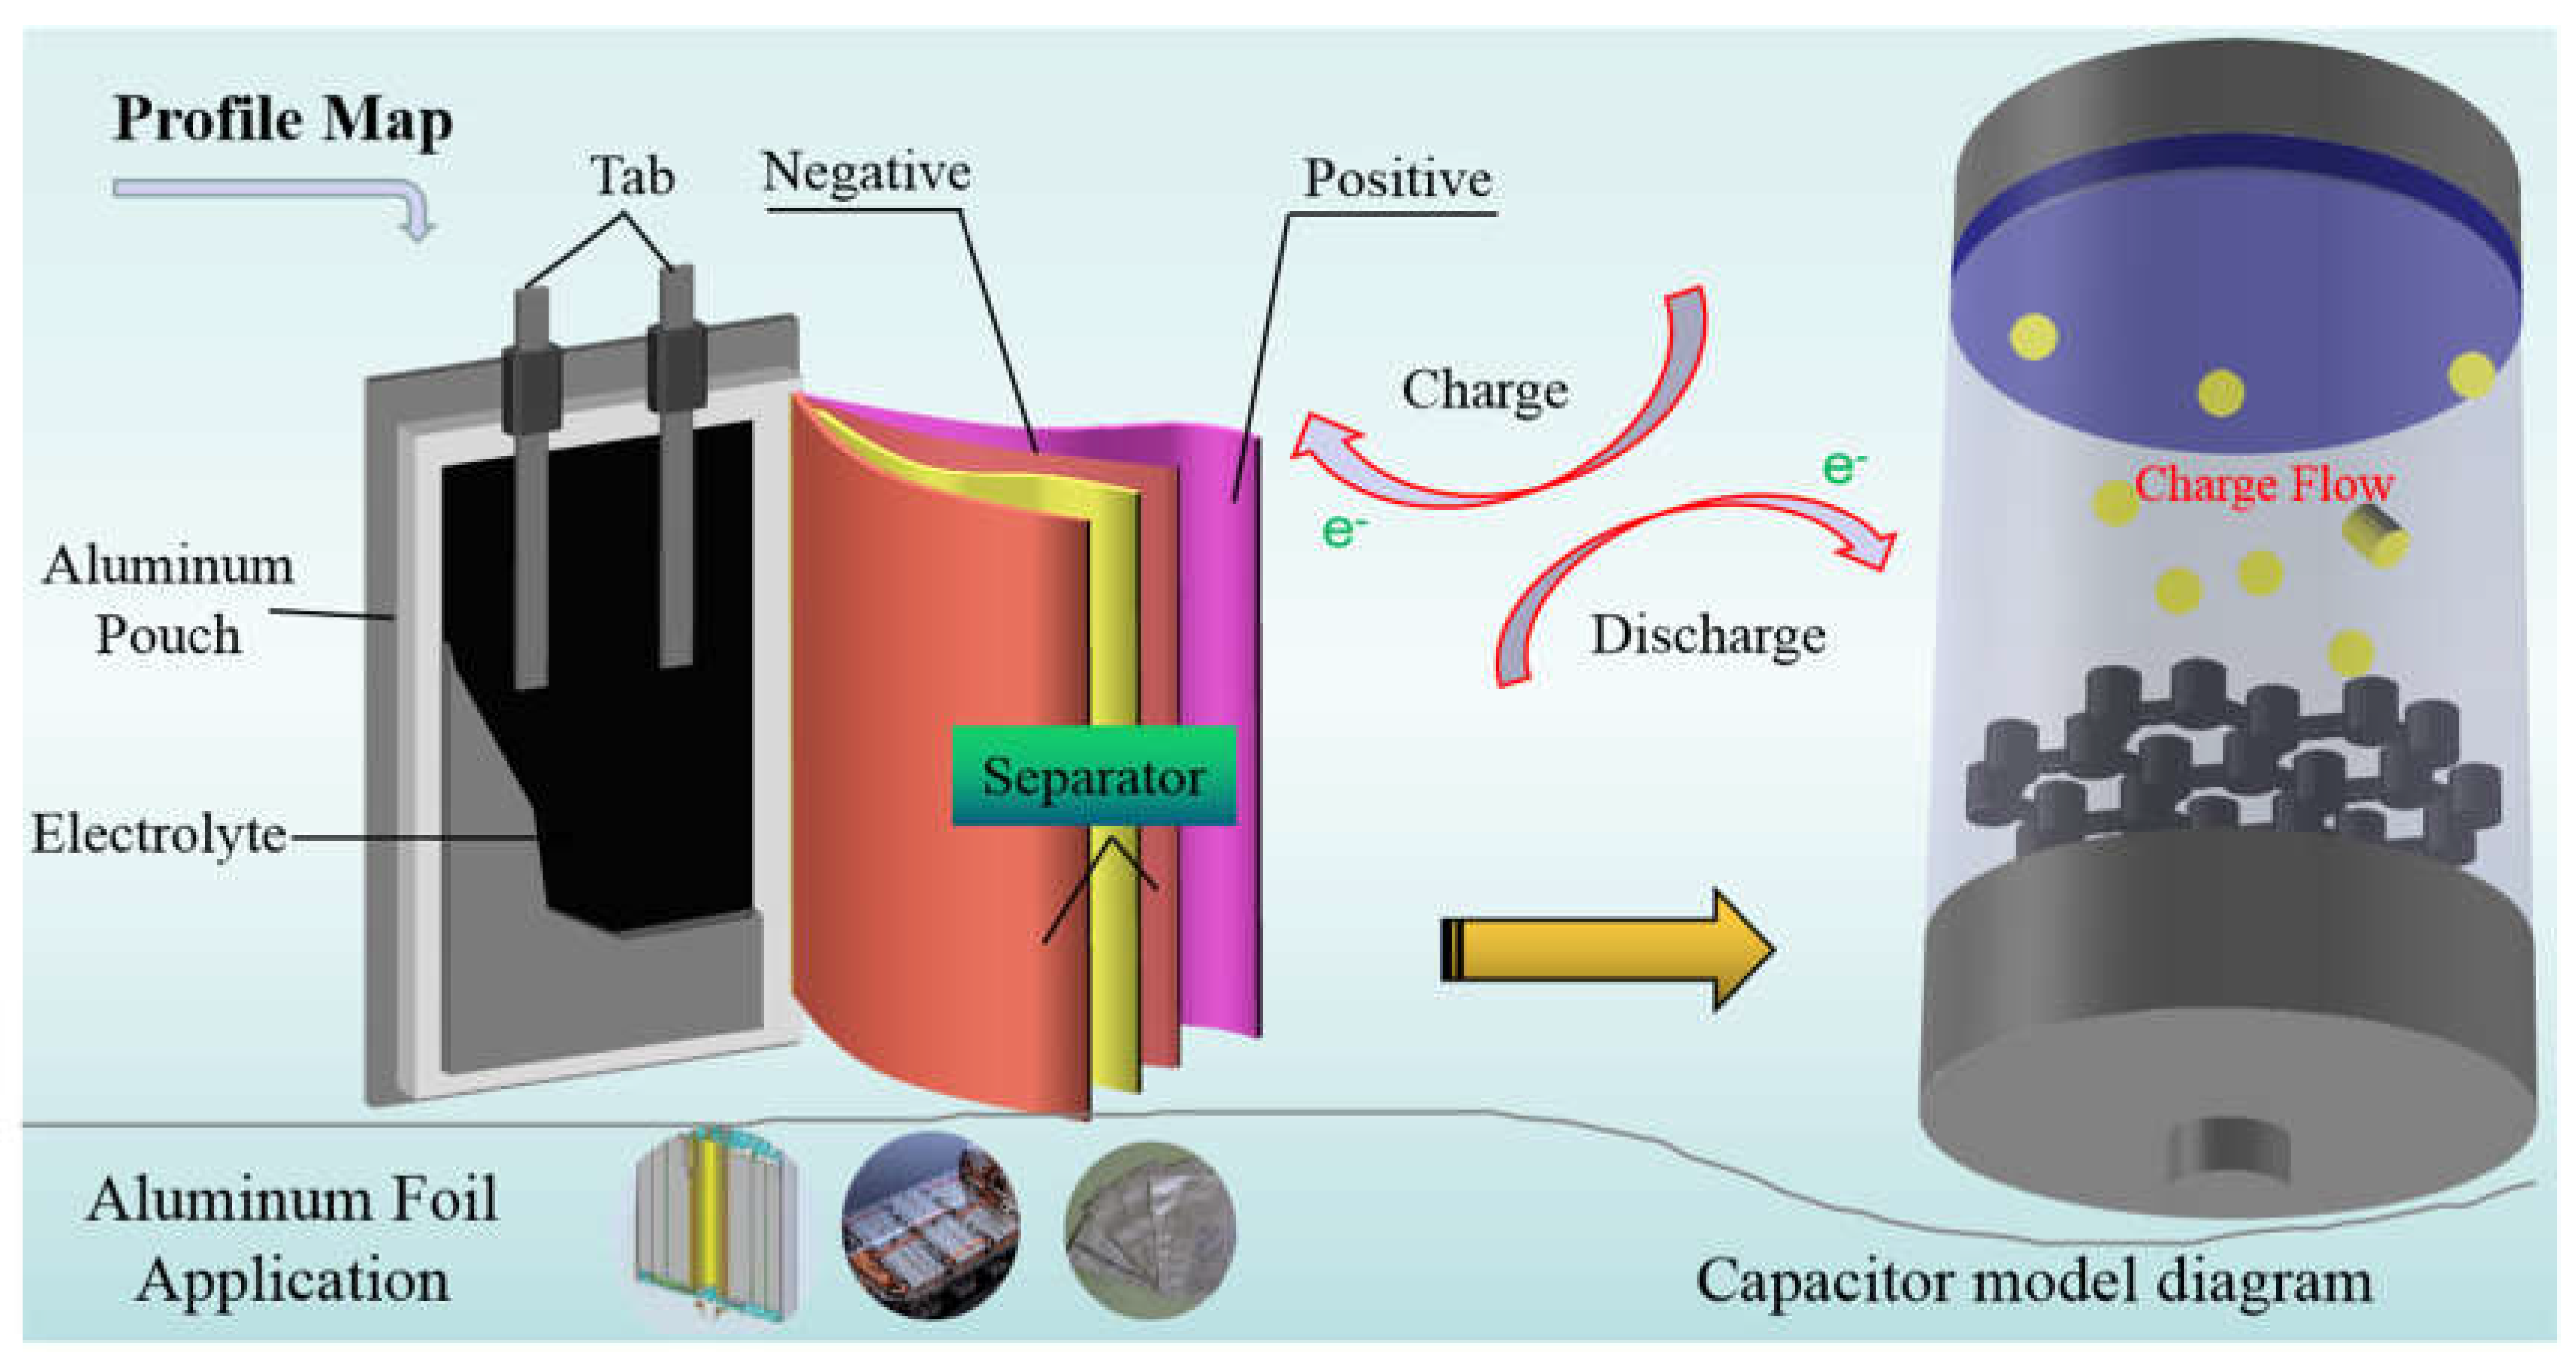
ε falls within the range of 7 to 10, while t ranges from 1.0 to 1.5 nm/V. Therefore, enhancing the specific capacitance of anodic aluminum foil hinges on increasing the effective surface area
S of the high voltage anode aluminum foil, which is crucial for achieving the miniaturization and high capacitance of aluminum electrolytic capacitors, as illustrated in
Figure 7.
In practical manufacturing, the surface area of aluminum foil is increased without increasing the volume of the capacitor by utilizing etching technology to create surface irregularities. This results in an improved effective surface area. During the corrosion process of the aluminum foil, the matrix dissolves in a uniform and structured manner along the crystallographic direction, particularly along the (100)<001> direction. This direction provides the best corrosion channel for the aluminum foil, resulting in a greater increase in effective surface area. Therefore, to increase the effective surface area
S of the high voltage anode aluminum foil, it is necessary to increase the cubic texture or (100) surface fraction [
22,
23].
The study conducted in this paper has revealed that a low heating rate can result in an increased effective surface area of aluminum foil by promoting a higher cubic texture content and uniform spatial distribution. It has also been determined that the grain size of the cube texture must be moderate and uniform in order to achieve the desired effect. According to the findings of Sun et al. [
2], the optimal grain size range for aluminum foil is between 60 and 200 micrometers, as determined through experimentation. If the grain size is too small, it can lead to inter-crystalline corrosion and surface peeling, resulting in a decrease in aluminum foil thickness and surface area, ultimately leading to a reduction in specific capacitance. Conversely, if the grain size is too large, it can result in a decrease in cubic texture degree and a reduction in specific capacitance.
4. Conclusion
(1) During the annealing process of aluminum foil, the recrystallization fraction and grain size decrease gradually as the inter-annealing temperature and finished product annealing heating rate increase. This phenomenon is attributed to the rise in heating rate, which occurs just below the critical heating rate. This increase in heating rate reduces the time required for grain boundary migration, thereby slowing down the recrystallization and recrystallization
(2) The heating rate during the annealing process for the final product was increased from 5°C/min to 30°C/min. This resulted in a reduction in the content of cube texture, while the content of Cu, S, and Brass texture increased. This can be attributed to the retention of a significant amount of deformation energy at a low intermediate annealing temperature, which provides a greater driving force for recrystallization. As a result, the formation of cube texture in the finished product annealing process was improved due to an increase in nucleation core. Additionally, the size of crystal grains gradually decreased. It is evident that the subsequent inter-annealing temperature played a crucial role in the formation of cube texture and the size of the grain.
(3) The degree of deflection in cube texture during low additional inter-annealing is greater than that observed during high additional inter-annealing. A deviation of 5° is observed when the heating rate is 5°C/min. It is evident that the degree of texture deviation is influenced by both the annealing temperature and cold deformation.
Author Contributions
Conceptualization, Y.W.; writing—original draft preparation, Y.W.; writing—review and editing, T.W and G.H.; supervision, G.H and L.C.; funding acquisition, Y.W.. All authors have read and agreed to the published version of the manuscript.
Funding
This research was funded by Postdoctoral Science Foundation of Chongqing, and the Science and Technology Research Program of Chongqing Municipal Education Commission (KJQN202001301), and the Industry-University-Research Cooperation Program (WLHX-2020-0048, WLHX-2022-0162).
Institutional Review Board Statement
Not applicable.
Informed Consent Statement
Not applicable.
Data Availability Statement
Not applicable.
Conflicts of Interest
The authors declare no conflict of interest.
References
- Sonego, E.; Filippo, P. D.; Riccardi, C.; Pomata, D.; Bannò, A.; Simonetti, G.; Buiarelli, F. Occurrence and migration study of chemicals from baking paper and aluminium foil. Food Chem. 2023, 409, 135260. [Google Scholar] [CrossRef]
- Du, L.; Nie, L.P.; Zhang, L.Y.; Lu, H.L.; Yang, L.; Xu, H.Z.; Hou, J. Enhancing the printing accuracy of melt electrowritten fibers deposited on aluminum foils. Mater. Lett. 2022, 321, 132397. [Google Scholar] [CrossRef]
- Olaf, E.; Moo, Y.H. Evolution of the cube texture in high purity aluminum capacitor foils by continuous recrystallization and subsequent grain growth. Mater. Sci. Eng. A. 1999, 271, 371–381. [Google Scholar]
- Song, J.B.; Mao, W.M.; Yang, H.; Feng, H.P. Effect of trace Sn on corrosion behaviors of high voltage anode aluminum foil. Trans. Nonferrous Met. Soc. China. 2008, 18, 879–883. [Google Scholar] [CrossRef]
- Xue,W. ; Kleeman, M.J. Comparison of size-resolved PM elements measured using aluminum foil and Teflon impaction substrates: Implications for ultrafine particle source apportionment and future sampling networks in California. Sci. Total Environ. 2022, 838, 156523. [Google Scholar] [CrossRef] [PubMed]
- Liang, L.B.; Pan, S.N.; Peng, N. Distribution improvement of etch tunnels on aluminum foil coated by Al2O3 film doped with ZnO microspheres. Surf. Coat. Technol. 2021, 421, 127439. [Google Scholar] [CrossRef]
- Redkin, A.N.; Mitina, A.A.; Yakimov, E.E. Simple technique of multiwalled carbon nanotubes growth on aluminum foil for supercapacitors. Mater. Sci. Eng:. B. 2021, 272, 115342. [Google Scholar] [CrossRef]
- Zhang, B.C.; Yang, H.F.; Liu, H.; Hao, J.B.; Liu, X.H. Crystallographic features and microstructure evolution of sandwich warm laser polishing: The case of aluminum foil. Appl. Surf. Sci. 2021, 573, 151557. [Google Scholar] [CrossRef]
- Wu, J.H.; Wu, H.S.; Wu, L.; Yao, W.H. ; Chen,Y.N.; Sun, LD.; Ma, Y.L.; Jiang, B.; Wang, J.F.; Atrens, A.; Pan, F.S. Preparation technology and properties of a thin anodic oxide composite film on the surface of an aluminum alloy foil. Surf. Coat. Technol 2022, 447, 128825. [Google Scholar] [CrossRef]
- Sultangaziyev, A.; Akhmetova, A.; Kunushpayeva, Z.; Rapikov, A.; Filchakova, O.; Bukasov, R. Aluminum foil as a substrate for metal enhanced fluorescence of bacteria labelled with quantum dots, shows very large enhancement and high contrast. Sensing and Bio-Sensing Res. 2020, 28, 100332. [Google Scholar] [CrossRef]
- Feng, Z.S.; Chen, J.J.; Zhang, R.; Zhao, N. Formation of Al2O3–Nb2O5 composite oxide films on low-voltage etched aluminum foil by complexation–precipitation and anodizing. Ceram. Int. 2012, 38, 3057–3061. [Google Scholar] [CrossRef]
- Peng, N.; Wen, Y.Q.; He, Y.D. Improved distribution of etched tunnels on aluminum foil with silane treatment. Prog. Org. Coat. 2019, 127, 151–156. [Google Scholar] [CrossRef]
- Attallah, M.M.; Strangwood, M.; Davis, C.L. Influence of the heating rate on the initiation of primary recrystallization in a deformed Al-Mg alloy. Scripta Mater. 2010, 63, 371–374. [Google Scholar] [CrossRef]
- Wang, Y.L.; Ren, L.P.; Dong, J.R.; Cao, C.C.; Liu, X.; Jiang, P. Grain Size Prediction and Growth Thermo-Kinetics Analysis During Annealing with Different Heating Rates for High Voltage Anode Aluminum Foil. Rare Metal Mater. Eng. 2022, 51, 2020–2026. [Google Scholar]
- Wang, Y.L.; Ren, L.P.; Yang, F.Z.; Liu, Q.; Cao, Y.; Luo, H.W. Research Progress on Fabrication Technology and Properties of SiC Particle-Reinforced Aluminum Matrix Composites. Rare Metal Mater. Eng. 2022, 51, 1270–1282. [Google Scholar]
- Wang, Y.; Ren, L.; Dong, J.; Cao, C. Influence of Cold Rolled Deformation Degree and Heating Rates on Crystallite Dimension and Recrystallization Fraction of Aluminum Plates. Crystals 2021, 11, 1428. [Google Scholar] [CrossRef]
- Wang, Y. Yang, F.; Ren, L.; Liu, Q.; Cao, Y.; Huang, G. Microstructure and Texture of an Aluminum Plate Produced by Multipass Cold Rolling and Graded Annealing Process. Metals. 2022, 12, 260. [Google Scholar] [CrossRef]
- Wang, Y.; Ren,L. ; Liu, Q.; Cao, Y.; Huang, G. Effect of residual deformation energy and critical heating rate on cubic texture and grain growth behavior of severely deformed aluminum foil. Materials. 2022, 15, 1395. [Google Scholar] [CrossRef]
- Chen, Y.B.; Li, Y.L.; He, L.Z.; Lu, C.; Ding, H.; Li, Q.Y. The influence of cryoECAP on microstructure and property of commercial pure aluminum. Mater. Lett. 2008, 62, 2821–2824. [Google Scholar] [CrossRef]
- Primig, S.; Leitner, H.; Knabl, W.; Lorich, A.; Clemens, H.; Stickler, R. Influence of the heating rate on the recrystallization behavior of molybdenum. Mater. Sci. Eng. A. 2012, 535, 316–324. [Google Scholar] [CrossRef]
- Zhai, X.S.; Wang, L.; Liu, Y.; He, J.; Zuo, L. Effects of Content and Distribution of Trace Element on Texture and Property of High-Voltage Electronic Aluminum Foil. Rare Metal Mater. Eng. 2013, 42, 1552–1557. [Google Scholar]
- Ferry, M.; Jones, D. High-rate annealing of single-phase and particle-containing aluminium alloy. Scripta Mater. 1998, 38, 177–183. [Google Scholar] [CrossRef]
- Xun, Y.; Tan, M.J. EBSD characterization of 8090 Al–Li alloy during dynamic and static recrystallization. Mater. Charact 2004, 52, 187–193. [Google Scholar] [CrossRef]
|
Disclaimer/Publisher’s Note: The statements, opinions and data contained in all publications are solely those of the individual author(s) and contributor(s) and not of MDPI and/or the editor(s). MDPI and/or the editor(s) disclaim responsibility for any injury to people or property resulting from any ideas, methods, instructions or products referred to in the content. |
© 2023 by the authors. Licensee MDPI, Basel, Switzerland. This article is an open access article distributed under the terms and conditions of the Creative Commons Attribution (CC BY) license (http://creativecommons.org/licenses/by/4.0/).
