Submitted:
23 April 2023
Posted:
23 April 2023
You are already at the latest version
Abstract
Keywords:
1. Introduction
2. Materials and Methods
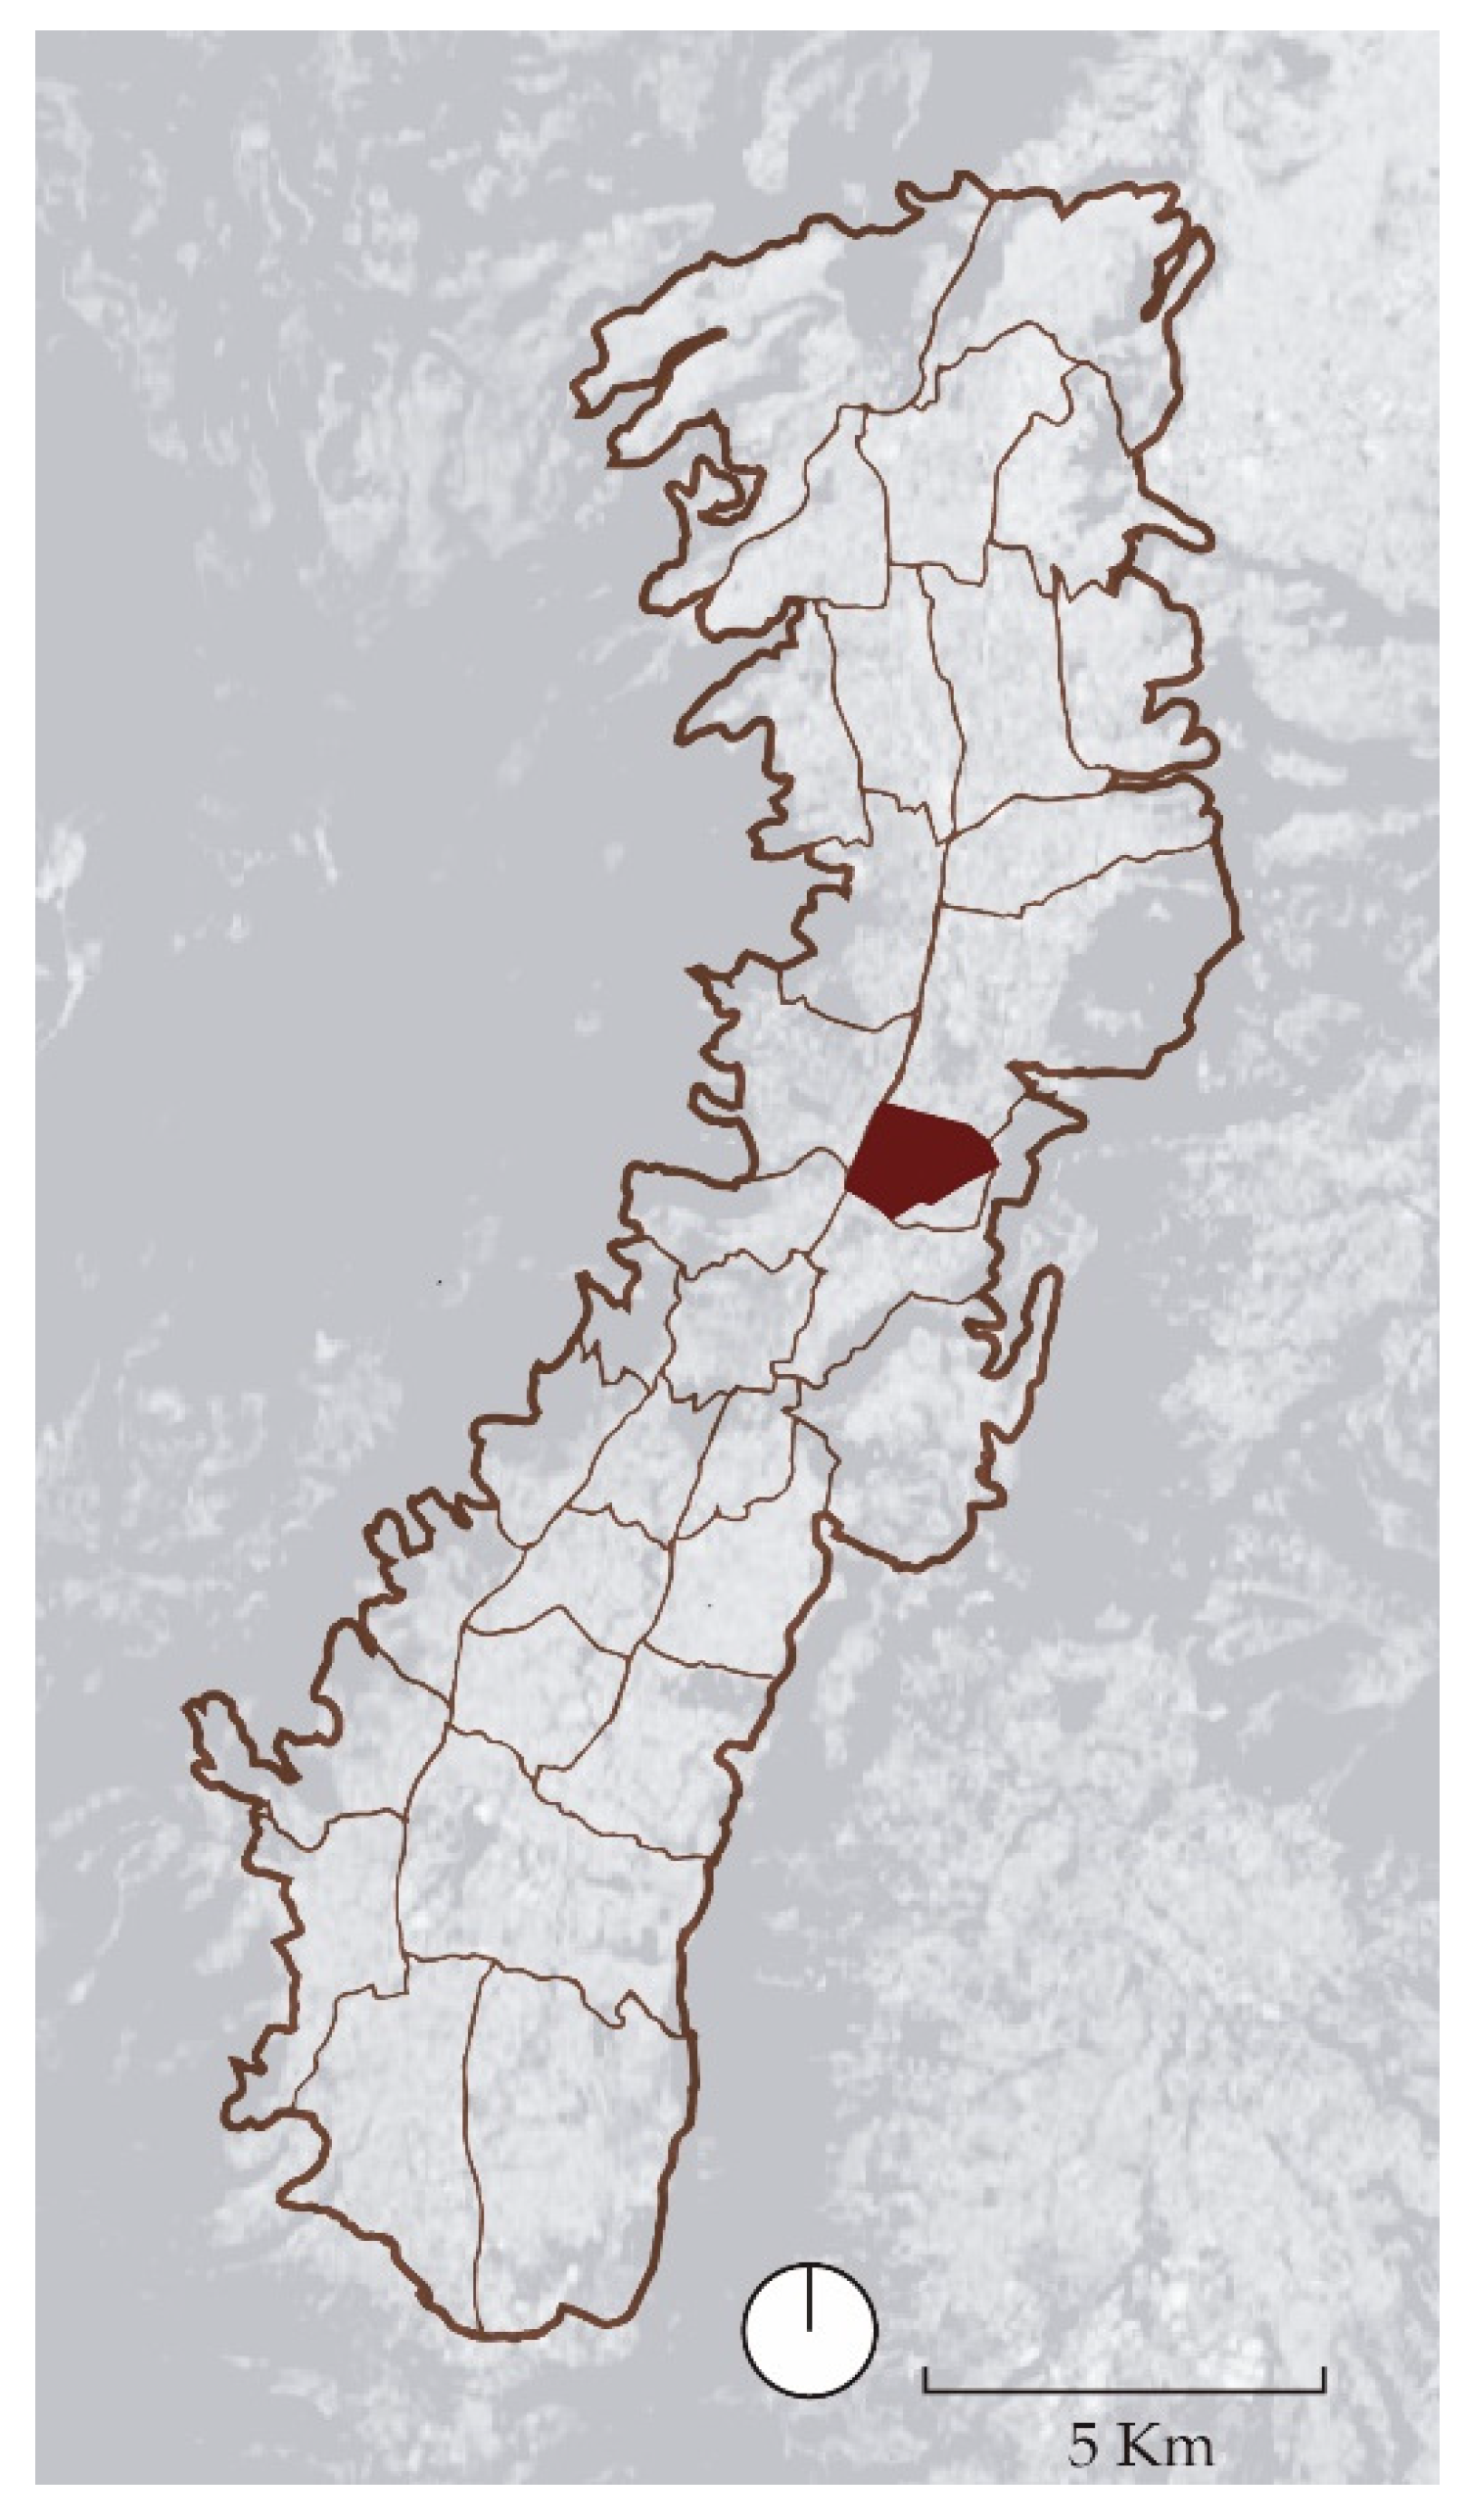
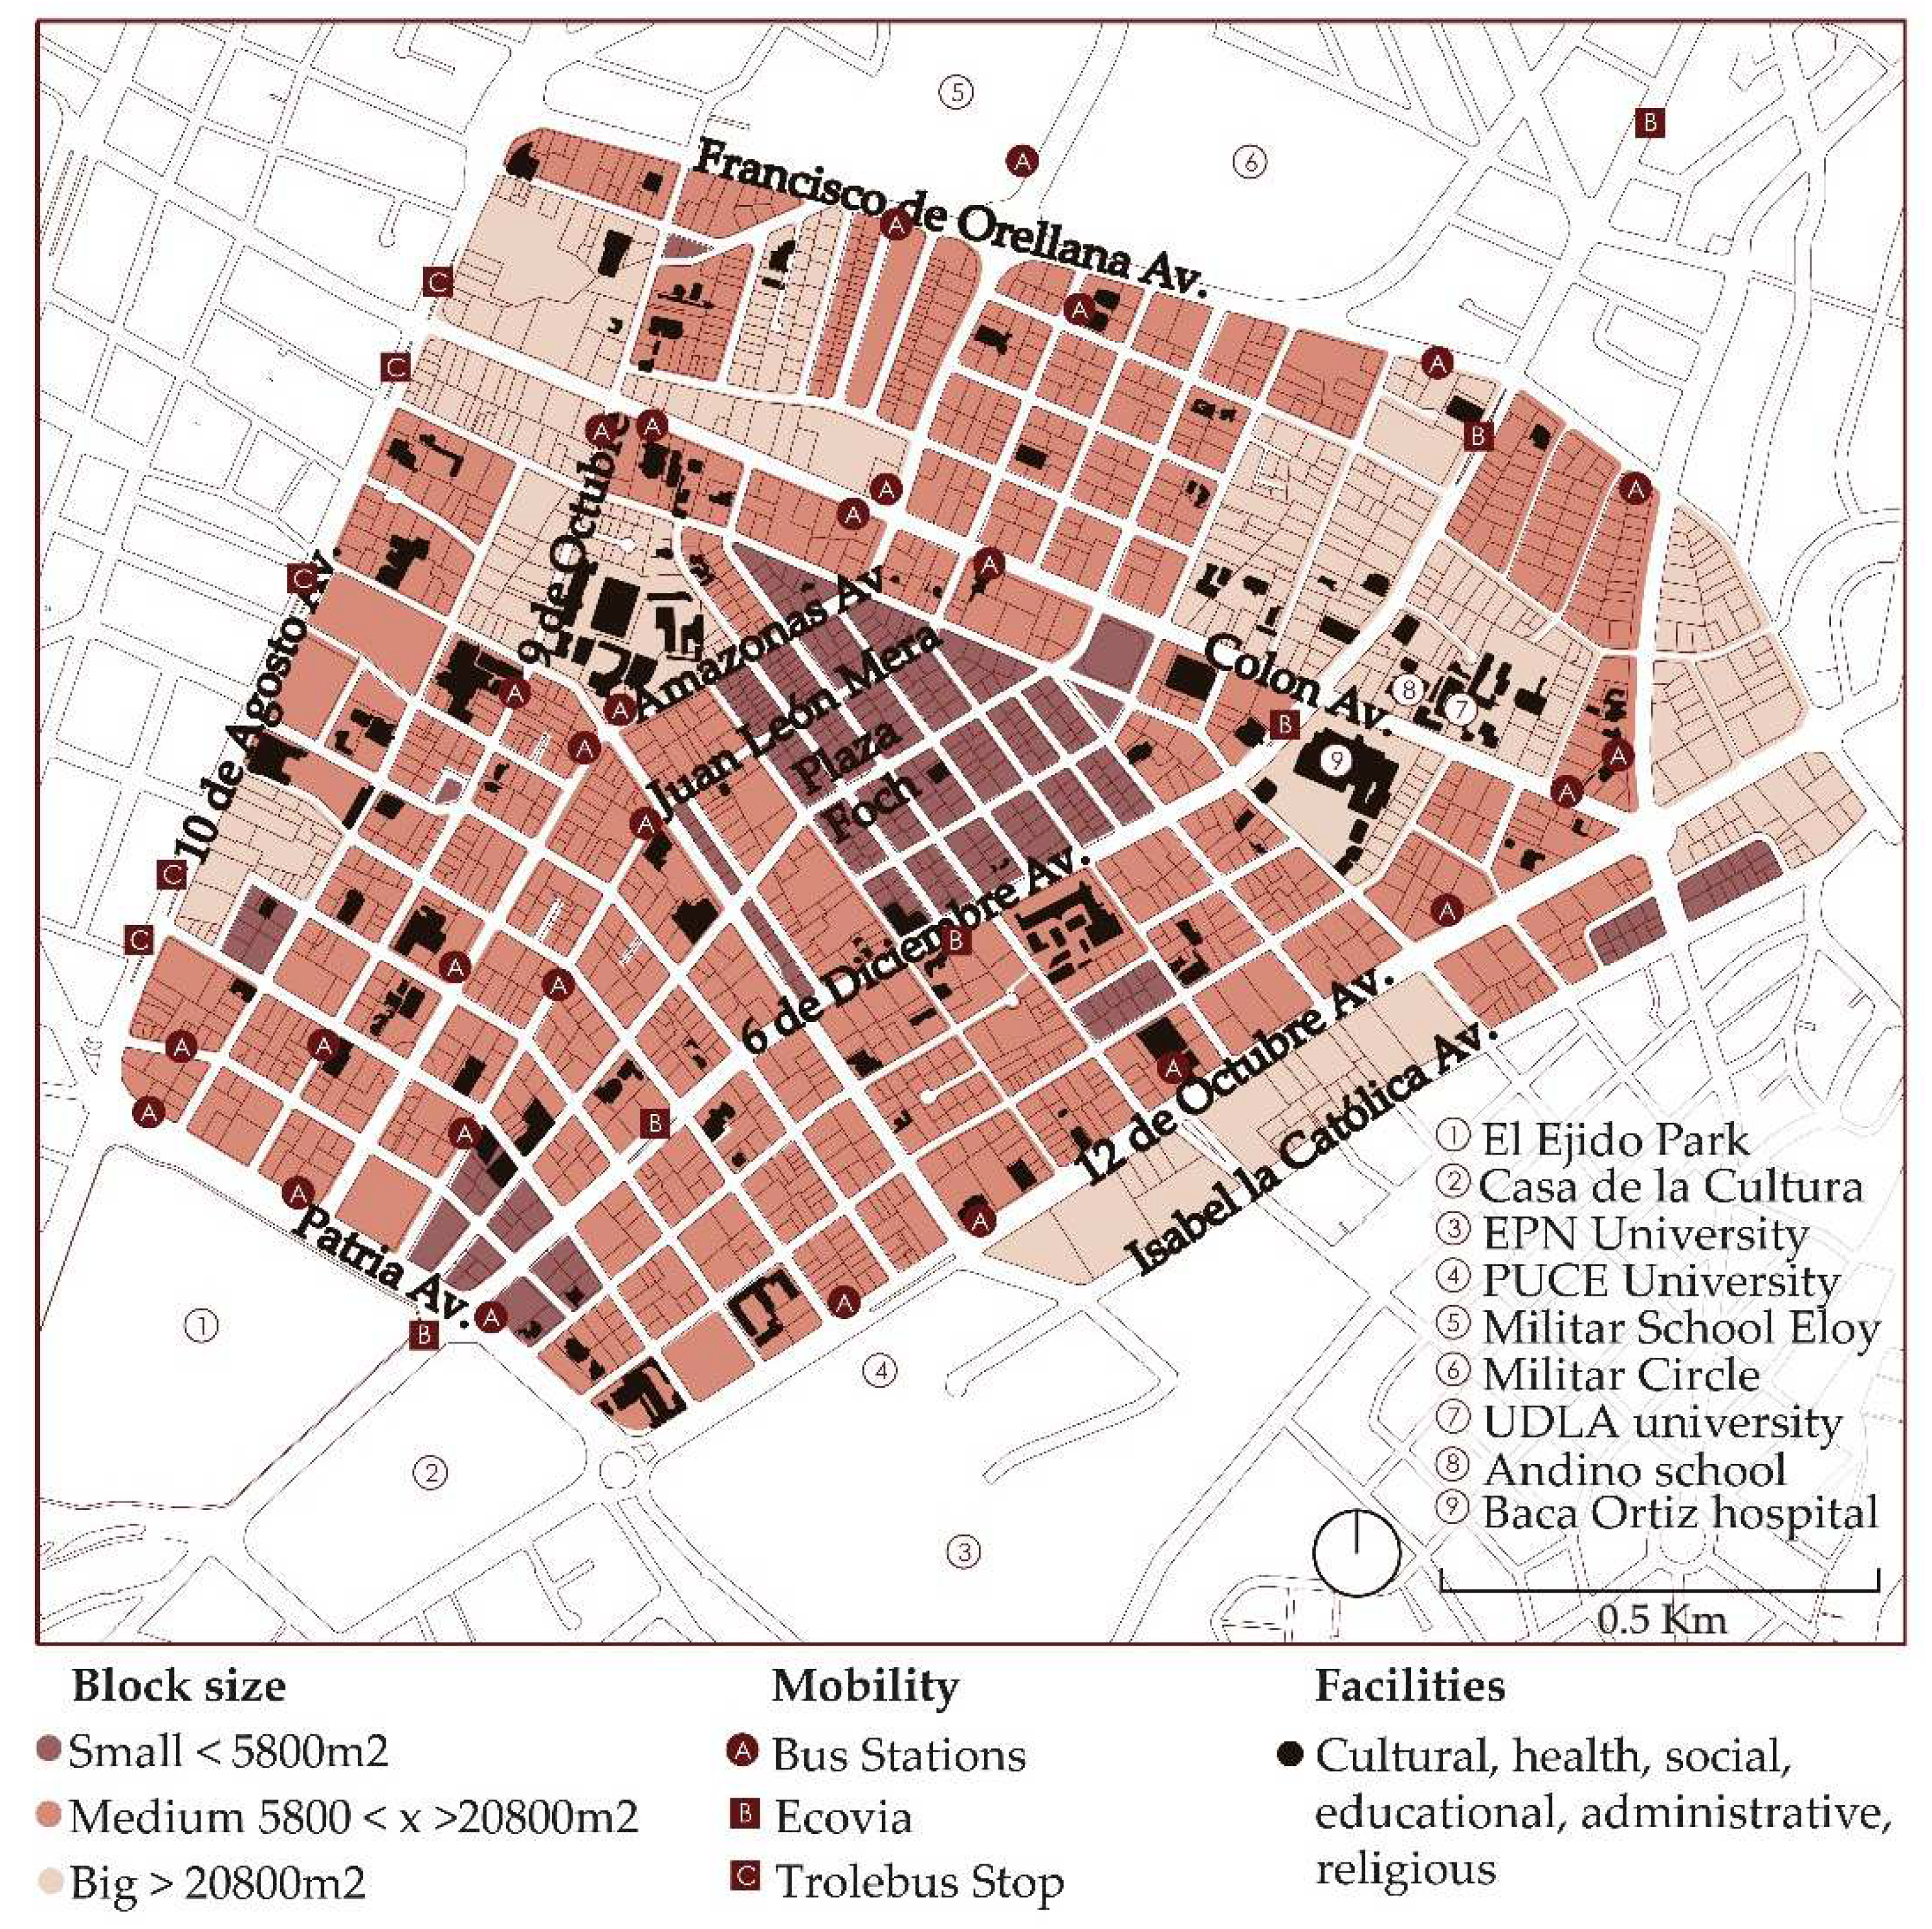
2.1. Study area
2.2. Dimensions derived from Jane Jacobs
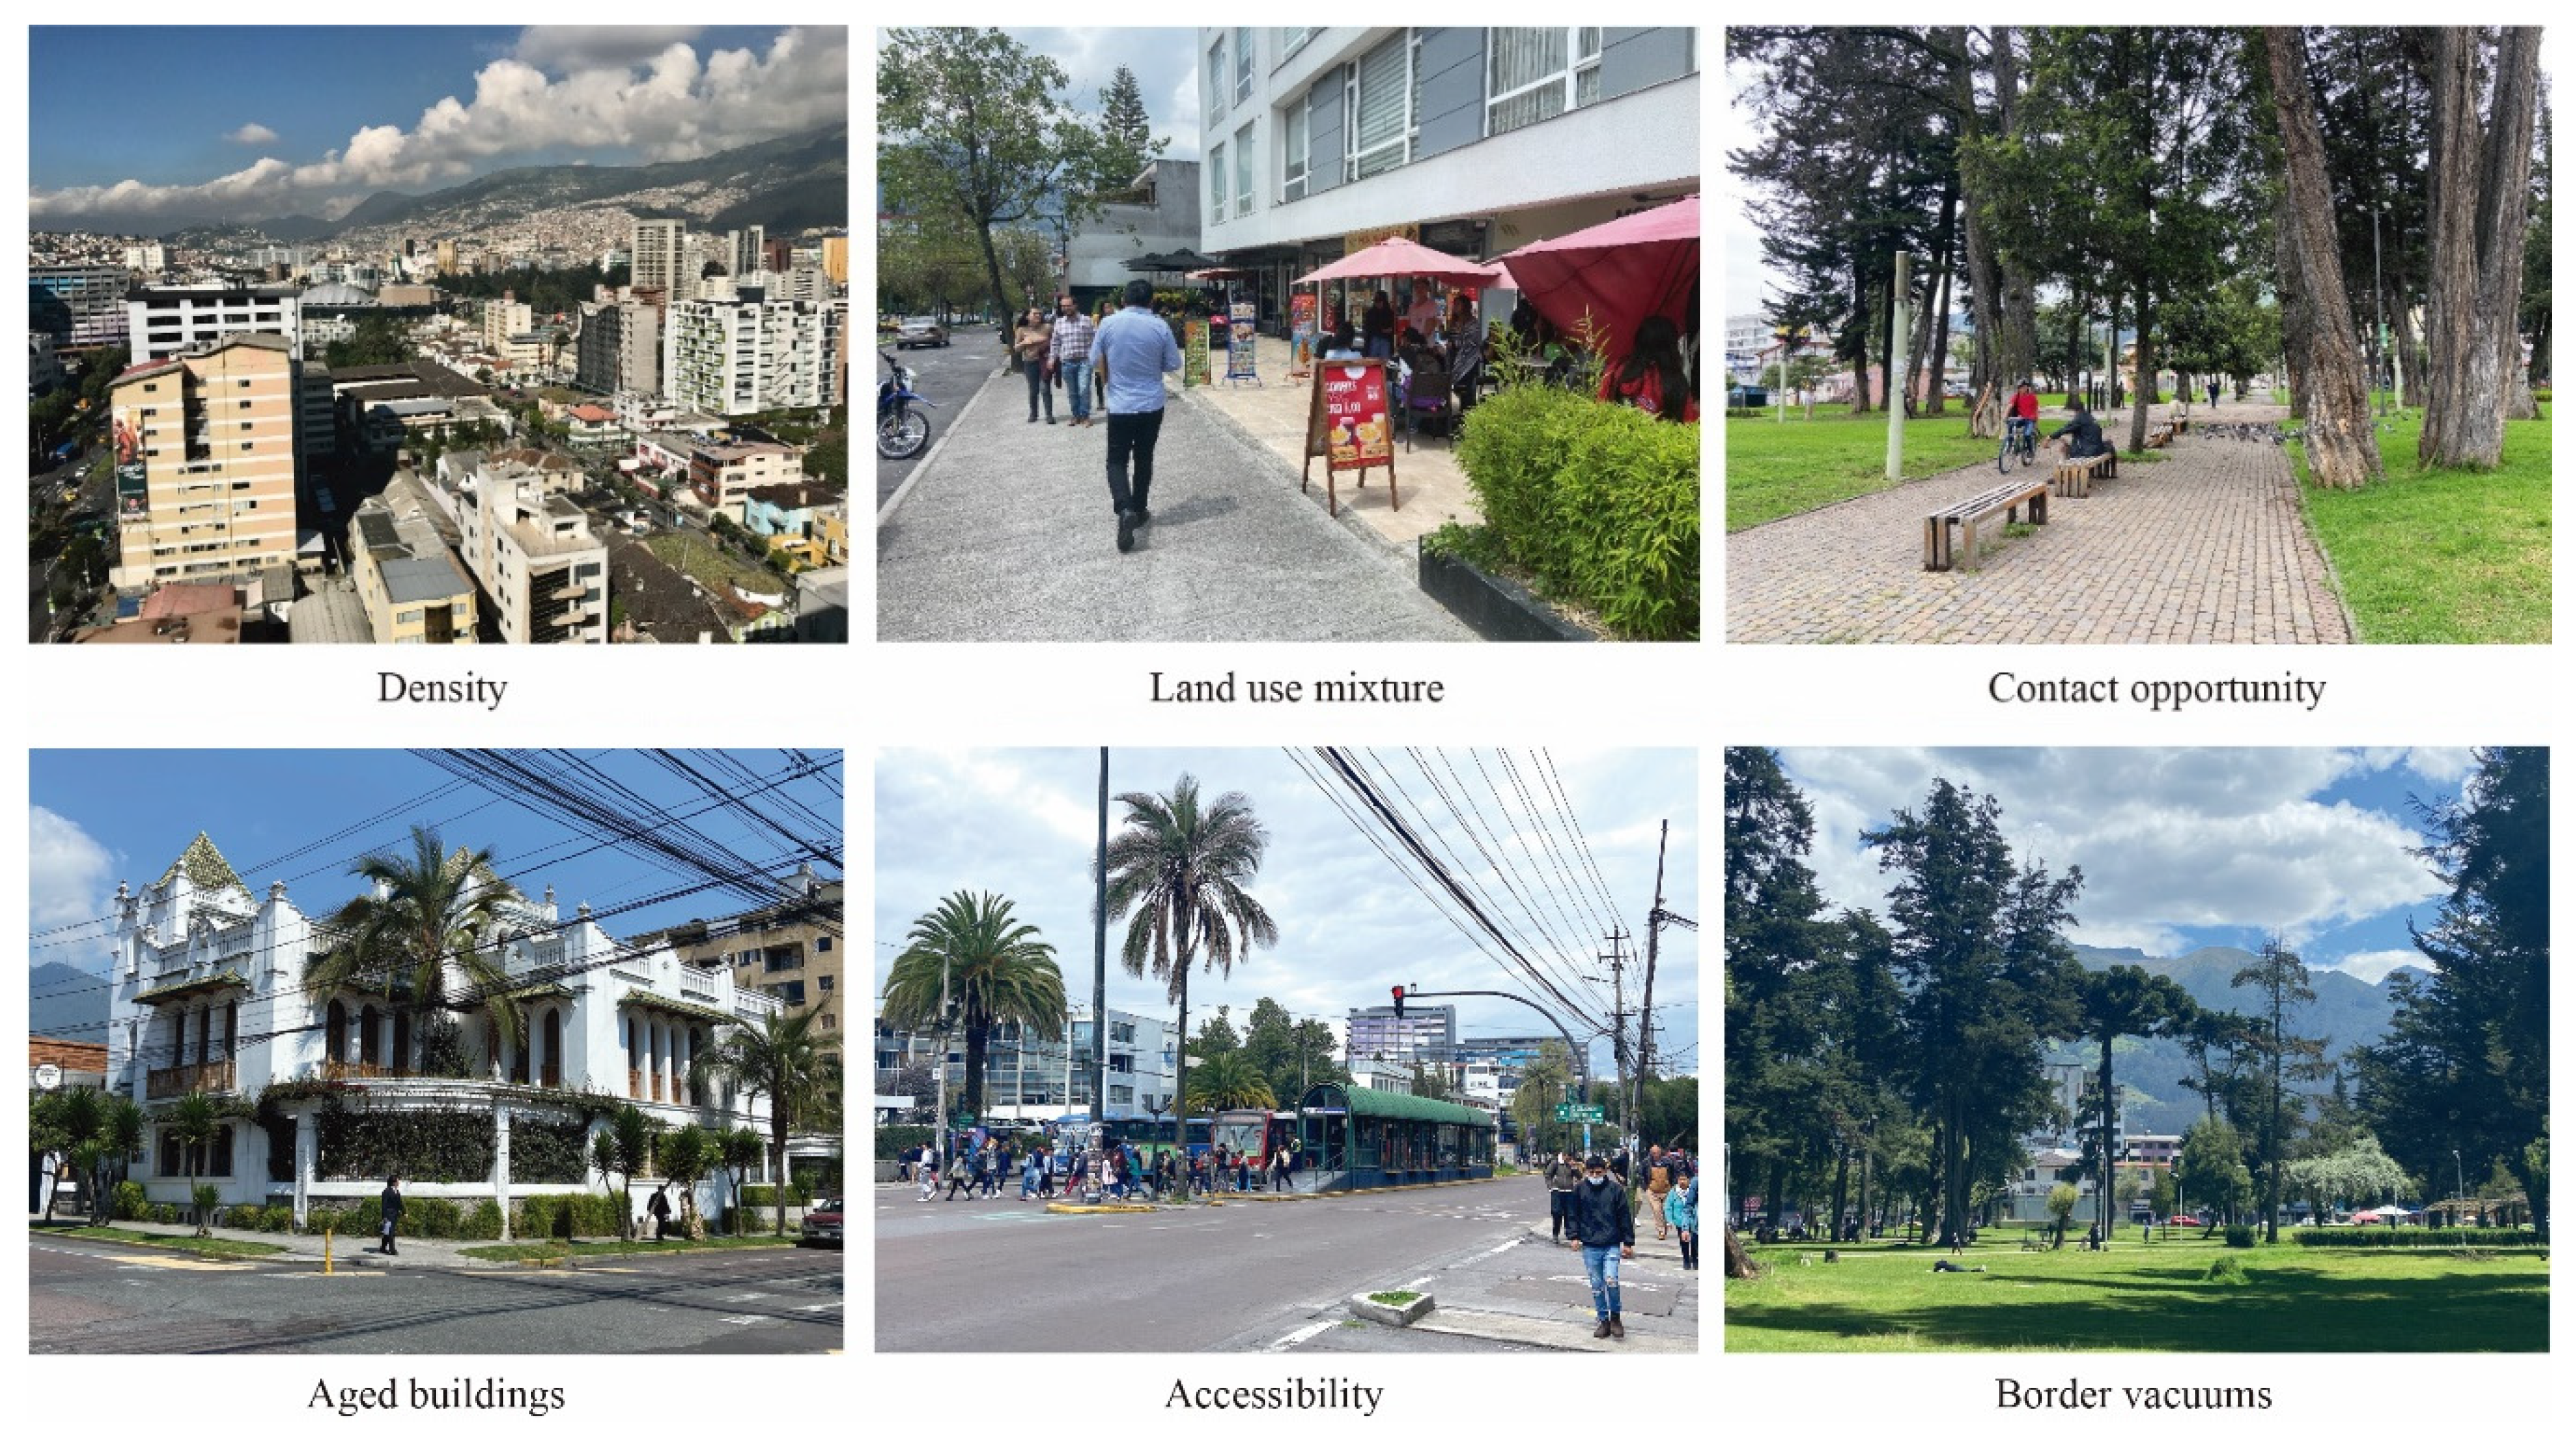
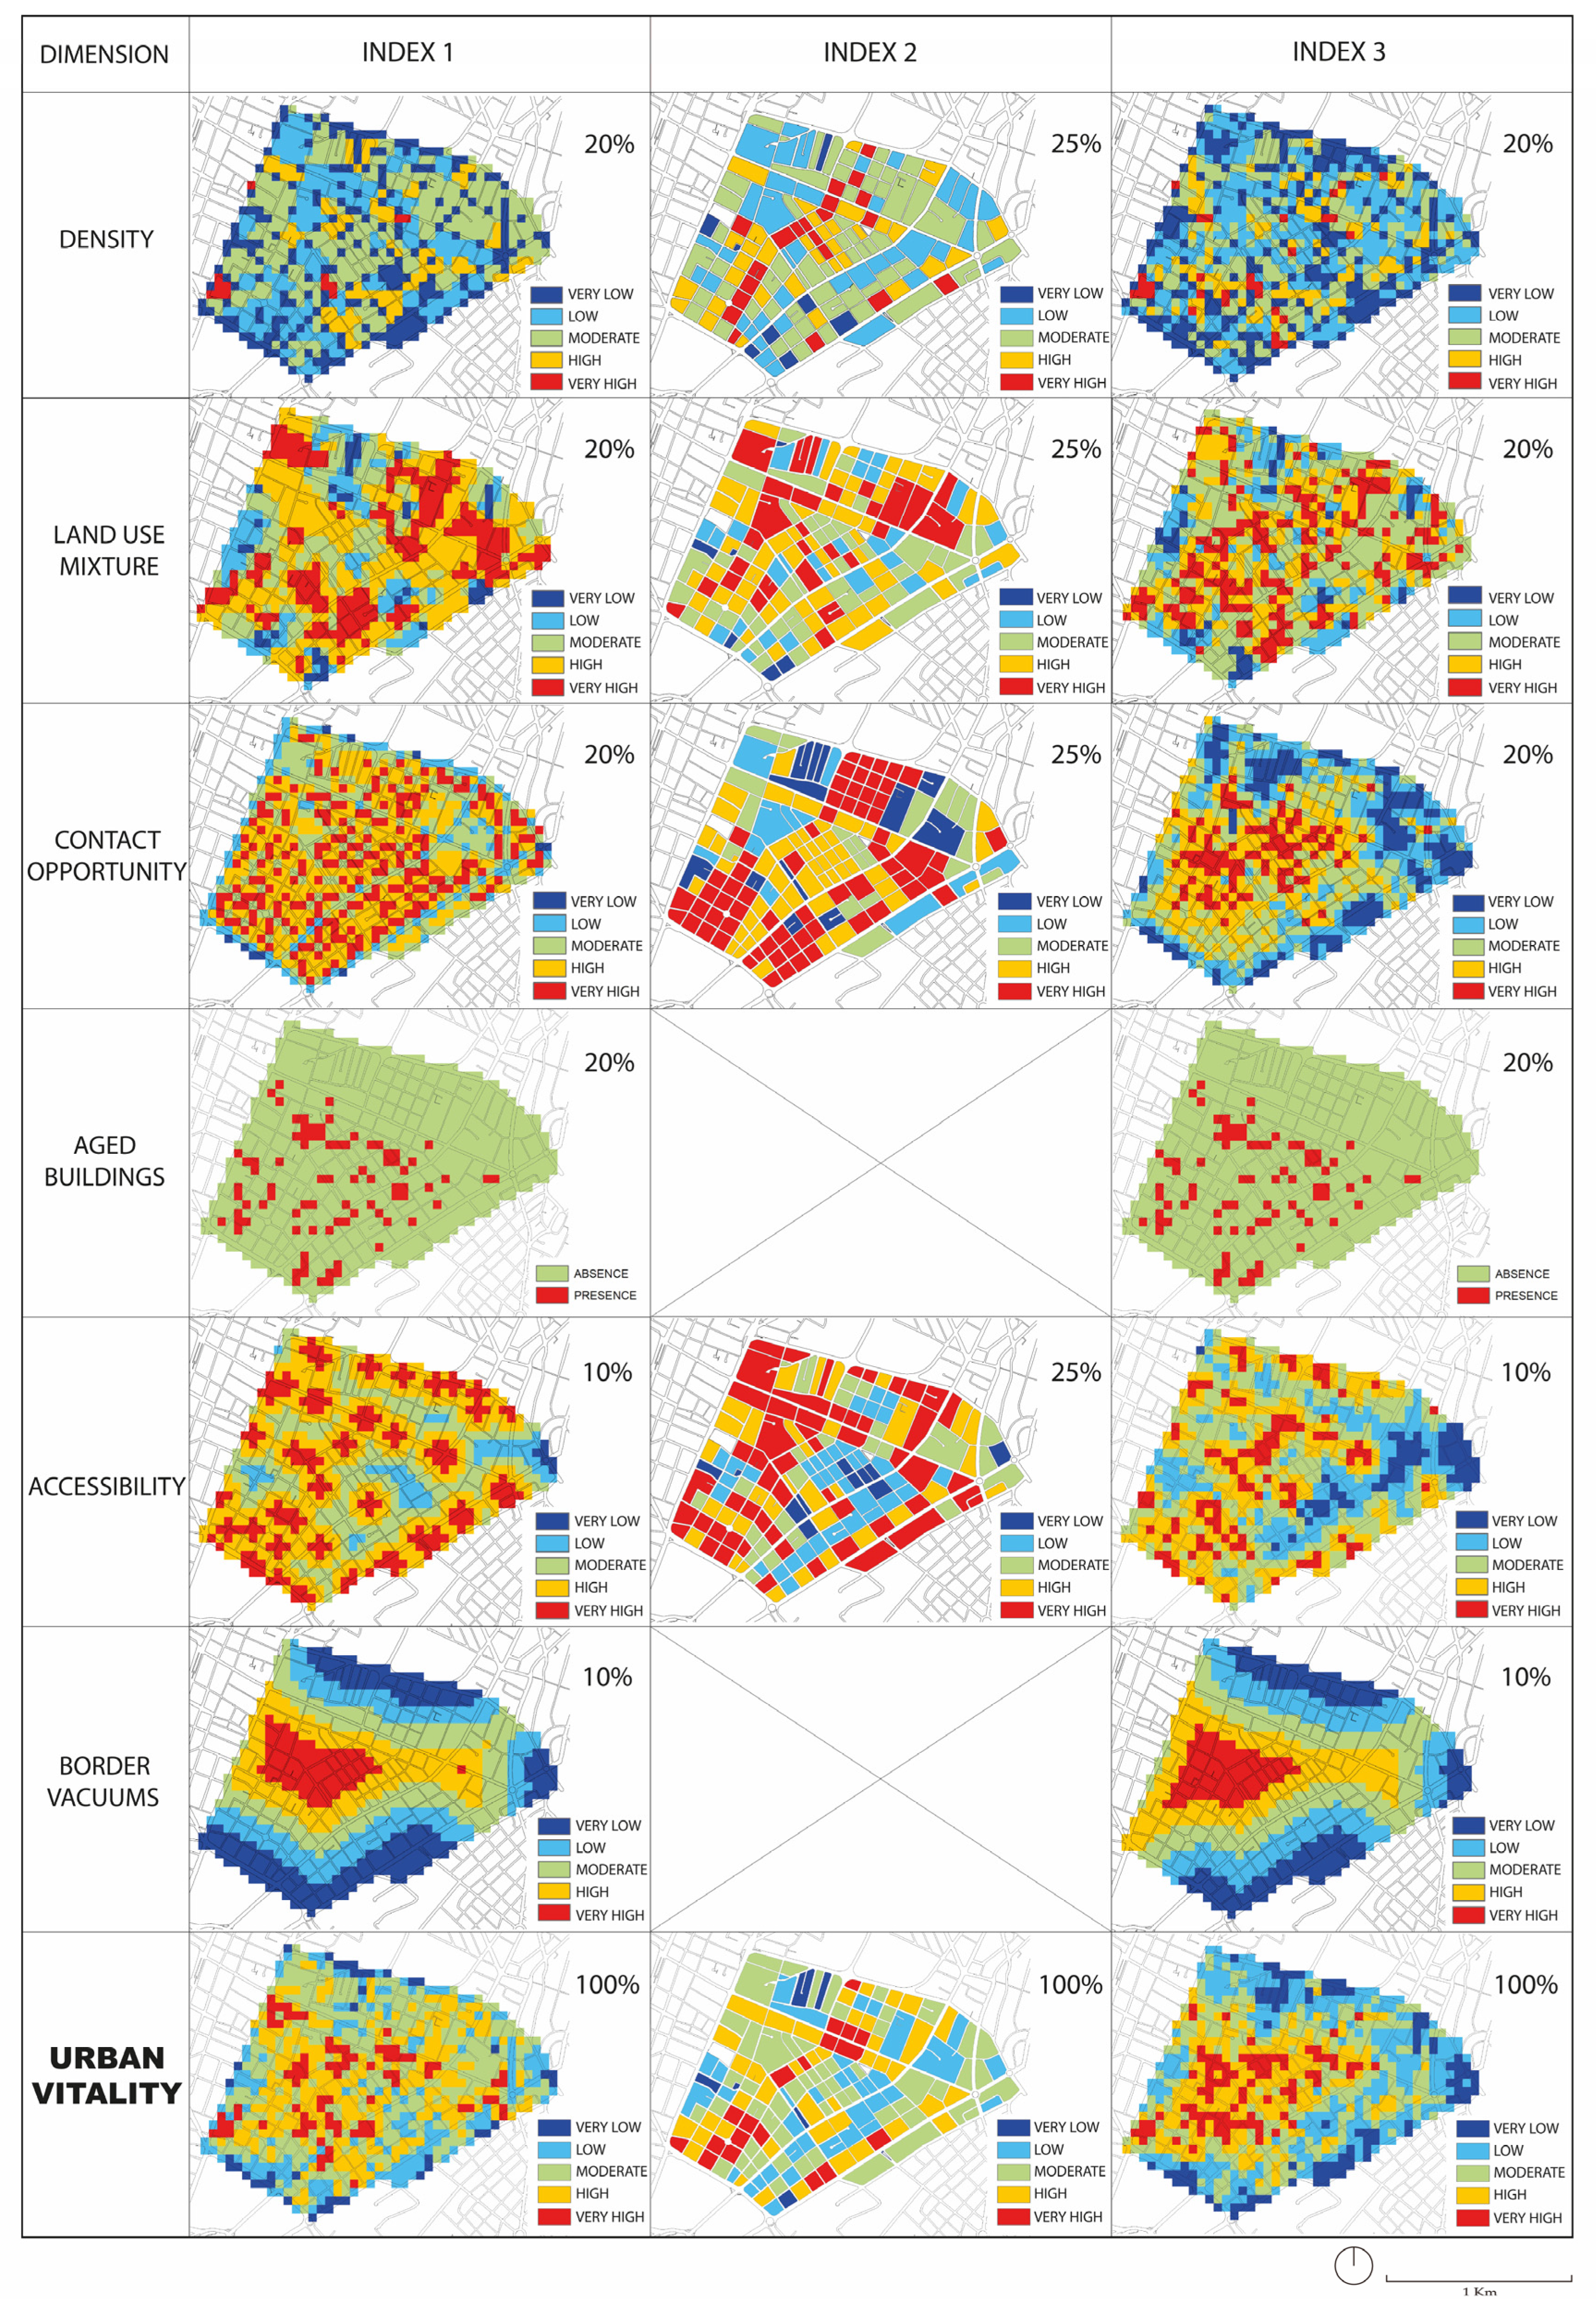
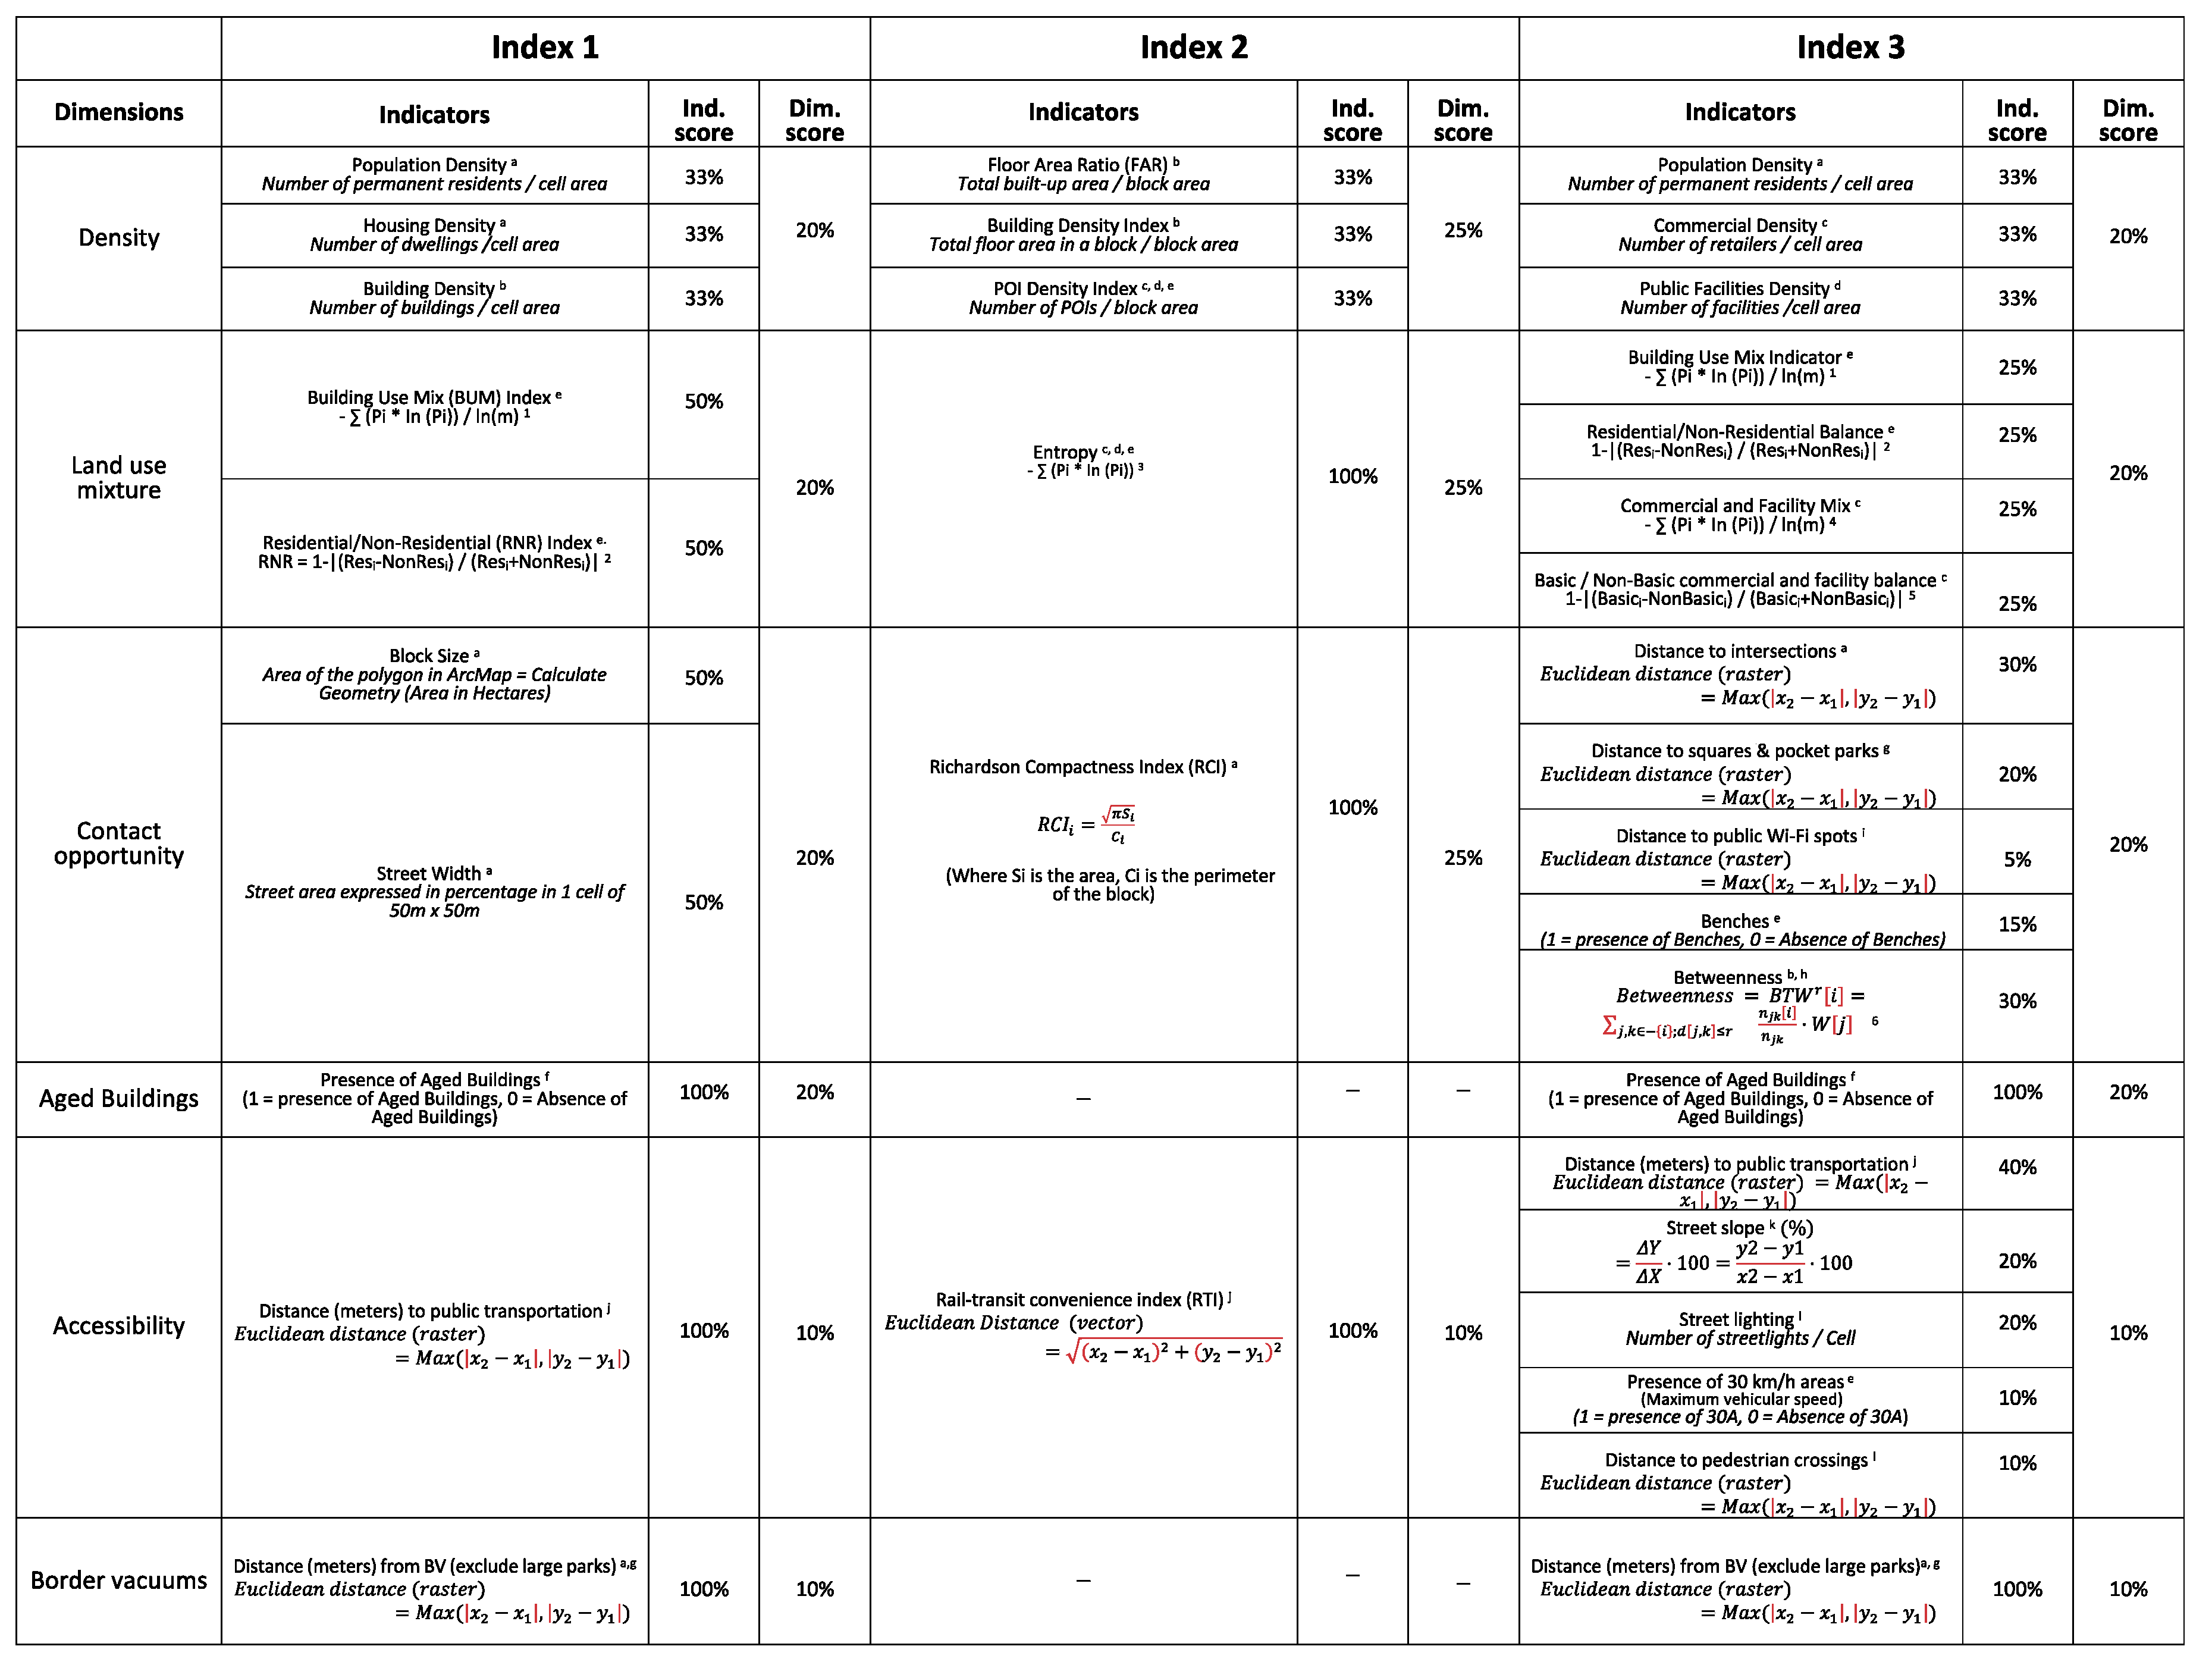
- The density dimension derives from “the need for concentration” recommended by Jacobs. Currently, it highlights the relevance of population density combined with the understanding of the built environment shaped by factors such as the density of buildings, commercial activities, and public facilities. In the study area, there is a remarkable presence of housing and commercial density. Nevertheless, the Floor Area Ratio (FAR) could be considerably increased based on the regulations of the municipality.
- The land use mixture dimension derives from “the need for primary mixed uses” recommended by Jacobs. Currently, it emphasizes the significance of land use diversity in attracting a significant number of people. For instance, the presence of kindergartens, schools, restaurants, bars, discotheques, hospitals, and daycare centers, would promote more presence of children, teenagers, youngsters, families, and elderly people, respectively. In the study area, it is ensured as a result of the significant number of schools, universities, health centers, housing, offices, administrative buildings, churches, and commerce present.
- The contact opportunity dimension derives from “the need for small blocks” recommended by Jacobs. She posited that small blocks promote more interaction in the streets than large blocks [4]. Currently, it associates the urban layout and elements such as distance to pocket parks and Wi-Fi spots with the possibility of interaction for walkers. In the study area, it is represented by a heterogeneous reticular urban layout conformed by morphologically different grideal-patterned subsectors, and the presence of pocket parks and Wi-Fi spots.
- The aged buildings dimension derives from the “need for aged buildings” recommended by Jacobs. It underlined the idea that older constructions would be more receptive to locating people with fewer economic resources promoting social diversity. For this paper, since we have only considered morphological parameters, we have associated aged buildings with the original big villas surrounded by generous private green gardens and interpreted them as urban vitality propellers due to their current public use after rehabilitation as heritage buildings.
- The accessibility dimension derives from the “need for accessibility” recommended by Jacobs. Currently, it is related to the importance of having close access to public transport stops, facilitating a good connection with the rest of the city, as well as promoting universal accessibility. For example, it should facilitate that people in wheelchairs do not present problems if they have to climb a curve, or parents who push a baby cart may not struggle with rough sidewalks. In the study area, it is covered by different public transport stations. Nevertheless, the neighborhood presents limitations regarding universal accessibility because of the inappropriate quality of sidewalks and high street slopes.
- The border vacuums dimension derives from the “absence of border vacuums” recommended by Jacobs. It correlates the idea that massive, gated areas inside the city, usually with one single use, such as railways, highways, or gated residential communities, make continuous walking more complicated, and, therefore, urban vitality decreases. There is a presence of external border vacuums in the external perimeter of the study area.
2.2. Methods
2.2.1. Indexes, calculations, and data sources
Index 1
Index 2
Index 3
3. Results
3.1. Density
3.2. Land use mixture
3.3. Contact opportunity
3.4. Aged buildings
3.5. Accessibility
3.6. Border vacuums
3.7. Final maps of urban vitality
4. Discussion
Limitations of the present article and future lines of research
5. Conclusions
Author Contributions
Funding
Data Availability Statement
Acknowledgments
Conflicts of Interest
References
- Siclari, P. Implementation of the New Urban Agenda (NUA) in Latin America and The Caribbean: 2018-2022. 2022.
- The Sustainable Development Goals Report 2022. Available online: http://desapublications.un.org/publications/sustainable-development-goals-report-2022 (accessed on 12 December 2022).
- Allam, Z.; Nieuwenhuijsen, M.; Chabaud, D.; Moreno, C. The 15-Minute City Offers a New Framework for Sustainability, Liveability, and Health. The Lancet Planetary Health 2022, 6, e181–e183. [Google Scholar] [CrossRef] [PubMed]
- Jacobs, J. The Death and Life of Great American Cities; Random House: New York, 1961; ISBN 978-0-394-42159-9. [Google Scholar]
- Weicher, J.C. A Test of Jane Jacobs’ Theory of Successful Neighborhoods. Journal of Regional Science 1973, 13, 29–40. [Google Scholar] [CrossRef]
- Schmidt, C.G. Influence of Land Use Diversity upon Neighborhood Success: An Analysis of Jacobs’ Theory. The Annals of Regional Science 1977, 11, 53–65. [Google Scholar] [CrossRef]
- Sung, H.; Lee, S.; Cheon, S. Operationalizing Jane Jacobs’s Urban Design Theory: Empirical Verification from the Great City of Seoul, Korea. Journal of Planning Education and research 2015, 35, 117–130. [Google Scholar] [CrossRef]
- Lee, J.; Kurisu, K.; An, K.; Hanaki, K. Development of the Compact City Index and Its Application to Japanese Cities. Urban Studies 2015, 52, 1054–1070. [Google Scholar] [CrossRef]
- King, K. Jane Jacobs and ‘the Need for Aged Buildings’: Neighbourhood Historical Development Pace and Community Social Relations. Urban Studies 2013, 50, 2407–2424. [Google Scholar] [CrossRef]
- Guan, C.; Rowe, P.G. The Concept of Urban Intensity and China’s Townization Policy: Cases from Zhejiang Province. Cities 2016, 55, 22–41. [Google Scholar] [CrossRef]
- Frank, L.D.; Sallis, J.F.; Saelens, B.E.; Leary, L.; Cain, K.; Conway, T.L.; Hess, P.M. The Development of a Walkability Index: Application to the Neighborhood Quality of Life Study. British journal of sports medicine 2010, 44, 924–933. [Google Scholar] [CrossRef]
- Cho, S.E.; Kim, S. Measuring Urban Diversity of Songjiang New Town: A Re-Configuration of a Chinese Suburb. Habitat International 2017, 66, 32–41. [Google Scholar] [CrossRef]
- Kang, C.; Fan, D.; Jiao, H. Validating Activity, Time, and Space Diversity as Essential Components of Urban Vitality. Environment and Planning B: Urban Analytics and City Science 2021, 48, 1180–1197. [Google Scholar] [CrossRef]
- Sevtsuk, A.; Kalvo, R.; Ekmekci, O. Pedestrian Accessibility in Grid Layouts: The Role of Block, Plot and Street Dimensions. Urban Morphology 2016, 20, 89–106. [Google Scholar] [CrossRef]
- Delclòs-Alió, X.; Miralles-Guasch, C. Looking at Barcelona through Jane Jacobs’s Eyes: Mapping the Basic Conditions for Urban Vitality in a Mediterranean Conurbation. Land Use Policy 2018, 75, 505–517. [Google Scholar] [CrossRef]
- Fuentes, L.; Miralles-Guasch, C.; Truffello, R.; Delclòs-Alió, X.; Flores, M.; Rodríguez, S. Santiago de Chile through the Eyes of Jane Jacobs. Analysis of the Conditions for Urban Vitality in a Latin American Metropolis. Land 2020, 9, 498. [Google Scholar] [CrossRef]
- Gómez-Varo, I.; Delclòs-Alió, X.; Miralles-Guasch, C. Jane Jacobs Reloaded: A Contemporary Operationalization of Urban Vitality in a District in Barcelona. Cities 2022, 123, 103565. [Google Scholar] [CrossRef]
- Wang, S.; Deng, Q.; Jin, S.; Wang, G. Re-Examining Urban Vitality through Jane Jacobs’ Criteria Using GIS-SDNA: The Case of Qingdao, China. Buildings 2022, 12, 1586. [Google Scholar] [CrossRef]
- Tang, L.; Lin, Y.; Li, S.; Li, S.; Li, J.; Ren, F.; Wu, C. Exploring the Influence of Urban Form on Urban Vibrancy in Shenzhen Based on Mobile Phone Data. Sustainability 2018, 10, 4565. [Google Scholar] [CrossRef]
- Chen, W.; Wu, A.N.; Biljecki, F. Classification of Urban Morphology with Deep Learning: Application on Urban Vitality. Computers, Environment and Urban Systems 2021, 90, 101706. [Google Scholar] [CrossRef]
- Wu, J.; Ta, N.; Song, Y.; Lin, J.; Chai, Y. Urban Form Breeds Neighborhood Vibrancy: A Case Study Using a GPS-Based Activity Survey in Suburban Beijing. Cities 2018, 74, 100–108. [Google Scholar] [CrossRef]
- Liu, D.; Shi, Y. The Influence Mechanism of Urban Spatial Structure on Urban Vitality Based on Geographic Big Data: A Case Study in Downtown Shanghai. Buildings 2022, 12, 569. [Google Scholar] [CrossRef]
- Zhang, Y.; Yang, L.; Wang, X. Analysis and Calculating of Comprehensive Urban Vitality Index by Multi-Source Temporal-Spatial Big Data and EW-TOPSIS.; IEEE, 2021; pp. 196–201.
- Wang, X.; Zhang, Y.; Yu, D.; Qi, J.; Li, S. Investigating the Spatiotemporal Pattern of Urban Vibrancy and Its Determinants: Spatial Big Data Analyses in Beijing, China. Land Use Policy 2022, 119, 106162. [Google Scholar] [CrossRef]
- Shi, J.; Miao, W.; Si, H. Visualization and Analysis of Mapping Knowledge Domain of Urban Vitality Research. Sustainability 2019, 11. [Google Scholar] [CrossRef]
- Yue, Y.; Zhuang, Y.; Yeh, A.G.O.; Xie, J.-Y.; Ma, C.-L.; Li, Q.-Q. Measurements of POI-Based Mixed Use and Their Relationships with Neighbourhood Vibrancy. International Journal of Geographical Information Science 2017, 31, 658–675. [Google Scholar] [CrossRef]
- Zhang, A.; Li, W.; Wu, J.; Lin, J.; Chu, J.; Xia, C. How Can the Urban Landscape Affect Urban Vitality at the Street Block Level? A Case Study of 15 Metropolises in China. Environment and Planning B: Urban Analytics and City Science 2021, 48, 1245–1262. [Google Scholar] [CrossRef]
- Chen, L.; Zhao, L.; Xiao, Y.; Lu, Y. Investigating the Spatiotemporal Pattern between the Built Environment and Urban Vibrancy Using Big Data in Shenzhen, China. Computers, Environment and Urban Systems 2022, 95, 101827. [Google Scholar] [CrossRef]
- Huang, J.; Cui, Y.; Li, L.; Guo, M.; Ho, H.C.; Lu, Y.; Webster, C. Re-Examining Jane Jacobs’ Doctrine Using New Urban Data in Hong Kong. Environment and Planning B: Urban Analytics and City Science 2022, 23998083221106184. [Google Scholar] [CrossRef]
- Wu, W.; Niu, X. Influence of Built Environment on Urban Vitality: Case Study of Shanghai Using Mobile Phone Location Data. Journal of Urban Planning and Development 2019, 145, 04019007. [Google Scholar] [CrossRef]
- Shen, Y.; Karimi, K.; Law, S.; Zhong, C. Physical Co-Presence Intensity: Measuring Dynamic Face-to-Face Interaction Potential in Public Space Using Social Media Check-in Records. PloS one 2019, 14, e0212004. [Google Scholar] [CrossRef] [PubMed]
- Zeng, P.; Sun, Z.; Gao, Z. Study on the Classification Method of Urban Vitality Spatial Pattern Based on Full-Time Vitality Spectrum: A Case Study of Tianjin, China.; CORP–Competence Center of Urban and Regional Planning, 2020; pp. 1181–1186.
- Lu, S.; Huang, Y.; Shi, C.; Yang, X. Exploring the Associations between Urban Form and Neighborhood Vibrancy: A Case Study of Chengdu, China. ISPRS International Journal of Geo-Information 2019, 8, 165. [Google Scholar] [CrossRef]
- Li, Q.; Cui, C.; Liu, F.; Wu, Q.; Run, Y.; Han, Z. Multidimensional Urban Vitality on Streets: Spatial Patterns and Influence Factor Identification Using Multisource Urban Data. ISPRS International Journal of Geo-Information 2021, 11, 2. [Google Scholar] [CrossRef]
- Kim, S. Urban Vitality, Urban Form, and Land Use: Their Relations within a Geographical Boundary for Walkers. Sustainability 2020, 12, 10633. [Google Scholar] [CrossRef]
- Sung, H.-G.; Go, D.-H.; Choi, C.G. Evidence of Jacobs’s Street Life in the Great Seoul City: Identifying the Association of Physical Environment with Walking Activity on Streets. Cities 2013, 35, 164–173. [Google Scholar] [CrossRef]
- Sung, H.; Lee, S. Residential Built Environment and Walking Activity: Empirical Evidence of Jane Jacobs’ Urban Vitality. Transportation Research Part D: Transport and Environment 2015, 41, 318–329. [Google Scholar] [CrossRef]
- Yue, W.; Chen, Y.; Thy, P.T.M.; Fan, P.; Liu, Y.; Zhang, W. Identifying Urban Vitality in Metropolitan Areas of Developing Countries from a Comparative Perspective: Ho Chi Minh City versus Shanghai. Sustainable Cities and Society 2021, 65, 102609. [Google Scholar] [CrossRef]
- Ziya Paköz, M.; Yaratgan, D.; Şahin, A. Re-Mapping Urban Vitality through Jane Jacobs’ Criteria: The Case of Kayseri, Turkey. Land Use Policy 2022, 114, 105985. [Google Scholar] [CrossRef]
- Palaiologou, G.; Vaughan, L. The Sociability of the Street Interface–Revisiting West Village, Manhattan.; FEUP, 2014; Vol. 21, pp. 88–102.
- Sulis, P.; Manley, E.; Zhong, C.; Batty, M. Using Mobility Data as Proxy for Measuring Urban Vitality. Journal of Spatial Information Science 2018, 16, 137–162. [Google Scholar] [CrossRef]
- Zeng, W.; Ye, Y. VitalVizor: A Visual Analytics System for Studying Urban Vitality. IEEE Computer Graphics and Applications 2018, 38, 38–53. [Google Scholar] [CrossRef] [PubMed]
- van Eijk, A. Urban Vitality-Restoring Public Life in Amsterdam-Noord, TU Delft, 2021.
- De Nadai, M.; Staiano, J.; Larcher, R.; Sebe, N.; Quercia, D.; Lepri, B. The Death and Life of Great Italian Cities: A Mobile Phone Data Perspective.; 2016; pp. 413–423.
- Šćepanović, S.; Joglekar, S.; Law, S.; Quercia, D. Jane Jacobs in the Sky: Predicting Urban Vitality with Open Satellite Data. Proceedings of the ACM on Human-Computer Interaction 2021, 5, 1–25. [Google Scholar] [CrossRef]
- Beltrán Rodríguez, M. La Importancia de La Vitalidad Urbana. Ciudades 2017, 0, 217–235. [Google Scholar] [CrossRef]
- Zhang, X.; Sun, Y.; Chan, T.O.; Huang, Y.; Zheng, A.; Liu, Z. Exploring Impact of Surrounding Service Facilities on Urban Vibrancy Using Tencent Location-Aware Data: A Case of Guangzhou. Sustainability 2021, 13, 444. [Google Scholar] [CrossRef]
- Bartzokas-Tsiompras, A.; Tampouraki, E.M.; Photis, Y.N. Is Walkability Equally Distributed among Downtowners? Evaluating the Pedestrian Streetscapes of Eight European Capitals Using a Micro-Scale Audit Approach. City Sustainability and Regeneration 2020, 135. [Google Scholar] [CrossRef]
- Zumelzu, A.; Barría, T.; Barrientos-Trinanes, M. Efectos de La Forma Urbana Sobre La Accesibilidad Peatonal En Barrios Del Sur de Chile. Arquiteturarevista 2020, 16, 1–22. [Google Scholar] [CrossRef]
- Certificación del Urbanismo Ecológico. Agencia de Ecología Urbana de Barcelona, Ed.; Ministerio de Fomento, 2012; ISBN 978-84-498-0914-9.
- Huang, C.; Gong, P.; Ding, R.; Qu, S.; Yang, X. Comprehensive Analysis of the Vitality of Urban Central Activities Zone Based on Multi-Source Data-Case Studies of Lujiazui and Other Sub-Districts in Shanghai CAZ. 2021. [CrossRef]
- Bergroth, C.; Järv, O.; Tenkanen, H.; Manninen, M.; Toivonen, T. A 24-Hour Population Distribution Dataset Based on Mobile Phone Data from Helsinki Metropolitan Area, Finland. Scientific data 2022, 9, 1–19. [Google Scholar] [CrossRef]
- Jia, C.; Du, Y.; Wang, S.; Bai, T.; Fei, T. Measuring the Vibrancy of Urban Neighborhoods Using Mobile Phone Data with an Improved PageRank Algorithm. Transactions in GIS 2019, 23, 241–258. [Google Scholar] [CrossRef]
- Zeng, C.; Song, Y.; He, Q.; Shen, F. Spatially Explicit Assessment on Urban Vitality: Case Studies in Chicago and Wuhan. Sustainable cities and society 2018, 40, 296–306. [Google Scholar] [CrossRef]
- Lu, S.; Shi, C.; Yang, X. Impacts of Built Environment on Urban Vitality: Regression Analyses of Beijing and Chengdu, China. International journal of environmental research and public health 2019, 16, 4592. [Google Scholar] [CrossRef] [PubMed]
- Fang, C.; He, S.; Wang, L. Spatial Characterization of Urban Vitality and the Association with Various Street Network Metrics from the Multi-Scalar Perspective. Frontiers in Public Health 2021, 579. [Google Scholar] [CrossRef] [PubMed]
- Rueda, S. Plan y Diseño de Supermanzanas 2015.
- 58. Descargas. LlactaLAB – Universidad de Cuenca.
- Ponce Alvarado, A. La Mariscal. Historia de un barrio moderno en Quito en el Siglo XX; Instituto Metropolitano de Patrimonio: Quito, 2012; ISBN 978-9978-366-73-8. [Google Scholar]
- home – Instituto Nacional de Estadística y Censos. Available online: https://www.ecuadorencifras.gob.ec/institucional/home/ (accessed on 15 December 2022).
- Wirth, M.A. Shape Analysis and Measurement. Image Processing Group 2004, 1–49. [Google Scholar]
- Sevtsuk, A.; Mekonnen, M. Urban Network Analysis: A New Toolbox for ArcGIS. Revue internationale de géomatique 2012, 22, 287–305. [Google Scholar] [CrossRef]
- Calculate Z-Score—ArcGIS Insights | Documentation. Available online: https://doc.arcgis.com/en/insights/latest/analyze/calculate-z-score.htm (accessed on 31 March 2023).
- Ye, Y.; Li, D.; Liu, X. How Block Density and Typology Affect Urban Vitality: An Exploratory Analysis in Shenzhen, China. Urban Geography 2017, 39, 1–22. [Google Scholar] [CrossRef]
- Liu, S.; Zhang, L.; Long, Y.; Long, Y.; Xu, M. A New Urban Vitality Analysis and Evaluation Framework Based on Human Activity Modeling Using Multi-Source Big Data. ISPRS International Journal of Geo-Information 2020, 9, 617. [Google Scholar] [CrossRef]
- Bozdag, A.; Gumus, M.G.; Gumus, K.; Durduran, S. Accessibility Analysis for the Elderly in an Urban Area from Turkey. Transylvanian Review of Administrative Sciences 2017, 21. [Google Scholar] [CrossRef]
- Gargiulo, C.; Zucaro, F.; Gaglione, F. A Set of Variables for Elderly Accessibility in Urban Areas. TeMA - Journal of Land Use, Mobility and Environment. [CrossRef]
- Fatima, K.; Moridpour, S.; Saghapour, T. Measuring Neighbourhood Walking Access for Older Adults. Sustainability 2022, 14. [Google Scholar] [CrossRef]
- Celi Ortega, S.F. Análisis Del Sistema de Transporte Público Privado de La Ciudad de Quito-Ecuador. Espacios 2018, 1. [Google Scholar]
- Paredes, E.; Berbey Álvarez, A. Situación Actual Del Sistema de Transporte En La Ciudad de Quito, Ecuador: Una Propuesta de Mejora. TRIM, Tordesillas Revista de Investigación Multidisciplinar 2019, 16. [Google Scholar] [CrossRef]
- Shaaban, K. Assessing Sidewalk and Corridor Walkability in Developing Countries. Sustainability 2019, 11, 3865. [Google Scholar] [CrossRef]
- Arellana, J.; Saltarín, M.; Larrañaga, A.M.; Alvarez, V.; Henao, C.A. Urban Walkability Considering Pedestrians’ Perceptions of the Built Environment: A 10-Year Review and a Case Study in a Medium-Sized City in Latin America. Transport reviews 2020, 40, 183–203. [Google Scholar] [CrossRef]
- Botta, F.; Gutiérrez-Roig, M. Modelling Urban Vibrancy with Mobile Phone and OpenStreetMap Data. Plos one 2021, 16, e0252015. [Google Scholar] [CrossRef]
- Jia, C.; Liu, Y.; Du, Y.; Huang, J.; Fei, T. Evaluation of Urban Vibrancy and Its Relationship with the Economic Landscape: A Case Study of Beijing. ISPRS International Journal of Geo-Information 2021, 10, 72. [Google Scholar] [CrossRef]
- Wu, C.; Ye, X.; Ren, F.; Du, Q. Check-in Behaviour and Spatio-Temporal Vibrancy: An Exploratory Analysis in Shenzhen, China. Cities 2018, 77, 104–116. [Google Scholar] [CrossRef]
- Zhang, X.; Gao, F.; Liao, S.; Zhou, F.; Cai, G.; Li, S. Portraying Citizens’ Occupations and Assessing Urban Occupation Mixture with Mobile Phone Data: A Novel Spatiotemporal Analytical Framework. ISPRS International Journal of Geo-Information 2021, 10, 392. [Google Scholar] [CrossRef]
- Chen, S.; Lang, W.; Li, X. Evaluating Urban Vitality Based on Geospatial Big Data in Xiamen Island, China. SAGE Open 2022, 12, 21582440221134520. [Google Scholar] [CrossRef]
- Tang, S.; Ta, N. How the Built Environment Affects the Spatiotemporal Pattern of Urban Vitality: A Comparison among Different Urban Functional Areas. Computational Urban Science 2022, 2, 1–13. [Google Scholar] [CrossRef] [PubMed]
- Bogomolov, A.; Lepri, B.; Staiano, J.; Letouzé, E.; Oliver, N.; Pianesi, F.; Pentland, A. Moves on the Street: Classifying Crime Hotspots Using Aggregated Anonymized Data on People Dynamics. Big data 2015, 3, 148–158. [Google Scholar] [CrossRef]
- Marquet, O.; Hipp, J.A.; Alberico, C.; Huang, J.-H.; Fry, D.; Mazak, E.; Lovasi, G.S.; Floyd, M.F. Park Use Preferences and Physical Activity among Ethnic Minority Children in Low-Income Neighborhoods in New York City. Urban Forestry & Urban Greening 2019, 38, 346–353. [Google Scholar] [CrossRef]
- Jo, A.; Lee, S.-K.; Kim, J. Gender Gaps in the Use of Urban Space in Seoul: Analyzing Spatial Patterns of Temporary Populations Using Mobile Phone Data. Sustainability 2020, 12, 6481. [Google Scholar] [CrossRef]
 |
 |
Disclaimer/Publisher’s Note: The statements, opinions and data contained in all publications are solely those of the individual author(s) and contributor(s) and not of MDPI and/or the editor(s). MDPI and/or the editor(s) disclaim responsibility for any injury to people or property resulting from any ideas, methods, instructions or products referred to in the content. |
© 2023 by the authors. Licensee MDPI, Basel, Switzerland. This article is an open access article distributed under the terms and conditions of the Creative Commons Attribution (CC BY) license (http://creativecommons.org/licenses/by/4.0/).


