1. Introduction
Truffles are ascomycete hypogeous fungi belonging to the
Tuberaceae family of the
Pezizales order [
1]. Although different genera of this order produce subterranean ascomata, several authors only consider “true truffles” the species belonging to the genus
Tuber [
2,
3].
Tuber spp grow associated in ectomycorrhizal symbiosis with tree roots and are known for their peculiar aromas and flavors, which are especially appreciated in
haute cuisine [
4]. There are around 200 species in the genus
Tuber [
5], the most valuable being:
Tuber melanosporum Vittad. (Périgord black truffle),
T. magnatum Picco (Italian white truffle),
T. aestivum Vittad. (Summer or Burgundy truffle) and
T. borchii Vittad. (Bianchetto truffle) [
6].
Beyond their use as food, studies show that truffles have potential antioxidant [
7], anti-angiogenic, anti-inflammatory [
8], and antitumor activity [
9], as well as the presence of volatile compounds (VOCs) [
1,
10,
11] responsible for their distinctive aroma. Truffle VOCs are a mixture of 30 to 60 volatile constituents, including alcohols, ketones, aldehydes, and aromatic and sulfur compounds, that produce each specific scent [
1].
The
Tuber fruiting bodies can be grown naturally and semi-artificially. However, natural truffle production has decreased over time, increasing its price [
12,
13]. The semi-artificial cultivation requires the controlled mycorrhization of appropriate tree seedlings using
Tuber mycelium or spores, which must be planted in suitable soils [
14]. Although obtaining fruiting bodies under in vitro conditions without the host plant is impossible, truffle mycelium, including that of
T. borchii, can be grown in pure cultures [
15]. Different methods have been developed for industrial in vitro cultivation from natural truffle samples [
13]. These mycelia usually grow very slowly, and several months are frequently required to obtain enough biomass for mycorrhization or other studies. Because of that, the number of strains characterized for their use as model systems is still scarce. In vitro studies have demonstrated the presence of VOCs in truffle axenic mycelium cultures [
16,
17,
18]. The availability of new strains for genetic and physiological studies in this fungus could facilitate progress in this field of research.
T. borchii is a whitish truffle found in Europe, especially in Italy, during winter and early spring. It grows in cold temperate to Mediterranean climates, in subalkaline, and, less frequently, in slightly acidic soils with trees and shrubs such as oak, poplar, strawberry tree, and pine, among others [
19,
20]. There are currently 72 pezizomycete genomes available in the Mycocosm database coordinated by the
Joint Genome Institute; 10 correspond to
Tuber. The main features of the truffle genomes were elucidated after sequencing those of
T. melanosporum in 2010 [
21]. The other
Tuber genomes sequenced are those of
T. aestivum,
T. borchii,
T. brumale Vittad.,
T. canaliculatum Gilkey.,
T. gibbosum Harkn.,
T. indicum Cooke & Massee., T
. magnatum,
T. melosporum [
22], and
T. mesentericum Vittad. [
23].
The genome sizes of the sequenced truffles are the largest in the
Pezizomycetes group (mean genome size of 114.13 Mbp compared with the 71.45 Mbp of the whole group), and eight out of the ten larger genomes in this group correspond to truffles. Moreover, this difference is even more apparent when the genomes of the
Tuber species are compared (129.48 Mbp mean genome size of the group). However, the larger genome size of
Tuber species is not a consequence of having more gene models (mean numbers 11,621.33 and 11,776.50 for
Pezizomycetes, and
Tuber, respectively), but is the consequence of an expanded number of transposons and repetitive sequences in truffles as described alter the analysis of the genome of
T. melanosporum [
21].
The
T. borchii reference draft genome (Tbo3840) was sequenced in 2018 [
24]. The nuclear genome assembly of this species is 97.18 Mbp in length, and it is relatively small compared to other
Tuber and truffle genomes. The genome codes for 12,346 predicted genes fit well with the expected number of genes for truffles and
Tuber. The
T. borchii genome lacks gene coding for the glycosylhydrolases GH6 and GH7, revealing its mycorrhizal nature.
Beyond gene catalogs, understanding the expression profiles in different metabolic pathways is crucial for a comprehensive knowledge of their life cycle. Moreover, producing complex secondary metabolites and volatile compound mixtures determines Tuber commercial value. The transcriptome profile of the central metabolic pathways can serve as an internal reference for evaluating the activity to produce secondary metabolites, more so when the differences in genetic background, environment, and culture conditions make the comparisons of different isolates difficult.
This work aims to characterize a new Spanish T. borchii isolate, grow its mycelium in vitro, initially explore the transcriptome under different culture conditions and study the genes related to the volatile compounds responsible for truffle aroma. The final objective is to increase the available strains for in vitro and in vivo functional studies in this group of organisms.
3. Discussion
3.1. SP1 is a new mycelial isolate of Tuber borchii.
Truffles are among the most appreciated edible fungi worldwide; therefore, there is great interest in this research field. In recent decades, research has been conducted on submerged fermentation of fungal mycelia to address the time- and skill-intensive process of truffle cultivation [
12,
13]. Several research groups have conducted cultivation optimization studies for submerged fermentation of truffle mycelia [
25,
26]. These studies generally evaluate changes in biomass, exopolysaccharides, enzymes, presence of metabolites, and volatile organic acids for proximity to fruiting bodies.
However, the number of Tuber strains available for laboratory studies is scarce. Tuber spp. mycelia are difficult to cultivate in culture medium; when possible, the growth of the mycelium is extremely slow, and the biomass yield is also minimal [
27,
28]. For this reason, increasing the number of Tuber strains cultivated
in vitro and molecularly characterized is of broad interest.
This paper describes the isolation and characterization of a new Tuber strain called SP1. T. borchii SP1 was collected in the wild from Castilla-León (Spain) soil. During the isolation process, the truffle was cleaned to remove other bacterial or fungal contaminants, and samples were collected from the gleba. The original samples were heavily contaminated with other microorganisms, such as fungi from the genera Cladosporium and Fomitopsis, identified by ITS sequencing as the most frequent (data not shown). This occurs because ectomycorrhizal truffles and fruiting bodies harbor a diverse microbial community, including filamentous fungi, yeasts, and bacteria[
29,
30,
31].
The mycelium recovered from this strain was developed from the glebal tissue (data not shown) and consequently corresponds to the maternal mycelium of this truffle [
32,
33]. The identification of this T. borchii new strain SP1 isolate was confirmed by sequencing the ITS of the isolated mycelium.
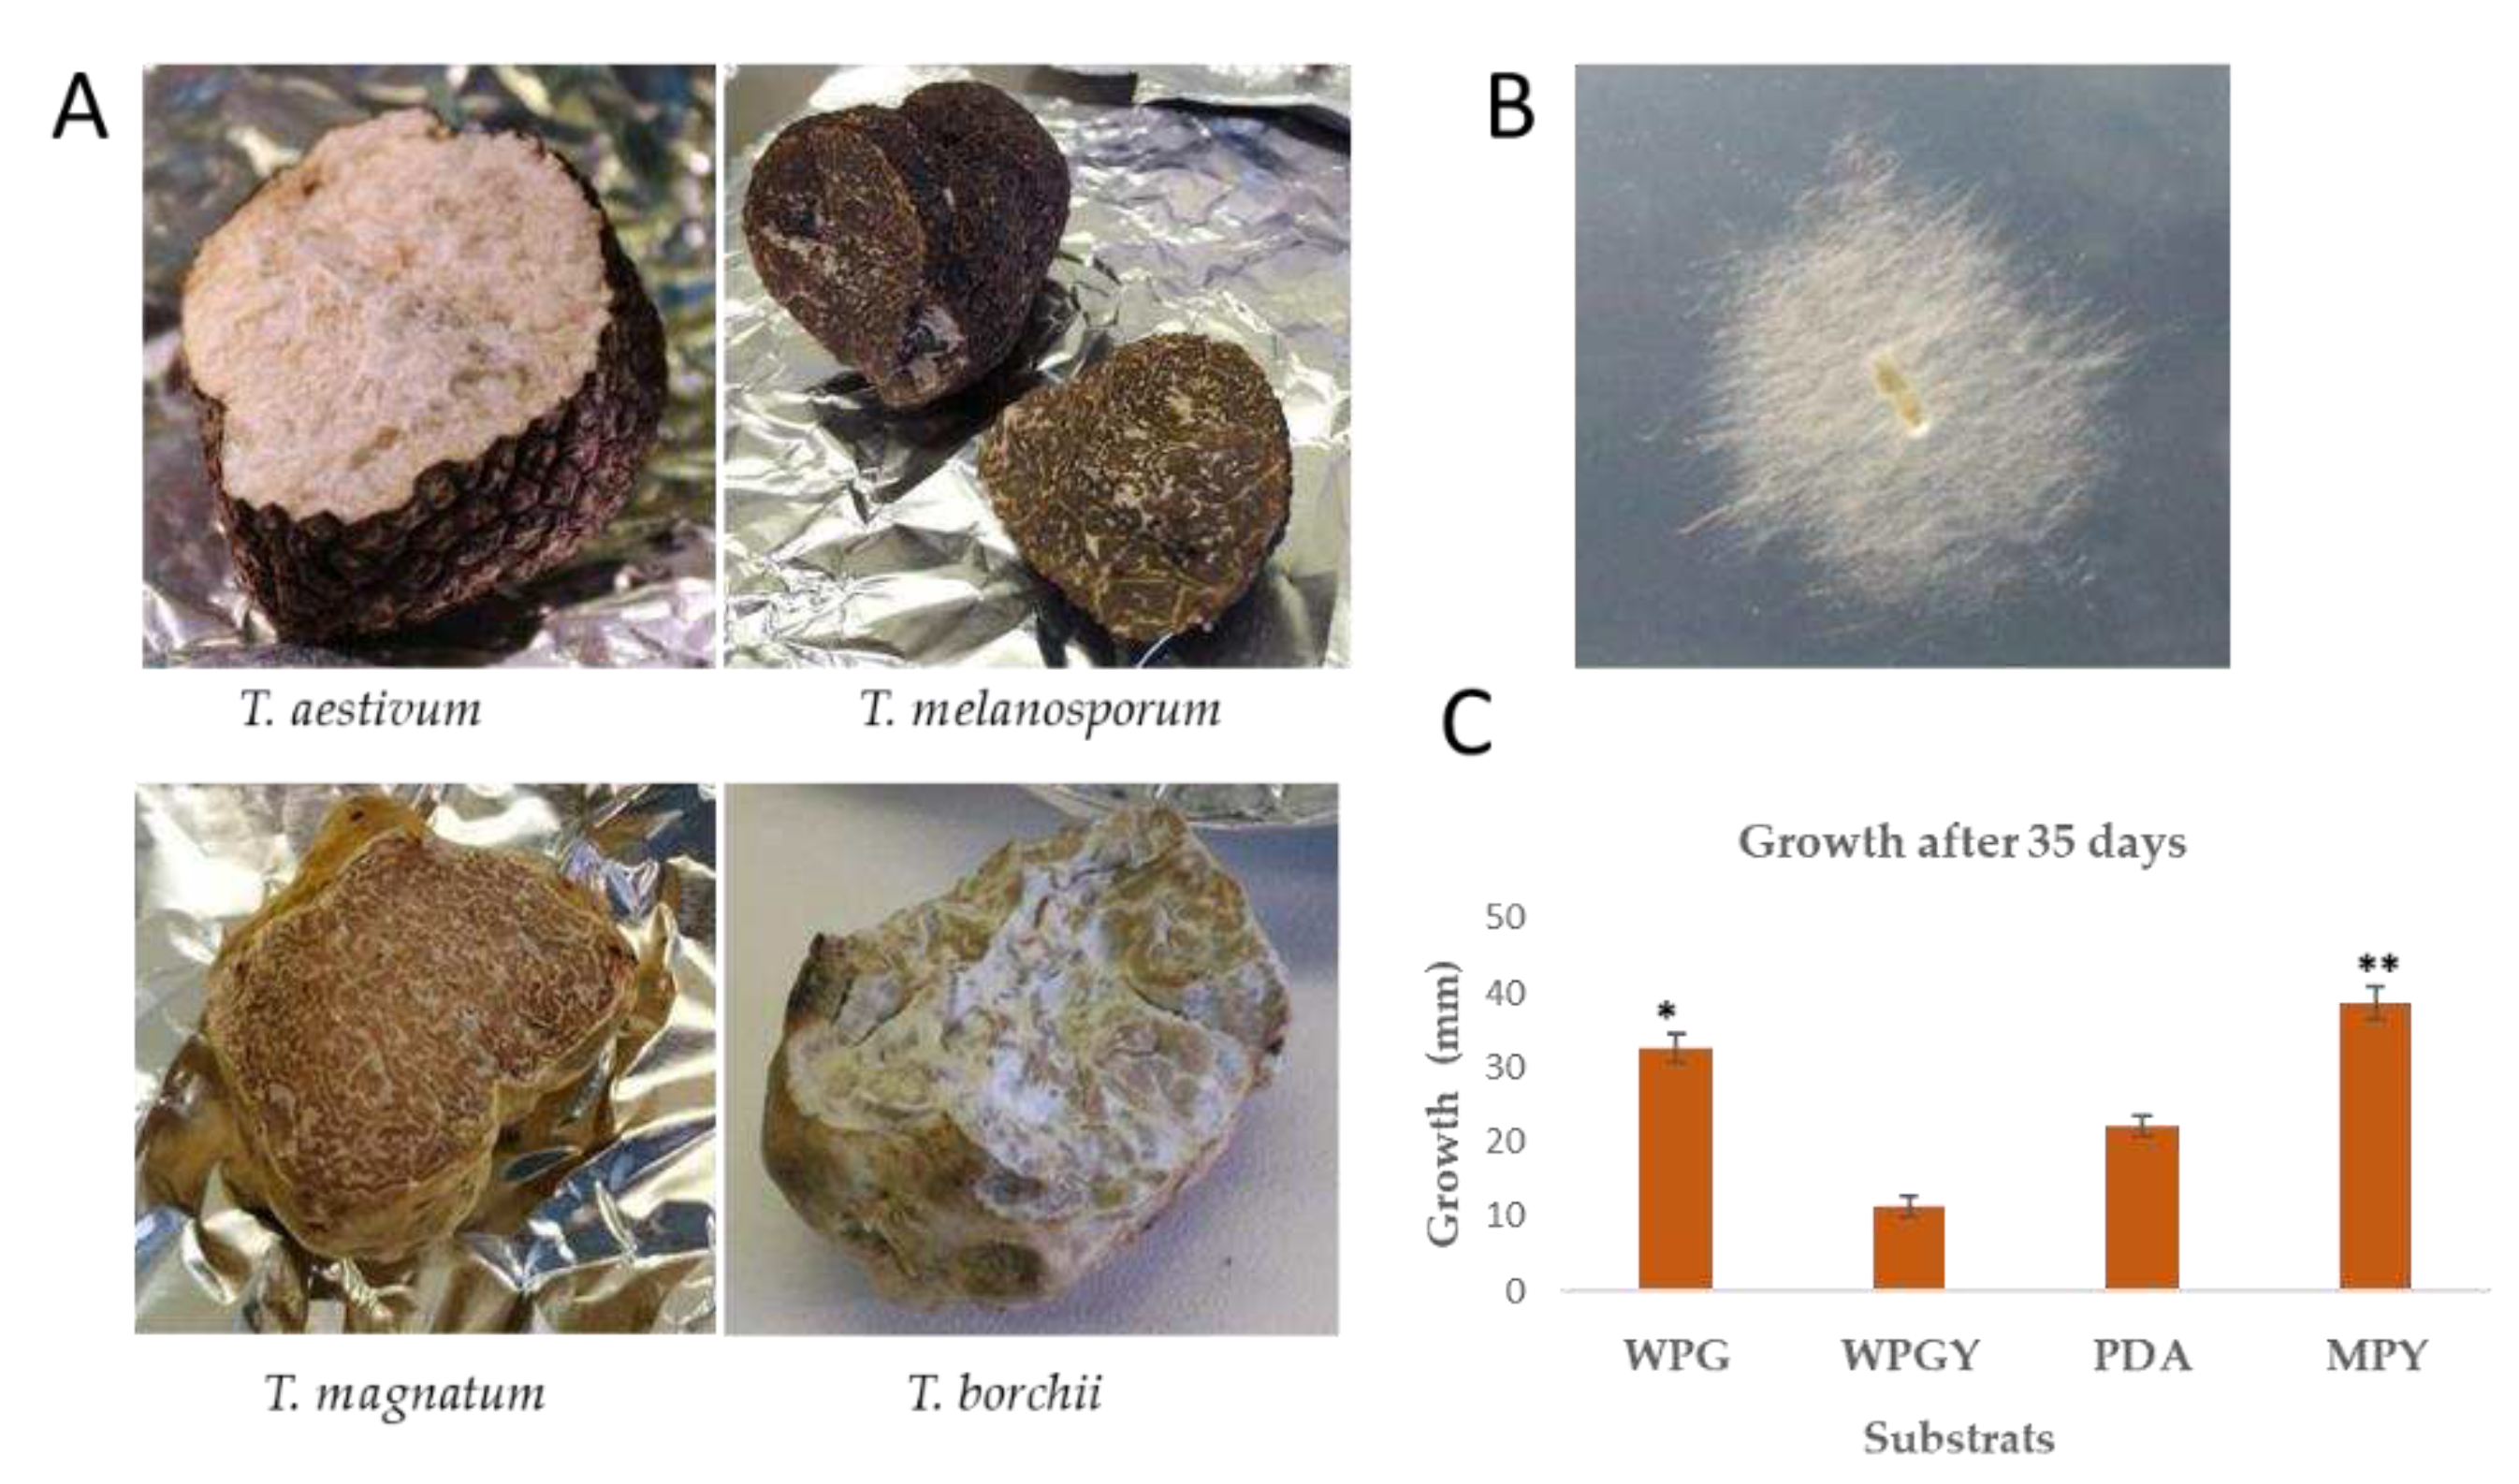
In vitro culturing of T. borchii is difficult because of its low growth rate. Different solid culture media (PDA, MPY, WPGY, and WPG, see Materials and Methods for their composition) were tested to isolate and cultivate the mycelium of the strain SP1. The best growth rate was observed in the cultures performed using MPY or WPG. In MPY, the estimated mycelial growth rate of T. borchii SP1 was 40 cm/yr, considerably faster than the growth achieved for T. borchii by Iotti
et al. (2002) [
28](
Figure 1C). The mycelia grew better when a lower agar concentration was used (data not shown).
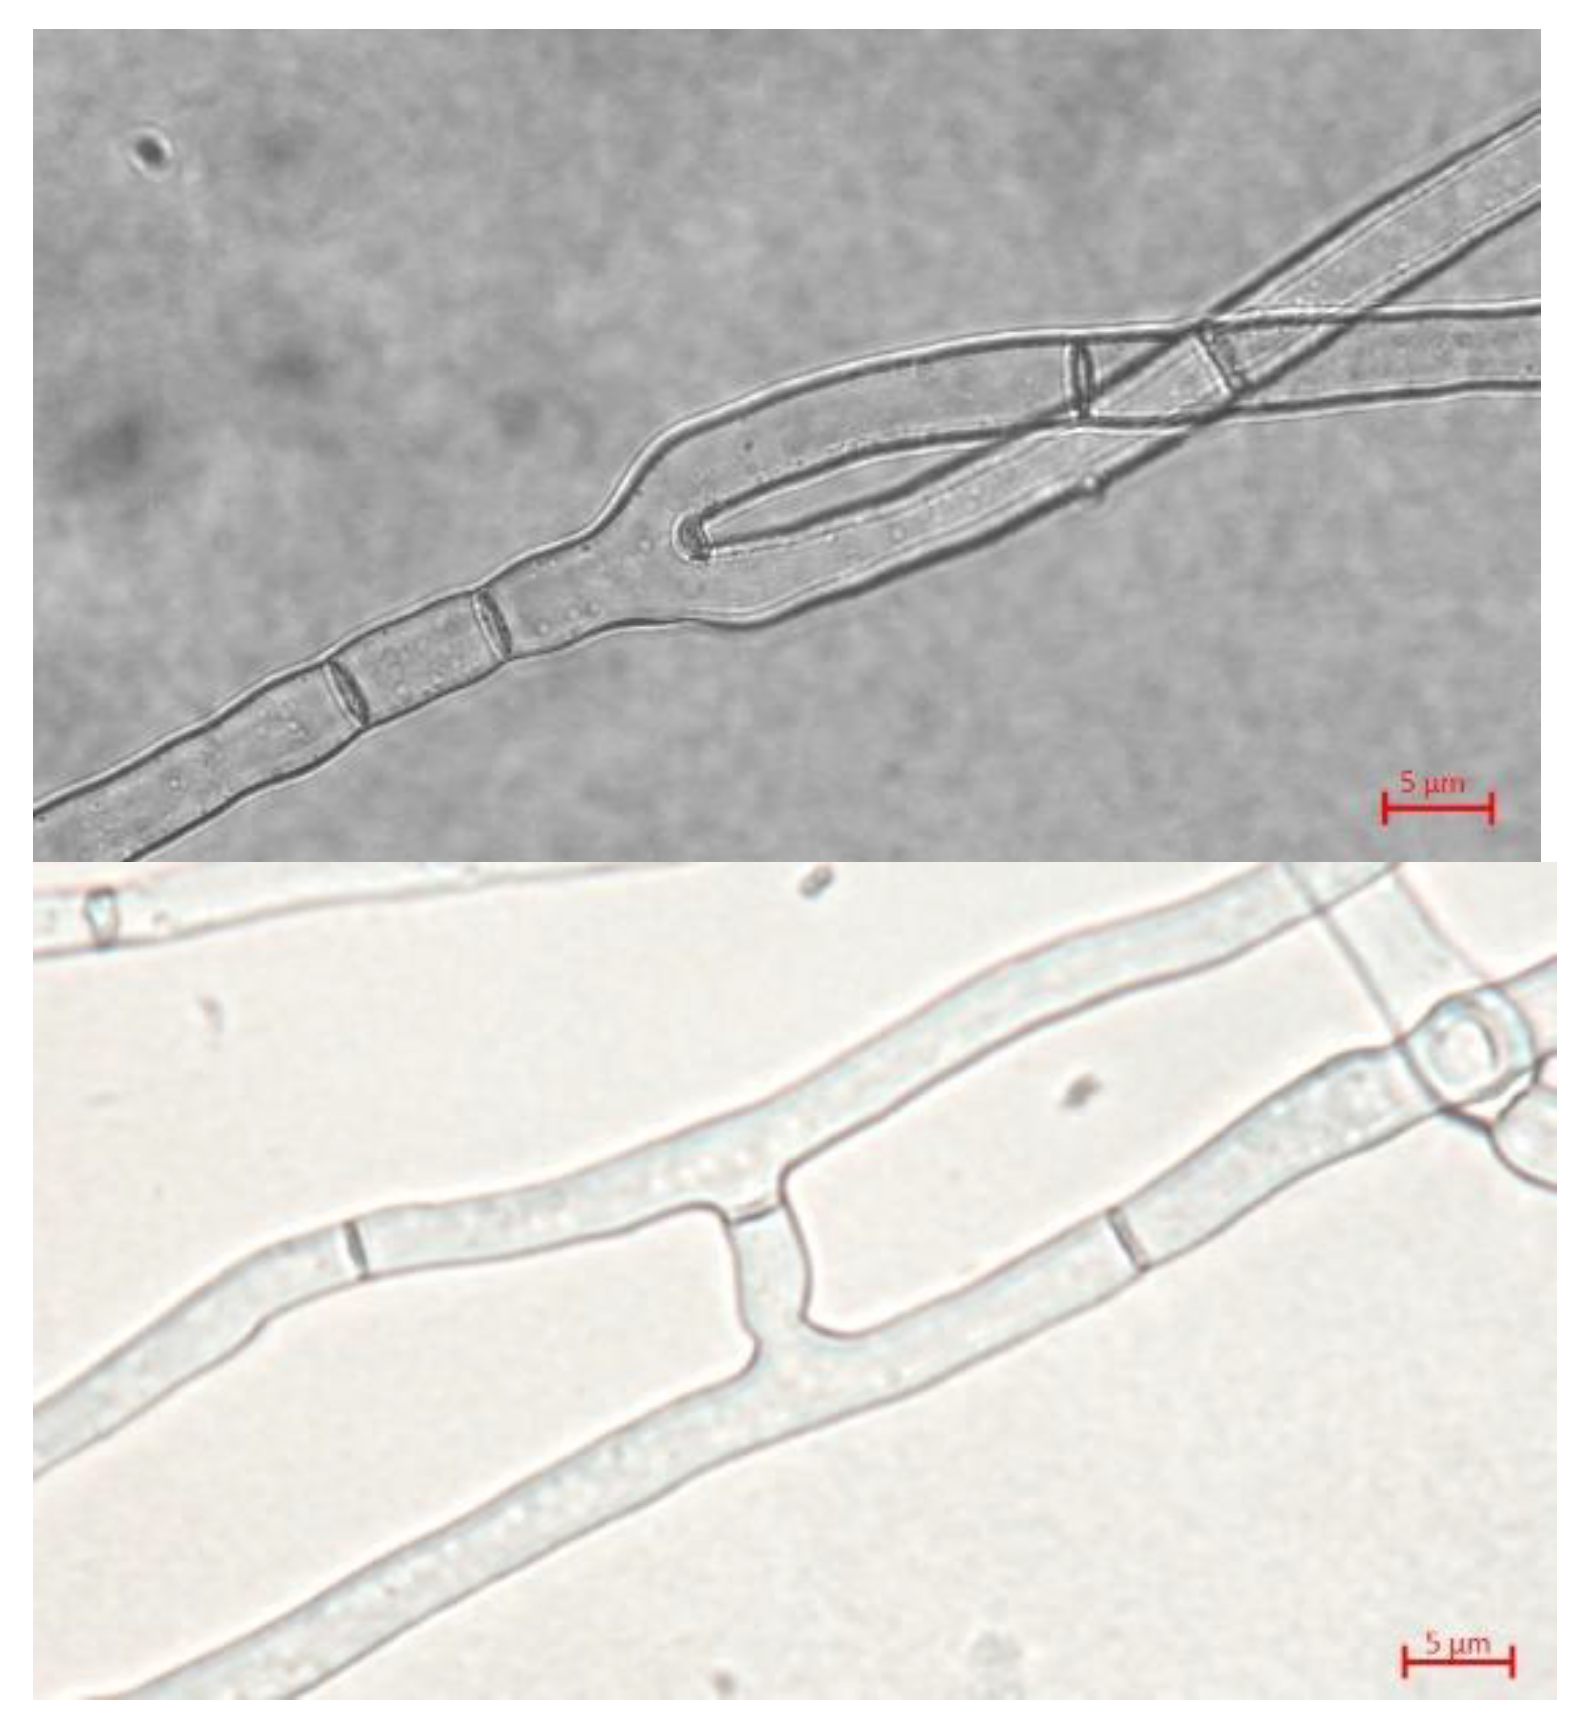
The mycelium growing on MPY formed white colonies with straight, septated, sparse hyaline hyphae (
Figure 1B). Branches and hyphae anastomoses were infrequently observed (
Figure 3). The morphological characteristics of the mycelia growing in the three culture media were similar. However, the cells of the mycelium growing on the maltose culture medium were larger, demonstrating that the nature of the culture medium can influence the morphogenesis of hyphae [
34]. No vesicles, which are typical features of Tuber spp. mycelia were observed in T. borchii SP1[
28,
35].
Submerged cultures of T. borchii SP1 were made using different media (WPG, MPY, and PDB) to select the conditions producing larger biomass. All cultures should be maintained static; growth was not observed under shaking conditions (200 rpm). Corroborating this information, Lacourt
et al. 2002 also performed their submerged cultures of T. borchii in static conditions [
7].
The culture broth supporting a higher biomass yield was MPY. In this culture medium, the hyphae showed the largest cell sizes under the microscope, and the transcription of some critical genes of the central metabolism also had values higher than in other culture conditions.
Amicucci
et al. 2010 [
36] found that the carbon source influenced the growth of T. borchii mycelium. They saw that the mycelium grew better in glucose while the hyphae were thinner and less branched in maltose or sucrose [
36]. Our results with T. borchii SP1 reflect the opposite, as the mycelium of T. borchii SP1 grew better in the presence of maltose than glucose.
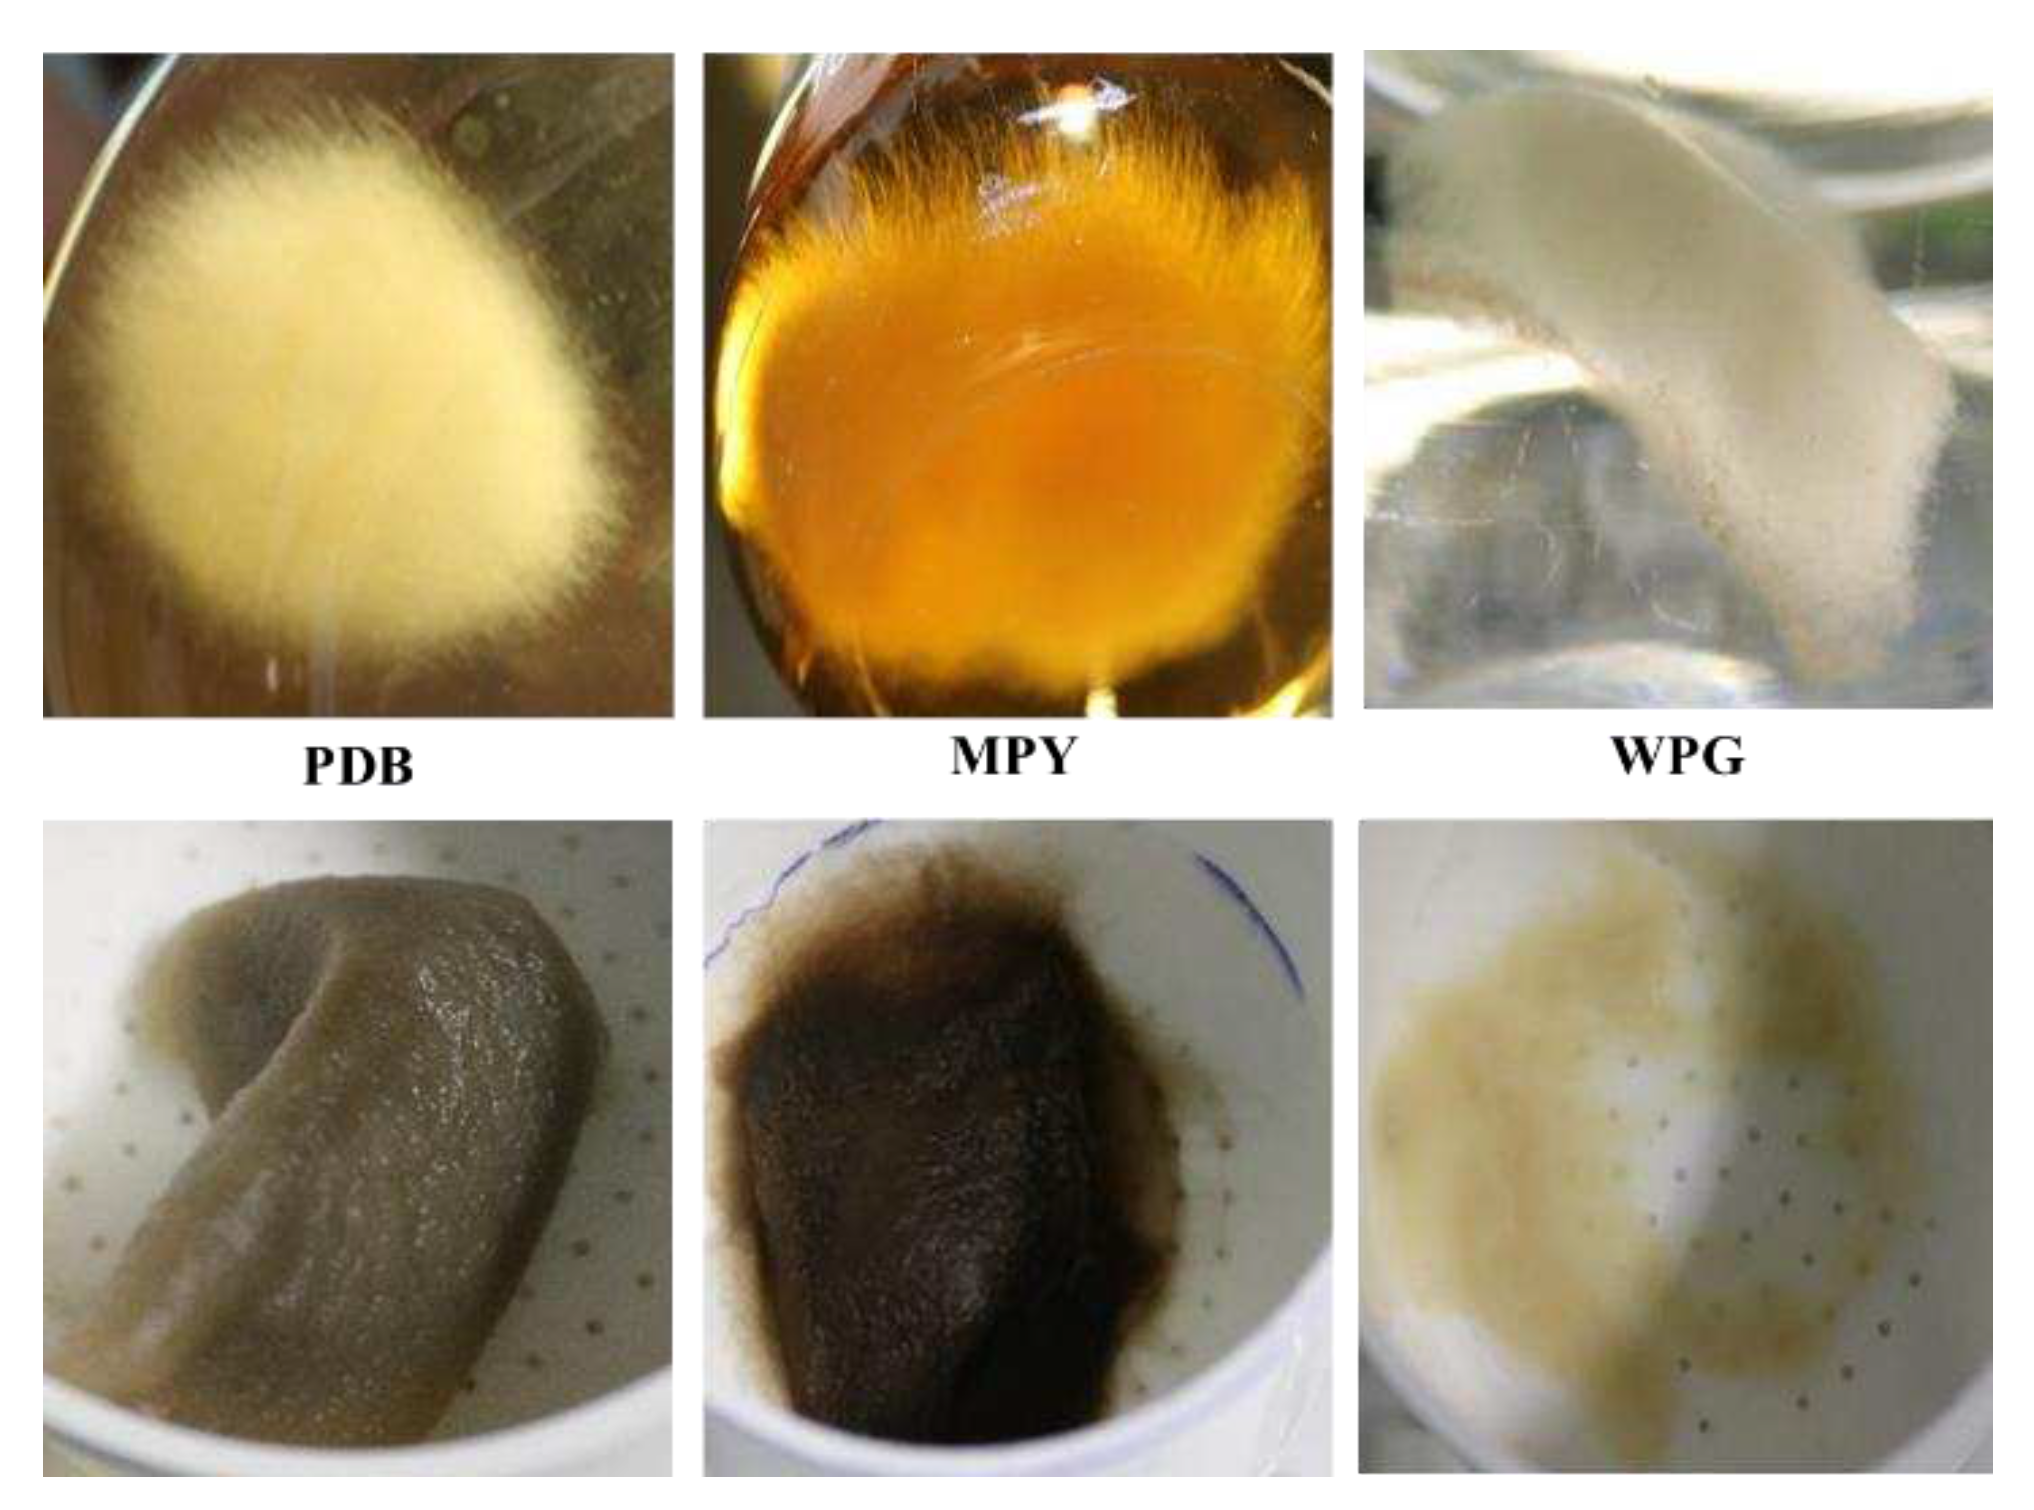
In all cases, the mycelium grew as a single pellet colony that occupied the culture flask. Even when different inoculation points were used to start the culture, the pellets merged into one. The pellet color depended on the culture medium (
Figure 3).
In some cases when the mycelia were collected by filtration, they turned brownish rapidly. This color change was more evident when it occurred in the cultures performed in MPY or PDB than in the cultures made using WPG. The brownish of the mycelium in these samples could be correlated with the slightly higher expression of genes in clusters of secondary metabolism in the cultures made in complex media.
In summary, a new strain of T. borchii that can be axenically cultured in maltose-containing plates and static-submerged cultures has been isolated. This strain can be maintained by subculturing indefinitely without signs of strain degeneration.
3.2. RNA-Seq and transcriptome analysis
The transcriptome analyses of the T. borchii SP1 strain described in this paper are preliminary and qualitative and do not pretend to be an exhaustive quantitative study since the difficulties in obtaining enough RNA material prevented making replicas of the different conditions studied. Our objective was to study the expression of different genes and gene families under different culture conditions and to identify common expression patterns that can be used as a reference for future comparative studies.
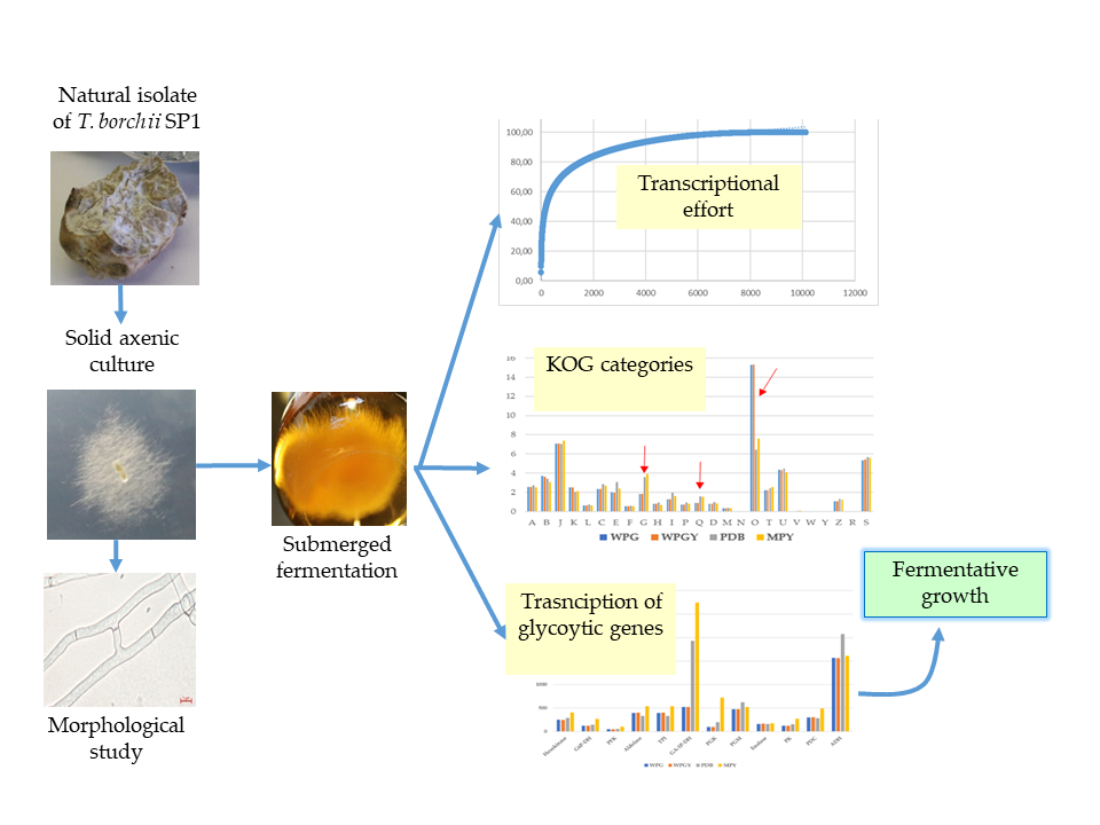
The transcriptomic profile of T. borchii SP1 growing in static liquid cultures of different media (PDB, MPY, WPGY, and WPG) was studied. The samples were harvested after either 64 (WPGY and WPG) or 85 days of culture (PDB and MPY). In the four media, expression of 10.1x10³ to 10.6x10³ gene models was detected and identified using the published T. borchii Tbo3840 genome as a reference. These values represent between 86.2 and 88.6% of the annotated genes.
The most expressed gene in the WPG and WPGY samples was ID990338, with an expression level representing 5.97 % of the transcription effort in these conditions. Surprisingly, the transcription level of this gene in the PDB and MPY samples was much lower and represented only 0.19 and 0.28% of the transcription effort, respectively, for these samples. Gene ID990338 codes presumably for an Hsp26/Hsp42 chaperone. This chaperone belongs to the family of the Hsp20 and is a small heat-shock protein that suppresses protein aggregation and protects against cell stress. Hsp20 has been reported to be absent in the T. melanosporum genome and other ascomycetes [
37]. However, the search for BlastP hits of this protein reveals its presence in T. brumale, T. aestivum, T. indicum, T. magnatum, and many other ascomycetes. This protein has been used to construct a temperature-tolerant strain of Lentinula edodes [
38] and found in tandem repeats in a temperature-adapted Coriolopsis trogii. The model identified in T. borchii corresponds to a secreted protein. Secreted heat shock proteins have been proposed to act as intercellular signals [
39]. Their function in Tuber is unknown, but it seems relevant in minimal media compared to complex media.
The most expressed gene in the PDB samples codes for a protein without an assigned function (ID1067414). The transcription effort of this gene in PBD is 2.10% and 1.37% in MPY. The gene coding for this protein is also among the most expressed in WPG and WPGY, representing 0.96 and 0.5 % of the gene expression and being among the 10 most expressed genes in these samples. This gene codes for a small (154 amino acids) presumably secreted protein. Proteins similar to this have been found in other ascomycetes (preferentially other Tuber) and some budding yeasts. It has a peculiar primary structure as it contains 14 Ser and 34 Thr residues.
Finally, the most expressed gene in MPY was ID957843, coding for the Glyceraldehyde 3-phosphate dehydrogenase (GA3PDH). The portion of the total transcription associated with this gene was 1.95, 1.36, 0.35, and 0.35% in the MPY, PDB, WPG, and WPGY samples., respectively. In the two samples derived from complex media (MPY and PDB), this gene was among the ten more expressed, whereas in the samples derived from minimal media (WPG and WPGY), the gene was among the 30 more expressed ones.
3.3. Comparison of the transcriptomes from the different culture media
The lack of technical replicas of the transcriptomes hampers the comparison between transcriptomes in this preliminary analysis. This lack is more relevant when studying the differences between samples but is more tolerable when stressing the similarities between the samples studied. Because of that, some rough qualitative comparisons under different culture conditions can be made. The correlation between the normalized expression values for all genes in all the pairwise combinations of conditions (
Supplementary Materials - Correlation coefficient) was studied. The correlation between the gene expression values when WPG and WPGY samples were compared was 99.6%, with R
2 being 0.996, thus indicating that both samples were virtually identical. No genes in this comparison fell outside the twofold limit established as a rough comparative criterion. This result suggests that the yeast extract in the WPGY medium did not induce significant gene expression changes in the samples. When all the other comparisons were made, the R
2 values were lower (between 0,64 and 0,70), appearing to be the most different sample, the one from the MPY culture. Only a few genes fell out of the twofold expression limits established for these comparisons, most without functional KOG annotation.
The WPG and WPGY samples showed a more similar transcriptome profile than the MPY and PDB samples. There are two possible explanations for this. The wood-plant-based culture media (WPG and WPGY) are synthetic culture media with glucose as the sole carbon source, whereas the PDB and MPY media are undefined culture media with complex carbon sources (maltose and potato dextrose). Furthermore, the WPG and WPGY samples were harvested after 65 days of culture, whereas the MPY and PDB samples were harvested on day 85.
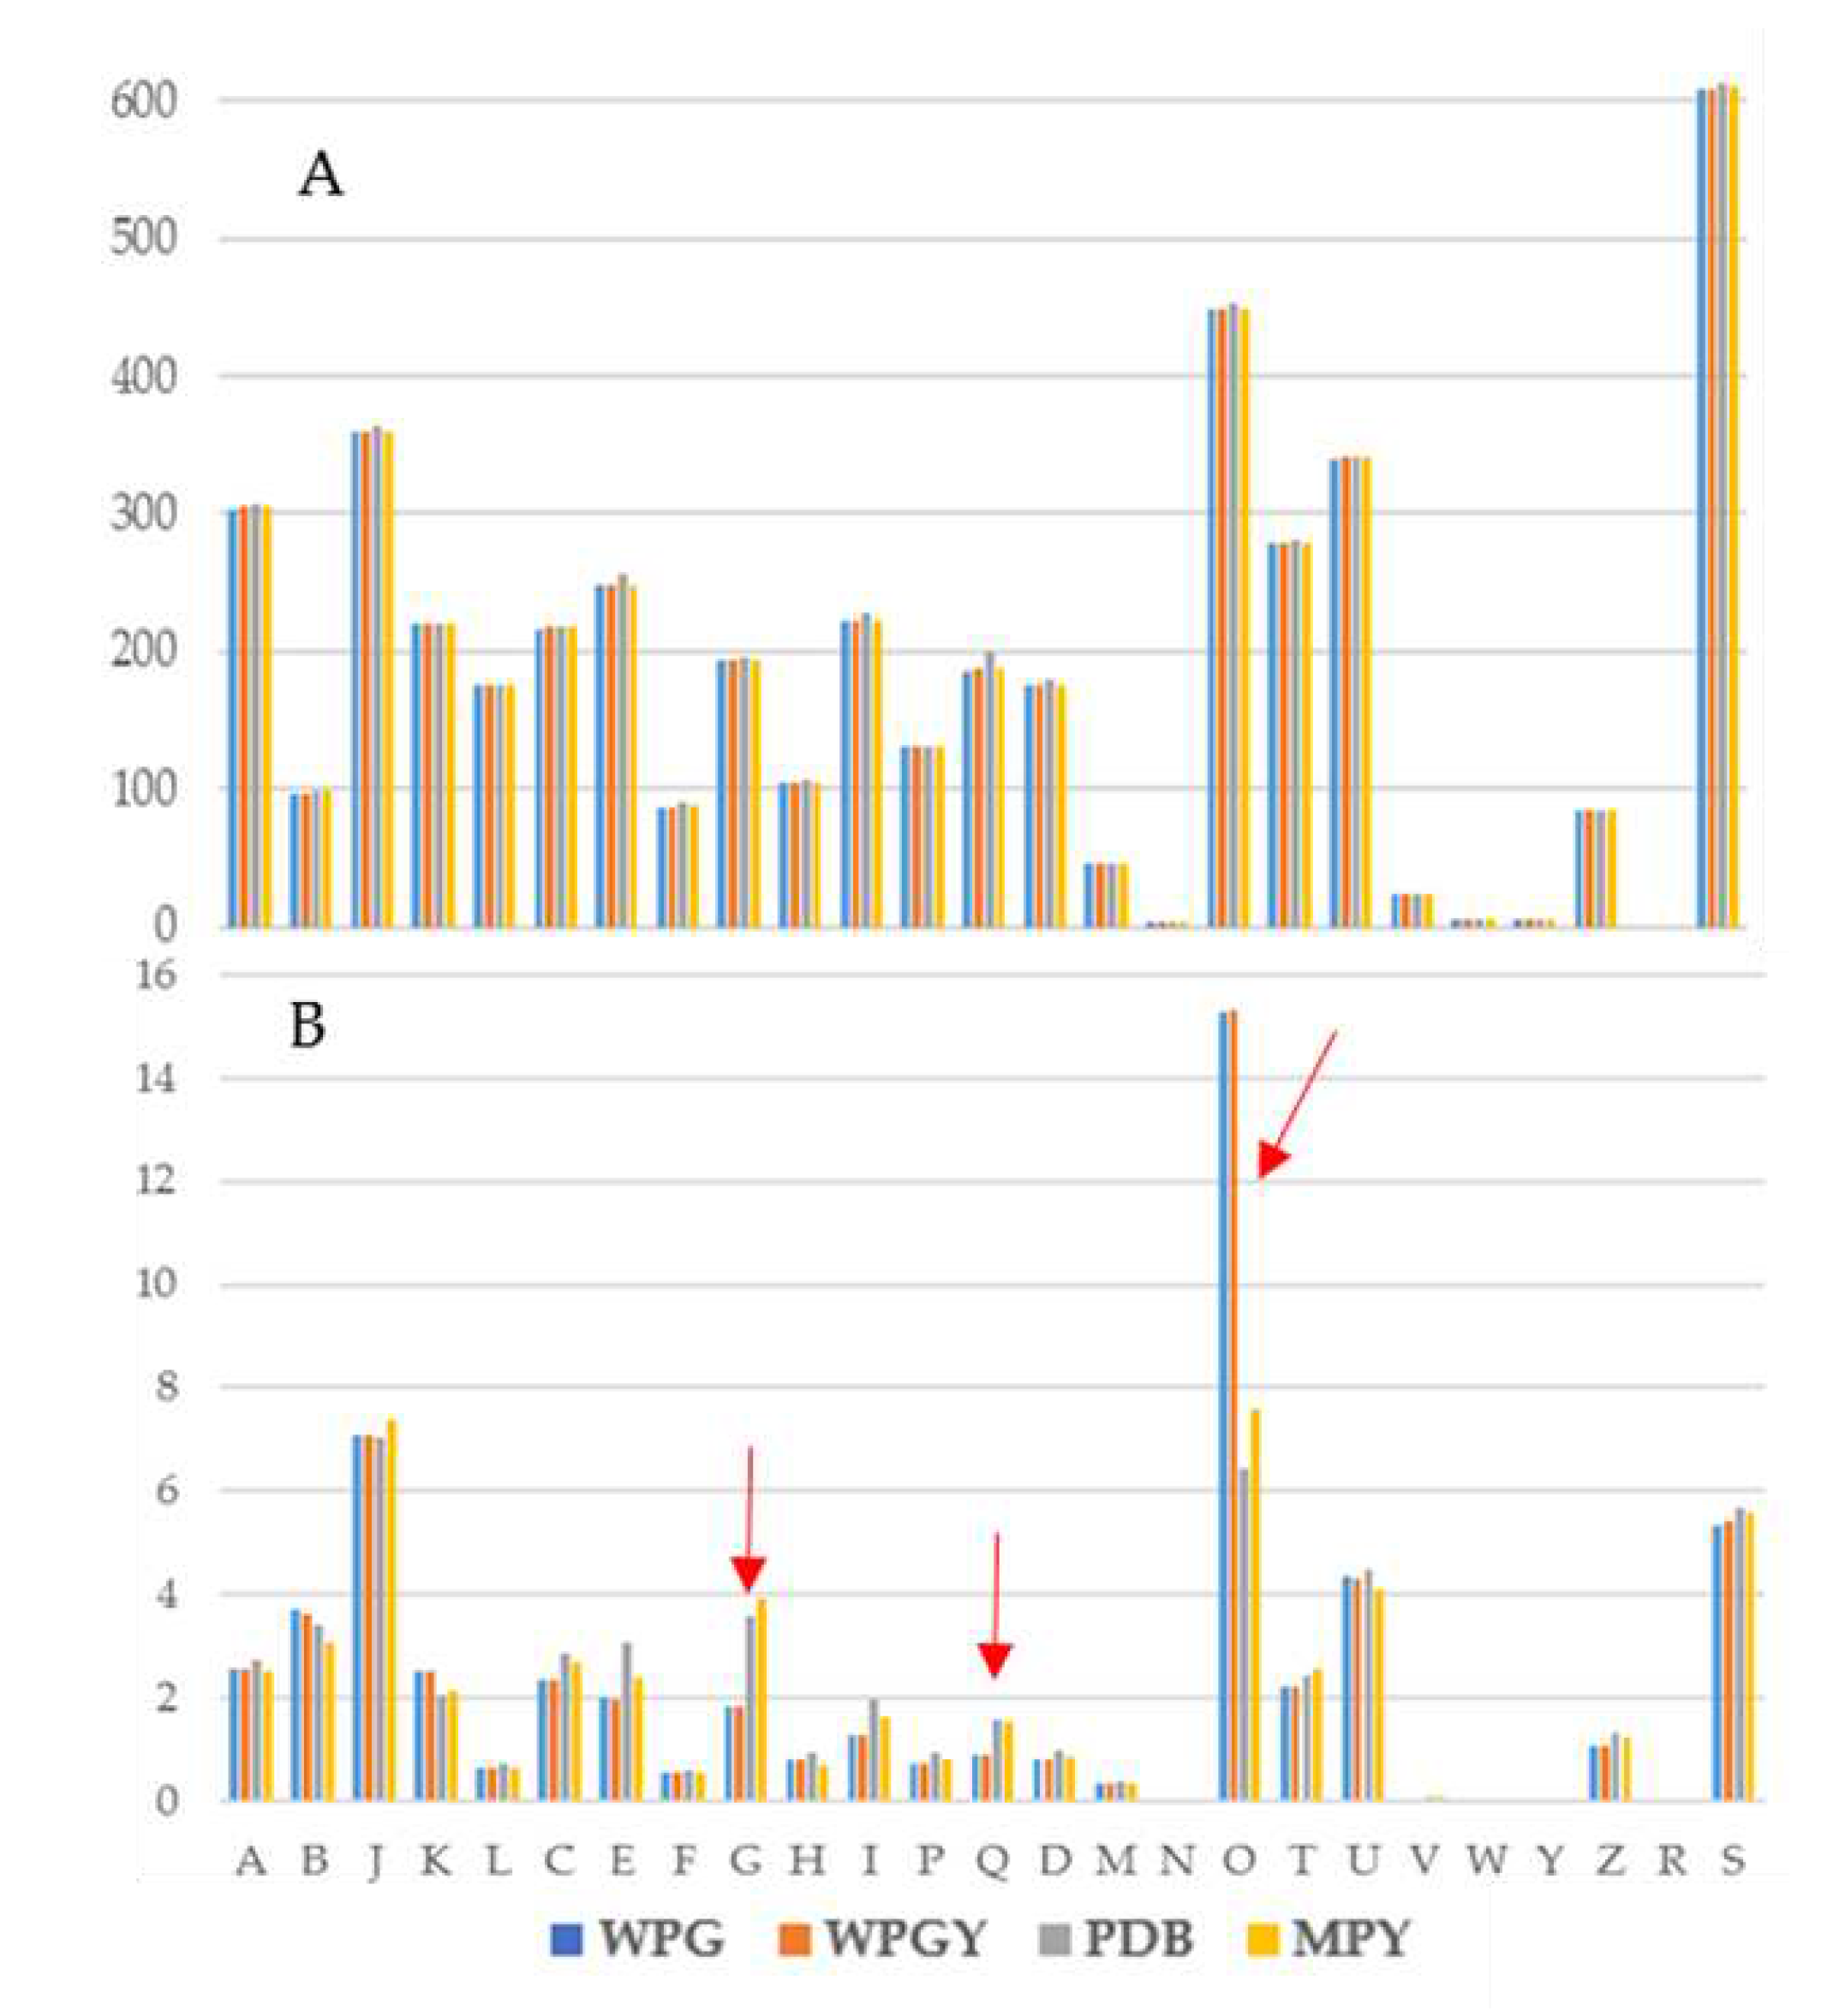
The transcription effort of the genes annotated within the O KOG category (posttranslational modification, protein turnover, and chaperones) in WPG and WPGY media was 15.27 and 15.30%, respectively, whereas in the PDB and MPY media was 6.43 and 7.61%, respectively. The importance of the transcription of gene ID990338 in WPG and WPGY has been described above. This gene codes for a chaperone belonging to KOG Class O, and its contribution to the effort of this class is around 6%. Putting aside the contribution of this gene to the complete transcription of class O, this class is still more transcribed in the minimal media (an effort close to 10%) than in the more complex media. Within the 20 most expressed genes in WPG and WPGY, three code for heat shock proteins (Hsp20 and Hsp70) and one for a Ubiquitin-like protein.
Concerning the genes belonging to the KOG class G (carbohydrate transport and metabolism), the observed enrichment in the expression of the genes involved in the carbon source processing can be a consequence of the complexity of these two media compared with the glucose used as the sole carbon source in WP-based broths.
Finally, the expression of genes classified in the KOG class Q seems higher in the MPY and PDB samples than in the WP-based ones. This category includes the genes involved in secondary metabolite synthesis. This result suggests that the mycelium cultivated in nutritionally richer broths can produce more secondary metabolites than in the basal WP medium.
3.4. Pathways of central metabolism
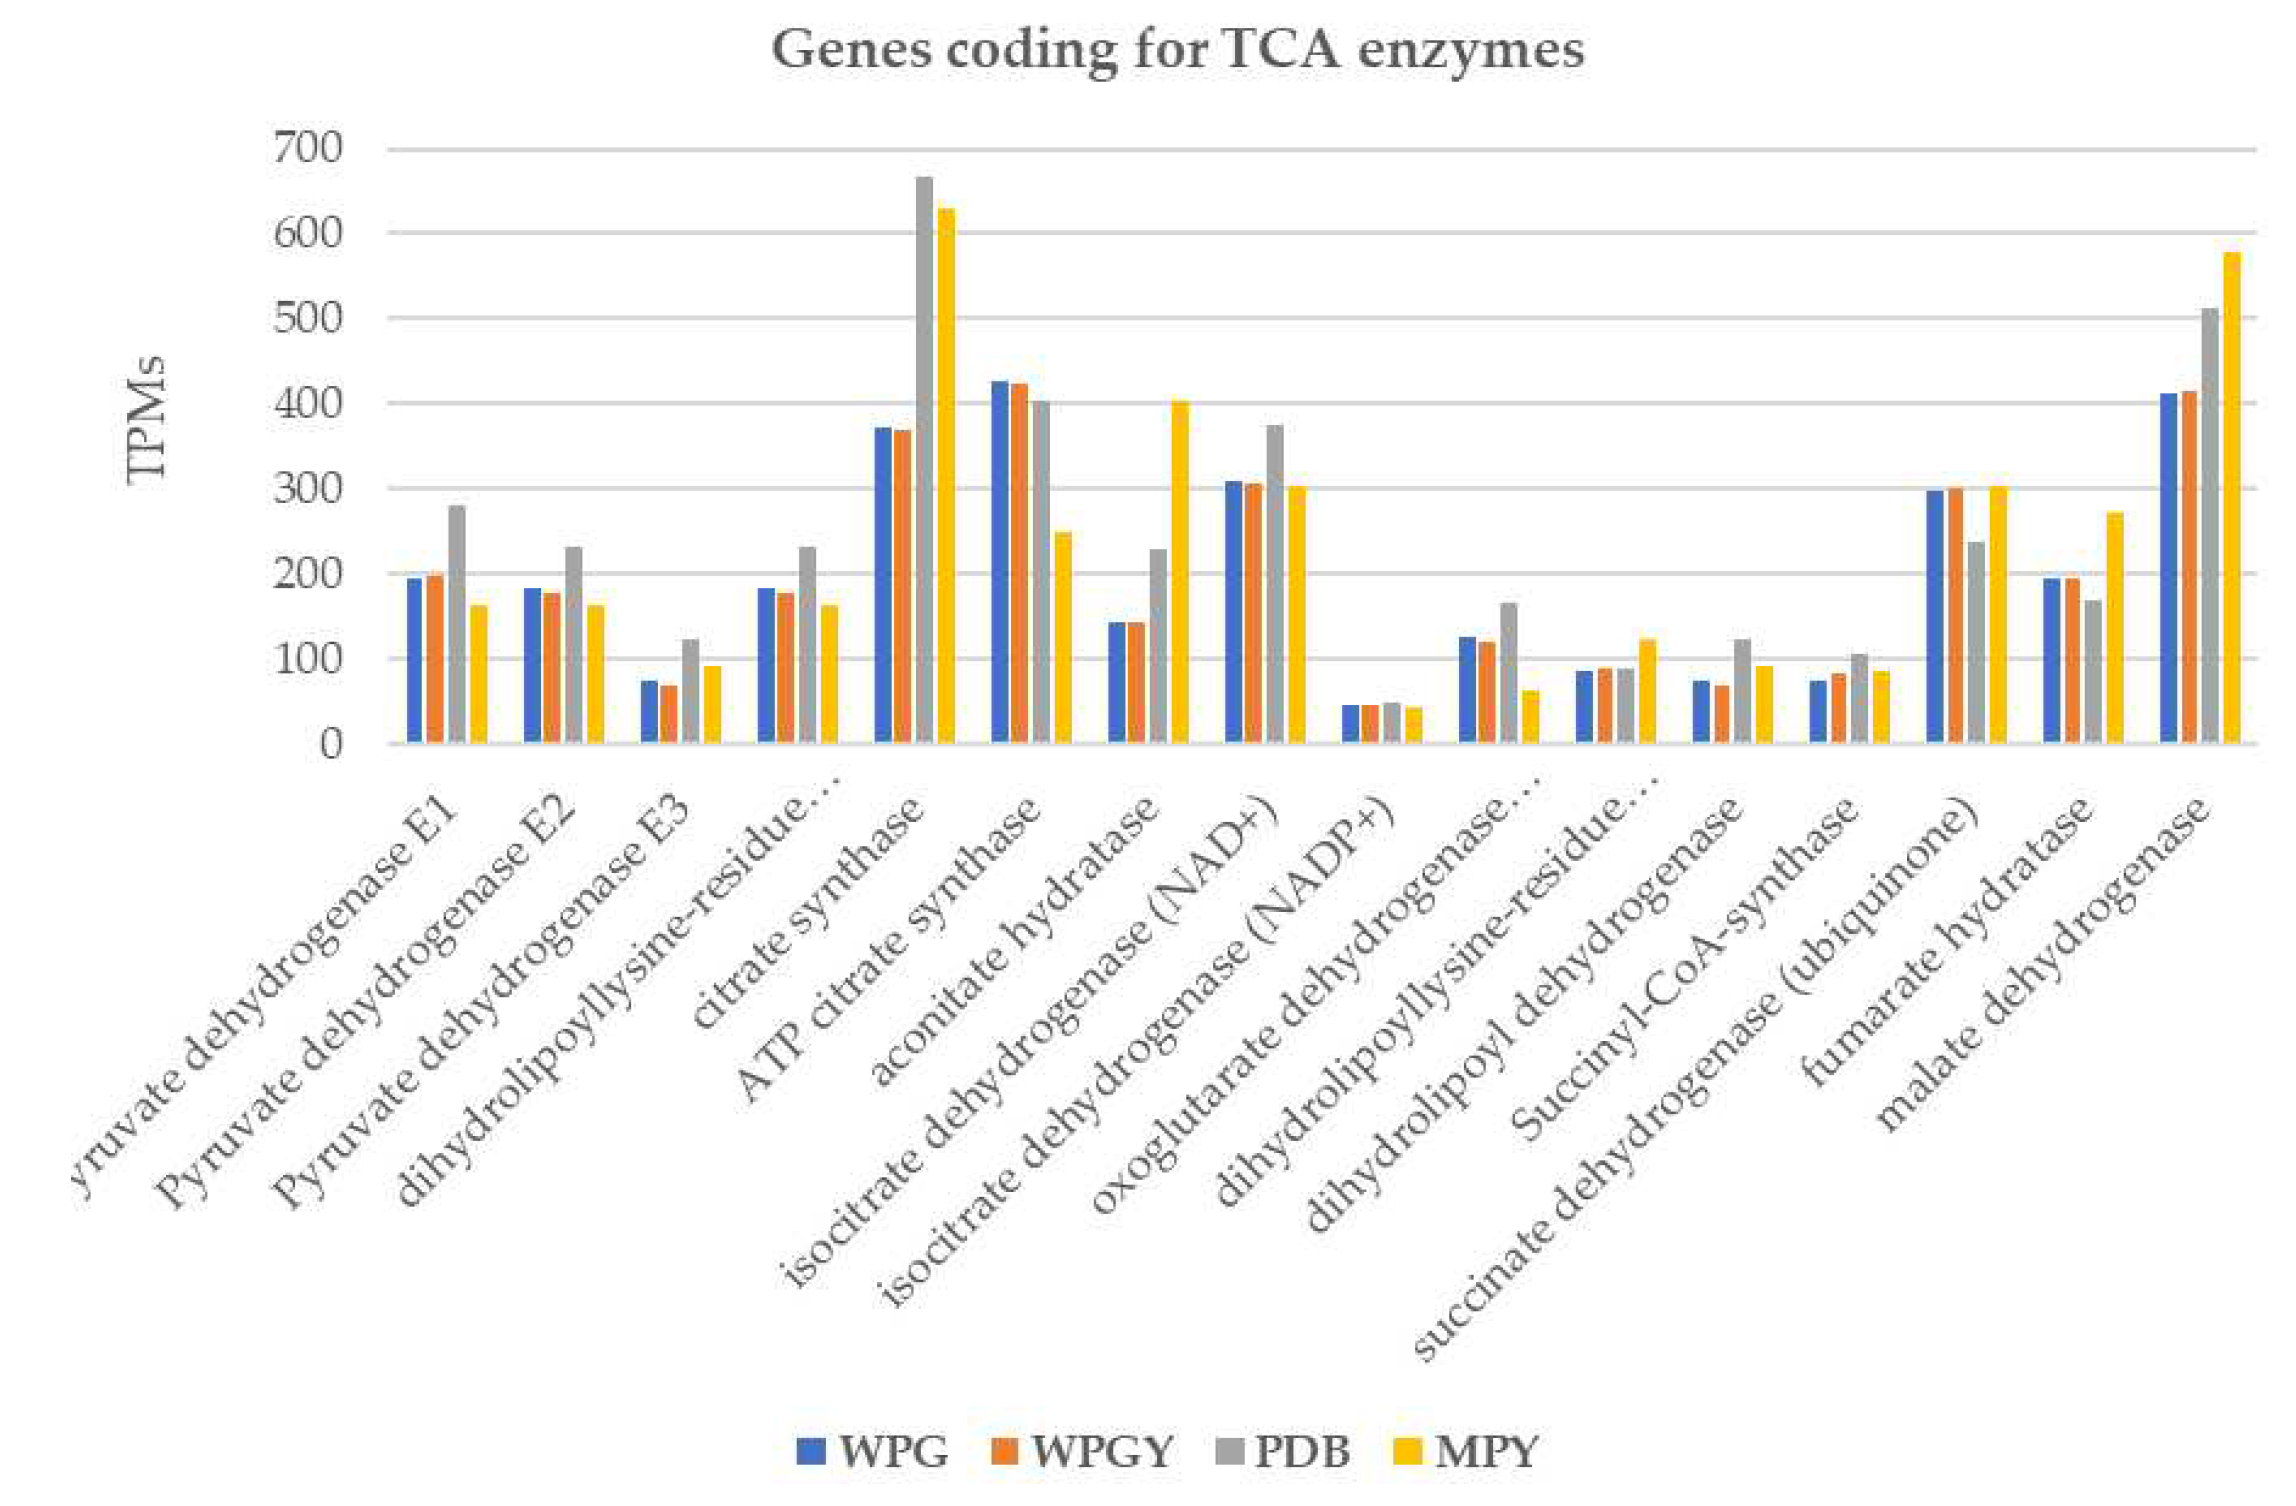
The NADH-dehydrogenase system is critical for regenerating the NAD
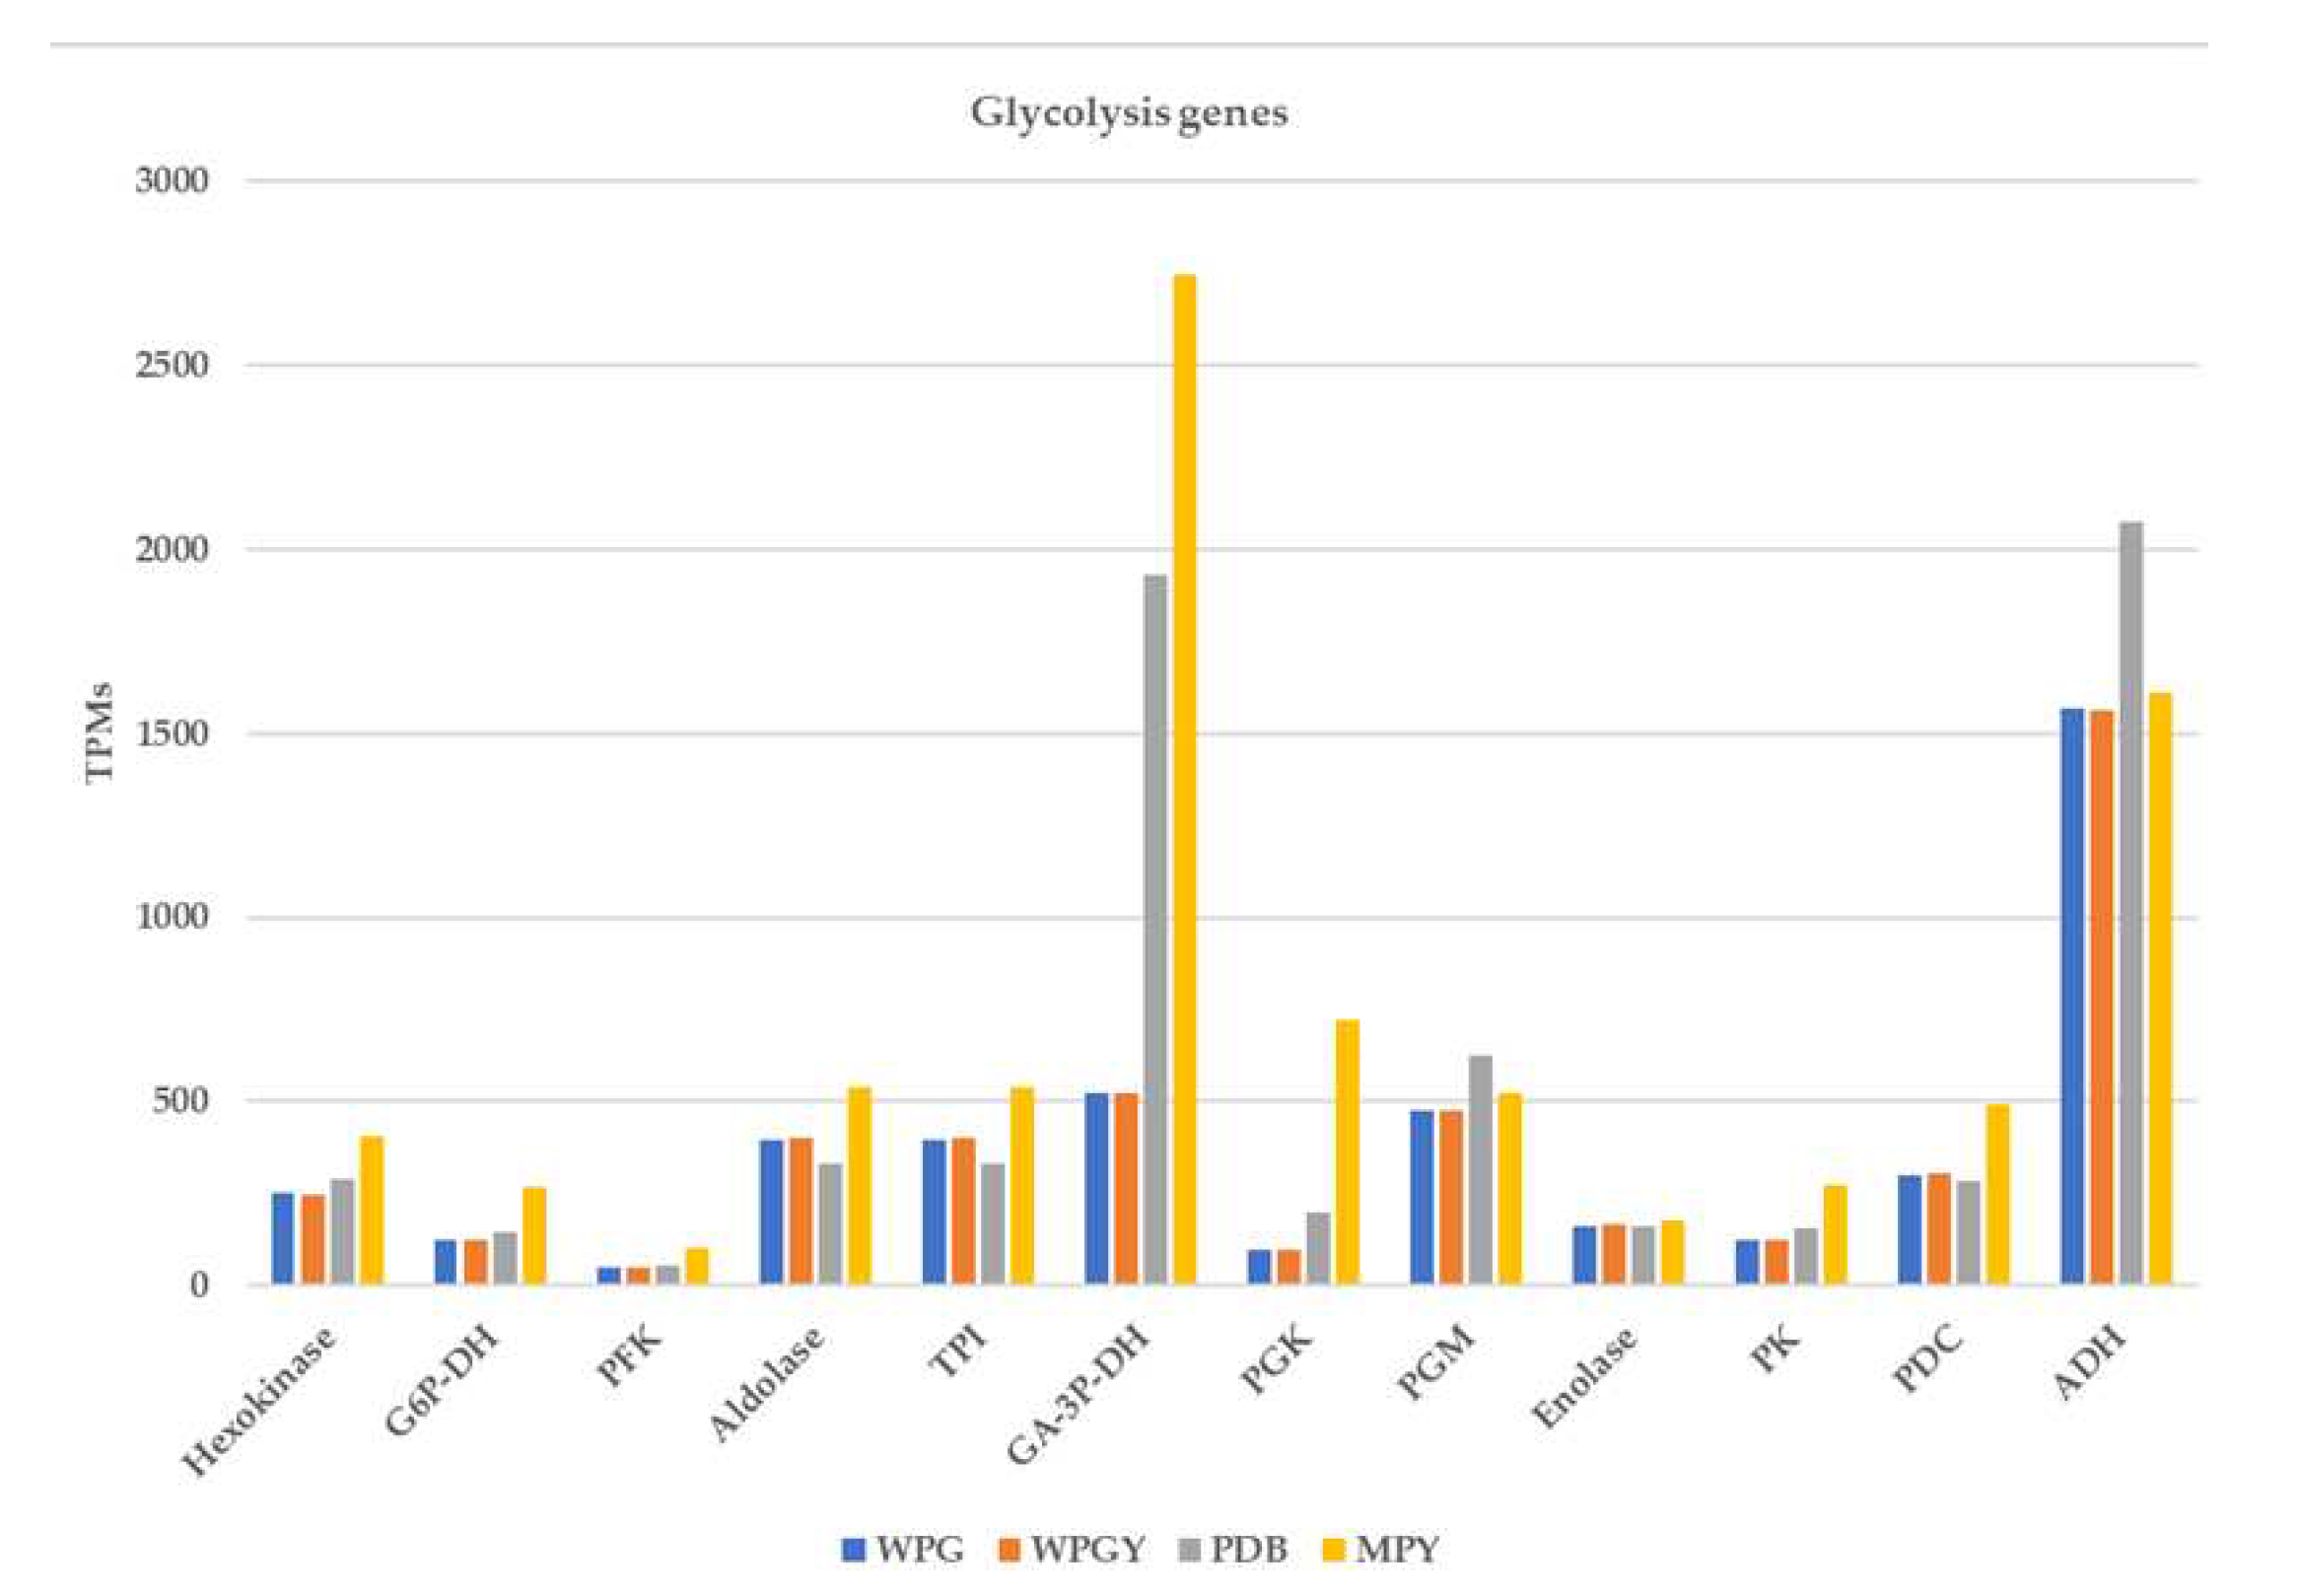
+ required for the glycolytic reactions. The combination of the low expression of the NADH-dehydrogenase system combined with the high expression levels of the alcohol dehydrogenase in the four media (see
Figure 6) suggests that this fungus displays a metabolism preferentially fermentative in these aerobic conditions. In yeasts, alcoholic fermentation is known as the Crabtree effect in aerobic conditions. This effect occurs by inhibiting the TCA and respiratory chain in conditions of high glucose concentration. The amount of glucose used in our system could be high enough to trigger this effect in T. borchii, preventing the accumulation of biomass in this way.
Besides the high level of ADH expression, the expression of GAPDH, PGK, and PK (responsible for phosphorylation at the substrate level) was also high, especially in the MPY culture medium. The high quantities of PGK and PK produce ATP in more significant amounts, which could justify the better mycelial performance in the culture MPY medium.
3.5. Genes involved in secondary metabolism – Clusters
Secondary metabolites are not produced in the rapid growth phase (trophophase) but rather during the later production phase (idiophase). Generally, the synthesis of these metabolites begins when a nutrient source is depleted, such as carbon or nitrogen [
40]. Although the transcriptomic analysis of this study was carried out with samples from days 65 and 85 of growth, it is possible that these periods were insufficient to produce and accumulate secondary metabolites.
Whereas the genes coding for enzymes involved in the central metabolic pathways are dispersed across the genome, those coding for enzymes participating in the secondary metabolism are arranged in biosynthetic clusters [
41]. Ascomycete genomes encode an average of ten non-ribosomal protein synthetases (NRPS), 16 polyketide synthetases (PKS), two tryptophan synthetases (TS), and two dimethylallyl tryptophan synthases (DMATS), per genome [
42]. The automatic annotation of the T. borchii genome used as a reference for this study, however, identifies seven clusters coding for highly conserved proteins: one non-ribosomal peptide synthetase (NRPS, containing proteins IDs 1077522, 1099828, and 1122331), one type I polyketide synthase (PKS, ID 962914), three NRPS-like (containing proteins IDs 1126844, 966209, 1119995, and 1032817) some of them with PKS domains, and two PKS-like (containing protein ID 1116892, and proteins 1121687, 970716, 1076327, and 970641). This number and distribution are also found in the genome of T. melanosporum. This reduced number of secondary metabolite clusters in the Tuber genomes could result from a miss-annotation of some of them in the highly complex genomes of these species.
The expression of the genes of the secondary metabolism clusters was low (lower than 50 TPMs in all the samples) except for two PKS genes in the PDB cultures that showed around 150 TPMs. Interstingly, the mycelium harvested under these conditions showed a more intense brownish that could correlate with the production of compounds that are easily oxidized upon removing the liquid culture medium.
3.6. Genes related to the synthesis of volatile compounds
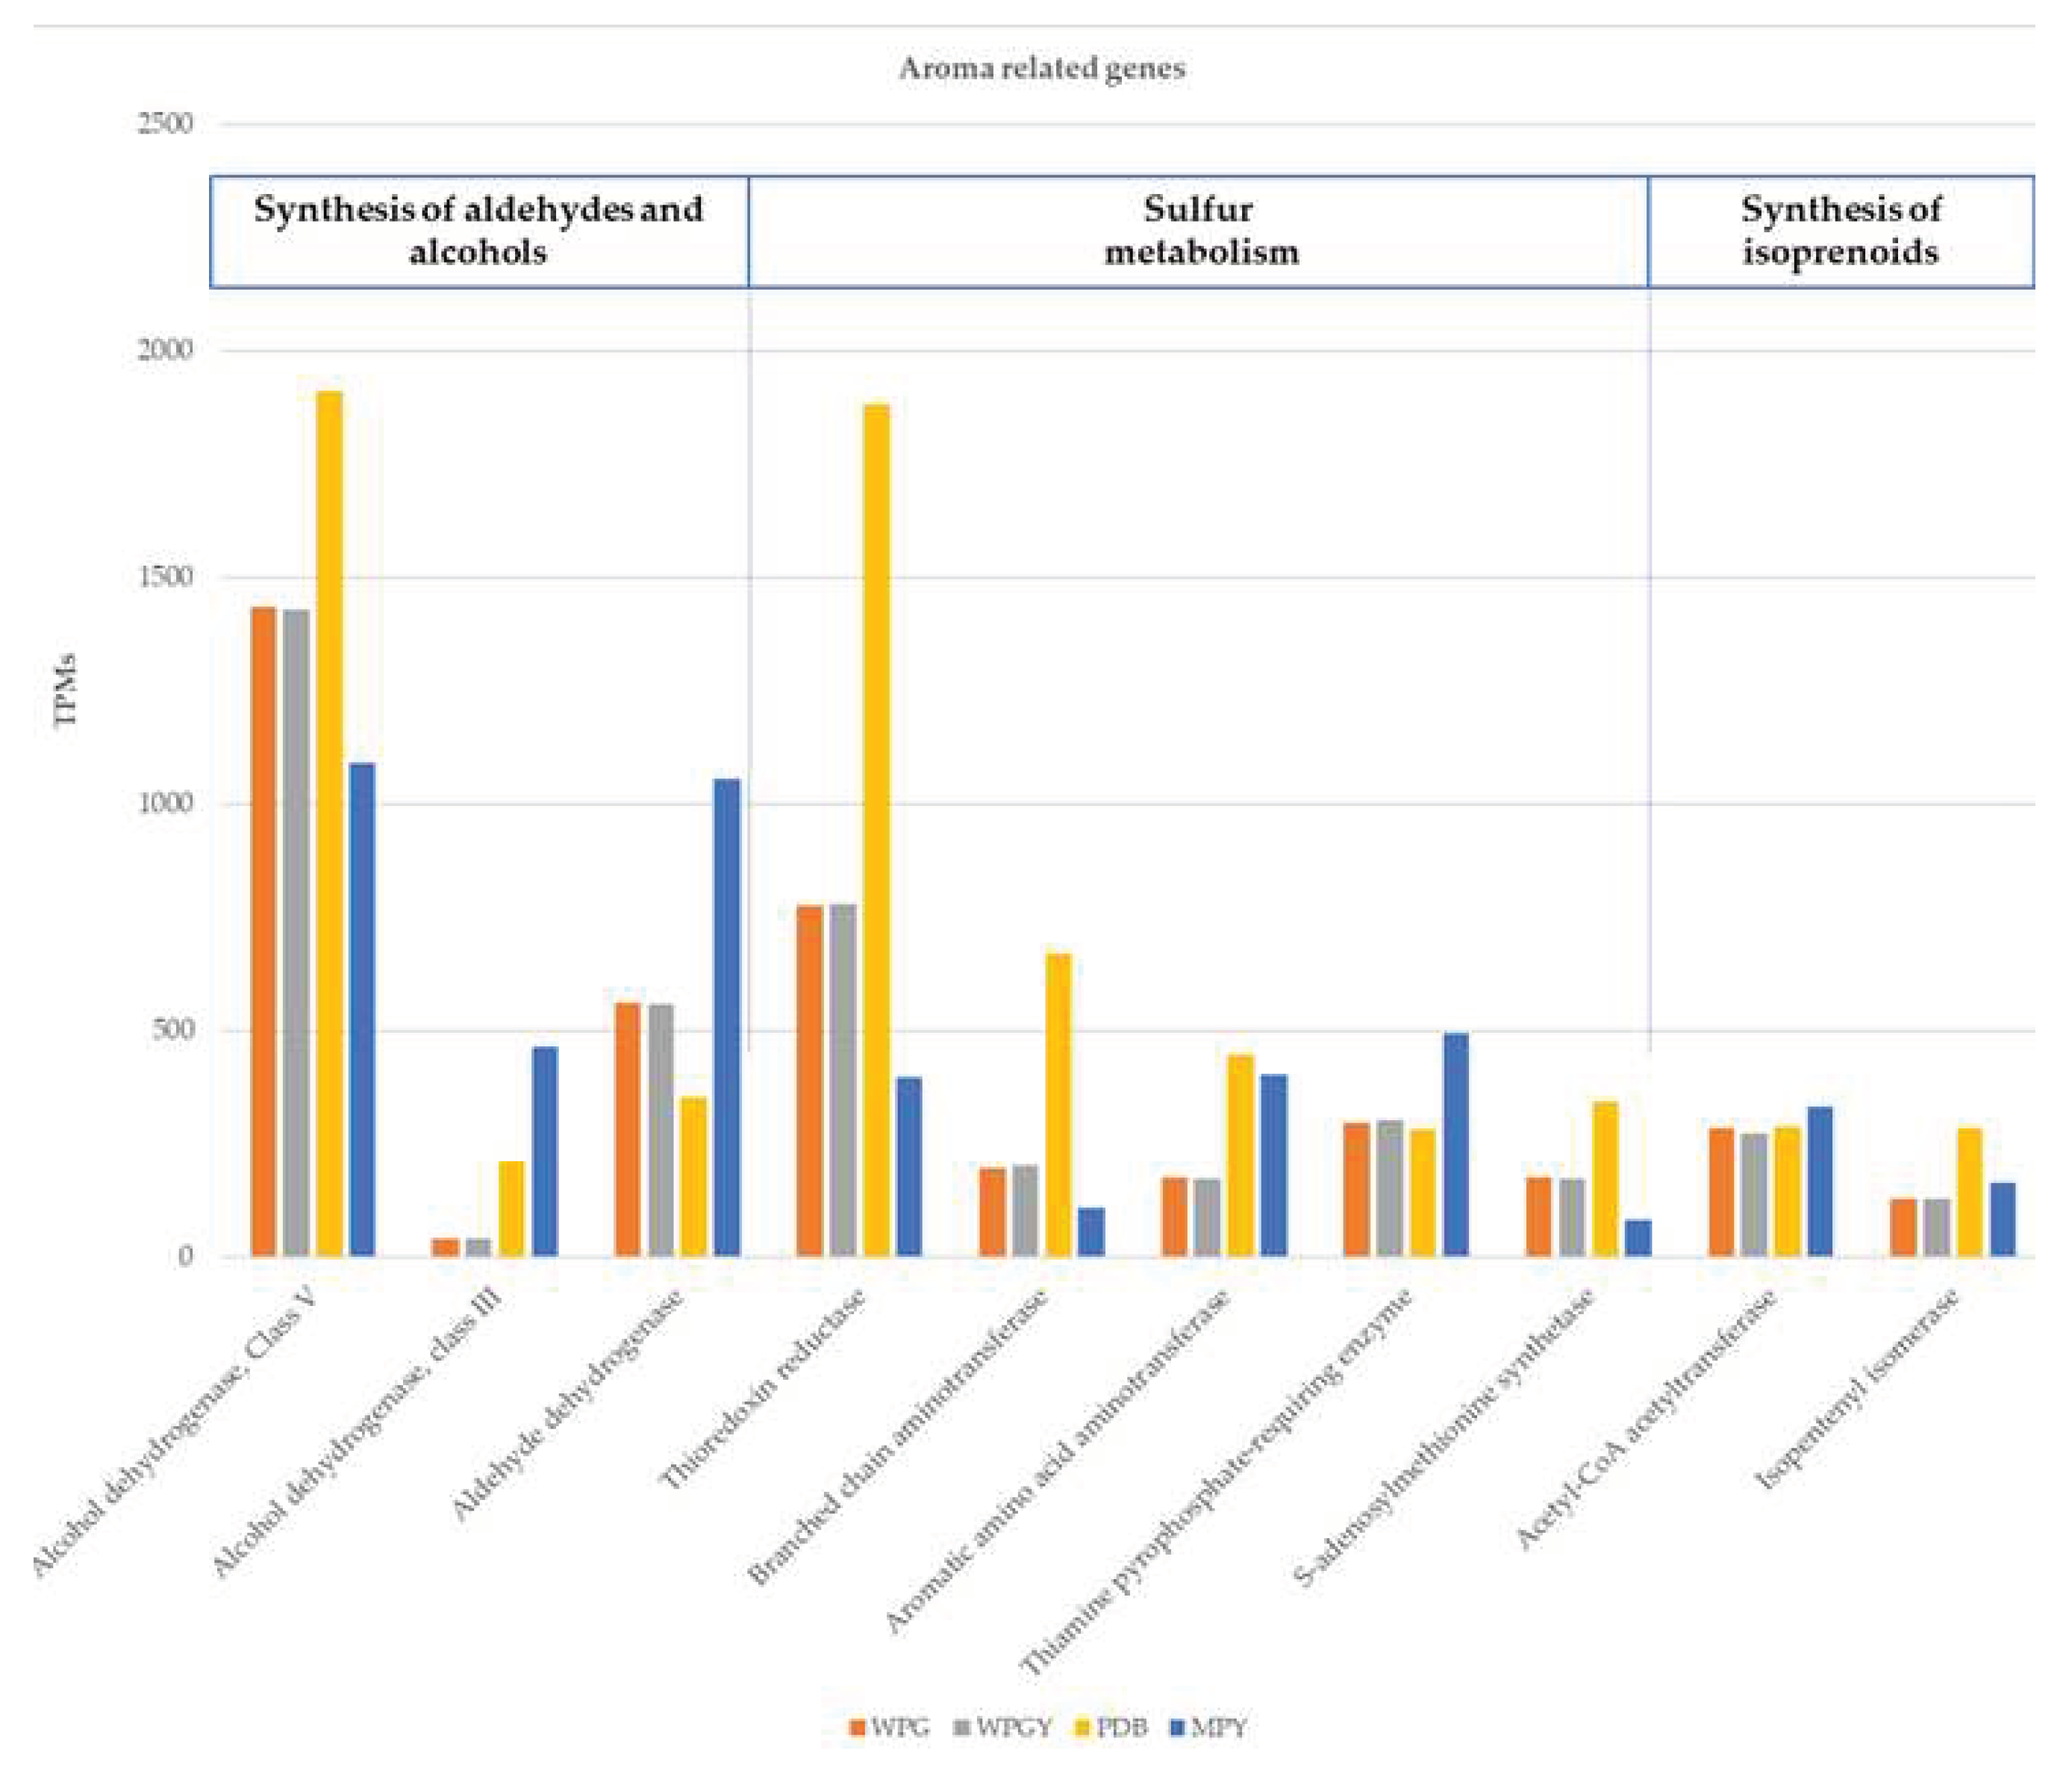
Regarding genes related to truffle aroma, it was observed that most of the analyzed genes were present and expressed in the samples. Upon analysis of the ten genes with the most significant expression, it was found that the gene expression was very similar in WPG and WPGY media, suggesting that adding yeast extract did not seem to influence the expression of these genes. It was verified that the PDB sample in some genes presented higher gene expression when compared to the other media. It was also observed that genes were expressed very differently between the different growing conditions. The gene corresponding to phosphoadenosine phosphosulfate reductase (thioredoxin reductase) was expressed almost five times more in PDB when compared to the MPY medium. The thioredoxin reductase was included in this group because it appears in the list of aroma-related genes published by Martin
et al. [
21]. The thioredoxin reductase also plays a role as an agent protecting the cell against the oxidative stress produced by ROS. As discussed above, the high expression of ADH and the low of the NADH-dehydrogenase genes suggest a fermentative metabolism for T. borchii under the culture conditions used. Fermentative metabolism and hypoxia conditions generate high levels of ROS. The data presented here suggest that the production of Thioredoxin-reductase could help prevent the detrimental effects of these toxic compounds.
4. Materials and Methods
4.1. Strain and culture conditions
Several truffles (T. borchii, T. aestivum, T. magnatum, T. melanosporum ) were obtained from local markets and collectors in different regions of Spain. The truffle surfaces were washed with soapy water (1:200 dilution), brushed to remove excess soil, and dried with absorbent filter paper. Then, the truffles were aseptically broken in two halves, and small pieces of the innermost part of the gleba were transferred to Petri dishes with different culture media supplemented with amoxicillin at 100 mg/mL to avoid bacterial contamination. All cultures were incubated at 22 ±1°C in the dark.
The cultivation process was performed in the following culture media: (i) Potato Dextrose Broth 20 g/L (PDB) (Scharlab) or Potato Dextrose Agar (PDA). (ii) Wood Plant (WP) medium (composition per liter: 0.2g KH
2PO
4, 0.1g CaCl
2•2H
2O, 0.3g MgSO
4•7H
2O, 0.9g K
2SO
4, 0.1g myoinositol, 2.3 g WoodPlant, 1 mL oligo-elements solution containing, per liter, 22.3 mg MnSO
4•H
2O, 0.014mg FeSO
4•7H
2O, 8.6 mg ZnSO
4•7H
2O, 0.25mg Na
2MoO
4•2H2O, 0.025mg CuSO
4•5H
2O) [
28] modified. The WP was occasionally supplemented with 20g/L Glucose (WPG), 20g/L glucose plus 5g/L yeast extract (WPGY), 20g/L Dextrose (WPD), 20g/L Dextrose plus 5g/L yeast extract (WPDY) or 20g/L Sucrose (WPS). (iii) Maltose medium (MPY) containing, per liter, 35g Maltose, 5g peptone, 5g yeast extract, 0.5g MgSO
4•7H
2O, 1g K
2SO
4, and 0.05 g myoinositol [
43] modified. The pH of all culture media was adjusted to 6.3 - 6.4 with NaOH. All liquid cultures were incubated in dark and static conditions at 22±1°C.
When needed, 7g/L Agar was added for solid cultures. Maltose and yeast extract were purchased from Scharlab, peptone from Panreac, WoodPlant from Merck, and Agar from Scharlab.
4.2. Growth rate
The linear growth rate was measured as follows: one plug (0.2 cm2) of actively growing mycelium was placed in the center of the Petri dish, and the linear growth of the colony’s edge was measured in the four perpendicular directions each week until the 35th day of growth. All plates were made in triplicate to calculate the mean growth rate values and standard deviation. ANOVA and Turkey were used to compare the variations between the means of the different groups.
4.3. Biomass
Three plugs (0.2 cm2) of actively growing mycelium from the outermost growth zone of a solid culture were used to inoculate 250 ml flasks containing 100 ml of medium. The flasks were grown at 22°C in dark and static conditions for 40 days. After 40 days, the mycelia were filtered through a micropore filter, weighed and dried at 50°C for 24 hours, and weighed again to obtain fresh and dry weight. The weight of the agar plugs was discounted. There were four replicates for each culture medium.
4.4. Molecular characterization
The mycelium was ground using liquid nitrogen. DNA extraction was performed using the commercial EZNA Fungal DNA Mini Kit (Promega Biotech) following the producer’s protocol. After checking the DNA concentration, a PCR was performed using sequences from the internal transcribed spacer (ITS) region, primers ITS4 5’-TCCTCCCGCTTATTGATA-3’, and ITS1F 5’-CTTGGTCATTTAGAGGAAGTAA-3’1. The PCR conditions were as follows: an initial denaturation step at 95°C for 5 min, followed by 29 cycles consisting of 1 min denaturation at 95ºC, 0.5 min annealing at 53ºC, and 1 min extension at 72ºC. After the last cycle, a 10 min final extension step at 72ºC was added to complete the reaction. The PCR products were sequenced, and the sequences were blasted against the NCBI database to identify the most similar entries. The ITS sequence was deposited in the GenBank NCBI database, with accession number OQ002403.
4.5. Morphology
Morphological data of the mycelium of T. borchii strain SP1 were studied under light microscopy in different culture media. Small pieces (1cm2) of mycelium were analyzed and collected from each Petri dish (three per substrate) after 40 days of mycelial growth. The following parameters were measured: thickness, branching angle, and distance between the septa of the hyphae grown in the different culture media. Photos were taken using a camera (ZEISS Axiocam 208 color/202) attached to the microscope and further processed using the program ZEN 2.3 - blue edition.
4.6. RNA seq
For the transcriptome analysis of the SP1 strain, axenic cultures of the mycelium were performed under different culture conditions. The mycelia were collected after 65 days in WPG and WPGYor 85 days in PDB and MPY of culture.
The mycelial samples were ground using liquid nitrogen and stored at -80°C for transcriptome analysis. A fungal RNA EZNA kit (Omega Bio-Tek, Norcross, GA, USA) was used to extract the total RNA. RNA quality was determined by electrophoresis on 1% (w/v) agarose gels. A Qubit® RNA Assay kit (Invitrogen, Life Technologies Corporation, USA) was used to measure RNA concentration. The mRNA libraries were built using TruSeq® RNA (Illumina, Inc., San Diego, CA, USA), following the manufacturer’s instructions. Sequencing was performed with an Illumina NovaSeq 6000 System (North Caroline genomic lab) using paired-end reads of 150 bp.
4.7. Transcriptome data analysis
The quality of mRNA-seq data was checked using FastQC [
44] and trimmed with Trimmomatic [
45] to remove reads and sequences containing adapters. The results of reads from all libraries were mapped to the T. borchii Tbo3840 reference genome obtained from the JGI Mycocosm platform [
24] using the STAR Galaxy Version 2.7.8 program [
46]. The feature Counts [
47] program was used to assign the mapped reads generated from RNA sequencing. KOG (EuKaryotic Orthologous Groups) and EggnogMapper [
48] were used for protein function annotation. The Kallisto program was used to normalize the read data, which generated values of TPMs that were transformed into RPMKs per gene [
49].
4.8. Analysis of metabolic pathways
The analysis of metabolic pathways, glycolysis, citrate cycle (TCA), glyoxylate cycle, and oxidative phosphorylation has been performed based on KEGG annotation of the T. borchii genome available in the mycocosm portal of the Joint Genome Institute. (
https://mycocosm.jgi.doe.gov/Tubbor1/Tubbor1.home.html).
Author Contributions
Conceptualization, E.C.T., L.R. and A.G.P.; methodology, E.C.T., M.A. and G.P.; formal analysis, E.C.T, M.A., A.Z., E.G. and G.P.; funding acquisition, L.R., H.S. and A.G.P.; project administration, H.S and A.G.P.; writing—original draft, E.C.T.; writing—review and editing, E.C.T., A.Z. and A.G.P. All authors have read and agreed to the published version of the manuscript.
Figure 1.
A. Fruiting bodies of the Tuber species used in this work. B, Mycelium growth of T. borchii SP1 after eight days of culture in WPS. The diameter of the colony in the picture was 2 cm. C. Linear growth of T. borchii SP1 in different culture media (*There is a statistically significant difference between MPY and PDA and WPGY p<0.05. ** There is no statistically significant difference between MPY and WPG, p>0.05).
Figure 2.
Vegetative mycelium of T. borchii SP1 was produced in submerged static cultures using PDB, MPY, and WPG (upper row) and the same mycelium after removal of the culture broth by filtration (lower row).
Figure 2.
Vegetative mycelium of T. borchii SP1 was produced in submerged static cultures using PDB, MPY, and WPG (upper row) and the same mycelium after removal of the culture broth by filtration (lower row).
Figure 3.
Representative hyphae of T. borchii after 40 days of growth (40X). Medium MPY (left) and WPG (right).
Figure 3.
Representative hyphae of T. borchii after 40 days of growth (40X). Medium MPY (left) and WPG (right).
Figure 4.
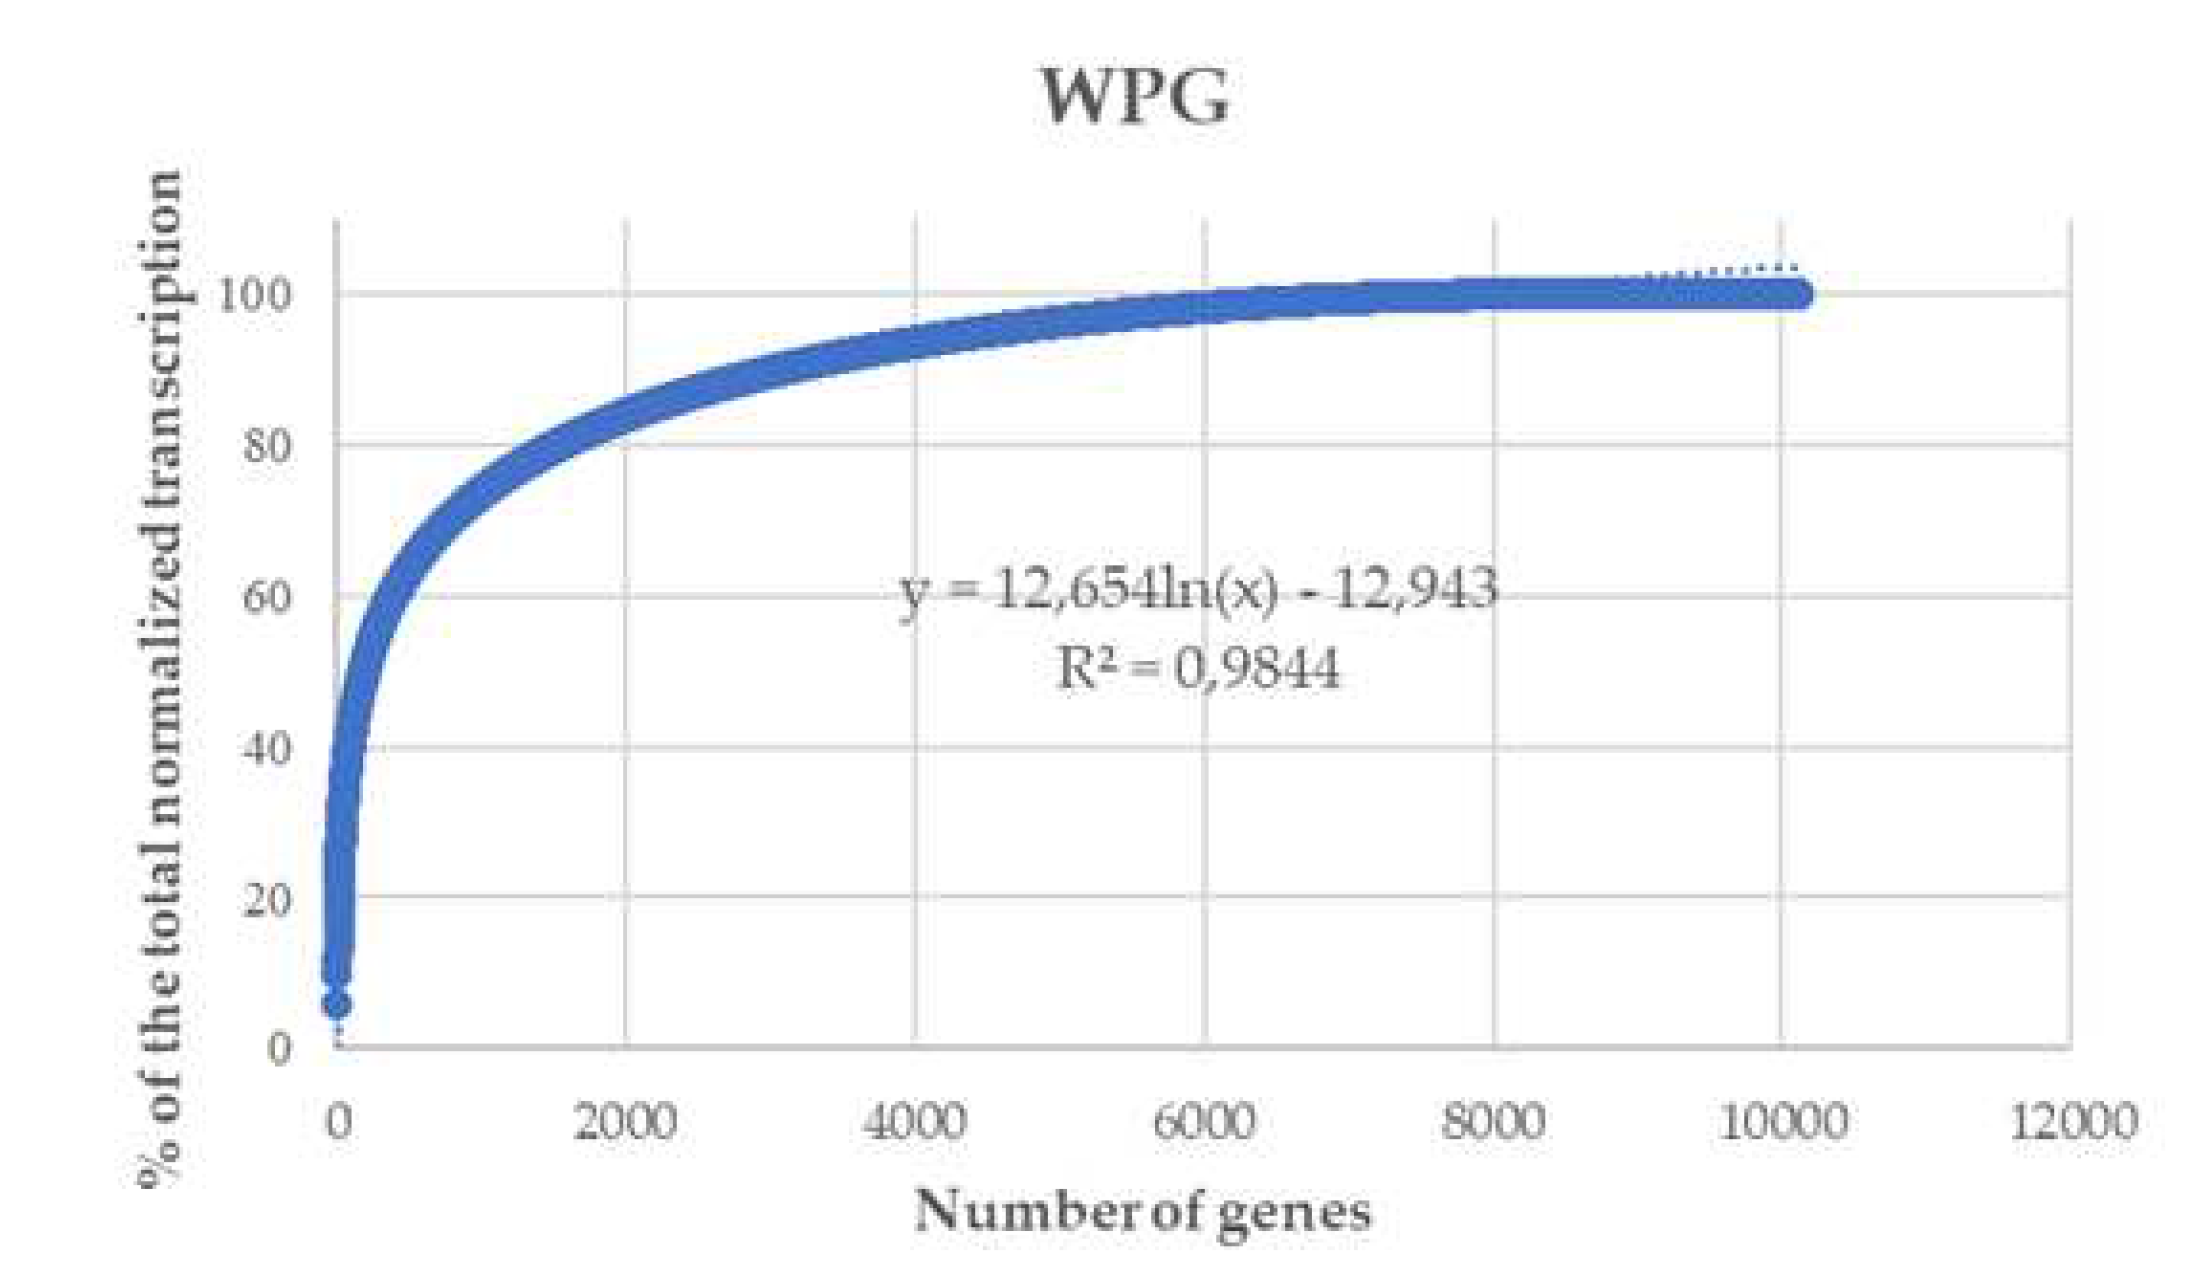
Cumulative gene expression in T. borchii SP1 cultivated in WPG. The genes were ordered by expression value, and the curve represents the cumulative expression of the transcriptome. Similar curves were obtained for the transcriptomes made in WPGY, PDB, and MPY.
Figure 4.
Cumulative gene expression in T. borchii SP1 cultivated in WPG. The genes were ordered by expression value, and the curve represents the cumulative expression of the transcriptome. Similar curves were obtained for the transcriptomes made in WPGY, PDB, and MPY.
Figure 5.
A. Number of genes in each KOG category in the four samples analyzed. B. Number of TPMs reads associated with each one of the KOG categories in the analyzed samples.
Figure 5.
A. Number of genes in each KOG category in the four samples analyzed. B. Number of TPMs reads associated with each one of the KOG categories in the analyzed samples.
Figure 6.
Transcription of the genes coding for glycolytic enzymes in the four culture media. The columns represent the addition of the transcription of all the genes annotated as coding for the same isozyme.
Figure 6.
Transcription of the genes coding for glycolytic enzymes in the four culture media. The columns represent the addition of the transcription of all the genes annotated as coding for the same isozyme.
Figure 7.
Transcription of the genes coding for enzymes of the citrate cycle in the four culture media. The columns represent the addition of the transcription of all the genes annotated as coding for the same isozyme.
Figure 7.
Transcription of the genes coding for enzymes of the citrate cycle in the four culture media. The columns represent the addition of the transcription of all the genes annotated as coding for the same isozyme.
Figure 8.
Genetic expression of the ten most expressed genes related to truffle aroma.
Figure 8.
Genetic expression of the ten most expressed genes related to truffle aroma.
Table 1.
Mean (four repetitions) and standard deviation of the fresh and dry weight of T. borchii SP1 mycelium after 40 days of submerged static growth in different liquid culture media.
Table 1.
Mean (four repetitions) and standard deviation of the fresh and dry weight of T. borchii SP1 mycelium after 40 days of submerged static growth in different liquid culture media.
| Culture medium |
Fresh weight (mg) |
Dry weight (mg) |
| WPG |
535±103 |
41±7 |
| PDB |
470±89 |
38±1 |
| MPY |
1600±270 |
127±22 |
Table 2.
Mean (four repetitions) and standard deviation of the fresh and dry weight of T. borchii SP1 mycelium after 40 days of submerged static growth in different liquid culture medium.
Table 2.
Mean (four repetitions) and standard deviation of the fresh and dry weight of T. borchii SP1 mycelium after 40 days of submerged static growth in different liquid culture medium.
| Sample |
Total reads |
RPKM |
Number of genes expressed (x103) |
% of annotated genes |
Genes KOG |
| WPG |
116,376,579 |
858,673.42 |
10.1 |
82.2 |
4,554 |
| WPGY |
125,457,058 |
848,604.73 |
10.1 |
82.2 |
4,654 |
| MPY |
47,969,567 |
803,655.02 |
10.2 |
82.9 |
4,568 |
| PDB |
157,335,190 |
803,793.44 |
10.6 |
86.2 |
4,620 |
| Genes in the reference genome |
12.3 |
100 |
5,686 |
Table 3.
Number of genes accounting for different percentages of total gene expression in the analyzed samples, and the number of them with a KOG annotation.
Table 3.
Number of genes accounting for different percentages of total gene expression in the analyzed samples, and the number of them with a KOG annotation.
| Sample |
10% |
25% |
50% |
75% |
| WPG |
3/1 |
18/9 |
185/108 |
1084/669 |
| WPGY |
3/1 |
19/9 |
186/108 |
1091/669 |
| PDB |
7/2 |
44/21 |
315/171 |
1392/847 |
| MPY |
8/2 |
43/18 |
271/144 |
1250/752 |
