1. Introduction
The last few decades have seen significant growth in construction of the urban rail transit, especially in the Southeast Coastal Area of China. Most of the newly built lines are underground lines with shield tunnel structures. Due to the combined action of geological, climatic, construction and operation factors, various types of defects occur on the surface of the shield tunnel, including water leakage, dislocation, spalling, cross-section deformation, etc., which can pose a significant impact on the tunnel structure and may compromise the operation safety of the subway. Therefore, it is necessary to regularly inspect the subway tunnel during the construction and operation periods to detect the potential defects at an early stage, whereby the proper measures can be employed to avoid further accidents. With the rapid development of subway construction, higher requirements are put forward for the efficiency and accuracy of tunnel inspection. However, the traditional manual inspection is labor- and time-consuming, and of low informationisation degree. To fill the gap in the detection techniques, extensive research has been carried out on the development of the automatic detection system. Driven by the different requirements of surface defect detection, a series of automatic detection systems have been proposed. The key detection methods include the vision-based detection method [
1,
2,
3], laser scanning-based detection method [
4,
5,
6], thermal imaging-based detection method [
7,
8], etc.
The principle of the vision-based measurement method is to calculate the geometric parameters of the measured object in three-dimensional space by using the captured images. With the wide application of image processing and machine vision technology, the research on surface defect detection for subway tunnel gradually turns to the anomaly identification by image processing. For instance, the high-resolution image information of the tunnel surface can be obtained at high speed through multiple area-scan CCD cameras, and the damage is identified and quantified using intelligent analysis methods [
9]. On the basis of image acquisition, some acquisition systems that can efficiently and accurately adapt to the actual condition of the subway tunnel have also been developed, such as the MTSIS system proposed by Ref. [
10] and the MTI-100 system developed by Ref. [
11]. In terms of image data processing, the deep learning techniques are frequently applied to identify the surface defects [
12], including full convolutional neural network (FCN) [
13,
14] and Mask R-CNN network (R-CNN) [
15,
16]. However, to overcome the dim condition in subway tunnel, the lighting devices are needed, which requires a lot of manpower to conduct the test. Laser scanning-based method can quickly obtain the three-dimensional coordinates and reflection intensity of a large number of measuring points on the lining surface by laser ranging without light source. It can assess the condition of the tunnel lining structure through the three-dimensional modeling of the tunnel. It is widely used in the detection of various surface defects, such as spalling defect [
17], water leakage defect [
18] and deformation [
19]. The principle of the thermal imaging-based method is to convert the temperature distribution of the tunnel lining surface into a visual image through an infrared thermal imager, which can reflect some of the leakage and cavity areas on the shield tunnel. For instance, Ref. [
20] successfully locate the leakage area by analysing the temperature gradient; Ref. [
21] proposes a novel method for identifying and extracting cracks of tunnel lining from the infrared images; Ref. [
22] verifies the feasibility of using thermal imaging technology to detect the cavity behind the lining through a series of laboratory and field tests. However, because the thermal imager is sensitive to temperature changes, and the auxiliary trackside facilities in the subway tunnel can significantly influence the detection accuracy, this method is rarely adopted in practical detection projects.
In comparison, the laser scanning technique can acquire a large volume of data with strong data compatibility, and offer three-dimensional coordinate information and reflection intensity information of measuring points. So it can be used to detect the multiple surface defect on subway tunnel. With the recognition of this, this research uses three-dimensional laser scanning technology to detect and identify various surface defects of shield tunnel.
With the detection results of multiple defects, the association rules between them can be studied to reveal the root cause of some critical defects, such as water leakage. Note that the research on the association rules between different defects is scare at present, compared with the research on the identification method of a specific defect. In view of this problem, this paper analyses the association rule between different surface defects based on Apriori algorithm. Nine sets of association rules are set up, and their confidence values are calculated respectively, whereby the correlation between various defects are revealed.
The rest of this paper is outlined as follows. The laser scanning-based surface defect detection system for shield tunnel as well as the data processing method for identifying multiple defects is presented in
Section 2.
Section 3 performs the association analysis for different surface defects based on Apriori algorithm. Finally, some conclusions are drawn in
Section 4.
2. Data Acquisition and Processing
2.1. Types of surface defects on shield tunnel
According to the field investigation on subway lines, the main surface defects can be classified into three categories: water leakage, structural damage (including lining cracks and spalling), and structural deformation (including tunnel settlement, section convergence and dislocation). This paper mainly studies leakage, dislocation, spalling and cross-section deformation.
Water leakage is a common defect of shield subway tunnel, it refers to that the material of the tunnel is infiltrated by water due to structural defects, or geological and climatic reasons. Segment dislocation refers to the relative displacement of adjacent rings in the plane perpendicular to the tunnel axis, or the relative displacement of adjacent segments in the radial direction. Spalling is another common tunnel defect. The main causes of spalling include material deterioration during the long-term operation and the concrete material quality does not meet the standard. Cross-section deformation is generated from the change of external load or soil erosion which can cause the change and redistribution of soil stress field, thus affecting the stability of the soil layer around the tunnel. Consequently, the cross-section deformation occurs.
2.2. Testing technology and equipment
As aforementioned, compared with the vision-based detection method which requires high lighting conditions, the laser scanning-based technology becomes more favourable under the test condition in subway tunnel. The laser scanning system can accurately detect the deformation in the subway tunnel and acquire point cloud data. The efficiency of data acquisition is high but due to the huge amount of point cloud data, a proper data processing algorithm is needed.
It should be note that the narrow window time the subway for tunnel inspection, i.e., 1:00 am - 4:00 am. Under such situation, the three-dimensional laser scanning technology, characterised by fast data acquisition speed, high accuracy and needing less manpower, is used to form a tunnel inspection trolley (TIT). The basic principle of system is to use laser ranging to measure the distance between the scanner and the measured point according to the round-trip time of the laser and the speed and angle of the laser. The laser emitter rapidly measures the scene information inside the tunnel through high-speed rotation, and stores the information in the point cloud. The point cloud data include both the coordinate information inside the tunnel and the intensity of the point cloud. In the defective area on the tunnel surface, the intensity information of the point cloud will be significantly lower than that of the surrounding area. So the intensity can be used as a feature to identify and the defective area which can be further located by combining the coordinate information of the point cloud.
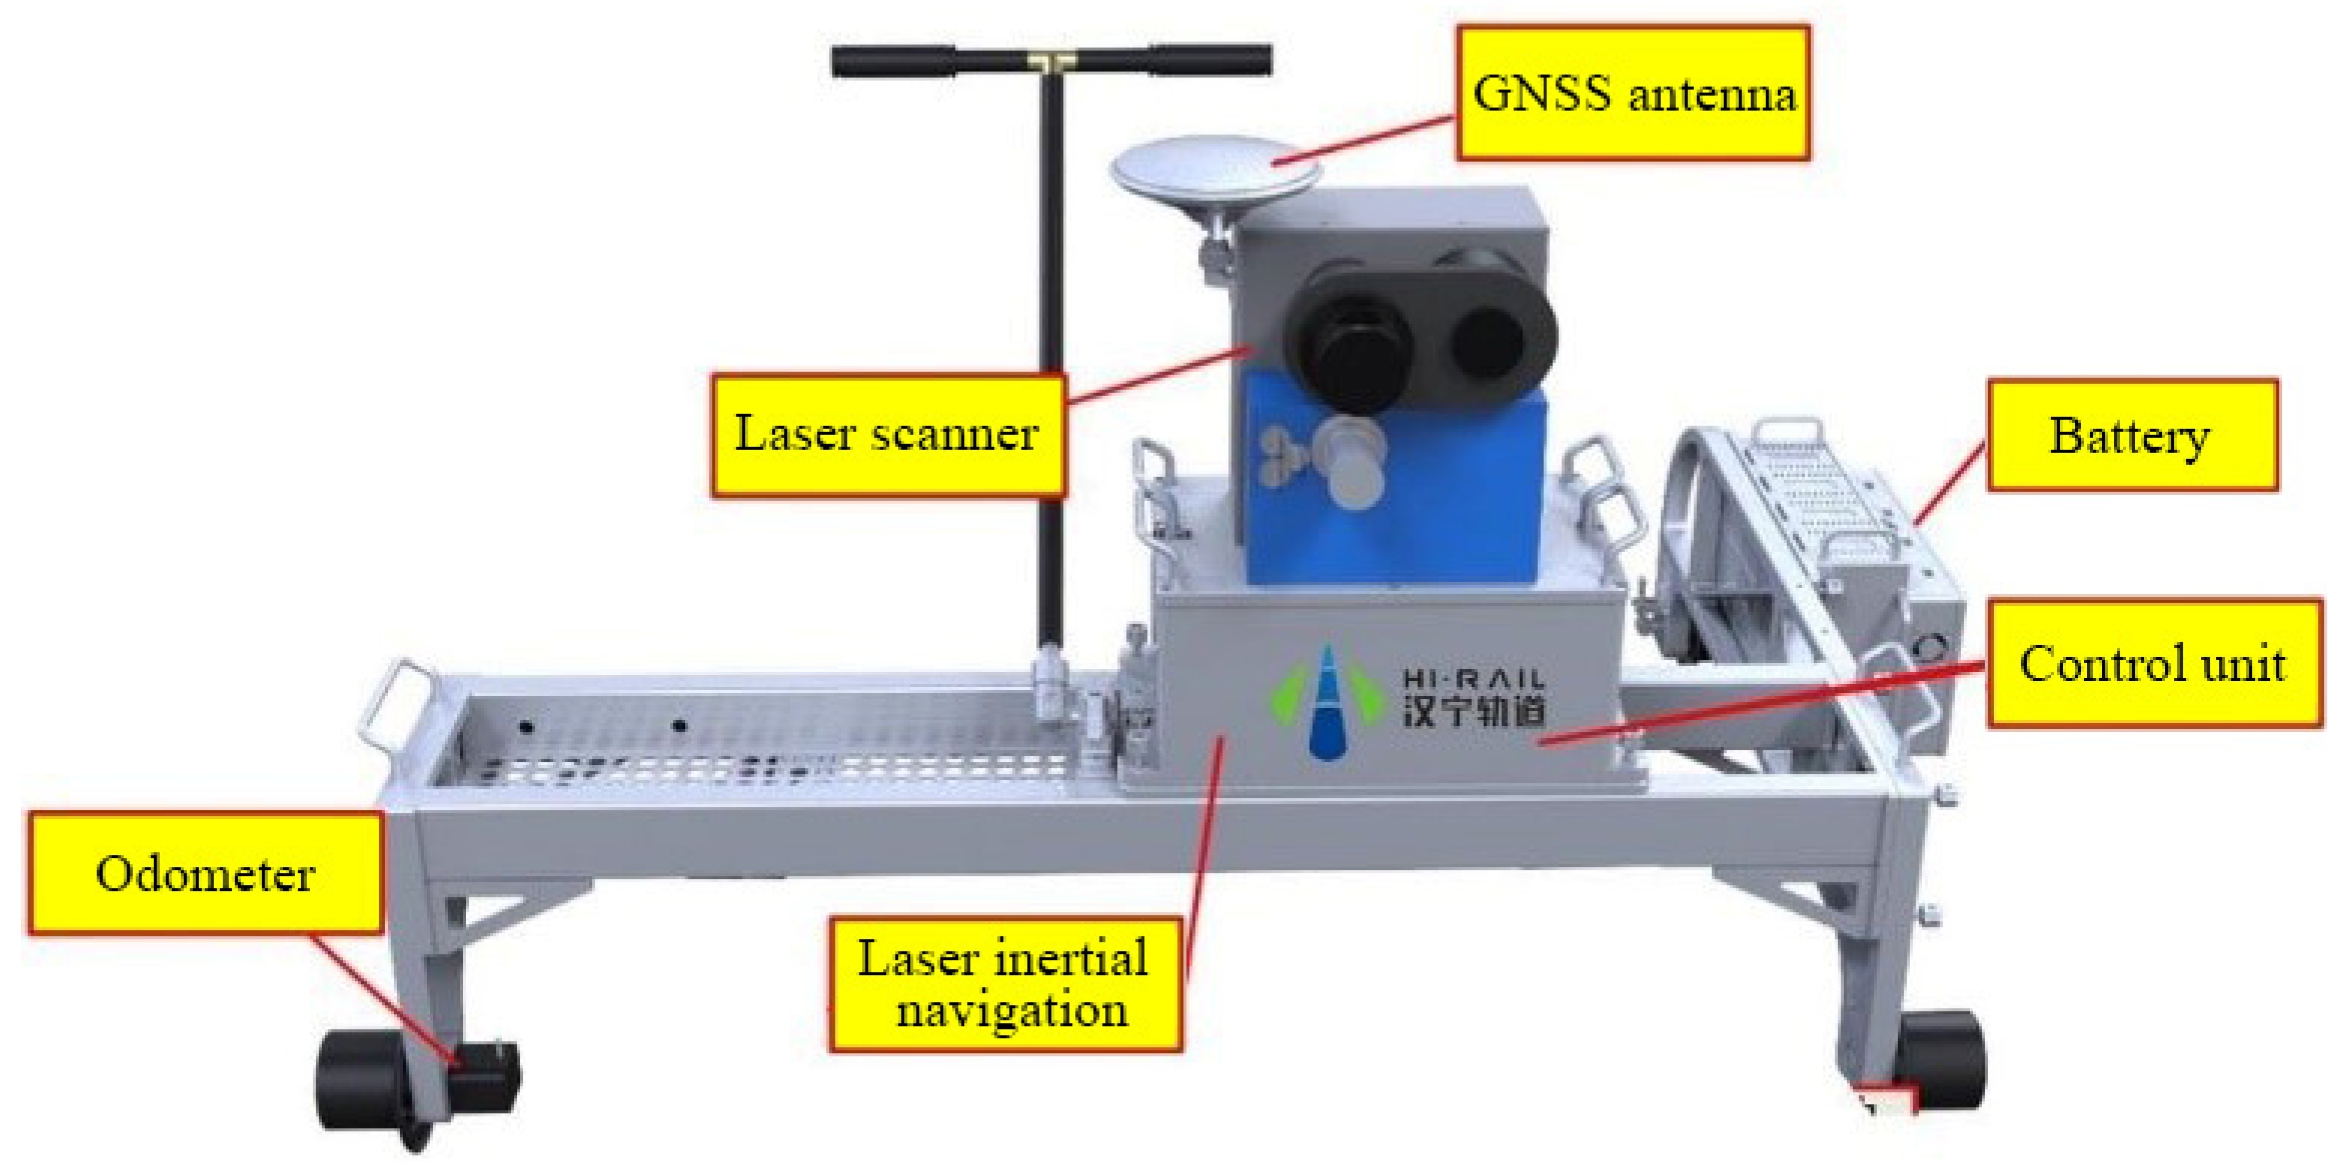
In the devised system, the trolley is developed by Wuhan HiRail Transportation Technology Co., Ltd., as shown in
Figure 1 [
23]. The 3D laser scanner which is PROFILER 9012 from Z + F company is mounted on the trolley. After post-processing, the visible spectrum information (RGB) in the image can be given to the point cloud, and the shape of the tunnel internal lining can be highly restored for the later point cloud modeling work. The TIT collects point cloud data at a speed of 2-5km/h.
2.3. Data Processing
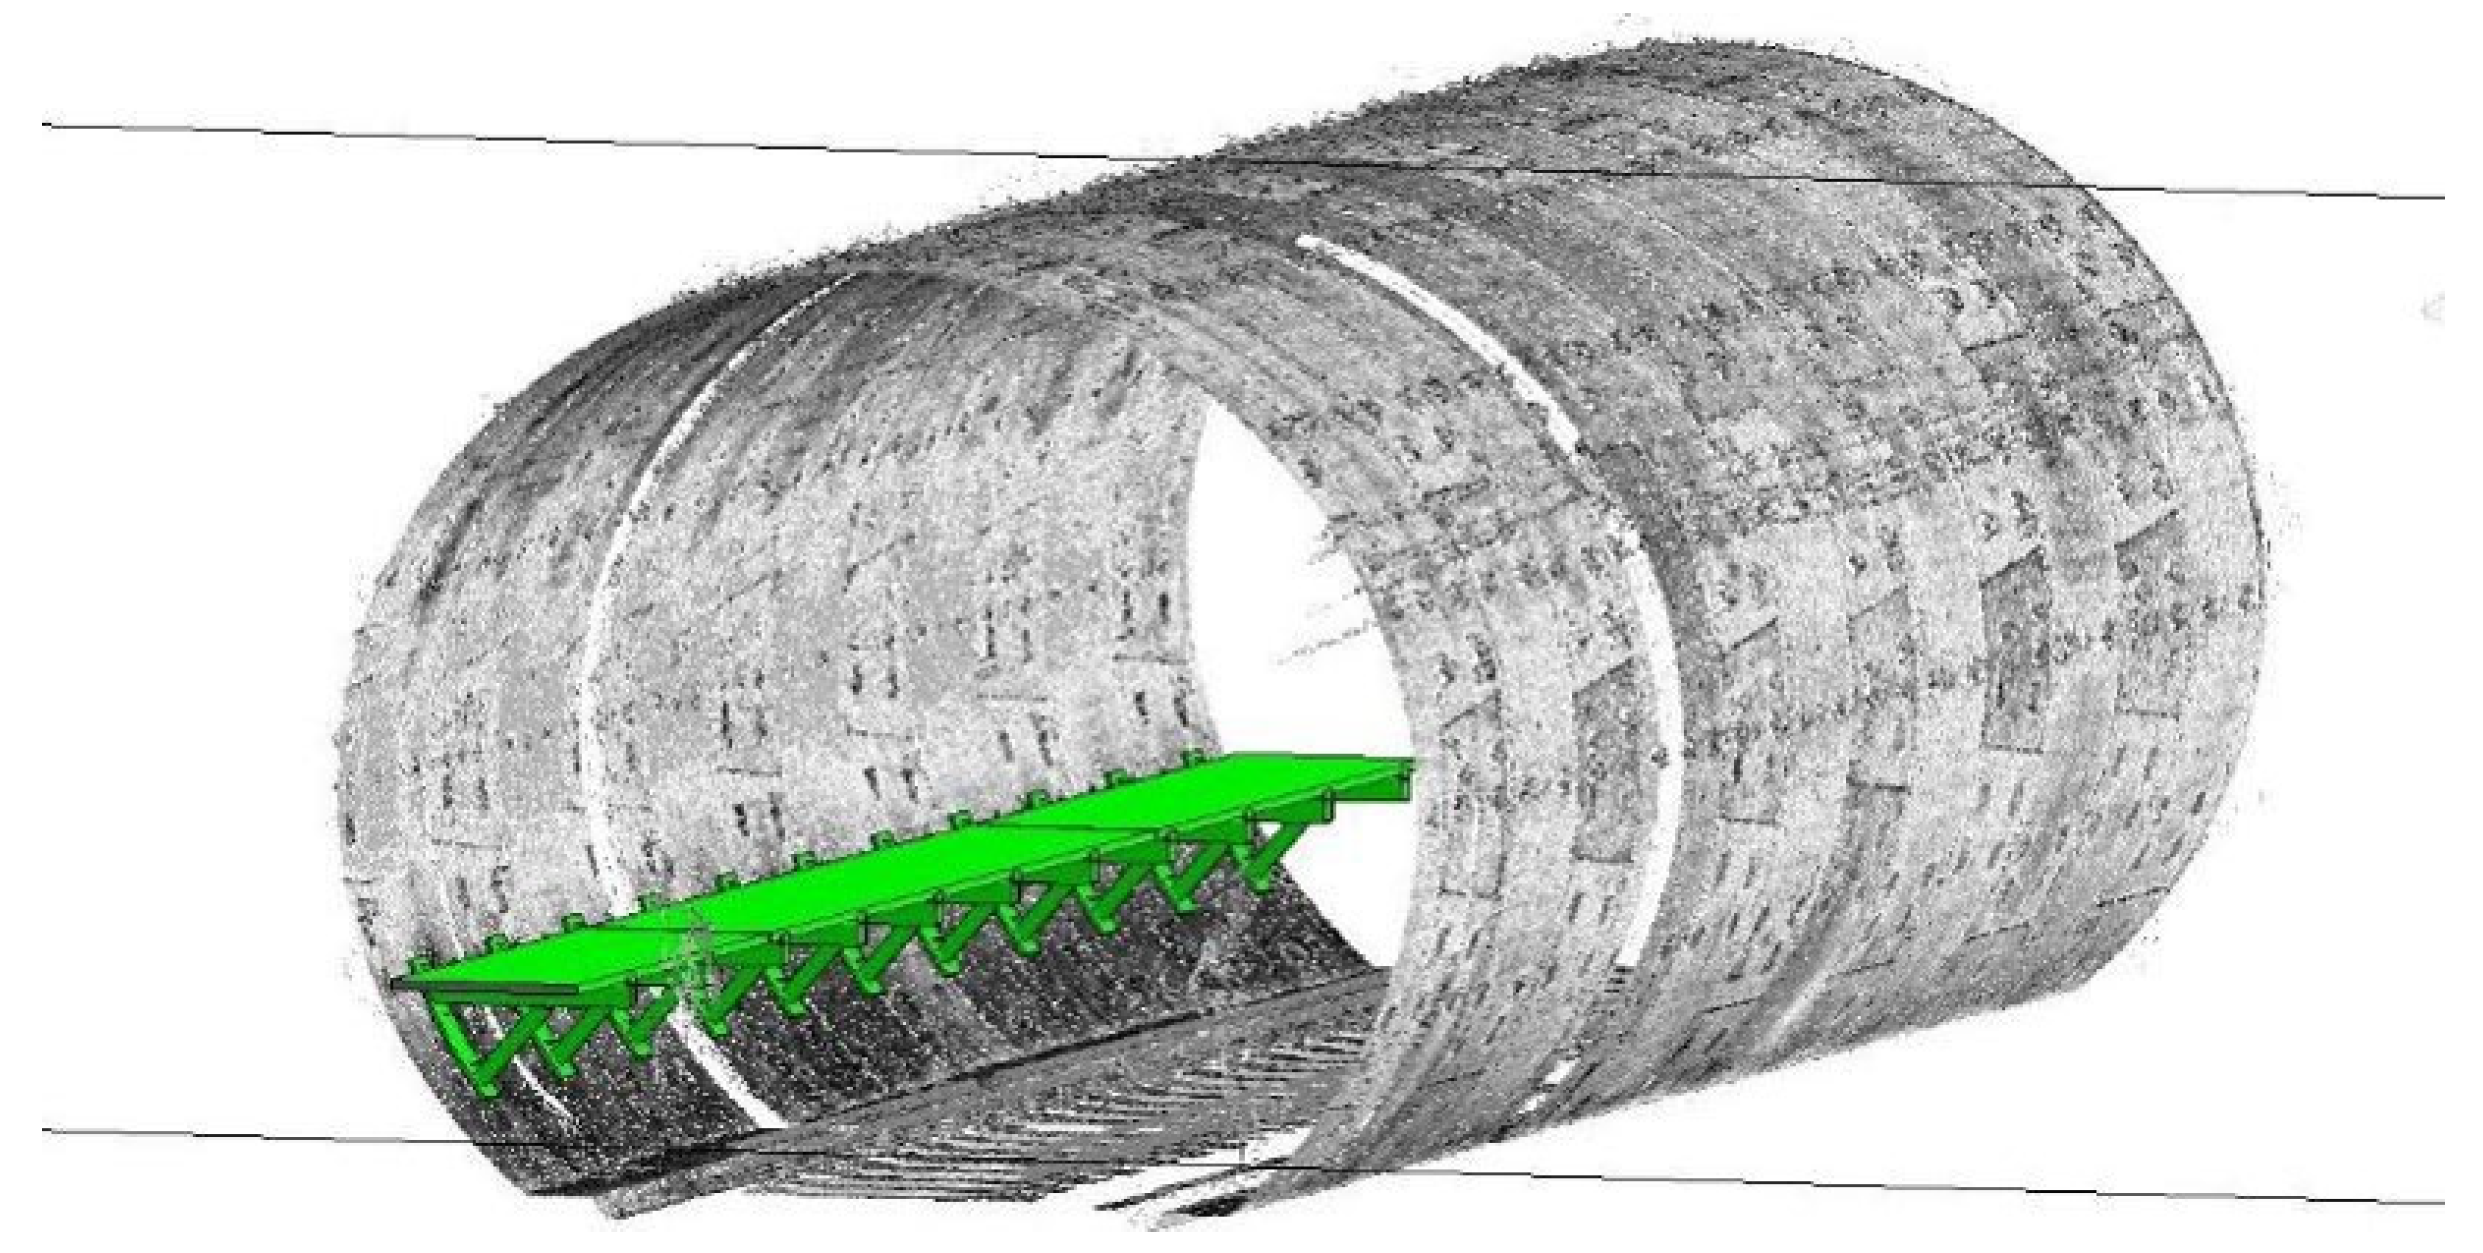
By operating the TIT, a large amount of point cloud data can be collected and the 3D model of the tunnel structure can be formed, as shown in
Figure 2. The point cloud data are then processed to extract the information of segment diameter and potential surface defects, including water leakage, segment dislocation, and spalling. The data processing steps are as follows:
Step1: Extraction of tunnel segment based on point cloud by using the ellipse fitting method.
Step2: Point cloud projection: Expand the circle center fitted by the tunnel section and the corresponding frame point cloud according to the angle between them, then insert differential value which according to the gray value of the two point clouds, so as to complete the forward projection.
Step3: Image graying: the original cloud projection RGB is weighted to calculate the average value. The weighted calculation formula is described as Eq. (1), and the weighted average value is taken as the grayscale result.
where
R,
G and
B are the three primary color channel parameters of image, and the collective value depends on the image type.
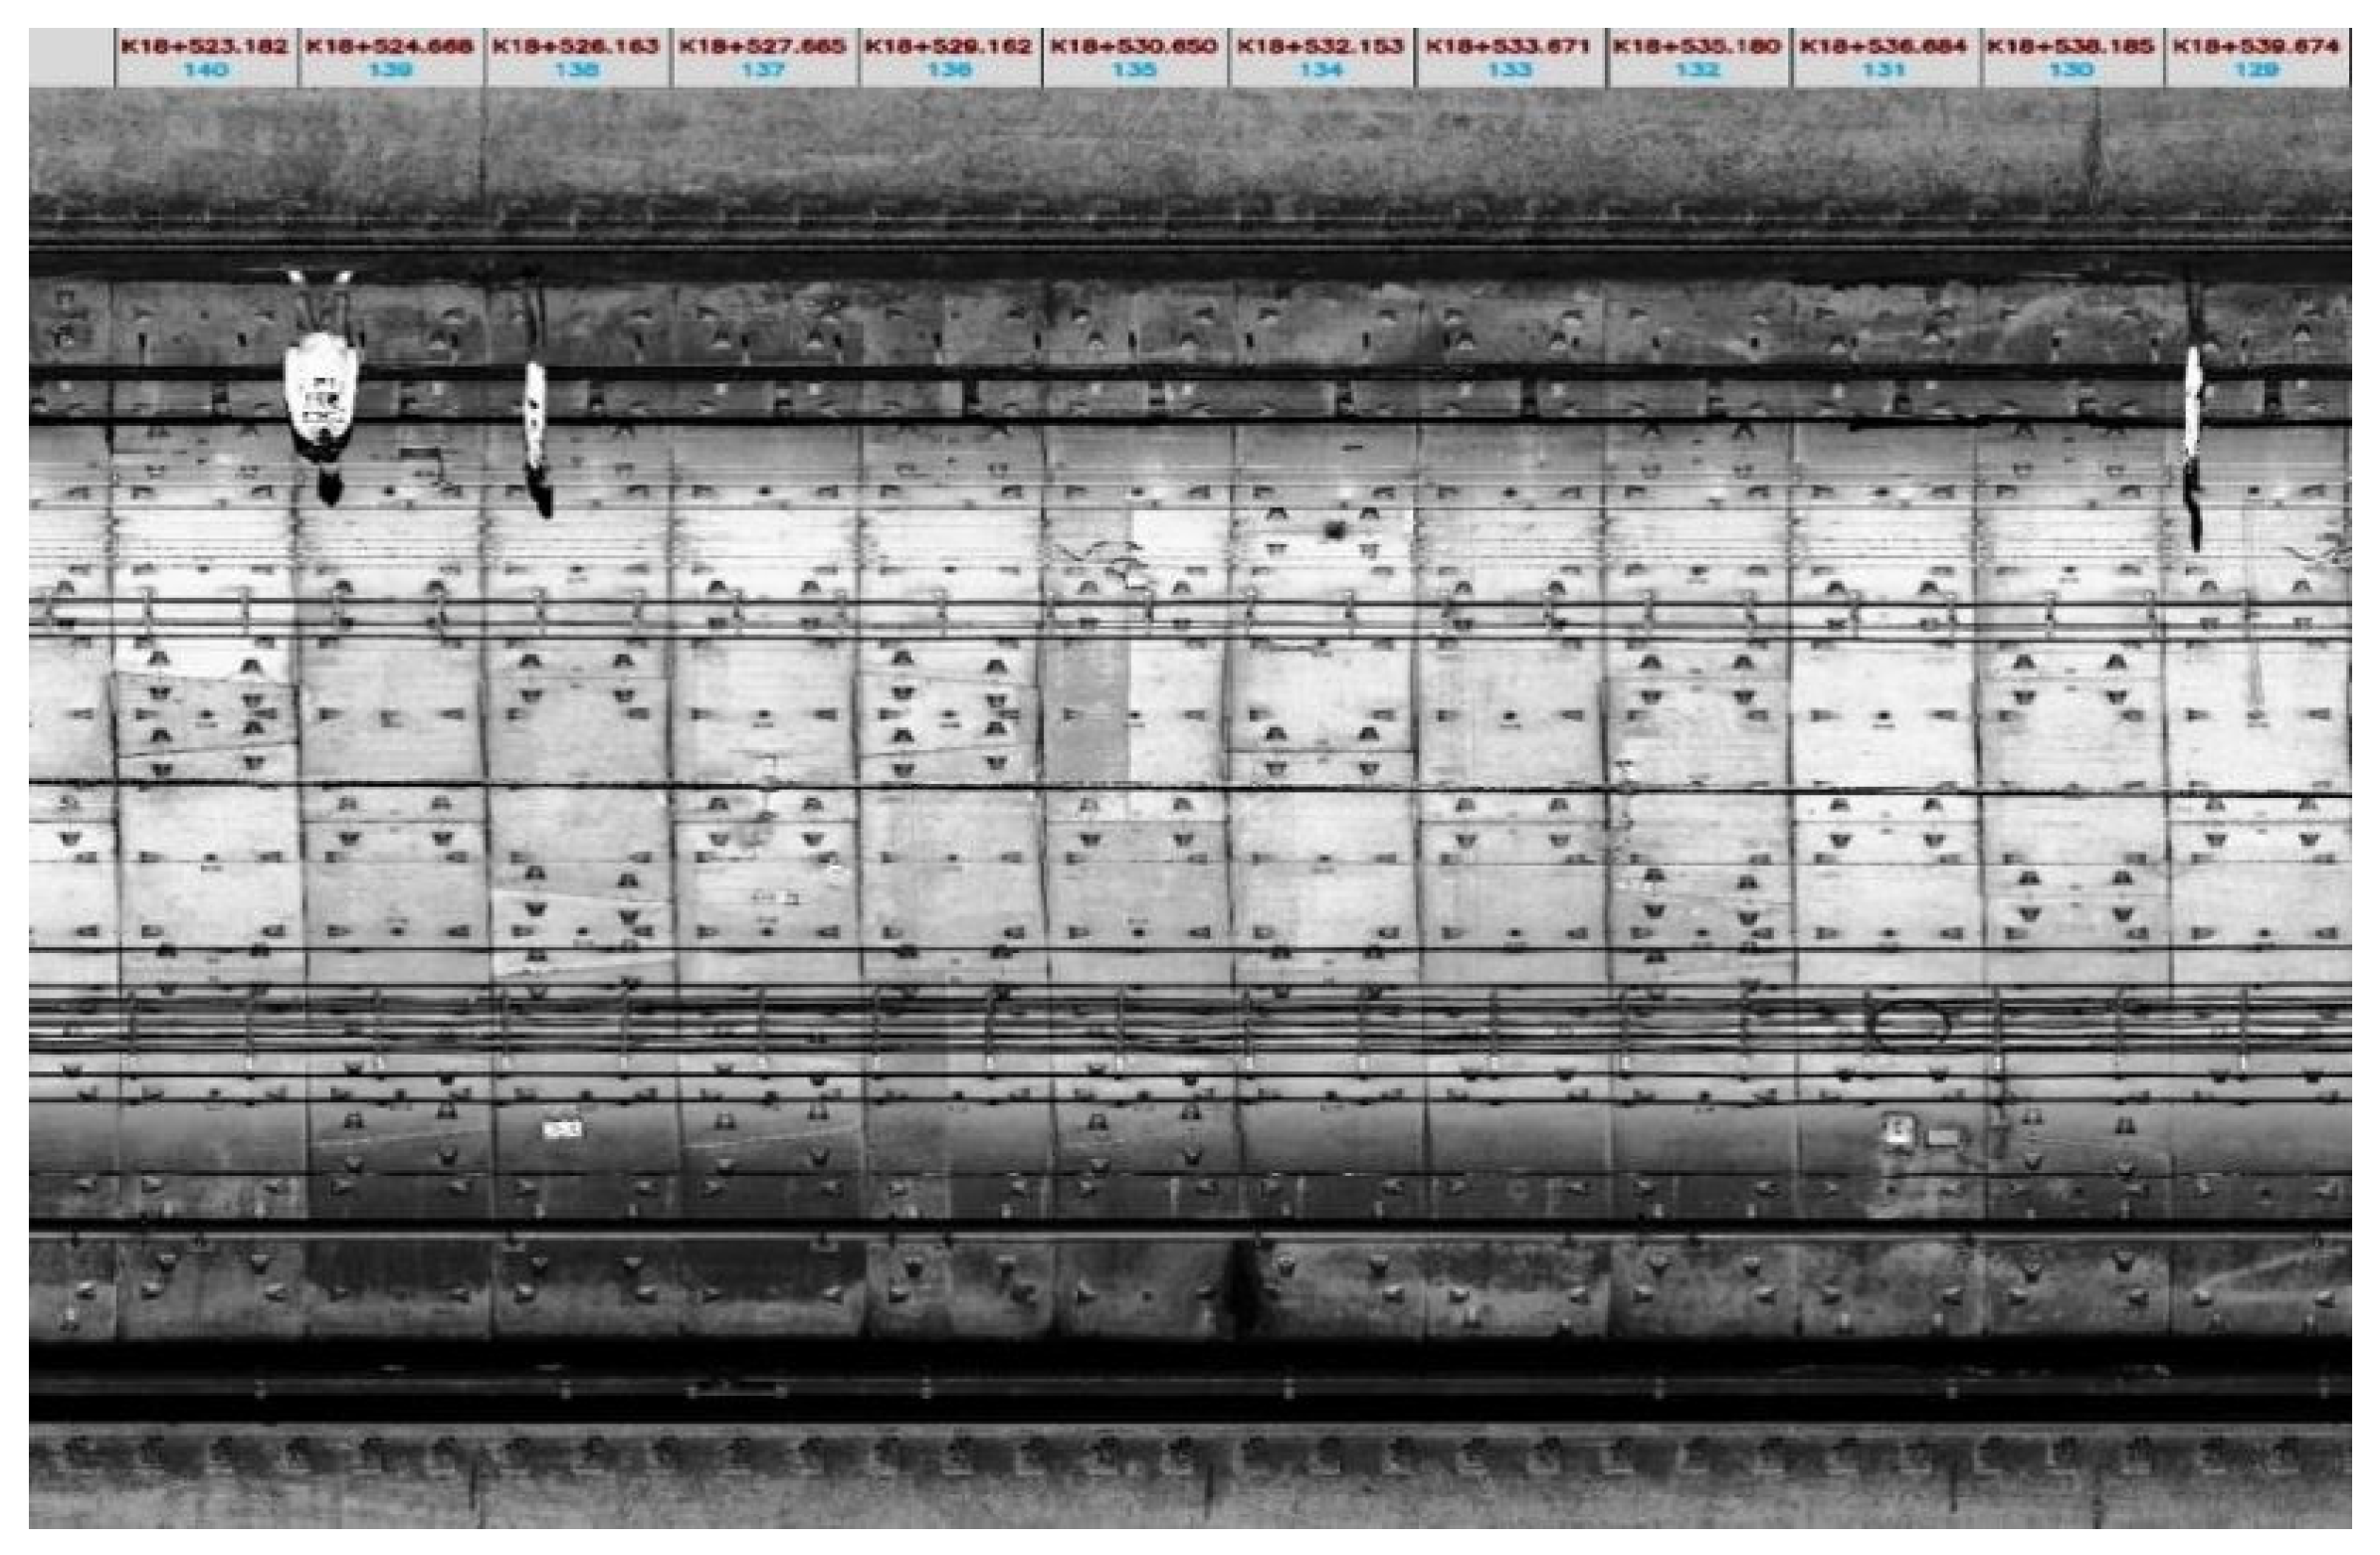
With the above process, the gray-scale image of the tunnel section can be obtained, as shown in
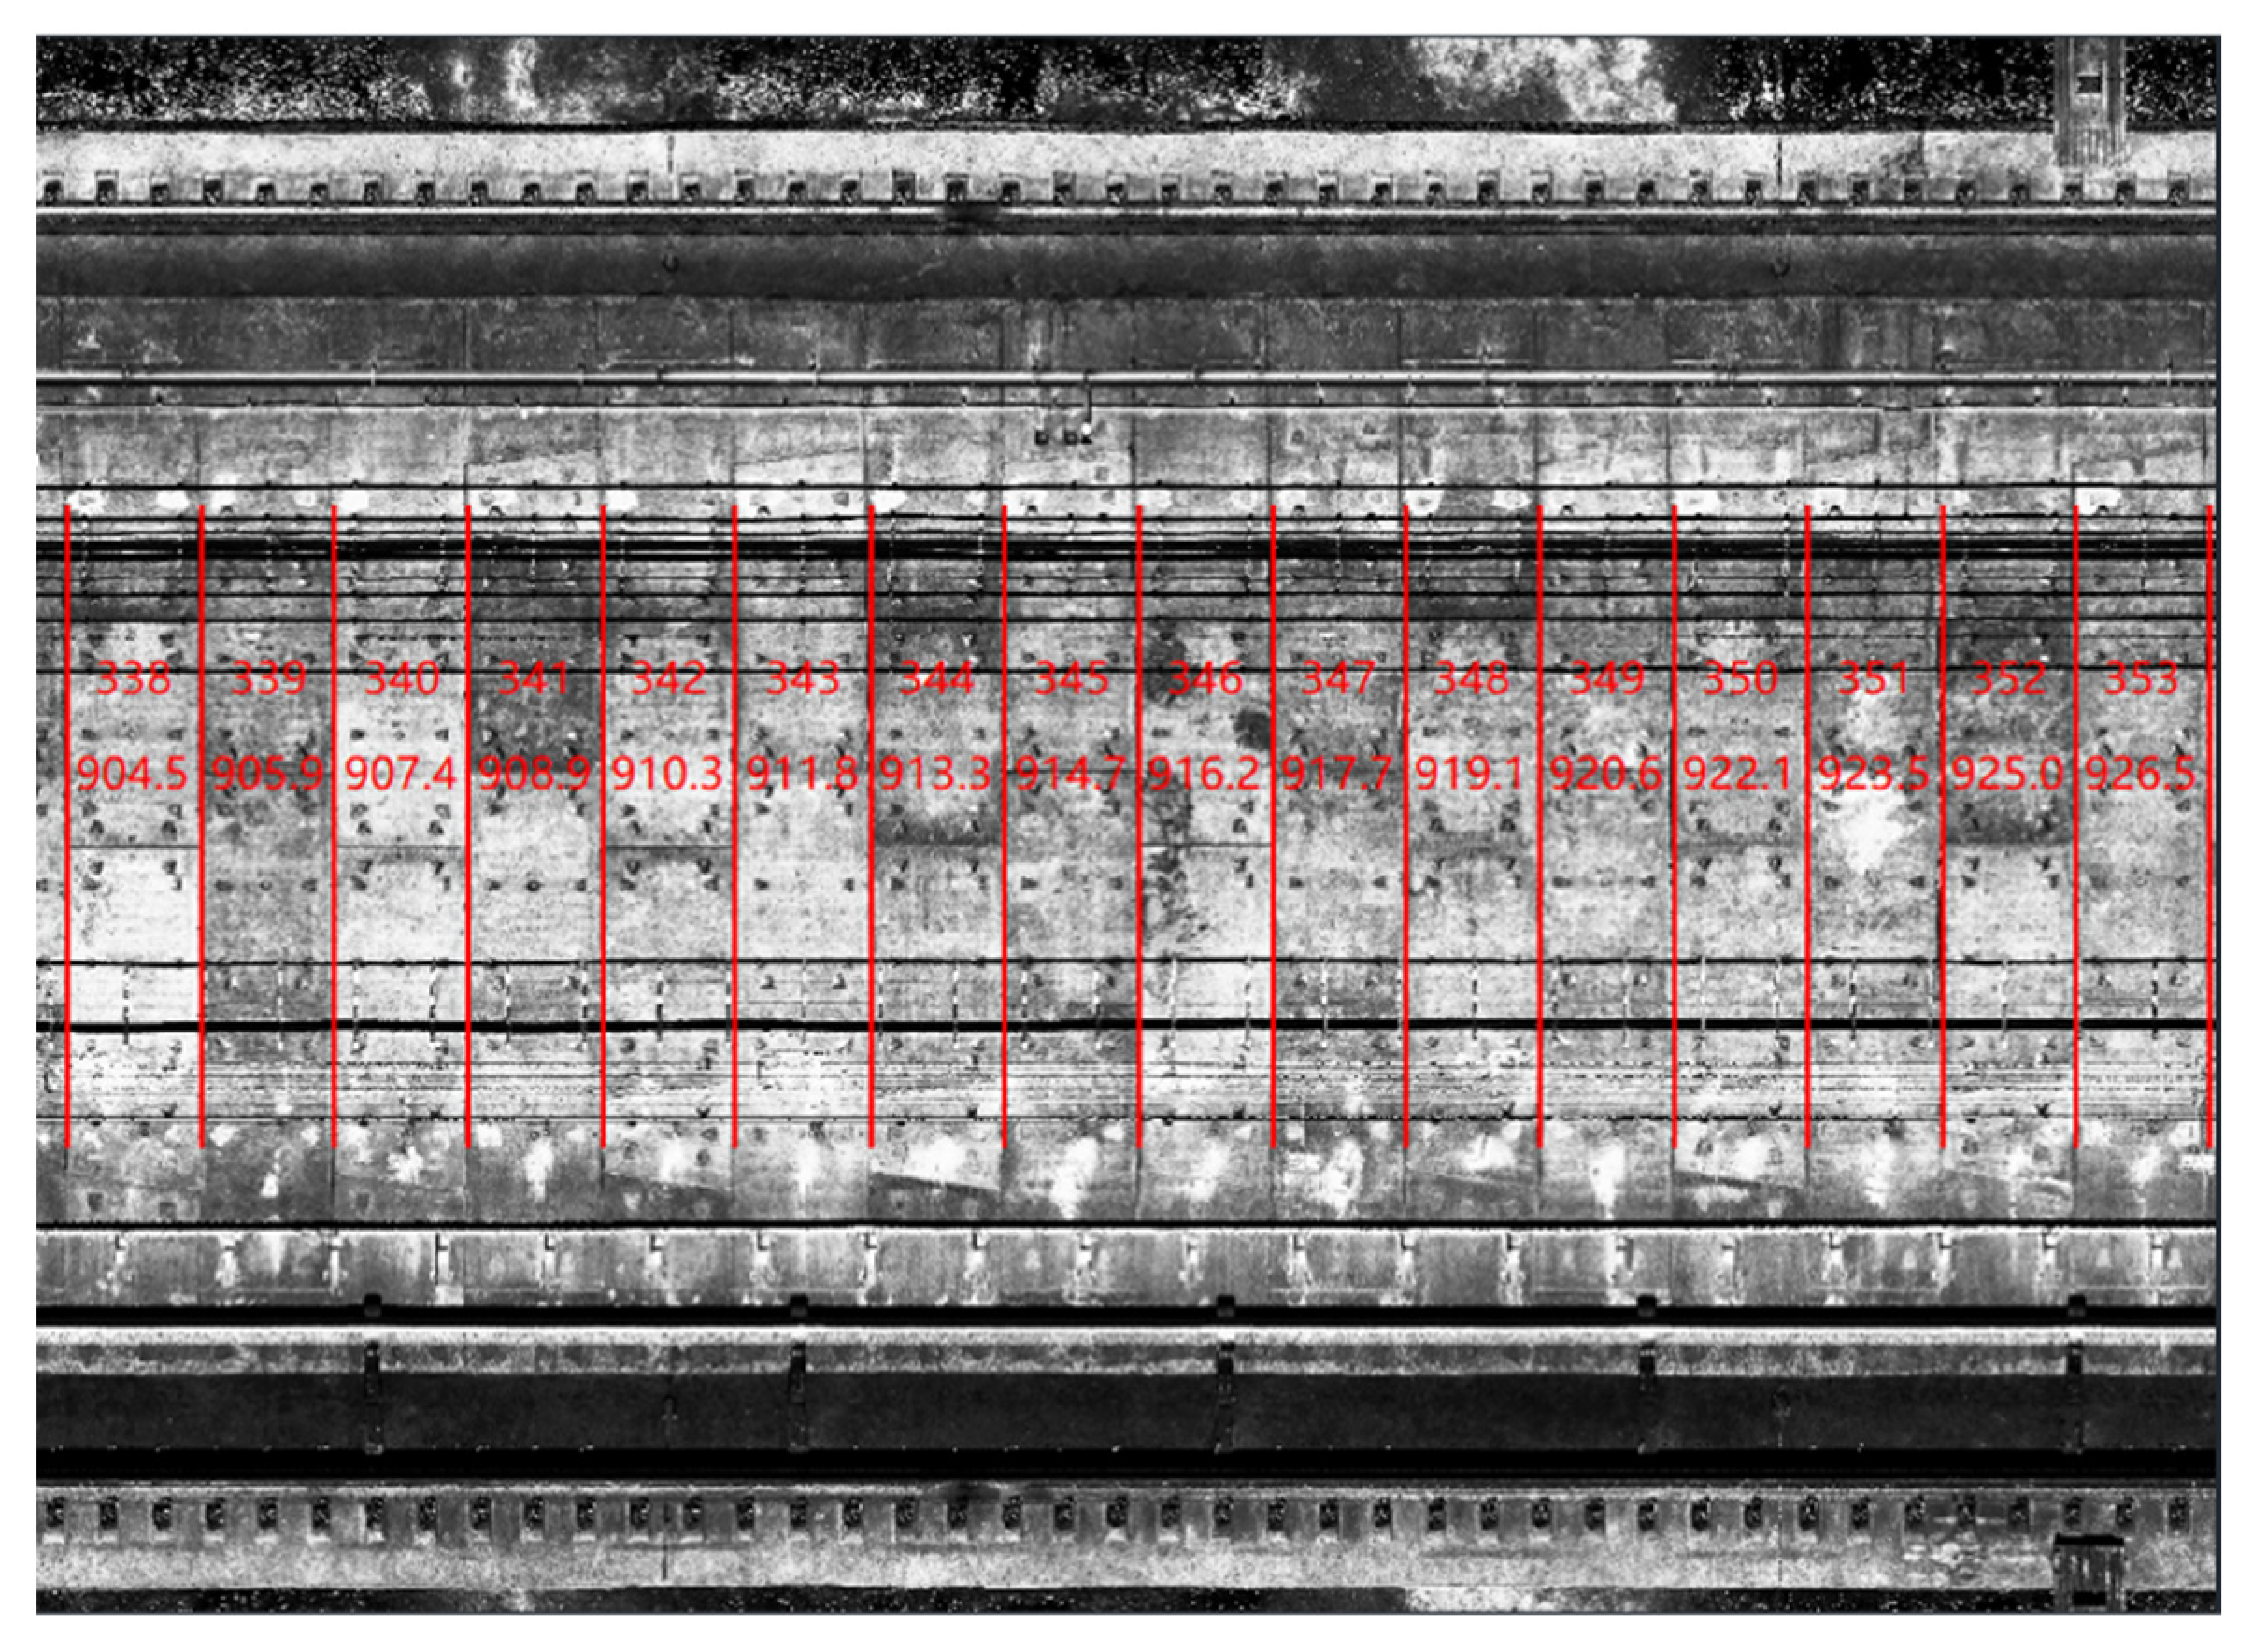
Figure 3. Through the gray-scale image, a variety of the surface defects can be identified using the existing image feature recognition techniques [
23], as shown in
Figure 4.
2.4. Test results
This research has completed the detection of three subway tunnel sections by operating the TIT. The lengths of the three sections are 1.6km (
Section 1), 1.6km (
Section 2) and 2.0km (
Section 3) respectively. With the data processing algorithm, the data of ring segment diameter, segment dislocation, water leakage and spalling defects can be obtained. This section shows the test results of
Section 1.
2.4.1. Cross-section deformation
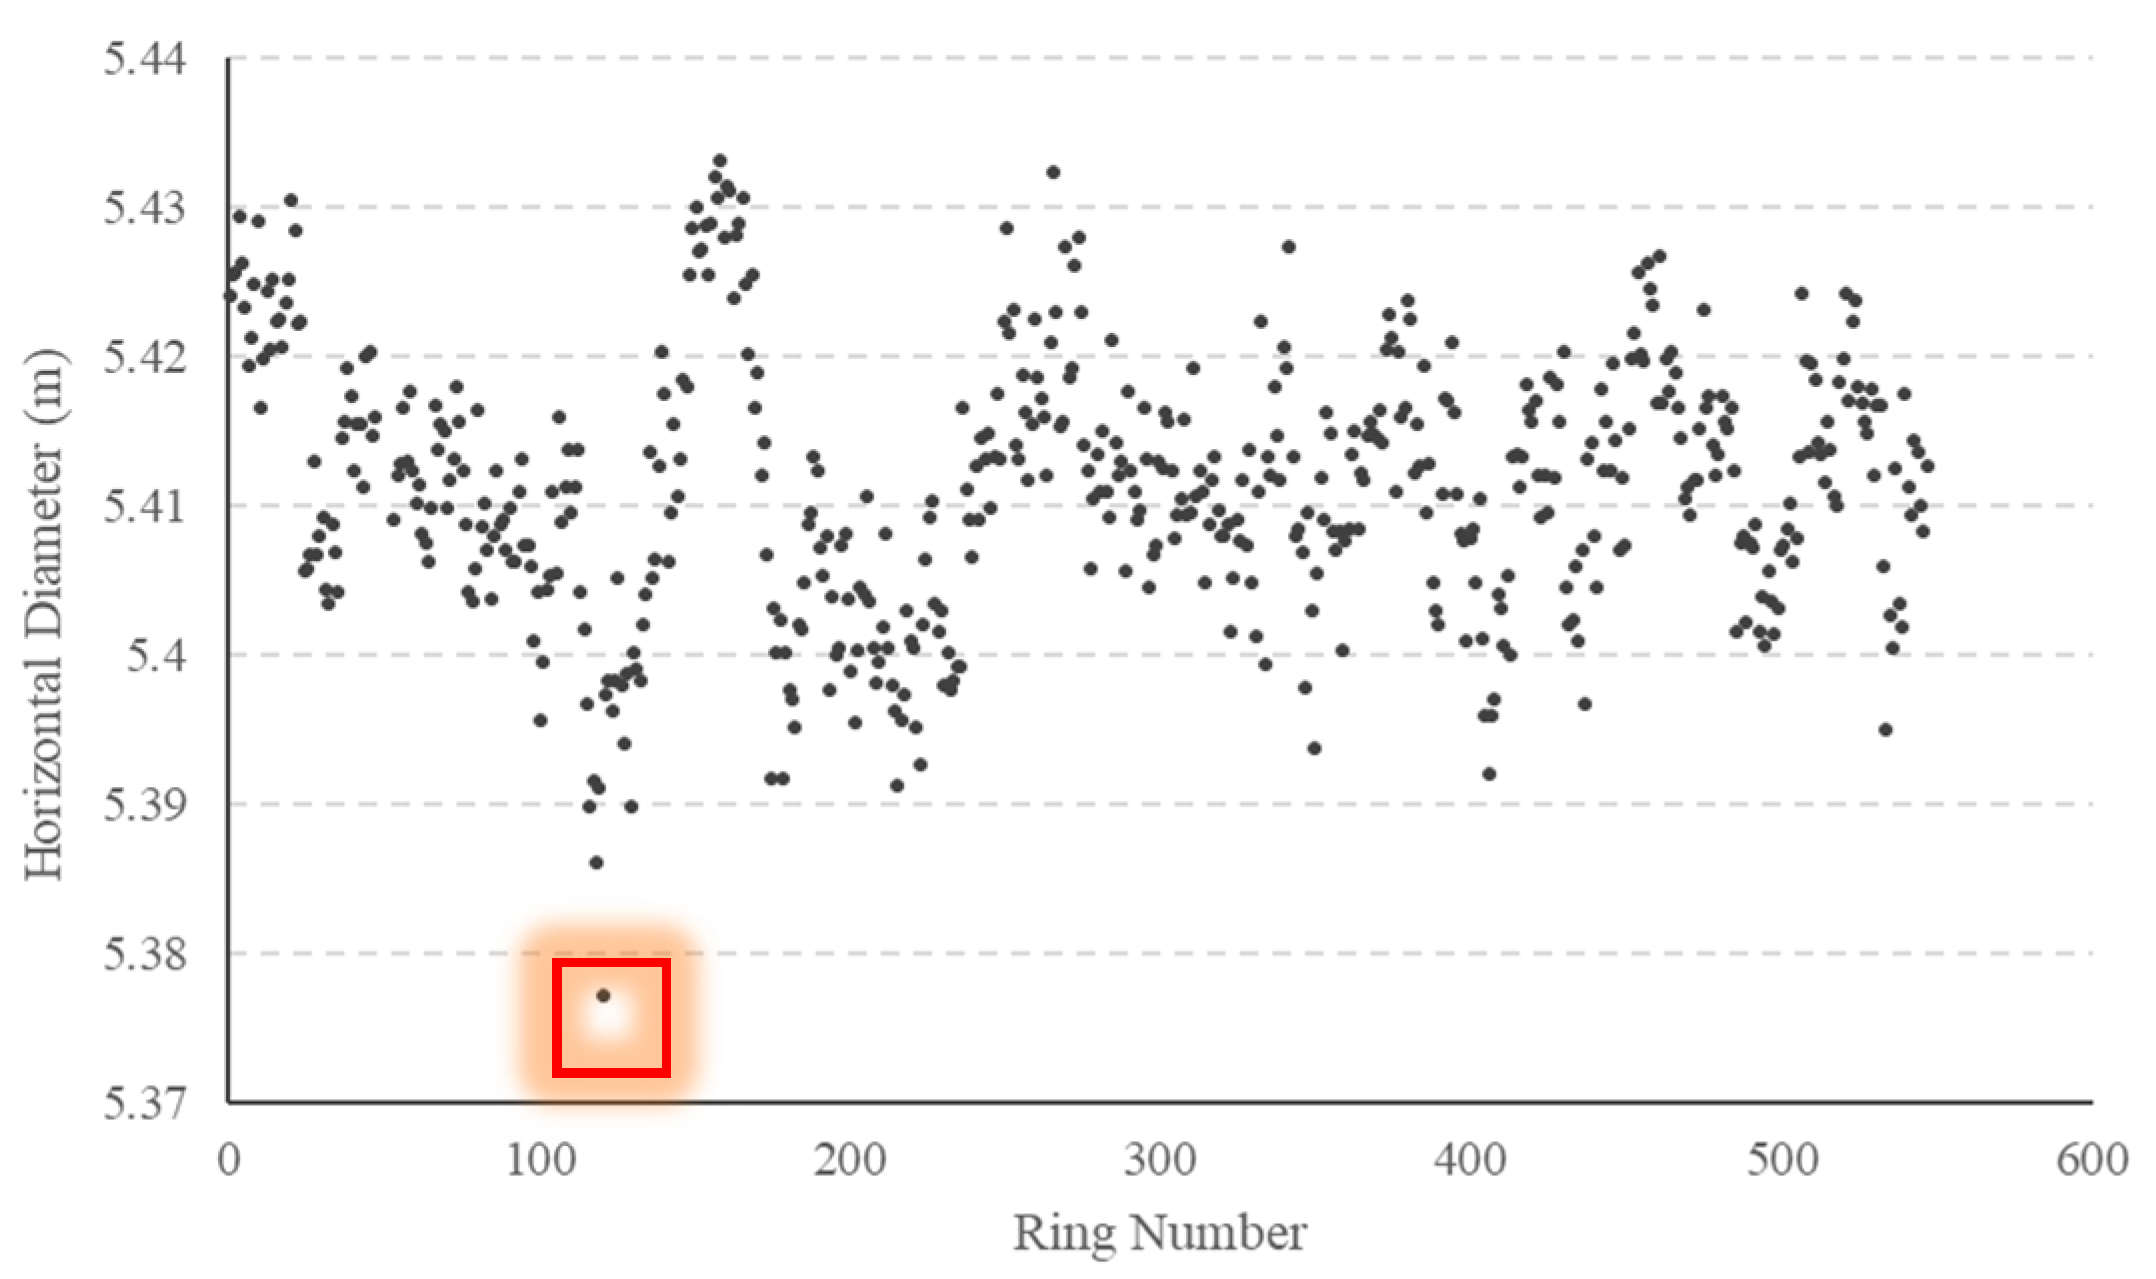
The cross-section deformation data include the diameter, deflection angle, long axis and short axis of each ring of the shield tunnel. By investigating and analysing the ring diameter, we can determine the degree of deformation of a ring in the tunnel. A total of 542 sets of effective ring data were collected, and the horizontal diameter of each ring is presented in
Figure 5.
The design diameter of the rings in test section is 5.4m, and the average diameter is 5.41m. The difference between the measured horizontal diameter and the design diameter indicates the cross-section deformation. It is seen from
Figure 5 that there are 8 rings with the difference of no less than 3cm, another 74 rings with a difference of between 2 - 3 cm, and another 227 rings with the difference of 1 - 2 cm. The deformation values at the other 233 rings are smaller than 1cm. There are no severely deformed rings, but all rings are slightly deformed. Since the tunnel deformation is too common but there is no serious deformation, it can be considered that the tunnel deformation is the natural deformation generated over time in the long-term operation, without the influence of defect factors.
Figure 6 shows the cross-section shape of a typical ring (No. 121) with the large difference between the measured diameter and designed diameter.
2.4.2. Segment dislocation
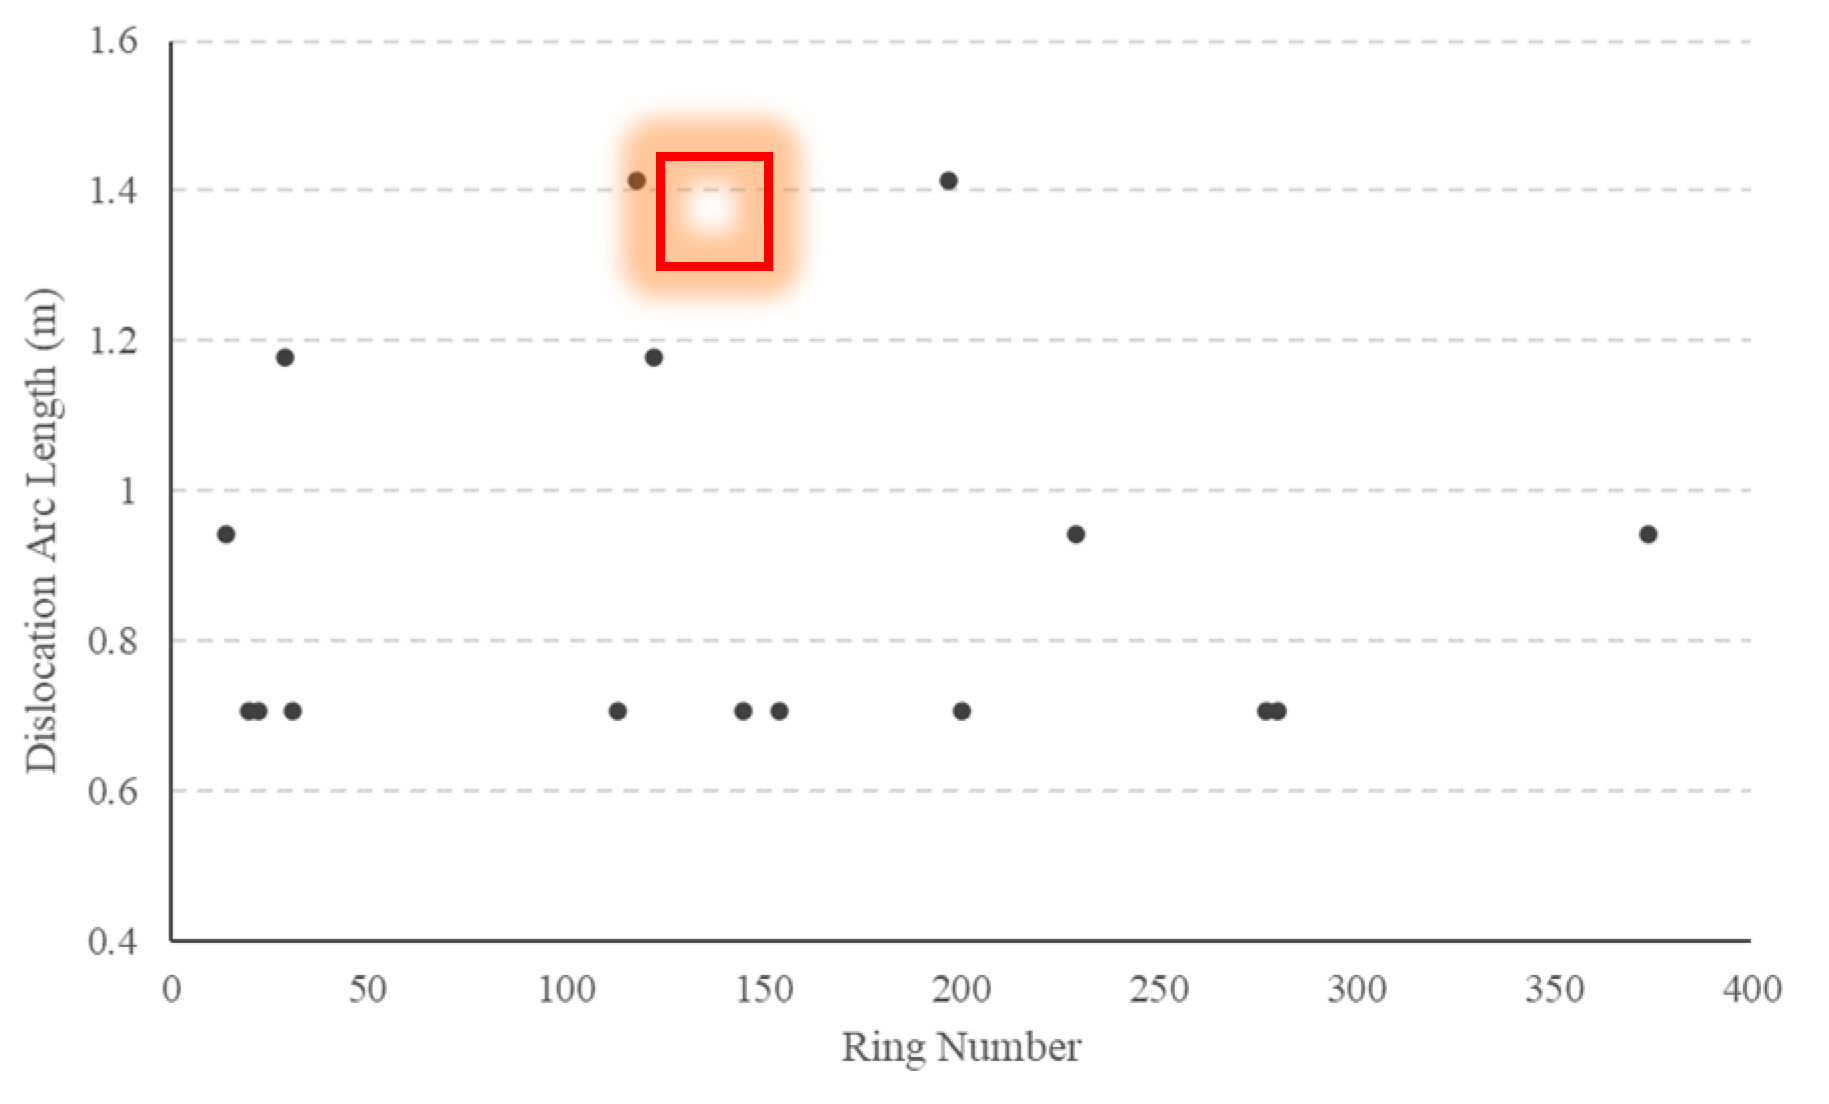
By analyzing the arc length of dislocation between ring segments, the severity of dislocation between ring segments can be obtained. A total of 16 rings with dislocation defect are found, and the arc length of dislocation at each ring is shown in
Figure 7. In the test results of cross-section deformation, the large convergence value is found at the ring No. 121. According to the definition of dislocation defect (i.e., displacement and dislocation between rings), the dislocation may probably occur at the adjacent areas of ring No. 121. As shown in
Figure 7, The test result of segment dislocation verifies the hypothesis: dislocation defects are detected at the rings No. 118 | 119 and No. 122 | 123. So it can be concluded that the deformation of the ring has a certain influence on the dislocation of the surrounding ring.
2.4.3. Water leakage
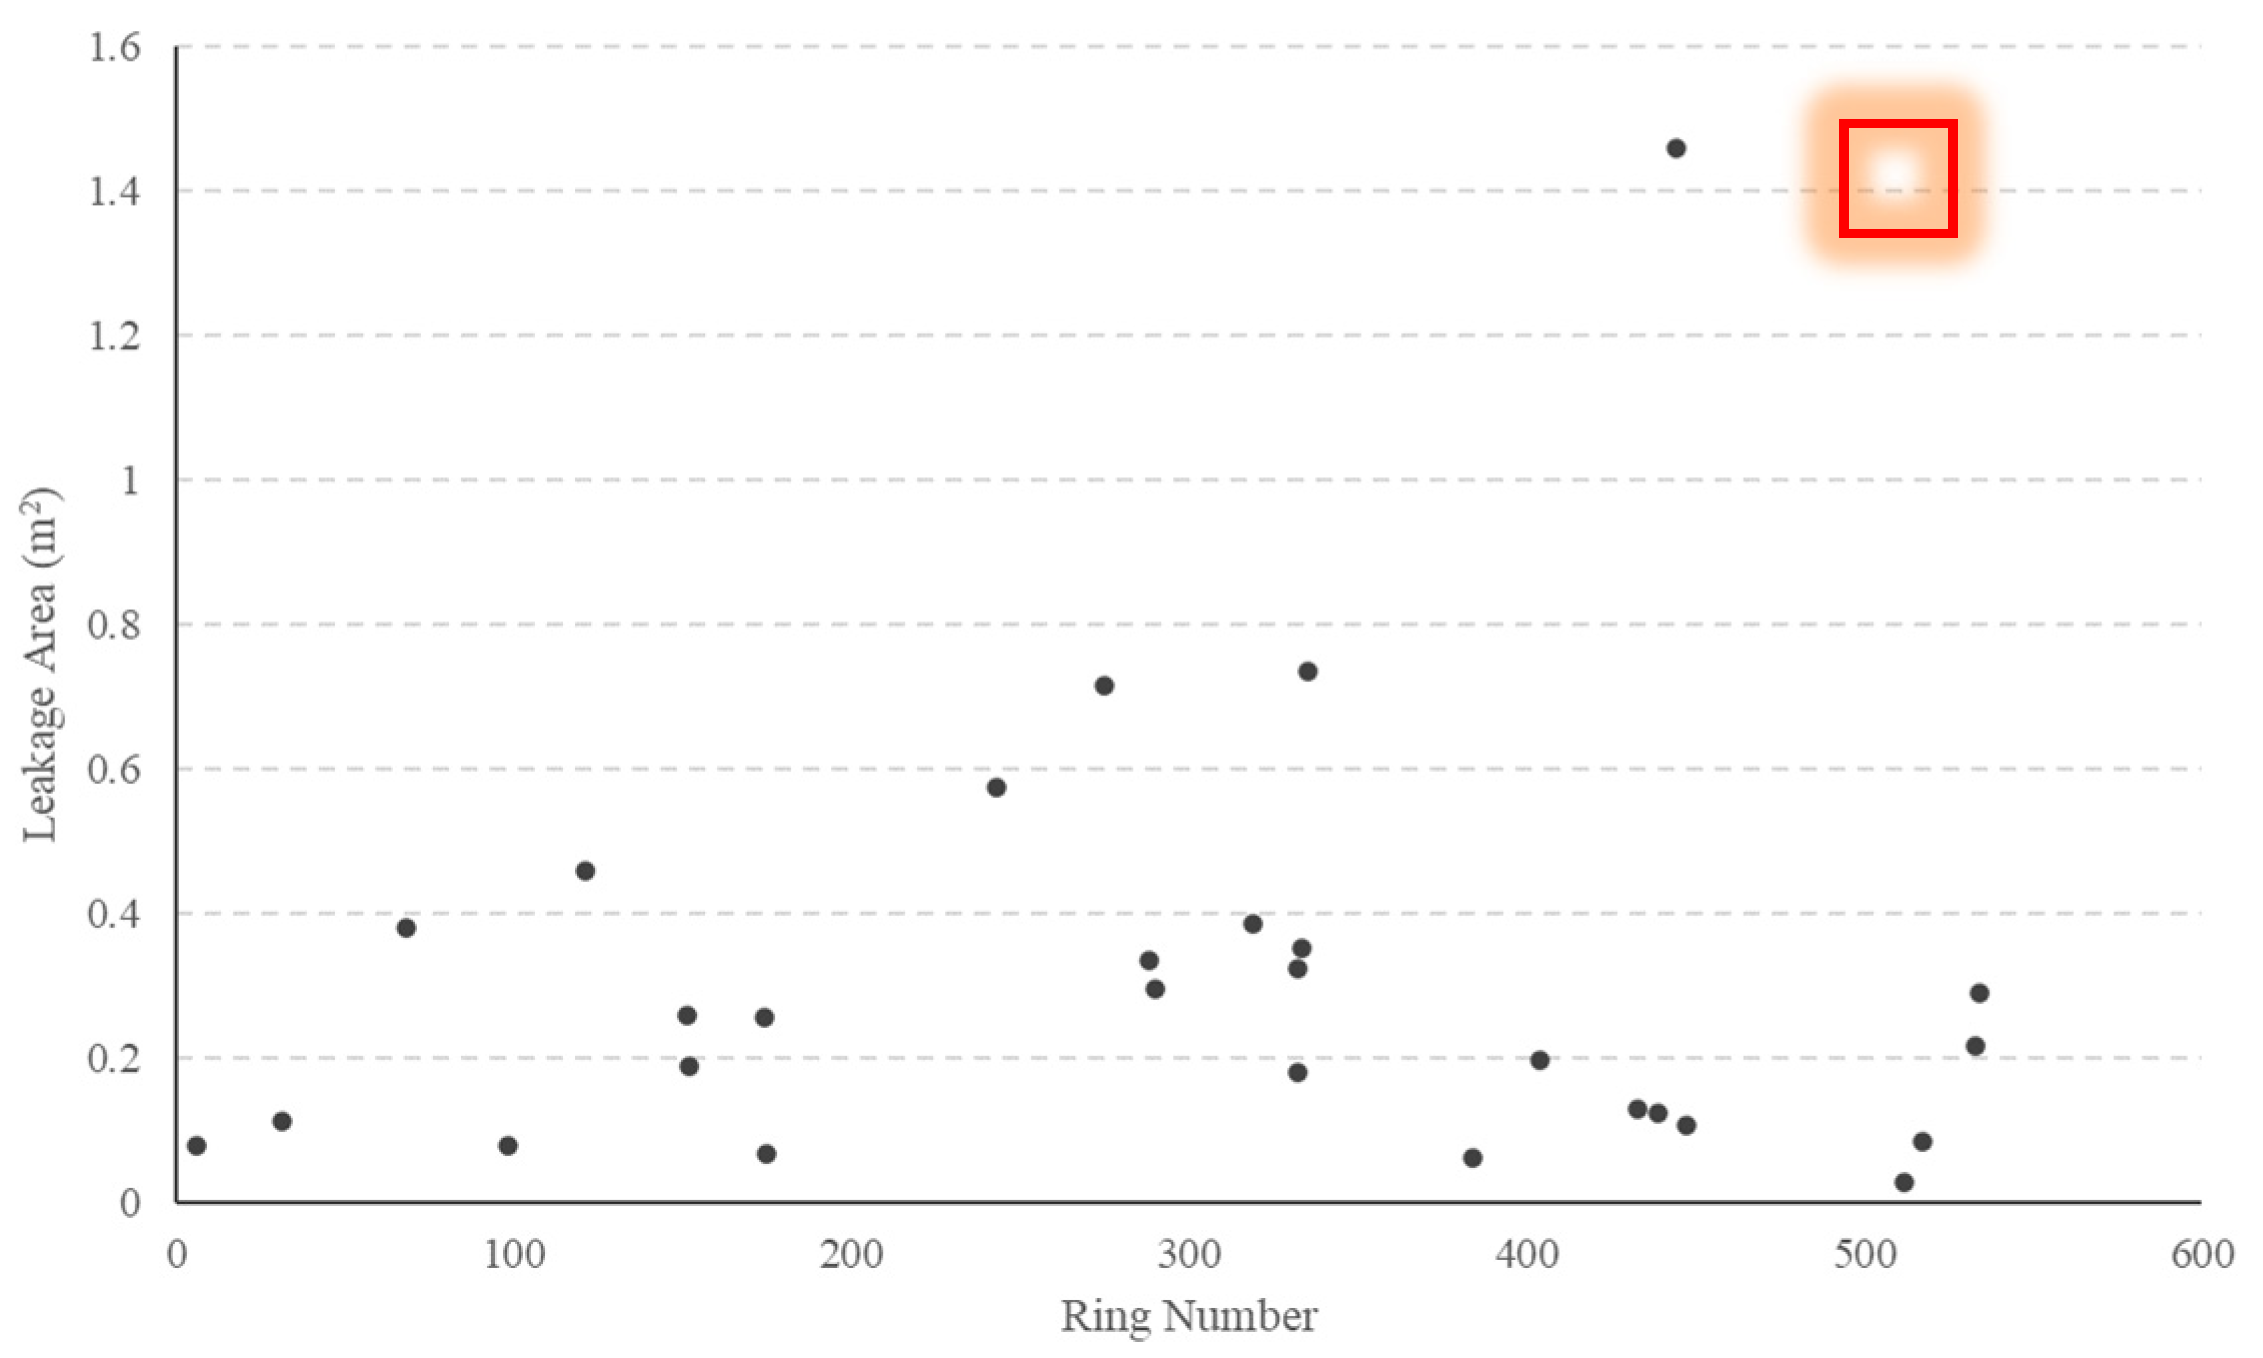
Totally 28 leakage areas are identified in the detection data, as shown in
Figure 9. The average leakage area of the study section is: 0.30m
2. It can be seen from
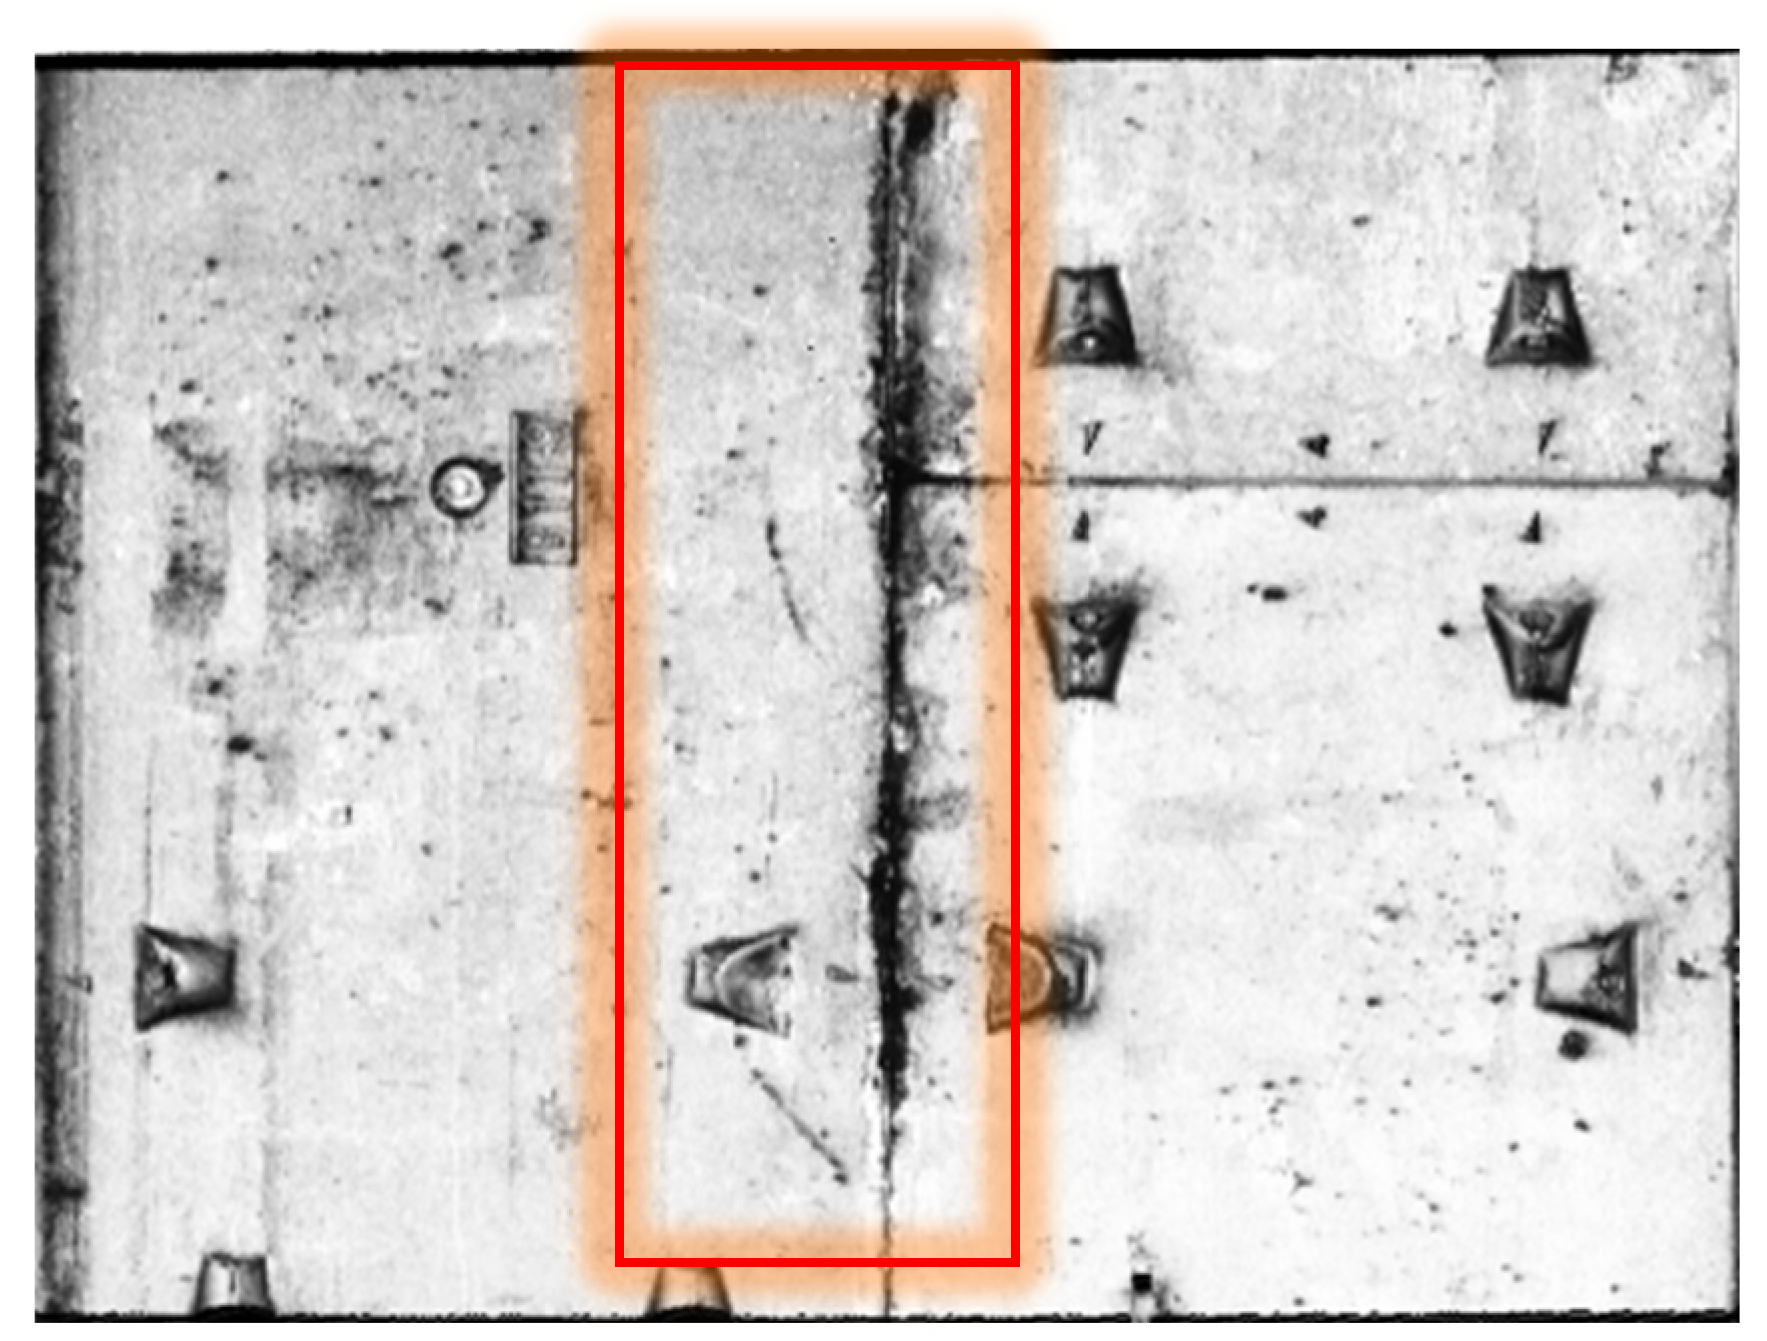
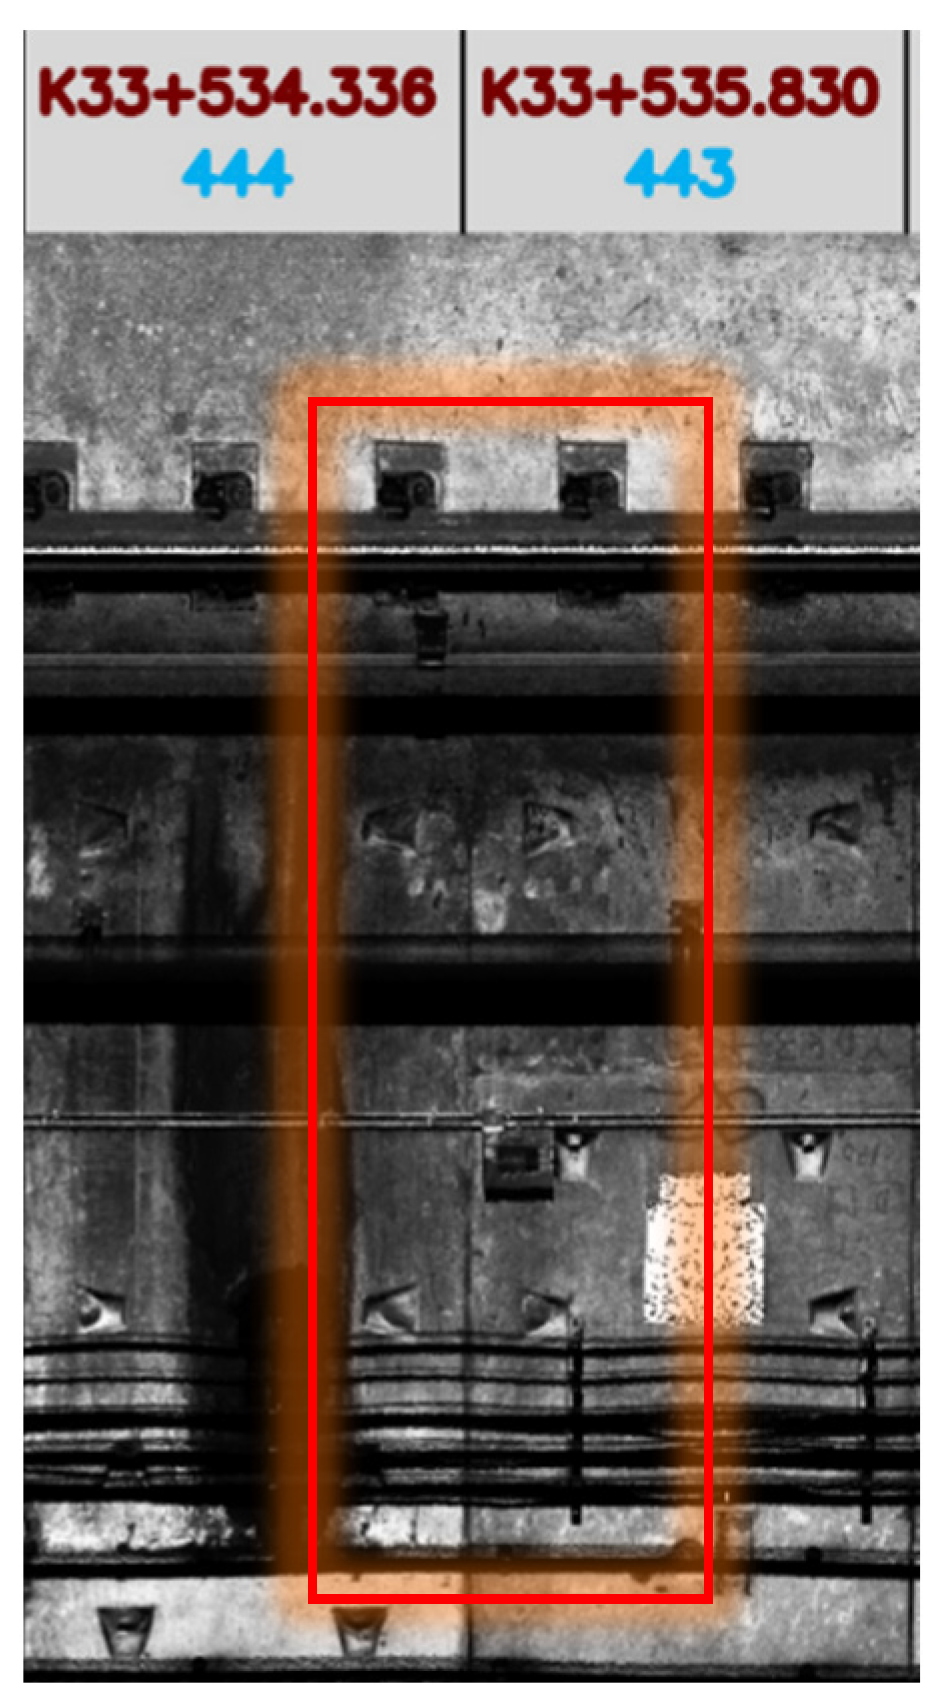
Figure 9 that there is a large area of water leakage at ring No. 444. After searching the water leakage position in the gray-scale map (see
Figure 10), it is found that the position is located at the splicing of ring pieces and no other defect is found. Therefore, it can be inferred that the damage caused by the ring piece splicing leads to the loss of waterproof performance and the water leakage defect at this location.
2.4.4. Spalling defects
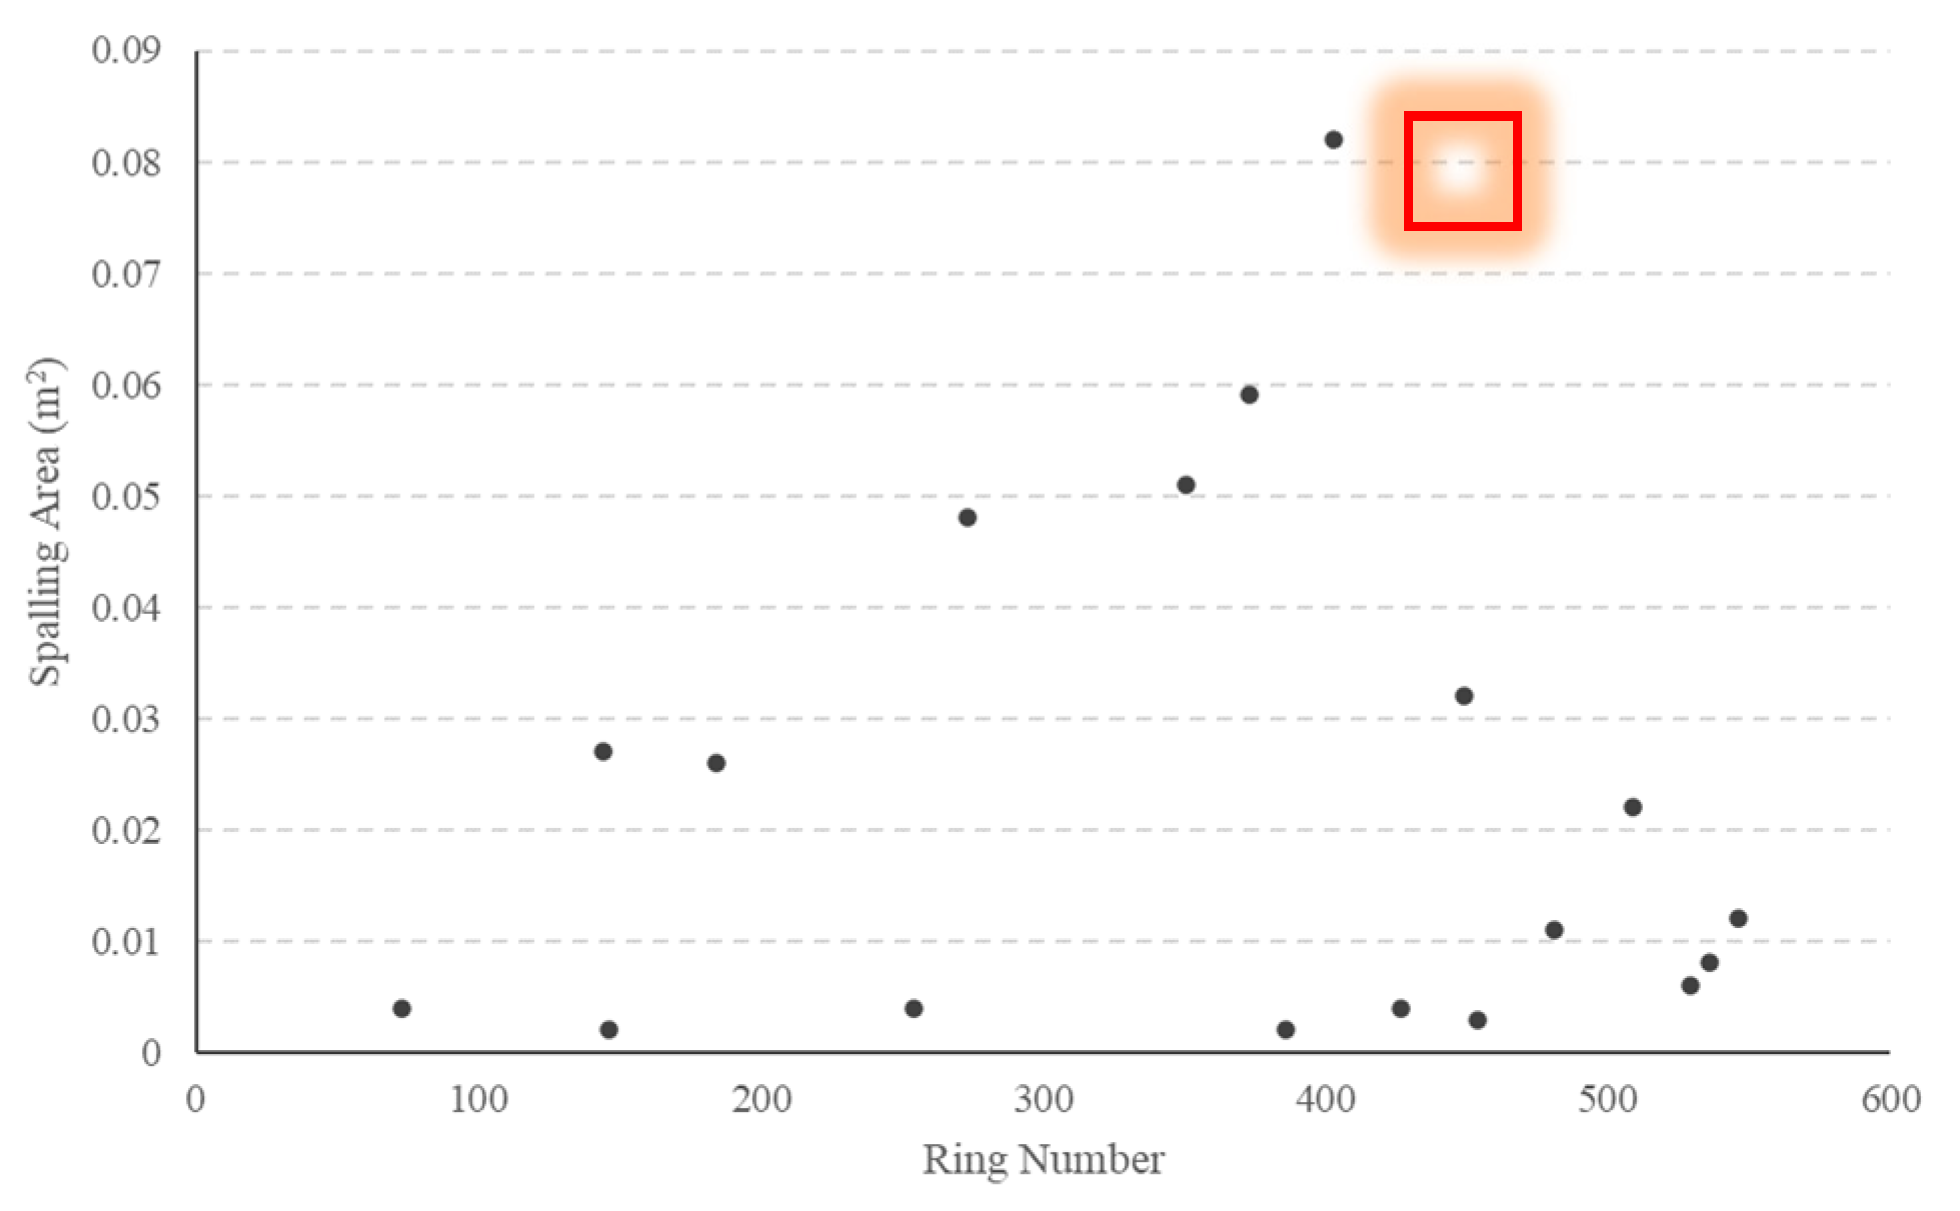
A total of 18 spalling defects are identified and the result is shown in
Figure 11. The average falling area of the study section is around 0.02m
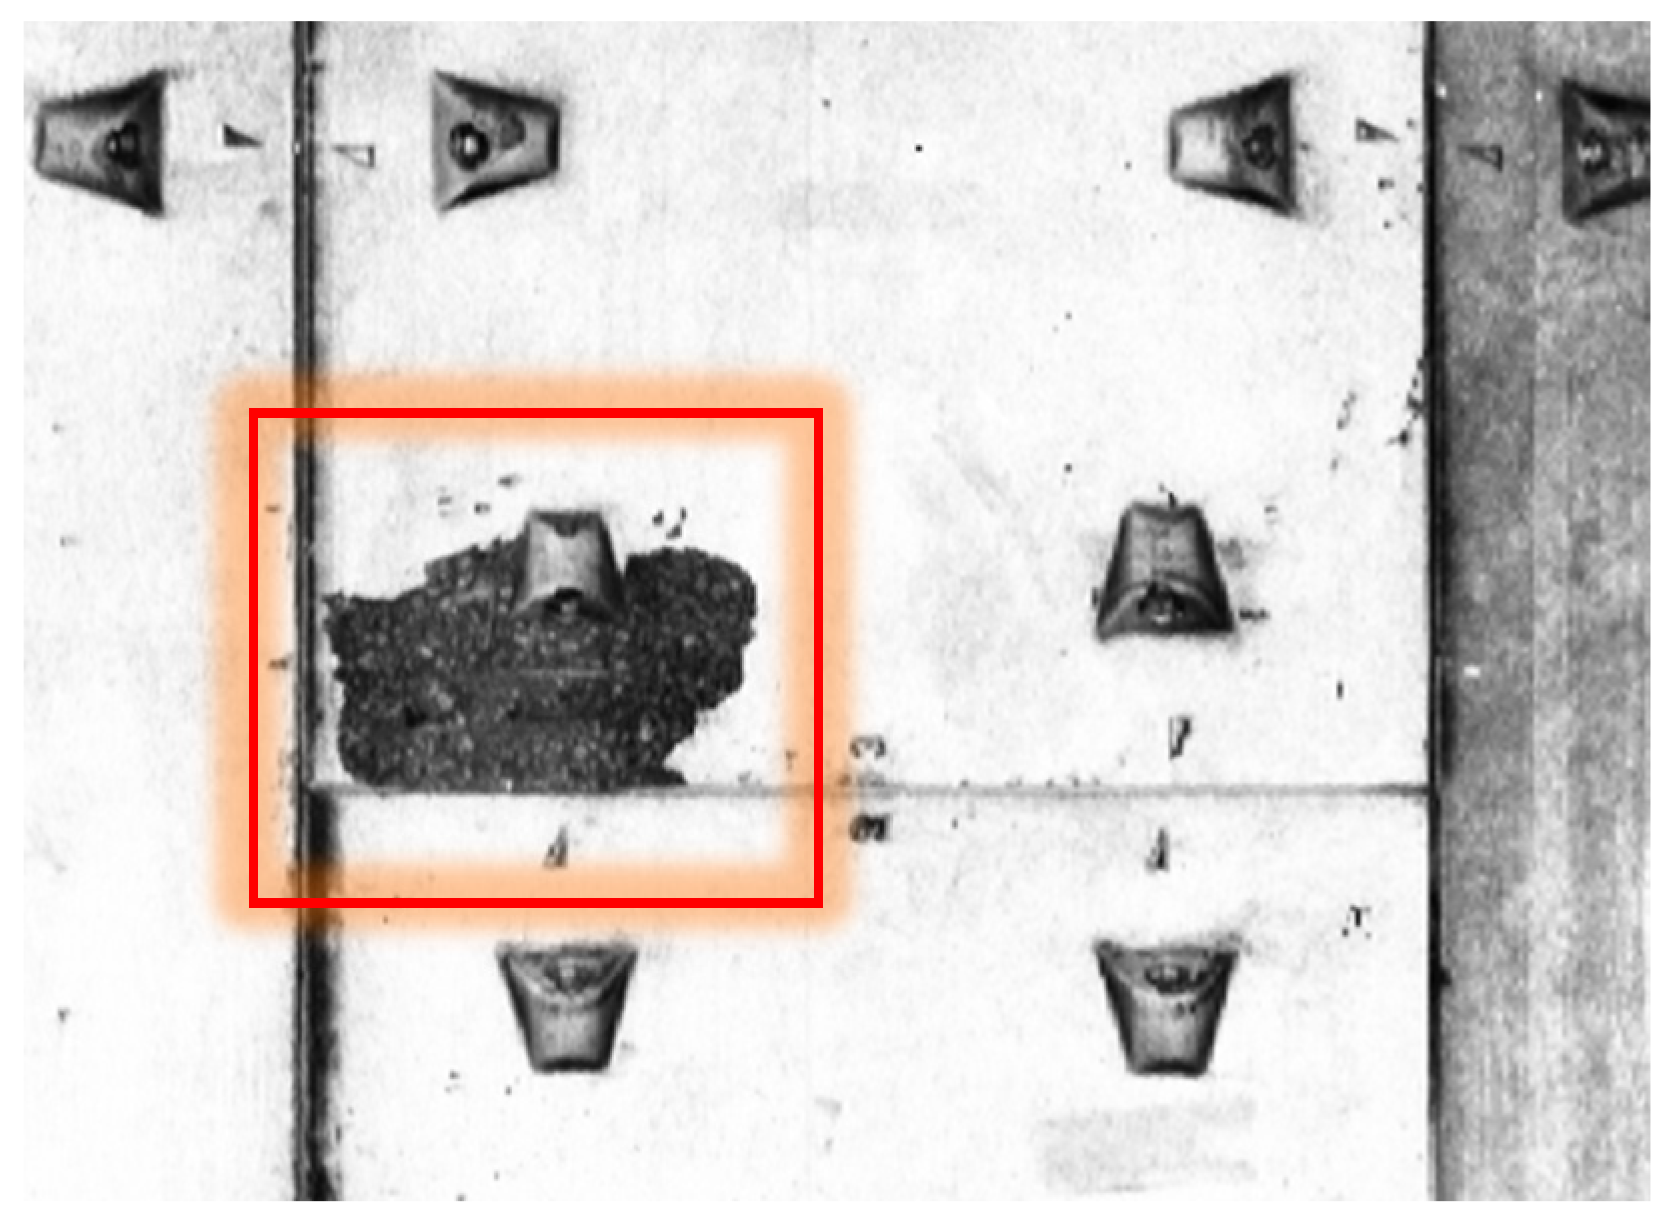
2. The gray-scale map at the spalling defect with the largest area (ring No. 403, area: 0.082m
2) is shown in
Figure 12.
3. Defect Association Analysis
For the purpose of revealing the root cause of the surface defects, the Apriori algorithm is used to mine the association between different surface defects of the shield tunnel.
3.1. Introduction to Apriori algorithm
Apriori algorithm is to find out frequent item sets and establish association rules by calculating the minimum support number [
25]. The advantage of this algorithm is that it can find and determine the frequent itemsets, and also can determine the association rules between transactions through calculation. Frequent itemsets refer to the itemsets whose occurrence times are greater than the minimum support number, while the confidence refers to the probability of the occurrence of two transactions at the same time under the association rules. The frequent itemsets and association rules can be quantified by support and confidence. The main purpose of the algorithm is to mine the association rules between transactions by finding multiple frequent itemsets and verifying them by successive calculation.
3.1.1. Support count
Support count refers to the number of specific itemsets in a transaction. The value of support count can determine the frequent transaction with number of transactions in the itemset. Assuming itemset
I={i1,i2,…,im}, and transaction set
T={t1,t2,…,tn}, the support count of itemset
I can be defined as:
3.1.2. Association rules and calculation process
Association rules [
24] reflect the association and dependency between multiple transactions. If several transactions have a certain association relationship, the Apriori algorithm can be used to find the frequent itemset, determine the association rules between transactions, and predict the occurrence probability of transactions. Association rules can be written in the form of
X →
Y. For frequent itemsets and association rules are then defined by support and confidence:
Support: Determines the minimum number of frequent itemsets.
Confidence: Determine occurrence frequency of
Y in transactions containing
X.
A strong association rule should have both high confidence and support. Assuming that the minimum confidence and support thresholds of the information data set
D are
Cmin and
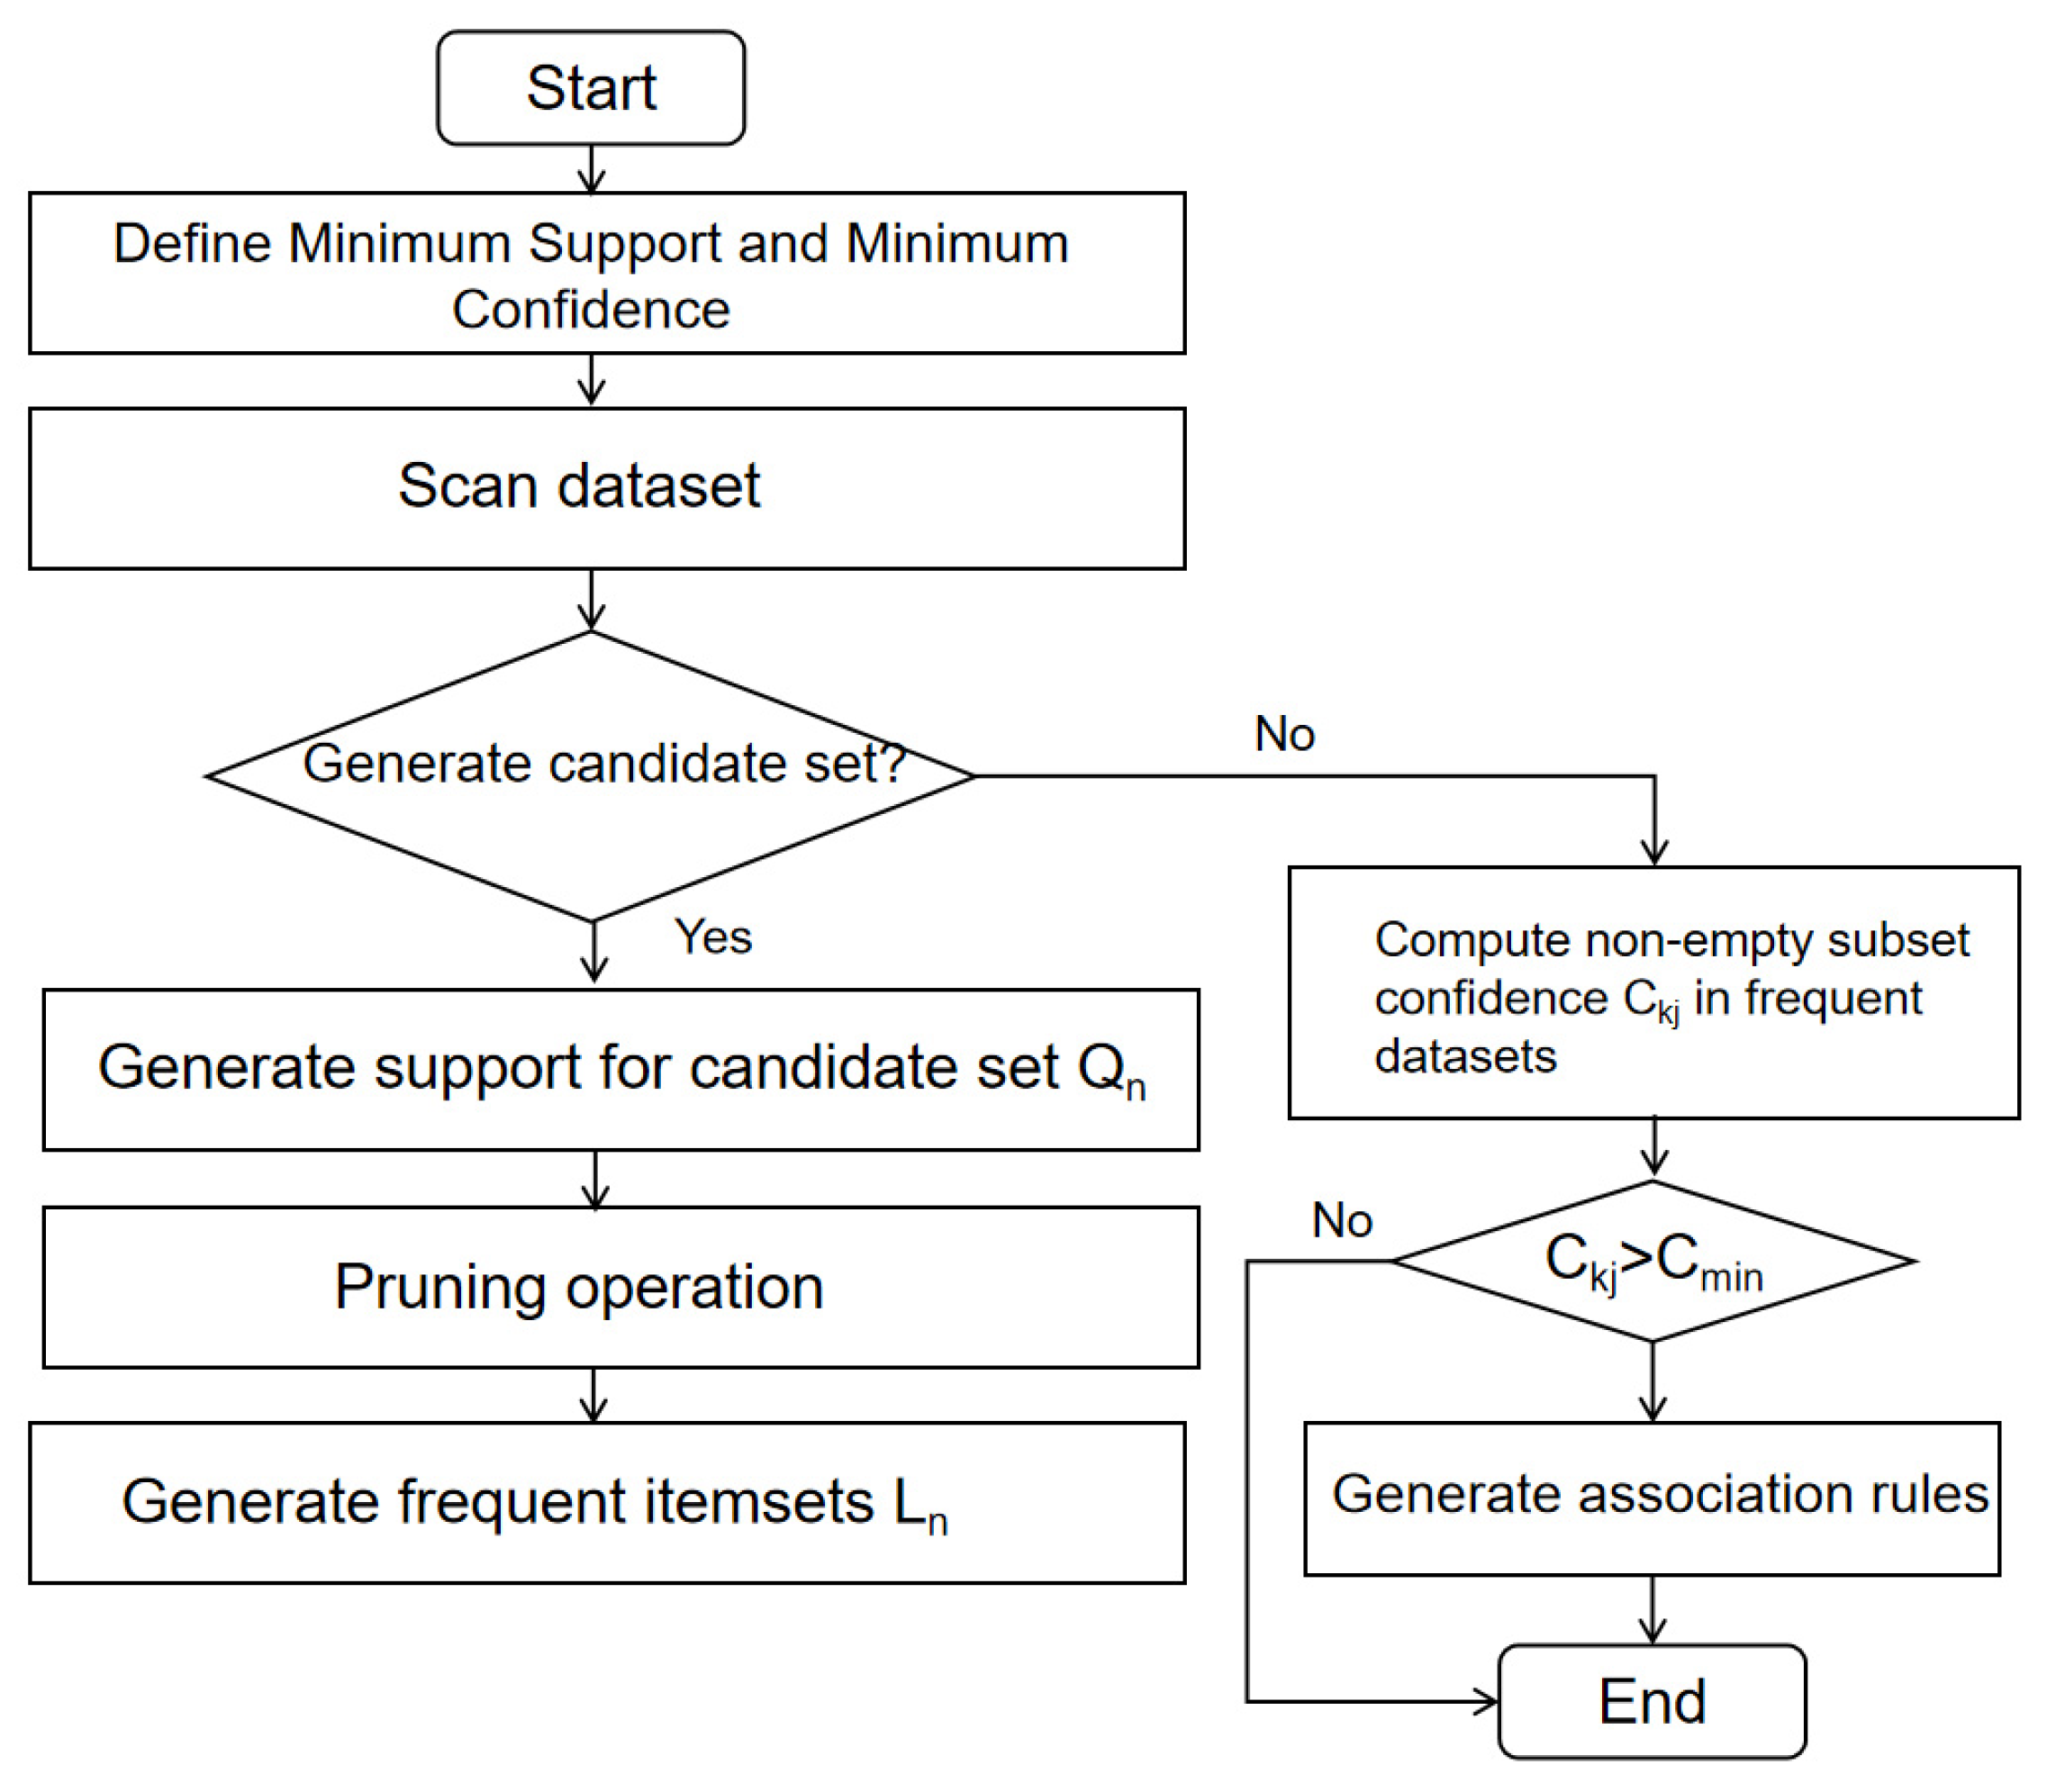
Smin, the calculation process is described as follows and the flowchart of the process is shown in
Figure 13.
Step 1: Searching the information data set D to generate L1 (frequent itemset): conduct a comprehensive search of the information dataset and count the support of each item. Items whose support count is no less than the product of the total number of transaction items in the information dataset D and the preset minimum support threshold are merged into L1.
Step 2: Connecting Lk-1 and generate a candidate Qk.
Step 3: Pruning: Lk and infrequent itemsets are included in Qk. First, based on the fact that all subsets of frequent itemsets are also frequent itemsets, delete the subsets in Qk which do not meet this requirement. Then search for the information data set D to calculate the support count of the remaining itemsets in Ck after the pruning operation step. Finally, find all Lk larger than the predetermined minimum support threshold Smin.
Step 4: Repeat the operations in Step 2 and Step 3 until Lk or Qk becomes an empty set.
Step 5: Generating association rule: calculate the confidence value Ckj of all non-empty subsets Lkj in each Lk separately. If Ckj > Cmin, it is defined as a strong association.
3.2. Defect Association Calculation
In defect association calculation, the data collections are divided into several groups and each group contains the inspection data of five rings. The minimum support number is set to 3. Then the frequent k itermsets (k = 1, 2, 3) will be determined and their supports will be calculated. At last, Apriori algorithm is used to establish association rules of multiple defects and calculate their confidences.
3.2.1. Calculation of support degree of defects
With the association calculation process, all groups with different combination of the surface defects as well as the support degree of each defect are obtained, as listed in
Table 1.
3.2.2. Frequent itemset Determination
By setting the minimum support number to 3, the calculation results of frequent k itemsets (k = 1, 2, 3) are obtained, as listed in
Table 2.
3.2.3. Confidence Calculation
(1) Determine the association rules: nine kinds of association rules are set in this calculation, which are “dislocation, spalling → water leakage”, “water leakage, spalling → dislocation”, “dislocation, water leakage → spalling”, “water leakage → spalling”, “water leakage → dislocation”, “dislocation → water leakage”, “dislocation → spalling”, “spalling → water leakage”, “spalling → dislocation”.
(2) Derive the confidence of “dislocation, spalling → water leakage”, “water leakage, spalling → dislocation”, “dislocation, water leakage → spalling” through the frequent 2- and 3-itemsets. Note that the left side of “→” is the existing defect, and the right side denotes the possible simultaneous defect. Confidence refers to the probability that when one defect exists, another defect exists at the same time. The confidence is defined as the number of occurrences of the frequent 3-itemset divided by the number of occurrences of the corresponding frequent 2-itemset.
(3) Similarly, the confidence of the other 6 association rules can be derived from the frequent 2-itemset and the frequent 1-itemset.
With the above calculation process, the result of confidences is summarized in
Table 3:
3.3. Discussion
Based on the above calculation of the association rules of the multiple defects, it is found that:
In different sections, the confidence level of each association is different, for example, the confidence level of “Dislocation, Spalling → Water leakage” and “Spalling → Water leakage” in Section3 is 100%, while the confidence level of the other two sections is less than 40%. There are also commonalities in the differences, such as the confidence of “Water leakage → Spalling” in all three sections is less than 20%.
1) On average, when there is water leakage defect in the tunnel, within the range of 5 rings around the defect, the probability of dislocation defect is 23.28%, and the probability of spalling defect is 13.00%; when there is a dislocation defect in the tunnel, within the range of 5 rings around the defect, the probability of spalling defect is 33.77%, and the probability of water leakage defect is 53.61%; when there is a spalling defect in the tunnel, within the range of 5 rings of the defect, the probability of water leakage defect is 51.01%, and the probability of dislocation defect is 43.73%.
2) When there are both dislocation and spalling defects at the same location, the probability of water leakage defect is 57.78% within the range of 5 rings; when there are both water leakage and spalling defects at the same location, the probability of dislocation defect is 55.56% within the range of 5 rings; when there are dislocation and water leakage defects at the same location, the probability of spalling defect is 31.88% within the range of 5 rings.
Results show that the confidence levels of some association rules are low, with the lowest “Water leakage → Spalling” having a confidence of only 13.00%. For such association rules with low confidence, taking this as an example, it can be considered that the probability of spalling due to water leakage is not high. In comparison, some association rules have quite high confidence levels, such as “dislocation, spalling → water leakage”, which has a confidence of 57.78%. Therefore, in the tunnel defect detection work, when the dislocation and spalling defect are found, it is necessary to detect water leakage defect around the dislocation and spalling defects. It can be inferred from the causes and phenomena of the three defects that the structure damage of the tunnel ring is caused by segment dislocation and spalling, which affects the waterproof performance and thus leads to the occurrence of water leakage defect.
4. Conclusions
In recent years, the problem surface defects of the shield tunnel gains the increasing attention of engineers and researchers with the rapid development of the subway. To ensure safety operation and enhance the serviceability of the tunnel structure, the efficiency and accuracy in defect detection become increasingly important. This paper first summarizes the common shield tunnel defects, including segment dislocation, water leakage, spalling and cross-section deformation. In terms of detection technology, considering the unique advantages of the laser scanning technology under the condition of subway inspection, this paper employs a laser scanning-based system to conduct in-situ tunnel inspection. With the inspection trolley, the massive point cloud data of the line section are acquired. With the image processing algorithm, the data of cross-section diameter, segment dislocation, water leakage and spalling are obtained from the gray-scale image of the tunnel.
Based on the dataset of the defects, a defect association analysis is carried out based on Apriori algorithm, as an attempt to reveal the cause of the surface defects. A total of nine sets of association rules are set up, and their confidence is calculated respectively. The correlation between different defects is then analysed. The results show that the two types of defects with the highest correlation degree is “dislocation → water leakage”, followed by “spalling → water leakage”, and the lowest correlation degree (i.e., “water leakage → spalling”) has a confidence of 13.00%. Significantly, some correlations between various defects in the tunnel are quite strong. Among them, the confidence of the association rule “dislocation, spalling → water leakage” is as high as 57.78%, which means that when detecting dislocation and spalling defects, it is necessary to focus on detecting whether there is water leakage defect around.
The results of association analysis can be used in the prevention of subway tunnel defects: when a defect is detected, it can predict the occurrence of other kinds of defects. Taking the association rule “dislocation → water leakage” as an example, when segment dislocation is detected in the tunnel, there is a 53.61% probability that there will be water leakage in the surrounding areas. The water leakage treatment scheme shall be formulated in time to treat or prevent the occurrence of leakage. During the operation of subway tunnel, it is suggested to pay more attention to the relationship between different structural defects, since it can help to enhance the operation safety of the subway and the reliability of the infrastructure.
Author Contributions
Conceptualization, Xiao-Zhou Liu and Zi-Ren Yin; methodology, Xiao-Zhou Liu; software, Zhanzhan Lei and Ao Zheng; validation, Zi-Ren Yin and Zhanzhan Lei; formal analysis, Zi-Ren Yin; investigation, Xiao-Zhou Liu, Zi-Ren Yin, Zhanzhan Lei and Ao Zheng; resources, Jiasong Zhu; data curation, Zhanzhan Lei, Ao Zheng and Zi-Ren Yin; writing—original draft preparation, Zi-Ren Yin; writing—review and editing, Xiao-Zhou Liu; visualization, Zi-Ren Yin and Zhanzhan Lei; supervision, Jiasong Zhu; project administration, Xiao-Zhou Liu; funding acquisition, Xiao-Zhou Liu. All authors have read and agreed to the published version of the manuscript.
Funding
This research was funded by the National Key R&D Program of China (Grants No. 2018YFB2101000), and funding support from Shenzhen Metro Group Company, Limited. Scientific Research Consulting Services (STJS-DT413-KY002/2021).
Data Availability Statement
All data, models, or code that support the findings of this study are available from the corresponding author upon reasonable request.
Conflicts of Interest
The authors declare no conflict of interest. The founding sponsors had no role in the design of the study; in the collection, analyses, or interpretation of data; in the writing of the manuscript, or in the decision to publish the results.
References
- Zhao, S.; Shadabfar, M.; Zhang, D.; Chen, J.; Huang, H. Deep learning-based classification and instance segmentation of leakage-area and scaling images of shield tunnel linings. Struct. Control. Heal. Monit. 2021, 28, e2732. [Google Scholar] [CrossRef]
- Attard, L.; Debono, C.J.; Valentino, G.; Di Castro, M. Tunnel inspection using photogrammetric techniques and image processing: A review. ISPRS J. Photogramm. Remote. Sens. 2018, 144, 180–188. [Google Scholar] [CrossRef]
- Gong, Q.; Zhu, L.; Wang, Y.; Yu, Z. Automatic subway tunnel crack detection system based on line scan camera. Struct. Control. Heal. Monit. 2021, 28, e2776. [Google Scholar] [CrossRef]
- D. Duan. W. Qiu, Y. D. Duan. W. Qiu, Y. Cheng, “Reconstruction of shield tunnel lining using point cloud,” Automation in Construction, vol. 130, Article ID 103860, 2021.
- Sánchez-Rodríguez, B. Riveiro, M. Soilán, “Automated detection and decomposition of railway tunnels from Mobile Laser Scanning Datasets,” Automation in Construction, vol. 96, pp. 171–179, 2018.
- Tan, K.; Cheng, X.; Ju, Q.; Wu, S. Correction of Mobile TLS Intensity Data for Water Leakage Spots Detection in Metro Tunnels. IEEE Geosci. Remote. Sens. Lett. 2016, 13, 1711–1715. [Google Scholar] [CrossRef]
- T. Asakura and Y. Kojima, “Tunnel maintenance in Japan,” Tunnelling and Underground Space Technology, vol. 18, no. 2, pp. 161–169, 2003.
- Afshani, A.; Kawakami, K.; Konishi, S.; Akagi, H. Study of infrared thermal application for detecting defects within tunnel lining. Tunn. Undergr. Space Technol. 2019, 86, 186–197. [Google Scholar] [CrossRef]
- Huang, Z.; Fu, H.; Chen, W.; Zhang, J.; Huang, H. Damage detection and quantitative analysis of shield tunnel structure. Autom. Constr. 2018, 94, 303–316. [Google Scholar] [CrossRef]
- Li, D.; Xie, Q.; Gong, X.; Yu, Z.; Xu, J.; Sun, Y.; Wang, J. Automatic defect detection of metro tunnel surfaces using a vision-based inspection system. Adv. Eng. Informatics 2020, 47, 101206. [Google Scholar] [CrossRef]
- Huang, H.; Sun, Y.; Xue, Y.; Wang, F. Inspection equipment study for subway tunnel defects by grey-scale image processing. Adv. Eng. Informatics 2017, 32, 188–201. [Google Scholar] [CrossRef]
- Y. Xue, P. Y. Xue, P. Shi, F. Jia, “3D reconstruction and automatic leakage defect quantification of metro tunnel based on SfM-Deep learning method,” Underground Space, vol. 7, no. 3, pp. 311–323, 2022.
- Xue, Y.; Li, Y. A Fast Detection Method via Region-Based Fully Convolutional Neural Networks for Shield Tunnel Lining Defects. Comput. Civ. Infrastruct. Eng. 2018, 33, 638–654. [Google Scholar] [CrossRef]
- Huang, H.-W.; Li, Q.-T.; Zhang, D.-M. Deep learning based image recognition for crack and leakage defects of metro shield tunnel. Tunn. Undergr. Space Technol. 2018, 77, 166–176. [Google Scholar] [CrossRef]
- Zhao, S.; Zhang, D.M.; Huang, H.W. Deep learning–based image instance segmentation for moisture marks of shield tunnel lining. Tunn. Undergr. Space Technol. 2019, 95, 103156. [Google Scholar] [CrossRef]
- Xu, X.; Yang, H. Vision Measurement of Tunnel Structures with Robust Modelling and Deep Learning Algorithms. Sensors 2020, 20, 4945. [Google Scholar] [CrossRef] [PubMed]
- Zhou, M.; Cheng, W.; Huang, H.; Chen, J. A Novel Approach to Automated 3D Spalling Defects Inspection in Railway Tunnel Linings Using Laser Intensity and Depth Information. Sensors 2021, 21, 5725. [Google Scholar] [CrossRef]
- Xu, T.; Xu, L.; Li, X.; Yao, J. Detection of Water Leakage in Underground Tunnels Using Corrected Intensity Data and 3D Point Cloud of Terrestrial Laser Scanning. IEEE Access 2018, 6, 32471–32480. [Google Scholar] [CrossRef]
- Yi, C.; Lu, D.; Xie, Q.; Xu, J.; Wang, J. Tunnel Deformation Inspection via Global Spatial Axis Extraction from 3D Raw Point Cloud. Sensors 2020, 20, 6815. [Google Scholar] [CrossRef]
- Fahmy, M.; Moselhi, O. Automated Detection and Location of Leaks in Water Mains Using Infrared Photography. J. Perform. Constr. Facil. 2010, 24, 242–248. [Google Scholar] [CrossRef]
- Yu, T.; Zhu, A.; Chen, Y. Efficient Crack Detection Method for Tunnel Lining Surface Cracks Based on Infrared Images. J. Comput. Civ. Eng. 2017, 31. [Google Scholar] [CrossRef]
- Konishi, S.; Kawakami, K.; Taguchi, M. Inspection Method with Infrared Thermometry for Detect Void in Subway Tunnel Lining. Procedia Eng. 2016, 165, 474–483. [Google Scholar] [CrossRef]
- Cui, H.; Ren, X.; Mao, Q.; Hu, Q.; Wang, W. Shield subway tunnel deformation detection based on mobile laser scanning. Autom. Constr. 2019, 106. [Google Scholar] [CrossRef]
- Zhou, Y.; Wang, S.; Mei, X.; Yin, W.; Lin, C.; Hu, Q.; Mao, Q. Railway Tunnel Clearance Inspection Method Based on 3D Point Cloud from Mobile Laser Scanning. Sensors 2017, 17, 2055. [Google Scholar] [CrossRef]
- Dong, S.; Zhong, J.; Hao, P.; Zhang, W.; Chen, J.; Lei, Y.; Schneider, A. Mining multiple association rules in LTPP database: An analysis of asphalt pavement thermal cracking distress. Constr. Build. Mater. 2018, 191, 837–852. [Google Scholar] [CrossRef]
|
Disclaimer/Publisher’s Note: The statements, opinions and data contained in all publications are solely those of the individual author(s) and contributor(s) and not of MDPI and/or the editor(s). MDPI and/or the editor(s) disclaim responsibility for any injury to people or property resulting from any ideas, methods, instructions or products referred to in the content. |
© 2023 by the authors. Licensee MDPI, Basel, Switzerland. This article is an open access article distributed under the terms and conditions of the Creative Commons Attribution (CC BY) license (http://creativecommons.org/licenses/by/4.0/).
