Preprint
Article

Effects of Rotational Speed on Performance Prediction of Pump As Turbine For energy generation and Green Development

Altmetrics

Downloads

206

Views

45

Comments

0

Submitted:

24 April 2023

Posted:

25 April 2023

You are already at the latest version

Alerts
Abstract
Small hydro-power systems seem to be the best solution for energy generation through the use of pump as turbine (PAT) due to its low cost and lesser environmental hazards associated with it. Recently, PAT applications are gaining global attention in energy generation but its operation is not fully understood. The performance and flow behavior is affected by several operational conditions. This study seeks to investigate the effects of rotational speed on flow behavior and performance of a PAT. Rotational speed is an important physical parameter that affects the operation of a PAT. A selected centrifugal pump model of four blades and splitters was used for the study. Numerical simulations were carried out using k-ε turbulence model to solve the three-dimensional (3D) equations in both pump and PAT modes. The outcomes were then validated using experimental results in the pump mode to obtain overview flow physiognomies. The results predicted that the efficiency increases as the rotational speed increases in the pump mode whereas in turbine mode, higher rotational speed cannot convert hydraulic energy into mechanical energy. Thus, a rotational speed of 1500 rpm performed the highest efficiency of 69.8% at QBEP among the other rotational speeds selected. Moreover, the head performance in the turbine mode increases as the flow rate increases. This research provides useful information which will help improve PAT performance as well as selecting PAT for small hydro-power site.
Keywords: 
Subject: Engineering  -   Energy and Fuel Technology

1. Introduction

Using pump as a hydraulic turbine for small hydro-power (SHP) generation is the best alternative. Small hydro-power can perform a vital role in providing electricity to rural settlement. According to Zhang J. et.al [1], global small hydro-power installed size witnessed a growth of about 4%, an approximation of 78 GW in 2016. Access to Energy is an essential parameter for the development of every country. With the growing demand for energy sources, the use of renewable for energy has in recent times gain global attention. Renewable energy resources such as wind, solar, biomass and small hydro-power have the potential to overcome these high demand problems. Small hydro-power can be an important source for energy supply and may also deliver additional support to the national grid by using Pump As Turbine (PAT). A study was conducted to analyze the need for small hydro-power plants [2,3,4]. PAT performance takes diverse best efficiency point caused by the dissimilarity of fluid-dynamic operating conditions. Mosè Rossi et al. conducted a test to investigate PAT performance [5]. Derakhshan, A. et.al, conducted a study on the efficiency PAT using analytical methods. It was observed that results from numerical simulation were in good agreement with experimental results for pump performance at various working condition including the best efficiency point [6]. An experimental study was conducted by [7] to determine the energy efficiency gain when PAT is used in place of conventional hydro turbines for hydro-power generation. The efficiency of pump was tested both at pump mode and PAT, and the results were finally compared. Results revealed that PAT operates better in maximum head and flow condition than pump An experimental study on the influence of impeller diameter then rotating speed on PAT operation was conducted by Sanjay V. Jain a, et.al [8]. By adjusting geometry such as impeller diameter the impact was detected [8]. Suarda et al. carried out an experimental analysis using two small pumps to show pumps as turbine performances. [9]. Several studies have been conducted by various researchers to improve this performance [10,11,12,13] Derakhshan, S. conducted a study with gradient-based optimization method comprising of partial sensitivities to reshape the impeller blade for turbo-machinery with the intention of attaining maximum efficiency. [14]. PAT performance was investigated using experimental approach by way of crushing inlet trimmings of impeller tips [15]. Singh, P. et al., adopted various ways to improve PAT operation through adjustment of pump geometry such as inlet casing rings, removal of casing eye lib, rounding of impeller inlet edges expanding the suction eye.[16]. The conclusion was that the impeller rounding method is vital for PAT performance optimization and suggested its use for all PAT projects.An Experimental study was performed by Pandey to predict the improvement of PAT performance characteristics [17]. Several studies have been carried out by many researchers on electrochemical water splitting for hydrogen generation since it also has the potential to support primary energy supply years to come. It was suggested that hydrogen generation and vector of energy using electrolysis and photovoltaic solar energy could be improved through an appropriate electrolytes selection [18,19,20]. Rathinam, N.K. et.al conducted a study on extremophilic electrocatalytic processes and concluded that MEC process does not require a large amount of external voltage when equated to water electrolysis. However, it has numerous difficulties challenges in the direction of the hydrogen production rate, high internal resistance [21,22]. The major challenge to PAT operation at the part -load condition is its lower efficiency compared to traditional turbines. It is therefore necessary to improve its performance to overcome this challenge. Although several researchers have contributed in PAT performance improvement, none has considered pump with splitter blade. Therefore, a typical pump having splitter blade was used for this study. A study was conducted by a review of various studies to analyse the cost and efficiency of PAT performance to better its operation using the cost adjustment of impeller and volute casing. Stefanizzi et al., carried out a study to investigate the development of precise and robust models for prediction of Pump a S turbine performance. The suggested model was used on several set of pumps based on The results, a new model is suggested, considering a greater sample constituted by gathering different pumps. Similar studies have been conducted by other researchers [25,26,27].

2. PAT model

A centrifugal pump of specific speed, 47 with four impeller blades and four splitter blades was selected to operate as a PAT in this study. The head, flow rate, rotational speed and efficiency operational parameters of the centrifugal pump used were 32 m, 12.5 m3/h, 2900 rpm and 56% respectively. This pump is mainly composed of long straight pipes, with outlet impeller width of 0.006 m, and a blade outlet angle of 30°, the impeller inlet and outlet diameters of 0.104 m and 0.16 m, respectively. The PAT model was created by means of the PTC Creo 5.0 software. Summary of design parameters of the selected PAT model under study are displayed in Table 1

3. Numerical simulations

3.1. Description of entire PAT fields

Figure 1 displays the summary of the created computational meshes. The entire selected pump field of PAT for modelling remained divided into six parts namely suction pipe, wear ring, front chamber, back chamber, impeller and volute. The hybrid meshes were generated with a mesh generation tool called ANSYS-ICEM 17.5. The impeller mesh was generated via tetrahedron unstructured mesh with hexahedron structured mesh method for the other parts. As mesh number has a prodigious influence on simulation results, mesh independence study was conducted by Zhang et al. [17].

3.2. Numerical simulation structure

The simulation set up as generated by Adu et.al, [28,29] was used for this study. The outcomes from the steady simulation were used to initiate the unsteady simulation since it gave a general idea of the pump flow behaviour. All boudry conditions well set.The k-omega (k-ω) turbulence model was selected to for the study calculate the turbulence kinetic energy.
The impeller was set to rotate at time step of 0.0002222 s which represents 2°. The impeller was set to revolve for 12 times with a total time of 0.48 s. Thus, 2150 transient results were obtained for the entire numerical simulations. By changing flow conditions, both pump and PAT modes characteristic curves were obtained. Average turbulence intensity was set to 5% at the inlet.

4. Experimental setup

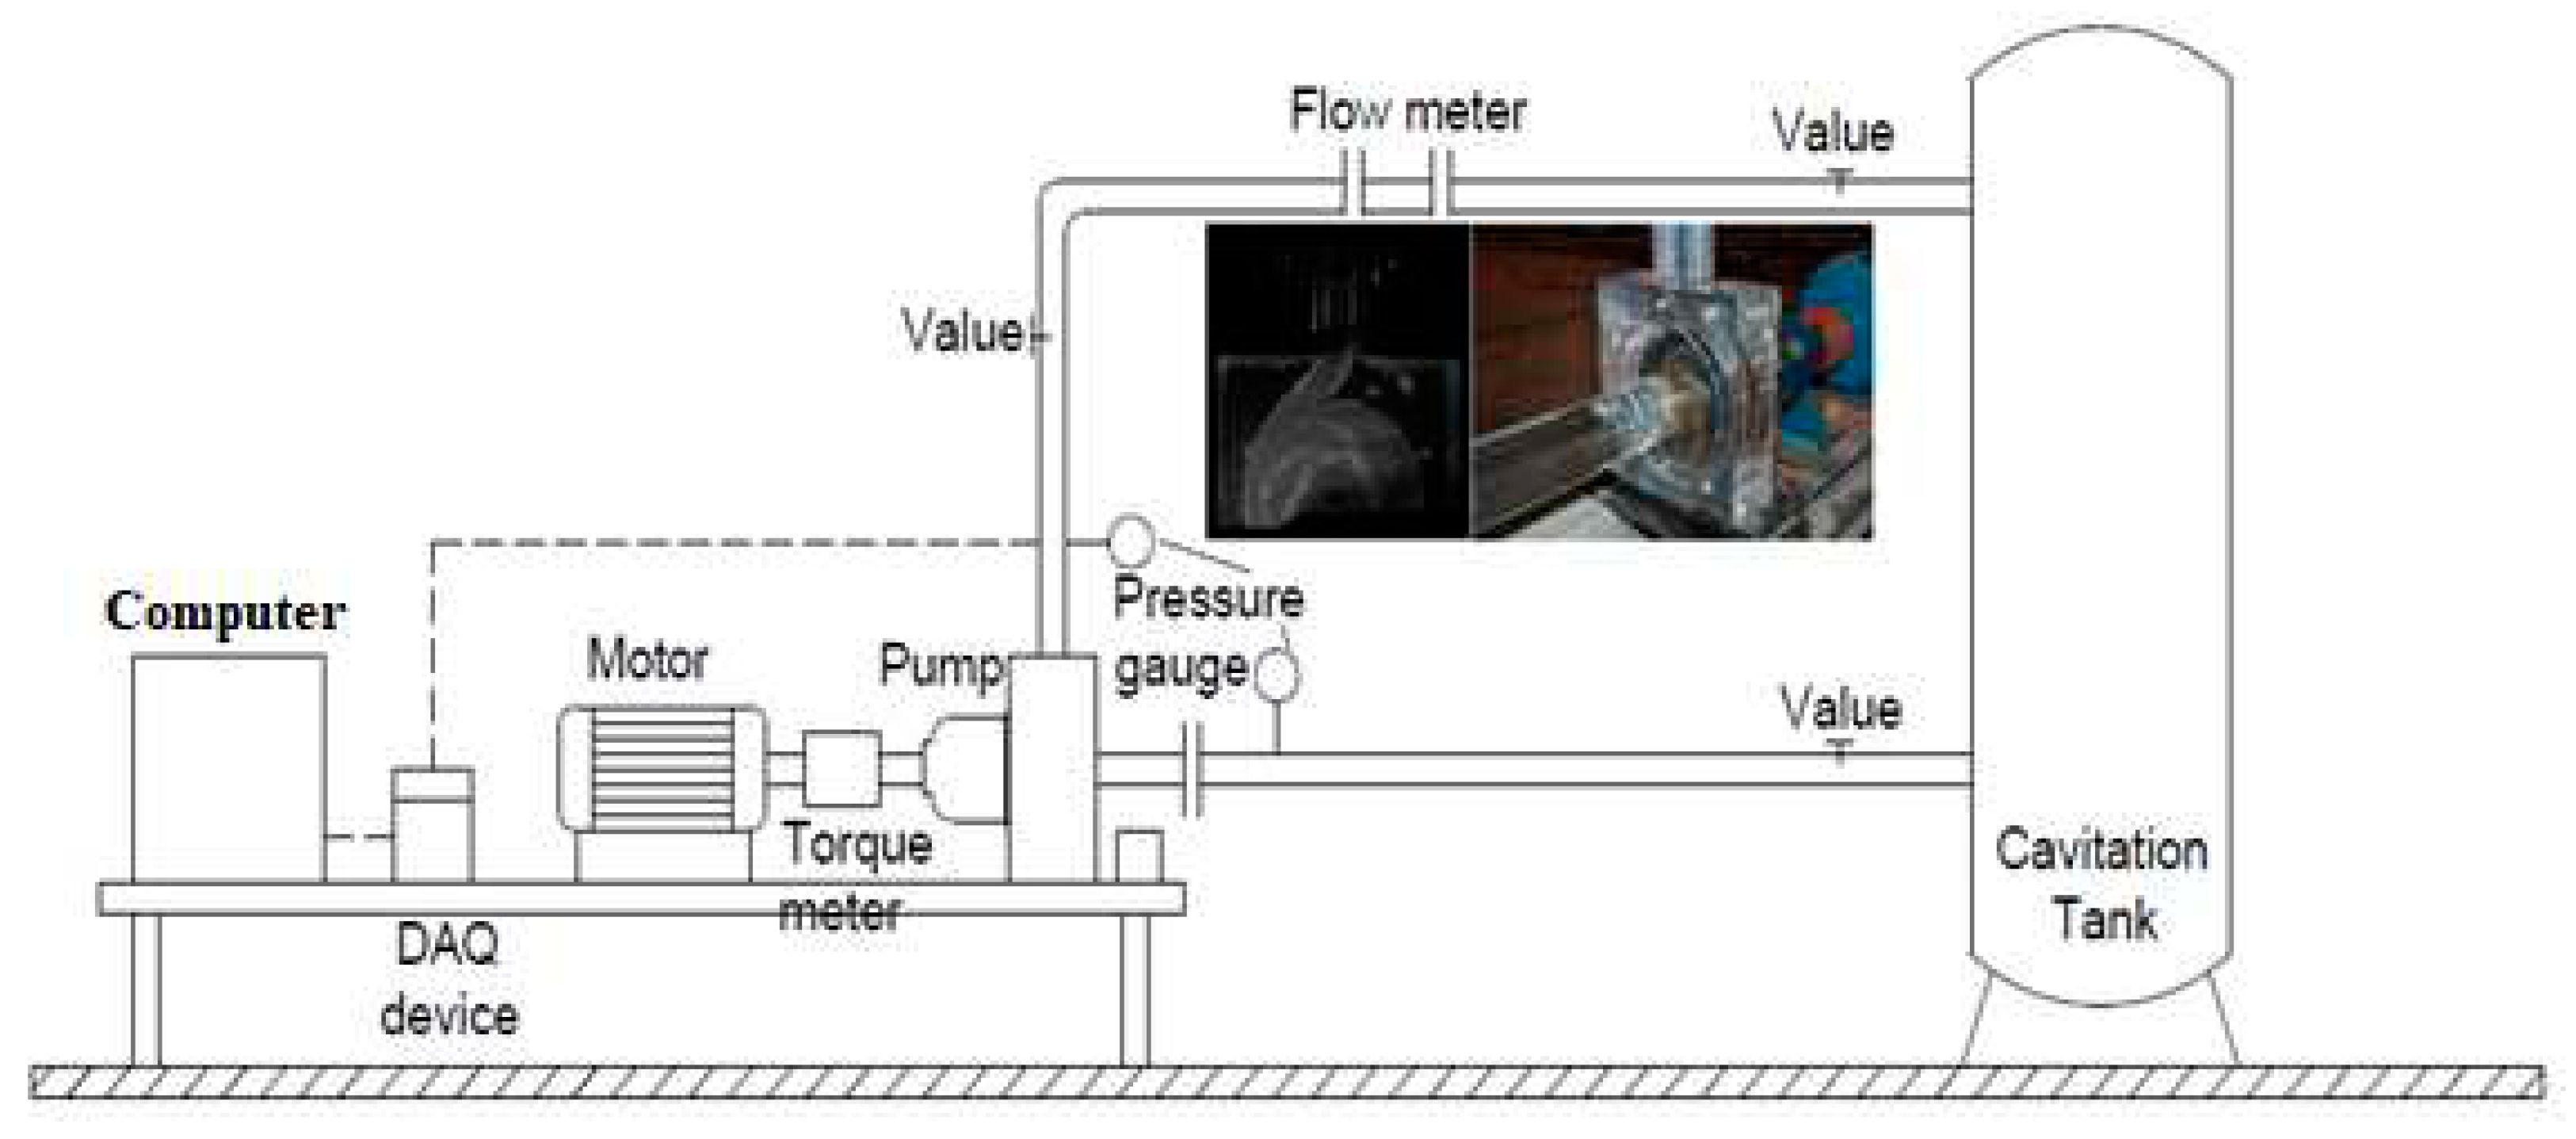
Since the experimental study is very important in verifying the accuracy of the numerical results, an experimental study was conducted at the National research center of pumps in Jiangsu University, Zhenjiang, China PR; as describe by Adu et.al, [[23[M1] ] using the test rig as shown in Figure 2. The experiment continue for a number of times to achieve a reliable result.

5. Results and discussions

5.1. pump characteristics curves

The characteristics of selected centrifugal Pump curves were attained for a rotating speed of n= 2900 rpm whereas the valve located at the distribution pipe was used to regulate fluid movement at different operating conditions. The suction and discharge pressures were obtained for head and efficiency curves calculation as can be seen in Figure 3. In the pump mode, head curve decreased gently as the flow increases as it reached the BEP thus QBEP = 22.5 m3/h as shown on efficiency curve and the deviation which occurred in the results obtained from CFD and experiment remained about 3%. Considering the design point results, the deviations obtained from CFD and experimental for efficiency and head were 5.2% and 10.07% indicating that a slight deviation exists amongst CFD results and experiment results at all operating conditions. This is partly attributed to the neglect of machine-driven and volumetric losses in the numerical simulations. The maximum deviation occurred on at the QBEP on the head curve and this makes the numerical results reliable to depend on for further analyses.

5.2. Effect of rotational speed on PAT performance

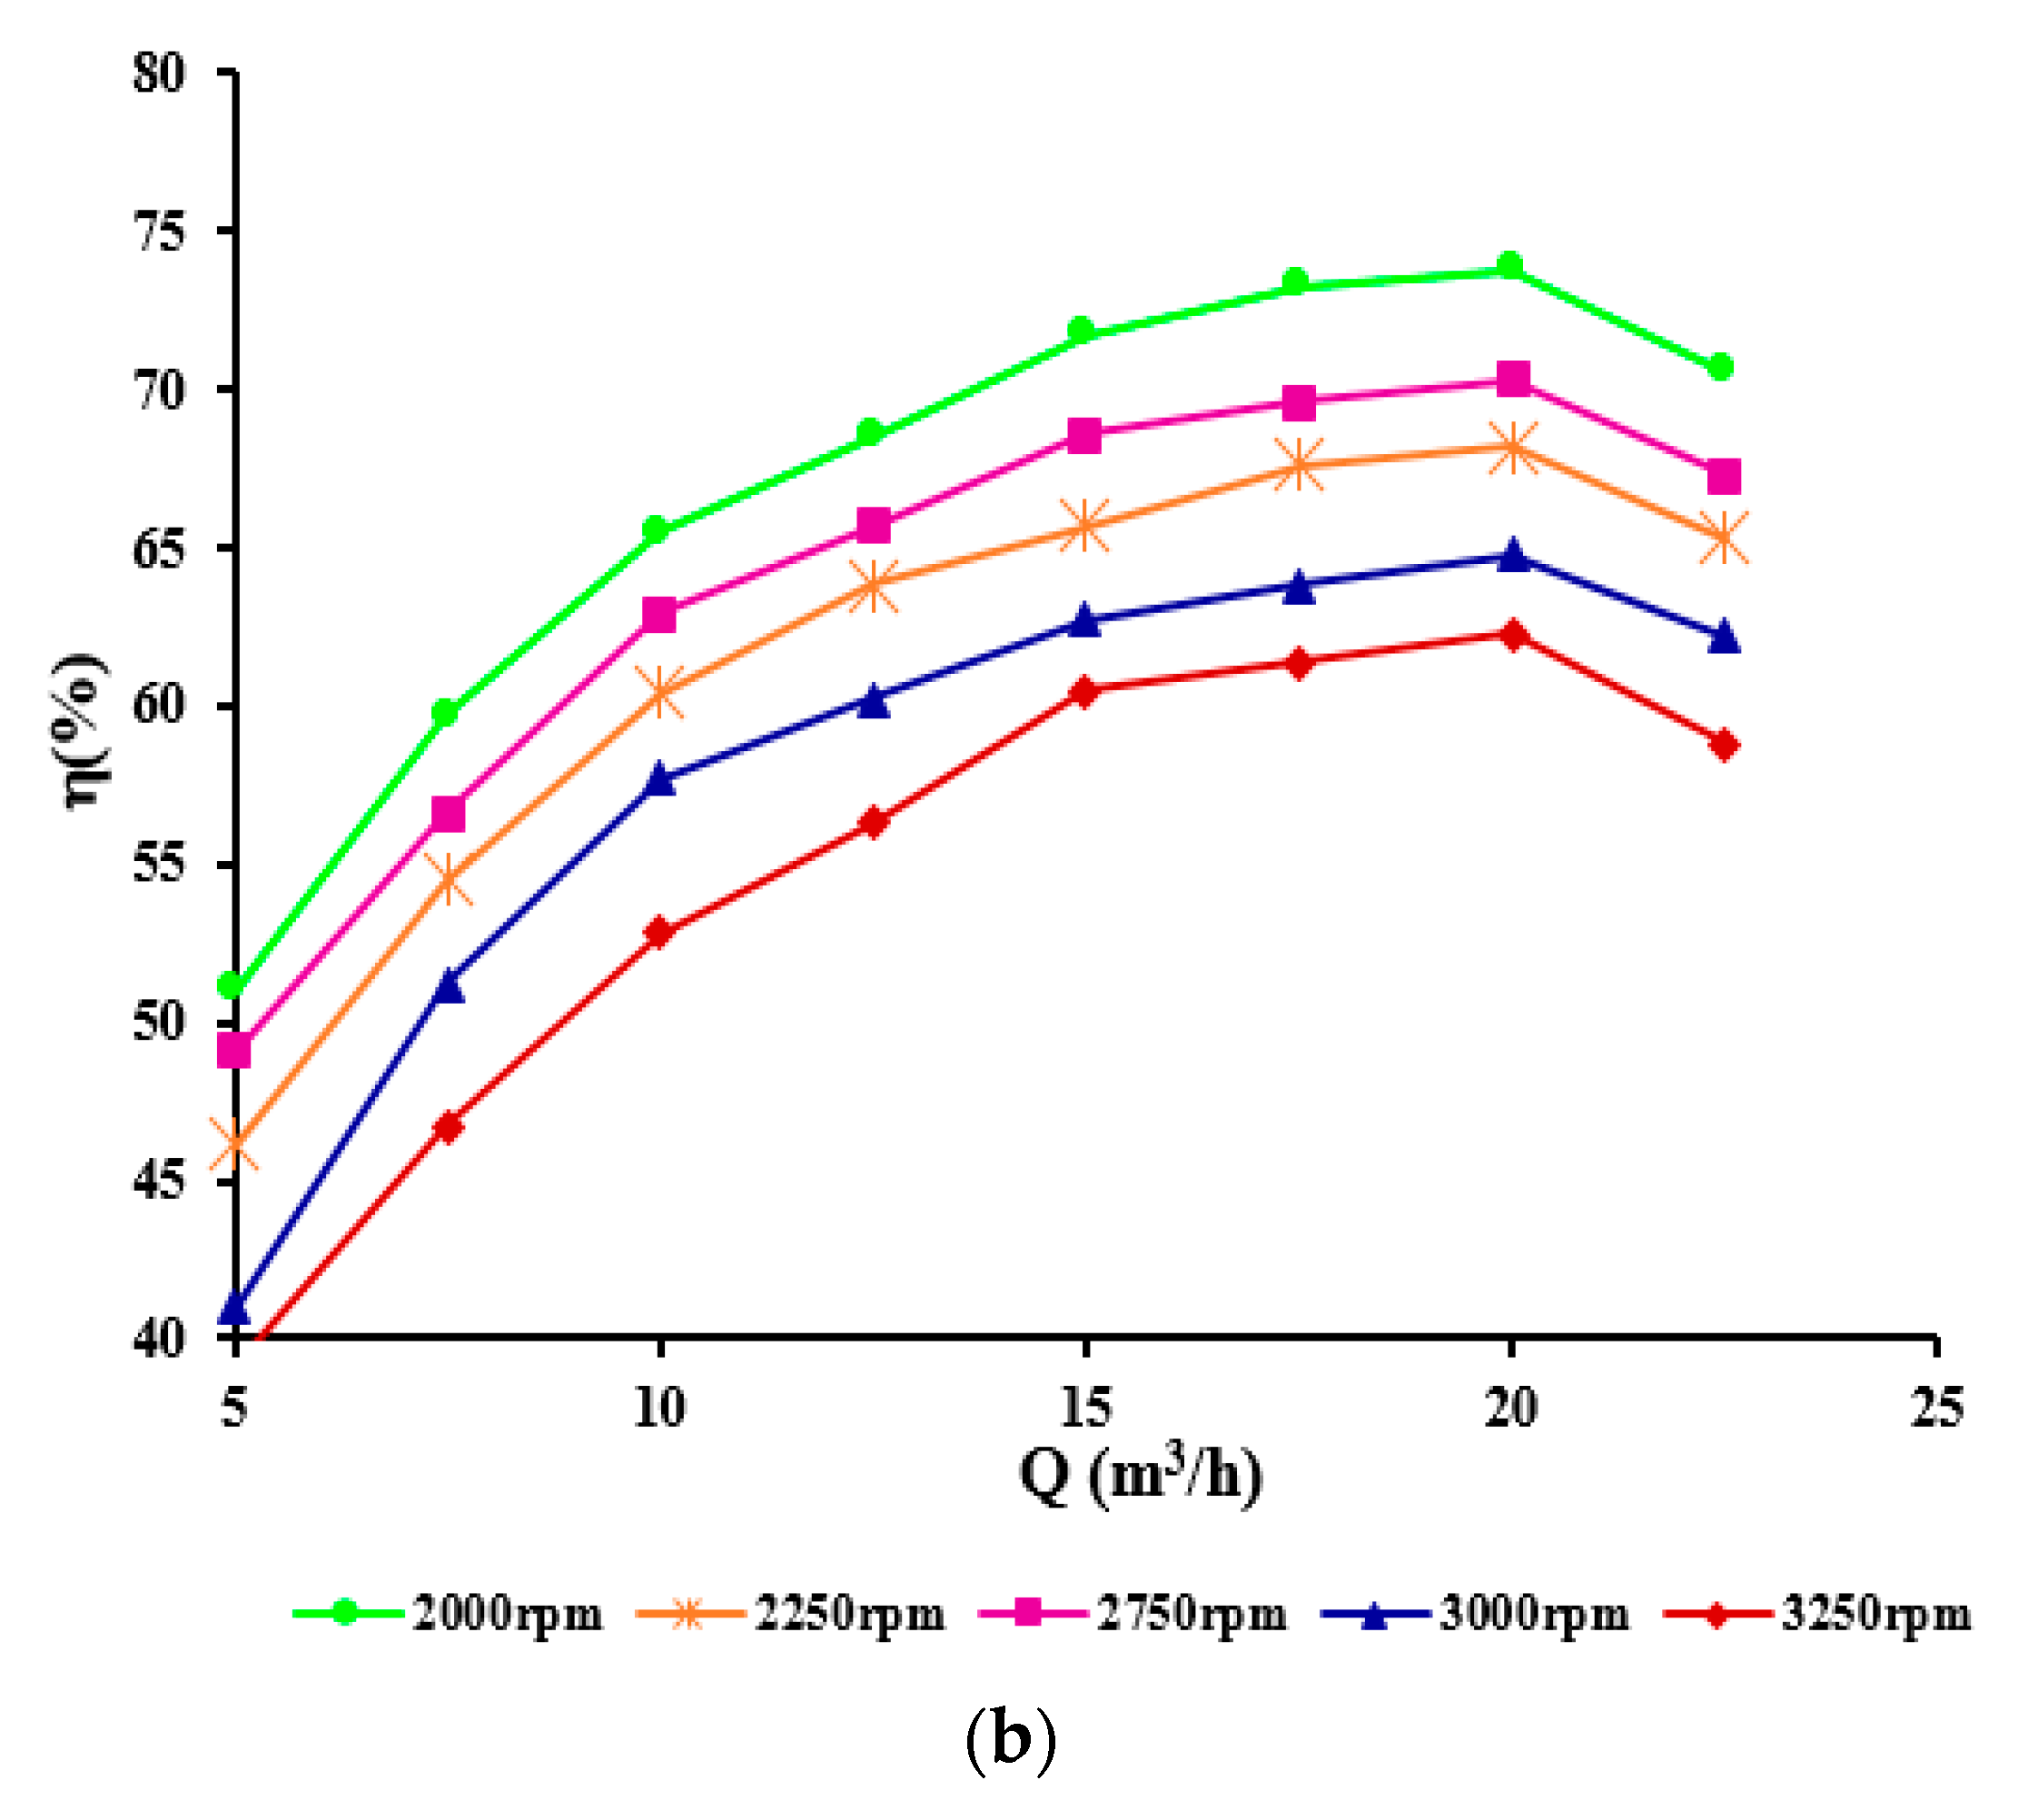
In order to evaluate the effects and predict the optimal rotational speed in a PAT, different rotational speeds between n= 2000 rpm and n= 3250 rpm have been studied in the pump mode to acquire overview characteristics of its operation. Figure 4a shows the head performance in the pump mode at different rotational speeds. The head performance at each operating condition increases as the rotational speed increases. At rotational speed, n= 2000 rpm, the maximum head recorded at Q= 5 m3/h was 22.4 m whereas at n= 3250 rpm the head increase by 52.7% at the same operating condition. This is because the velocity of the fluid increases as the rotational speed increases. Subsequently, this leads to higher fluid energy at higher rotational speeds. Thus, as the rotational speed increases the head increases in the pump mode. A counter-trend is observed with the efficiency performance curves at the same rotational speed in Figure 4b. As the rotational speed increases the efficiency decreases at all operating conditions. At design point, Q= 12.5 m3/h, rotational speed n= 2000 rpm produced an efficiency 14% more than n= 3250 rpm. The efficiency deviation between n= 2000 rpm and n= 3250 rpm increased by 0.9% more as the flow approaches the QBEP.
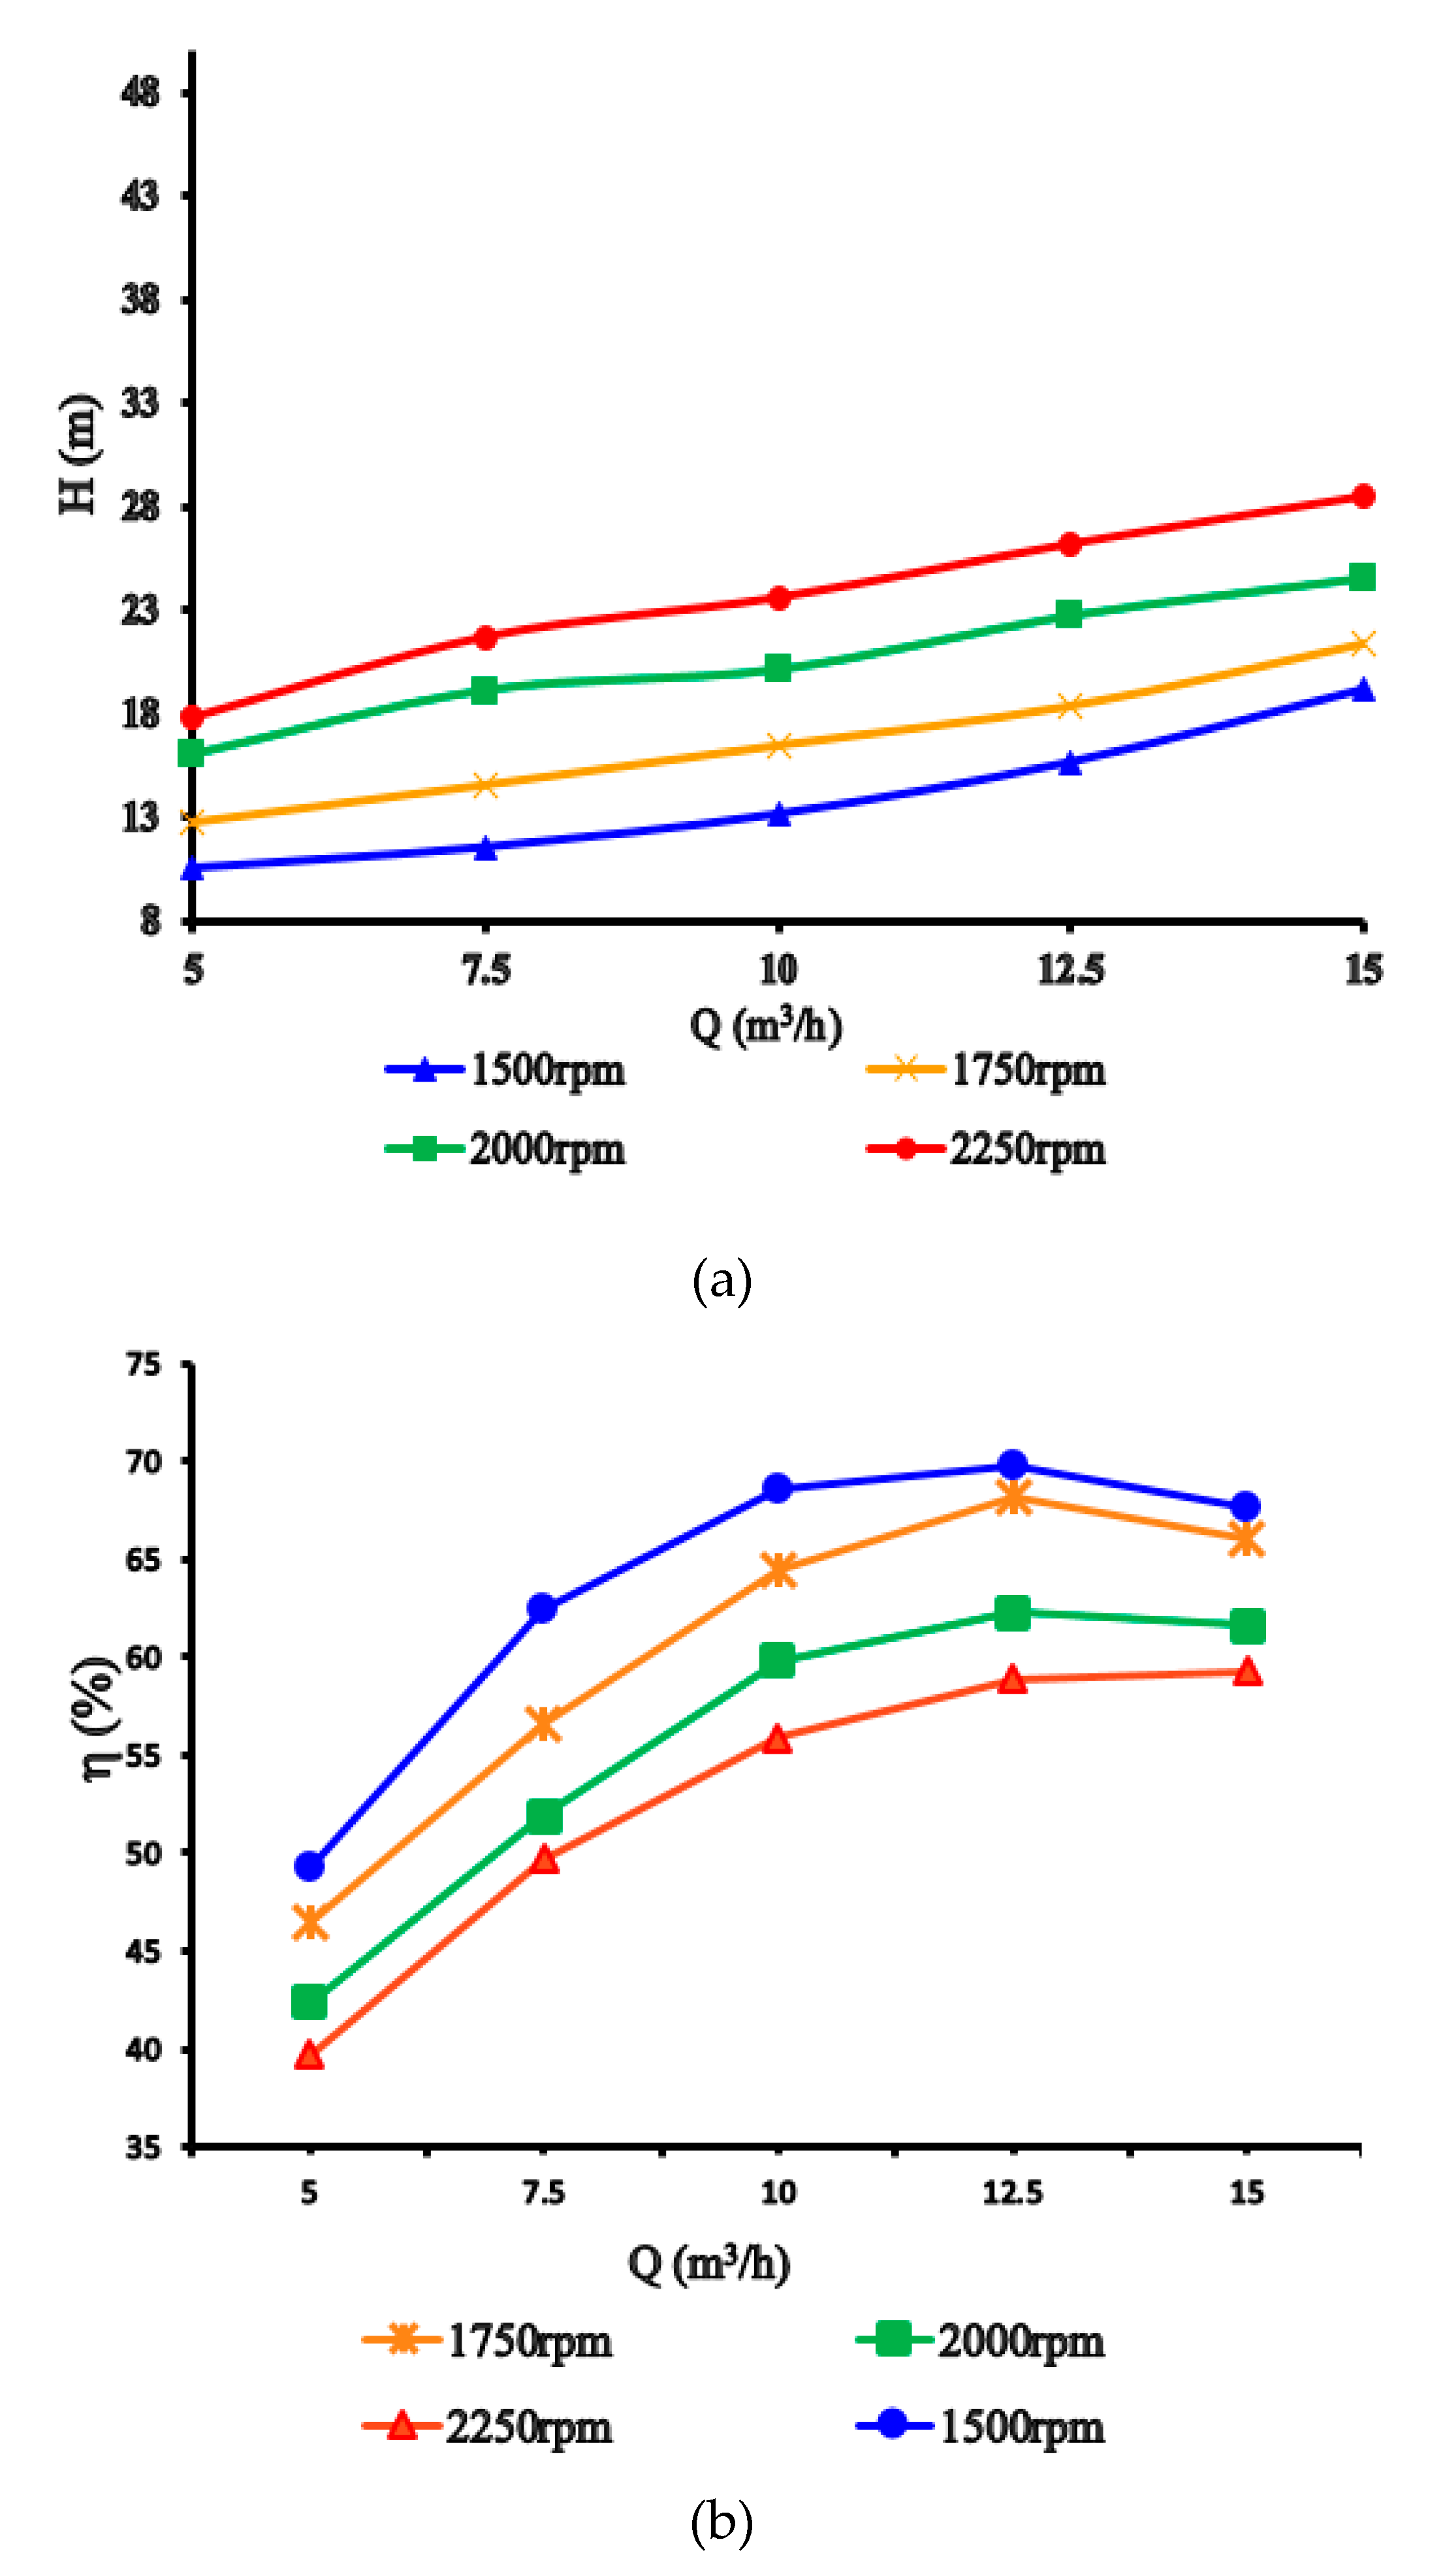
Figure 5a shows the head performance curve in PAT mode.
Unlike pump mode the head increases as the rotational speed increases in turbine mode. Moreover, as the rotational speed increases the head increases. The efficiency performance in Figure 5b in turbine mode was optimal at lower rotational speeds because the conversion of hydraulic energy to mechanical energy is inefficient at higher speeds. The efficiency curves increase as the flow rate increases and decreased after the maximum efficiency, ηBEP. Rotational speed, n= 1500 rpm recorded the highest efficiency of 69.8% at QBEP among the other rotational speeds. However, at n= 1750 rpm, an efficiency decrease of about 2.3% is observed compared to n= 1500 rpm. Moreover, higher rotational speeds such n= 2250 rpm, the efficiency recorded at QBEP is about 58.9% which represents about 15.6% decrease in efficiency. For this reason, as rotational speed increases, the PAT mode performance seems poor thus n= 1500 rpm and n= 1750 rpm are likely to be optimal rotational speed for PAT operation. There are some dimensionless parameters which are essential in determining PAT performance characteristics. They comprise head, flow and power coefficient. The similarities which exist among these parameters is that each variable coefficient are made dimensionless by standardizing with diameter (D) and rotation speed (n) .all these parameters require variables such as gravity and density to standardize except flow coefficient.
Head coefficient is express as
Preprints 71747 i001
Flow coefficient is express as:
Preprints 71747 i002
Power coefficient is express as
Preprints 71747 i003

5.3. Pressure Distribution in PAT

In order to analyze the inner flow characteristics in the PAT mode, the pulsating head curve is plotted against time step to obtain the maximum and minimum head data in Figure 6. The pulsating curve shows four major and minor peaks and valleys representing the blade and splitter numbers. The maximum and minimum points are clearly depicted. Figure 7 shows the static pressure distribution at a minimum and maximum heads. The average pressure distribution at a maximum point is higher than the minimum point thus the inner flow behavior in the PAT are analyzed using the maximum head. Numerical results conforming to a maximum head time step is used for all numerical analysis.
Figure 8a shows the pressure distribution at different operating conditions at n= 1500 rpm. The pressure distribution at the inlet is over and above the outlet in various working circumstances because the fluid energy at high elevation is extracted by PAT pump. As the flow rate increases, inlet pressure decreases due to various losses such as rotational losses. Generally, the impeller eye and blade leading edge recorded low pressure compared to the trailing edge. The pressure distribution in the volute increases gradually as the flow increases. Moreover, very low pressure are observed in the impeller passage at Q= 12.5 m3h and Q= 15 m3/h. As the rotational speed increases to n= 1750 rpm, the pressure at the inlet decreases especially at Q= 15 m3/h in Figure 8b. It is very obvious that higher rotational speed cannot convert fluid energy into mechanical energy. At n= 1750 rpm, the pressure distribution at the leading edge remained higher than the trailing edge.

5.4. Velocity Distribution in PAT

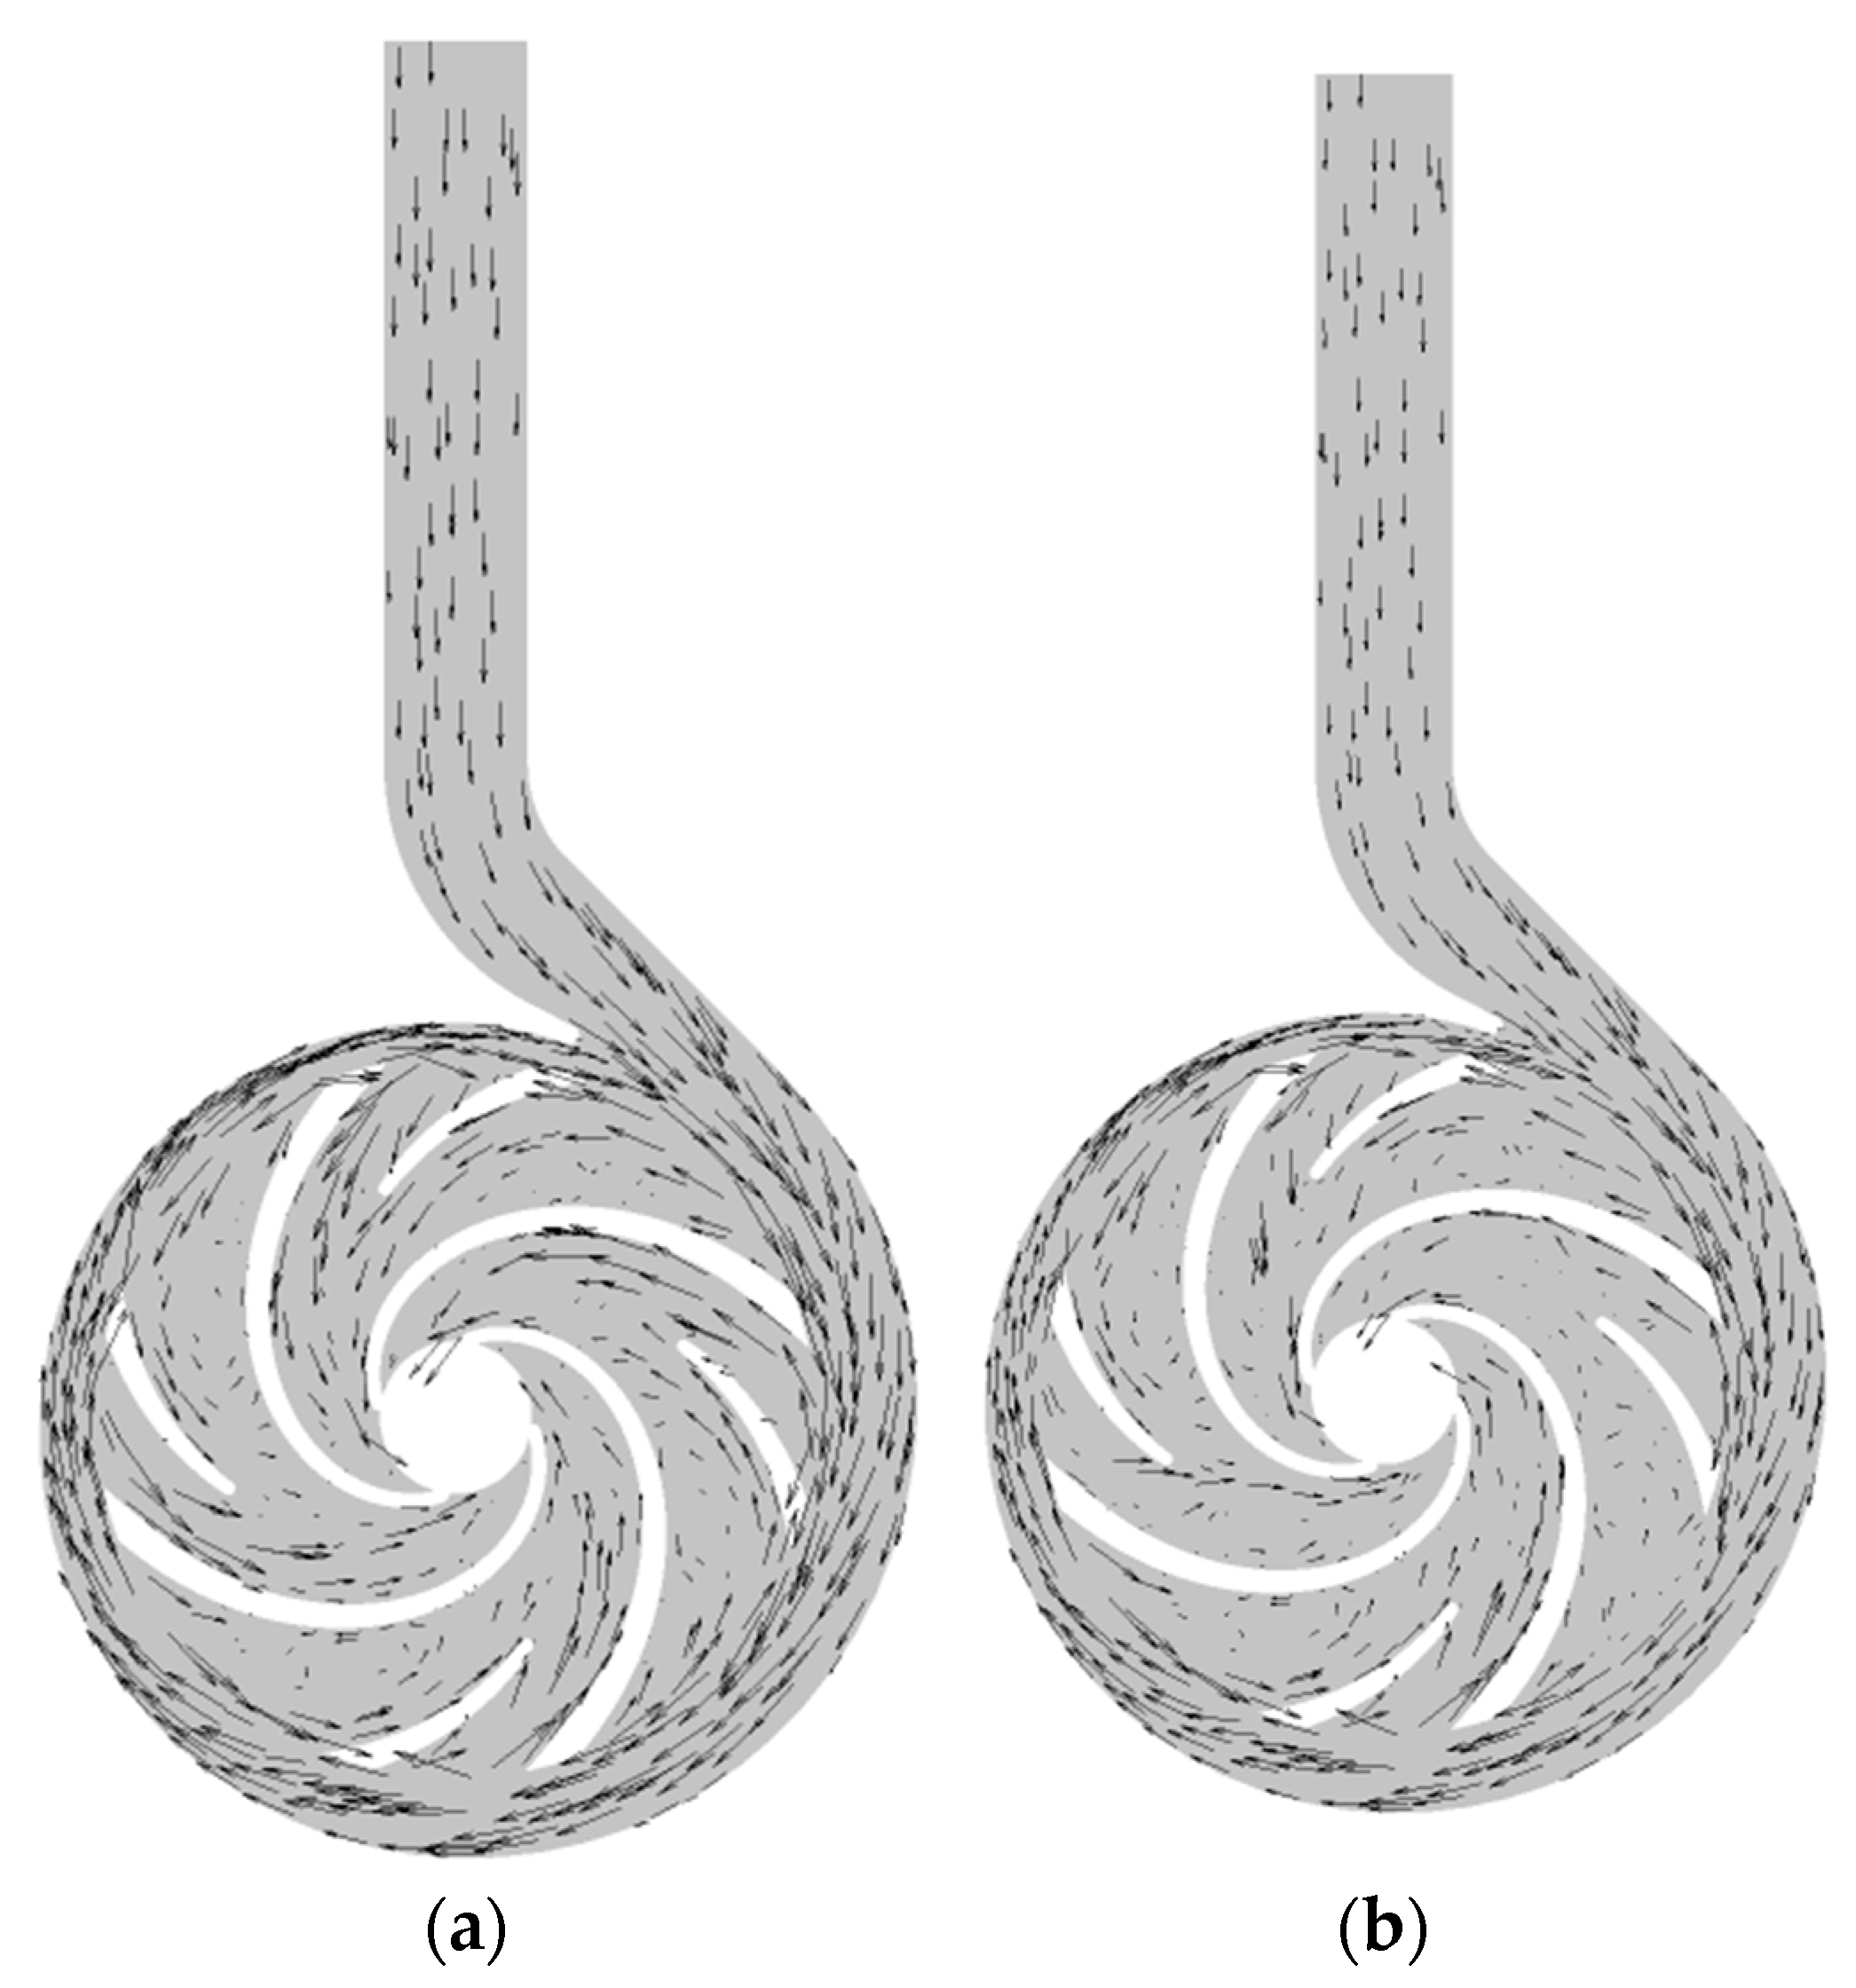
Figure 9 shows the velocity vector at the flow rate, Q= 12.5 m3/h for rotational speeds n= 1500 rpm and n= 1750 rpm. The vectors depict the flow path starting from the PAT inlet to the outlet. The vectors at these rotational speeds depict similar patterns. At both rotational speeds, vortices are observed in the impeller passage.
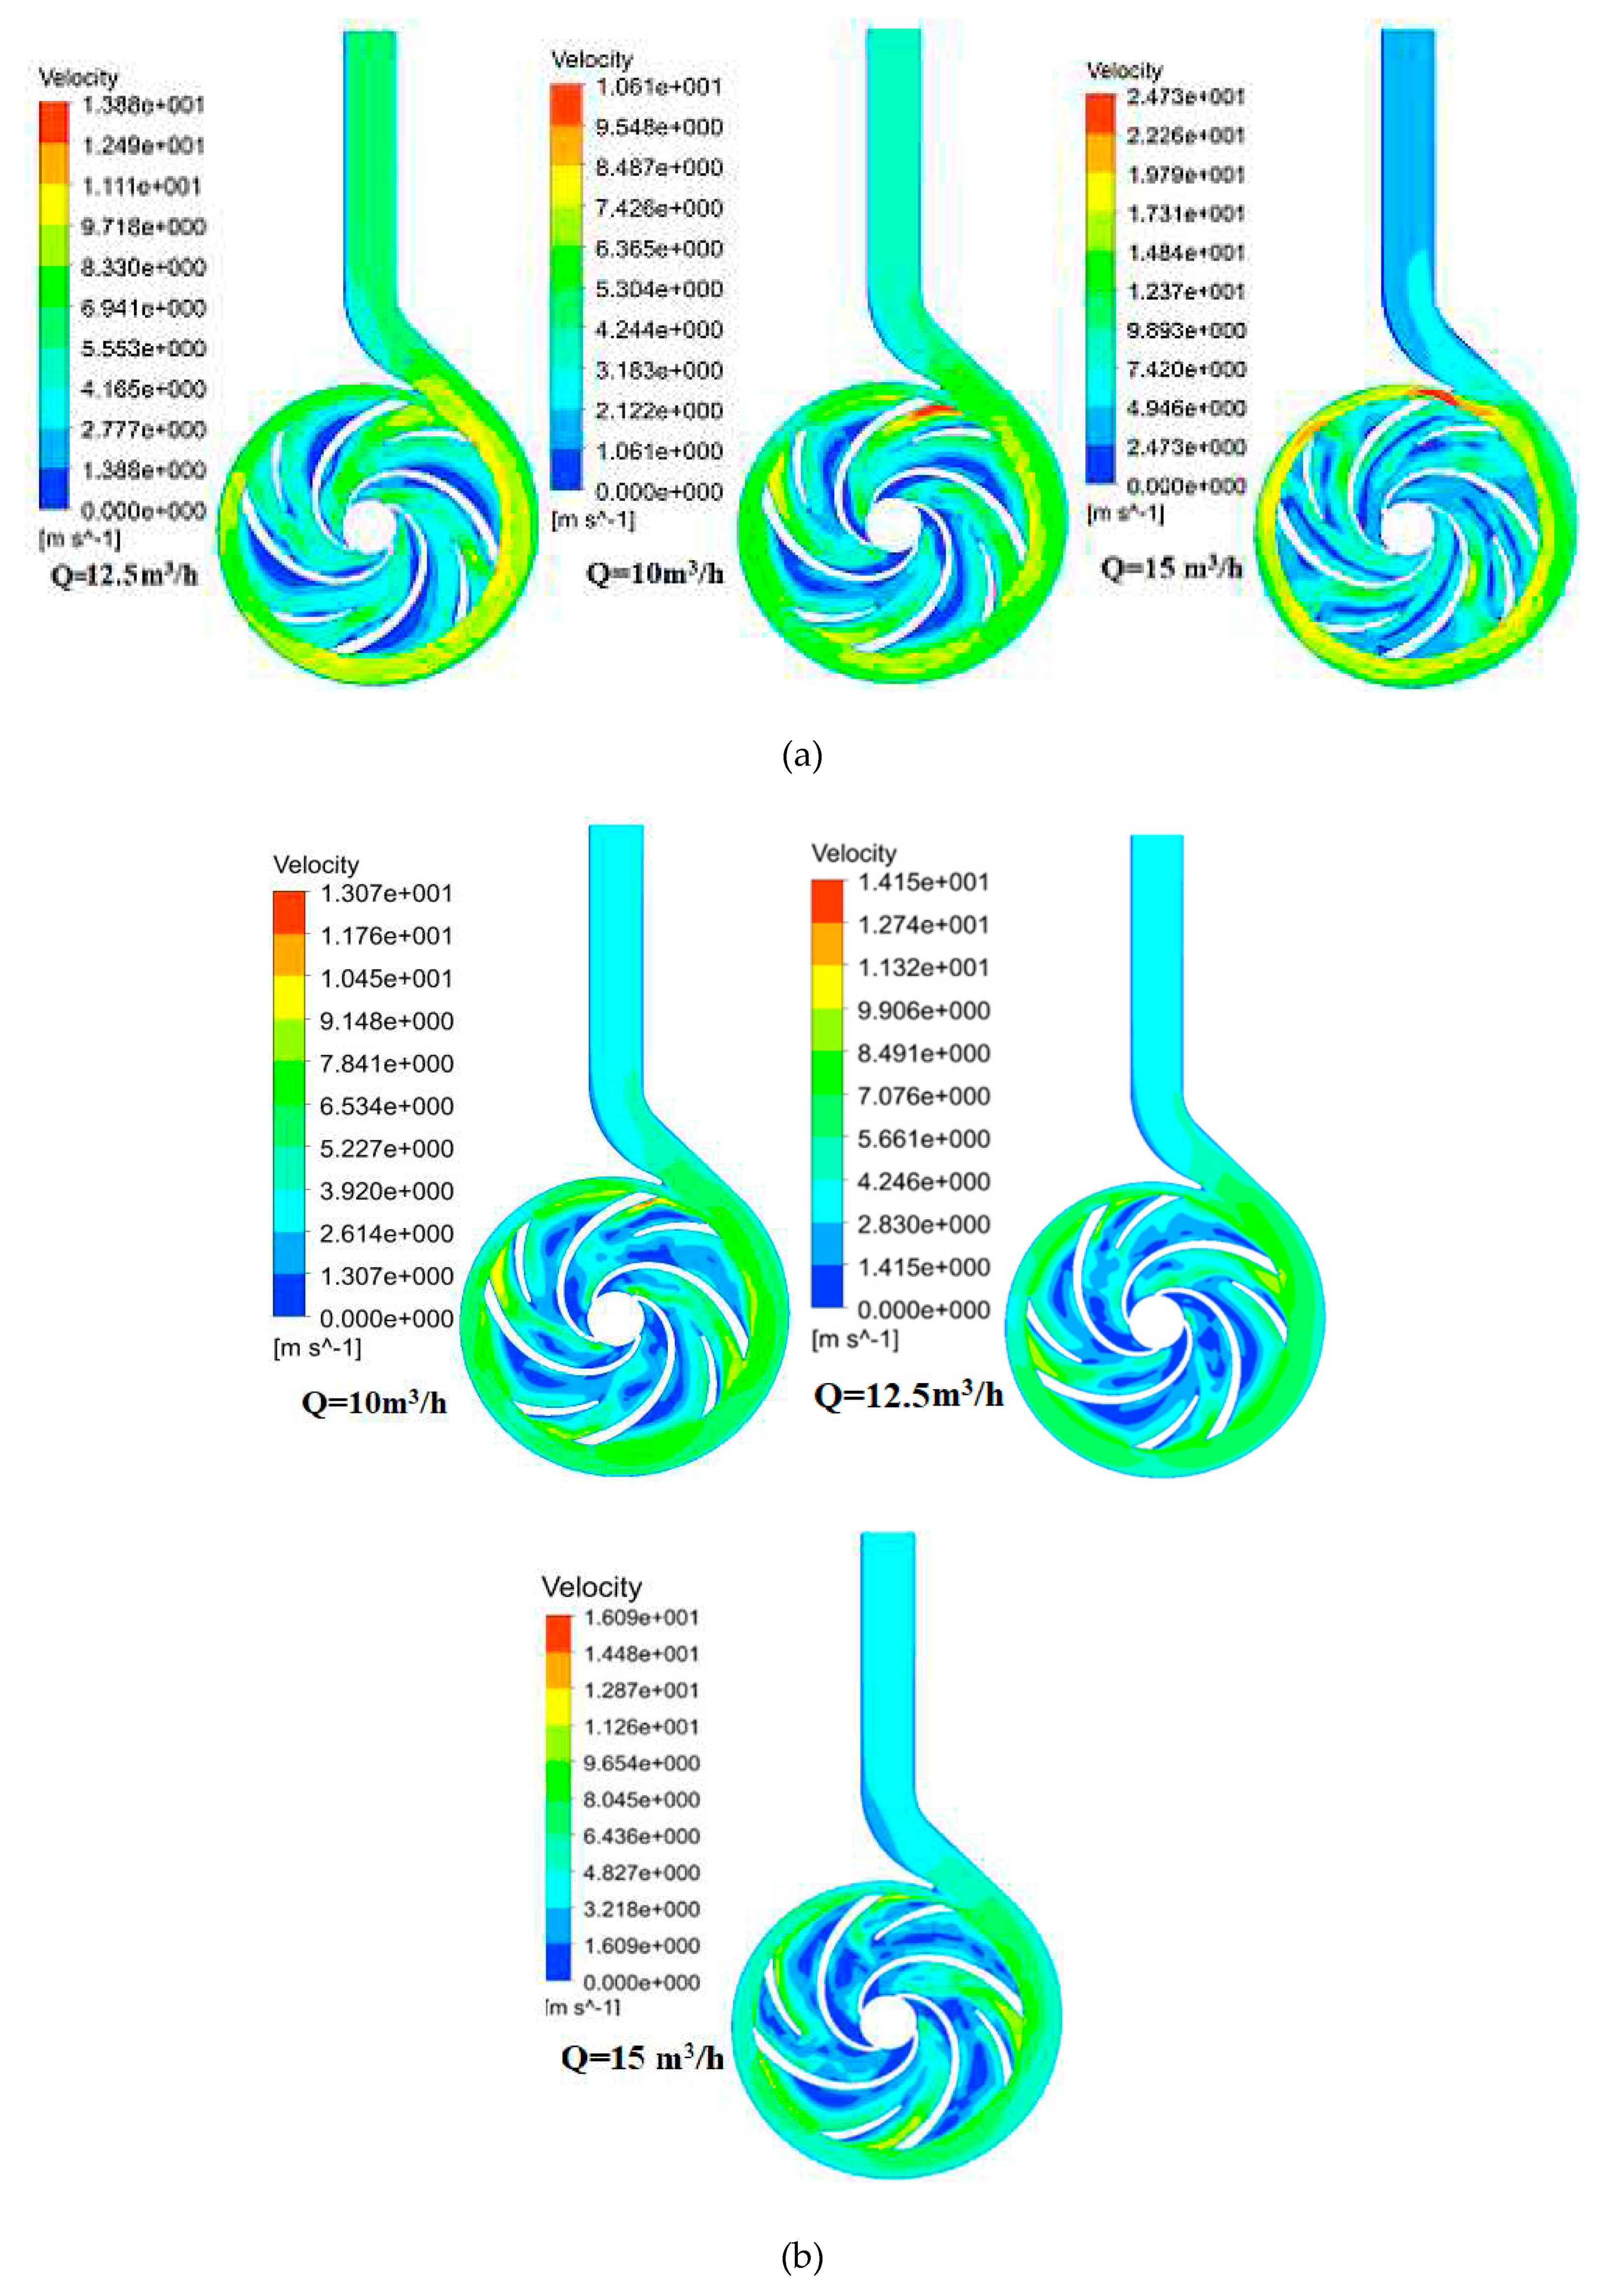
Figure 10 shows the velocity distribution on different rotational speeds at different operating conditions. In Figure 10a, the velocity gradient decreases as the flow rate increases at rotational speed n= 1500 rpm. As the fluid gets to the tongue region, its velocity increases; however, the velocity intensifies as the flow rate increases. Within the impeller passage, weak velocities ranging from 0 to about 2.7 m/s were seen and also the trailing edges of the blades were characterized by high velocity. This effect can be attributed to the direction of the flow without any guide vane into the outlet. As the rotational speed increases to n= 1750 rpm, the average velocity distribution within the flow passage decreases at all operating conditions as shown in Figure 10b. Generally, the velocity intensity of the flow in the volute is greater compared with the impeller in all working conditions as well as rotational speed n= 1500 rpm and n= 1750 rpm because the fluid energy was extracted by the movement of the impeller in the counter-clockwise direction.

6. Conclusion

This study provides numerical investigations on the performance of a centrifugal pump carefully chosen to operate as turbine for small hydro-power generation under different rotational speeds. The results showed that The head performance at each operating condition increases as the rotational speed increases. At rotational speed, n= 2000 rpm, the maximum head recorded at Q= 5 m3/h was 22.4 m whereas at The pressure distribution at the inlet is over and above the outlet in various working circumstances because the fluid energy at high elevation is extracted by PAT pump. As the flow rate increases, inlet pressure decreases due to various losses such as rotational losses.The pressure distribution at the inlet is over and above the outlet in various working circumstances because the fluid energy at high elevation is extracted by PAT pump. As the flow rate increases, inlet pressure decreases due to various losses such as rotational losses.n= 3250 rpm the head increase by 52.7% at the same operating condition. This is because the velocity of the fluid increases as the rotational speed increases. Subsequently, this leads to higher fluid energy at higher rotational speeds.Also the pressure distribution at the inlet is over and above the outlet in various working circumstances because the fluid energy at high elevation is extracted by PAT pump. As the flow rate increases, inlet pressure decreases due to various losses such as rotational losses. PTA’s best efficiency point (BEP) shifted near higher discharge with high-efficiency range when rotational speed was increased. The efficiency in the turbine mode increases as the flow rate increases and decreases after the maximum efficiency. Rotational speed, n= 1500 rpm attained the highest efficiency of 69.8% at QBEP among the other rotational speeds. However, at n= 1750 rpm, an efficiency decrease of about 2.3% is observed compared to n= 1500 rpm. Moreover, the pressure and velocity distributions at the inlet are higher at all operating conditions than the outlet because the fluid energy at high elevation is extracted by the pump in the reverse mode. This work is very useful and will help in selecting appropriate pump to be useda s turbine for small hydro power development to promote green development.

Acknowledgments

The Authors would like to express their appreciation to the National Key Research and Development Plan (Grant No. 2018YFB0606101), National Natural Science Foundation of China (Grant No. 51809121), Natural Science Foundation of Jiangsu Province (Grant No. BK20170548), Senior Talent Research Start-up Foundation of Jiangsu University (Grant No. 17JDG040) for their financial support.

Nomenclature

D1 Suction diameter[m]
D2 Impeller out diameter[m]
b2 Impeller out width[m]
Z Number of vanes
P Motor Power[kW]
Pin Pressure of pump inlet [Pa]
η Pump hydraulic efficiency[%]
n Motor speed[rpm]
ns Specific Speed
M Impeller moment [Nm]
rpm revolutions per minute
ηBEP. efficiency at best efficient point
BEP best efficient point
Qd Design pump flow rate[m3/h]
Q Pump flow rate[m3/h]
Hd Design Pump Head[m]
H pump head[m]
Di Inlet diameter of splitter blades [m]
SST k-ω Shear Stress Transport
g gravity acceleration [m/s2]
ρ fluid density [kg/m3]
RANS Reynolds- Averaged Navier–Stokes
CFD Computational fluid dynamics
PAT Pump as turbine
SHP small hydropower
H pump head[m]
Di Inlet diameter of splitter blades [m]
SST k-ω Shear Stress Transport

References

  1. Zhang, J.; Adu, D.; Fang, Y.; Yin, T. Review of the sub-Saharan African small hydropower situation. Proc. Inst. Civ. Eng. Energy 2018, 171, 129–139. [Google Scholar] [CrossRef]
  2. Adu, D.; Zhang, J.; Fang, Y.; Suoming, L.; Darko, R.O. A Case Study of Status and Potential of Small Hydro-Power Plants in Southern African Development Community. Energy Procedia 2017, 141, 352–359. [Google Scholar] [CrossRef]
  3. Karekezi S, Kimarii J the Potential Contribution of Non-Electrified Renewable Energy Technologies for Poverty Reduction in East Africa. 2005.
  4. European Small Hydropower Association Small Hydropower Roadmap-Condensed Research Data for EU-27[R/OL], Brussels: ESHA. ( 2013.
  5. Mosè Rossi et al. Pump-as-Turbine for energy recovery applications: the case study of an aqueduct ATI2016, Turin, Italy Energy Procedia. t: for energy recovery applications, 2016; 101, 1207–1214.
  6. Derakhshan, S.; Nourbakhsh, A. Theoretical, numerical and experimental investigation of centrifugal pumps in reverse operation. Exp. Therm. Fluid Sci. 2008, 32, 1620–1627. [Google Scholar] [CrossRef]
  7. POPESCU, D. et al. Study of Centrifugal Pump Operating as Turbine in Small Hydropower Plants, Recent Researches in Electric Power and Energy Systems. ISBN: 978-960-474-328-5.
  8. Sanjay, V. Jain a, Abhishek S., et al. Effects of impeller diameter and rotational speed on performance of pump running in turbine mode. Energy Conversion and Management 2015, 89, 808–824. [Google Scholar]
  9. Suarda, M.; Suarnadwipa, N.; AdnyanaW.B., *!!! REPLACE !!!*. , Suarnadwipa N., and AdnyanaW.B. In Assessment Performance of Pumps as Hydro-Turbines‖, International Conference on Energy and Environment; ICEE, 2006. [Google Scholar]
  10. Liu, M.; Tan, L.; Cao, S. Performance Prediction and Geometry Optimization for Application of Pump as Turbine: A Review. Front. Energy Res. 2022, 9. [Google Scholar] [CrossRef]
  11. Barbarelli, S.; Amelio, M.; Florio, G.; Scornaienchi, N. Procedure Selecting Pumps Running as Turbines in Micro Hydro Plants. Energy Procedia 2017, 126, 549–556. [Google Scholar] [CrossRef]
  12. Kramer, M. , Terheiden K., Wieprecht S., Pumps as turbines for efficient energy recovery in water supply networks. Renewable Energy 2018, 122, 17–25. [Google Scholar] [CrossRef]
  13. Frosina, E.; Buono, D.; Senatore, A. A Performance Prediction Method for Pumps as Turbines (PAT) Using a Computational Fluid Dynamics (CFD) Modeling Approach. Energies 2017, 10, 103. [Google Scholar] [CrossRef]
  14. Derakhshan, S.; Mohammadi, B.; Nourbakhsh, A. Efficiency Improvement of Centrifugal Reverse Pumps. J. Fluids Eng. 2009, 131, 021103. [Google Scholar] [CrossRef]
  15. Suarda, M.; Suarnadwipa, N.; Adnyana, W. Experimental Work on Modification of Impeller Tips of a Centrifugal Pump as a Turbine. Udayana University Denpasar, Bali, Indonesia.
  16. Singh, P., Ph. D. thesis: Optimization of the Internal Hydraulic and of System Design in Pumps as Turbines with Field Implementation and Evaluation,” University of Karlsruhe, Germany, 05. 20 June.
  17. Singh, P.; Nestmann, F. Internal hydraulic analysis of impeller rounding in centrifugal pumps as turbines. Exp. Therm. Fluid Sci. 2011, 35, 121–134. [Google Scholar] [CrossRef]
  18. Pandey, R. , ―Performance analysis of modified pump used as turbine‖, M.Tech. Dissertation, ; AHEC, IIT Roorkee.
  19. Anantharaj, S. , Ede S.R., Karthick K., Sam Sankar S., Sangeetha K., Karthik, Subrata Kundu P.E., Precision and correctness in the evaluation of electrocatalytic water splitting: revisiting activity parameters with a critical assessment. Energy Environ. Sci. 2018, 4, 744–771. [Google Scholar] [CrossRef]
  20. Sheng, X.; Li, Y.; Yang, T. Hierarchical micro-reactor as electrodes for water splitting by metal rod tipped carbon Nano capsule self-assembly in carbonized wood Applied Catalysis B: Environmental. E: Hierarchical micro-reactor as electrodes for water splitting by metal rod tipped carbon Nano capsule self-assembly in carbonized wood Applied Catalysis B, 2020. [Google Scholar]
  21. Shiva Kumar, S. , Ramakrishna S.U.B., Bhagawan D., Himabindu V., Preparation of RuxPd1-xO2 electro catalysts for the oxygen evolution reaction (OER) in PEM water electrolysis Ionics. 24; 2018, 2411–2419. [Google Scholar]
  22. Rathinam, N.K.; Sani, R.K. Salem, Extremophilic Microbial Processing of Lignocellulosic Feedstocks to Biofuels, Value-Added Products, and Usable Power. Springer: Cham, 2018; pp. 229–245. [Google Scholar]
  23. Kannan, Sekar & Kumar, N & Pandian, Vasanthakumar. (2017). Centrifugal Pump as Turbine for Micro-Hydro Power Scheme in Rural Areas of India: A Review. In International Journal of ChemTech Research; 1: International Journal of ChemTech Research, (14), 2017; Volume 14, pp. 106–109.
  24. Bentum-Micah, G.; Atuahene, S.A.; Cai, L.; Adu, D.; Sheng, Q.X. Experimental investigation and performance prediction modeling of a single stage centrifugal pump operating as turbine. Energy Procedia 2017, 126, 589–596. [Google Scholar]
  25. Kan, K.; Zhang, Q.; Xu, Z.; Zheng, Y.; Gao, Q.; Shen, L. Energy loss mechanism due to tip leakage flow of axial flow pump as turbine under various operating conditions. Energy 2022, 255. [Google Scholar] [CrossRef]
  26. Li, W.; Ji, L.; Li, E.; Shi, W.; Agarwal, R.; Zhou, L. Numerical investigation of energy loss mechanism of mixed-flow pump under stall condition. Renew. Energy 2020, 167, 740–760. [Google Scholar] [CrossRef]
  27. Samuele S, Mose R,et al, Energy recovery in gravity addiction pipelines of a water supply system (WSS) for urban areas using Pumps-as-Turbines. Sustainable Energy Technologies and Assessments 2021, 45, 101040. [CrossRef]
  28. Kadier, A.; Sahaid Kalil, Md.; Abdeshahian, P.; Chandrasekhar, K.; Mohamed, A.; Farhana Azman, N.; Logroño, W.; Simayi, Y.; Abdul Hamid, A. Recent advances and emerging challenges in microbial electrolysis cells (MECs) for microbial production of hydrogen and value-added chemicals. Renewable Sustainable Energy Rev. 2016, 61, 501–525. [Google Scholar] [CrossRef]
  29. Zhang Y L, Yuan S Q, Zhang J F, et.al Numerical investigation of the effects of splitter blades on the cavitation performance of a centrifugal pump 2014 IOP Conf. Ser.: Earth Environ. Sci. 22 052003.
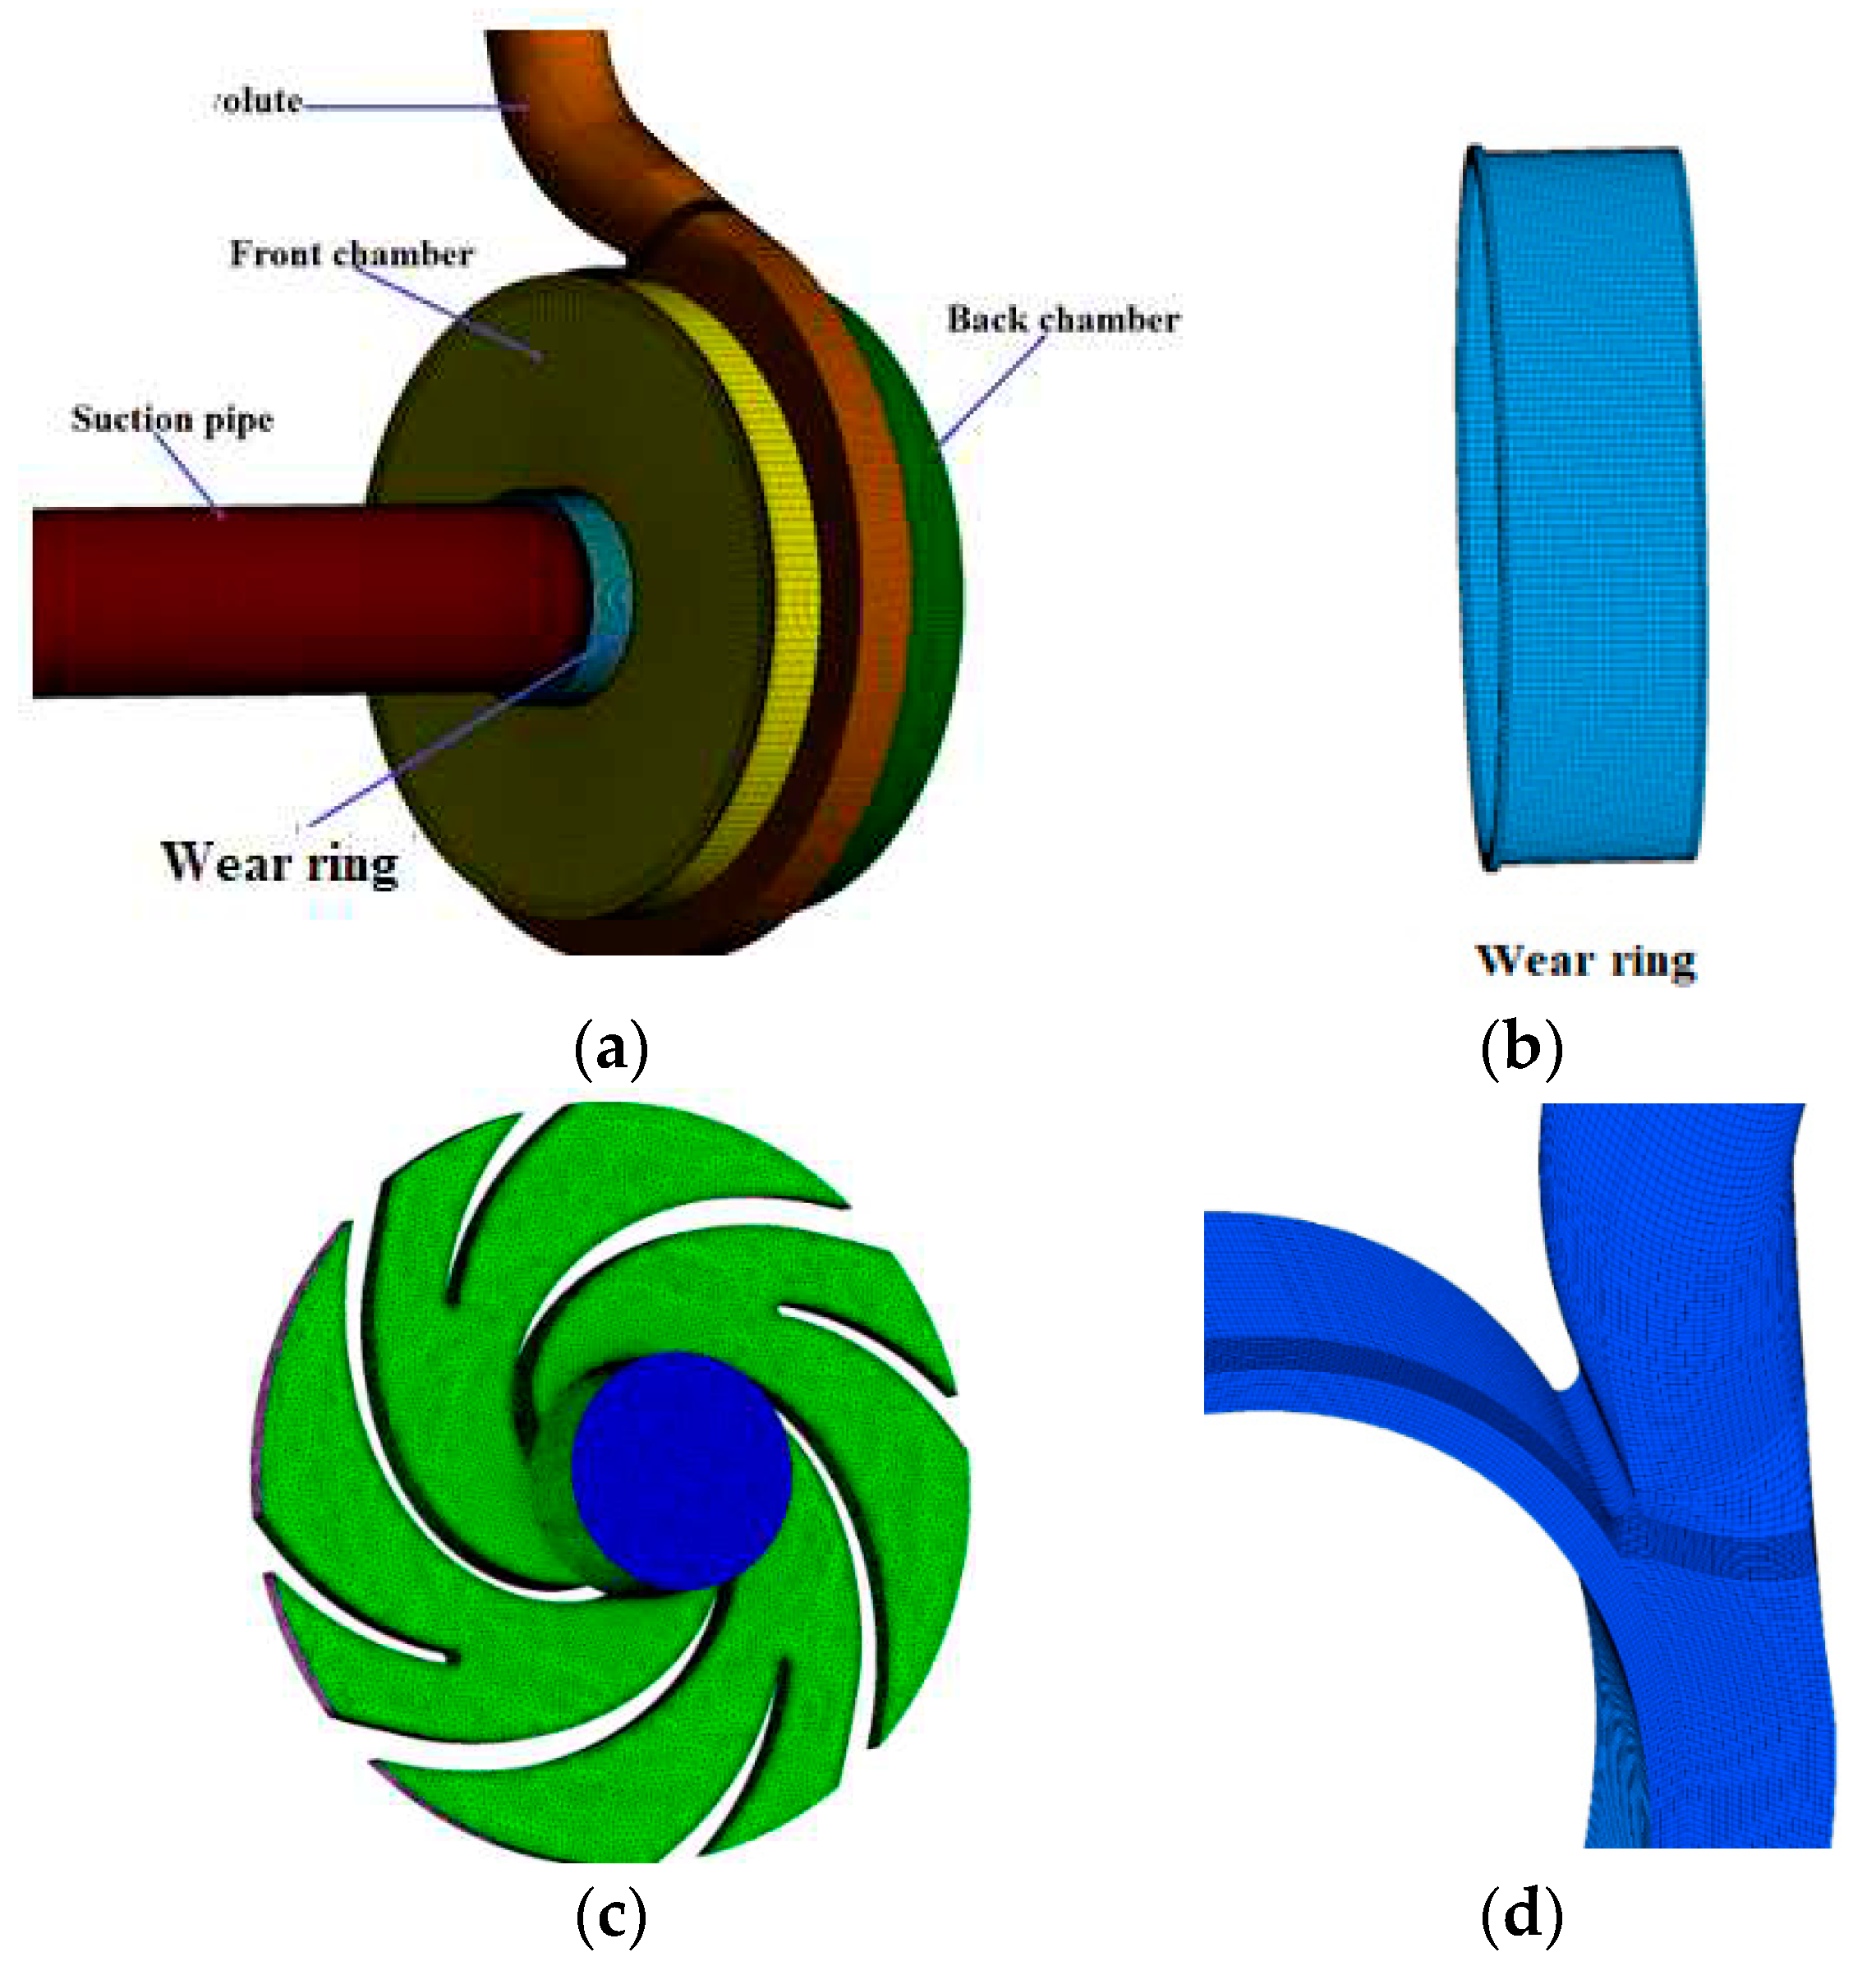
Figure 1. Computational mesh domain (a) entire PAT model (b) wear ring (c) impeller (d) volute tongue.
Preprints 71747 g001
Figure 2. 2D sketch of the test rig.
Preprints 71747 g002
Figure 3. Hydraulic pump performance.
Preprints 71747 g003
Figure 4. Performance prediction under different rotational speed in pump mode (a) head (b) efficiency.
Preprints 71747 g004aPreprints 71747 g004b
Figure 5. Performance prediction under different rotational speed in PAT mode (a) head (b) efficiency.
Preprints 71747 g005
Figure 6. Head pulsation in PAT mode.
Preprints 71747 g006
Figure 7. Pressure distribution (a) Maximum (b) Minimum.
Preprints 71747 g007
Figure 8. Pressure distribution in PAT mode (a) n = 1500 rpm (b) n =1750rpm at different flow rate.
Preprints 71747 g008
Figure 9. Velocity vector at Q = 12.5 m3/h (a) n= 1500 rpm (b) n= 1750 rpm.
Preprints 71747 g009
Figure 10. Velocity distribution in PAT mode (a) n= 1500 rpm (b) n=1750rpm.
Preprints 71747 g010
Table 1. Geometrical and operational parameters of a PAT model.
(a) Geometric parameters.
Parameter Symbol Value Unit
Suction diameter
outer Impeller diameter
outer Impeller width
long blades
splitter blades
splitter blades Inlet diameter
D1
D2
b2
-
-
Di
0.05
0.16
0.06
4
4
0.104
m
m
m
-
-
m
(b) Operational parameters at design condition.
Parameter Symbol Value Unit
Flow rate
Head
Efficiency
Specific Speed
Rotational speed
QD
HD
η
ns
n
12.5
32
56
47
2900
m3/h
m
-
-
rpm
Disclaimer/Publisher’s Note: The statements, opinions and data contained in all publications are solely those of the individual author(s) and contributor(s) and not of MDPI and/or the editor(s). MDPI and/or the editor(s) disclaim responsibility for any injury to people or property resulting from any ideas, methods, instructions or products referred to in the content.
Copyright: This open access article is published under a Creative Commons CC BY 4.0 license, which permit the free download, distribution, and reuse, provided that the author and preprint are cited in any reuse.
Prerpints.org logo

Preprints.org is a free preprint server supported by MDPI in Basel, Switzerland.

Subscribe

© 2024 MDPI (Basel, Switzerland) unless otherwise stated