1. Introduction
The respiratory rate (RR) is an important biological indicator that provides information on a patient’s health status or diagnosis. The RR particularly serves as a very significant indicator for patients whose health and prognosis checks are essential, such as those in the intensive care unit (ICU) and emergency room (ER) [
1,
2]. The importance of the RR in the medical environment can be also confirmed through several ICU scoring schemes such as APACHE, MEWS, SOFA, and qSOFA [
3,
4]. Although RR is a critical indicator in everyday life and medical environments, RR measurements are still monitored by caregivers’ careful attention [
5]. Of course, with respect to the RR, there are several physiological signals such as CO2 levels, impedance pneumography (IP), and oral-nasal pressure, and many traditional approaches using these signals exist. However, several challenges exist in obtaining the RR from these signals, including additional signal processing, feature extraction, and annotation processing [
6]. These processes can be costly in terms of labor, time, and money, and because each piece of RR measuring equipment requires adequate room space and professional knowledge, the RR cannot easily be measured whenever and wherever it is desired.
Unlike other equipment such as the above, a photoplethysmogram (PPG) can be obtained using inexpensive and simple equipment such as pulse oximetry or a smartwatch. A PPG provides various and critical bioindicators such as heart rate (HR), blood pressure (BP), O2 saturation (SpO2), and RR [
7,
8]. However, it is still a challenging task to attenuate the noise in PPG signals caused by movement or physiological action of the body [
7]. In addition, the lack of open-source PPG data provided for medical research is one of the reasons why it is difficult to conduct various studies and validations. To overcome these issues, synthetic PPG data are often used to verify the algorithm [
9]. However, this is an imitation of actual data and there is a limitation in representing actual clinical practice cases.
The use of a deep neural network (DNN) is considered an approach to solve some recent clinical issues and studies have introduced several artificial intelligence (AI) techniques to extract meaningful information, such as RR and BP, from PPGs [
10,
11,
12,
13]. Generally, DNNs are well-known solvers of imaging problems and show sufficient performance in predicting problems using time-series data. In this paper, the DNN model of Bian [
10] which showed significant performance in PPG-based RR estimation was adopted for experimentation and validation.
The aim of this study was to verify the validity of the DNN model and PPG and RR datasets (StMary) collected from Seoul St. Mary’s Hospital, Catholic University of Korea, a tertiary referral hospital. We also describe the StMary dataset and an experiment conducted to determine whether the actual RR collected from subjects and the RR predicted by the model from PPG evaluations were the same.
2. Materials and Methods
2.1. PPG Signal Collector
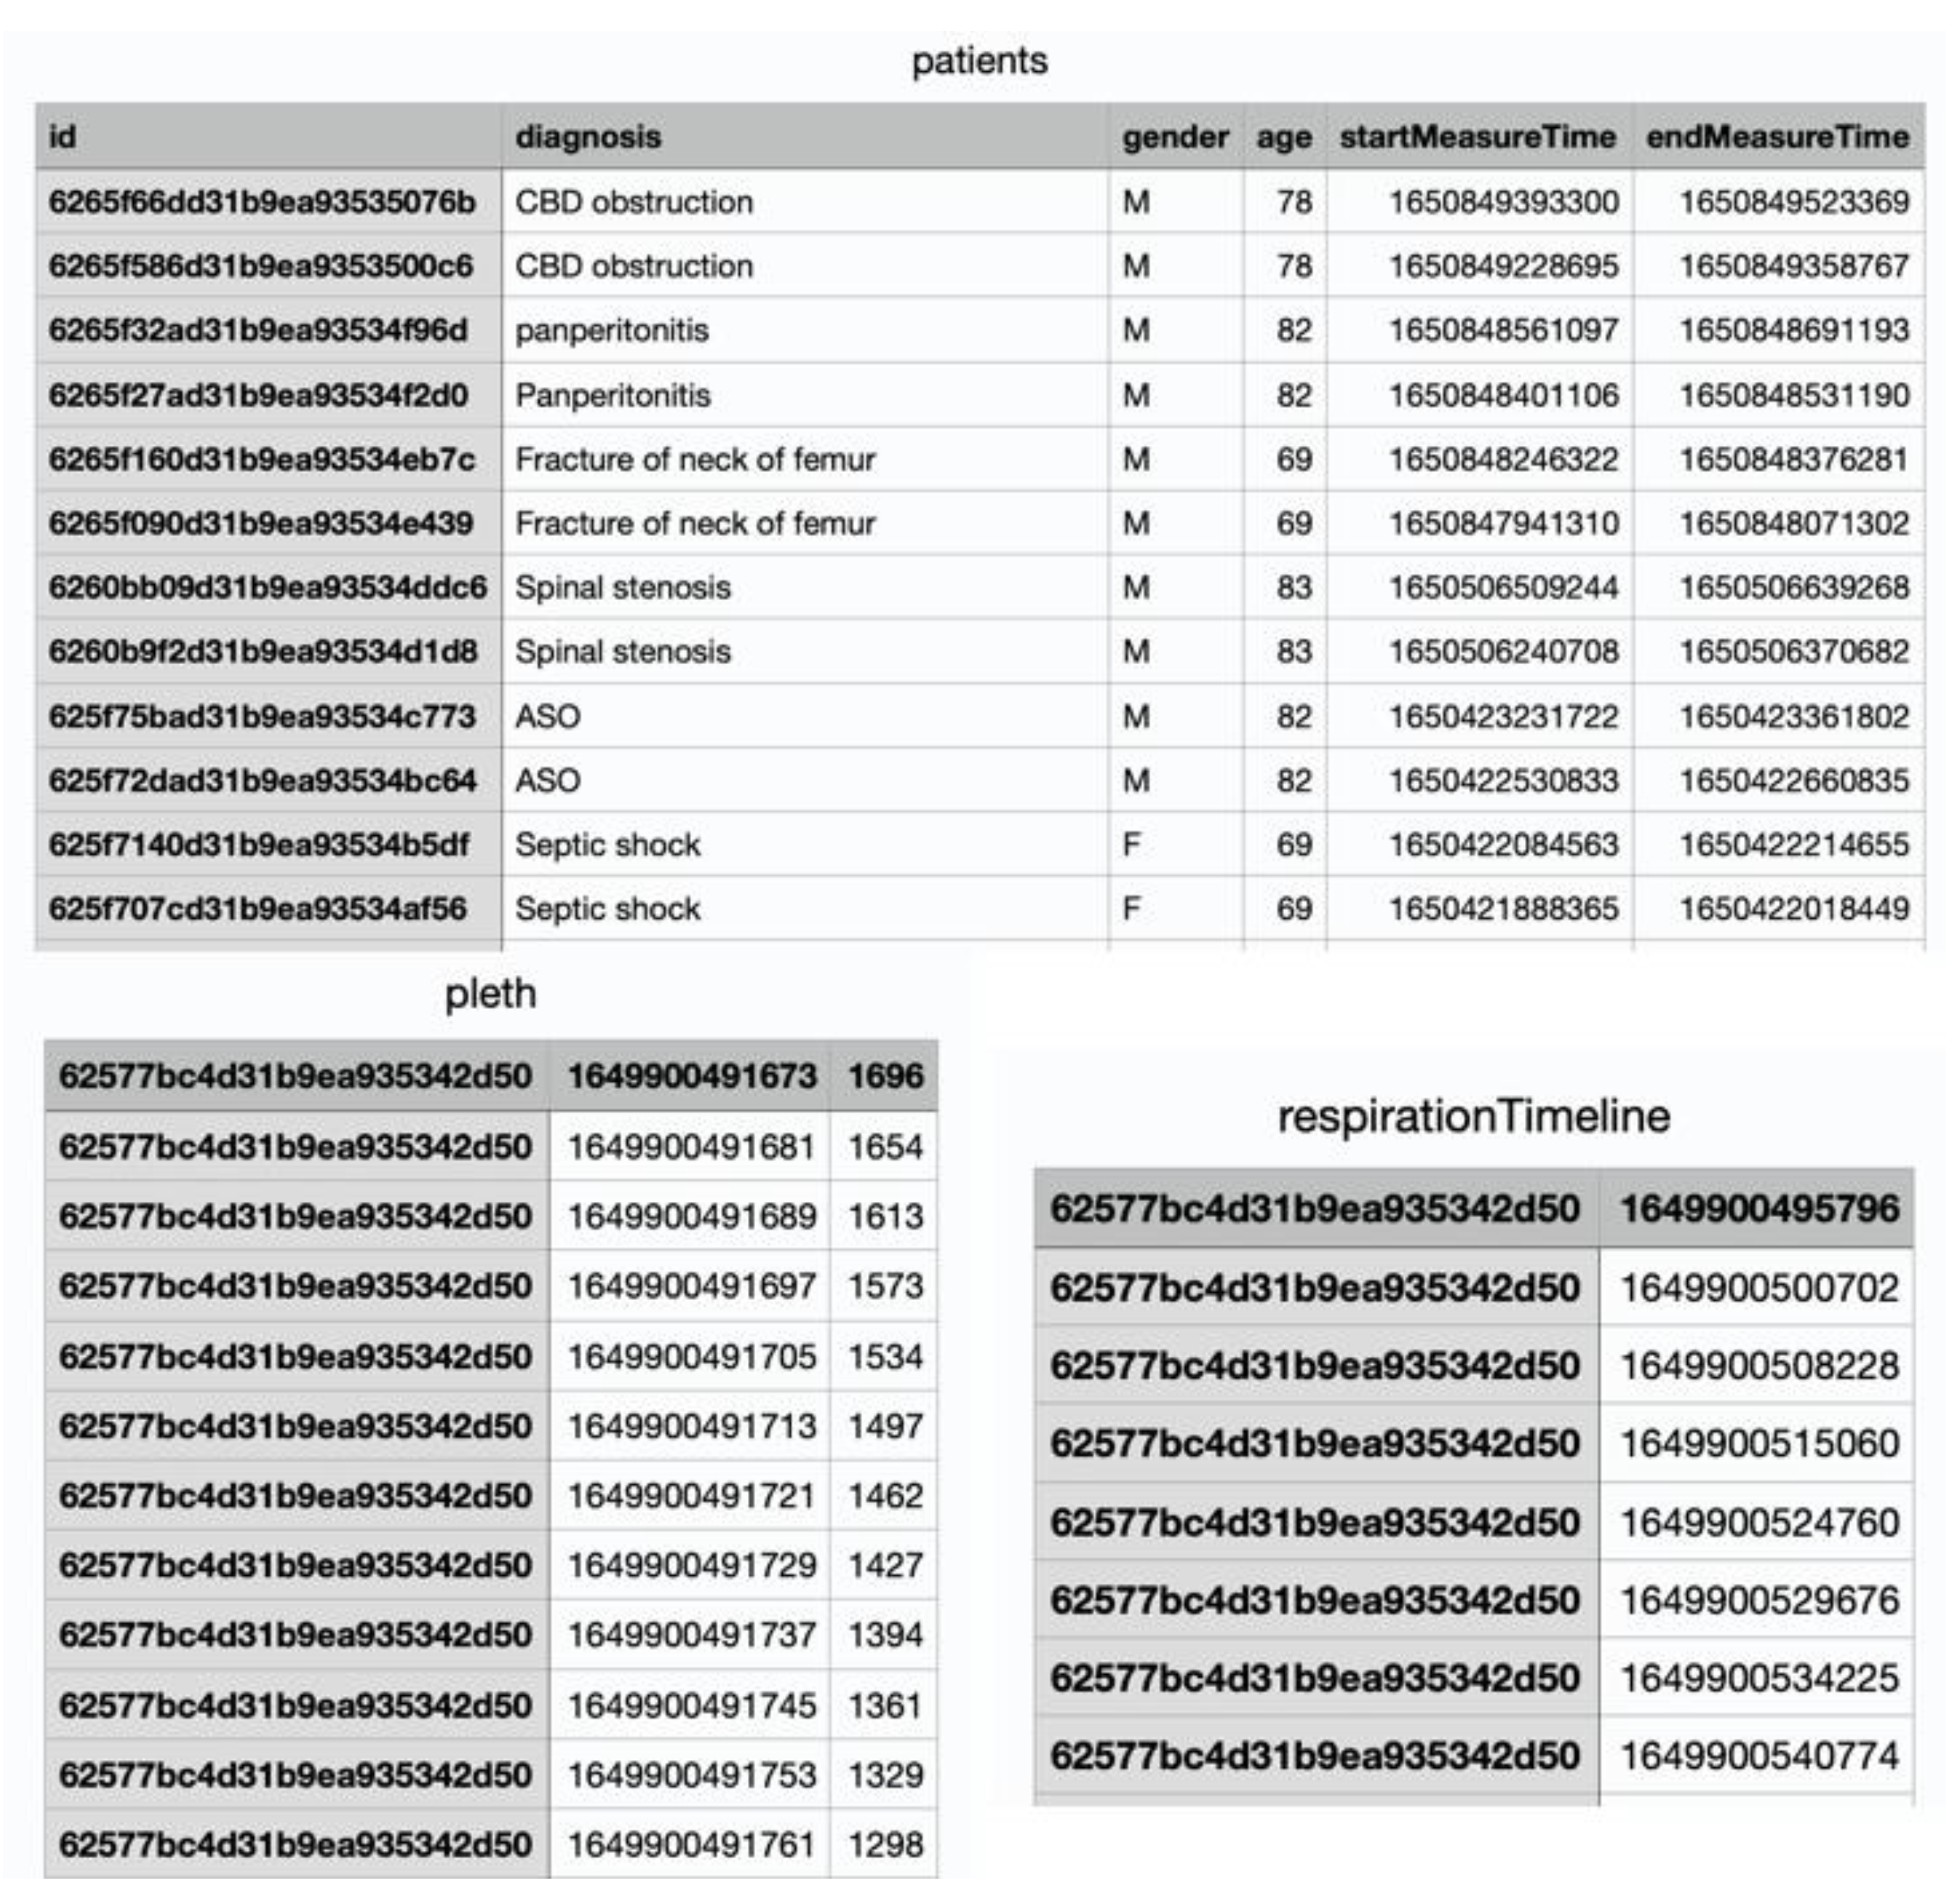
The PPG signal collector is a respiratory counter web application. A router was linked with a laptop to connect the network between the browser and the patient monitor. In this study, for our research, data were collected from patients and healthy volunteers through a pulse oximeter connected to the patient’s monitor. All healthy participants were measured in a sitting state after resting for 2 minutes to stabilize breathing before measurement. In the case of patient, measurements were taken while lying in the supine position due to the characteristics of inpatients in the intensive care unit. The subject’s demographic information must be entered into the PPG signal collector to acquire the data. When the collection started, the PPG signal was continuously recorded during the time limit and the RR was recorded manually by medical staff pressing the spacebar at the exhalation time. The measuring time was set up to 2 minutes and 10 seconds. When the time ended, the data were recorded as history and stored in the database. The subject’s data were exported into a CSV file using an internal API service. Three CSV files were acquired, consisting of patient demographic information, PPG, and breathing time (
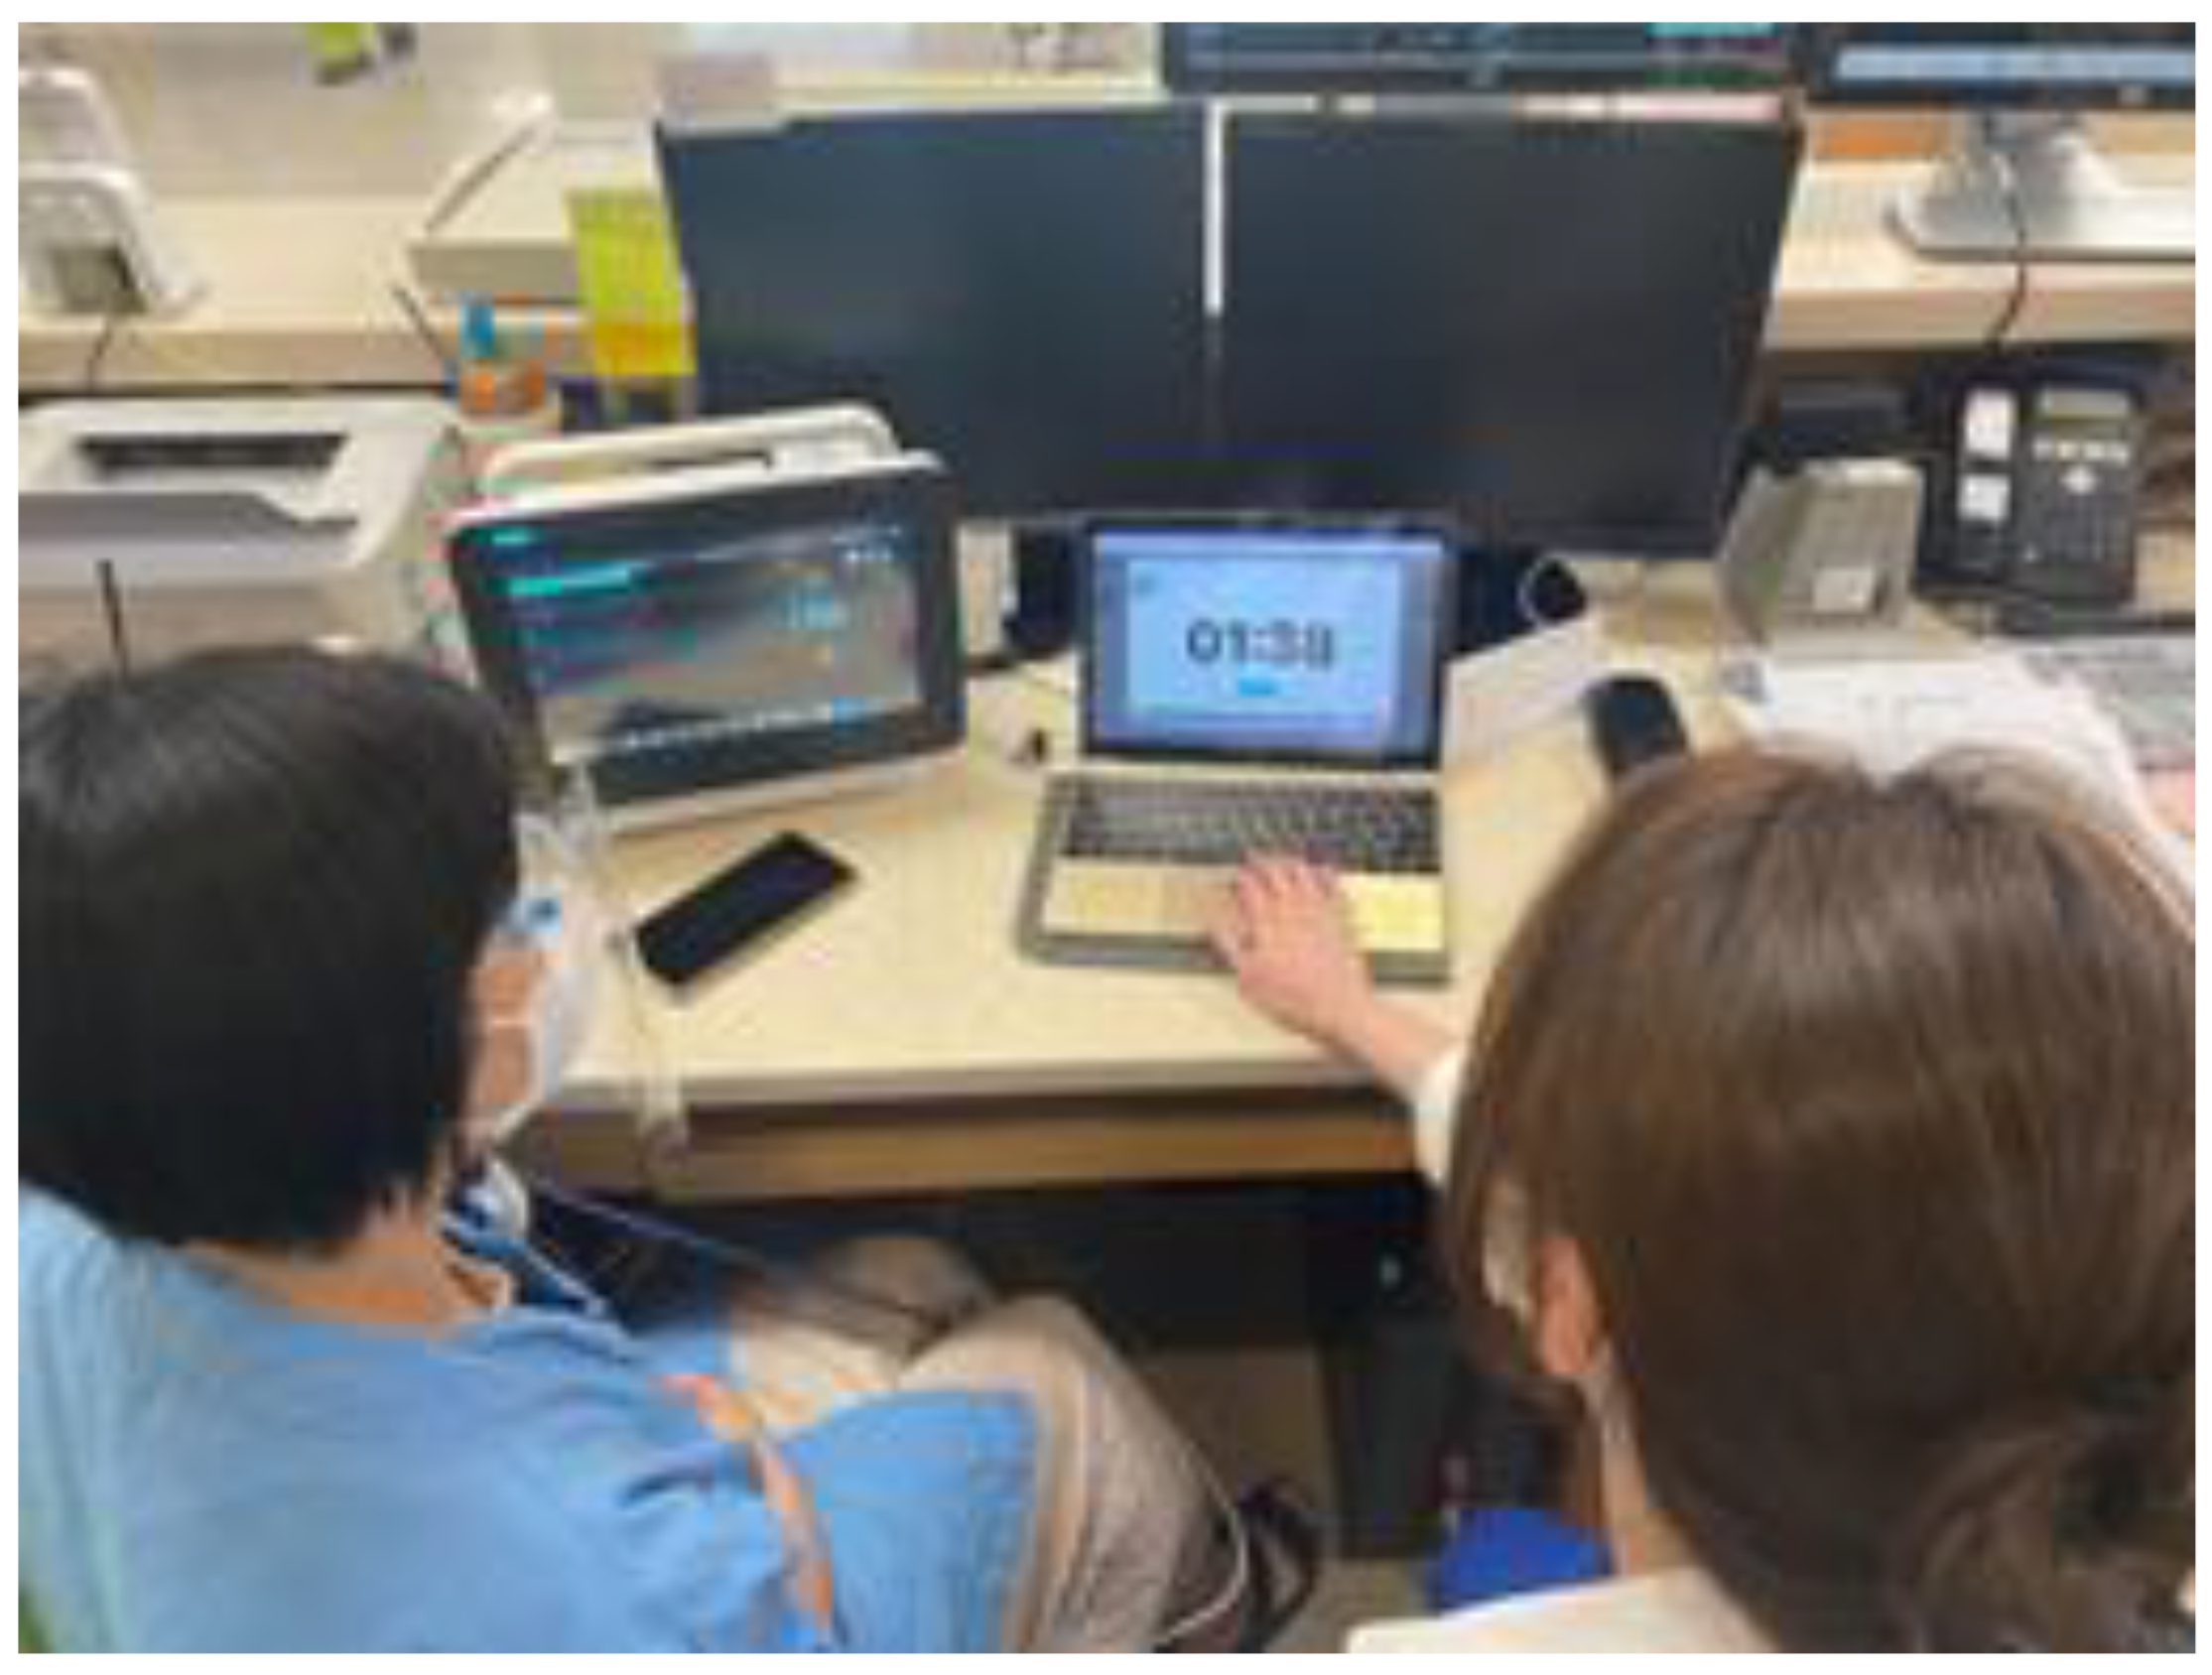
Figure 1). Medical staff in the surgical intensive care unit (SICU) of Catholic University, Seoul St. Mary’s Hospital supported our data collection using the PPG signal collector (
Figure 2). The collection procedure was as follows:
1. Move into local monitoring page through the browser installed in the laptop.
A. Set up the measuring time.
2. Register subject’s demographic including gender, age, and diagnosis to start recording.
3. When a window pops-up, click the start button to record the PPG.
4. Press the spacebar when the subject exhales.
5. When the time is up, the window will close, and the data will be stored automatically.
The PPG signal collector receives medical data from the Philips IntelliVue MX450, referring to the interlocking specification provided by Philips [
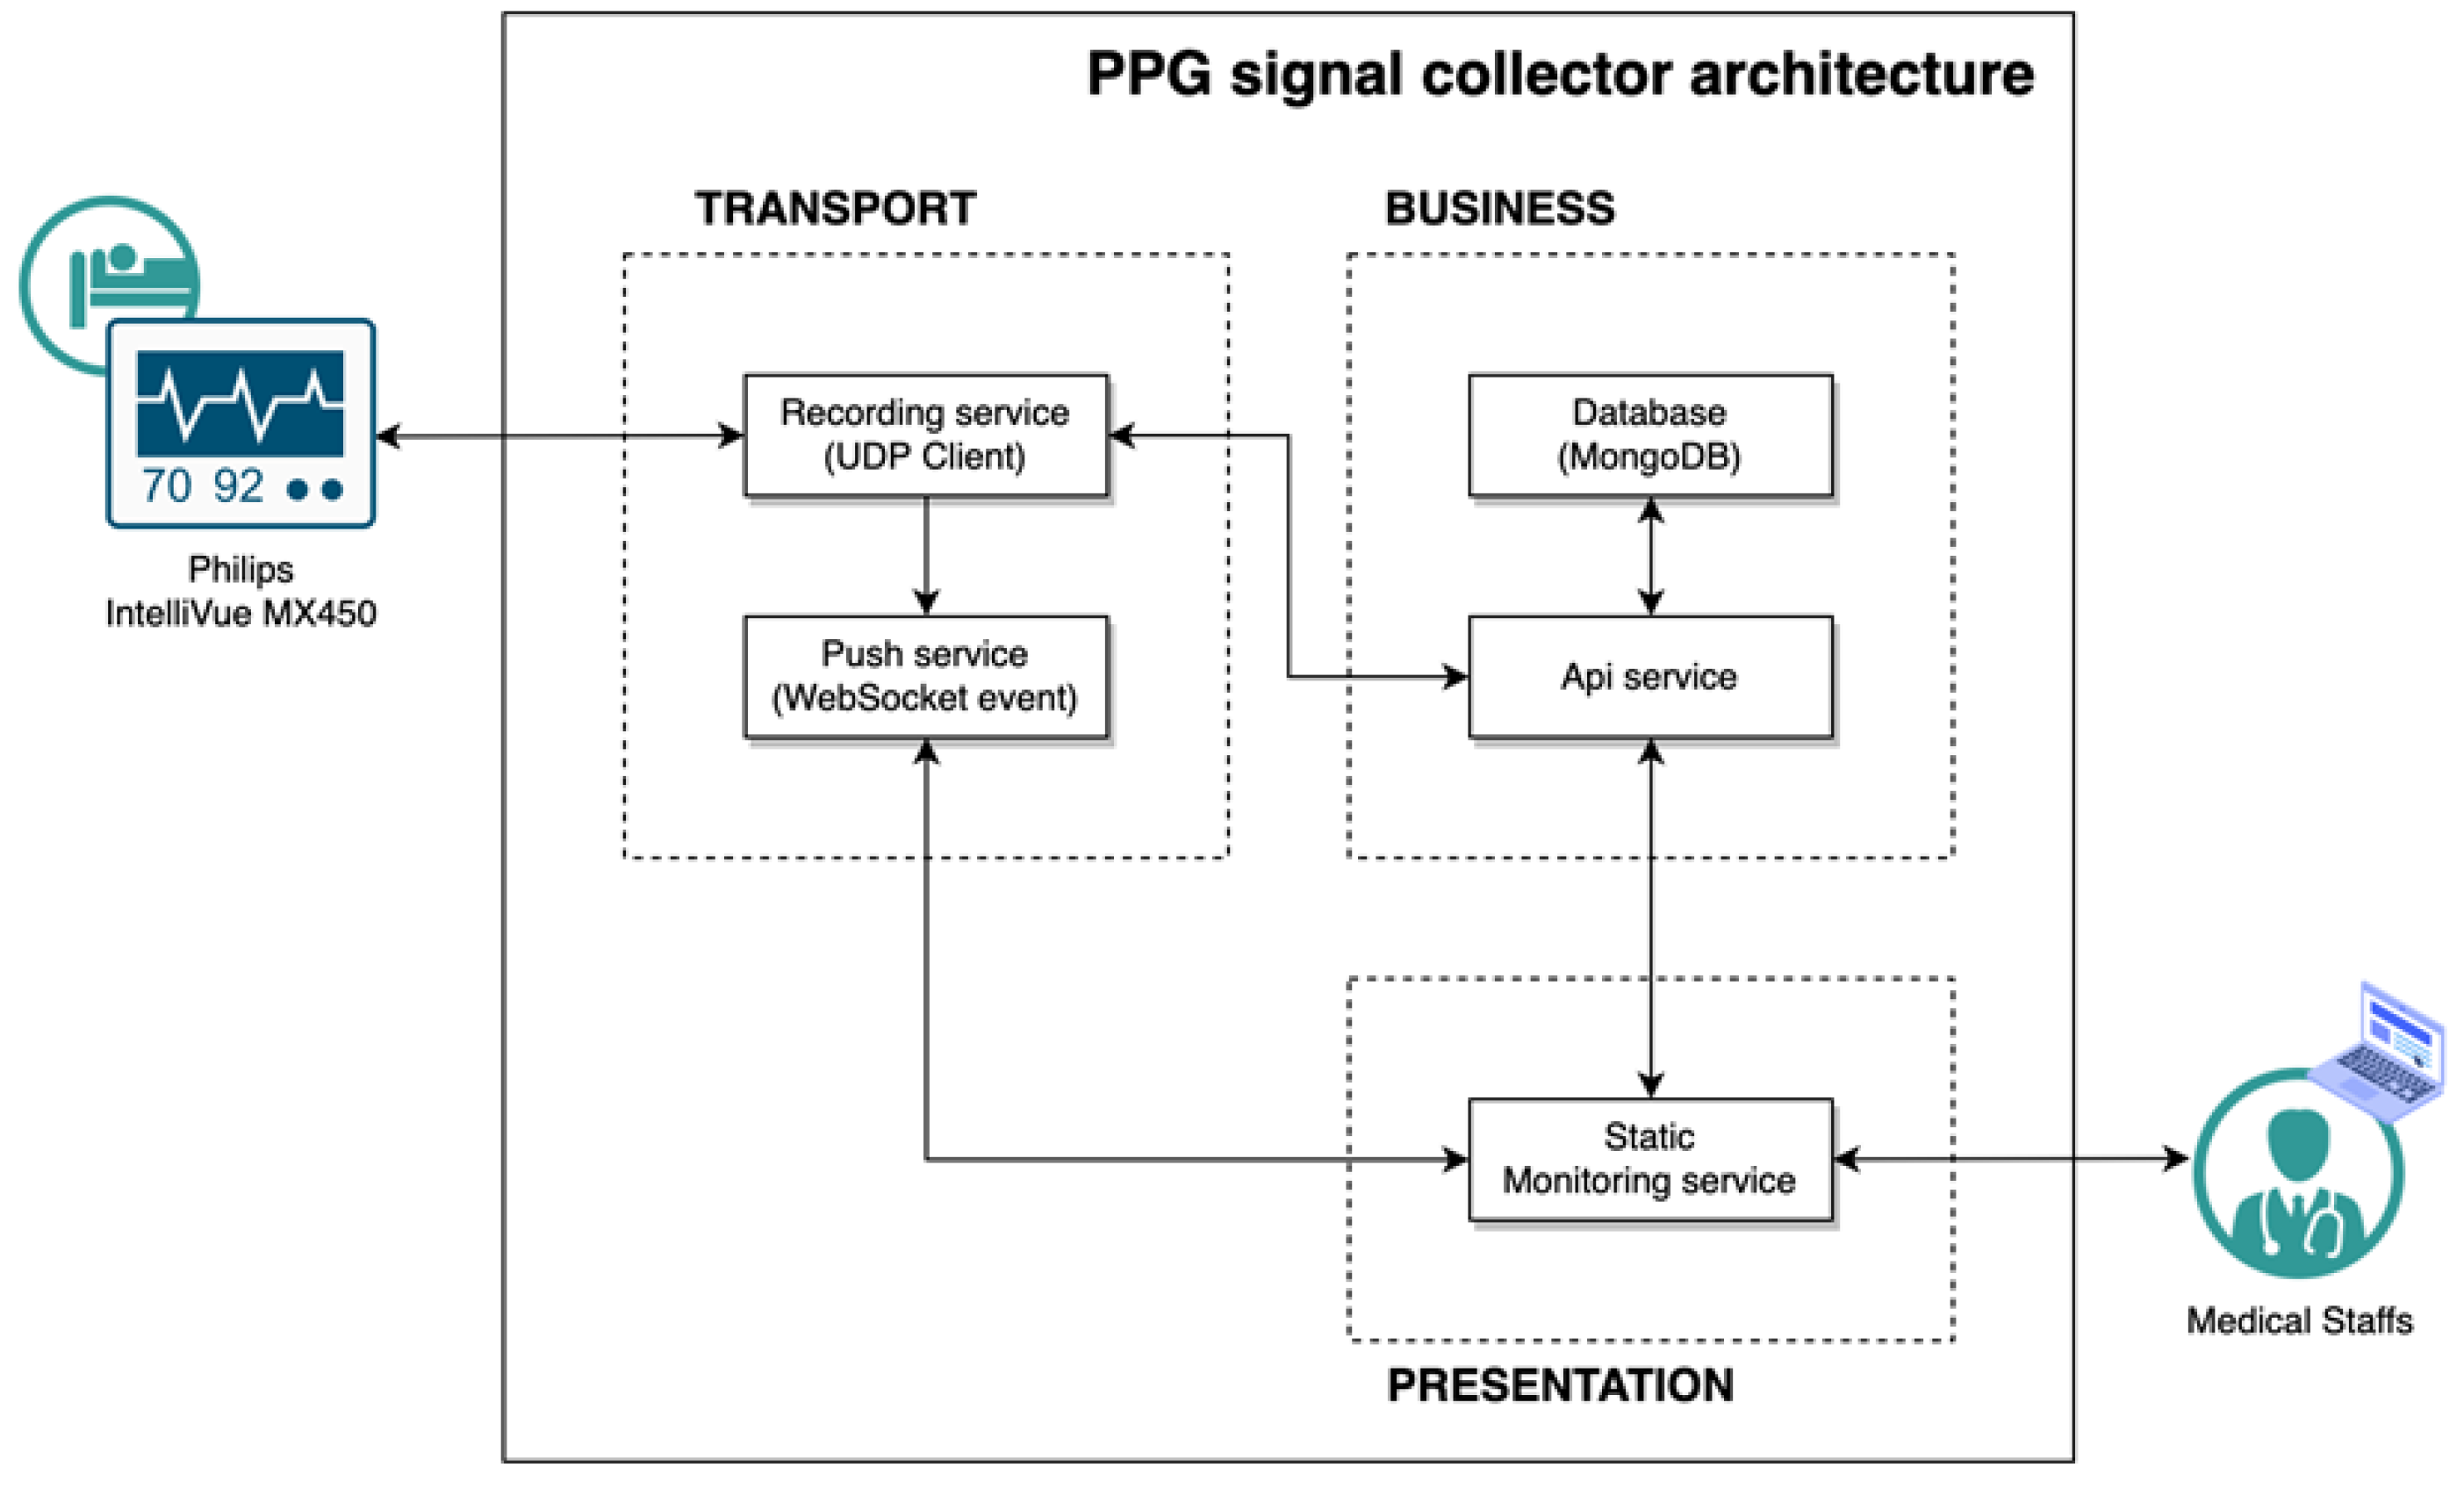
14]. We used a MacOS Big Sur v11.4 laptop with a 1.3 GHz dual-core Intel Core 7 processor CPU and 8 GB 1600 MHz DDR3 memory for our research and Safari v14.11 for the browser. The application was developed in NestJS v8.0.0 and Vue v3.2.31 based on Javascripts 2017 (ES8), and the database was configured with MongoDB v5.0.9. The overall structure of the PPG signal collector is shown in
Figure 3.
2.2. Datasets
StMary
The StMary dataset consisted of 50 patients and 50 healthy volunteers aged 18 and older. All data were collected in the SICU of our institution, which is a tertiary referral hospital, and our SICU has an average of 1,800 patients annually. Our SICU is a closed ICU system, operated by two critical care specialists who take care of all patients who are admitted to the SICU. Therefore, the diagnosis was made by two critical care specialists in consultation with each other, and the decision was made by considering the patient's blood test, physical examination, imaging test, past history, and surgical history. The dataset contained demographic information, PPG signals, and exhalation timestamps for each de-identified subject. Two-minute PPGs were collected for each subject twice, sampled at 125 Hz. A unique ID was generated for each collected two-minute PPG. This ID served as an identifier for individual data and a de-identifier for the subject at the same time.
Table 1 shows each feature name and its description extracted from the StMary dataset.
BIDMC
The BIDMC dataset [
15] contained 53 samples of eight-minute-long signals collected in the ICU of Beth Israel Deaconess Medical Center. Two annotators labeled the RR using each subject’s impedance respiratory signal. The dataset consisted of impedance respiratory rate, electrocardiogram, and PPG sampled at 125 Hz. It also included patient demographics and 1-Hz signals such as the heart rate, respiratory rate, O2 saturation, and pulse. This dataset provides various formats, including CSV, for use in research and benchmark testing as a public dataset.
CapnoBase
The IEEE TBME Respiratory Rate Benchmark dataset [
16] is a dataset designed for developing and testing respiratory rate estimation. The dataset contains eight-minute electrocardiograms, capnography, and PPG signals acquired from 42 patients during elective surgery and routine anesthesia. Labels from an annotator are available for PPG peaks and CO2 in breaths. The data used were from 29 children and 13 adults.
2.3. Experiments
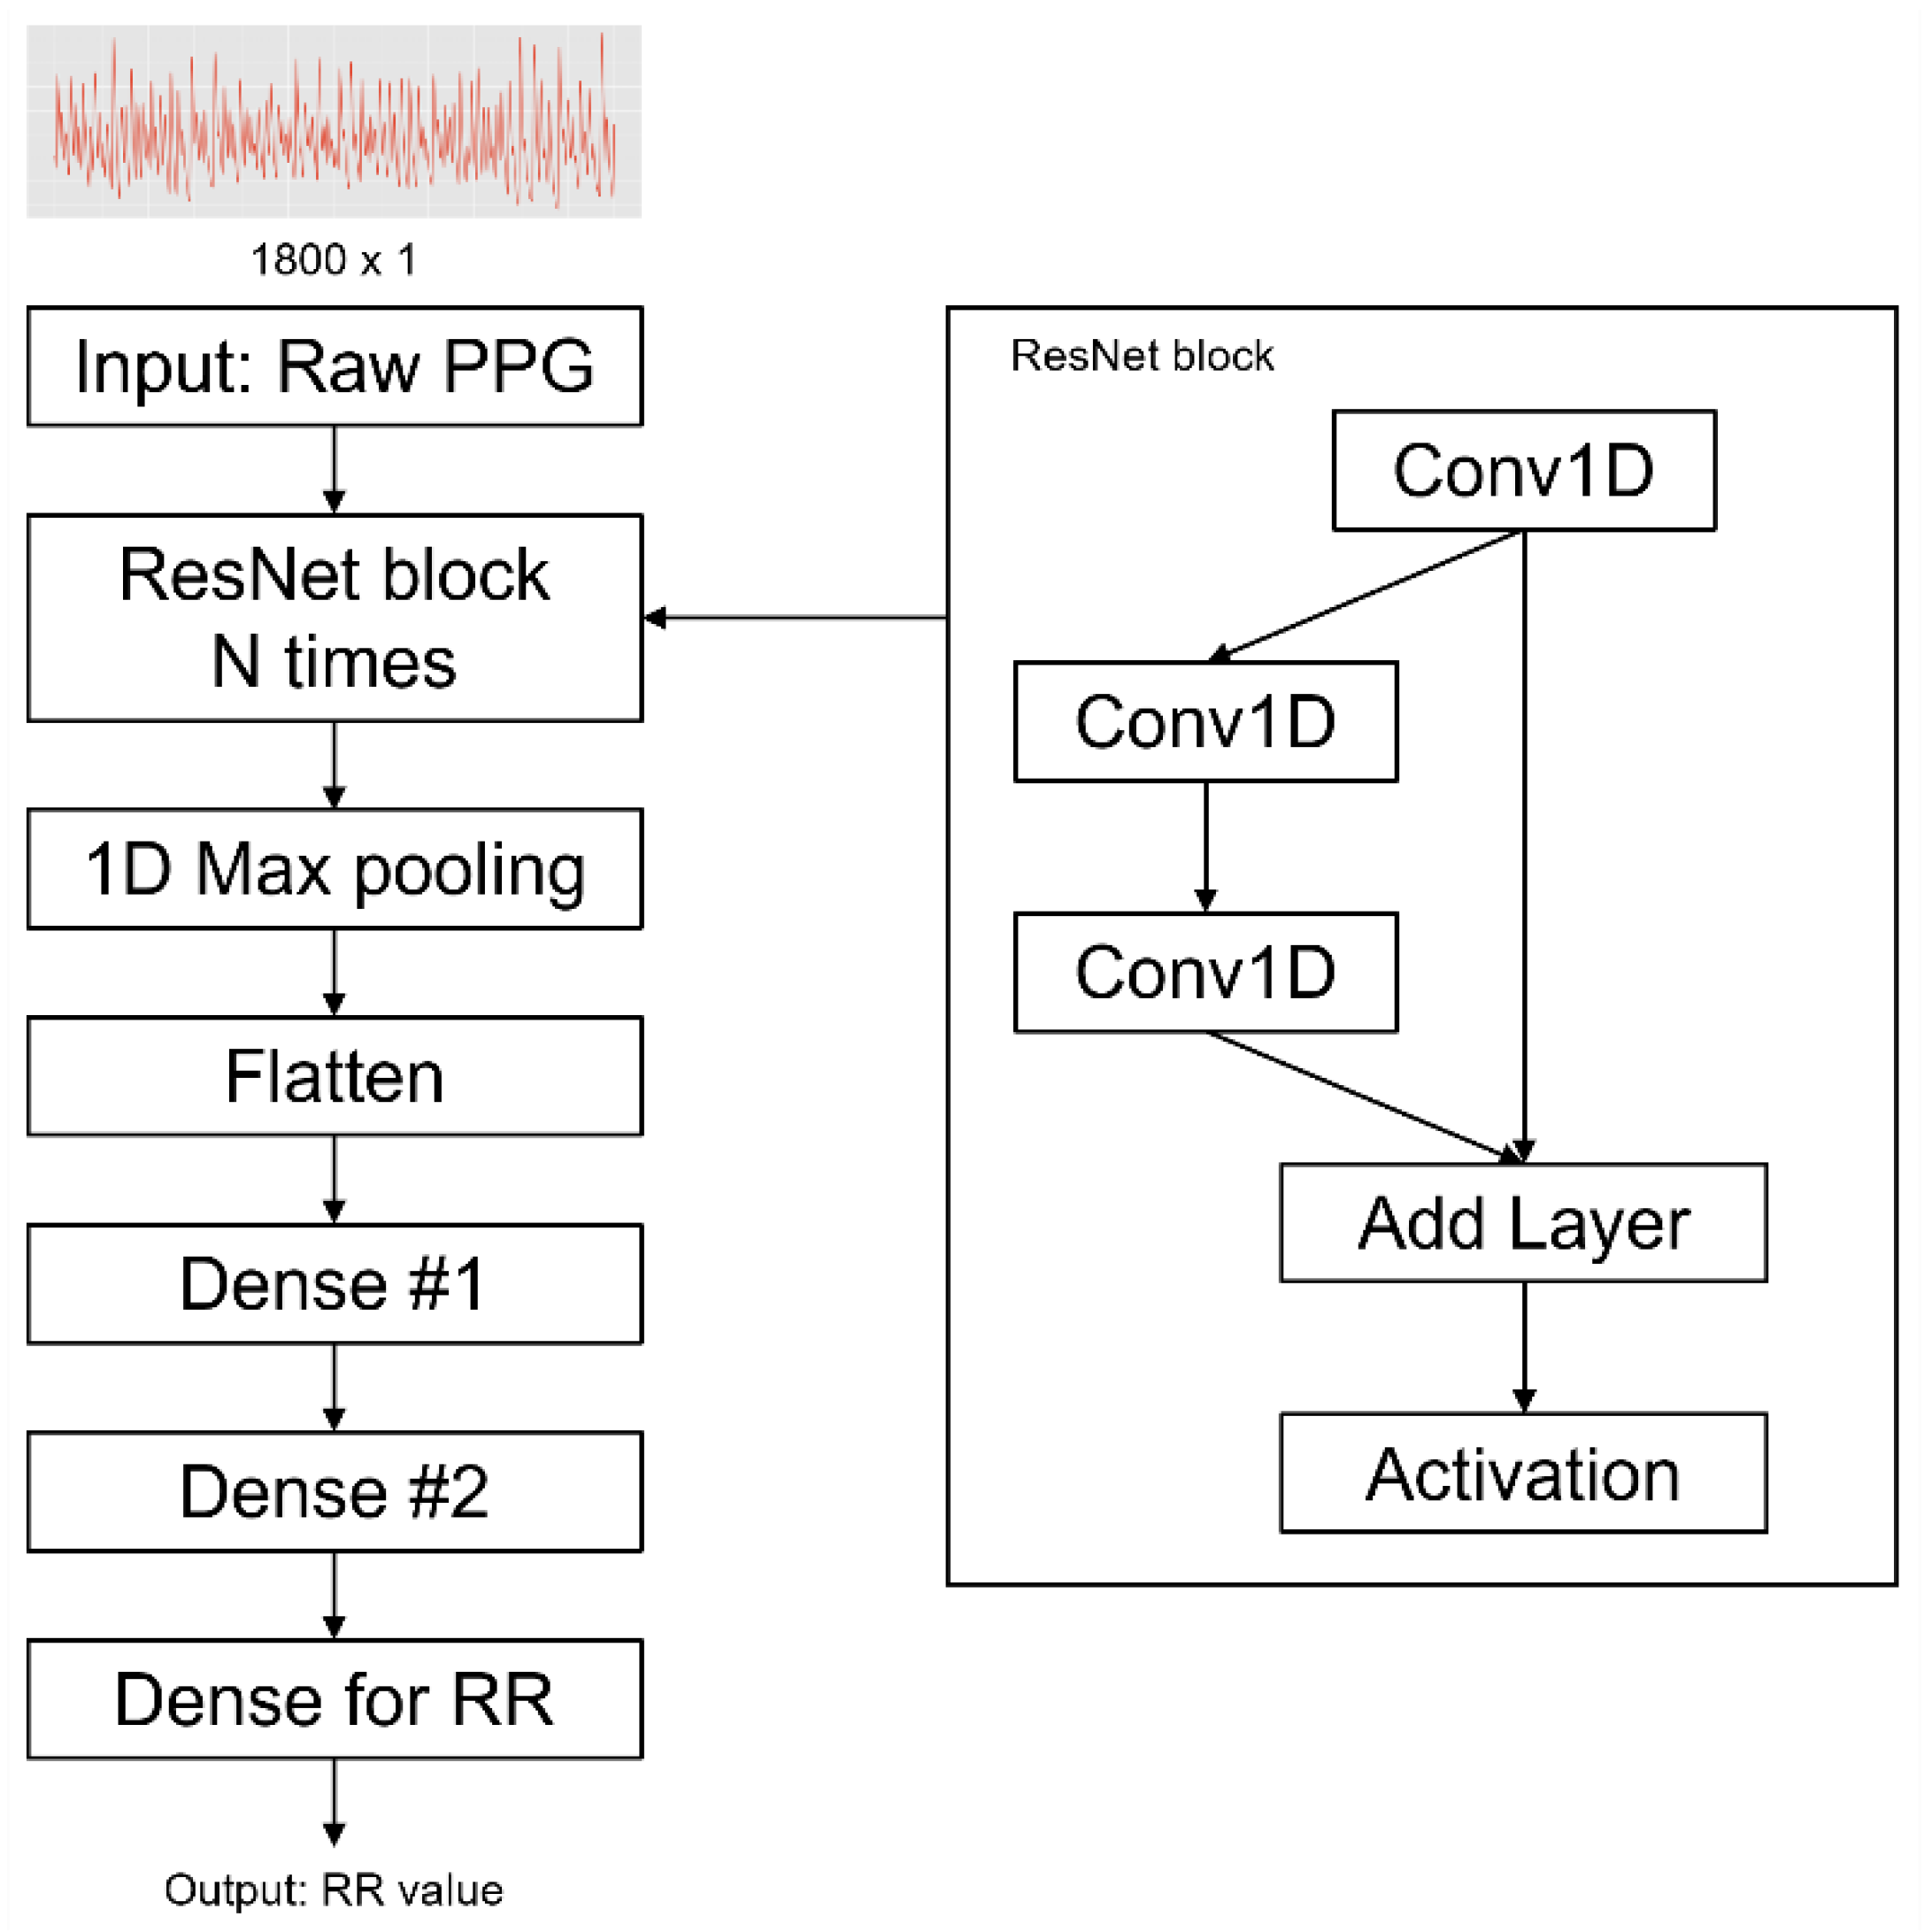
We built a ResNet DNN model based on Bian’s architecture (
Figure 4), which was hyperparameter-tuned by Bayesian optimization [
17,
18]. The reason we adopted their model is that they tried to estimate the RR using PPG as an input. In this study, with this model, we compared the performance of open-source dataset (Capnobase and BIDMC)-based models to the StMary-based model and conducted reasonable verification of the StMary dataset. For our research, PPGs were resampled to 30 Hz to reduce computational requirements and model complexity while preserving the integrity of the data. The optimal window size for RR estimation is between 30 and 90 seconds. If the window size increases, the error rate decreases. In contrast, if the window size decreases, the data can be more stable and calculation costs for the RR estimation algorithm decrease [
16,
19]. In this study, the window size for RR estimation was selected to be 60 seconds, and the window was set to slide by 1 second for sampling.
As the RR unit is breath/min, we counted the breaths within 60 seconds according to the timestamp of respirationTimeline.csv. Thus, the RR value for one minute was used to label the one-minute PPG sample. As a result, a total of 12,573 samples were generated for the StMary dataset. Before inputting data into the ResNet model, min-max normalization was performed on every PPG signal. To optimize the regression problem learning of the model, the Adam optimization technique [
20] was adopted and the batch size was set up to 128. The experiment was conducted for 100 epochs and the mean absolute error (MAE) function was used as a loss function according to the following equation:
where N is the total number of observations in a PPG sample, and
and
are predicted RR values and actual RR values, respectively.
The early stopping technique, which monitors the loss of the validation dataset, was used to prevent overfitting of the model while training. In the dataset, 20% of the data were extracted for testing and 4-fold cross-validation was performed on the model using the remaining 80% of the data. The overall model configuration was conducted with TensorFlow version 2.0, and all experiments were performed on workstations with Intel® Xeon® Silver 4214R CPUs.
All research protocols were conducted in accordance with the ethical standards of the responsible committee on human experimentation (institutional and national) and with the Helsinki Declaration of 1975, as revised in 2000. All data used in this study were anonymized, deidentified, and aggregated before analysis.
3. Results
Based on the above, data were collected on 200 samples in a total of 100 subjects, twice per target subject. The groups consisted of 43 men and 57 women, respectively, and each dataset contained 50 patients and 50 volunteers. Signal sampling was conducted by applying a one-minute window to two-minute data, and extracting one-minute data at 30 Hz. In this process, four patient samples and 10 volunteer samples of less than two minutes were excluded from the experiment. In total, 14 samples (i.e., seven subjects) were excluded. Lastly, we generated a one-minute training dataset and labeled each of the 186 samples that were not excluded (
Table 2).
The patient group consisted of four major diagnosis classes including malignancy, non-cancerous lesion, trauma, and miscellaneous with 21, 16, 6, and 7 patients, respectively. The malignancy and non-cancerous lesion groups included some subgroups. In the malignancy group, three patients had gastric cancer, nine had hepatobiliary-pancreas cancer, four had gynecological cancer, one had malignant mesothelioma, one had tongue cancer, two had renal cell carcinoma, and one had colorectal cancer. In the non-cancerous lesion group, two had deep neck infections, one had an ulcer perforation, four had pan-peritonitis, and nine had vascular disease.
To confirm the validity of the StMary dataset, the PPG of the dataset was split into four groups to determine whether there were any differences in model performance. The groups were:
1. Patient group: diagnosis is not ‘0’
2. Volunteer group: diagnosis is ‘0’
3. Male group: gender is ‘M’
4. Female group: gender is ‘F’
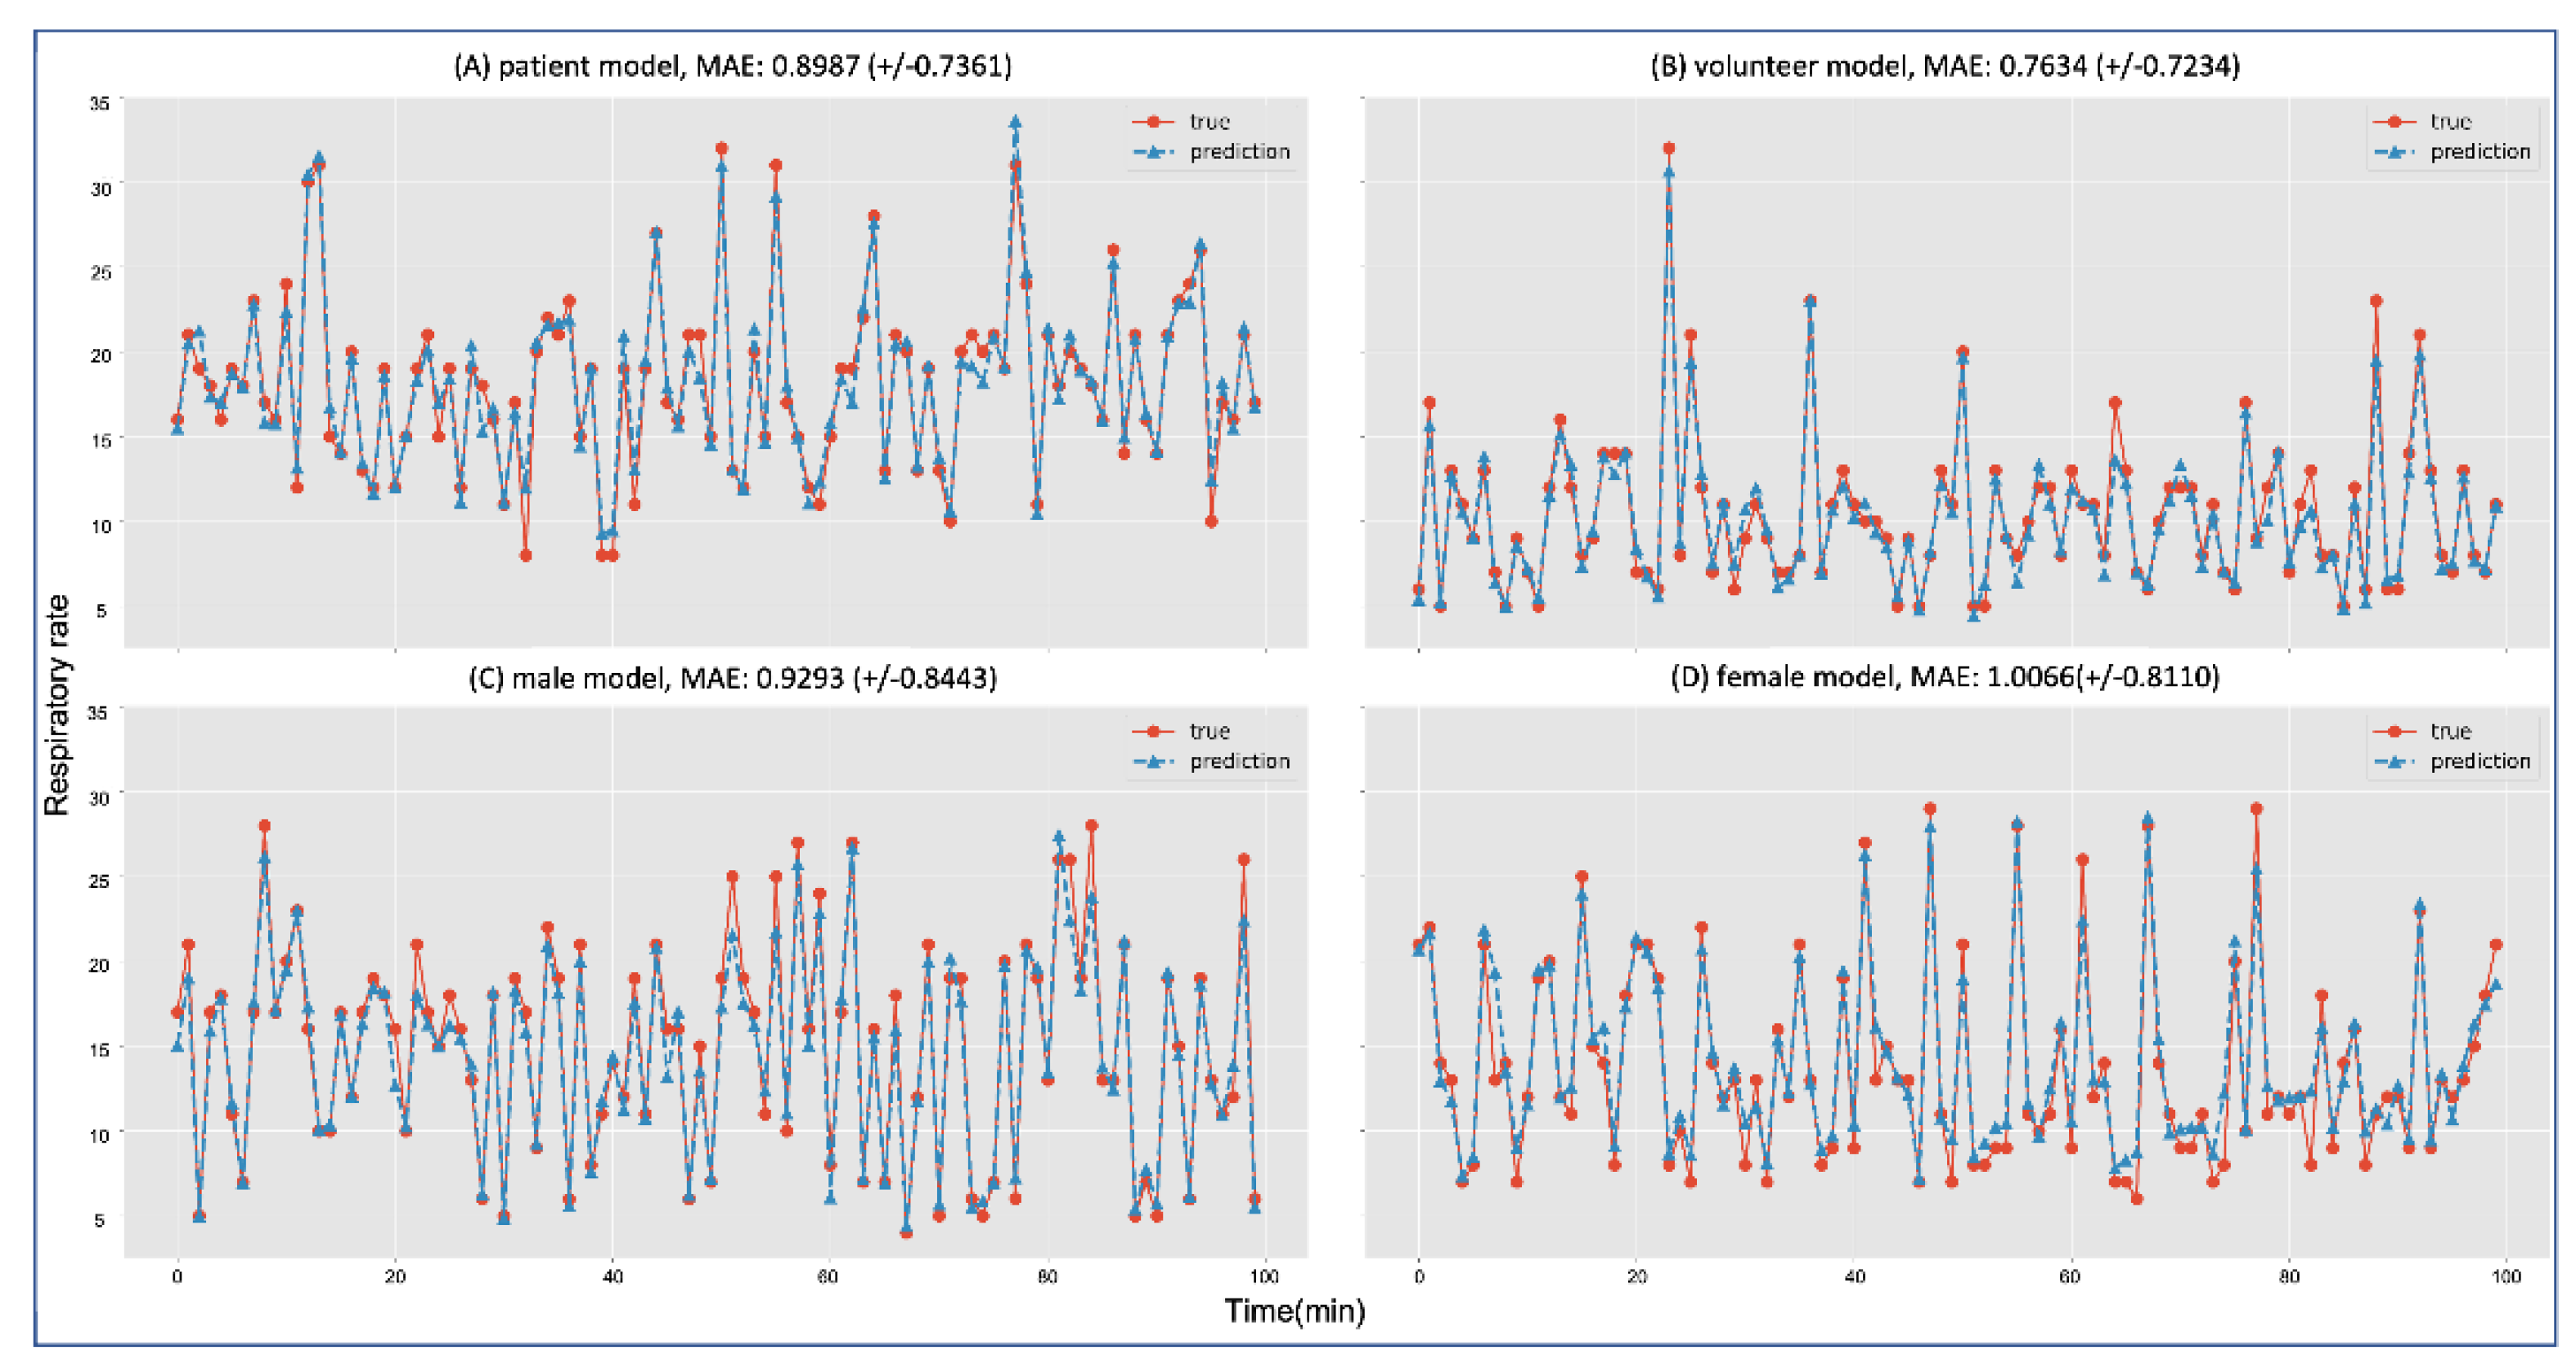
The results of each model showed a low error ratio for inference. The volunteer group showed the lowest MAE at
, and the female group showed the highest MAE at
. Each group’s MAE average and standard deviation are shown in
Figure 5. Although each model had an error ratio, every model significantly followed the trend in RR.
Figure 5 shows the inferences of each group model that evaluated 100 predicted RRs (dotted line with triangles) and actual RRs (line with circles).
Each ResNet model trained with different datasets (CapnoBase, BIDMC, and StMary) showed fine performance with a trend that corresponded to the actual data.
Table 3 shows that the model trained with the CapnoBase dataset had a low MAE of
and the model trained with the StMary dataset showed a high MAE of
. However, despite its error rate, the StMary model demonstrated a high correspondence with actual data.
Two public datasets, CapnoBase and BIDMC, were employed to compare the validity and results of the StMary dataset. Each dataset was sampled and labeled in the same way as mentioned above. Then, five experiments were conducted using the ResNet model with individual or selectively merged datasets (
Table 3). In the merged dataset shown in
Table 3, the model trained with CapnoBase and BIDMC datasets showed an MAE of
and the model trained with CapnoBase, BIDMC, and StMary datasets showed an MAE of
which was a lower error rate than in the earlier model.
4. Discussion
The results of the four groups showed that the StMary dataset had a meaningful validity regardless of patient gender or illness. As the differences in error rates were not high, the RR model was shown to significantly predict actual RR trends. This demonstrates that the ResNet model for RR prediction had learned a few patterns from the PPGs and RRs in the StMary dataset. Since the model is easily affected by its dataset quality, if our StMary dataset showed a low quality, then our models would not show low error rates.
The results of the selectively merged datasets also strongly indicated the validity of the StMary dataset. This is because the results of the model using combined BIDMC, CapnoBase, and StMary datasets showed a lower error rate than the model using only BIDMC and CapnoBase datasets. Generally, it is true that if the size of the dataset used for training increases, the error rate of the model decreases. However, if a new dataset has poor quality because of signal noise, distortion, and outliers, then combining it with new data may add confusion to model training, which results in bad performance. However, even though the StMary dataset and the two public datasets (BIDMC, CapnoBase) had different properties, the MAE score of the model additionally trained with the StMary dataset showed a much lower MAE compared to the model trained with only the two public datasets. This demonstrates that our PPG data could be considered a meaningful dataset, along with the other public datasets. If we advance our PPG signal collector to collect more components and consider a more systemic data table scheme, we will be able to achieve much more objective and detailed results.
We had confronted several limitations in the current research. First, we could not configure a much more consistent data-collecting environment. Although it is desirable to configure a consistent dataset with a strictly controlled collecting method and subjects, patients admitted to the ICU had various attributes, which were hard to control, such as age, gender, diagnosis, and operation method differences. Volunteers also had some of these, such as uncontrollable breathing patterns or temporary changes in their respiration rate. Actually, as considering for this bias, we did not focus on the enrollment of patients with respiratory diseases. In the case of critically ill patients with respiratory diseases, it is thought that there are several confounding factors caused by the pathologic condition of respiratory function itself, such as the involuntary movements, shaking, or tremors due to frequent suction and coughing, that causes difficulties in RR measuring. To overcome this, a more systematic clinical data-collecting schema including more detailed subject demographics (e.g., age, gender, whether they underwent surgery, infusion drug time, etc.) and various clinical signals (e.g., electrocardiogram, electroencephalogram, and end-tidal CO2, etc.) should be developed. The preceding research on public datasets such as CapnoBase and BIDMC can be used as references. We also need to consider the sampling window size to extract more samples. Shortening the window size and using end-tidal CO2 for labeling the RR will help us to achieve the goal. Ravichandran [
11] used a similar research approach. Secondly, we need additional verification for the StMary dataset to develop a more accurate model or useful clinical applications. Although it is true that the current StMary dataset and its model showed significant results, classifying and verifying high-quality PPG signals in the StMary dataset will give fair PPG signals more suitable for training. The signal quality index (SQI) [
13], which is often used for scoring signal characteristics, will be exploited to classify signal quality in our future work. Lastly, racial PPG differences also have to be considered. The two public datasets used (CapnoBase and BIDMC) came from Westerners, but the StMary dataset in this study was collected from Asians. Considering the principle of PPG sensing, skin color, the thickness of the blood vessels, and blood viscosity could be considered essential factors [
21,
22,
23]. Such differences exist along with racial characteristics, and the frequency of diseases differs along with it. Therefore, racial PPG differences should not be underestimated. In future work, we will compare the PPGs in the StMary dataset with the others to determine whether racial bias exists in the PPGs. This can be evaluated by a classification model that uses similarity measure algorithms [
24], which are usually employed for time-series data.
However, despite the limitations of the current study, we introduced a reliable new algorithm extracting from photoplethysmography as a real-time surveillance tool for RR and confirmed the validity of the StMary dataset, which consists of Asian PPGs collected in an SICU using our PPG signal collector, in a ResNet model based on Bian's architecture. It is already well known that the clinical usefulness and importance of monitoring changes and patterns of RR are significant. Therefore, the presentation of an algorithm showing comparable accuracy compared to the existing results not only has usefulness for clinical use, but is also expected to have potential as a fastidious surveillance tool for the Asian population, which has not been studied much due to the characteristics of the dataset. We look forward to providing various new opportunities not only through well-known Western datasets but also through an Asian dataset in future research. The PPG signals collected were clinical data from 50 patients and 50 volunteers in the SICU and consisted of Asians only over the age of 18. Although more strict verification is needed, data consisting of Asian patients and a normal group have significant value. And also, it seems that additional validation on whether such an algorithm really shows a difference in accuracy by race and disease types should be done. It should be performed through data recruit including a larger number of data and various races and types of diseases in the near future. We expect that the StMary dataset will contribute greatly to the generalization of the model as it is possible to train a much more robust model. Therefore, in future work, we will verify the dataset more clearly and will provide the StMary dataset as a public dataset.
5. Conclusions
The StMary dataset we collected from the SICU of the tertiary referral hospital can be considered a meaningful dataset, and showed its significant model performance. This dataset will subsequently contribute as the clinical research data that supports RR evaluation by AI models, which is a critical vital sign for patients, and surveillance tools to test whether equipment monitoring, and alarming functions are working properly.
Author Contributions
Conceptualization, Eun Young Kim; Formal analysis, Chishin Hwang and JUNG K Hyun; Investigation, Chishin Hwang and Eun Young Kim; Methodology, JUNG K Hyun; Project administration, Eun Young Kim; Resources, Chishin Hwang and Yonghwan Kim; Software, Yonghwan Kim, JUNG K Hyun, Joonhwang Kim, Seorak Lee, Choongmin Kim, Sanghee Rho and Jungwoo Nam; Supervision, Yonghwan Kim and Eun Young Kim; Validation, JUNG K Hyun, Joonhwang Kim, Seorak Lee, Choongmin Kim, Sanghee Rho, Jungwoo Nam and Eun Young Kim; Visualization, Chishin Hwang, Joonhwang Kim, Seorak Lee, Choongmin Kim, Sanghee Rho and Jungwoo Nam; Writing – original draft, Chishin Hwang; Writing – review & editing, Eun Young Kim.
Funding
The authors received no specific funding for this work.
Institutional Review Board Statement
This study involved human participants and human data and was approved by the Institutional Review Board of the Ethics Committee of Seoul St. Mary’s Hospital (IRB No. KC21ONSI0839).
Informed Consent Statement
Not applicable.
Data Availability Statement
The datasets used and analyzed during the current study are available from the corresponding author upon reasonable request.
Acknowledgments
No additional investigators participated in this research project.
Conflicts of Interest
The authors declare no conflict of interest for this article. It is the responsibility of the corresponding author to review this policy with all authors.
Abbreviations
AI: artificial intelligence; BP: blood pressure; DNN: deep neural network; HR: heart rate; ICU: intensive care unit; MAE: mean absolute error; PPG: photoplethysmogram; RR: respiratory rate; SICU: surgical intensive care unit
References
- Lim, W. et al. Defining community acquired pneumonia severity on presentation to hospital: an international derivation and validation study. Thorax 58, 377-382 (2003). [CrossRef]
- Shann, F., Hart, K. & Thomas, D. Acute lower respiratory tract infections in children: possible criteria for selection of patients for antibiotic therapy and hospital admission. Bulletin of the World Health Organization 62, 749 (1984).
- Singer, M. et al. The Third International Consensus Definitions for Sepsis and Septic Shock (Sepsis-3). JAMA 315, 801-810 (2016). [CrossRef]
- Goldhill, D. The critically ill: following your MEWS. Vol. 94 507-510 (Oxford University Press, 2001).
- Hogan, J. Why don't nurses monitor the respiratory rates of patients? British Journal of nursing 15, 489-492 (2006). [CrossRef]
- Liu, H., Allen, J., Zheng, D. & Chen, F. Recent development of respiratory rate measurement technologies. Physiological measurement 40, 07TR01 (2019). [CrossRef]
- Allen, J. Photoplethysmography and its application in clinical physiological measurement. Physiological measurement 28, R1 (2007). [CrossRef]
- Sahni, R. Noninvasive monitoring by photoplethysmography. Clinics in perinatology 39, 573-583 (2012). [CrossRef]
- Charlton, P. H. et al. An assessment of algorithms to estimate respiratory rate from the electrocardiogram and photoplethysmogram. Physiological measurement 37, 610 (2016). [CrossRef]
- Bian, D., Mehta, P. & Selvaraj, N. in 2020 42nd annual international conference of the IEEE engineering in Medicine & Biology Society (EMBC). 5948-5952 (IEEE).
- Ravichandran, V. et al. in 2019 41st Annual International Conference of the IEEE Engineering in Medicine and Biology Society (EMBC). 5556-5559 (IEEE).
- Kumar, A. K., Ritam, M., Han, L., Guo, S. & Chandra, R. Deep learning for predicting respiratory rate from biosignals. Computers in Biology and Medicine 144, 105338 (2022). [CrossRef]
- Lampier, L. C., Coelho, Y. L., Caldeira, E. M. & Bastos-Filho, T. F. A Deep Learning Approach to Estimate the Respiratory Rate from Photoplethysmogram. Ingenius, 96-104 (2022). [CrossRef]
- Data Export Interface Programming Guide: IntelliVue Patient Monitor & Avalon Fetal Monitor. (2015).
- Goldberger, A. L. et al. PhysioBank, PhysioToolkit, and PhysioNet: components of a new research resource for complex physiologic signals. circulation 101, e215-e220 (2000). [CrossRef]
- Karlen, W., Raman, S., Ansermino, J. M. & Dumont, G. A. Multiparameter respiratory rate estimation from the photoplethysmogram. IEEE Transactions on Biomedical Engineering 60, 1946-1953 (2013). [CrossRef]
- He, K., Zhang, X., Ren, S. & Sun, J. in Proceedings of the IEEE conference on computer vision and pattern recognition. 770-778.
- Snoek, J., Larochelle, H. & Adams, R. P. Practical bayesian optimization of machine learning algorithms. Advances in neural information processing systems 25 (2012).
- Schäfer, A. & Kratky, K. W. Estimation of breathing rate from respiratory sinus arrhythmia: comparison of various methods. Annals of Biomedical Engineering 36, 476-485 (2008). [CrossRef]
- Kingma, D. P. & Ba, J. Adam: A method for stochastic optimization. arXiv preprint arXiv:1412.6980 (2014). [CrossRef]
- Wesley, N. O. & Maibach, H. I. Racial (ethnic) differences in skin properties. American journal of clinical dermatology 4, 843-860 (2003).
- Sjoding, M. W., Dickson, R. P., Iwashyna, T. J., Gay, S. E. & Valley, T. S. Racial Bias in Pulse Oximetry Measurement. New England Journal of Medicine 383, 2477-2478 (2020). [CrossRef]
- Brillante, D. G., O'Sullivan, A. J. & Howes, L. G. Arterial stiffness indices in healthy volunteers using non-invasive digital photoplethysmography. Blood Pressure 17, 116-123 (2008). [CrossRef]
- Serra, J. & Arcos, J. L. An empirical evaluation of similarity measures for time series classification. Knowledge-Based Systems 67, 305-314 (2014). [CrossRef]
|
Disclaimer/Publisher’s Note: The statements, opinions and data contained in all publications are solely those of the individual author(s) and contributor(s) and not of MDPI and/or the editor(s). MDPI and/or the editor(s) disclaim responsibility for any injury to people or property resulting from any ideas, methods, instructions or products referred to in the content. |
© 2023 by the authors. Licensee MDPI, Basel, Switzerland. This article is an open access article distributed under the terms and conditions of the Creative Commons Attribution (CC BY) license (http://creativecommons.org/licenses/by/4.0/).
