Submitted:
26 April 2023
Posted:
27 April 2023
You are already at the latest version
Abstract
Keywords:
1. Introduction
2. Materials and Methods
2.1. Receiver Arrays
2.2. Tagging Smolts
2.3. Detection Efficiency and Tidal Current
2.4. Tidal Current
2.5. Detecting Passing Events
- 1.
-
Measure the distance of closest approach of each passing tagged fish to the receiver (proxy turbine) and identify those that were close enough to cross the area that would be swept by turbine blades. Two measurement methods might be used.
- (a)
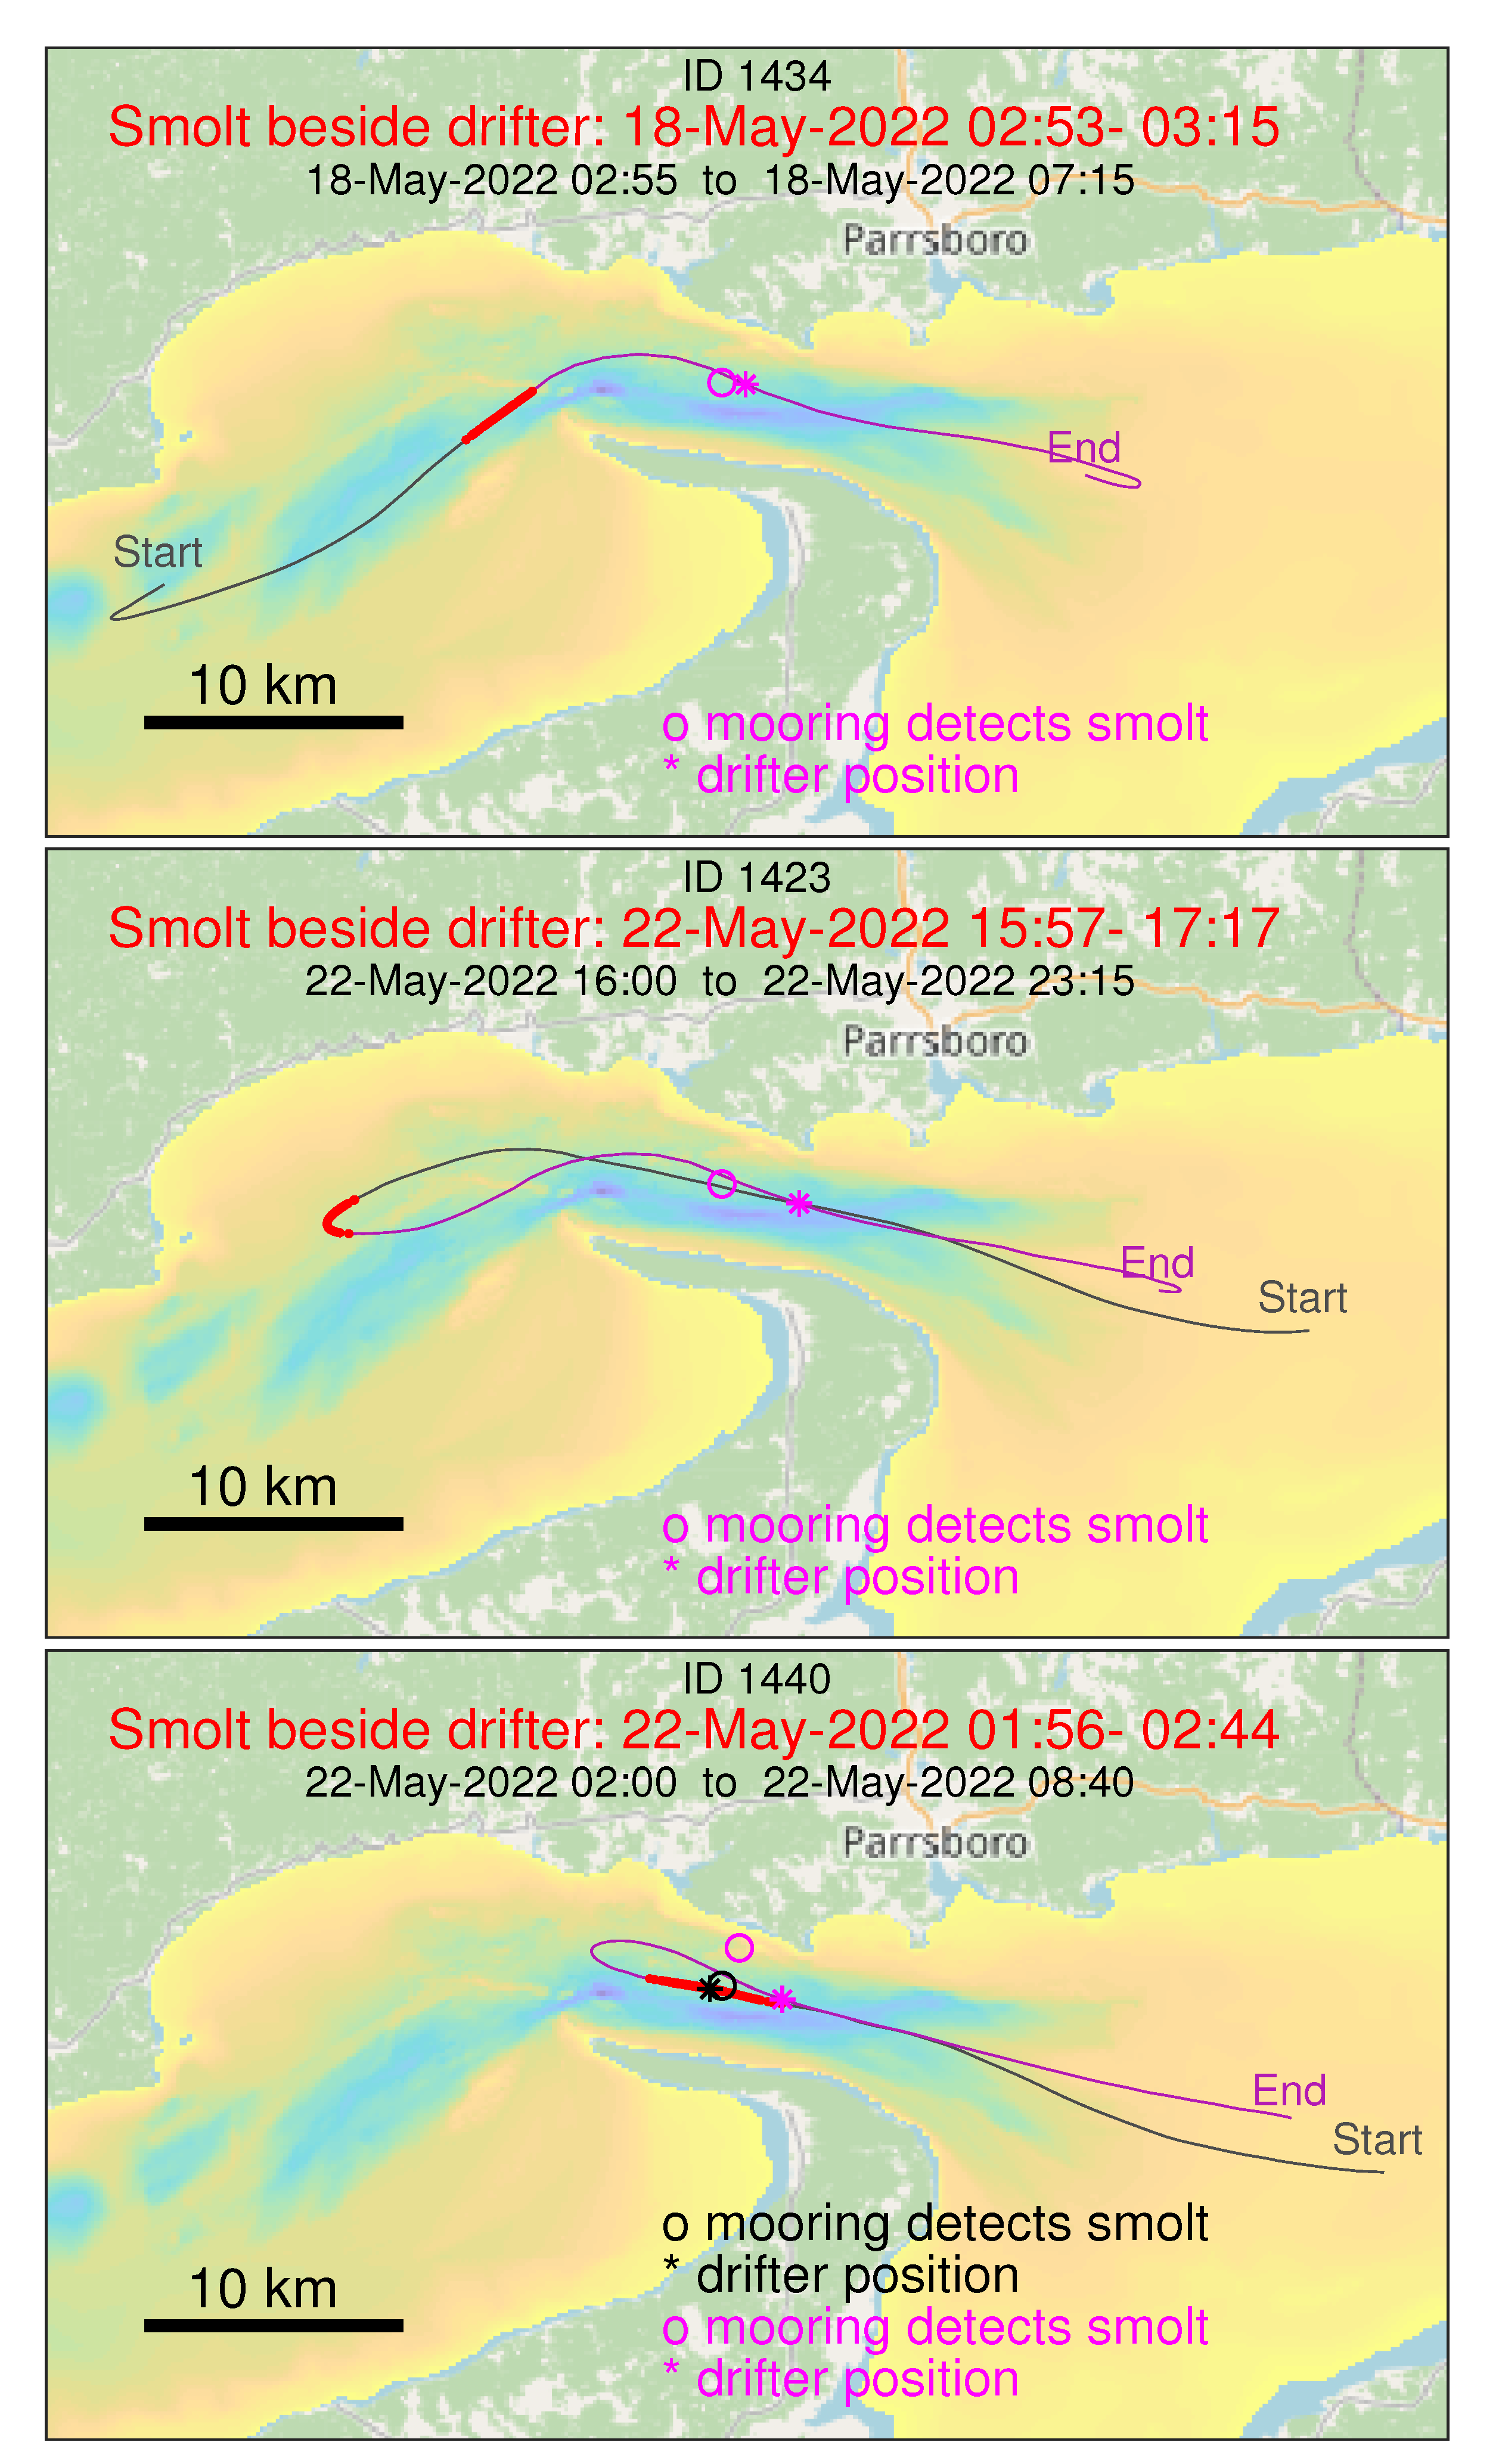
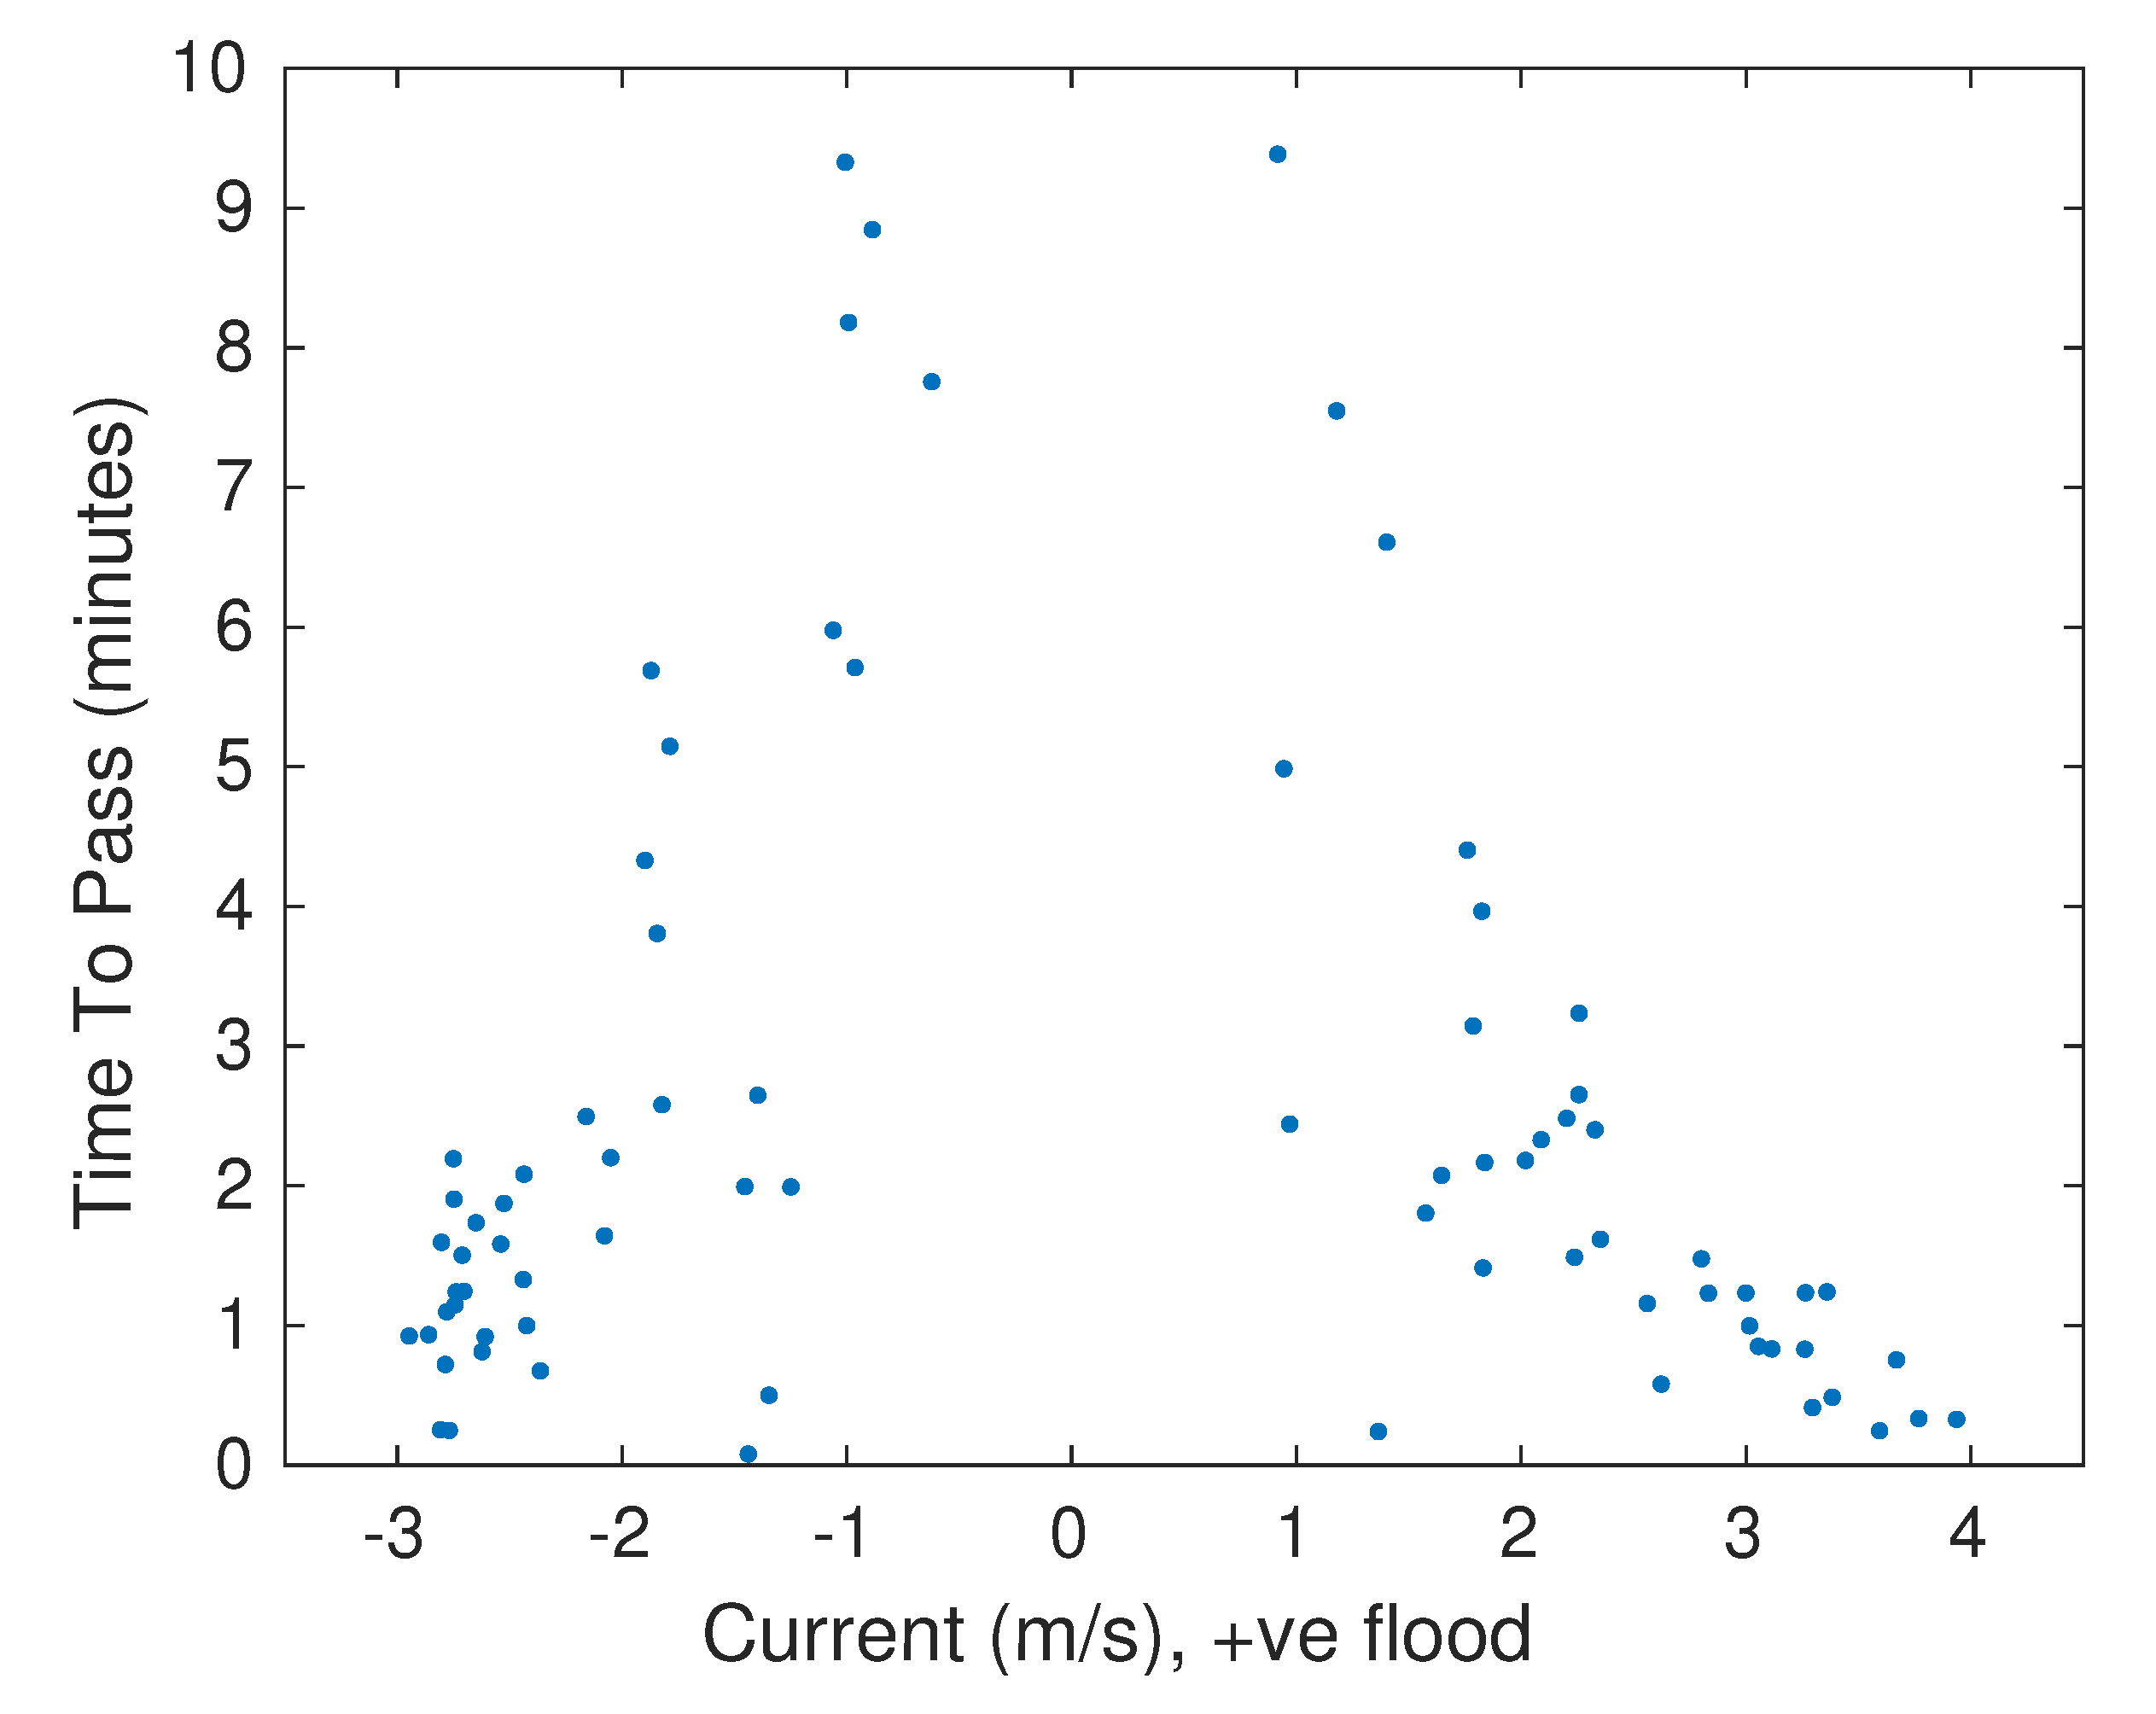
- The number of signals that are detected during a passing event will typically be larger if the smolt passes closer to the receiver. Drifter studies demonstrate much variability in the measured number of detections relative to the expected number [9].
- (b)
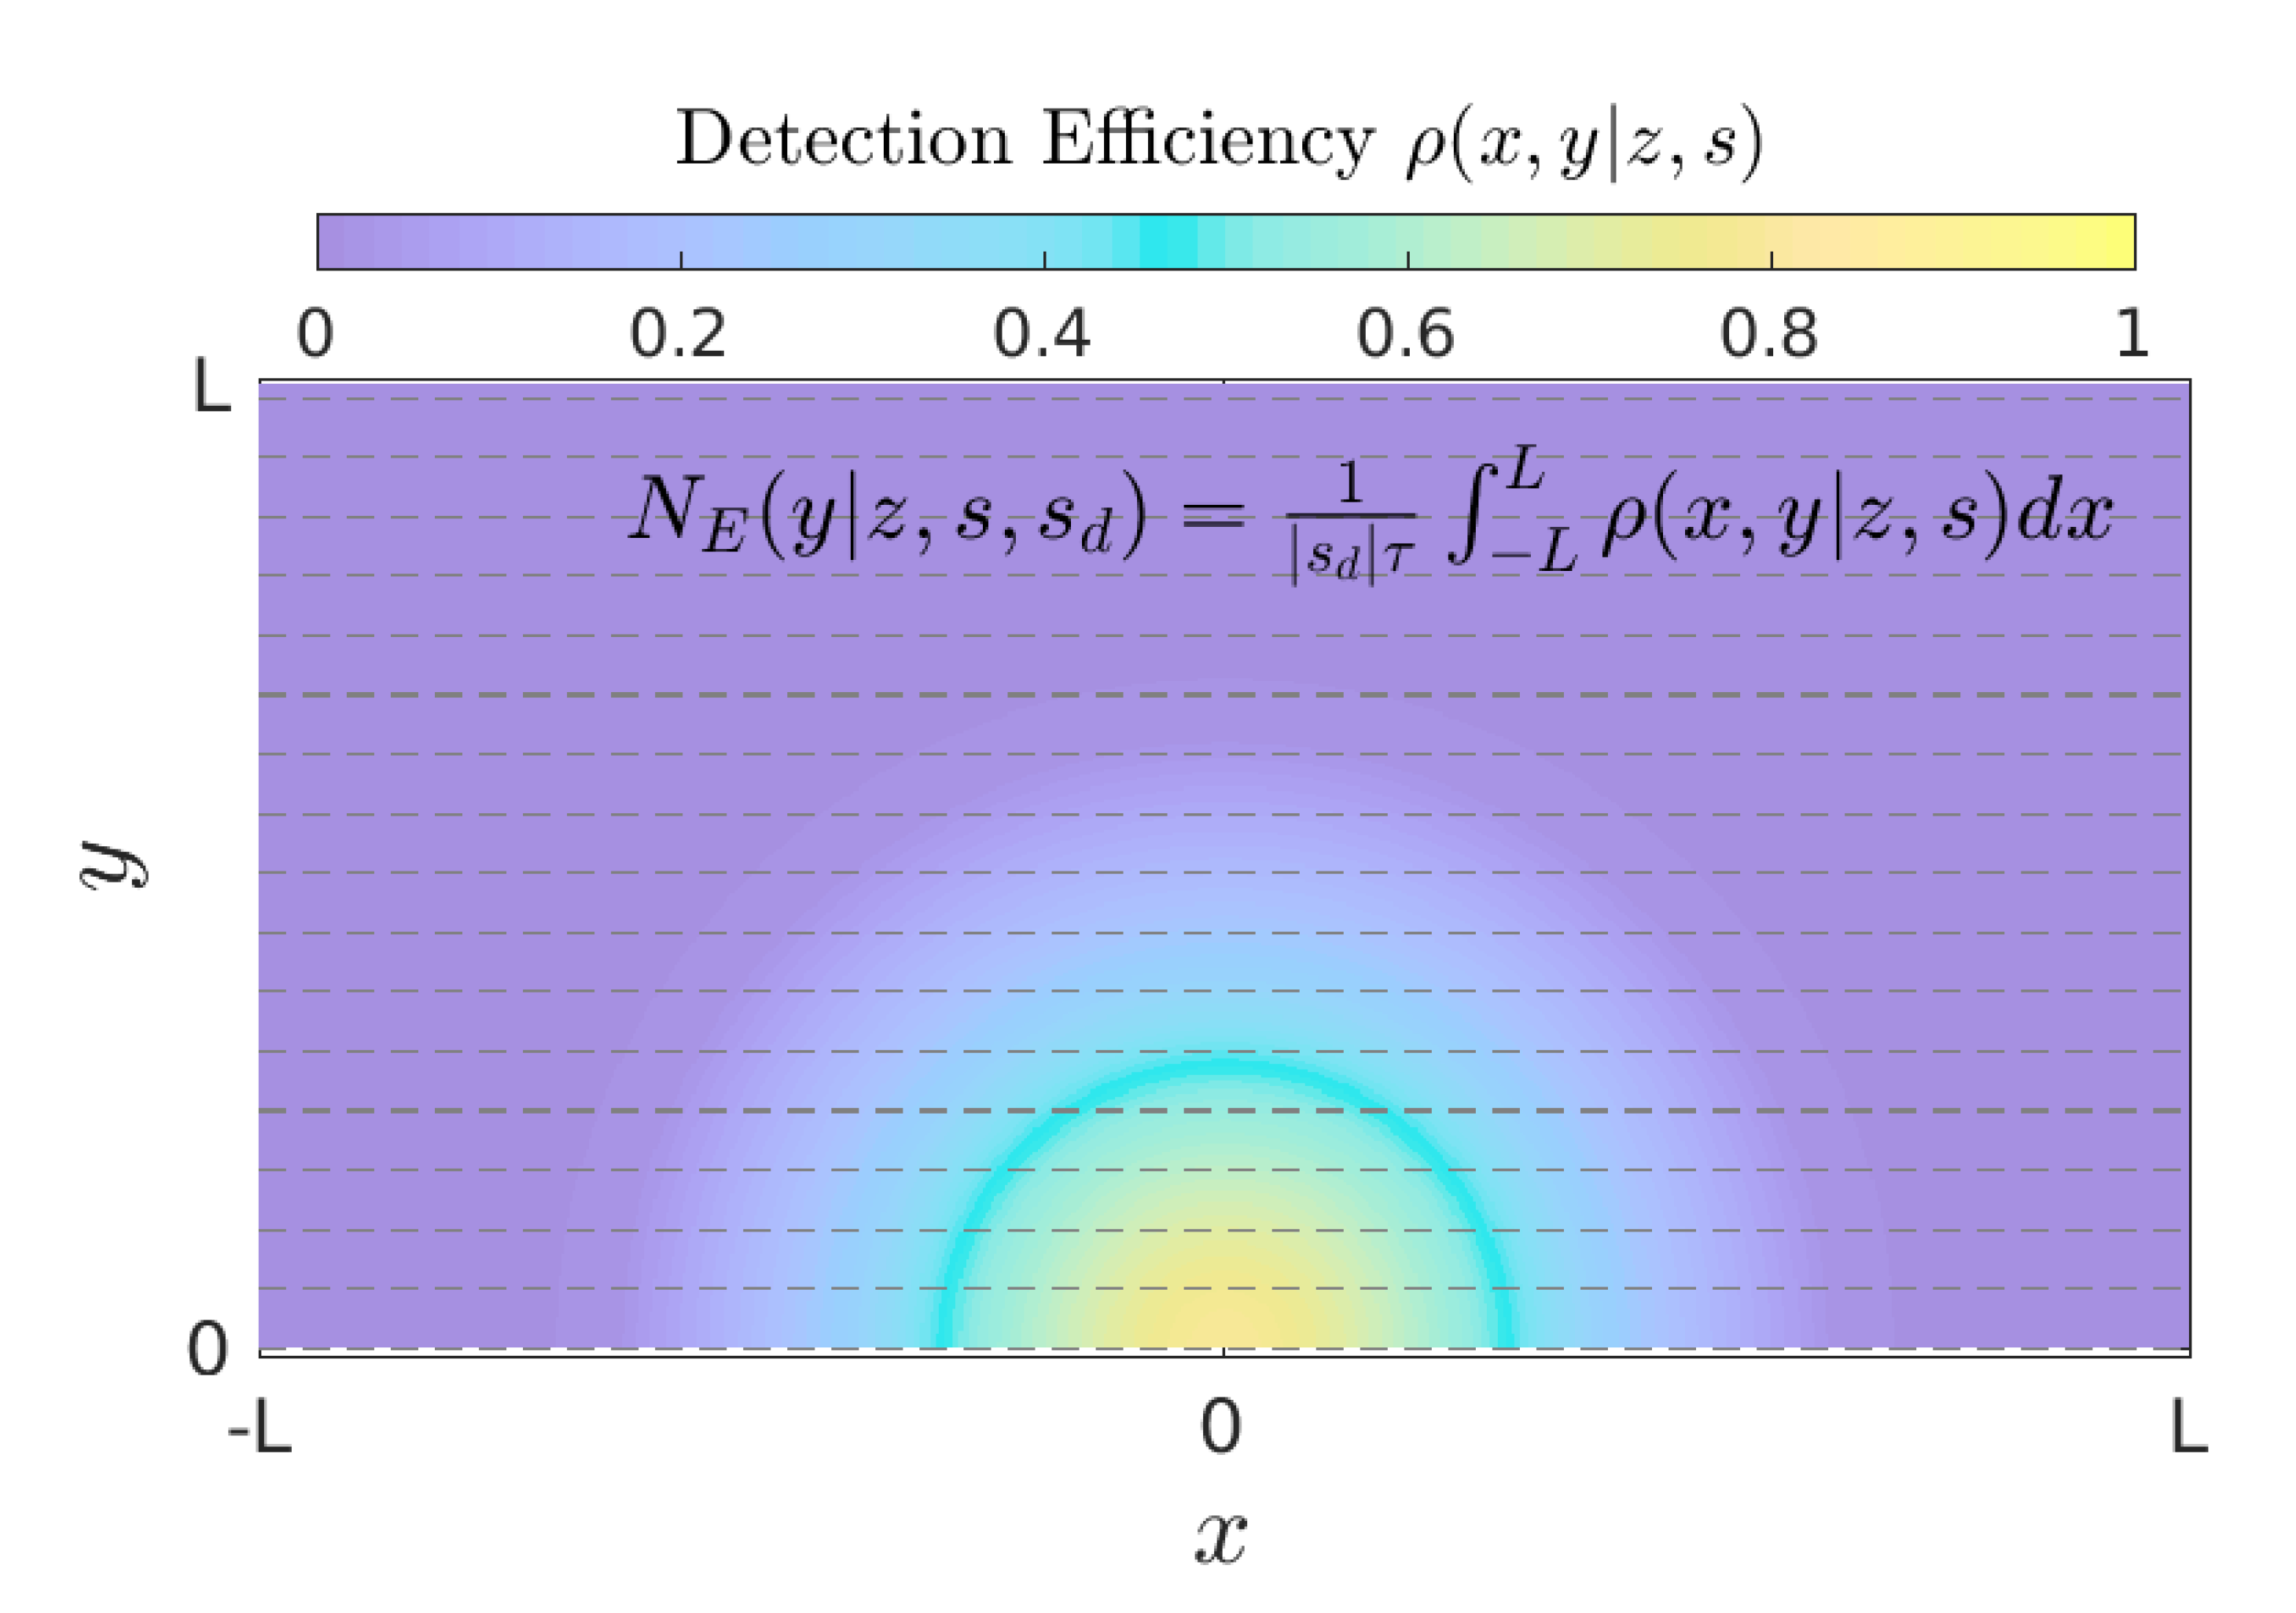
- Use many closely-spaced HR2 receivers to localize the track of each tagged fish as it passes by. Measurements of detection efficiency [13] indicated an impractical number of receivers would be required.
- 2.
- Another approach is to consider that a detected passing event might have been on any one of a set of all paths that passed the receiver/turbine. This approach builds on an assumption of statistical similarity for paths that cross within a scale comparable to the effective range of detection [9]. This was the approach that was previously used to calculate the probability that drifters would collide with a turbine installation in Minas Passage [12]. Presently, we build upon this approach.
2.6. Calculation of Probability of Encounter
3. Results
3.1. Presence of Tagged Post Smolts in Minas Passage
3.2. Post Smolt Motion in Minas Passage, Passing Events
3.3. Probabilities of Encounter for Post Smolts in Minas Passage
4. Discussion
Author Contributions
Funding
Data Availability Statement
Acknowledgments
Conflicts of Interest
Abbreviations
| FORCE | Fundy Ocean Research Centre for Energy |
| DFO | Department of Fisheries and Oceans, Canada |
| OTN | Ocean Tracking Network, Canada |
| MHK | Marine hydrokinetic |
| TED | Tidal Energy Demonstration |
| PPM | Pulse position modulation |
| HR | High residency |
| HR2 | High residence receiver |
| FVCOM | Finite-Volume Coastal Ocean Model |
| GPS | Global Positioning System |
References
- Price, D. Energy and human evolution. Population and Environment 1995, 16(4), 301–319. [Google Scholar] [CrossRef]
- May, R.M. Ecological science and tomorrow’s world. Philosphical Transactions of the Royal Society B 2010, 365, 41–47. [Google Scholar] [CrossRef] [PubMed]
- Karsten, R.; McMillan, J.; Lickley, M.; Haynes, R. Assessment of tidal current energy in the Minas Passage, Bay of Fundy. Journal of Power and Energy 2008, 222(A3), 289–297. [Google Scholar] [CrossRef]
- Lenders, H.J.R.; Chamuleau, T.P. M; Hendriks, A.J.; Lauwerier, R.C.G.M.; Leuven, R.S.E.W.; Verberk, W.C.E.P. Historical rise of waterpower initiated the collapse of salmon stocks. Sci Rep. 2926. [Google Scholar] [CrossRef]
- DuBois, R.B.; Gloss, S.P. Mortality of juvenile shad and striped bass passed through Ossberger crossflow turbines at a small-scale hydroelectric site. North American Journal of Fisheries Management 1993, 13, 178–185. [Google Scholar] [CrossRef]
- Watson, S.M.; Schneider, A.D.; Gardner, L.C.; Apell, B.R.; Thompson, P.C.; Cadman, G.B.; Gagnon, I.F.; Frese, C.R.; Wechsler, J.F. Juvenile alewife passage through a compact hydropower turbine designed for fish safety. North AMerican Journal of Fisheries Management. 2022. [Google Scholar] [CrossRef]
- Dadswell, M.J.; Rulifson, R.A. Macrotidal estuaries: a region of collision between migratory marine animals and tidal power development. Biological Journal of the Linnean Society 1994, 51, 93–113. [Google Scholar] [CrossRef]
- Karsten, R. An assessment of the potential of tidal power from Minas Passage, Bay of Fundy, using three-dimensional models. In Proceedings of the ASME 2001 30th International Conference on Ocean, Offshore and Arctic Engineering, OMEA2011-49249, 2011, Rotterdam, Netherlands.
- Sanderson, B.G.; Karsten, R.; Hasselman, D.J. Using drifters equipped with acoustic tags to verify the utility of detection efficiency measurements for estimating probability of fish-turbine encounter. J. Mar. Sci. Eng. Submitted. [CrossRef]
- Davie, E. 2019 Tidal energy companies join forces for Bay of Fundy project. CBC News. www.cbc.ca/news/canada/nova-scotia/sustainable-marine-energy-minas-tidal-lp-bay-of-fundy-tidal-power-1.5304276.
- Jeffcoate, P.; McDowell, J. Performance of PLAT-I, a floating tidal energy platform for inshore applications. In Proceedings of the 12th European Wave and Tidal Energy Conference 27th Aug -1st Sept 2017, Cork, Ireland.
- Sanderson, B.G.; Stokesbury, M.J.W.; Redden, A.M. 2021. Using trajectories through a tidal energy development site in the Bay of Fundy to study interaction of renewable energy with local fish. Journal of Ocean Technology 2021, 16(1), 50–70. [Google Scholar]
- Sanderson, B.G.; Bangley, C.W.; McGarry, L.P.; Hasselman, D.J. Measuring detection efficiency of 170 kHz high-residency acoustic signals in a fast-flowing tidal passage. J. Mar. Sci. Eng. Submitted. [CrossRef]
- Betz, A. 1966. Introduction to the Theory of Flow Machines, (D. G. Randall, Trans.); Oxford: Pergamon Press, 1966. [Google Scholar]
- Hammar, L. , Andersson, S.; Eggertsen, L.; Haglund, J.; Gullstrom, M.; Ehnberg, J.; Molander S. Hydrokinetic Turbine Effects on Fish Swimming Behaviour. PLoS ONE 2013, 8(12), e84141. [Google Scholar] [CrossRef] [PubMed]
- Broadhurst, M.; Barr, S.; Orme, D. In-Situ Ecological Interactions with a Deployed Tidal Energy Device; An Observational Pilot Study. Ocean & Coastal Management 2014, 99, 31–38. [Google Scholar]
- Castro-Santos, T.; Haro, A. Survival and behavioral effects of exposure to a hydrokinetic turbine on juvenile Atlantic salmon and adult American Shad. Estuaries Coasts 2015, 38 (Suppl. 1), 203–214. [Google Scholar] [CrossRef]
- Shen, H.; Zydlewski, G.; Viehman, H.; Staines, G. Estimating the probability of fish encountering a marine hydrokinetic device. Renewable Energy 2016, 97, 746–756. [Google Scholar] [CrossRef]
- Grippo, M.; Zydlewski, G.; Shen, H.; Goodwin, R.A. Behavioral responses of fish to a current-based hydrokinetic turbine under mutliple operational conditions. Environmental Monitoring and Assessment, 2020, 192, 645. [Google Scholar] [CrossRef] [PubMed]
- Viehman, H.A.; Zydlewski, G.B. Fish Interactions with a Commercial-Scale Tidal Energy Device in the Natural Environment. Estuaries and Coasts 2015, 38 (Suppl 1), 1):S241–S252. [Google Scholar] [CrossRef]
- Fraser,S. ; Williamson, B.J; Nikora, V.; Scott, B.E. Fish distributions in a tidal channel indicate the behavioural impact of a marine renewable energy installation. Energy Reports, 2018, 4, 65–69. [Google Scholar]
- Viehman, H.A.; Hasselman, D.J.; Douglas, J.; Boucher, T. The ups and downs of using active acoustic technologies to study fish at tidal energy sites. Frontiers of Marine Science, 2022, 9. [Google Scholar] [CrossRef]
- Keyser, F.; Redden, A.M.; Sanderson, B.G. Winter presence and temperature-related diel vertical migration of Striped Bass Morone saxatilis in an extreme high flow passage in the inner Bay of Fundy. Canadian Journal of Fisheries and Aquatic Sciences. Published on the web , 10. 02 June 1139. [Google Scholar]
- Stokesbury, M.J.W.; Logan-Chesney, L.M.; McLean, M.F.; Buhariwalla, F.F.; Redden, A.M.; Beardsall, J.W.; Broome, J.; Dadswell, M.J. Atlantic sturgeon spatial and temporal distribution in Minas Passage, Nova Scotia: a region of future tidal power extraction. 11(7).
- Lilly, J.; Dadswell, M.J.; McLean, M.f.; Avery, T.S.; Comolli, P.D.; Stokesbury, M.J.W. Atlantic sturgeon presence in a designated marine hydrokinetic test site prior to turbine deployment: A baseline study. Journal of Applied Ichthyology.
- Sanderson, B.G.; Buhariwalla, C.; Adams, M.; Broome, J.; Stokesbury, M.; Redden, A.M. 2017. Quantifying detection range of acoustic tags for probability of fish encountering MHK devices. In Proceedings of the 12th European Wave and Tidal Energy Conference, Cork, Ireland, 27 Aug-1st Sept 2017.
- Tsitrin, E.; Sanderson, B.G.; McLean, M.F.; Gibson, A.J.F.; Hardie, D.C.; Stokesbury, M.J.W. Migration and apparent survival of postspawning alewife (Alosa pseudoharengus) in Minas Basin, Bay of Fundy. Animal Biotelemetry, 2022, 10(11).
- Solda, C. Migration ecology of Inner Bay of Fundy Atlantic Salmon (Salmo Salar) smolt, and the relationship between improvements in tagging technology and surgical procedures and estimates of post surgery survival, M.Sc., Acadia University, Wolfville, Nova Scotia, in preparation.
- Renkawitz, M.D.; Sheehan, T.F.; Goulette, G.S. Swimming depth, behavior, and survival of Atlantic salmon postsmolts in Penobscot Bay, Maine. Transactions of the American Fisheries Society, 2012, 141, 1219–1229. [Google Scholar] [CrossRef]
- Newton, M.; Barry, J.; Dodd, J.A.; Lucas, M.C.; Boylan, P.; Adams, C.E. A test of the cumulative effect of river weirs on downstream migration success, speed and mortality of Atlantic salmon (Salmo salar) smolts: An empirical study. Ecol. Freshwat. Fish, 2018; 28, 176–186. [Google Scholar] [CrossRef]
- DFO. 2008. Recovery Potential Assessment for Inner Bay of Fundy Atlantic Salmon. DFO Can. Sci. Advis. Sec. Sci. Advis. Rep. 2008/050. https://waves-vagues.dfo-mpo.gc.ca/library-bibliotheque/335147.pdf.
- Chen, C.; Beardsley, R.C.; Cowles, G. An unstructured-grid, finite-volume coastal ocean model (FVCOM) system, Oceanography, 2006, 19, 78-89. [CrossRef]
- Okubo, A. Horizontal dispersion of floatable particles in the vicinity of velocity singularities such as convergences. Deep-Sea Research 1970, 17(3), 445–454. [CrossRef]
- Bahaj, A.S. Marine current energy conversion: the dawn of a new era in electricity production. Phil Trans R Soc A, 2012. [Google Scholar] [CrossRef]
- Amaral, S.V.; Bevelhimer, M.S.; Cada, G.F.; Giza, D.J.; Jacobson, P. T; McMahon, B.J.; Pracheil, B.M. Evaluation of Behavior and Survival of Fish Exposed to an Axial-Flow Hydrokinetic Turbine. North American Journal of Fisheries Management 2015, 35, 97–113. [Google Scholar] [CrossRef]
- Greenberg, D.A. 1983. Modelling the mean barotropic circulation in the Bay of Fundy and Gulf of Maine. J. Phys. Oceanogr. 1983, 13, 886–904. [Google Scholar] [CrossRef]
- Tee, K.T. Tide induced residual motion — verification of a numerical model. J. Phys. Oceanogr. 1977, 7, 396–402. [Google Scholar] [CrossRef]
- Viehman, H., Boucher, T.; Redden, A.M. Winter and summer differences in probability of fish encounter (spatial overlap) with MHK devices. Proceedings of the 12th European Wave and Tidal Energy Conference 27th Aug-1st Sept 2017, Cork, Ireland.
- Wild Atlantic Salmon in Eastern Canada, Report of the Standing Committee on Fisheries and Oceans, proceedings of the House of Commons and its Committees, 17, 42nd Parliament, 1st Session. 20 January.
| smolt | stn | (ms) | time | ||
|---|---|---|---|---|---|
| 0.0608 | 0.0595 | 1 | 1 | -1.91 | 17-May 10:33 |
| 0.0597 | 0.0597 | 1 | 2 | 0.06 | 18-May 18:24 |
| 0.0649 | 0.0613 | 1 | 1 | 2.86 | 19-May 02:07 |
| 0.1333 | 0.1075 | 1 | 12 | 4.36 | 19-May 16:33 |
| 0.0755 | 0.0678 | 1 | 9 | 3.42 | 20-May 06:05 |
| 0.0727 | 0.0662 | 1 | 5 | -3.71 | 20-May 09:36 |
| 0.0607 | 0.0595 | 2 | 1 | -1.76 | 20-May 13:00 |
| 0.0799 | 0.0689 | 2 | 8 | 4.08 | 20-May 15:53 |
| 0.0691 | 0.0634 | 2 | 12 | -3.19 | 21-May 11:08 |
| 0.0713 | 0.0652 | 2 | 4 | -3.61 | 21-May 23:38 |
| 0.0614 | 0.0597 | 2 | 7 | 2.26 | 22-May 08:39 |
| 0.0597 | 0.0586 | 3 | 12 | -1.75 | 16-May 09:12 |
| 0.0643 | 0.0599 | 3 | 4 | -2.55 | 16-May 21:29 |
| 0.0747 | 0.0672 | 3 | 4 | -3.84 | 17-May 07:09 |
| 0.0671 | 0.0624 | 3 | 6 | 3.09 | 17-May 16:42 |
| 0.0739 | 0.0669 | 4 | 1 | -3.78 | 17-May 20:48 |
| 0.1140 | 0.0955 | 4 | 2 | 4.68 | 18-May 03:58 |
| 0.0872 | 0.0762 | 4 | 2 | -4.13 | 18-May 08:54 |
| 0.0618 | 0.0601 | 5 | 6 | 2.32 | 20-May 07:09 |
| 0.0719 | 0.0665 | 5 | 2 | 3.53 | 20-May 19:12 |
| 0.0757 | 0.0678 | 5 | 2 | -3.85 | 20-May 22:47 |
| 0.0817 | 0.0699 | 5 | 4 | 4.09 | 21-May 06:06 |
| 0.0650 | 0.0606 | 5 | 1 | -2.85 | 21-May 12:43 |
| 0.0777 | 0.0680 | 5 | 12 | 3.52 | 22-May 05:10 |
| 0.0636 | 0.0596 | 5 | 12 | -2.64 | 22-May 12:49 |
| 0.0608 | 0.0595 | 6 | 1 | -1.88 | 19-May 12:09 |
| 0.0676 | 0.0621 | 6 | 10 | -3.06 | 20-May 11:16 |
| 0.0695 | 0.0641 | 6 | 2 | 3.27 | 20-May 19:21 |
| 0.4116 | 0.2615 | 6 | 1 | 5.86 | 21-May 04:54 |
| 0.0603 | 0.0594 | 7 | 1 | -1.37 | 16-May 22:28 |
| 0.0604 | 0.0595 | 7 | 1 | 1.73 | 16-May 23:56 |
| 0.0610 | 0.0595 | 7 | 1 | -1.99 | 17-May 10:29 |
| 0.0591 | 0.0587 | 7 | 9 | -0.92 | 19-May 00:08 |
| 0.0606 | 0.0596 | 7 | 2 | 1.76 | 19-May 01:32 |
| 0.0699 | 0.0651 | 7 | 9 | 3.09 | 20-May 15:40 |
| 0.0587 | 0.0585 | 7 | 11 | 0.73 | 21-May 20:46 |
| 0.0647 | 0.0603 | 7 | 7 | -2.82 | 21-May 22:26 |
| Post smolts | |||||
|---|---|---|---|---|---|
| 2022 Gaspereau | 23 | 9 | 11 | ||
| 2019 Gaspereau | 71 | 18 | 22 | ||
| 2019 Stewiacke | 39 | 19 | 38 |
| 2022 Gaspereau River | 2019 Gaspereau River | 2019 Stewiacke River | ||||
|---|---|---|---|---|---|---|
| (ms) | ||||||
| 0.0098±0.0030 | 0.075±0.031 | 0.0110±0.0024 | 0.014±0.004 | 0.034±0.0078 | 0.075±0.017 | |
| 0.0091±0.0028 | 0.073±0.031 | 0.0087±0.0022 | 0.014±0.004 | 0.032±0.0078 | 0.072±0.017 | |
| 0.0091±0.0028 | 0.072±0.031 | 0.0082±0.0022 | 0.013±0.004 | 0.03±0.0079 | 0.063±0.016 | |
| 0.0085±0.0029 | 0.069±0.032 | 0.0074±0.0021 | 0.011±0.004 | 0.026±0.0071 | 0.058±0.015 | |
| 0.0078±0.0029 | 0.067±0.031 | 0.0070±0.0020 | 0.008±0.004 | 0.024±0.0064 | 0.044±0.013 | |
Disclaimer/Publisher’s Note: The statements, opinions and data contained in all publications are solely those of the individual author(s) and contributor(s) and not of MDPI and/or the editor(s). MDPI and/or the editor(s) disclaim responsibility for any injury to people or property resulting from any ideas, methods, instructions or products referred to in the content. |
© 2023 by the authors. Licensee MDPI, Basel, Switzerland. This article is an open access article distributed under the terms and conditions of the Creative Commons Attribution (CC BY) license (http://creativecommons.org/licenses/by/4.0/).


