Submitted:
27 April 2023
Posted:
27 April 2023
You are already at the latest version
Abstract
Keywords:
1. Introduction
2. Materials and Methods
2.1. Materials
2.2. Ligand selection for combined in silico / in vitro approach
2.3. Similarity assessment – Tanimoto scoring (TS) matrix
2.2. Dataset assembly for molecular docking (ChEMBL validation)
2.3. Data set preparation for molecular docking
2.4. Molecular docking workflow
2.4.1. Molecular docking – D1R
2.4.2. Molecular dynamics simulation (MDS) – D2R
2.4.3. Molecular docking D2R
2.4.4. Molecular docking D3R
2.5. DR subtypes – BLASTP alignment
2.6. Validation of the molecular docking approach – ChEMBL dataset(s)
2.7. Docking analysis – novel DR ligands
2.8. HTRF-based receptor binding studies
2.9. Characterization of DR carrier cells (D1R and D3R) – KD determination
2.10. In vitro screening – assessment of compound activity
2.10. Ligand selection for KI determination
2.12. KI Determination for selected ligands
2.13. Data processing, representation and analysis
3. Results
3.1. Structural summary of the investigated ligands
3.2. In vitro compound screening – an assessment of DR subtype selectivity
3.3. KI determination –of the selected compounds at DR subtypes
3.4. Dataset assembly – in silico assessment
3.5. Validation of molecular docking
3.6. In silico assessment of DR selectivity – interaction with the SBP
3.7. Retrospective analyis of the in silico / in vitro correlation
4. Discussion
Supplementary Materials
Author Contributions
Funding
Institutional Review Board Statement
Informed Consent Statement
Data Availability Statement
Conflicts of Interest
References
- Hauser, A.S.; et al., Trends in GPCR drug discovery: New agents, targets and indications. Nat Rev Drug Discov, 2017. 16(12): P. 829-842. [CrossRef]
- Hauser, A.S.; et al., Pharmacogenomics of GPCR Drug Targets. Cell, 2018. 172(1-2): P. 41-54 e19. [CrossRef]
- Martel, J.C. and S. Gatti McArthur, Dopamine Receptor Subtypes, Physiology and Pharmacology: New Ligands and Concepts in Schizophrenia. Front Pharmacol, 2020. 11: P. 1003. [CrossRef]
- Stocchi, F., M. Torti, and C. Fossati, Advances in dopamine receptor agonists for the treatment of Parkinson's disease. Expert Opin Pharmacother, 2016. 17(14): P. 1889-902. [CrossRef]
- Ashok, A.H.; et al., The dopamine hypothesis of bipolar affective disorder: The state of the art and implications for treatment. Mol Psychiatry, 2017. 22(5): P. 666-679. [CrossRef]
- Beaulieu, J.M. and R.R. Gainetdinov, The physiology, signaling, and pharmacology of dopamine receptors. Pharmacol Rev, 2011. 63(1): P. 182-217. [CrossRef]
- Kiss, B.; et al., Neuronal Dopamine D3 Receptors: Translational Implications for Preclinical Research and CNS Disorders. Biomolecules, 2021. 11(1). [CrossRef]
- Prieto, G.A., Abnormalities of Dopamine D(3) Receptor Signaling in the Diseased Brain. J Cent Nerv Syst Dis, 2017. 9: P. 1179573517726335. [CrossRef]
- Wang, Q.; et al., Subtype selectivity of dopamine receptor ligands: Insights from structure and ligand-based methods. J Chem Inf Model, 2010. 50(11): P. 1970-85. [CrossRef]
- Murer, M.G. and R. Moratalla, Striatal Signaling in L-DOPA-Induced Dyskinesia: Common Mechanisms with Drug Abuse and Long Term Memory Involving D1 Dopamine Receptor Stimulation. Front Neuroanat, 2011. 5: P. 51. [CrossRef]
- Berman, B.D., Neuroleptic malignant syndrome: A review for neurohospitalists. Neurohospitalist, 2011. 1(1): P. 41-7. [CrossRef]
- Sykes, D.A.; et al., Extrapyramidal side effects of antipsychotics are linked to their association kinetics at dopamine D(2) receptors. Nat Commun, 2017. 8(1): P. 763. [CrossRef]
- Lao, C.L.; et al., Intranasal and subcutaneous administration of dopamine D3 receptor agonists functionally restores nigrostriatal dopamine in MPTP-treated mice. Neurotox Res, 2013. 24(4): P. 523-31. [CrossRef]
- Li, C.; et al., Novel D3 dopamine receptor-preferring agonist D-264: Evidence of neuroprotective property in Parkinson's disease animal models induced by 1-methyl-4-phenyl-1,2,3,6-tetrahydropyridine and lactacystin. J Neurosci Res, 2010. 88(11): P. 2513-23. [CrossRef]
- Antonini, A.; et al., Role of pramipexole in the management of Parkinson's disease. CNS Drugs, 2010. 24(10): P. 829-41. [CrossRef]
- Carnicella, S.; et al., Implication of dopamine D3 receptor activation in the reversion of Parkinson's disease-related motivational deficits. Transl Psychiatry, 2014. 4(6): P. e401. [CrossRef]
- Millan, M.J.; et al., S33084, a novel, potent, selective, and competitive antagonist at dopamine D(3)-receptors: I. Receptorial, electrophysiological and neurochemical profile compared with GR218,231 and L741,626. J Pharmacol Exp Ther, 2000. 293(3): P. 1048-62.
- Meltzer, H.Y., Cognitive factors in schizophrenia: Causes, impact, and treatment. CNS Spectr, 2004. 9(10 Suppl 11): P. 15-24. [CrossRef]
- Jones-Tabah, J.; et al., The Signaling and Pharmacology of the Dopamine D1 Receptor. Front Cell Neurosci, 2021. 15: P. 806618. [CrossRef]
- Felsing, D.E., M.K. Jain, and J.A. Allen, Advances in Dopamine D1 Receptor Ligands for Neurotherapeutics. Curr Top Med Chem, 2019. 19(16): P. 1365-1380. [CrossRef]
- Girgis, R.R.; et al., A proof-of-concept, randomized controlled trial of DAR-0100A, a dopamine-1 receptor agonist, for cognitive enhancement in schizophrenia. J Psychopharmacol, 2016. 30(5): P. 428-35. [CrossRef]
- Rosell, D.R.; et al., Effects of the D1 dopamine receptor agonist dihydrexidine (DAR-0100A) on working memory in schizotypal personality disorder. Neuropsychopharmacology, 2015. 40(2): P. 446-53. [CrossRef]
- Abi-Dargham, A.; et al., Dopamine D1R Receptor Stimulation as a Mechanistic Pro-cognitive Target for Schizophrenia. Schizophrenia Bulletin, 2022. 48(1): P. 199-210. [CrossRef]
- O'Sullivan, G.J.; et al., Dopamine D1 vs D5 receptor-dependent induction of seizures in relation to DARPP-32, ERK1/2 and GluR1-AMPA signalling. Neuropharmacology, 2008. 54(7): P. 1051-61. [CrossRef]
- Arnsten, A.F.; et al., Novel Dopamine Therapeutics for Cognitive Deficits in Schizophrenia. Biol Psychiatry, 2017. 81(1): P. 67-77. [CrossRef]
- Kozak, R.; et al., Characterization of PF-6142, a Novel, Non-Catecholamine Dopamine Receptor D1 Agonist, in Murine and Nonhuman Primate Models of Dopaminergic Activation. Front Pharmacol, 2020. 11: P. 1005. [CrossRef]
- Basith, S.; et al., Exploring G Protein-Coupled Receptors (GPCRs) Ligand Space via Cheminformatics Approaches: Impact on Rational Drug Design. Front Pharmacol, 2018. 9: P. 128. [CrossRef]
- Salman, M.M.; et al., Advances in Applying Computer-Aided Drug Design for Neurodegenerative Diseases. Int J Mol Sci, 2021. 22(9). [CrossRef]
- Lian, P.; et al., A computational perspective on drug discovery and signal transduction mechanism of dopamine and serotonin receptors in the treatment of schizophrenia. Curr Pharm Biotechnol, 2014. 15(10): P. 916-26. [CrossRef]
- Nikolic, K.; et al., Drug Design for CNS Diseases: Polypharmacological Profiling of Compounds Using Cheminformatic, 3D-QSAR and Virtual Screening Methodologies. Front Neurosci, 2016. 10: P. 265. [CrossRef]
- Bueschbell, B.; et al., A Complete Assessment of Dopamine Receptor- Ligand Interactions through Computational Methods. Molecules, 2019. 24(7). [CrossRef]
- Floresca, C.Z. and J.A. Schetz, Dopamine receptor microdomains involved in molecular recognition and the regulation of drug affinity and function. J Recept Signal Transduct Res, 2004. 24(3): P. 207-39. [CrossRef]
- Vass, M.; et al., Aminergic GPCR-Ligand Interactions: A Chemical and Structural Map of Receptor Mutation Data. J Med Chem, 2019. 62(8): P. 3784-3839. [CrossRef]
- Zhuang, Y.; et al., Structural insights into the human D1 and D2 dopamine receptor signaling complexes. Cell, 2021. 184(4): P. 931-942 e18. [CrossRef]
- Newman, A.H.; et al., Molecular determinants of selectivity and efficacy at the dopamine D3 receptor. J Med Chem, 2012. 55(15): P. 6689-99. [CrossRef]
- Michino, M.; et al., A single glycine in extracellular loop 1 is the critical determinant for pharmacological specificity of dopamine D2 and D3 receptors. Mol Pharmacol, 2013. 84(6): P. 854-64. [CrossRef]
- Robinson, S.W., K.R. Jarvie, and M.G. Caron, High affinity agonist binding to the dopamine D3 receptor: Chimeric receptors delineate a role for intracellular domains. Mol Pharmacol, 1994. 46(2): P. 352-6.
- Ishiki, H.M.; et al., Computer-aided Drug Design Applied to Parkinson Targets. Curr Neuropharmacol, 2018. 16(6): P. 865-880. [CrossRef]
- Elek, M.; et al., Synthesis, in silico, and in vitro studies of novel dopamine D(2) and D(3) receptor ligands. Arch Pharm (Weinheim), 2021. 354(6): P. e2000486. [CrossRef]
- Degorce, F.; et al., HTRF: A technology tailored for drug discovery - a review of theoretical aspects and recent applications. Curr Chem Genomics, 2009. 3: P. 22-32. [CrossRef]
- Yasi, E.A., N.S. Kruyer, and P. Peralta-Yahya, Advances in G protein-coupled receptor high-throughput screening. Curr Opin Biotechnol, 2020. 64: P. 210-217. [CrossRef]
- Zell, L.; et al., Identification of Novel Dopamine D(2) Receptor Ligands-A Combined In Silico/In Vitro Approach. Molecules, 2022. 27(14). [CrossRef]
- Glen, R.C.; et al., Circular fingerprints: Flexible molecular descriptors with applications from physical chemistry to ADME (vol 9, pg 199, 2006). Idrugs, 2006. 9(4): P. 311-311.
- Rogers, D. and M. Hahn, Extended-connectivity fingerprints. J Chem Inf Model, 2010. 50(5): P. 742-54. [CrossRef]
- Tanimoto, T.T., An Elementary Mathematical Theory of Classification and Prediction. 1958: International Business Machines Corporation.
- el Ahmad, Y.; et al., New benzocycloalkylpiperazines, potent and selective 5-HT1A receptor ligands. J Med Chem, 1997. 40(6): P. 952-60. [CrossRef]
- Hubner, H., J. Kraxner, and P. Gmeiner, Cyanoindole derivatives as highly selective dopamine D(4) receptor partial agonists: Solid-phase synthesis, binding assays, and functional experiments. J Med Chem, 2000. 43(23): P. 4563-9. [CrossRef]
- Einsiedel, J., H. Hubner, and P. Gmeiner, Benzamide bioisosteres incorporating dihydroheteroazole substructures: EPC synthesis and SAR leading to a selective dopamine D4 receptor partial agonist (FAUC 179). Bioorg Med Chem Lett, 2001. 11(18): P. 2533-6. [CrossRef]
- Lober, S.; et al., Di- and trisubstituted pyrazolo[1,5-a]pyridine derivatives: Synthesis, dopamine receptor binding and ligand efficacy. Bioorg Med Chem Lett, 2002. 12(4): P. 633-6. [CrossRef]
- Wittig, T.W., M. Decker, and J. Lehmann, Dopamine/serotonin receptor ligands. 9. Oxygen-containing midsized heterocyclic ring systems and nonrigidized analogues. A step toward dopamine D5 receptor selectivity. J Med Chem, 2004. 47(17): P. 4155-8. [CrossRef]
- Seong, C.M.; et al., Discovery of 3-aryl-3-methyl-1H-quinoline-2,4-diones as a new class of selective 5-HT6 receptor antagonists. Bioorg Med Chem Lett, 2008. 18(2): P. 738-43. [CrossRef]
- Enzensperger, C.; et al., Dopamine/serotonin receptor ligands. 16.(1) Expanding dibenz[d,g]azecines to 11- and 12-membered homologues. Interaction with dopamine D(1)-D(5) receptors. J Med Chem, 2007. 50(18): P. 4528-33. [CrossRef]
- Linz, S.; et al., Design, synthesis and dopamine D4 receptor binding activities of new N-heteroaromatic 5/6-ring Mannich bases. Bioorg Med Chem, 2009. 17(13): P. 4448-58. [CrossRef]
- Banister, S.D.; et al., Molecular hybridization of 4-azahexacyclo[5.4.1.0(2,6).0(3,10).0(5,9).0(8,11)]dodecane-3-ol with sigma (sigma) receptor ligands modulates off-target activity and subtype selectivity. Bioorg Med Chem Lett, 2011. 21(12): P. 3622-6. [CrossRef]
- Robaa, D.; et al., Chiral indolo[3,2-f][3]benzazecine-type dopamine receptor antagonists: Synthesis and activity of racemic and enantiopure derivatives. J Med Chem, 2011. 54(20): P. 7422-6. [CrossRef]
- Sampson, D.; et al., Identification of a new selective dopamine D4 receptor ligand. Bioorg Med Chem, 2014. 22(12): P. 3105-14. [CrossRef]
- Zhang, J.; et al., Structural manipulation on the catecholic fragment of dopamine D(1) receptor agonist 1-phenyl-N-methyl-benzazepines. Eur J Med Chem, 2014. 85: P. 16-26. [CrossRef]
- Madapa, S. and W.W. Harding, Semisynthetic Studies on and Biological Evaluation of N-Methyllaurotetanine Analogues as Ligands for 5-HT Receptors. J Nat Prod, 2015. 78(4): P. 722-9. [CrossRef]
- Lee, D.Y.W.; et al., Asymmetric total synthesis of tetrahydroprotoberberine derivatives and evaluation of their binding affinities at dopamine receptors. Bioorg Med Chem Lett, 2017. 27(6): P. 1437-1440. [CrossRef]
- Martini, M.L.; et al., Defining Structure-Functional Selectivity Relationships (SFSR) for a Class of Non-Catechol Dopamine D(1) Receptor Agonists. J Med Chem, 2019. 62(7): P. 3753-3772. [CrossRef]
- Heier, R.F.; et al., Synthesis and biological activities of (R)-5,6-dihydro-N,N-dimethyl-4H-imidazo[4,5,1-ij]quinolin-5-amine and its metabolites. J Med Chem, 1997. 40(5): P. 639-46.
- Thomas, C., H. Hubner, and P. Gmeiner, Enantio- and diastereocontrolled dopamine D1, D2, D3 and D4 receptor binding of N-(3-pyrrolidinylmethyl)benzamides synthesized from aspartic acid. Bioorg Med Chem Lett, 1999. 9(6): P. 841-6. [CrossRef]
- Einsiedel, J.; et al., Phenyloxazoles and phenylthiazoles as benzamide bioisosteres: Synthesis and dopamine receptor binding profiles. Bioorg Med Chem Lett, 2000. 10(17): P. 2041-4. [CrossRef]
- Lehmann, T., H. Hubner, and P. Gmeiner, Dopaminergic 7-aminotetrahydroindolizines: Ex-chiral pool synthesis and preferential D3 receptor binding. Bioorg Med Chem Lett, 2001. 11(21): P. 2863-6. [CrossRef]
- Einsiedel, J.; et al., Stereocontrolled dopamine receptor binding and subtype selectivity of clebopride analogues synthesized from aspartic acid. Bioorg Med Chem Lett, 2003. 13(19): P. 3293-6. [CrossRef]
- Enguehard-Gueiffier, C.; et al., 2-[(4-phenylpiperazin-1-yl)methyl]imidazo(di)azines as selective D4-ligands. Induction of penile erection by 2-[4-(2-methoxyphenyl)piperazin-1-ylmethyl]imidazo[1,2-a]pyridine (PIP3EA), a potent and selective D4 partial agonist. J Med Chem, 2006. 49(13): P. 3938-47. [CrossRef]
- Tietze, R.; et al., Discovery of a dopamine D4 selective PET ligand candidate taking advantage of a click chemistry based REM linker. Bioorg Med Chem Lett, 2008. 18(3): P. 983-8. [CrossRef]
- Balle, T.; et al., Synthesis and structure-affinity relationship investigations of 5-heteroaryl-substituted analogues of the antipsychotic sertindole. A new class of highly selective alpha(1) adrenoceptor antagonists. J Med Chem, 2003. 46(2): P. 265-83. [CrossRef]
- Sromek, A.W.; et al., Synthesis and Evaluation of Fluorinated Aporphines: Potential Positron Emission Tomography Ligands for D2 Receptors. ACS Med Chem Lett, 2011. 2(3): P. 189-194. [CrossRef]
- Banerjee, A.; et al., Click chemistry based synthesis of dopamine D4 selective receptor ligands for the selection of potential PET tracers. Bioorg Med Chem Lett, 2013. 23(22): P. 6079-82. [CrossRef]
- Salama, I.; et al., Synthesis and binding profile of haloperidol-based bivalent ligands targeting dopamine D(2)-like receptors. Bioorg Med Chem Lett, 2014. 24(16): P. 3753-6. [CrossRef]
- Lindsley, C.W. and C.R. Hopkins, Return of D(4) Dopamine Receptor Antagonists in Drug Discovery. J Med Chem, 2017. 60(17): P. 7233-7243. [CrossRef]
- Glase, S.A.; et al., Aryl 1-but-3-ynyl-4-phenyl-1,2,3,6-tetrahydropyridines as potential antipsychotic agents: Synthesis and structure-activity relationships. J Med Chem, 1996. 39(16): P. 3179-87. [CrossRef]
- Yuan, J.; et al., NGB 2904 and NGB 2849: Two highly selective dopamine D3 receptor antagonists. Bioorg Med Chem Lett, 1998. 8(19): P. 2715-8. [CrossRef]
- Birch, A.M.; et al., N-Substituted (2,3-dihydro-1,4-benzodioxin-2-yl)methylamine derivatives as D(2) antagonists/5-HT(1A) partial agonists with potential as atypical antipsychotic agents. J Med Chem, 1999. 42(17): P. 3342-55. [CrossRef]
- Paul, N.M.; et al., Structure-activity relationships for a novel series of dopamine D2-like receptor ligands based on N-substituted 3-aryl-8-azabicyclo[3.2.1]octan-3-ol. J Med Chem, 2008. 51(19): P. 6095-109. [CrossRef]
- Kumar, J.S.; et al., Synthesis and in vivo validation of [O-methyl-11C]2-4-[4-(7-methoxynaphthalen-1-yl)piperazin- 1-yl]butyl-4-methyl-2H-[1,2,4]triazine-3,5-dione: A novel 5-HT1A receptor agonist positron emission tomography ligand. J Med Chem, 2006. 49(1): P. 125-34. [CrossRef]
- Schlotter, K.; et al., Fancy bioisosteres: Novel paracyclophane derivatives as super-affinity dopamine D3 receptor antagonists. J Med Chem, 2006. 49(12): P. 3628-35. [CrossRef]
- Newman, A.H.; et al., N-(4-(4-(2,3-dichloro- or 2-methoxyphenyl)piperazin-1-yl)butyl)heterobiarylcarboxamides with functionalized linking chains as high affinity and enantioselective D3 receptor antagonists. J Med Chem, 2009. 52(8): P. 2559-70. [CrossRef]
- Ortega, R.; et al., Synthesis, binding affinity and SAR of new benzolactam derivatives as dopamine D3 receptor ligands. Bioorg Med Chem Lett, 2009. 19(6): P. 1773-8. [CrossRef]
- Skultety, M.; et al., Bioisosteric replacement leading to biologically active [2.2]paracyclophanes with altered binding profiles for aminergic G-protein-coupled receptors. J Med Chem, 2010. 53(19): P. 7219-28. [CrossRef]
- Hofling, S.B.; et al., Synthesis, biological evaluation and radiolabelling by 18F-fluoroarylation of a dopamine D3-selective ligand as prospective imaging probe for PET. Bioorg Med Chem Lett, 2010. 20(23): P. 6933-7. [CrossRef]
- Ye, N.; et al., Further SAR study on 11-O-substituted aporphine analogues: Identification of highly potent dopamine D3 receptor ligands. Bioorg Med Chem, 2011. 19(6): P. 1999-2008. [CrossRef]
- Reinart-Okugbeni, R.; et al., Chemoenzymatic synthesis and evaluation of 3-azabicyclo[3.2.0]heptane derivatives as dopaminergic ligands. Eur J Med Chem, 2012. 55: P. 255-61. [CrossRef]
- Spetea, M.; et al., Discovery and pharmacological evaluation of a diphenethylamine derivative (HS665), a highly potent and selective kappa opioid receptor agonist. J Med Chem, 2012. 55(22): P. 10302-6. [CrossRef]
- Majo, V.J.; et al., Synthesis and in vivo evaluation of [(18)F]2-(4-(4-(2-(2-fluoroethoxy)phenyl)piperazin-1-yl)butyl)-4-methyl-1,2,4-triazine-3,5(2H,4H)-dione ([(18)F]FECUMI-101) as an imaging probe for 5-HT1A receptor agonist in nonhuman primates. Bioorg Med Chem, 2013. 21(17): P. 5598-604. [CrossRef]
- Abdelfattah, M.A., J. Lehmann, and A.H. Abadi, Discovery of highly potent and selective D4 ligands by interactive SAR study. Bioorg Med Chem Lett, 2013. 23(18): P. 5077-81. [CrossRef]
- Insua, I.; et al., Synthesis and binding affinity of new 1,4-disubstituted triazoles as potential dopamine D(3) receptor ligands. Bioorg Med Chem Lett, 2013. 23(20): P. 5586-91. [CrossRef]
- van Wieringen, J.P.; et al., Synthesis and characterization of a novel series of agonist compounds as potential radiopharmaceuticals for imaging dopamine D(2)/(3) receptors in their high-affinity state. J Med Chem, 2014. 57(2): P. 391-410. [CrossRef]
- Moller, D.; et al., Functionally selective dopamine D(2), D(3) receptor partial agonists. J Med Chem, 2014. 57(11): P. 4861-75. [CrossRef]
- Sampson, D.; et al., Further evaluation of the tropane analogs of haloperidol. Bioorg Med Chem Lett, 2014. 24(17): P. 4294-7. [CrossRef]
- Weichert, D.; et al., Molecular determinants of biased agonism at the dopamine D(2) receptor. J Med Chem, 2015. 58(6): P. 2703-17. [CrossRef]
- Jorg, M.; et al., Investigation of novel ropinirole analogues: Synthesis, pharmacological evaluation and computational analysis of dopamine D-2 receptor functionalized congeners and homobivalent ligands. Medchemcomm, 2014. 5(7): P. 891-898. [CrossRef]
- Bartuschat, A.L.; et al., Fluoro-substituted phenylazocarboxamides: Dopaminergic behavior and N-arylating properties for irreversible binding. Bioorg Med Chem, 2015. 23(14): P. 3938-47. [CrossRef]
- Moller, D.; et al., 1,4-Disubstituted aromatic piperazines with high 5-HT2A/D2 selectivity: Quantitative structure-selectivity investigations, docking, synthesis and biological evaluation. Bioorg Med Chem, 2015. 23(18): P. 6195-209. [CrossRef]
- Weichert, D.; et al., Structure-guided development of dual beta2 adrenergic/dopamine D2 receptor agonists. Bioorg Med Chem, 2016. 24(12): P. 2641-53. [CrossRef]
- Moller, D.; et al., Discovery of G Protein-Biased Dopaminergics with a Pyrazolo[1,5-a]pyridine Substructure. J Med Chem, 2017. 60(7): P. 2908-2929. [CrossRef]
- Mannel, B.; et al., Hydroxy-Substituted Heteroarylpiperazines: Novel Scaffolds for beta-Arrestin-Biased D(2)R Agonists. J Med Chem, 2017. 60(11): P. 4693-4713. [CrossRef]
- Mannel, B.; et al., beta-Arrestin biased dopamine D2 receptor partial agonists: Synthesis and pharmacological evaluation. Bioorg Med Chem, 2017. 25(20): P. 5613-5628. [CrossRef]
- Stossel, A.; et al., Development of molecular tools based on the dopamine D(3) receptor ligand FAUC 329 showing inhibiting effects on drug and food maintained behavior. Bioorg Med Chem, 2017. 25(13): P. 3491-3499. [CrossRef]
- Omran, A.; et al., Synthesis of 3-(3-hydroxyphenyl)pyrrolidine dopamine D(3) receptor ligands with extended functionality for probing the secondary binding pocket. Bioorg Med Chem Lett, 2018. 28(10): P. 1897-1902. [CrossRef]
- Ashraf-Uz-Zaman, M.; et al., Analogs of penfluridol as chemotherapeutic agents with reduced central nervous system activity. Bioorg Med Chem Lett, 2018. 28(23-24): P. 3652-3657. [CrossRef]
- Chen, P.J.; et al., Design, synthesis, and evaluation of N-(4-(4-phenyl piperazin-1-yl)butyl)-4-(thiophen-3-yl)benzamides as selective dopamine D(3) receptor ligands. Bioorg Med Chem Lett, 2019. 29(18): P. 2690-2694. [CrossRef]
- Tan, L.; et al., Design and Synthesis of Bitopic 2-Phenylcyclopropylmethylamine (PCPMA) Derivatives as Selective Dopamine D3 Receptor Ligands. J Med Chem, 2020. 63(9): P. 4579-4602. [CrossRef]
- Moritz, A.E.; et al., Discovery, Optimization, and Characterization of ML417: A Novel and Highly Selective D(3) Dopamine Receptor Agonist. J Med Chem, 2020. 63(10): P. 5526-5567. [CrossRef]
- Battiti, F.O., A.H. Newman, and A. Bonifazi, Exception That Proves the Rule: Investigation of Privileged Stereochemistry in Designing Dopamine D(3)R Bitopic Agonists. ACS Med Chem Lett, 2020. 11(10): P. 1956-1964. [CrossRef]
- Bergauer, M., H. Hubner, and P. Gmeiner, 2,4-Disubstituted pyrroles: Synthesis, traceless linking and pharmacological investigations leading to the dopamine D4 receptor partial agonist FAUC 356. Bioorg Med Chem Lett, 2002. 12(15): P. 1937-40. [CrossRef]
- Bettinetti, L.; et al., Interactive SAR studies: Rational discovery of super-potent and highly selective dopamine D3 receptor antagonists and partial agonists. J Med Chem, 2002. 45(21): P. 4594-7. [CrossRef]
- Hocke, C.; et al., Synthesis and radioiodination of selective ligands for the dopamine D3 receptor subtype. Bioorg Med Chem Lett, 2004. 14(15): P. 3963-6. [CrossRef]
- Rodriguez Loaiza, P.; et al., Click chemistry based solid phase supported synthesis of dopaminergic phenylacetylenes. Bioorg Med Chem, 2007. 15(23): P. 7248-57. [CrossRef]
- Butini, S.; et al., Discovery of a new class of potential multifunctional atypical antipsychotic agents targeting dopamine D3 and serotonin 5-HT1A and 5-HT2A receptors: Design, synthesis, and effects on behavior. J Med Chem, 2009. 52(1): P. 151-69. [CrossRef]
- Dorfler, M.; et al., Novel D3 selective dopaminergics incorporating enyne units as nonaromatic catechol bioisosteres: Synthesis, bioactivity, and mutagenesis studies. J Med Chem, 2008. 51(21): P. 6829-38. [CrossRef]
- von Coburg, Y.; et al., Potential utility of histamine H3 receptor antagonist pharmacophore in antipsychotics. Bioorg Med Chem Lett, 2009. 19(2): P. 538-42. [CrossRef]
- Tschammer, N.; et al., Highly potent 5-aminotetrahydropyrazolopyridines: Enantioselective dopamine D3 receptor binding, functional selectivity, and analysis of receptor-ligand interactions. J Med Chem, 2011. 54(7): P. 2477-91.
- Berry, C.B.; et al., Discovery and Characterization of ML398, a Potent and Selective Antagonist of the D4 Receptor with in Vivo Activity. ACS Med Chem Lett, 2014. 5(9): P. 1060-4. [CrossRef]
- Ponnala, S., N. Kapadia, and W.W. Harding, Identification of tris-(phenylalkyl) amines as new selective h5-HT2B receptor antagonists (vol 6, pg 601, 2015). Medchemcomm, 2015. 6(4): P. 732-732. [CrossRef]
- Gadhiya, S.; et al., New Dopamine D3-Selective Receptor Ligands Containing a 6-Methoxy-1,2,3,4-tetrahydroisoquinolin-7-ol Motif. ACS Med Chem Lett, 2018. 9(10): P. 990-995. [CrossRef]
- Karki, A.; et al., Structural manipulation of aporphines via C10 nitrogenation leads to the identification of new 5-HT(7A)R ligands. Bioorg Med Chem, 2020. 28(15): P. 115578. [CrossRef]
- Hawkins, P.C.; et al., Conformer generation with OMEGA: Algorithm and validation using high quality structures from the Protein Databank and Cambridge Structural Database. J Chem Inf Model, 2010. 50(4): P. 572-84. [CrossRef]
- Jones, G.; et al., Development and validation of a genetic algorithm for flexible docking. J Mol Biol, 1997. 267(3): P. 727-48. [CrossRef]
- Xu, P.; et al., Structures of the human dopamine D3 receptor-G(i) complexes. Mol Cell, 2021. 81(6): P. 1147-1159 e4. [CrossRef]
- Altschul, S.F.; et al., Basic local alignment search tool. J Mol Biol, 1990. 215(3): P. 403-10. [CrossRef]
- BIOVIA, Dassault Systèmes, BIOVIA Discovery Studio, Release 2018. 2018, San Diego: Dassault Systems.
- Wolber, G. and T. Langer, LigandScout: 3-D pharmacophores derived from protein-bound ligands and their use as virtual screening filters. J Chem Inf Model, 2005. 45(1): P. 160-9. [CrossRef]
- Joober, R. and P. Boksa, Clozapine: A distinct, poorly understood and under-used molecule. J Psychiatry Neurosci, 2010. 35(3): P. 147-9. [CrossRef]
- Perrone, R.; et al., A structure-affinity relationship study on derivatives of N-[2-[4-(4-Chlorophenyl)piperazin-1-yl]ethyl]-3-methoxybenzamide, a high-affinity and selective D(4) receptor ligand. J Med Chem, 2000. 43(2): P. 270-7. [CrossRef]
- Smith, J.L.; et al., Inhibition of dengue virus replication by a class of small-molecule compounds that antagonize dopamine receptor d4 and downstream mitogen-activated protein kinase signaling. J Virol, 2014. 88(10): P. 5533-42. [CrossRef]
- Campiani, G.; et al., New antipsychotic agents with serotonin and dopamine antagonist properties based on a pyrrolo[2,1-b][1,3]benzothiazepine structure. J Med Chem, 1998. 41(20): P. 3763-72. [CrossRef]
- Staron, J.; et al., Virtual screening-driven discovery of dual 5-HT(6)/5-HT(2A) receptor ligands with pro-cognitive properties. Eur J Med Chem, 2020. 185: P. 111857. [CrossRef]
- Peprah, K.; et al., Multi-receptor drug design: Haloperidol as a scaffold for the design and synthesis of atypical antipsychotic agents. Bioorg Med Chem, 2012. 20(3): P. 1291-7. [CrossRef]
- Schoemaker, H.; et al., Neurochemical characteristics of amisulpride, an atypical dopamine D2/D3 receptor antagonist with both presynaptic and limbic selectivity. J Pharmacol Exp Ther, 1997. 280(1): P. 83-97.
- Daina, A., O. Michielin, and V. Zoete, SwissTargetPrediction: Updated data and new features for efficient prediction of protein targets of small molecules. Nucleic Acids Res, 2019. 47(W1): P. W357-W364. [CrossRef]
- Bragina, M.E.; et al., The SwissSimilarity 2021 Web Tool: Novel Chemical Libraries and Additional Methods for an Enhanced Ligand-Based Virtual Screening Experience. Int J Mol Sci, 2022. 23(2). [CrossRef]
- Zoete, V.; et al., SwissSimilarity: A Web Tool for Low to Ultra High Throughput Ligand-Based Virtual Screening. J Chem Inf Model, 2016. 56(8): P. 1399-404. [CrossRef]
- Charifson, P.S.; et al., Conformational analysis and molecular modeling of 1-phenyl-, 4-phenyl-, and 1-benzyl-1,2,3,4-tetrahydroisoquinolines as D1 dopamine receptor ligands. J Med Chem, 1989. 32(9): P. 2050-8. [CrossRef]
- Pettersson, F.; et al., Synthesis and evaluation of a set of 4-phenylpiperidines and 4-phenylpiperazines as D2 receptor ligands and the discovery of the dopaminergic stabilizer 4-[3-(methylsulfonyl)phenyl]-1-propylpiperidine (huntexil, pridopidine, ACR16). J Med Chem, 2010. 53(6): P. 2510-20. [CrossRef]
- Zheng, Z.; et al., Structure-Based Discovery of New Antagonist and Biased Agonist Chemotypes for the Kappa Opioid Receptor. J Med Chem, 2017. 60(7): P. 3070-3081. [CrossRef]
- Nievergelt, A.; et al., Identification of serotonin 5-HT1A receptor partial agonists in ginger. Bioorg Med Chem, 2010. 18(9): P. 3345-51. [CrossRef]
- Maramai, S.; et al., Dopamine D3 Receptor Antagonists as Potential Therapeutics for the Treatment of Neurological Diseases. Front Neurosci, 2016. 10: P. 451. [CrossRef]
- Fan, L.; et al., Haloperidol bound D(2) dopamine receptor structure inspired the discovery of subtype selective ligands. Nat Commun, 2020. 11(1): P. 1074. [CrossRef]
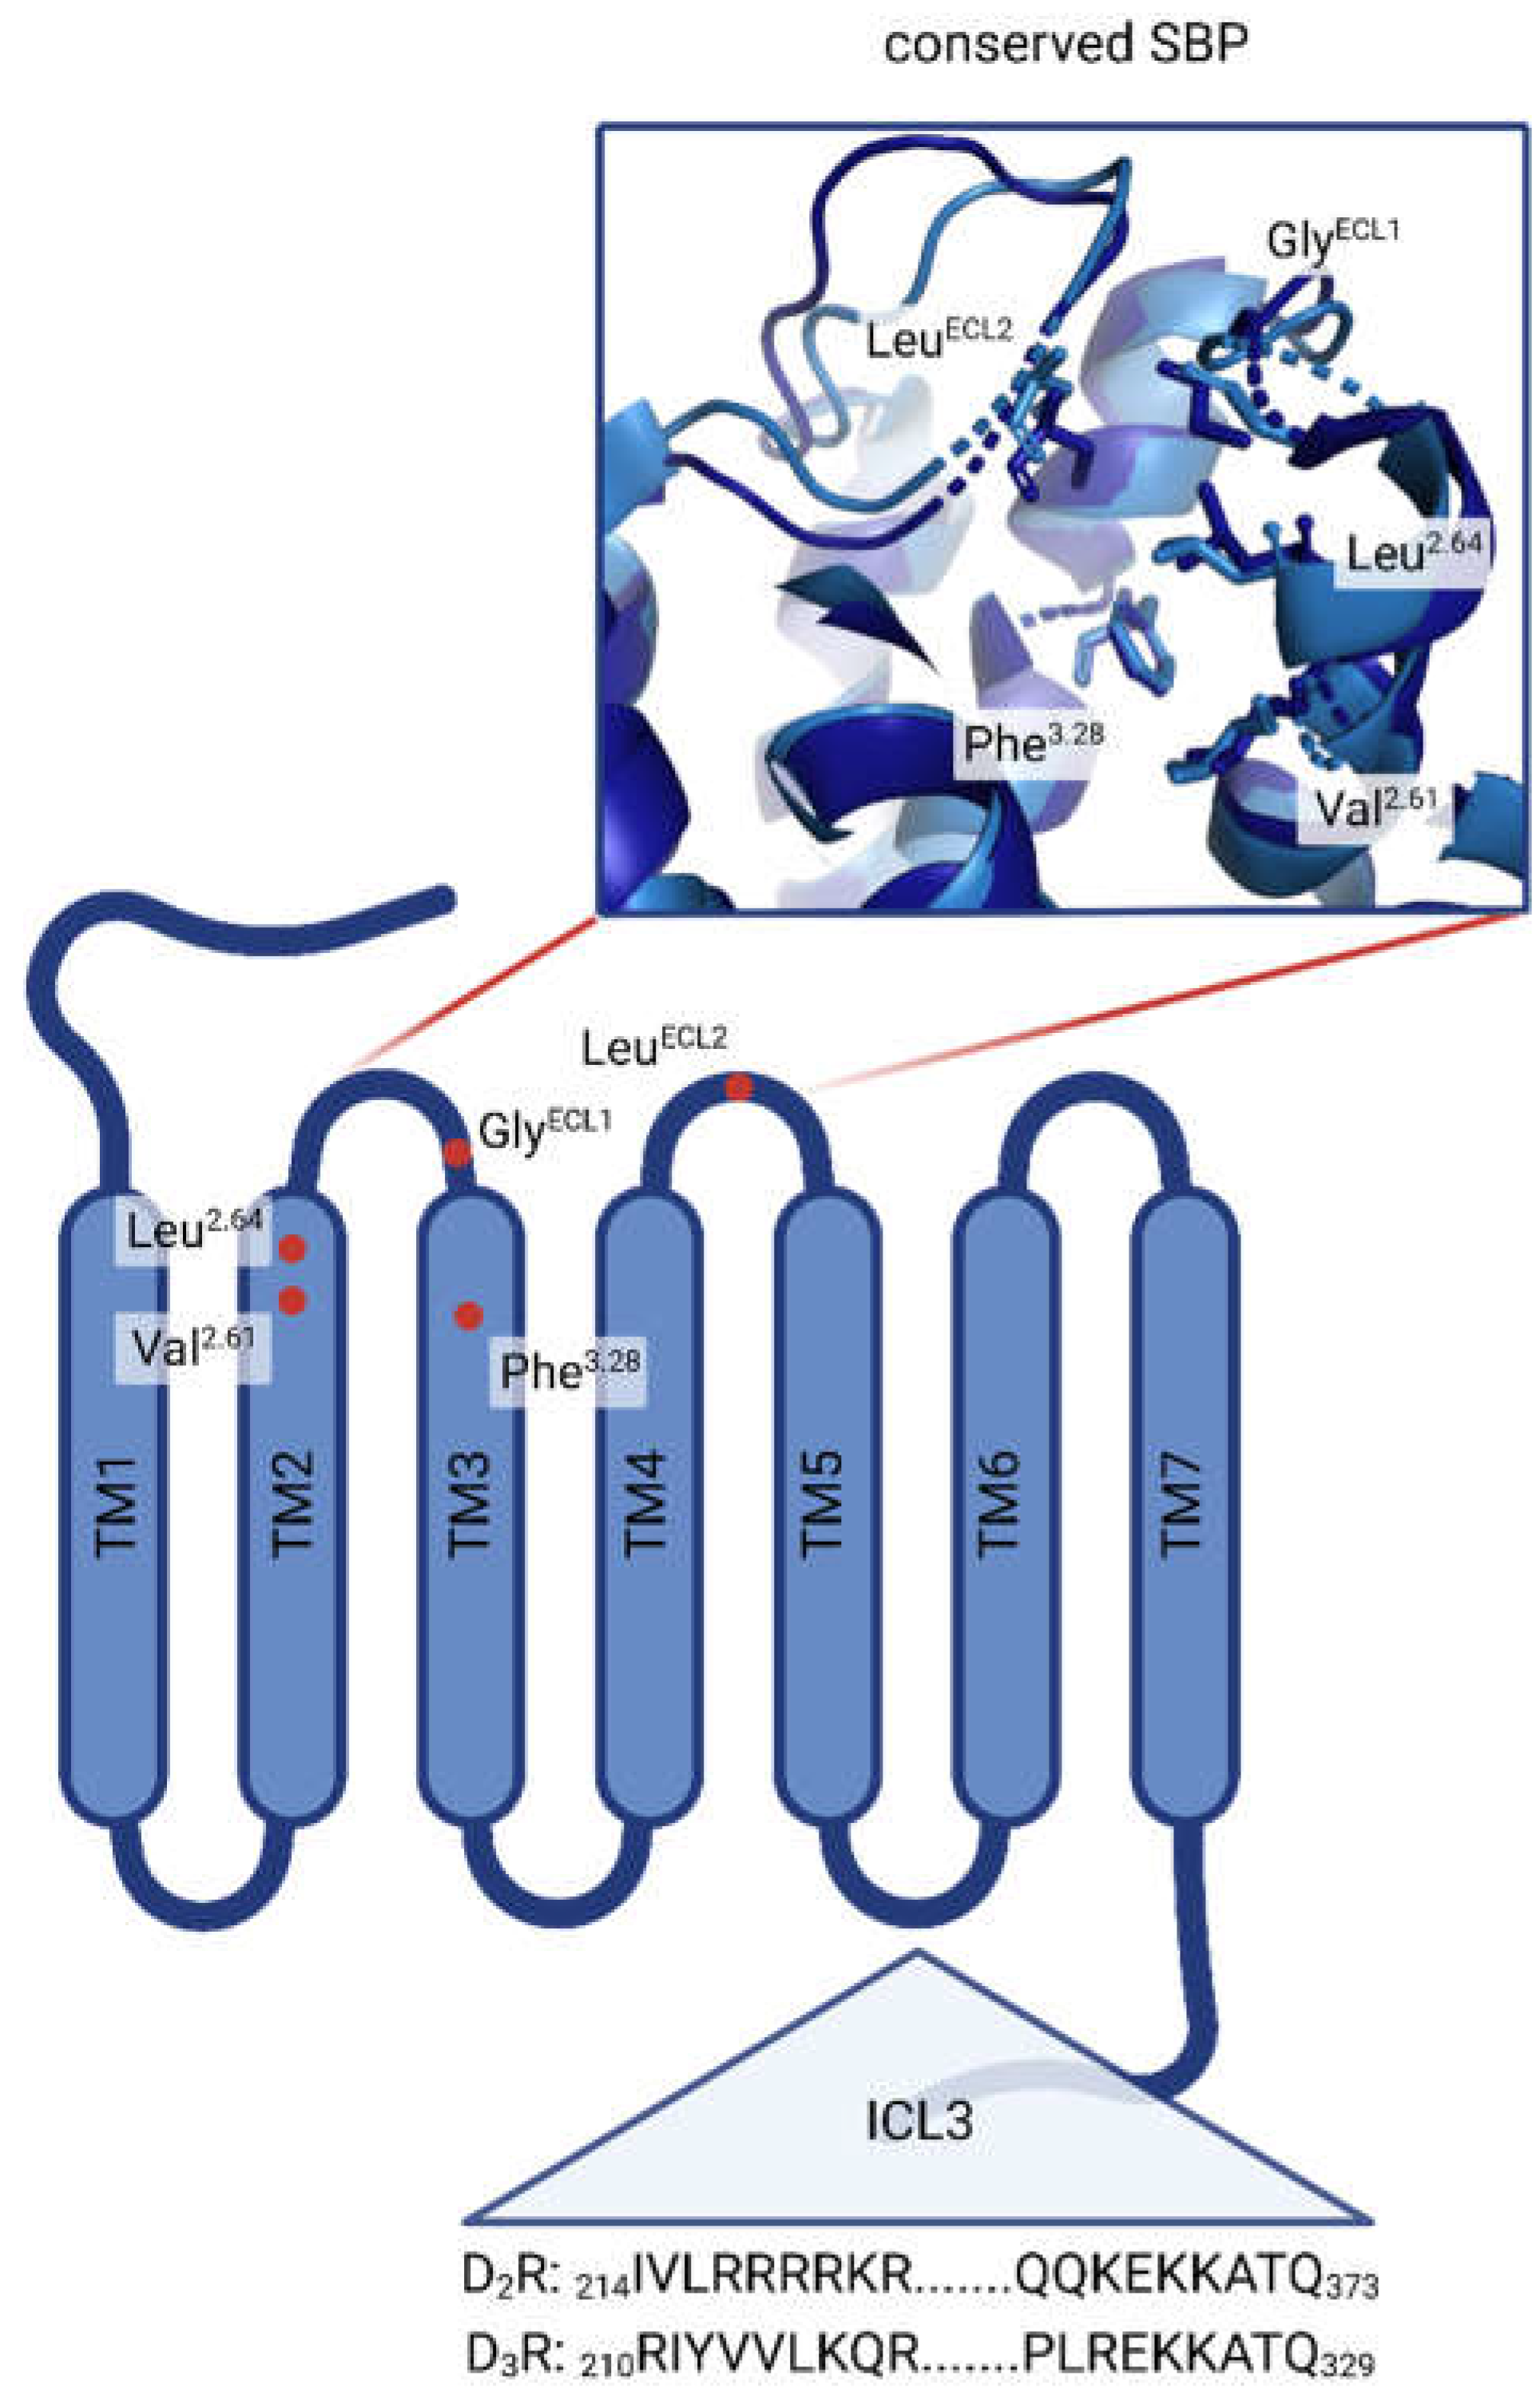
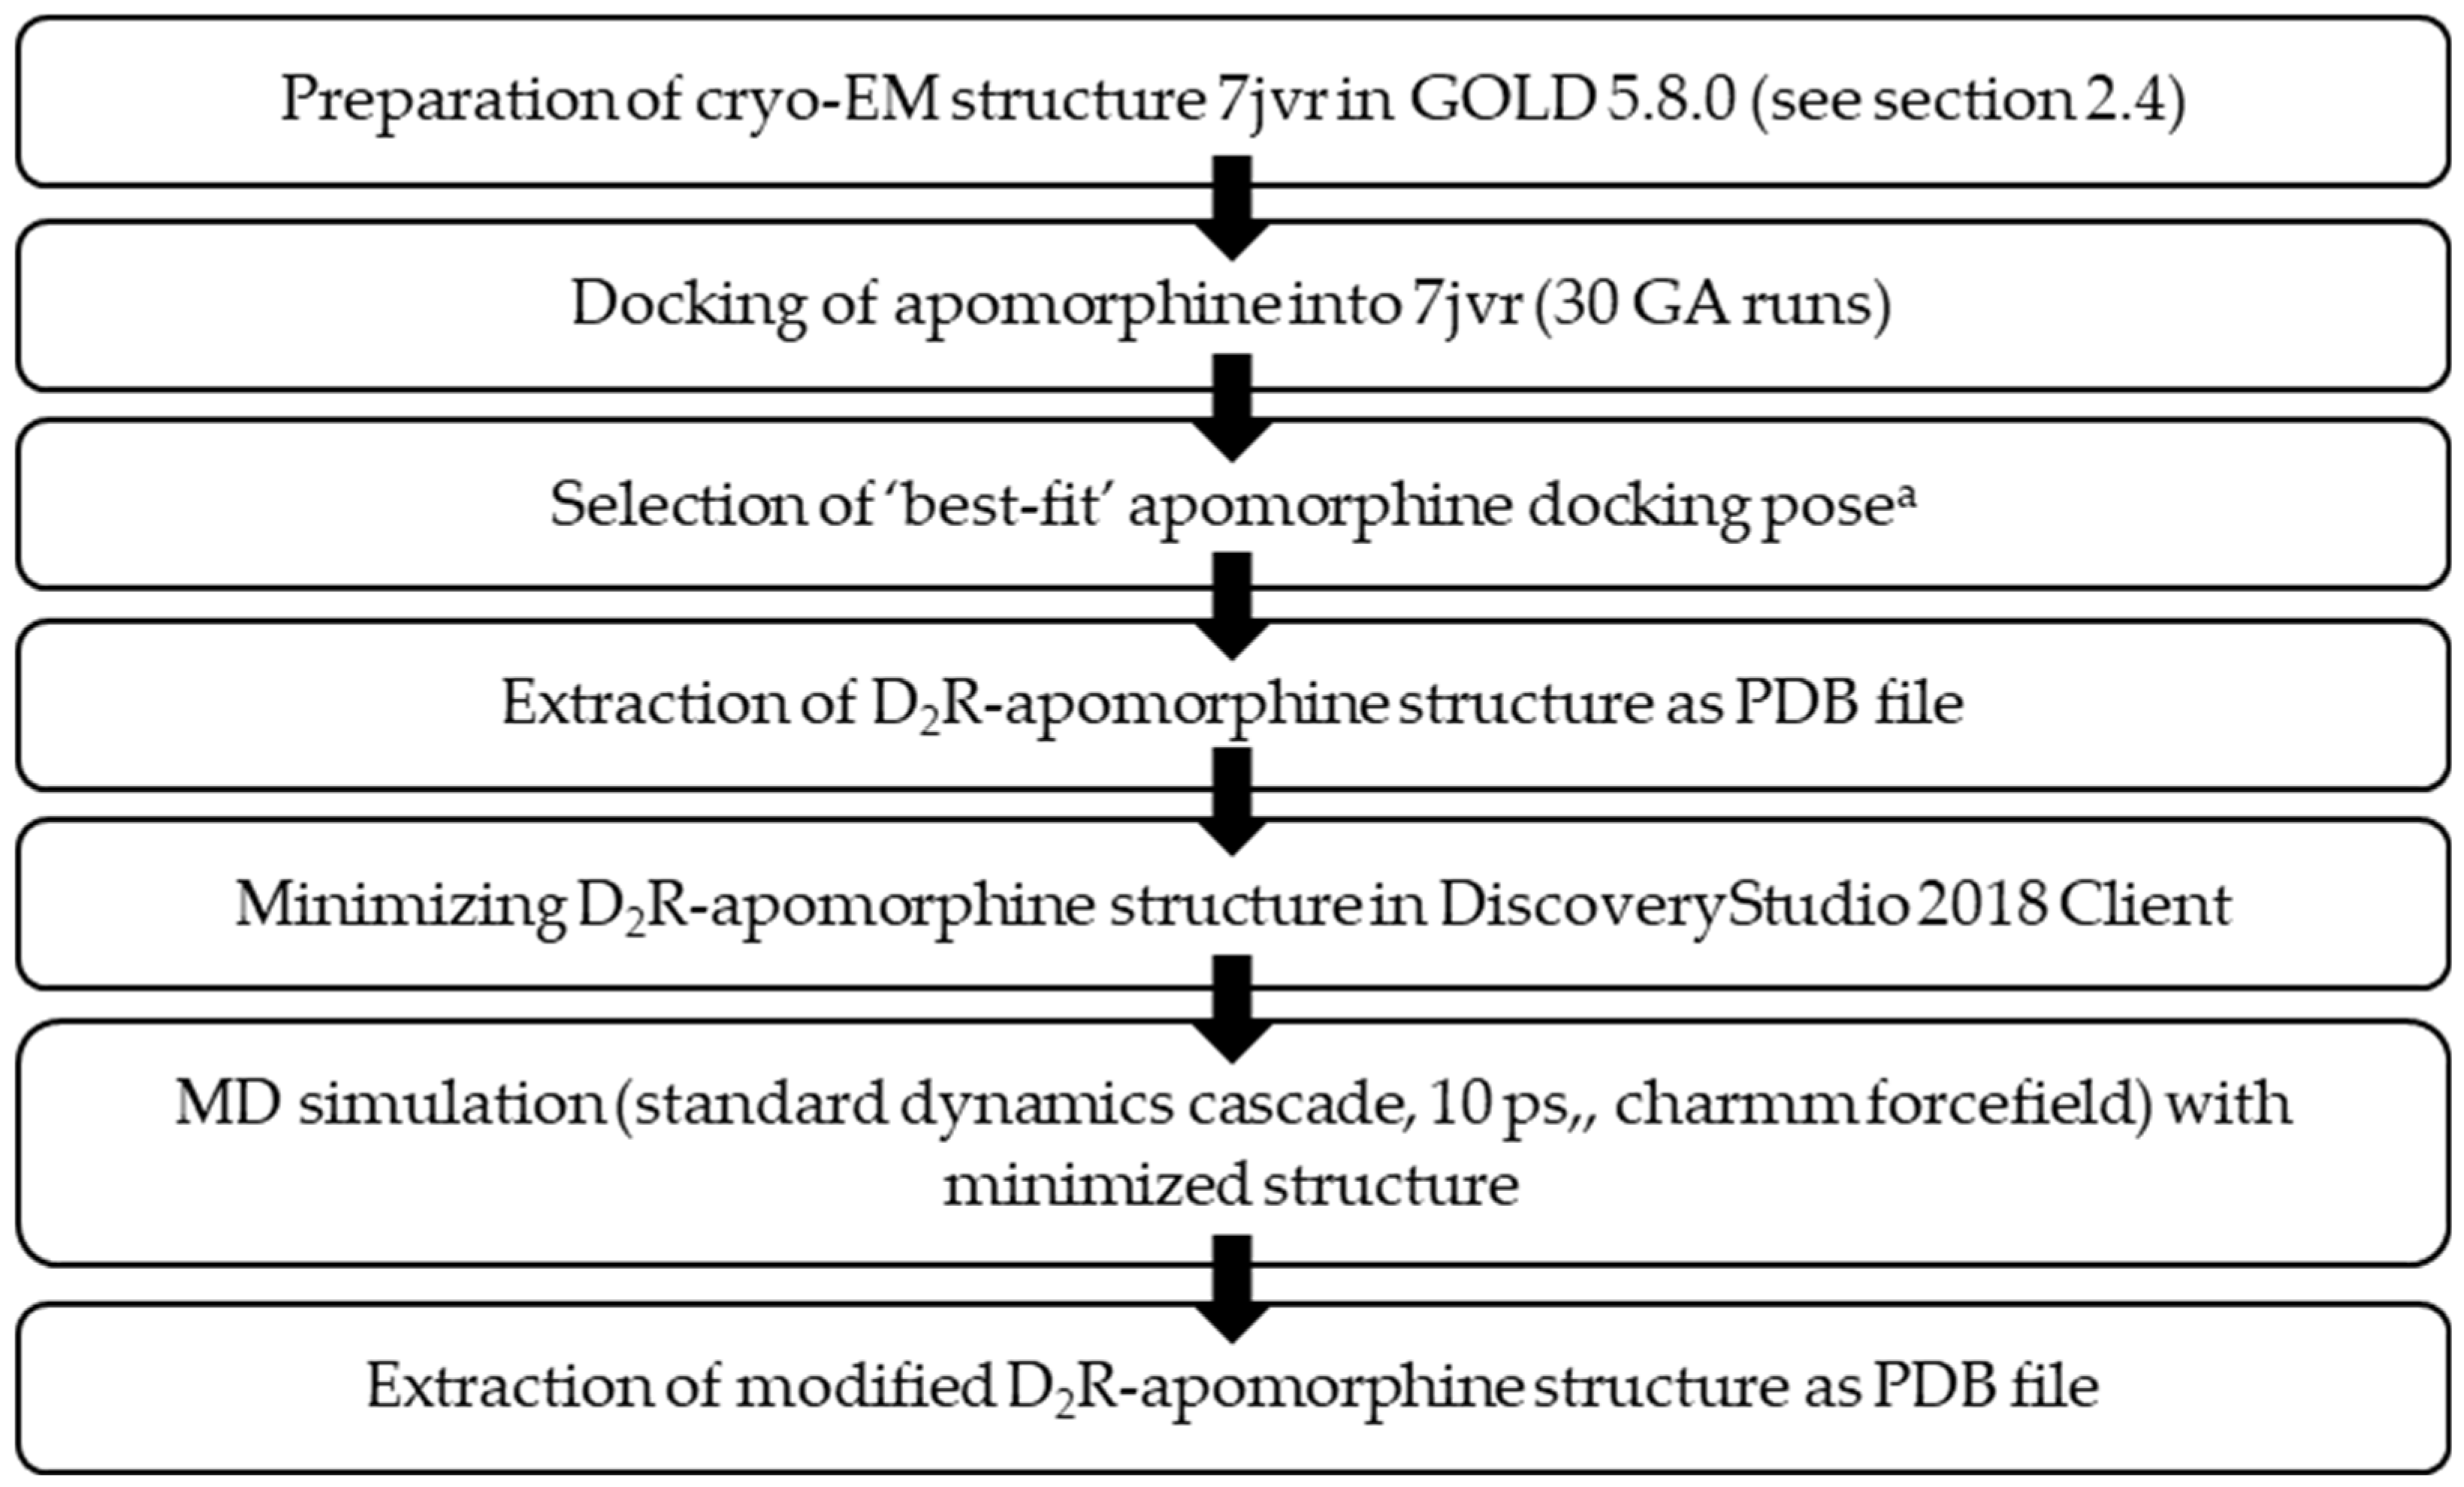
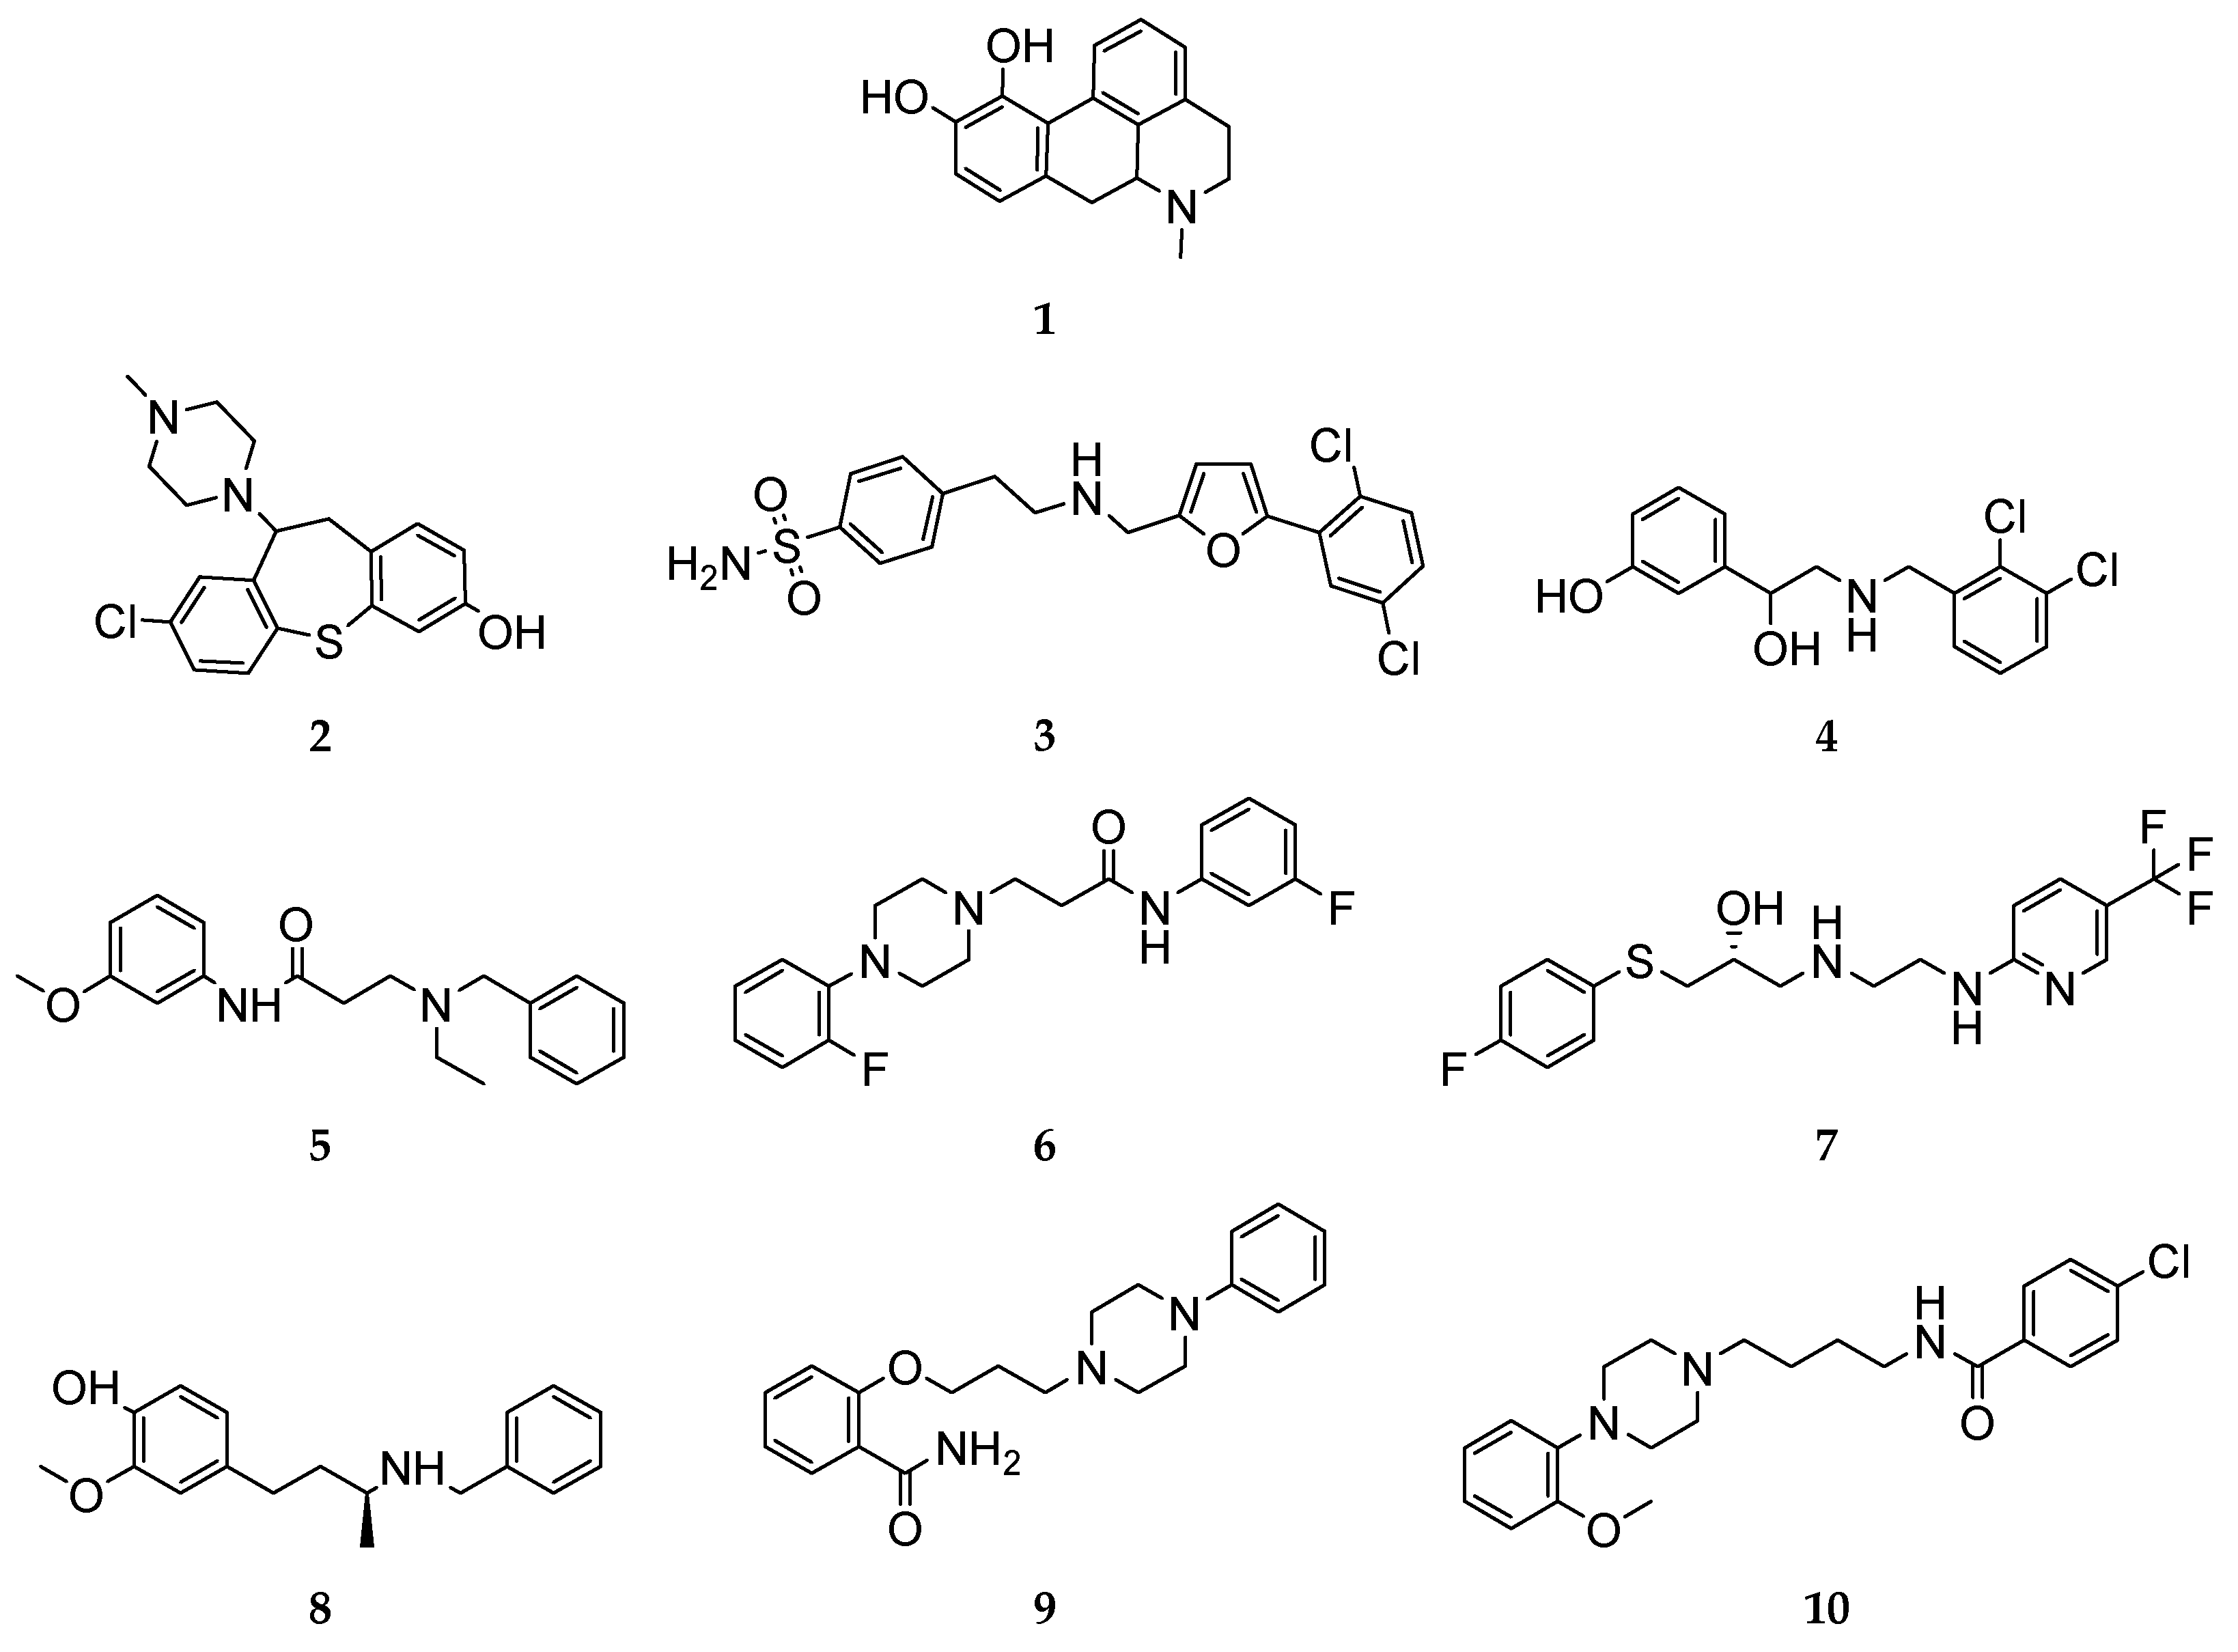

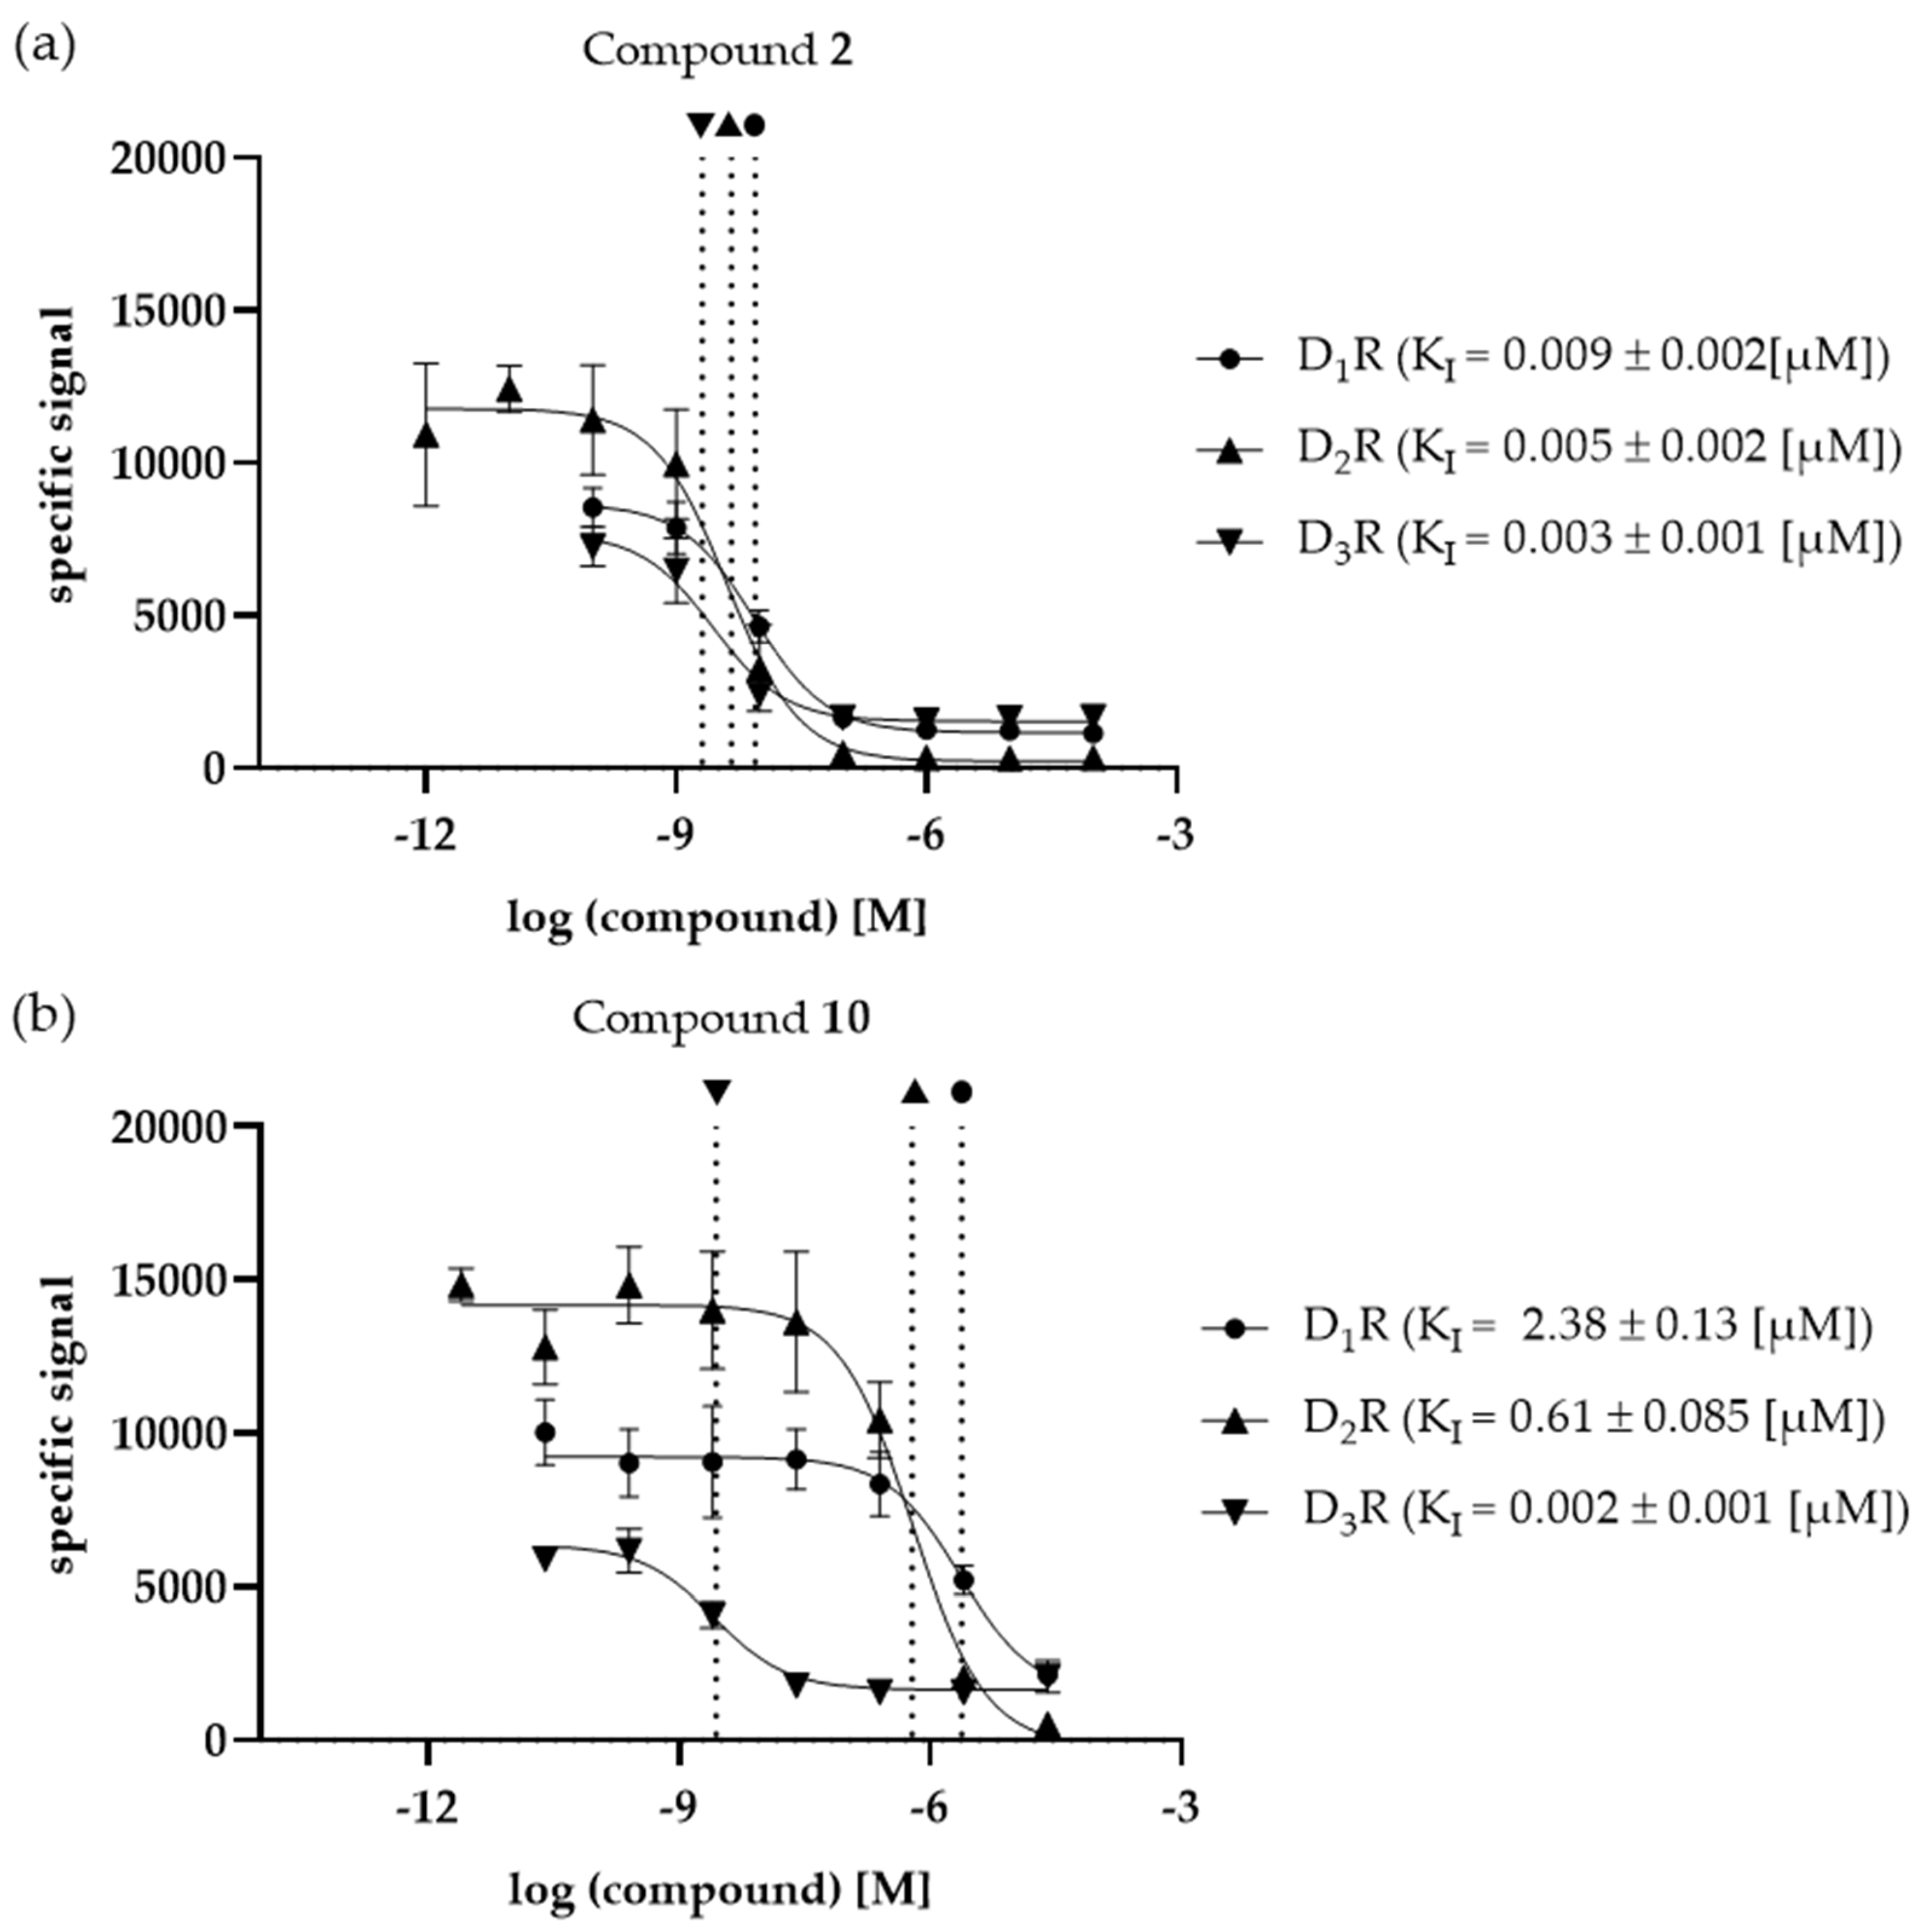
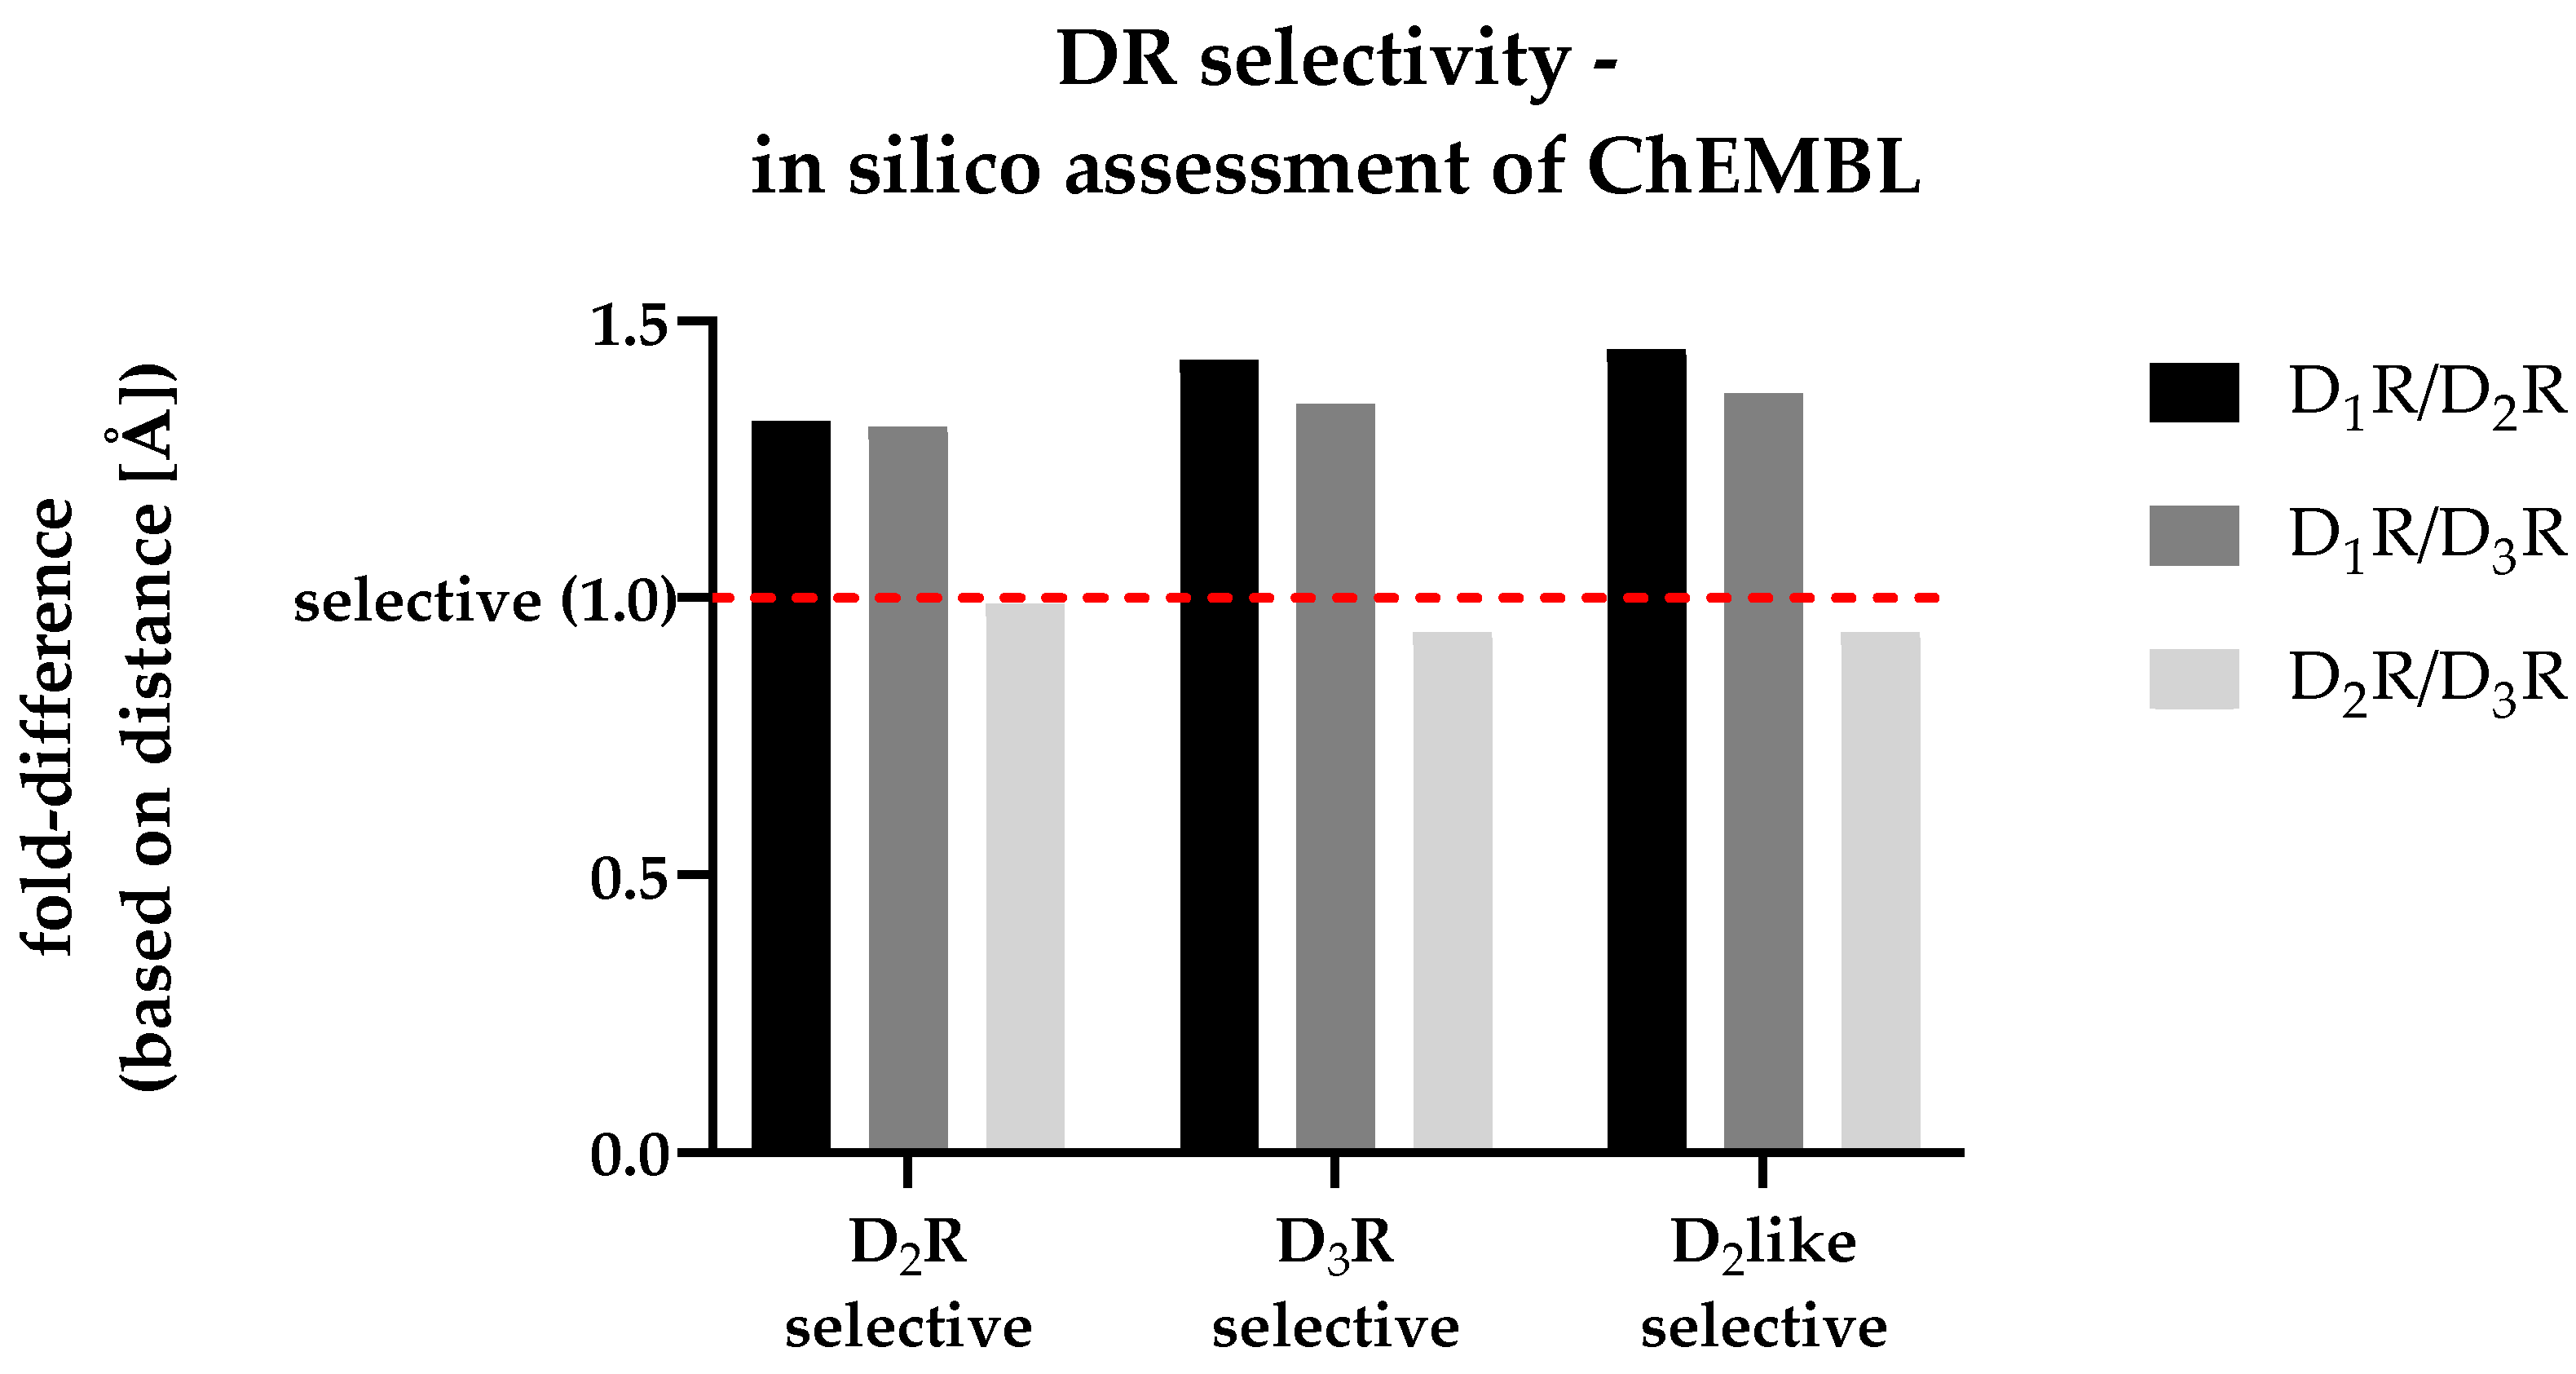
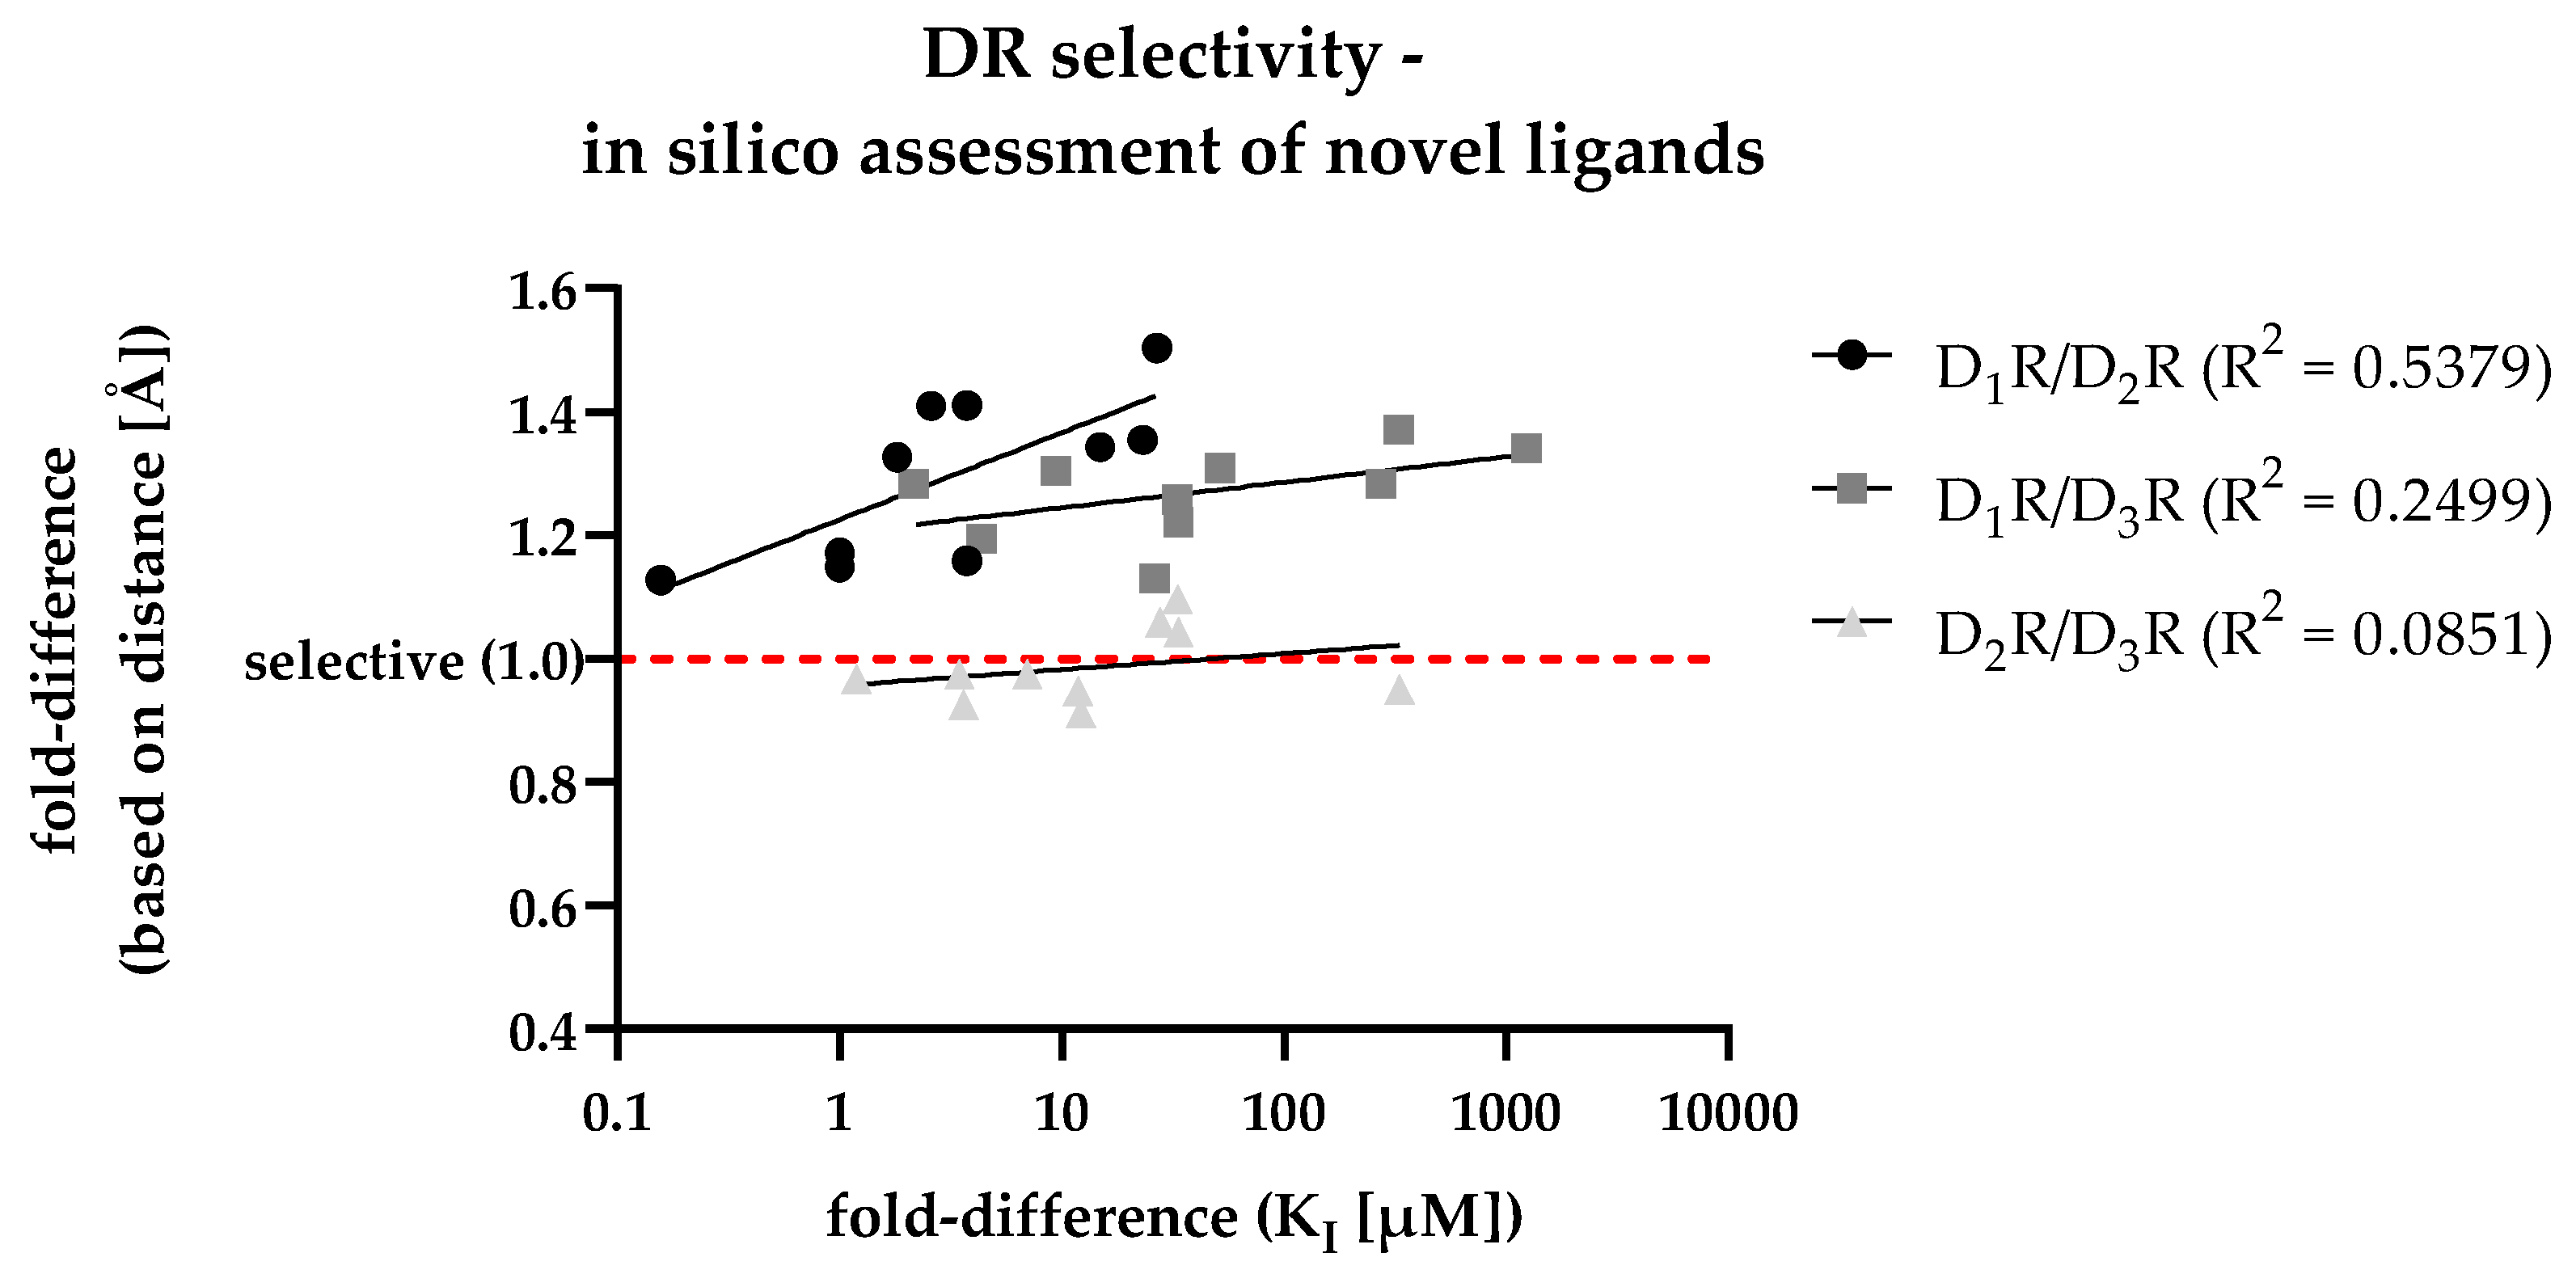
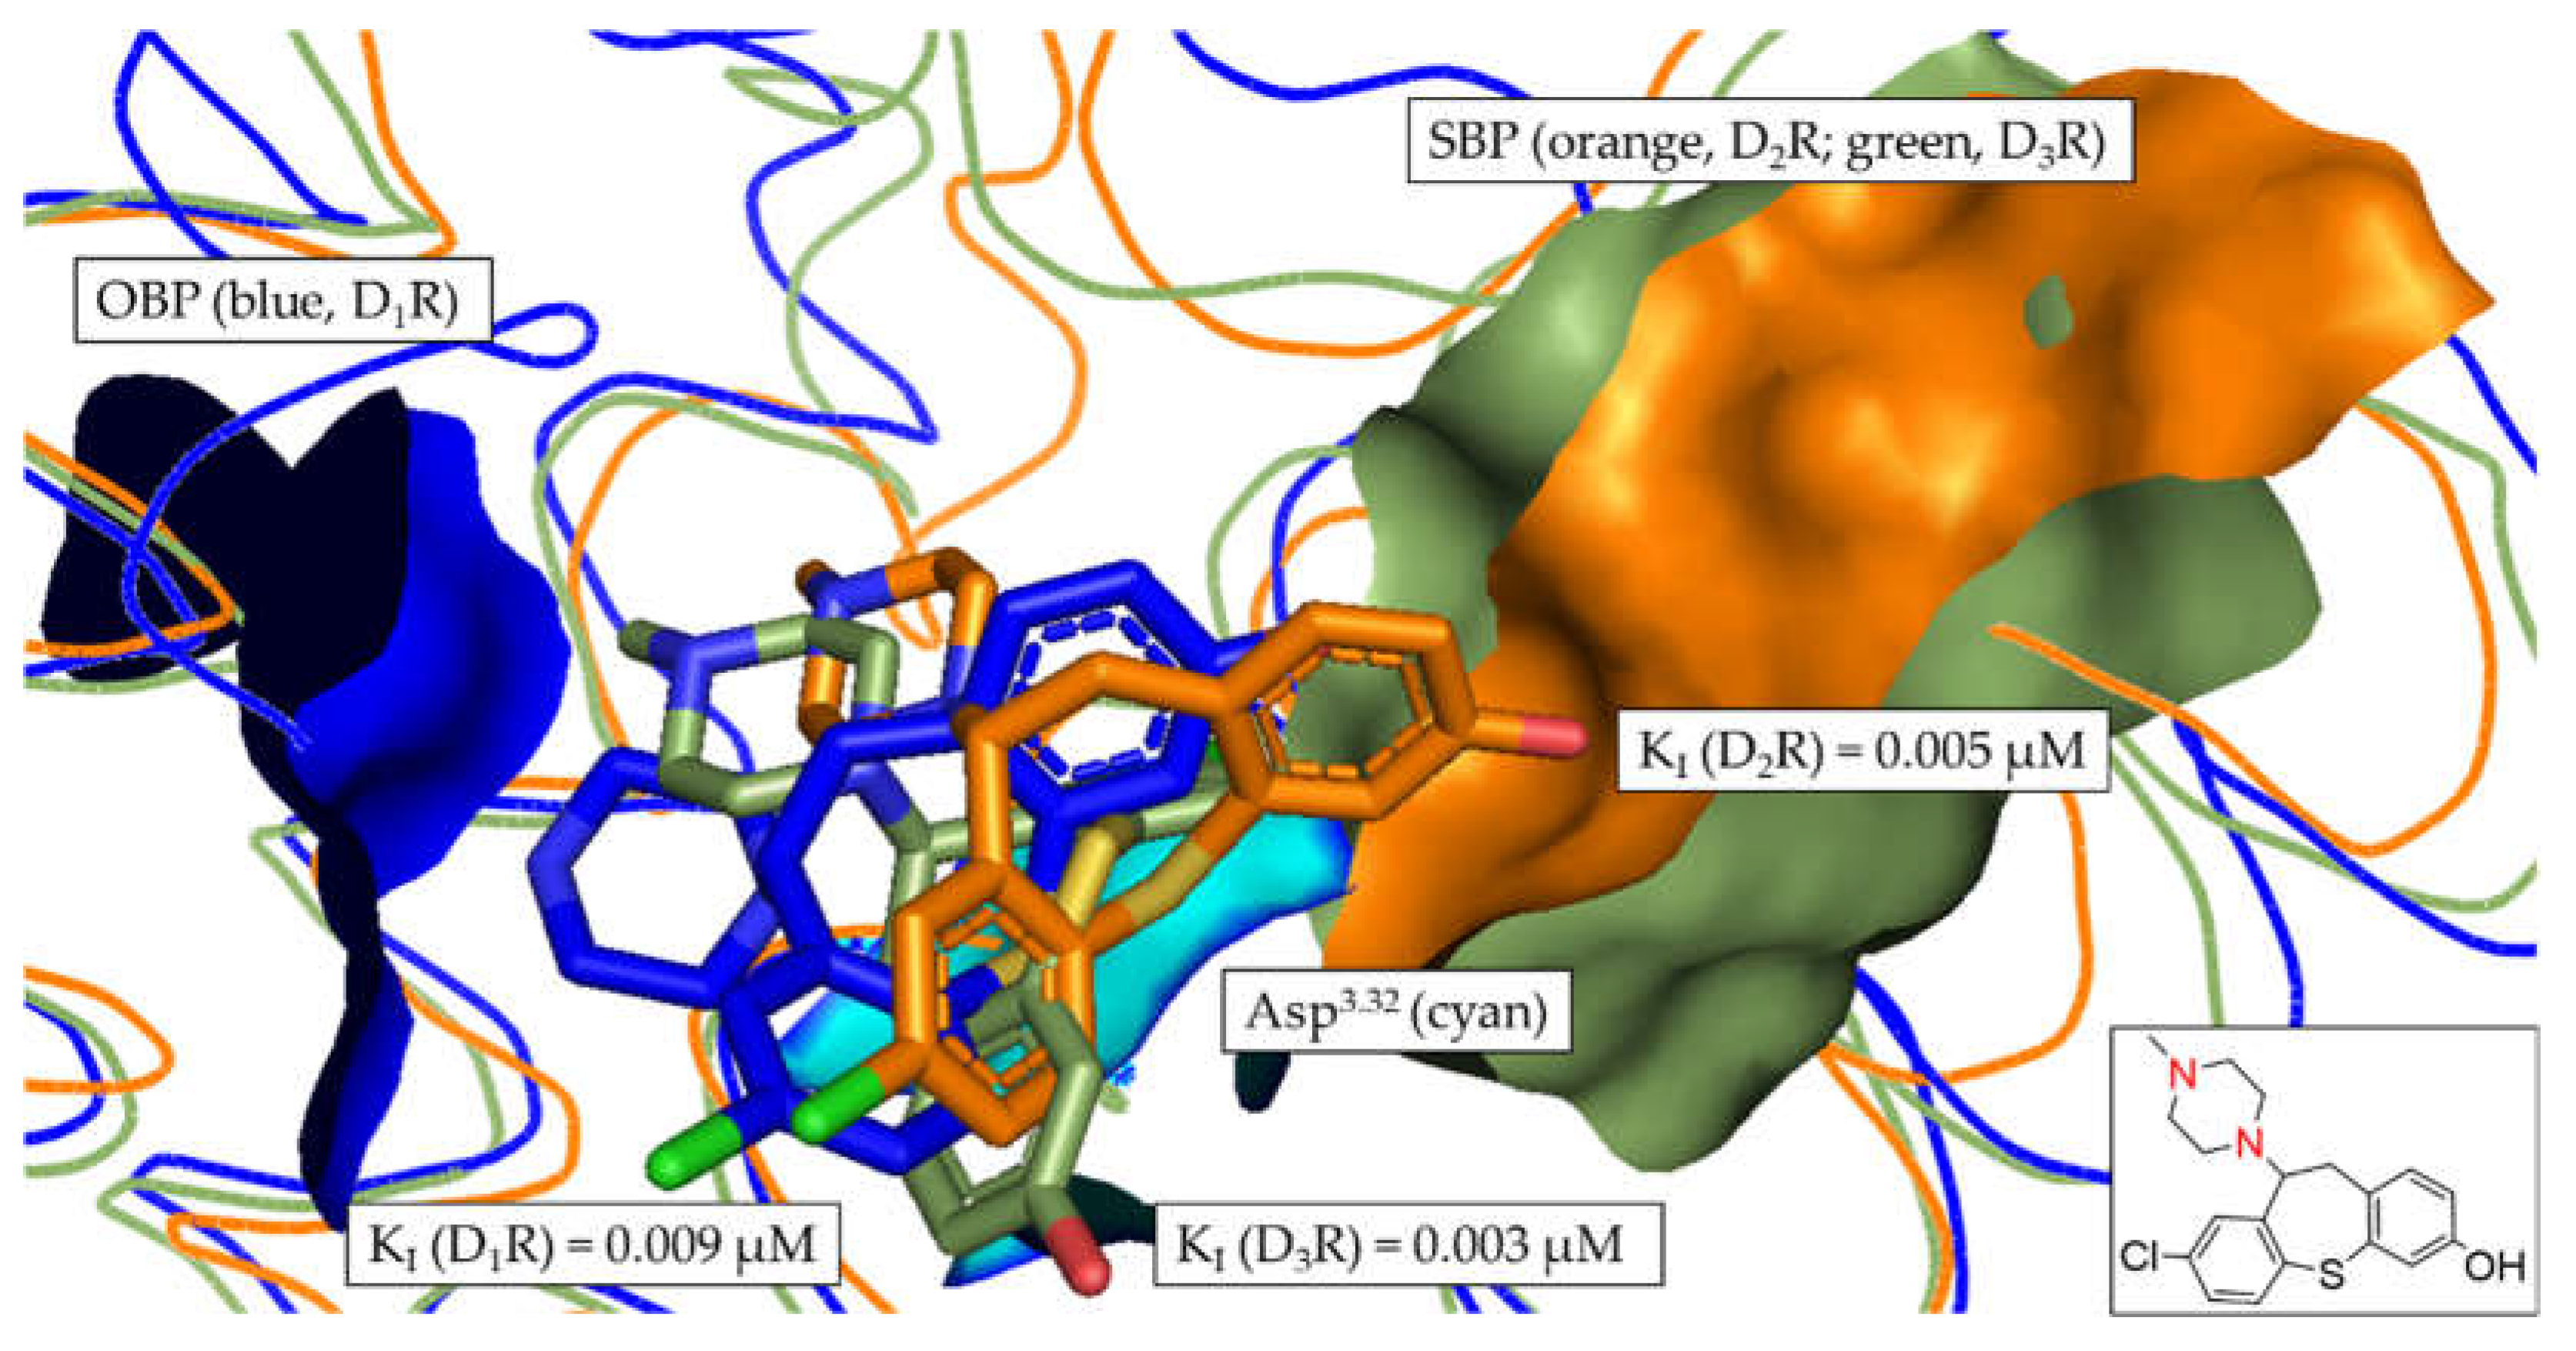
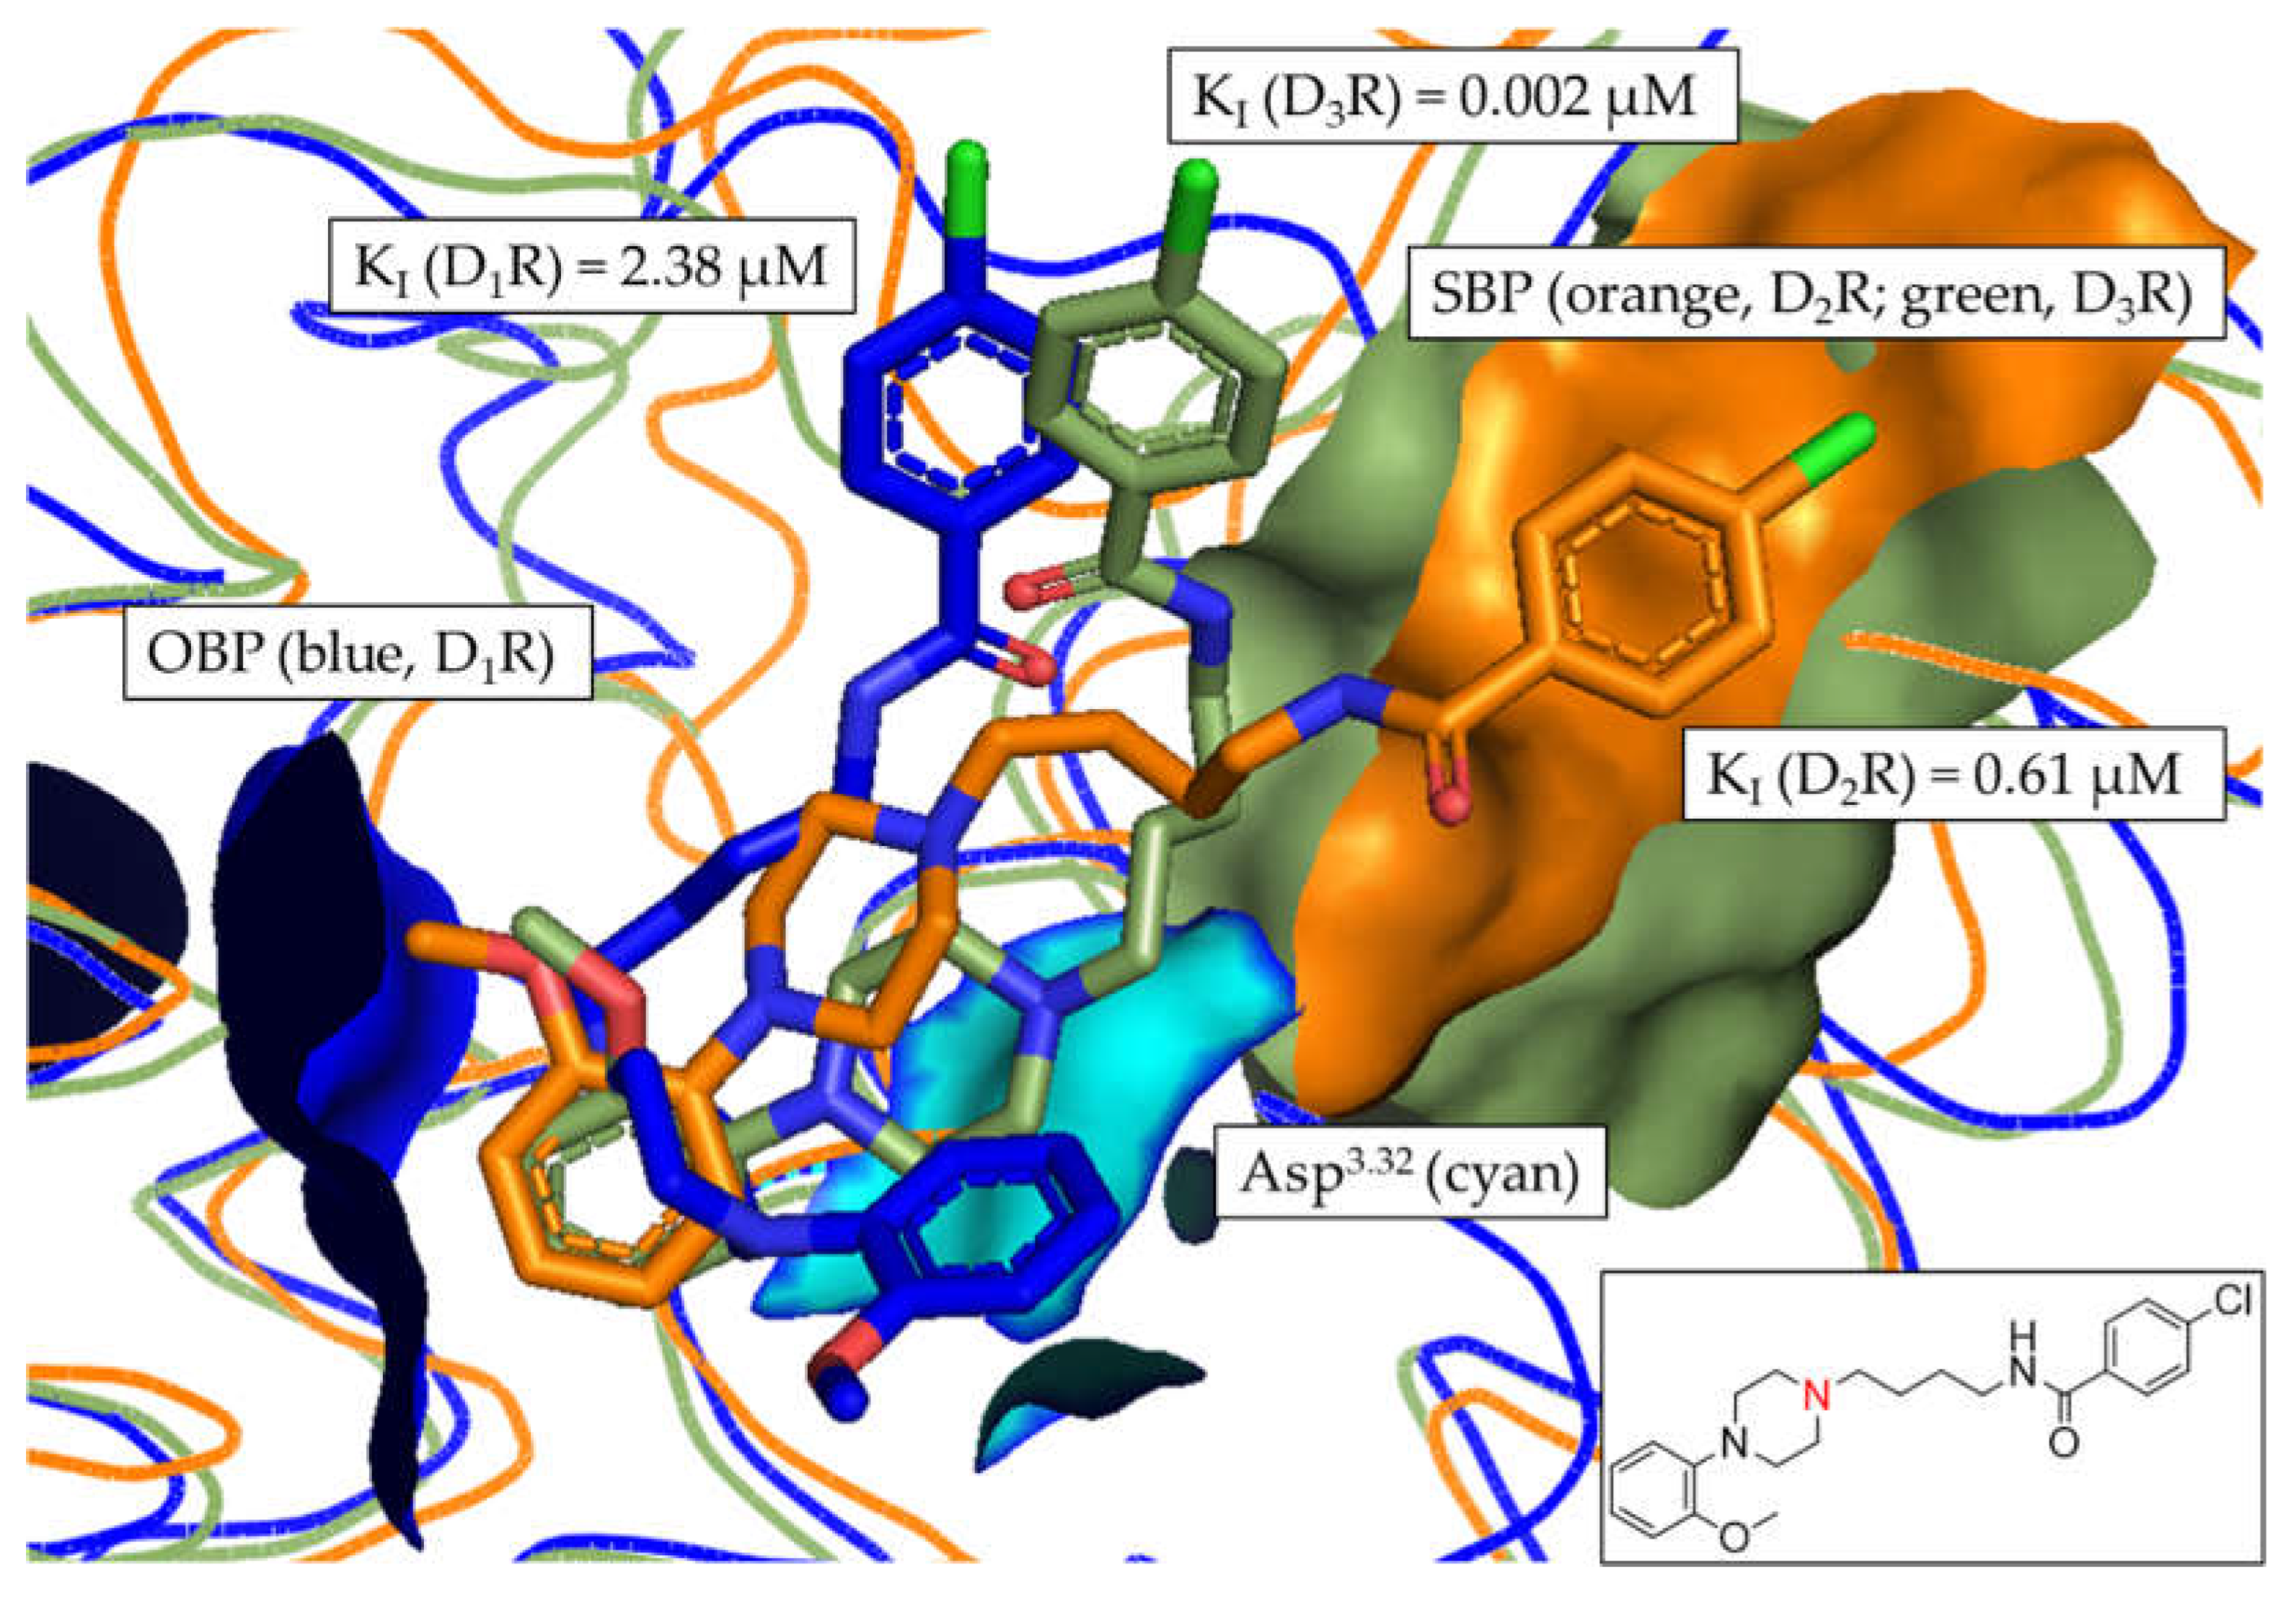
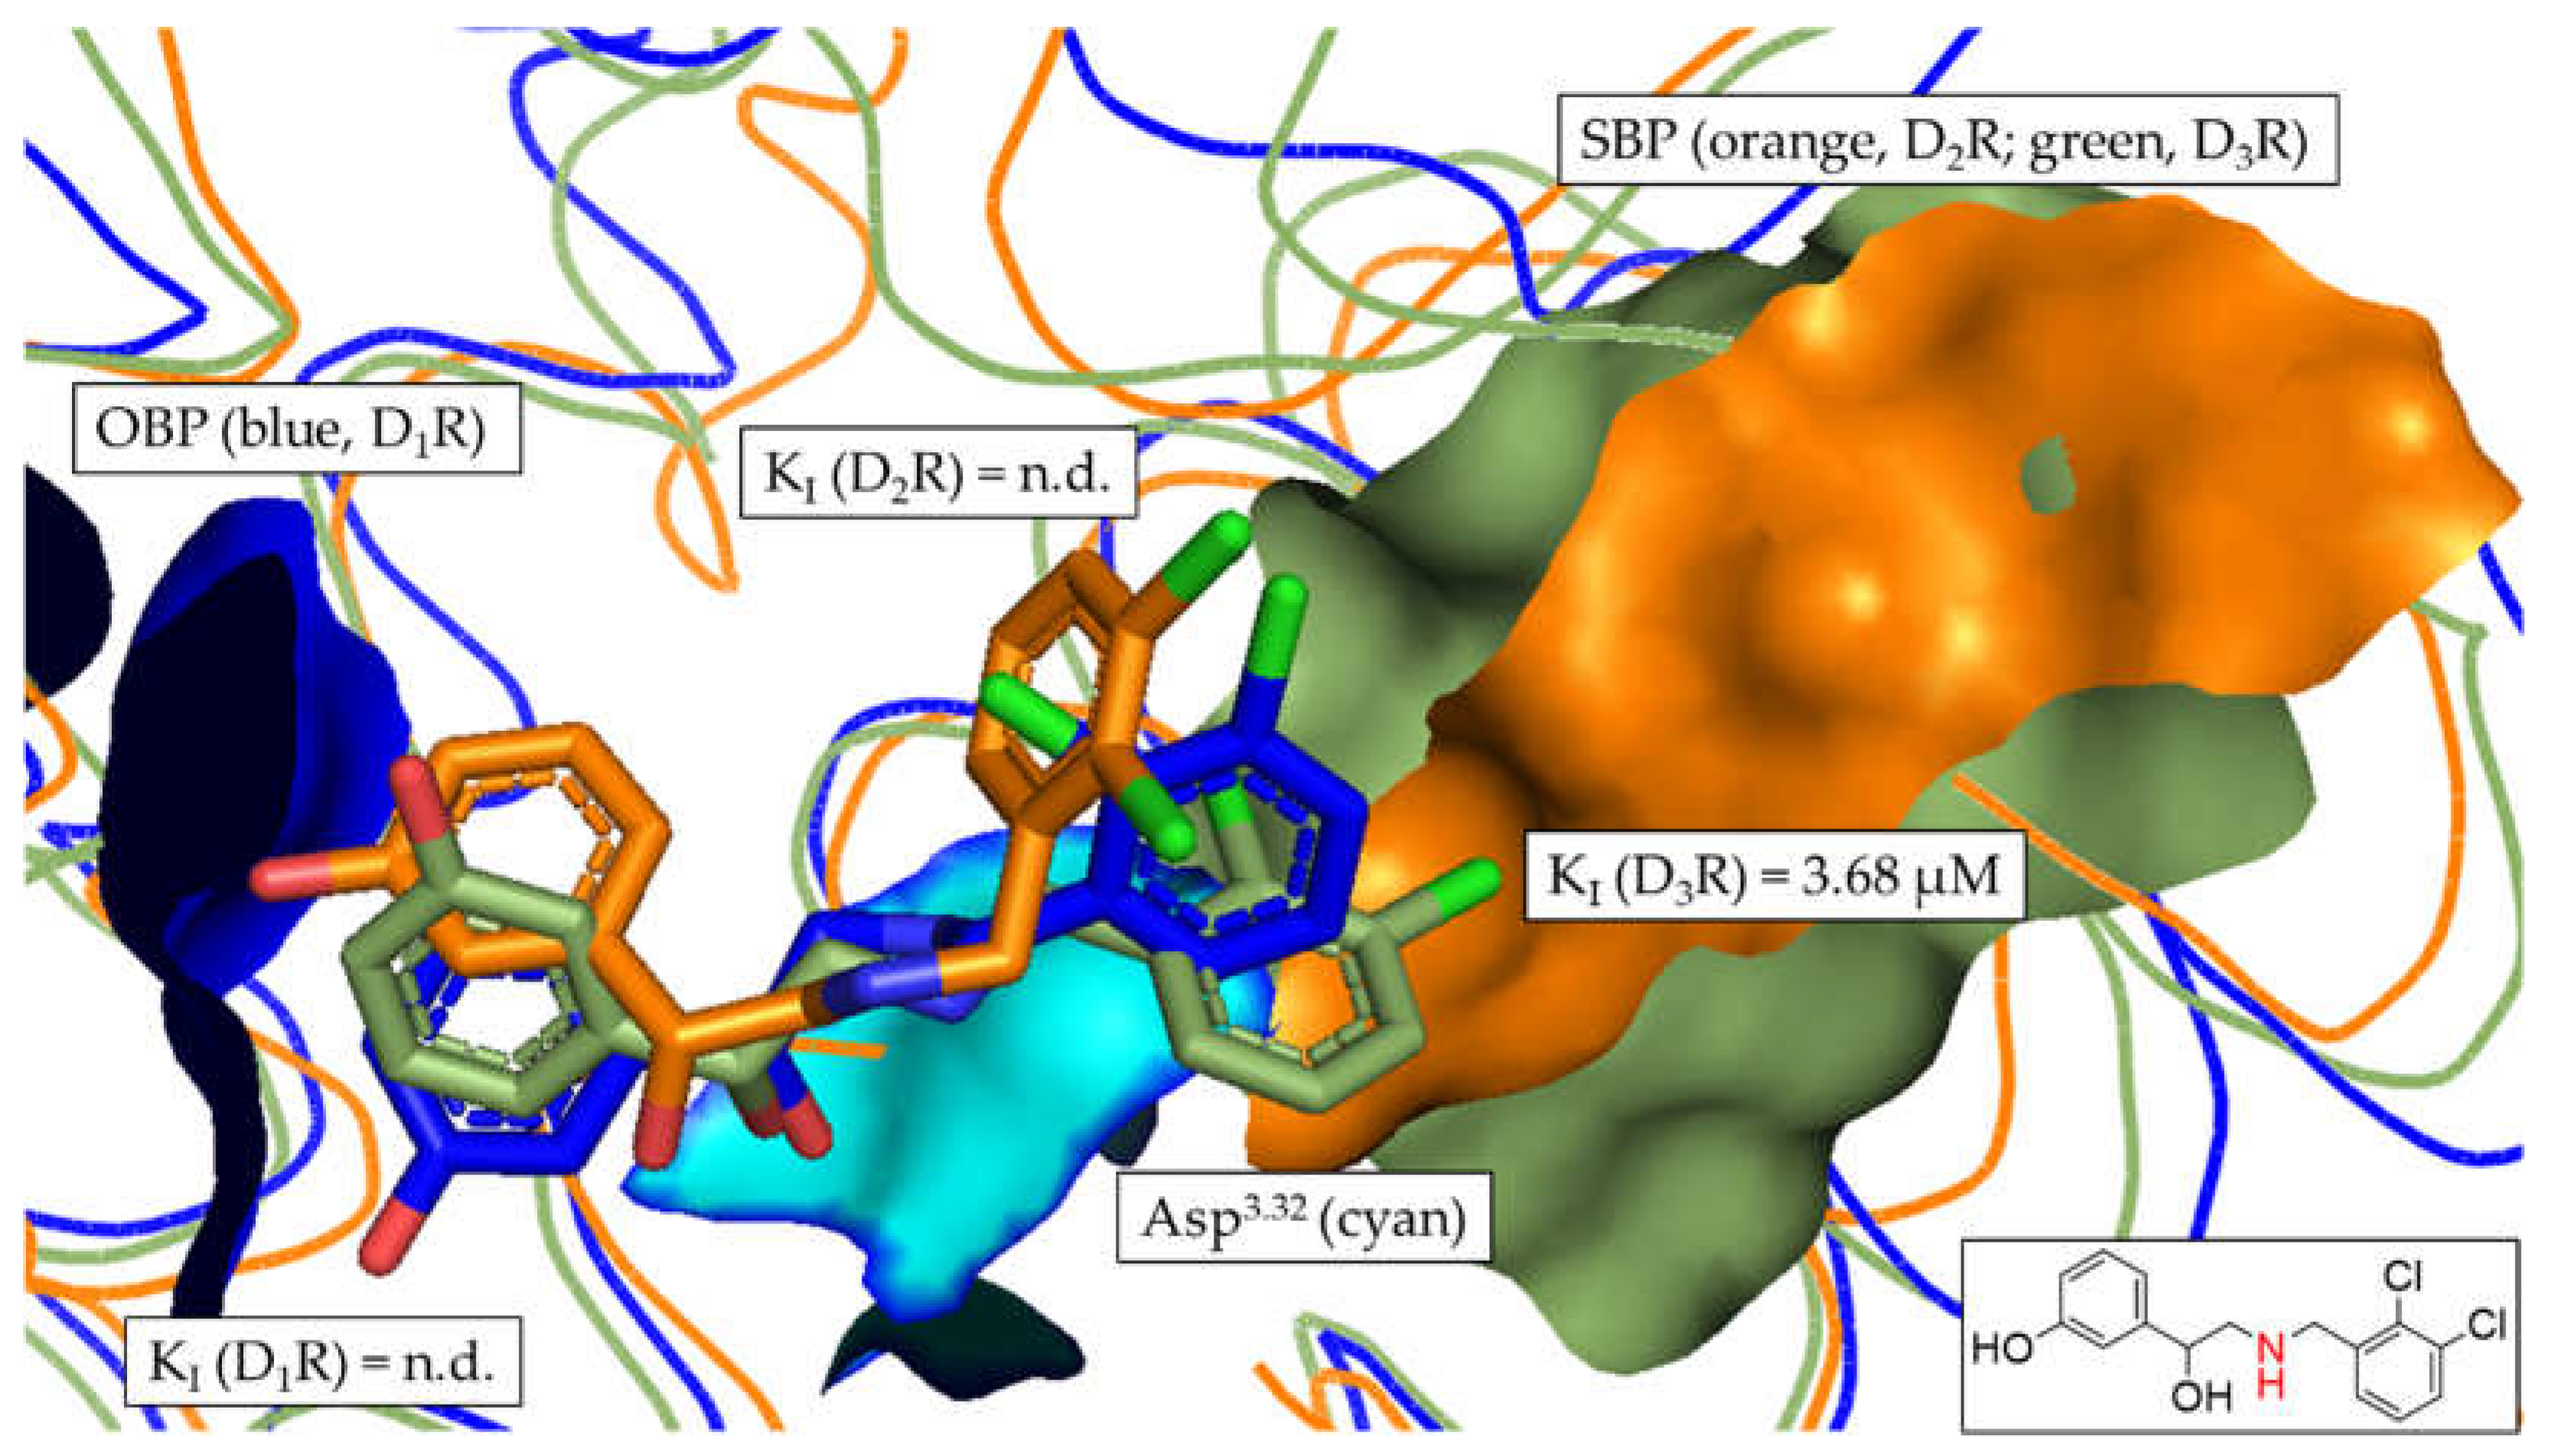

| Setting | Value |
|---|---|
| Flexible Sidechains | ASP103 R, 1 rotamer (free) |
| TRP285 R, 1 rotamer (free) | |
| PHE288 R, 1 rotamer (free) | |
| PHE289, 1 rotamer (free) | |
| ASN292 R, 1 rotamer (free) |
| Setting | Value |
|---|---|
| Flexible Sidechains | ASP110 R, 1 rotamer (free) |
| HIS349 R, 8 rotamers (constrained) |
| DR subtype | |||
|---|---|---|---|
| D3R | D1R | D2R | Status |
| Val86 | Lys81 | Val91 | Conserved in D2like DRs |
| Leu89 | Ala84 | Leu94 | Conserved in D2like DRs |
| Gly94 | Gly88 | Gly98 | Conserved |
| Phe106 | Trp99 | Phe110 | Conserved in D2like DRs |
| Cys181 | Cys186 | Cys182 | Conserved |
| Compound | Normalized Decrease in Fluorescence (NDF) ± SD | ||
|---|---|---|---|
| D1R | D2Ra | D3R | |
| Control | 1 | 1 | 1 |
| 1 | 3.47 ± 1.04 | 9.44 ± 5.97 | 3.82 ± 1.32 |
| 2 | 5.46 ± 1.97 | 40.41 ± 1.39 | 4.16 ± 1.08 |
| 3 | 1.78 ± 1.35 | 3.99 ± 2.58 | 3.96 ± 1.10 |
| 4 | 0.90 ± 0.31 | 0.90 ± 0.39 | 2.75 ± 0.61 |
| 5 | 1.26 ± 0.64 | 15.74 ± 18.15 | 2.65 ± 0.64 |
| 6 | 2.15 ± 1.16 | 8.18 ± 3.62 | 4.21 ± 0.79 |
| 7 | 1.57 ± 0.54 | 10.85 ± 4.93 | 3.79 ± 0.70 |
| 8 | 1.20 ± 0.59 | 1.10 ± 0.52 | 2.63 ± 0.52 |
| 9 | 1.71 ± 0.86 | 22.08 ± 6.62 | 3.97 ± 0.78 |
| 10 | 2.59 ± 1.04 | 22.89 ± 8.41 | 4.09 ± 1.07 |
| Cpd. | KI [µM] | selectivity | ||||
|---|---|---|---|---|---|---|
| D1R | D2R | D3R | D1R/D2R | D1R/D3R | D2R/D3R | |
| 1 | 0.36 ± 0.009 | 2.36 ± 0.14 | 0.12 ± 0.048 | 0.15 | 3.06 | 19.8 |
| 2 | 0.009 ± 0.002 | 0.005 ± 0.002a | 0.003 ± 0.001 | 1.95 | 3.23 | 1.66 |
| 3 | n.d.b | 4.66 ± 2.69a | 0.38 ± 0.022 | > 21.4b | 262.2 | 12.2 |
| 4 | n.d.b | n.d.b | 3.68 ± 0.94 | - | > 27.2b | > 27.2b |
| 5 | 46.9 ± 27.4 | 10.95 ± 4.43a | 2.25 ± 0.91 | 4.28 | 20.8 | 4.86 |
| 6 | 7.76 ± 4.41 | 1.35 ± 0.63a | 0.37 ± 0.28 | 5.77 | 20.7 | 3.56 |
| 7 | 8.33 ± 2.17 | 2.78 ± 1.06a | 0.68 ± 0.068 | 3.00 | 12.3 | 4.11 |
| 8 | n.d.b | n.d.b | 2.32 ± 0.92 | - | > 43.1b | > 43.1b |
| 9 | 9.46 ± 1.18 | 0.33 ± 0.093a | 0.024 ± 0.003 | 28.6 | 395.1 | 13.8 |
| 10 | 2.38 ± 0.13 | 0.61 ± 0.085 | 0.002 ± 0.001 | 3.91 | 1031.4 | 263.7 |
| Dataset | Fold-difference (cons. Gly-COM)) | ||
|---|---|---|---|
| D1R/D2R | D1R/D3R | D2R/D3R | |
| D2R selective | 1.32 | 1.31 | 0.99 |
| D3R selective | 1.43 | 1.35 | 0.94 |
| D2like selective | 1.45 | 1.37 | 0.94 |
Disclaimer/Publisher’s Note: The statements, opinions and data contained in all publications are solely those of the individual author(s) and contributor(s) and not of MDPI and/or the editor(s). MDPI and/or the editor(s) disclaim responsibility for any injury to people or property resulting from any ideas, methods, instructions or products referred to in the content. |
© 2023 by the authors. Licensee MDPI, Basel, Switzerland. This article is an open access article distributed under the terms and conditions of the Creative Commons Attribution (CC BY) license (http://creativecommons.org/licenses/by/4.0/).


