Submitted:
27 April 2023
Posted:
28 April 2023
You are already at the latest version
Abstract
Keywords:
1. Introduction
2. Materials and Methods
2.1. Animals
2.2. Hemodynamic Data
2.3. Estimation of Protein Expression
2.4. Double Immunofluorescence
2.5. Statistical Analysis
2.6. Gene Expression Data
2.7. Transcriptomic Analyses
2.7.1. Significant Regulation
2.7.2. Measures of Individual Genes’ Contributions to the Transcriptomic Alteration
3. Results
3.1. Significant Increase of the RVSP and RV/LV Weight Ratio in All Three PAH Models
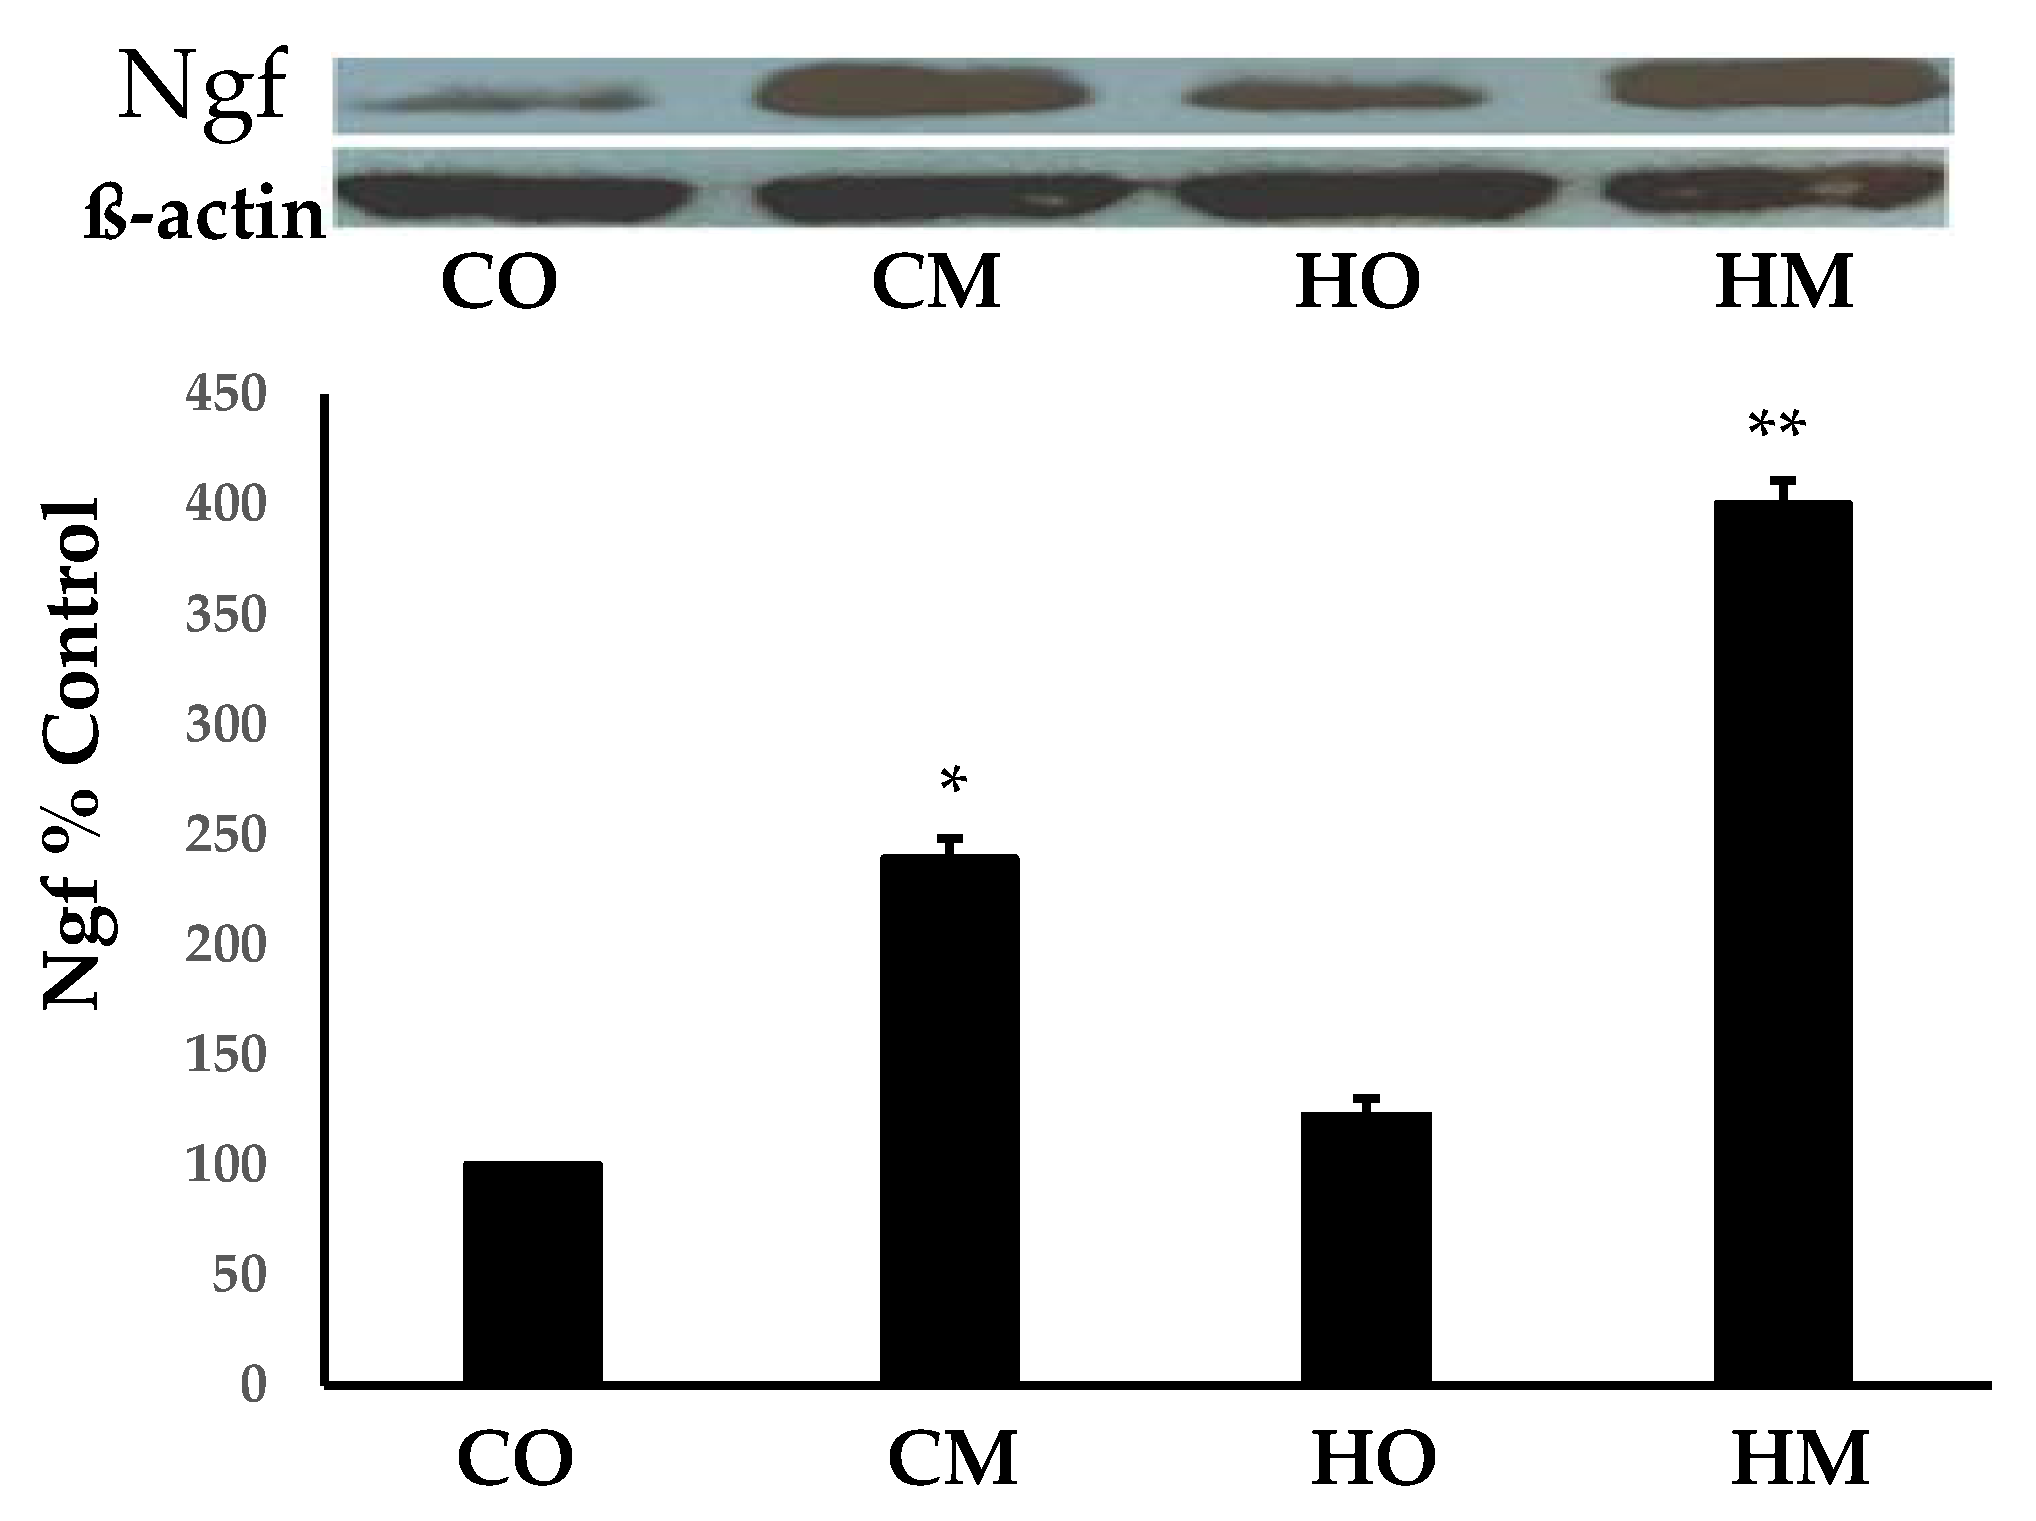
3.2. Monocrotaline Administration Increased the Expression of the Nerve Growth Factor (Ngf)
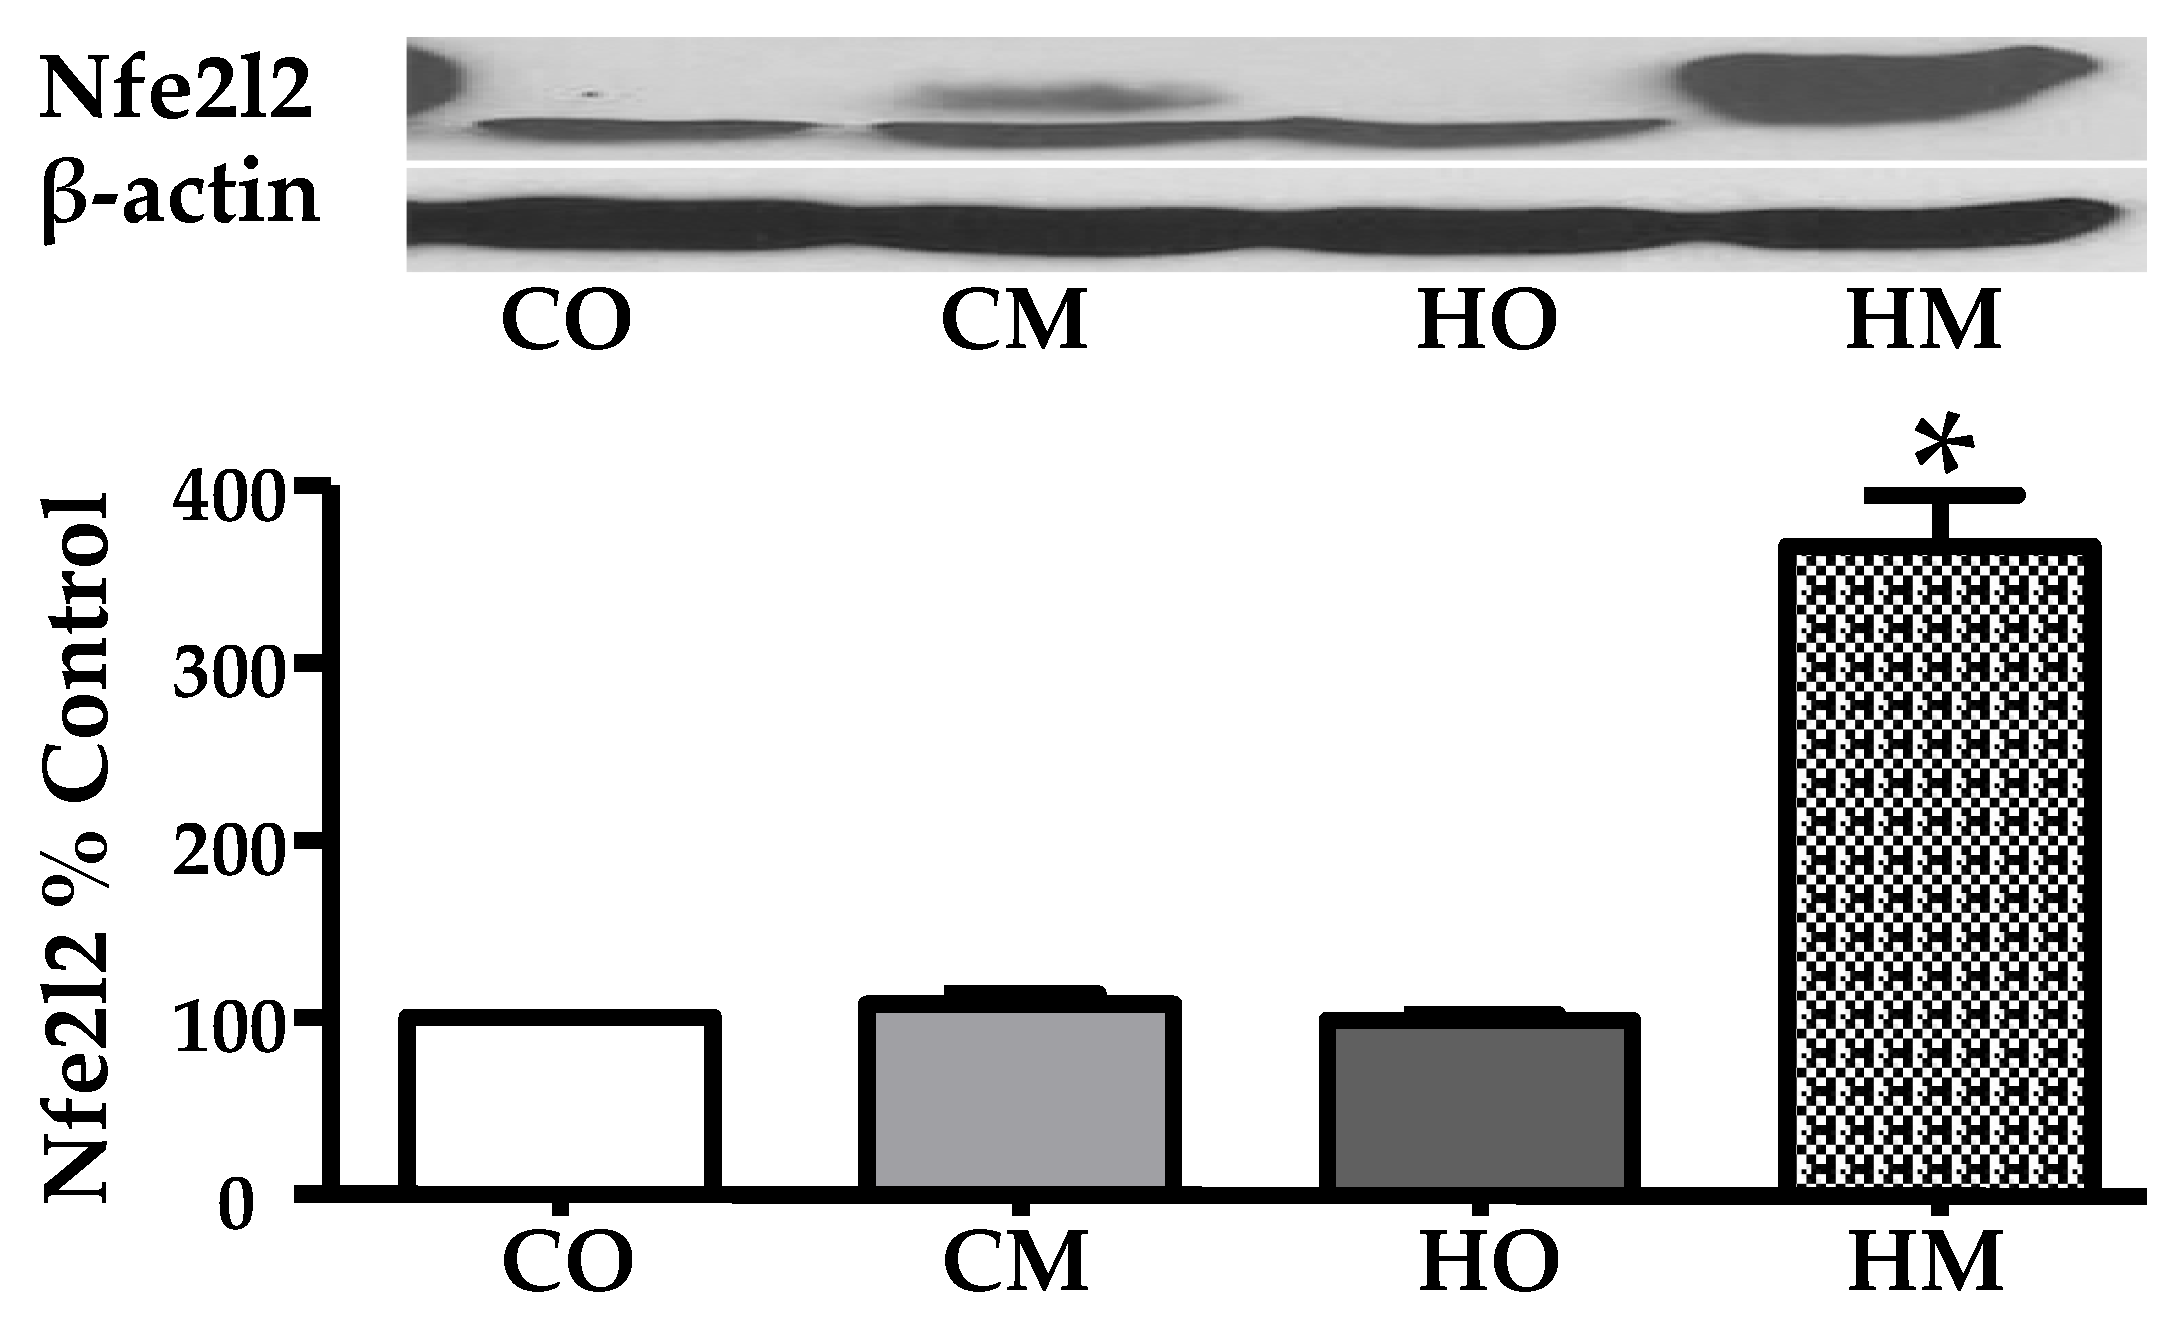
3.3. Administration of Monocrotaline to Rats Exposed to Hypoxia Increased the Expression of the Nuclear Factor Erythroid Derived 2, like 2 (Nfe2l2)
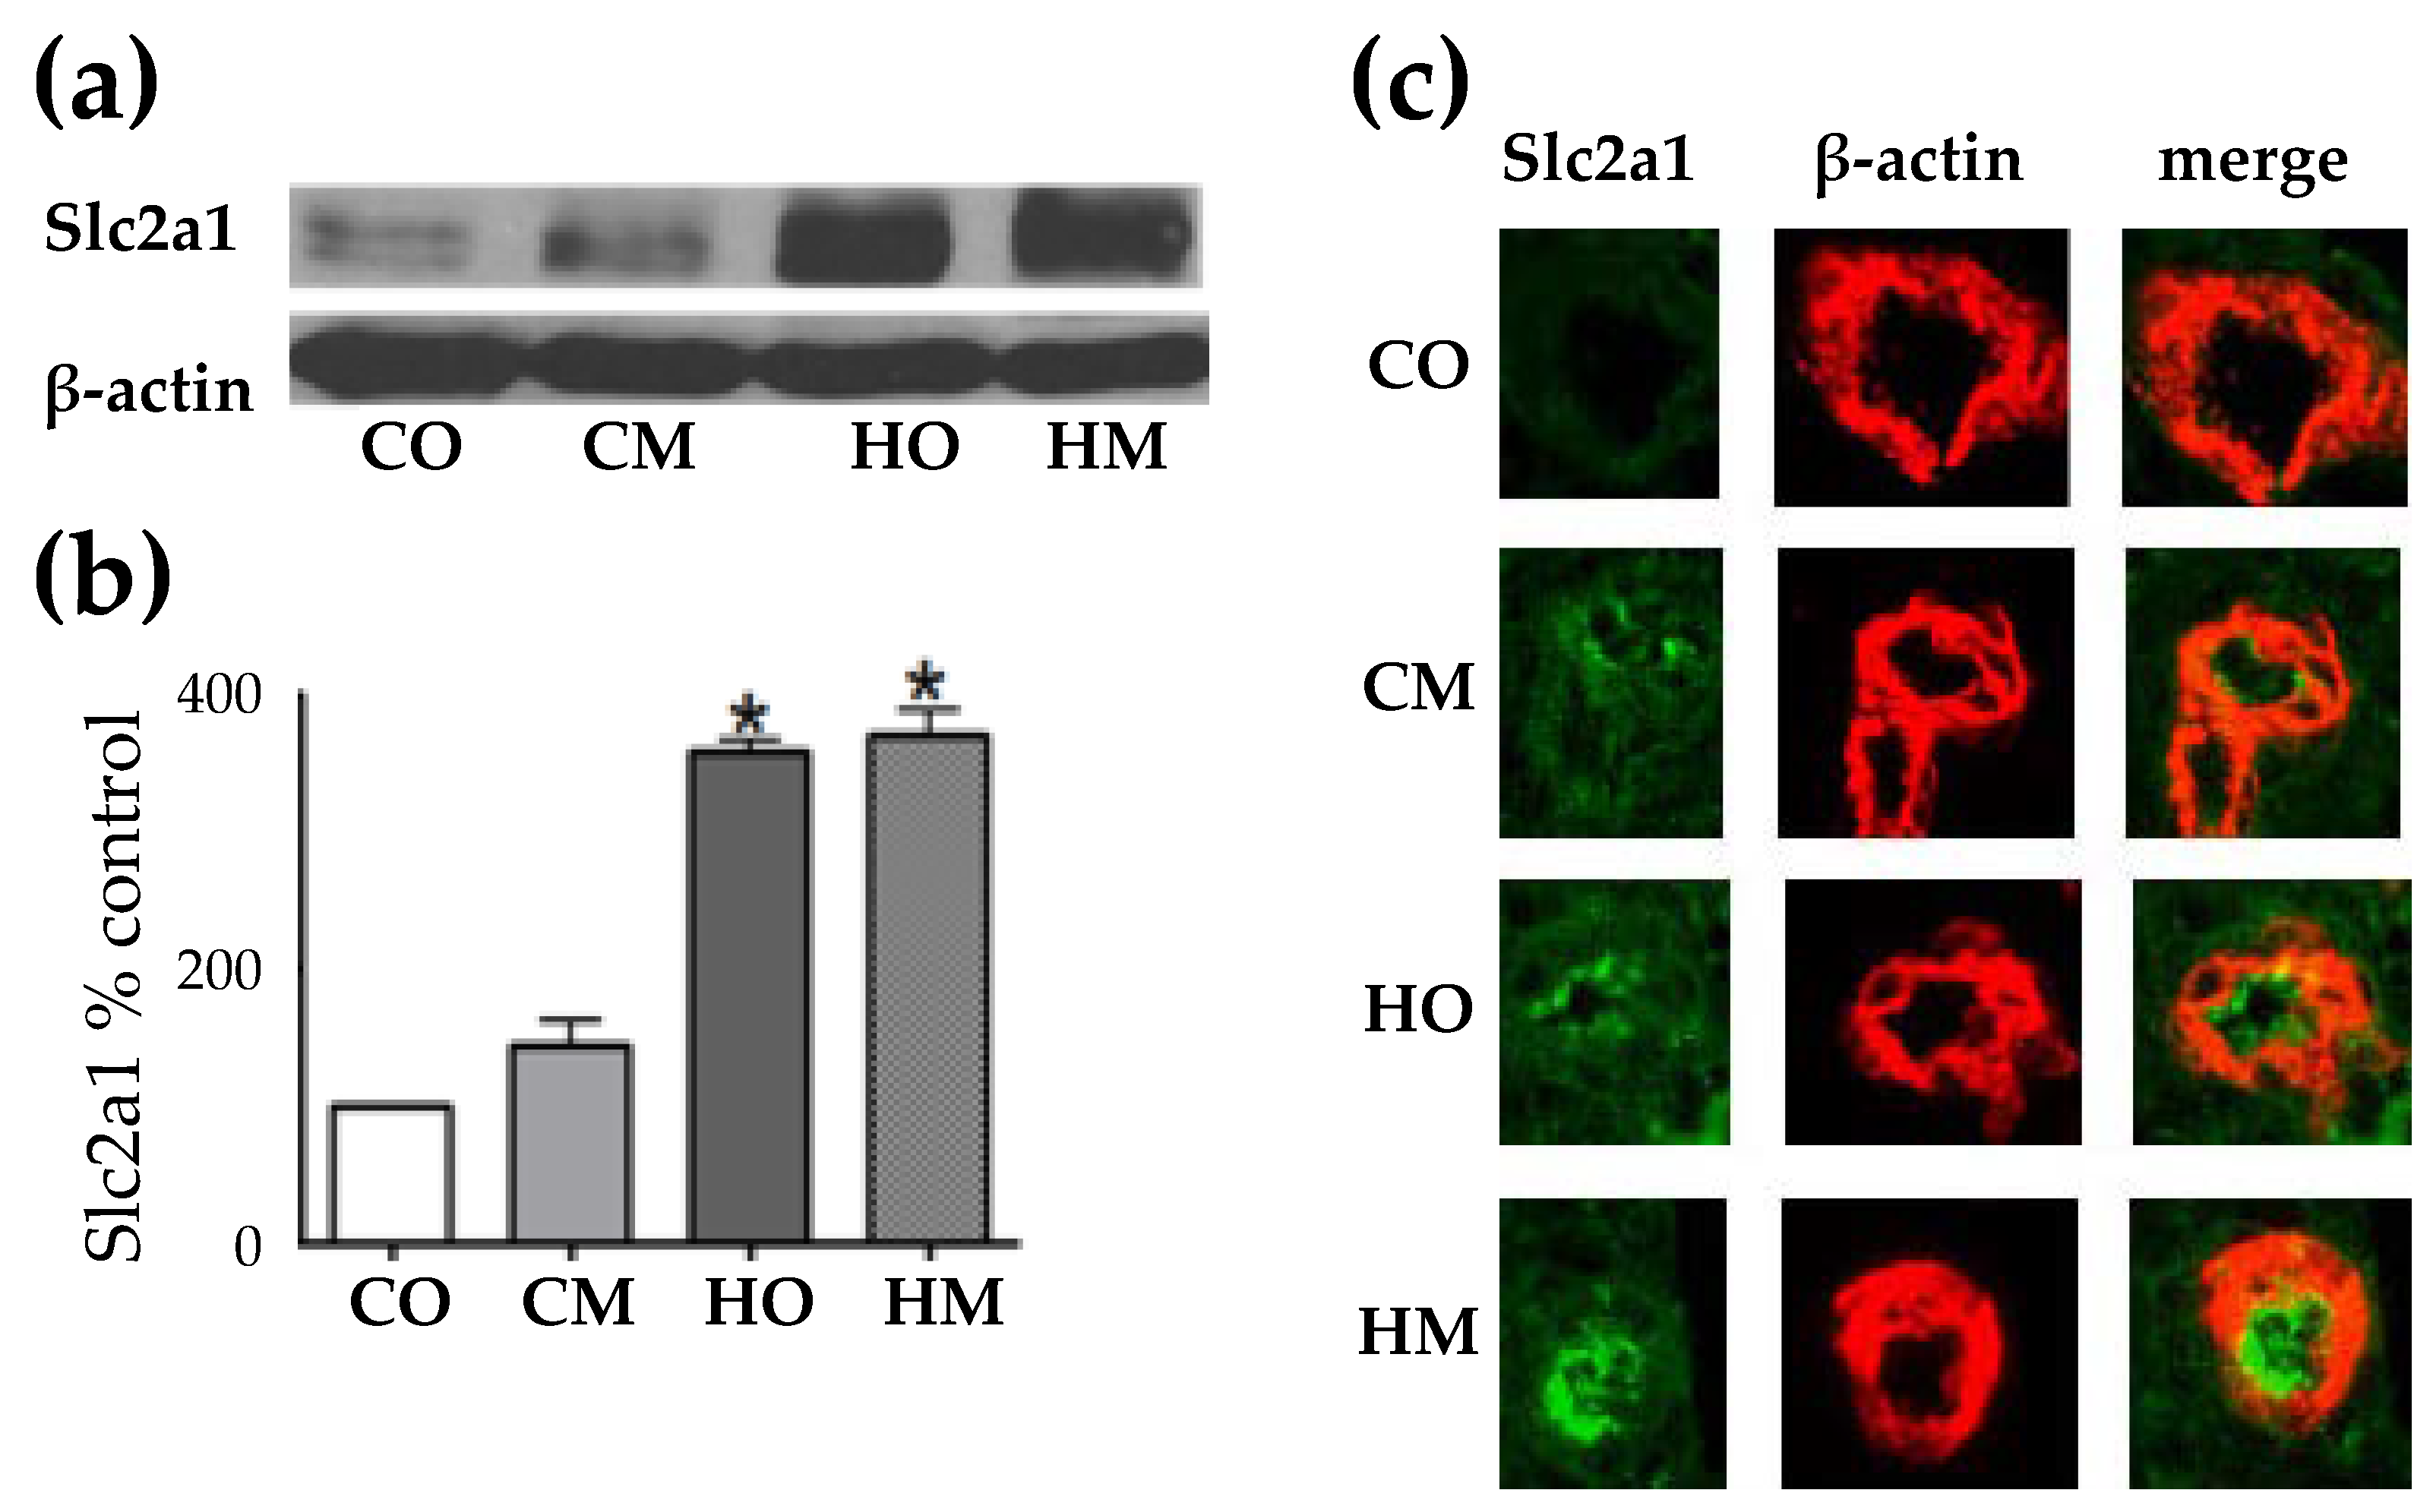
3.4. Hypoxia –Induced Pulmonary Hypertension Increased the Expression of Glucose Transporter Solute Carrier Family 2 (Slc2a1)
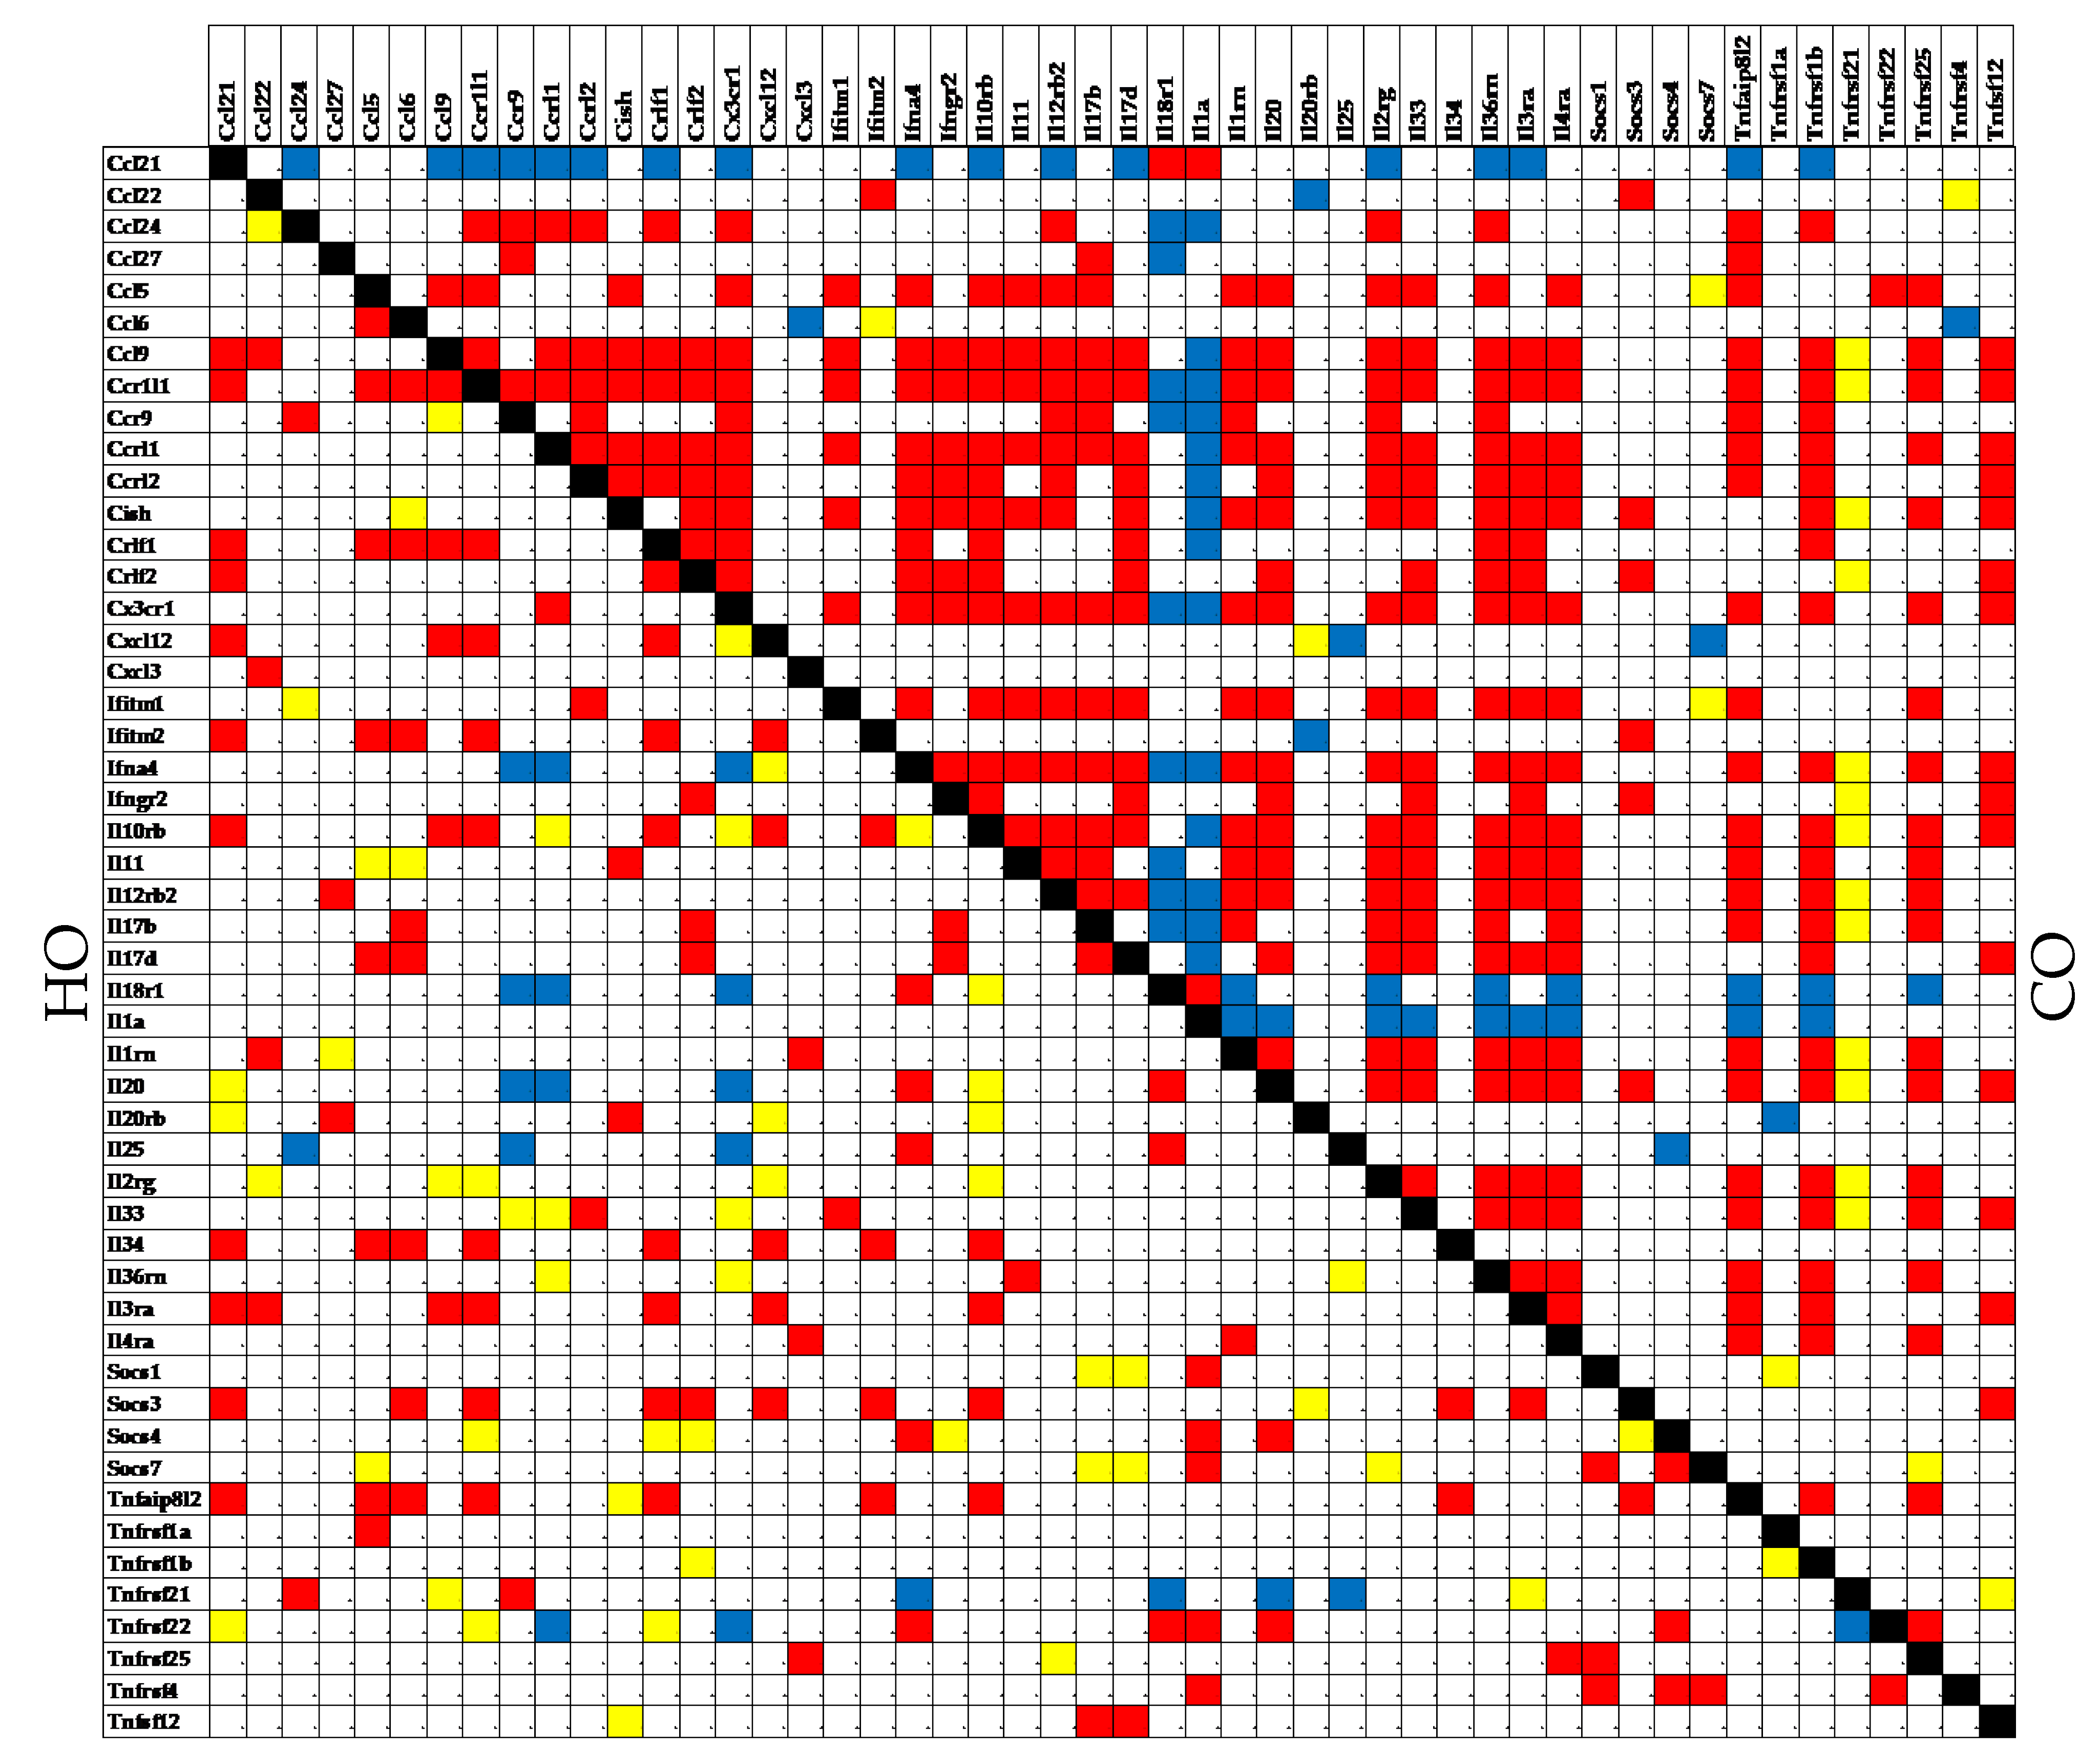
3.5. Independent Transcriptomic Characteristics
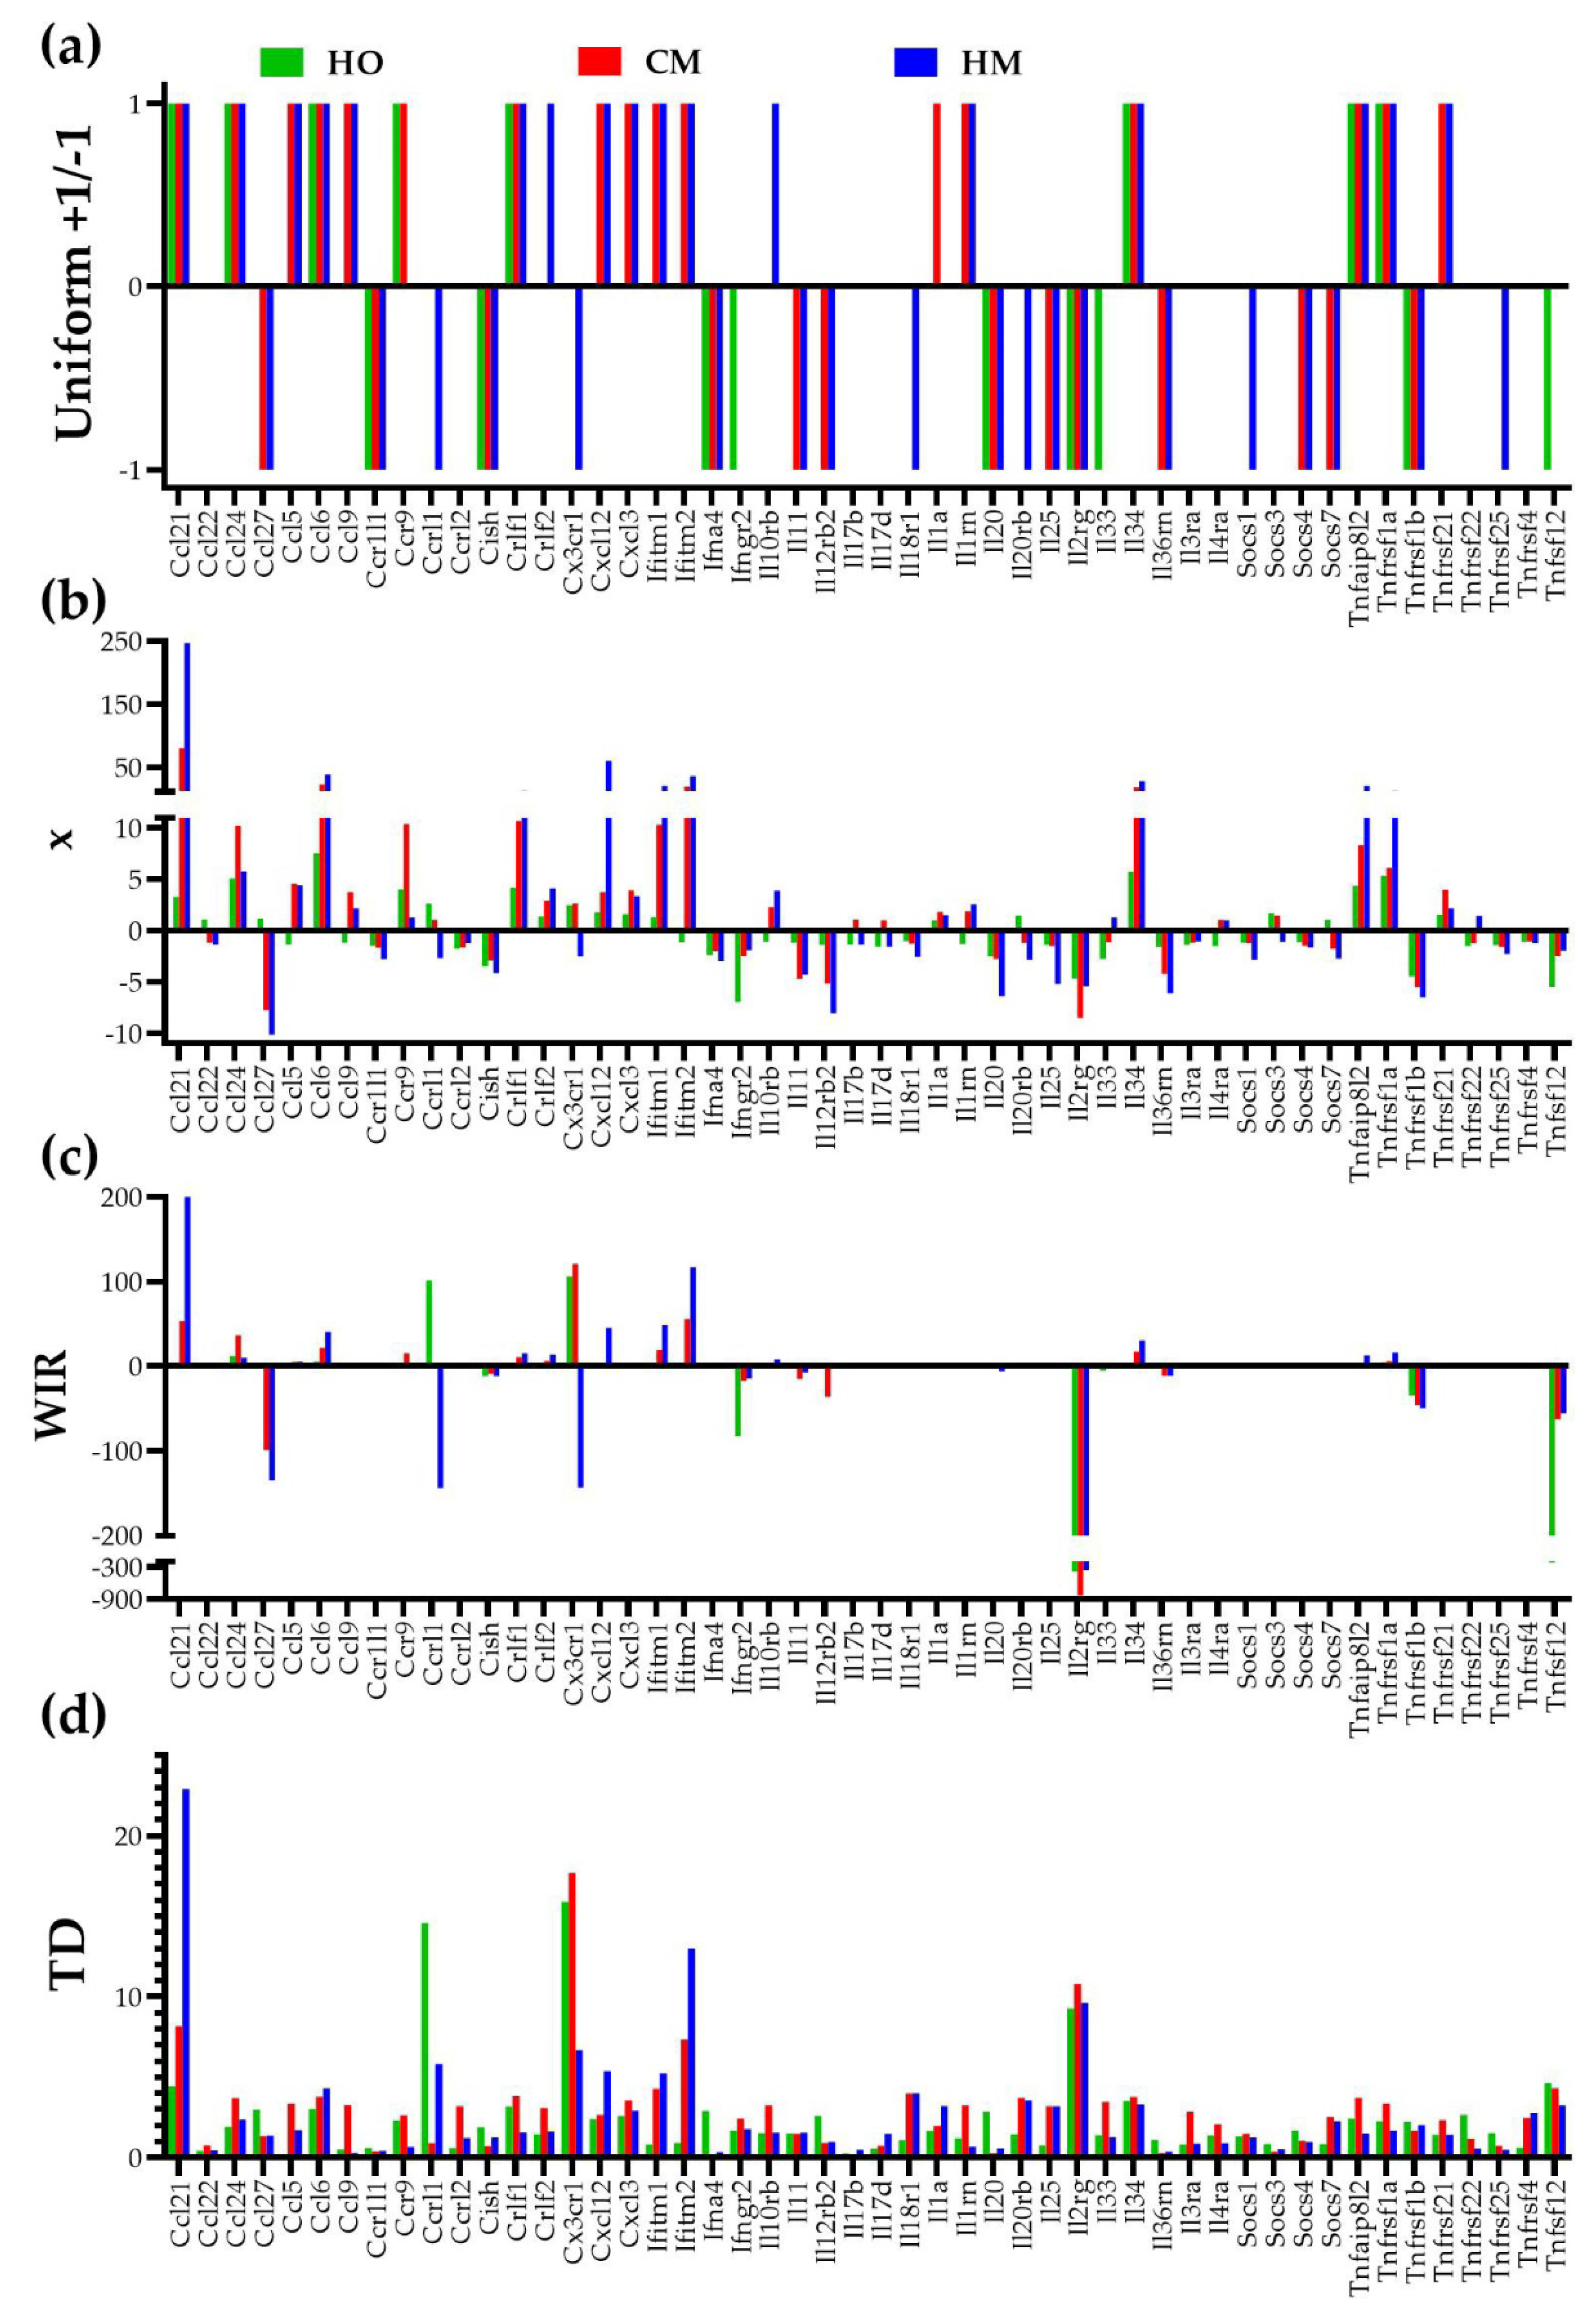
3.6. Measures of Transcriptomic Alterations
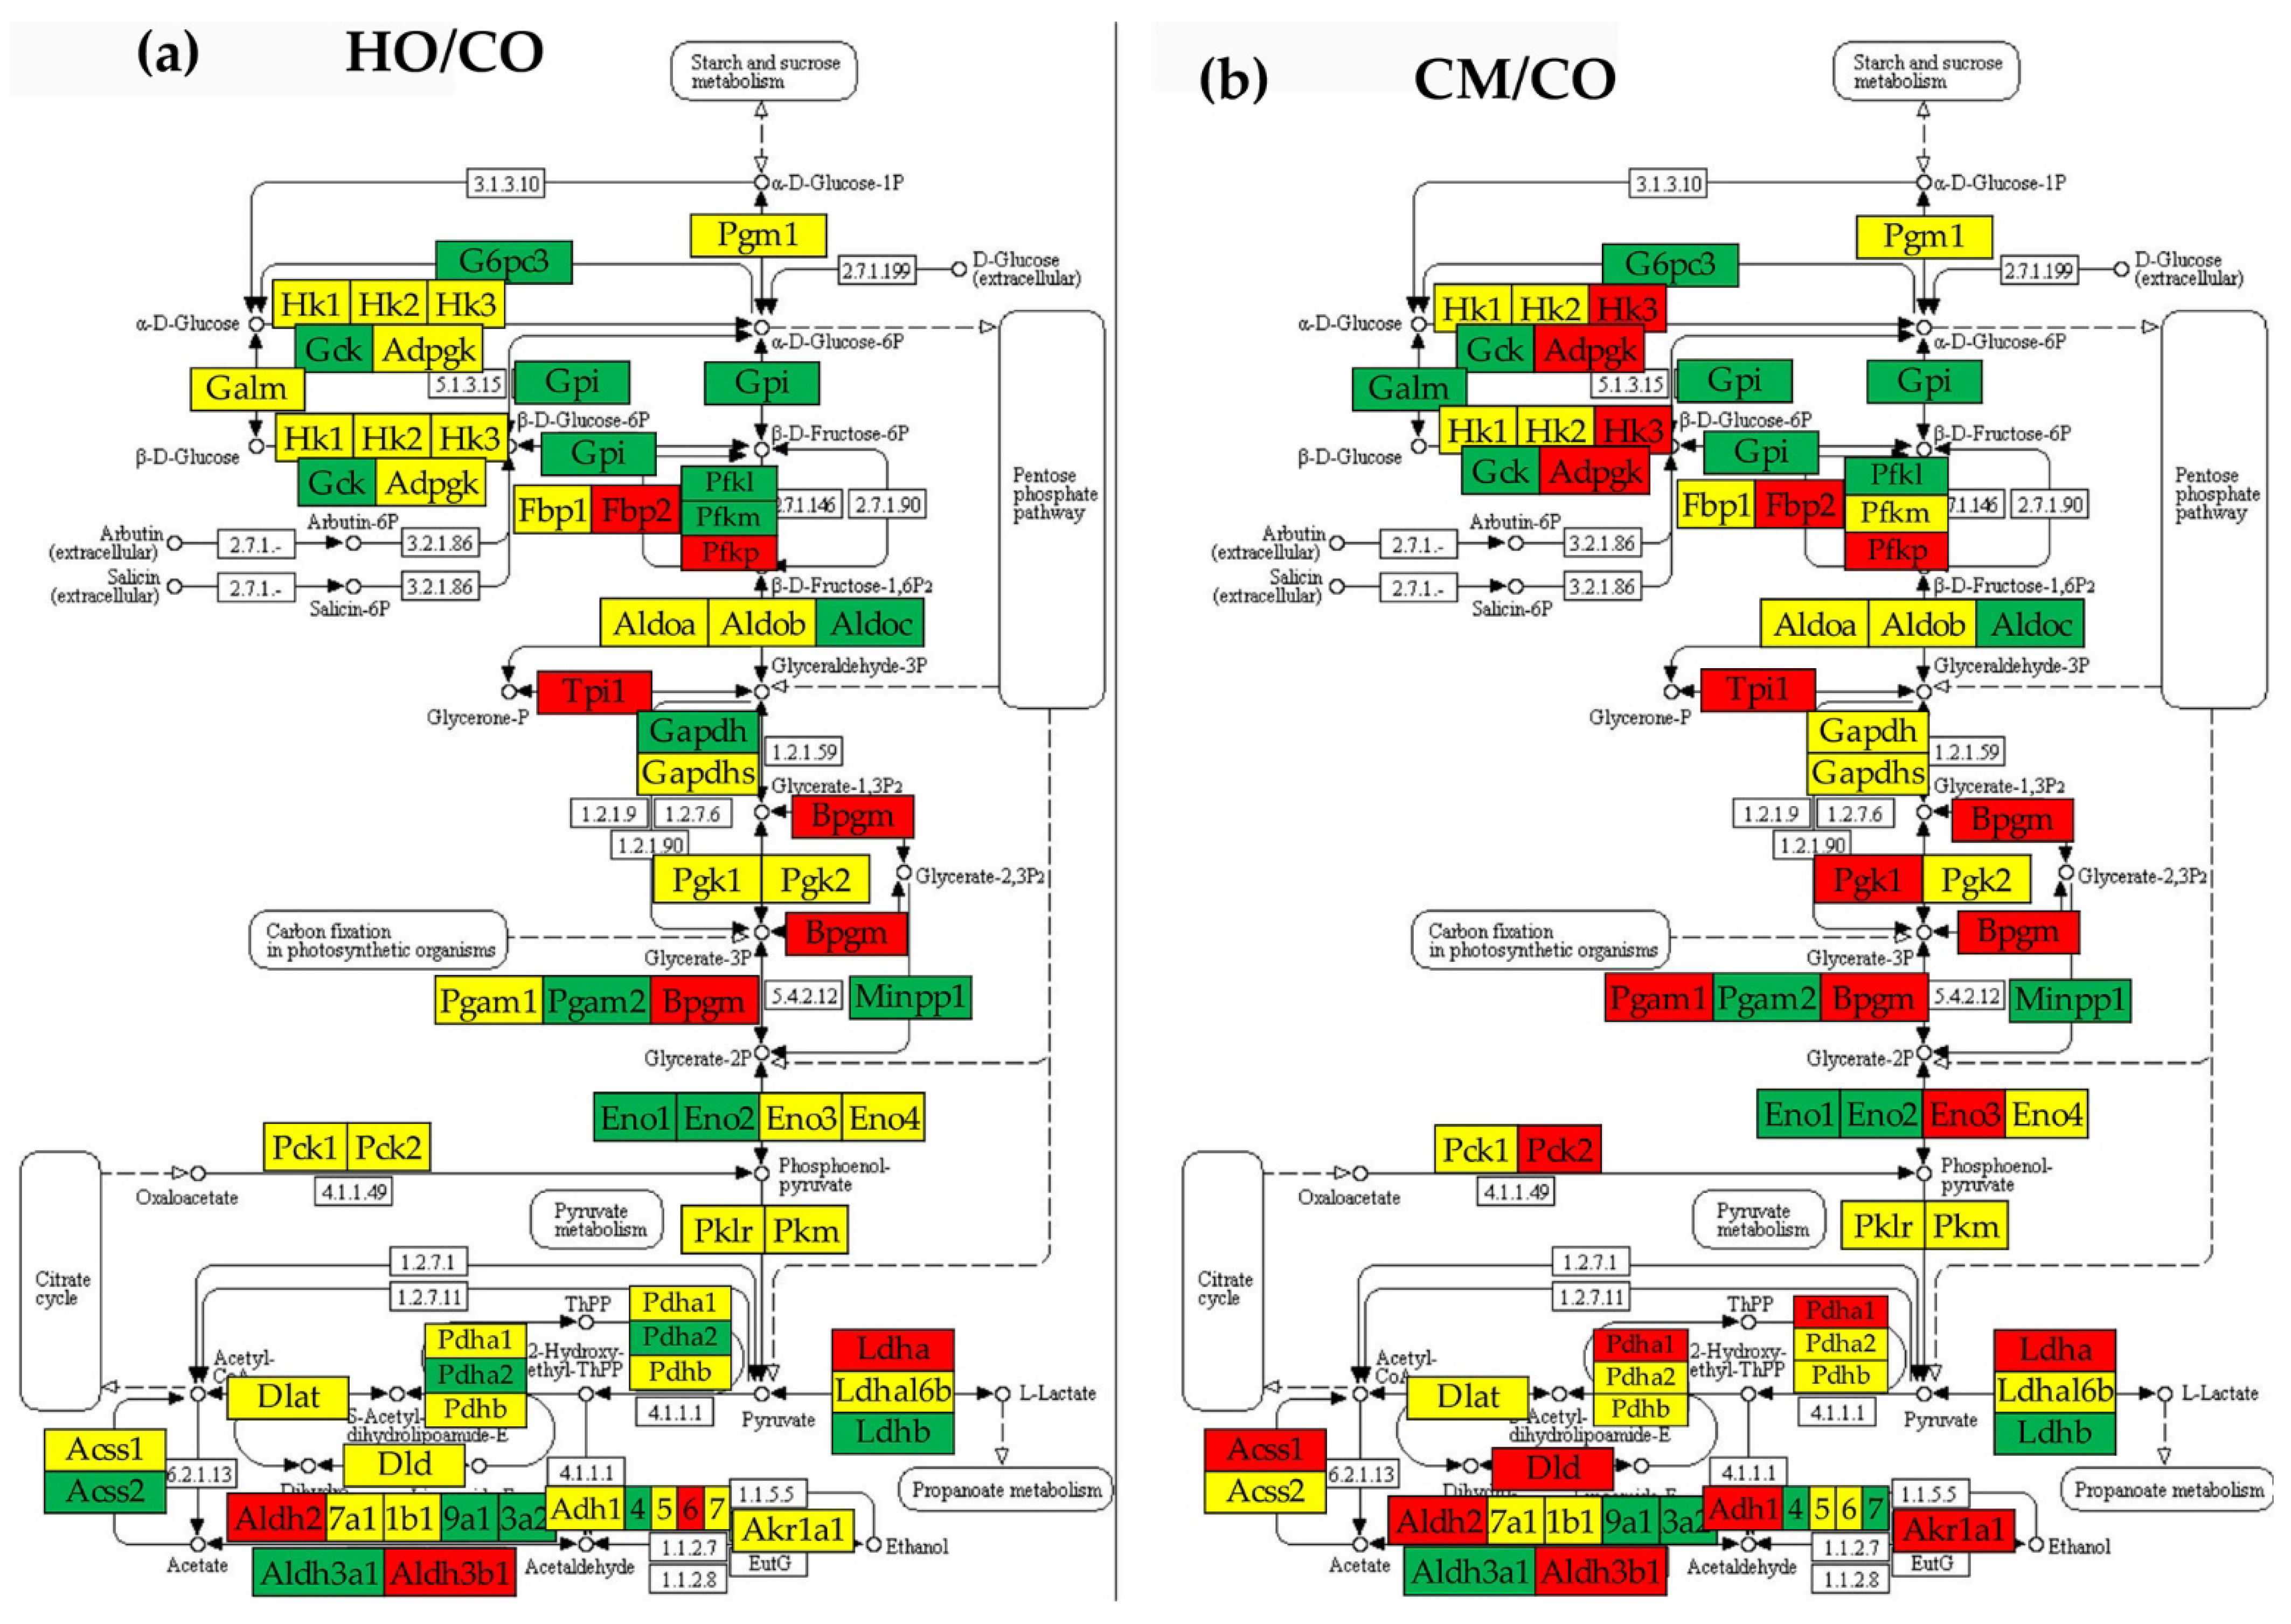
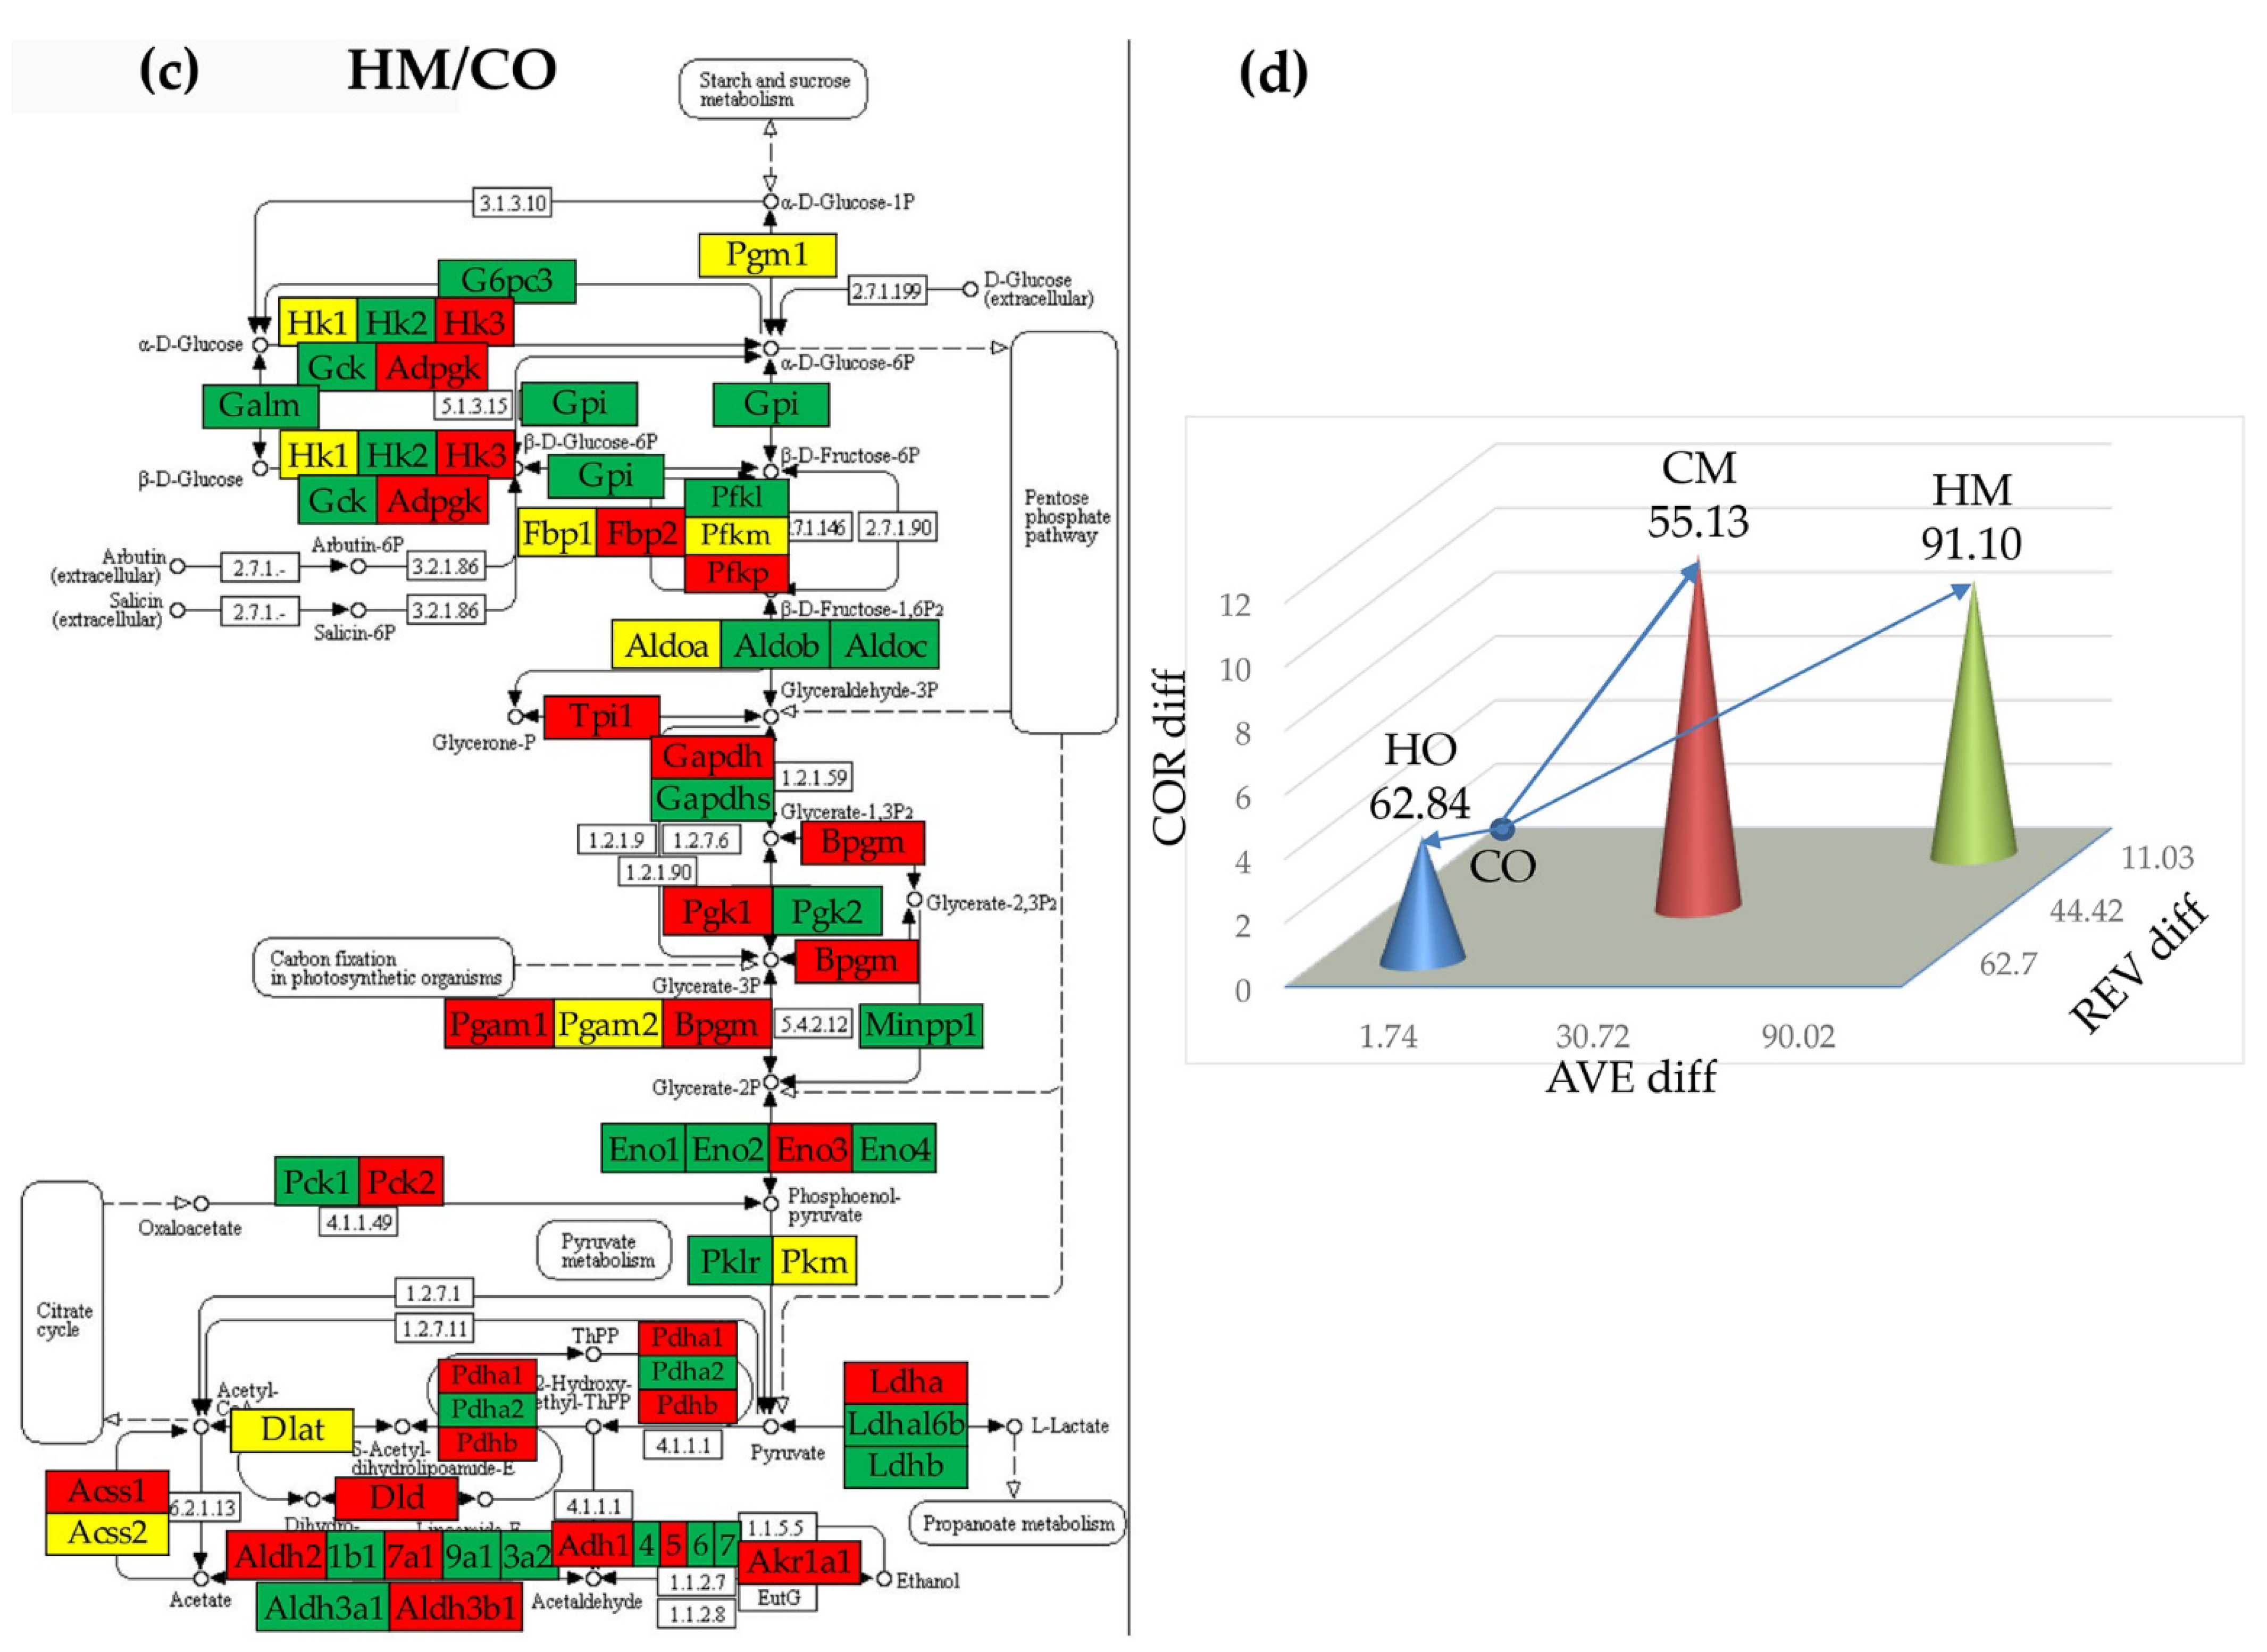
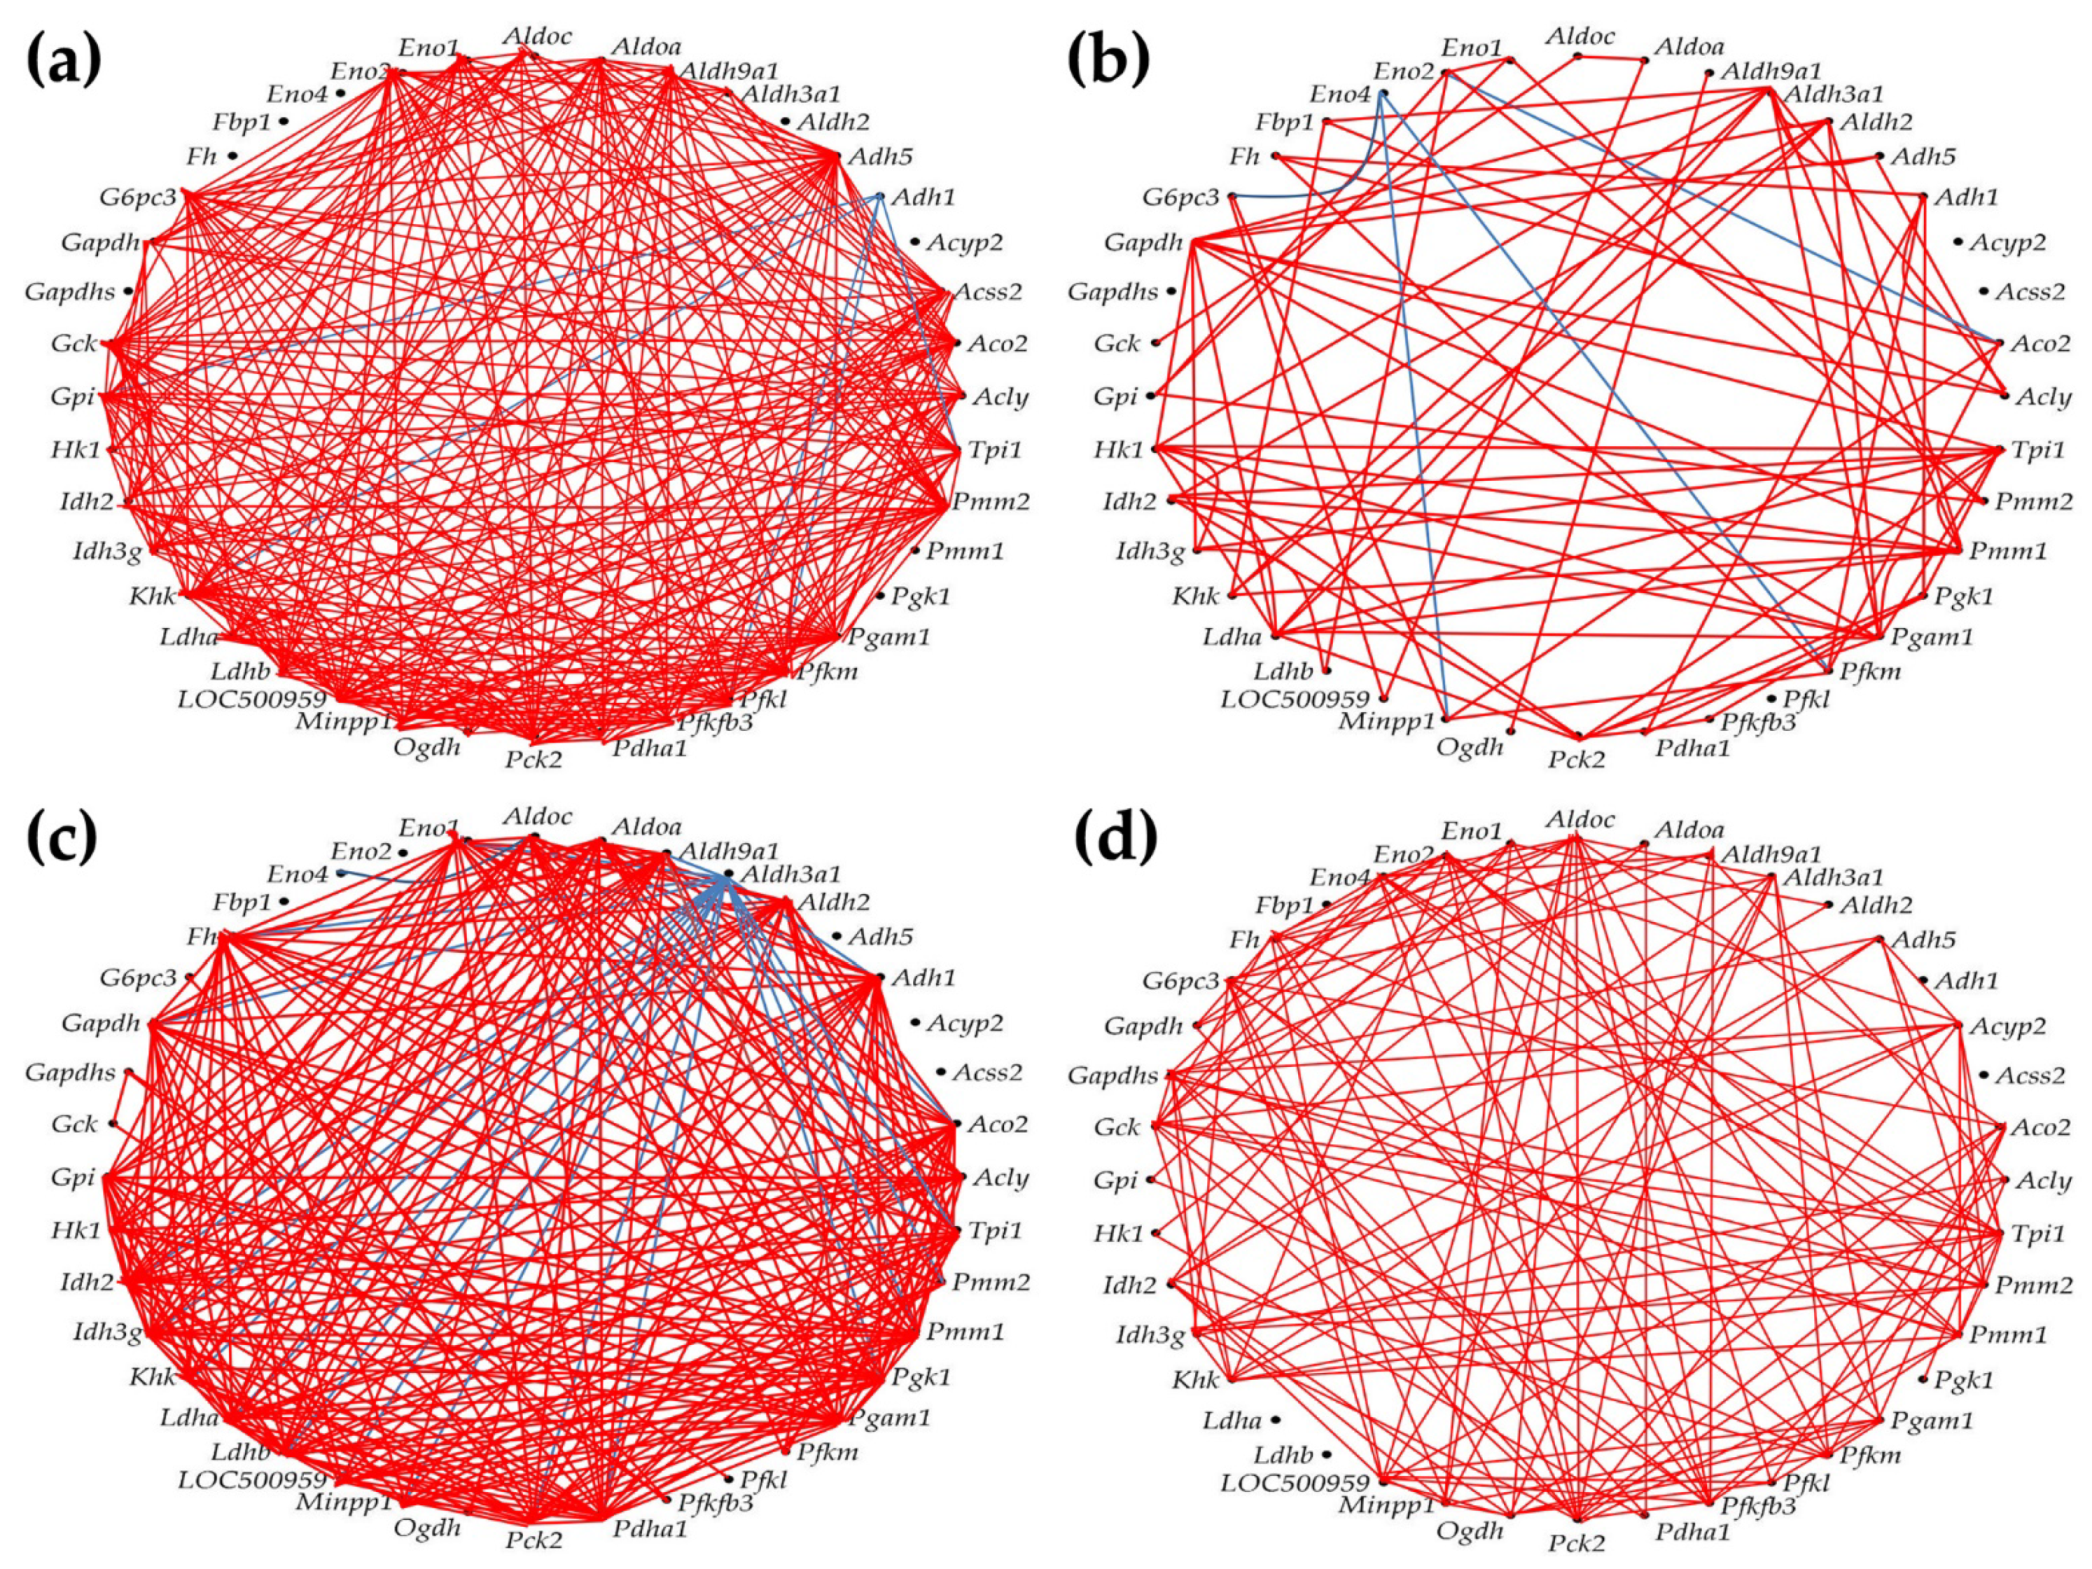
3.7. Regulation of Glycolysis-Gluconeogenesis
3.8. Remodeling of the Metabolic Genes Network
4. Discussion
5. Conclusions
Author Contributions
Funding
Institutional Review Board Statement
Data Availability Statement
Conflicts of Interest
References
- D’Alonzo, G.E.; Barst, R.J.; Ayers, S.M.; Bergofsky, E.H.; Brundage, B.H.; Detre, K.M.; Fishman, A.P.; Goldring, R.M.; Groves, B.M.; Kernis, J.T.; et al. Survival in patients with primary pulmonary hypertension. Results from a national prospective registry. Ann Intern Med 1991, 115, 343–349. [Google Scholar] [CrossRef]
- Thenappan, T.; Shah, S.J.; Rich, S.; Tian, L.; Archer, S.L.; Gomberg-Maitland, M. Survival in pulmonary arterial hypertension: a reappraisal of the NIH risk stratification equation. Eur Respir J. 2010, 35, 1079–1087. [Google Scholar] [CrossRef]
- Humbert, M.; Sitbon, O.; Chaouat, A.; Bertocchi, M.; Habib, G.; Gressin, V.; Yaïci, A.; Weitzenblum, E.; Cordier, J.F.; Chabot, F.; et al. Survival in patients with idiopathic, familial and anorexigen-associated pulmonary arterial hypertension in modern management era. Circulation. 2010, 122, 156–163. [Google Scholar] [CrossRef]
- Simonneau, G.; Montani, D.; Celermajer, D.S.; Denton, C.P.; Gatzoulis, M.A.; Krowka, M.; Williams, P.G.; Souza, R. Haemodynamic definitions and updated clinical classification of pulmonary hypertension. Eur Respir J. 2019, 53, 1801913. [Google Scholar] [CrossRef] [PubMed]
- Mathew, R.; Gewitz, M.H. Pulmonary hypertension in infancy and childhood. Heart Dis 2000, 2, 362–368. [Google Scholar]
- Huang, J.; Wolk, J.H.; Gewitz, M.H.; Mathew, R. Caveolin-1 expression during the progression of pulmonary hypertension. Exp Biol Med. 2012, 237, 956–965. [Google Scholar] [CrossRef] [PubMed]
- Huang, J.; Wolk, J.H.; Gewitz, M.H.; Loyd, J.E.; West, J.; Austin, E.D.; Mathew, R. Enhanced caveolin-1 expression in smooth muscle cells: Possible prelude to neointima formation. World J Cardiol. 2015, 7, 671–684. [Google Scholar] [CrossRef]
- Huang, J.; Mathew, R. Loss of Cavin1 and Expression of p-Caveolin-1 in Pulmonary Hypertension: Possible role in neointima formation. World J Hypertens 2019, 9, 17–29. [Google Scholar] [CrossRef]
- Thyberg, J. Differences in caveolae dynamics in vascular smooth muscle cells of different phenotypes. Lab Invest 2000, 80, 915–929. [Google Scholar] [CrossRef] [PubMed]
- Ajduković, J. HIF-1 — A big chapter in cancer tale. Experimental Oncology 2016, 38, 9–12. [Google Scholar] [CrossRef]
- Ryan, J.; Dasgupta, A.; Huston, J.; Chen, K.H.; Archer, S.L. Mitochondrial dynamics in pulmonary arterial hypertension. J. Mol Med (Berl) 2015, 93, 229–242. [Google Scholar] [CrossRef]
- Shiroto, T.; Romero, N.; Sugiyama, T.; Sartoretto, J.L.; Kalwa, H.; Yan, Z.; Shimokawa, H.; Michel, T. Caveolin-1 Is a Critical Determinant of Autophagy, Metabolic Switching, and Oxidative Stress in Vascular Endothelium. PLoS one. 2014, 9, e87871. [Google Scholar] [CrossRef]
- Vallejo, J.; Hardin, C.D. Metabolic organization in vascular smooth muscle: distribution and localization of caveolin-1 and phosphofructokinase. Am J Physiol Cell Physiol 2004, 286, C43–C54. [Google Scholar] [CrossRef]
- Xiao, H.; Wang, J.; Yan, W.; Cui, Y.; Chen, Z.; Gao, X.; Wen, X.; Chen, J. GLUT1 regulates cell glycolysis and proliferation in prostate cancer. Prostate 2018, 78, 86–94. [Google Scholar] [CrossRef]
- Huang, J.; Frid, M.; Gewitz, M.G.; Fallon, J.T.; Brown, D.; Krafsur, G.; Stenmark, K.; Mathew, R. Hypoxia-induced pulmonary hypertension and chronic lung disease: caveolin-1 dysfunction an important underlying feature. Pulm Circ. 2019, 9, 2045894019837876. [Google Scholar] [CrossRef] [PubMed]
- Morani, F.; Phadngam, S.; Follo, C.; Titone, R.; Aimaretti, G.; Galetto, A.; Alabiso, O.; Isidoro, C. PTEN regulates plasma membrane expression of glucose transporter 1 and glucose uptake in thyroid cancer cells. J Mol Endocrinol. 2014, 53, 247–258. [Google Scholar] [CrossRef] [PubMed]
- Xia, H.; Khalil, W.; Kahm, J.; Jessurun, J.; Kleidon, J.; Henke, C.A. Pathologic Caveolin-1 Regulation of PTEN in Idiopathic Pulmonary Fibrosis. Am J Pathol 2010, 176, 2010. [Google Scholar] [CrossRef] [PubMed]
- Hayes, J.D.; Dinkova-Kostova, A.T. The Nrf2 regulatory network provides an interface between redox and intermediary metabolism. Trends Biochem Sci. 2014, 39, 199–2181. [Google Scholar] [CrossRef] [PubMed]
- Li, W.; Liu, H.; Zhou, J.S.; Cao, J.F.; Zhou, X.B.; Choi, A.M.K.; Chen, Z.H.; Shen, H.H. Caveolin-1 Inhibits Expression of Antioxidant Enzymes through Direct Interaction with Nuclear Erythroid 2 p45-related Factor-2 (Nrf2). J Biol Chem 2012, 287, 20922–20930. [Google Scholar] [CrossRef]
- Taguchi, K.; Yamamoto, M. The KEAP1-NRF2 System in Cancer. Front. Oncol. 2017, 7, 85. [Google Scholar] [CrossRef] [PubMed]
- Panda, H.; Wen, H.; Suzuki, M.; Yamamoto, M. Multifaceted Roles of the KEAP1–NRF2 System in Cancer and Inflammatory Disease Milieu. Antioxidants 2022, 11, 538. [Google Scholar] [CrossRef]
- Rojo, A.I.; Rada, P.; Mendiola, M.; Ortega-Molina, A.; Wojdyla, K.; Rogowska-Wrzesinska, A.; Hardisson, D.; Serrano, M.; Cuadrado, A. The PTEN/NRF2 Axis Promotes Human Carcinogenesis. Antioxidant Redox Signaling 2014, 21, 2498–2541. [Google Scholar] [CrossRef]
- Freund-Michel, V.; Dos Santos, M.C.; Guignabert, C.; Montani, D.; Phan, C.; Fl Coste, F.I.; Tu, L.; et al. Role of nerve growth factor in development and persistence of experimental pulmonary hypertension. Am J Respir Crit Care Med. 2015, 192, 342–355. [Google Scholar] [CrossRef]
- Fang, C.-N.; Tan, H.-Q.; Song, A.-B.; Jiang, N.; Liu, Q.-R.; Song, T. NGF/TrkA promotes the vitality, migration and adhesion of bone marrow stromal cells in hypoxia by regulating the Nrf2 pathway. Metab Brain Dis. 2022. [Google Scholar] [CrossRef]
- Mathew, R.; Huang, J.; Iacobas, S.; Iacobas, D.A. Pulmonary Hypertension Remodels the Genomic Fabrics of Major Functional Pathways. Genes 2020, 11, 126. [Google Scholar] [CrossRef]
- Lago-Docampo, M.; Solarat, C.; Méndez-Martínez, L.; Baloira, A.; Valverde, D. Common Variation in EDN1 Regulatory Regions Highlights the Role of PPARγ as a Key Regulator of Endothelin in vitro. Front Cardiovasc Med. 2022, 25, 823133. [Google Scholar] [CrossRef]
- Castillo-Galán, S.; Riquelme, B.; Iturriaga, R. Crucial Role of Stromal Interaction Molecule-Activated TRPC-ORAI Channels in Vascular Remodeling and Pulmonary Hypertension Induced by Intermittent Hypoxia. Front Physiol. 2022, 13, 841828. [Google Scholar] [CrossRef]
- Thomas, S.; Manivannan, S.; Garg, V.; Lilly, B. Single-Cell RNA Sequencing Reveals Novel Genes Regulated by Hypoxia in the Lung Vasculature. J Vasc Res. 2022, 16, 1–13. [Google Scholar] [CrossRef]
- Iacobas, D.A. Biomarkers, Master Regulators and Genomic Fabric Remodeling in a Case of Papillary Thyroid Carcinoma. Genes 2020, 11, 1030. [Google Scholar] [CrossRef]
- Iacobas, S.; Amuzescu, B.; Iacobas, D.A. Transcriptomic uniqueness and commonality of the ion channels and transporters in the four heart chambers. Sci Rep 2021, 11, 2743. [Google Scholar] [CrossRef]
- Iacobas, D.A.; Iacobas, S.; Lee, P.R.; Cohen, J.E.; Fields, R.D. Coordinated Activity of Transcriptional Networks Responding to the Pattern of Action Potential Firing in Neurons. Genes 2019, 10, 754. [Google Scholar] [CrossRef]
- Victorino, P.H.; Marra, C.; Iacobas, D.A.; Iacobas, S.; Spray, D.C.; Linden, R.; Adesse, D.; Petrs-Silva, H. Retinal Genomic Fabric Remodeling after Optic Nerve Injury. Genes 2021, 12, 403. [Google Scholar] [CrossRef]
- Qiagen Ingenuity Pathway Analysis. Available online: https://digitalinsights.qiagen.com/products-overview/discovery-insights-portfolio/analysis-and-visualization/qiagen-ipa/.
- DAVID Functional Annotation Bioinformatics Microarray Analysis. Available online: https://david.ncifcrf.gov.
- Kyoto Encyclopedia of Genes and Genomes. Available online: https://www.kegg.jp/kegg/pathway.html.
- Chemokine signaling pathway. Available online: https://www.genome.jp/kegg-bin/show_pathway?rno04062.
- Ramirez-Carrozzi, V.; Ota, N.; Sambandam, A.; Wong, K.; Hackney, J.; Martinez-Martin, N.; Ouyang, W.; Pappu, R. Cutting Edge: IL-17B Uses IL-17RA and IL-17RB to Induce Type 2 Inflammation from Human Lymphocytes. J Immunol. 2019, 202, 1935–1941. [Google Scholar] [CrossRef]
- Iacobas, S.; Iacobas, D.A. A Personalized Genomics Approach of the Prostate Cancer. Cells 2021, 10, 1644. [Google Scholar] [CrossRef]
- Iacobas, D.A.; Wen, J.; Iacobas, S.; Putterman, C.; Schwartz, N. TWEAKing the Hippocampus: The Effects of TWEAK on the Genomic Fabric of the Hippocampus in a Neuropsychiatric Lupus Mouse Model. Genes 2021, 12, 1172. [Google Scholar] [CrossRef]
- Iacobas, S.; Ede, N.; Iacobas, D.A. The Gene Master Regulators (GMR) Approach Provides Legitimate Targets for Personalized, Time-Sensitive Cancer Gene Therapy. Genes 2019, 10, 560. [Google Scholar] [CrossRef]
- Glycolisis/glucogenesis pathway. Available online: https://www.genome.jp/kegg-bin/show_pathway?rno00010.
- Fructose and manose metabolism. Available online: https://www.genome.jp/kegg-bin/show_pathway?rno00051.
- Pyruvate metabolism. Available online: https://www.genome.jp/kegg-bin/show_pathway?rno00620.
- Iacobas, D.A.; Xi, L. Theory and Applications of the (Cardio) Genomic Fabric Approach to Post-Ischemic and Hypoxia-Induced Heart Failure. J. Pers. Med. 2022, 12, 1246. [Google Scholar] [CrossRef]
- Guo, Y.; Zhang, C.; Ye, T.; Chen, X.; Liu, X.; Chen, X.; Sun, Y.; Qu, C.; Liang, J.; Shi, S.; et al. Pinocembrin ameliorates arrhythmias in rats with chronic ischaemic heart failure. Ann Med. 2021, 53, 830–840. [Google Scholar] [CrossRef]
- Chang, S.D.; Lin, Y.H.; Liang, C.C.; Chen, T.C. Effects of sacral nerve stimulation on postpartum urinary retention-related changes in rat bladder. Taiwan J Obstet Gynecol. 2015, 54, 671–677. [Google Scholar] [CrossRef]
- Qin, Y.; Qiao, Y.; Wang, D.; Li, L.; Li, M.; Yan, G.; Tang, C. Target Nuclear Factor Erythroid 2-Related Factor 2 in Pulmonary Hypertension: Molecular Insight into Application. Oxid Med Cell Longev. 2022, 2022, 7845503. [Google Scholar] [CrossRef]
- Li, W.; Chen, W.; Peng, H.; Xiao, Z.; Liu, J.; Zeng, Y.; Huang, T.; Song, Q.; Wang, X.; Xiao, Y. Shikonin improves pulmonary vascular remodeling in monocrotaline-induced pulmonary arterial hypertension via regulation of PKM2. Mol Med Rep. 2023, 27, 60. [Google Scholar] [CrossRef] [PubMed]
- Bekedam, F.T.; Goumans, M.J.; Bogaard, H.J.; de Man, F.S.; Llucià-Valldeperas, A. Molecular mechanisms and targets of right ventricular fibrosis in pulmonary hypertension. Pharmacol Ther. 2023, 244, 108389. [Google Scholar] [CrossRef] [PubMed]
- Smolders, V.F.E.D.; Rodríguez, C.; Blanco, I.; Szulcek, R.; Timens, W.; Piccari, L.; Roger, Y.; Hu, X.; Morén, C.; Bonjoch, C.; et al. Metabolic profile in endothelial cells of chronic thromboembolic pulmonary hypertension and pulmonary arterial hypertension. Sci Rep. 2022, 12, 2283. [Google Scholar] [CrossRef]
- Hoffmann-Vold, A.M.; Hesselstrand, R.; Fretheim, H.; Ueland, T.; Andreassen, A.K.; Brunborg, C.; Palchevskiy, V.; Midtvedt, Ø.; Garen, T.; Aukrust, P.; et al. CCL21 as a Potential Serum Biomarker for Pulmonary Arterial Hypertension in Systemic Sclerosis. Arthritis Rheumatol. 2018, 70, 1644–1653. [Google Scholar] [CrossRef]
- Zhou, R.P.; Wei, X.; Ma, G.G.; Zhu, F.; Chen, F.H.; Hu, W. Questions Regarding the Value of CCL21 as a Potential Biomarker for Pulmonary Arterial Hypertension in Systemic Sclerosis: Comment on the Article by Hoffmann-Vold et al. Arthritis Rheumatol. 2019, 71, 653–654. [Google Scholar] [CrossRef] [PubMed]
- Cao, Y.; Zhang, X.; Wang, L.; Yang, Q.; Ma, Q.; Xu, J.; Wang, J.; Kovacs, L.; Ayonm, R.J.; Liu, Z.; et al. PFKFB3-mediated endothelial glycolysis promotes pulmonary hypertension. Proc Natl Acad Sci USA 2019, 116, 13394–13403. [Google Scholar] [CrossRef] [PubMed]
- Barnett, S.D.; Buxton, I.L.O. The role of S-nitrosoglutathione reductase (GSNOR) in human disease and therapy. Crit Rev Biochem Mol Biol. 2017, 52, 340–354. [Google Scholar] [CrossRef]
- Smolle, E.; Leko, P.; Stacher-Priehse, E.; Brcic, L.; El-Heliebi, A.; Hofmann, L.; Quehenberger, F.; Hrzenjak, A.; Popper, H.H.; Olschewski, H.; et al. Distribution and prognostic significance of gluconeogenesis and glycolysis in lung cancer. Mol Oncol. 2020, 14, 2853–2867. [Google Scholar] [CrossRef]
- Pirard, M.; Achouri, Y.; Collet, J.F.; Schollen, E.; Matthijs, G.; Van Schaftingen, E. Kinetic properties and tissular distribution of mammalian phosphomannomutase isozymes. Biochem J. 1999, 339, 201–207. [Google Scholar] [CrossRef]
- Voulgaridou, G.P.; Theologidis, V.; Xanthis, V.; Papagiannaki, E.; Tsochantaridis, I.; Fadouloglou, V.E.; Pappa, A. Identification of a peptide ligand for human ALDH3A1 through peptide phage display: Prediction and characterization of protein interaction sites and inhibition of ALDH3A1 enzymatic activity. Front Mol Biosci. 2023, 10, 1161111. [Google Scholar] [CrossRef]
- Tan, R.; Li, J.; Peng, X.; Zhu, L.; Cai, L.; Wang, T.; Su, Y.; Irani, K.; Hu, Q. GAPDH is critical for superior efficacy of female bone marrow-derived mesenchymal stem cells on pulmonary hypertension. Cardiovasc Res. 2013, 100, 19–27. [Google Scholar] [CrossRef] [PubMed]
Disclaimer/Publisher’s Note: The statements, opinions and data contained in all publications are solely those of the individual author(s) and contributor(s) and not of MDPI and/or the editor(s). MDPI and/or the editor(s) disclaim responsibility for any injury to people or property resulting from any ideas, methods, instructions or products referred to in the content. |
© 2023 by the authors. Licensee MDPI, Basel, Switzerland. This article is an open access article distributed under the terms and conditions of the Creative Commons Attribution (CC BY) license (http://creativecommons.org/licenses/by/4.0/).


