Submitted:
27 April 2023
Posted:
28 April 2023
You are already at the latest version
Abstract
Keywords:
1. Introduction
2. Materials and Methods
3. Results
5. Conclusions
Author Contributions
Funding
Institutional Review Board Statement
Informed Consent Statement
Data Availability Statement
Conflicts of Interest
References
- Gouasmia, T.; Loudjani, N.; Boulkra, M.; Benchiheub, M.; Belakroum, K.; Bououdina, M. Morphology, structural and microstructural characterizations of mechanically alloyed Fe50Co40Ni10 powder mixture. Applied Physics A - Science & Processing 2022, 128, 935. [Google Scholar] [CrossRef]
- Panigrahi, M.; Avar, B. Influence of mechanical alloying on structural, thermal and magnetic properties of Fe50Ni10Co10Ti10B20 high entropy soft magnetic alloy. Journal of Materials Science - Materials in Electronics 2021, 32, 21124–21134. [Google Scholar] [CrossRef]
- Chaubey, A.K.; Konda Gokuldoss, P.; Wang, Z.; Scudino, S.; Mukhopadhyay, N.K.; Eckert, J. Effect of Particle Size on Microstructure and Mechanical Properties of Al-Based Composite Reinforced with 10 Vol.% Mechanically Alloyed Mg-7.4%Al Particles. Technologies 2016, 4, 37. [Google Scholar] [CrossRef]
- Karthiselva, N.S.; Bakshi, S.R. Reactive Spark Plasma Sintering and Mechanical Properties of Zirconium Diboride–Titanium Diboride Ultrahigh Temperature Ceramic Solid Solutions. Technologies 2016, 4, 30. [Google Scholar] [CrossRef]
- Chebli, A.; Cesnek, M.; Djekoun, A.; Suñol, J.J.; Niznansky, D. Synthesis, characterization and amorphization of mechanically alloyed Fe75Si12Ti6B7 and Fe73Si15Ti5B7 powders. Journal of Materials Science 2022, 57, 12600–12615. [Google Scholar] [CrossRef]
- Carrillo, A.; Daza, J.; Saurina, J.; Escoda, L.; Suñol, J.J. Structural, Thermal and Magnetic Analysis of Fe75Co10Nb6B9 and Fe65Co20Nb6B9 Nanostructured Alloys. Materials 2021, 14, 4542. [Google Scholar] [CrossRef]
- Yao, K.F.; Shi, L.X.; Chen, S.Q.; Shao, Y.; Chen, N.; Jia, J.L. Research progress of Fe based soft magnetic amorphous/nanocrystalline alloys. Acta Physica Sinica 2018, 58, 17–27. [Google Scholar] [CrossRef]
- Zhu, S.; Duan, F.; Ni, J.L.; Feng, S.J.; Liu, X.S.; Lv, Q.R.; Kan, X.C. Soft magnetic composites FeSiAl/MoS2 with high magnetic permeability and low magnetic loss. Journal of Alloys and Compounds 2022, 926, 166893. [Google Scholar] [CrossRef]
- Yamazaki, T.; Tomita, T.; Uji, K.; Kuwata, H.; Sano, K.; Oka, C.; Sakurai, J.; Hata, S. Combinatorial synthesis of nanocrystalline FeSiBPCuC-Ni-(Nb.;Mo) soft magnetic alloys with high corrosion resistance. Journal of Non-Crystalline Solids 2021, 563, 120808. [Google Scholar] [CrossRef]
- Miglierini, MB.; Dekan, J.; Cesnek, M.; Janotova, I.; Svev, P.; Budjos, M.; Kohout, J. Hyperfine interactions in Fe/Co-B-Sn amorphous alloys by Mossbauer spectrometry. Journal of Magnetism and Magnetic Materials 2020, 500, 6417. [Google Scholar] [CrossRef]
- Zhao, M.; Pang, J.; Zhang, Y.R.; Zhang, W.; Xiang, Q.C.; Ren, Y.L.; Li, X.Y.; Qiu, K.Q. Optimization of crystallization, microstructure and soft magnetic properties of (Fe0.83B0.11Si0.02P0.03C0.01)(99.5)Cu0.5 alloy by rapid annealing. Journal of Non-Crystalline Solids 2022, 579, 121380. [Google Scholar] [CrossRef]
- Hasiak, M.; Laszcz, A.; Zak, A.; Kaleta, J. Microstructure and Magnetic Properties of NANOPERM-Type Soft Magnetic Material. Acta Physica Polonica A 2019, 135, 284–287. [Google Scholar] [CrossRef]
- Ozturk, S.; Icin, K.; Gencturk, M.; Gobuluk, M.; Svec, P. Effect of heat treatment process on the structural and soft magnetic properties of Fe38Co38Mo8B15Cu ribbons. Journal of Non-Crystalline Solids 2020, 527, 119745. [Google Scholar] [CrossRef]
- Nishiyama, N.; Tanimoto, K.; Makino, A. Outstanding efficiency in energy conversion for electric motors constructed by nanocrystalline soft Magnetic Nanomet cores. AIP Advances 2016, 6, 055925. [Google Scholar] [CrossRef]
- Suñol, J.J.; González, A.; Saurina, J.; Escoda, L.; Bruna, P. Thermal and structural characterization of Fe-Nb-B alloys prepared by mechanical alloying. Materials Science and Engineering A 2004, 375-377, 874–880. [Google Scholar] [CrossRef]
- Taghvaei, A.H.; Bednarcik, J.; Eckert, J. Influence of annealing on microstructure and magnetic properties of cobalt-based amorphous/nanocrystalline powders synthesized by mechanical alloying. Journal of Alloys and Compounds 2015, 632, 296–302. [Google Scholar] [CrossRef]
- Daza, J.; Ben Mbarek, W.; Escoda, L.; Suñol, J.J. Characterization and analysis of nanocrystalline soft Magnetic alloys: Fe based. Metals 2021, 11, 1896. [Google Scholar] [CrossRef]
- Vyazovkin, S. Kissinger Method in Kinetics of Materials: Things to Beware and Be Aware of. Molecules 2020, 25, 2813. [Google Scholar] [CrossRef]
- Chen, F.G.; Wang, Y.G.; Mian, X.F.; Hong, H.; Bi, K. Nanocrystalline Fe83P16Cu1 soft magnetic alloy produced by crystallization of its amorphous precursor. Journal of Alloys and Compounds 2013, 549, 26–29. [Google Scholar] [CrossRef]
- Liu, Y.; Zhu, M.; Du, Y.; Yao, L.; Jian, Z. Crystallization Kinetics of the Fe68Nb6B23Mo3 Glassy Ribbons Studied by Differential Scanning Calorimetry. Crystals 2022, 12, 852. [Google Scholar] [CrossRef]
- Zhang, L.I.; Yu, P.F.; Cheng, H.; Zhang, M.D.; Liu, D.J.; Zhou, Z.; Jin, Q.; Liaw, P.K.; Li, G.; Liu, R.P. Crystallization in Fe- and Co-based amorphous alloys studied by in-situ X-ray diffraction. Metallurgical and Materials Transactions A 2016, 47. [Google Scholar] [CrossRef]
- Zhu, J.S.; Wang, Y.G.; Xia, G.T.; Dai, J.; Chen, J.K. Fe83P14.5Cu1Al1.5 partial nanocrystalline alloy obtained by one-step melt spinning method. Journal of Alloys and Compound 2016, 666. [Google Scholar] [CrossRef]
- Li, G.; Li, D.; Ni, X.; Li, Z.; Lu, Z. Effect of copper and niobium addition on crystallization kinetics in Fe-Cu-Nb-Si-B alloys. Rare Metal Materials and Engineering 2013, 42, 1352–1355. [Google Scholar] [CrossRef]
- Malow, T.R.; Koch, C.C. Grain growth in nanocrystalline iron prepared by mechanical attrition. Acta Materialia 1997, 45, 2197–2186. [Google Scholar] [CrossRef]
- Wu, X.; Li, X.; Li, S. Crystallization kinetics and soft magnetic properties of Fe71Si16B9Cu1Nb3 amorphous alloys. Materials Research Express 2020, 7, 016118. [Google Scholar] [CrossRef]
- Liu, Y.J.; Chang, I.T.H.; Lees, M.R. Thermodynamic and magnetic properties of multicomponent (Fe,Ni)70Zr10B20 amorphous alloy powders made by mechanical alloying. Materials Science and Engineering A 2001, 304-306, 992–996. [Google Scholar] [CrossRef]
- Manchanda, B.; Vimal, K.K.; Kapur, G.S.; Kant, S.; Choudhary, V. Effect of sepiolite on nonisothermal crystallization kinetics of polypropylene. Journal of Materials Science 2016, 51, 9535–9550. [Google Scholar] [CrossRef]
- Gao, Q.; Jian, Z. Kinetic study on non-isothermal crystallization of Cu50Zr50 metallic glass. Trans Indian Inst Mat. 2017, 70. [Google Scholar] [CrossRef]
- Hasani, S.; Rezaei-Shahreza, P.; Seifoddini, A. The effect of Cu minor addition on the non-isothermal kinetic of nano-crystallites formation in Fe41Co7Cr15Mo14Y2C15B6 BMG. Journal of Thermal Analysis and Calorimetry 2021, 143. [Google Scholar] [CrossRef]
- Jaafari, Z.; Seifoddini, A.; Hasani, S.; Rezaei-Shahreza, P. Kinetic analysis of crystallization process in [(Fe0.9Ni0.1)(77)Mo5P9C7.5B1.5](100-x)Cux (x=0.1at.%) BMG: Non-isothermal condition. Journal of Thermal Analysis and Calorimetry 2018, 134, 1565–1574. [Google Scholar] [CrossRef]
- Janovsky, D.; Sveda, M.; Sycheva, A.; Kristaly, F.; Zamborsky, F.; Koziel, T.; Bala, P.; Czel, G.; Kaptay, G. Amorphous alloys and differential scanning calorimetry (DSC). Journal of Thermal Analysis and Calorimetry 2022, 147, 7141–7157. [Google Scholar] [CrossRef]
- Kaloshkin, S.; Churyukanova, M.; Tcherdyntsev, V. Characterization of Magnetic Transformation at Curie Temperature in Finemet-type Microwires by DSC. MRS Online Proceedings Library 2012, 1408, 107–112. [Google Scholar] [CrossRef]
- Alleg, S.; Brahimi, A.; Azzaza, S.; Souilah, S.; Zergoug, M.; Suñol, J.J.; Greneche, J.M. X-ray diffraction, Mössbauer spectroscopy and thermal studies of the mechanically alloyed (Fe1-xMnx)2P powders. Advanced Powder Technology 2018, 29, 257–265. [Google Scholar] [CrossRef]
- González, A.; Bonastre, A.; Escoda, L.; Suñol, JJ. Thermal analysis of Fe(Co,Ni) based alloys prepared by mechanical alloying. 2007. Journal of Thermal Analysis and Calorimetry 2007, 87, 255–258. [Google Scholar] [CrossRef]
- Neamtu, B.V.; Chicinas, H.F.; Gabor, M.; Marinca, T.F.; Lupu, N.; Chicinas, I. A comparative of the Fe-based amorphous alloy prepared by mechanical alloying and rapid quenching. J Alloys & Comp. 2017, 703, 19–25. [Google Scholar] [CrossRef]
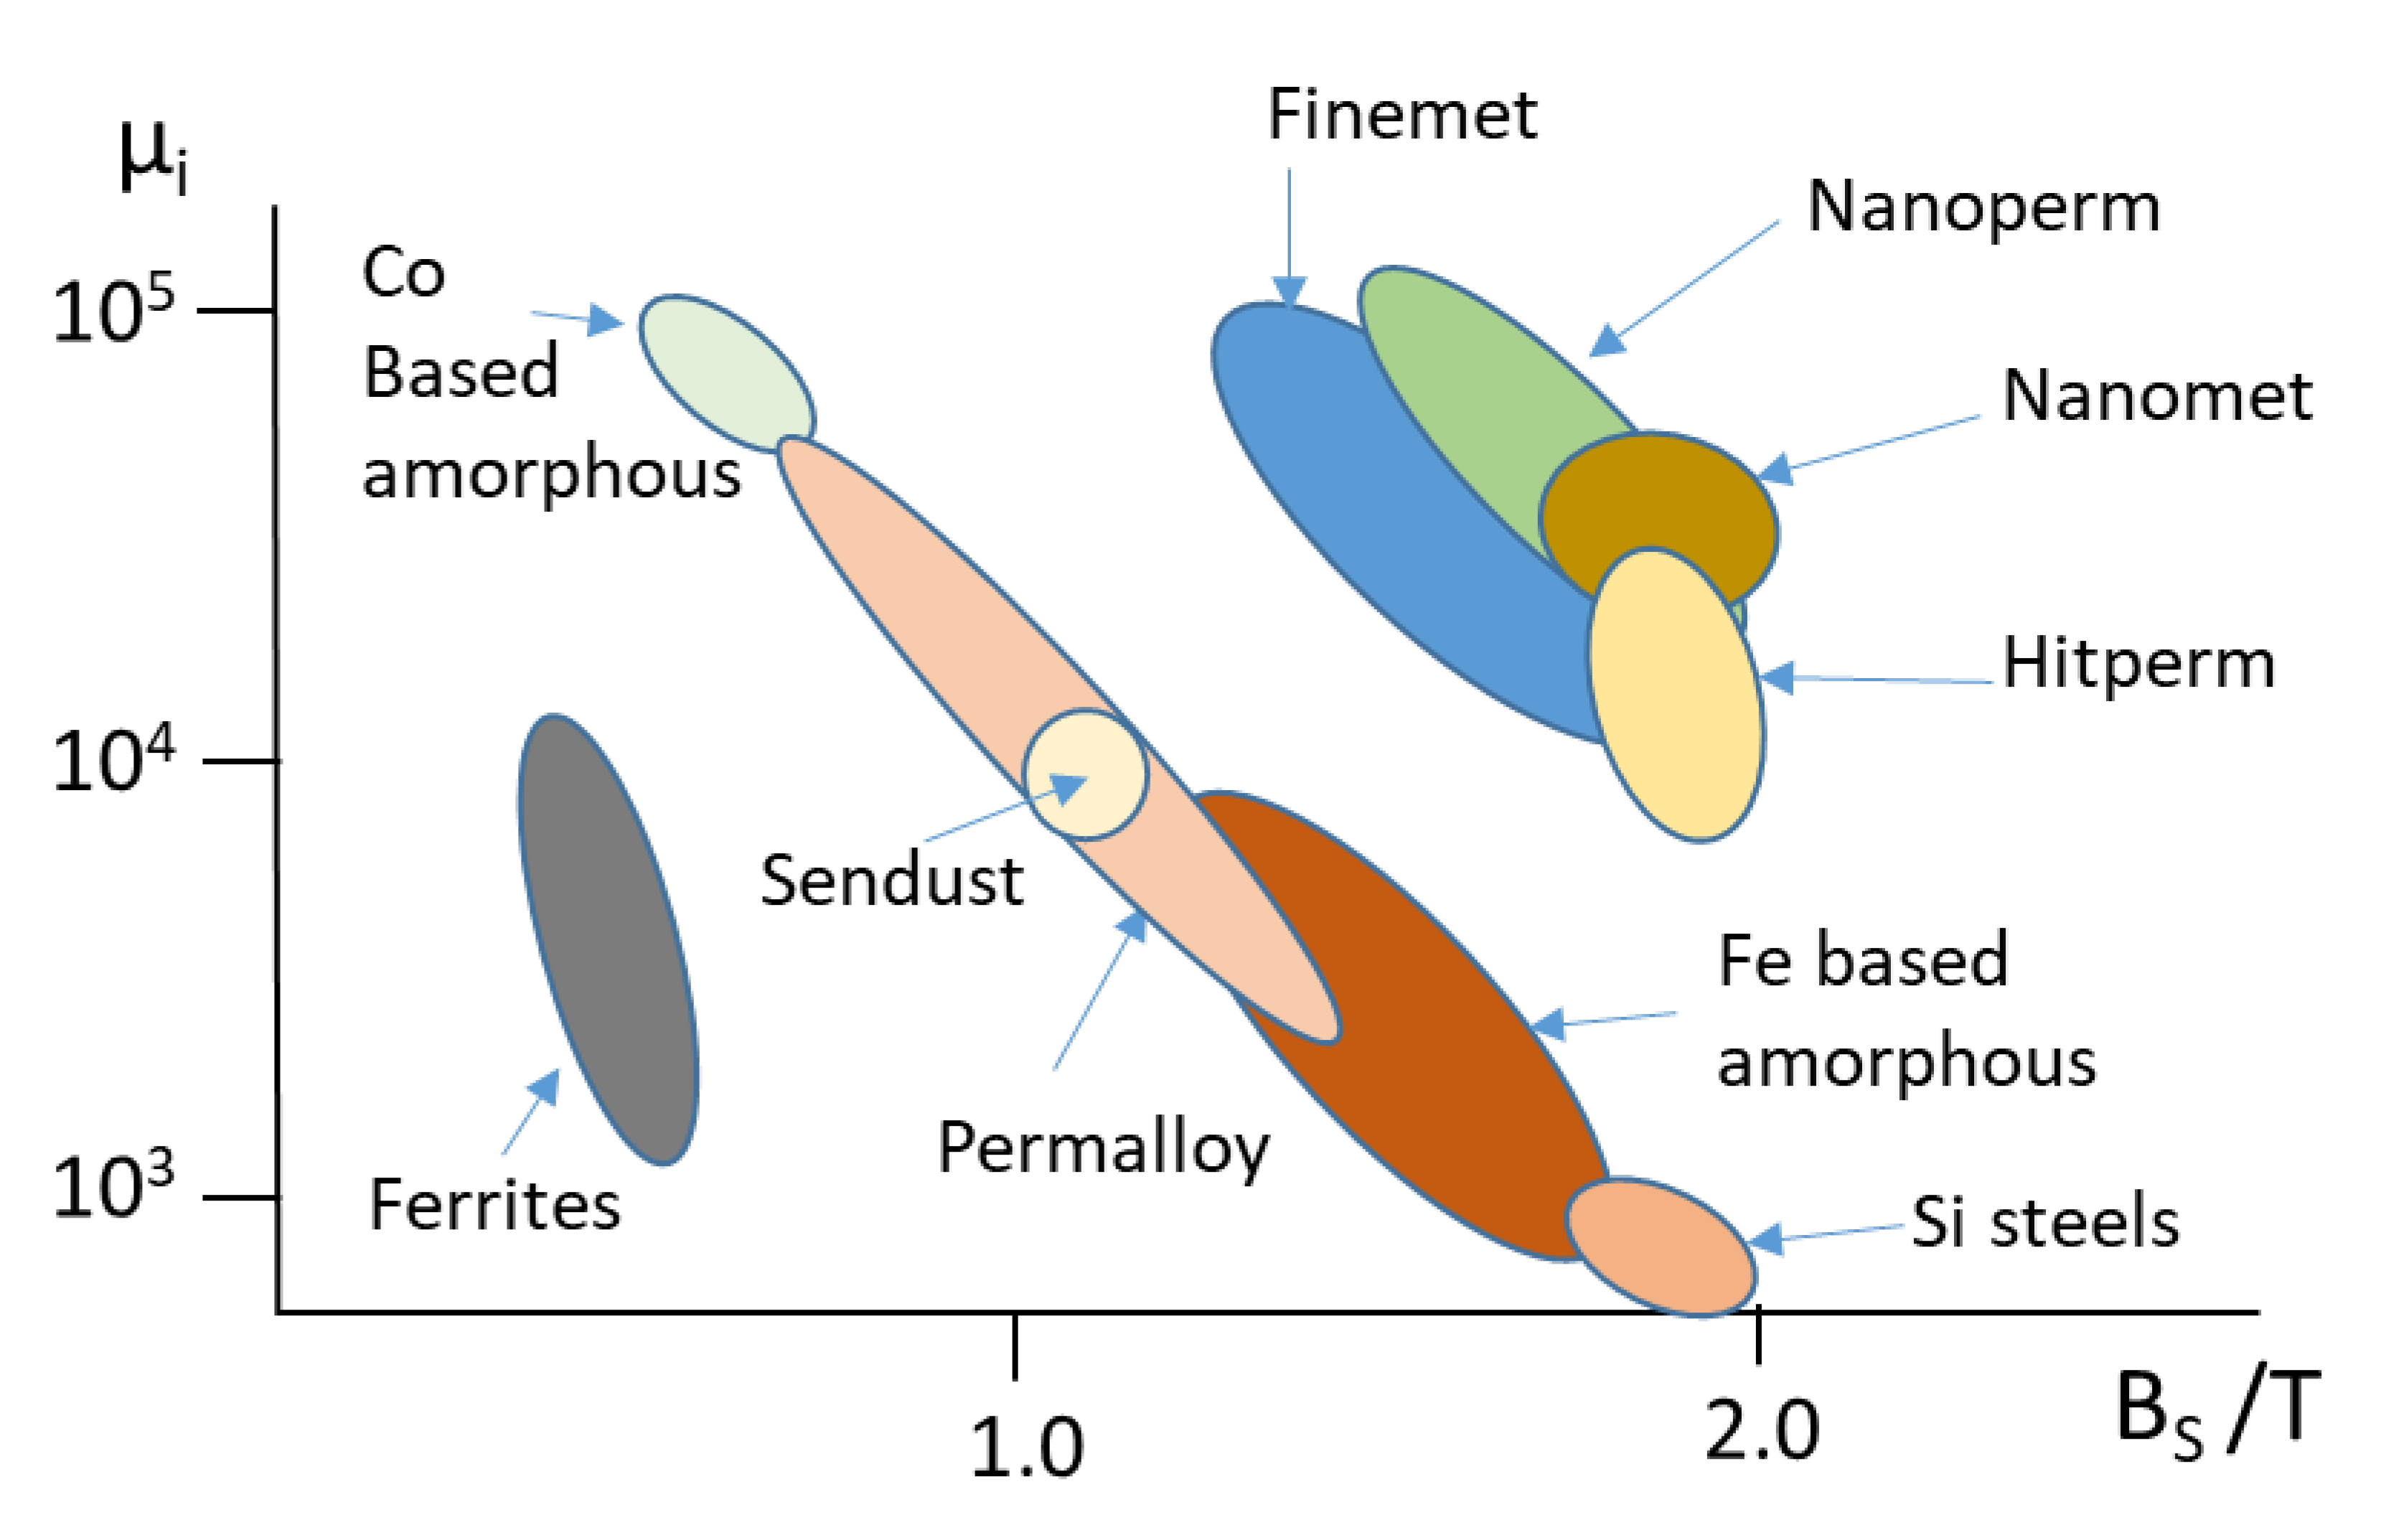
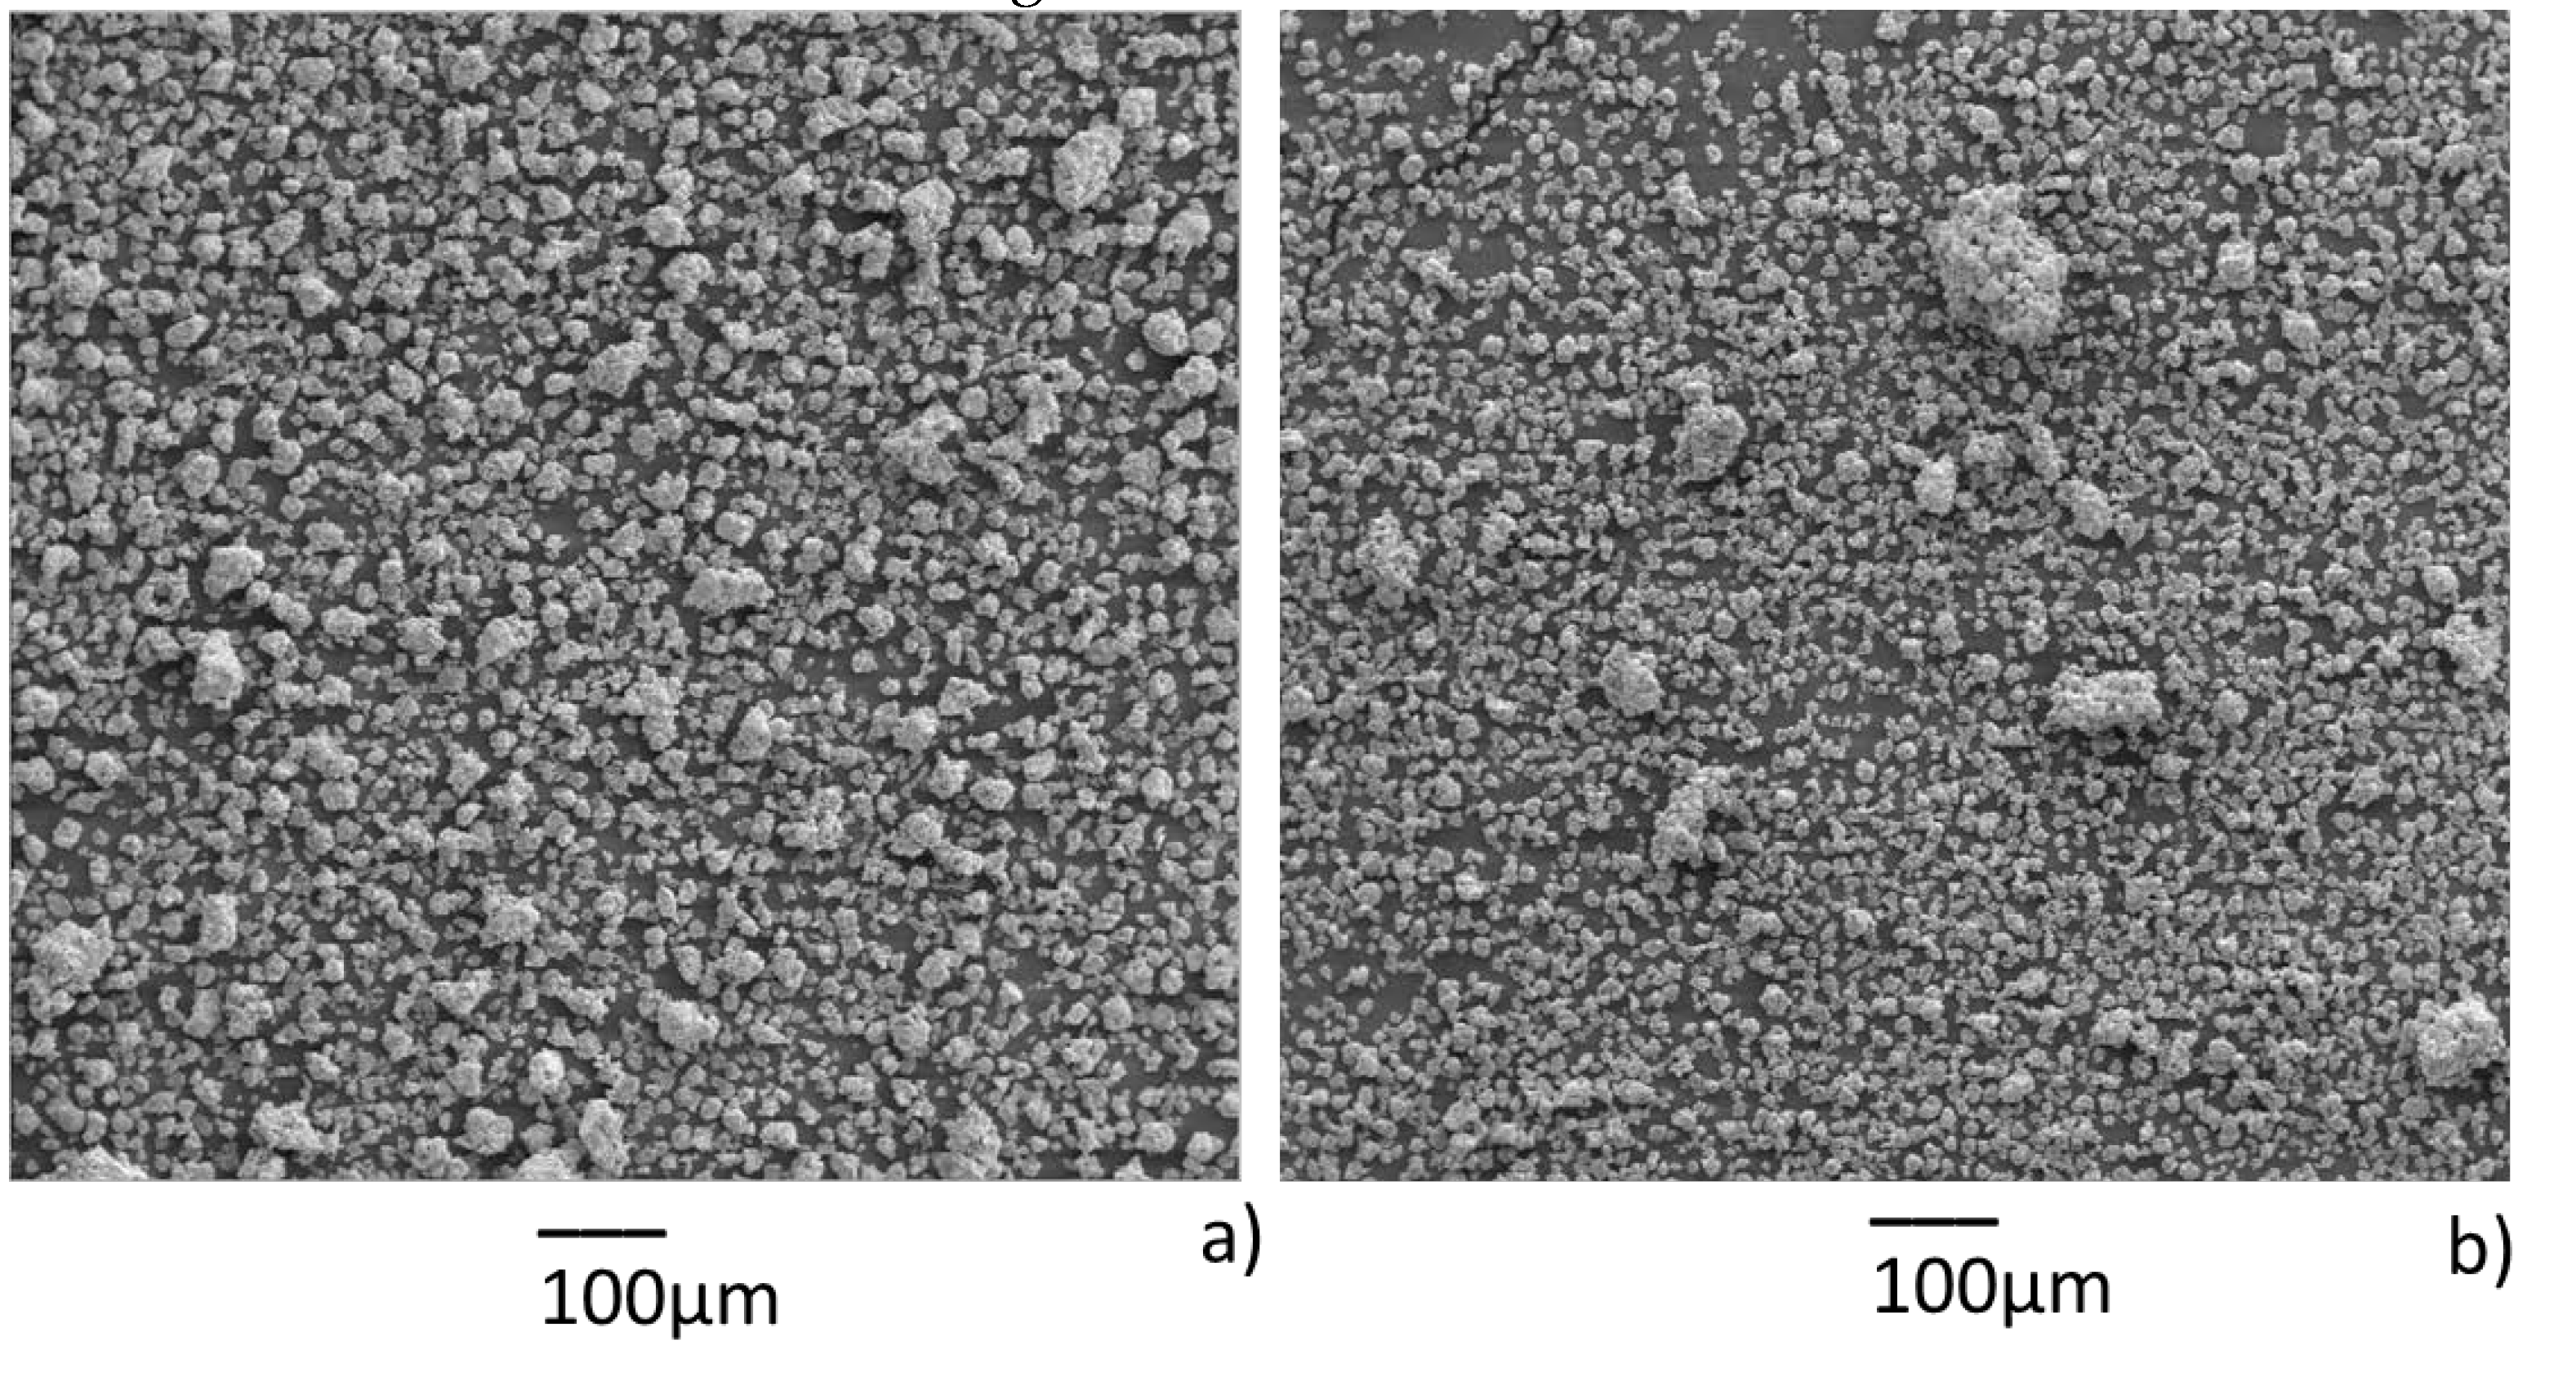
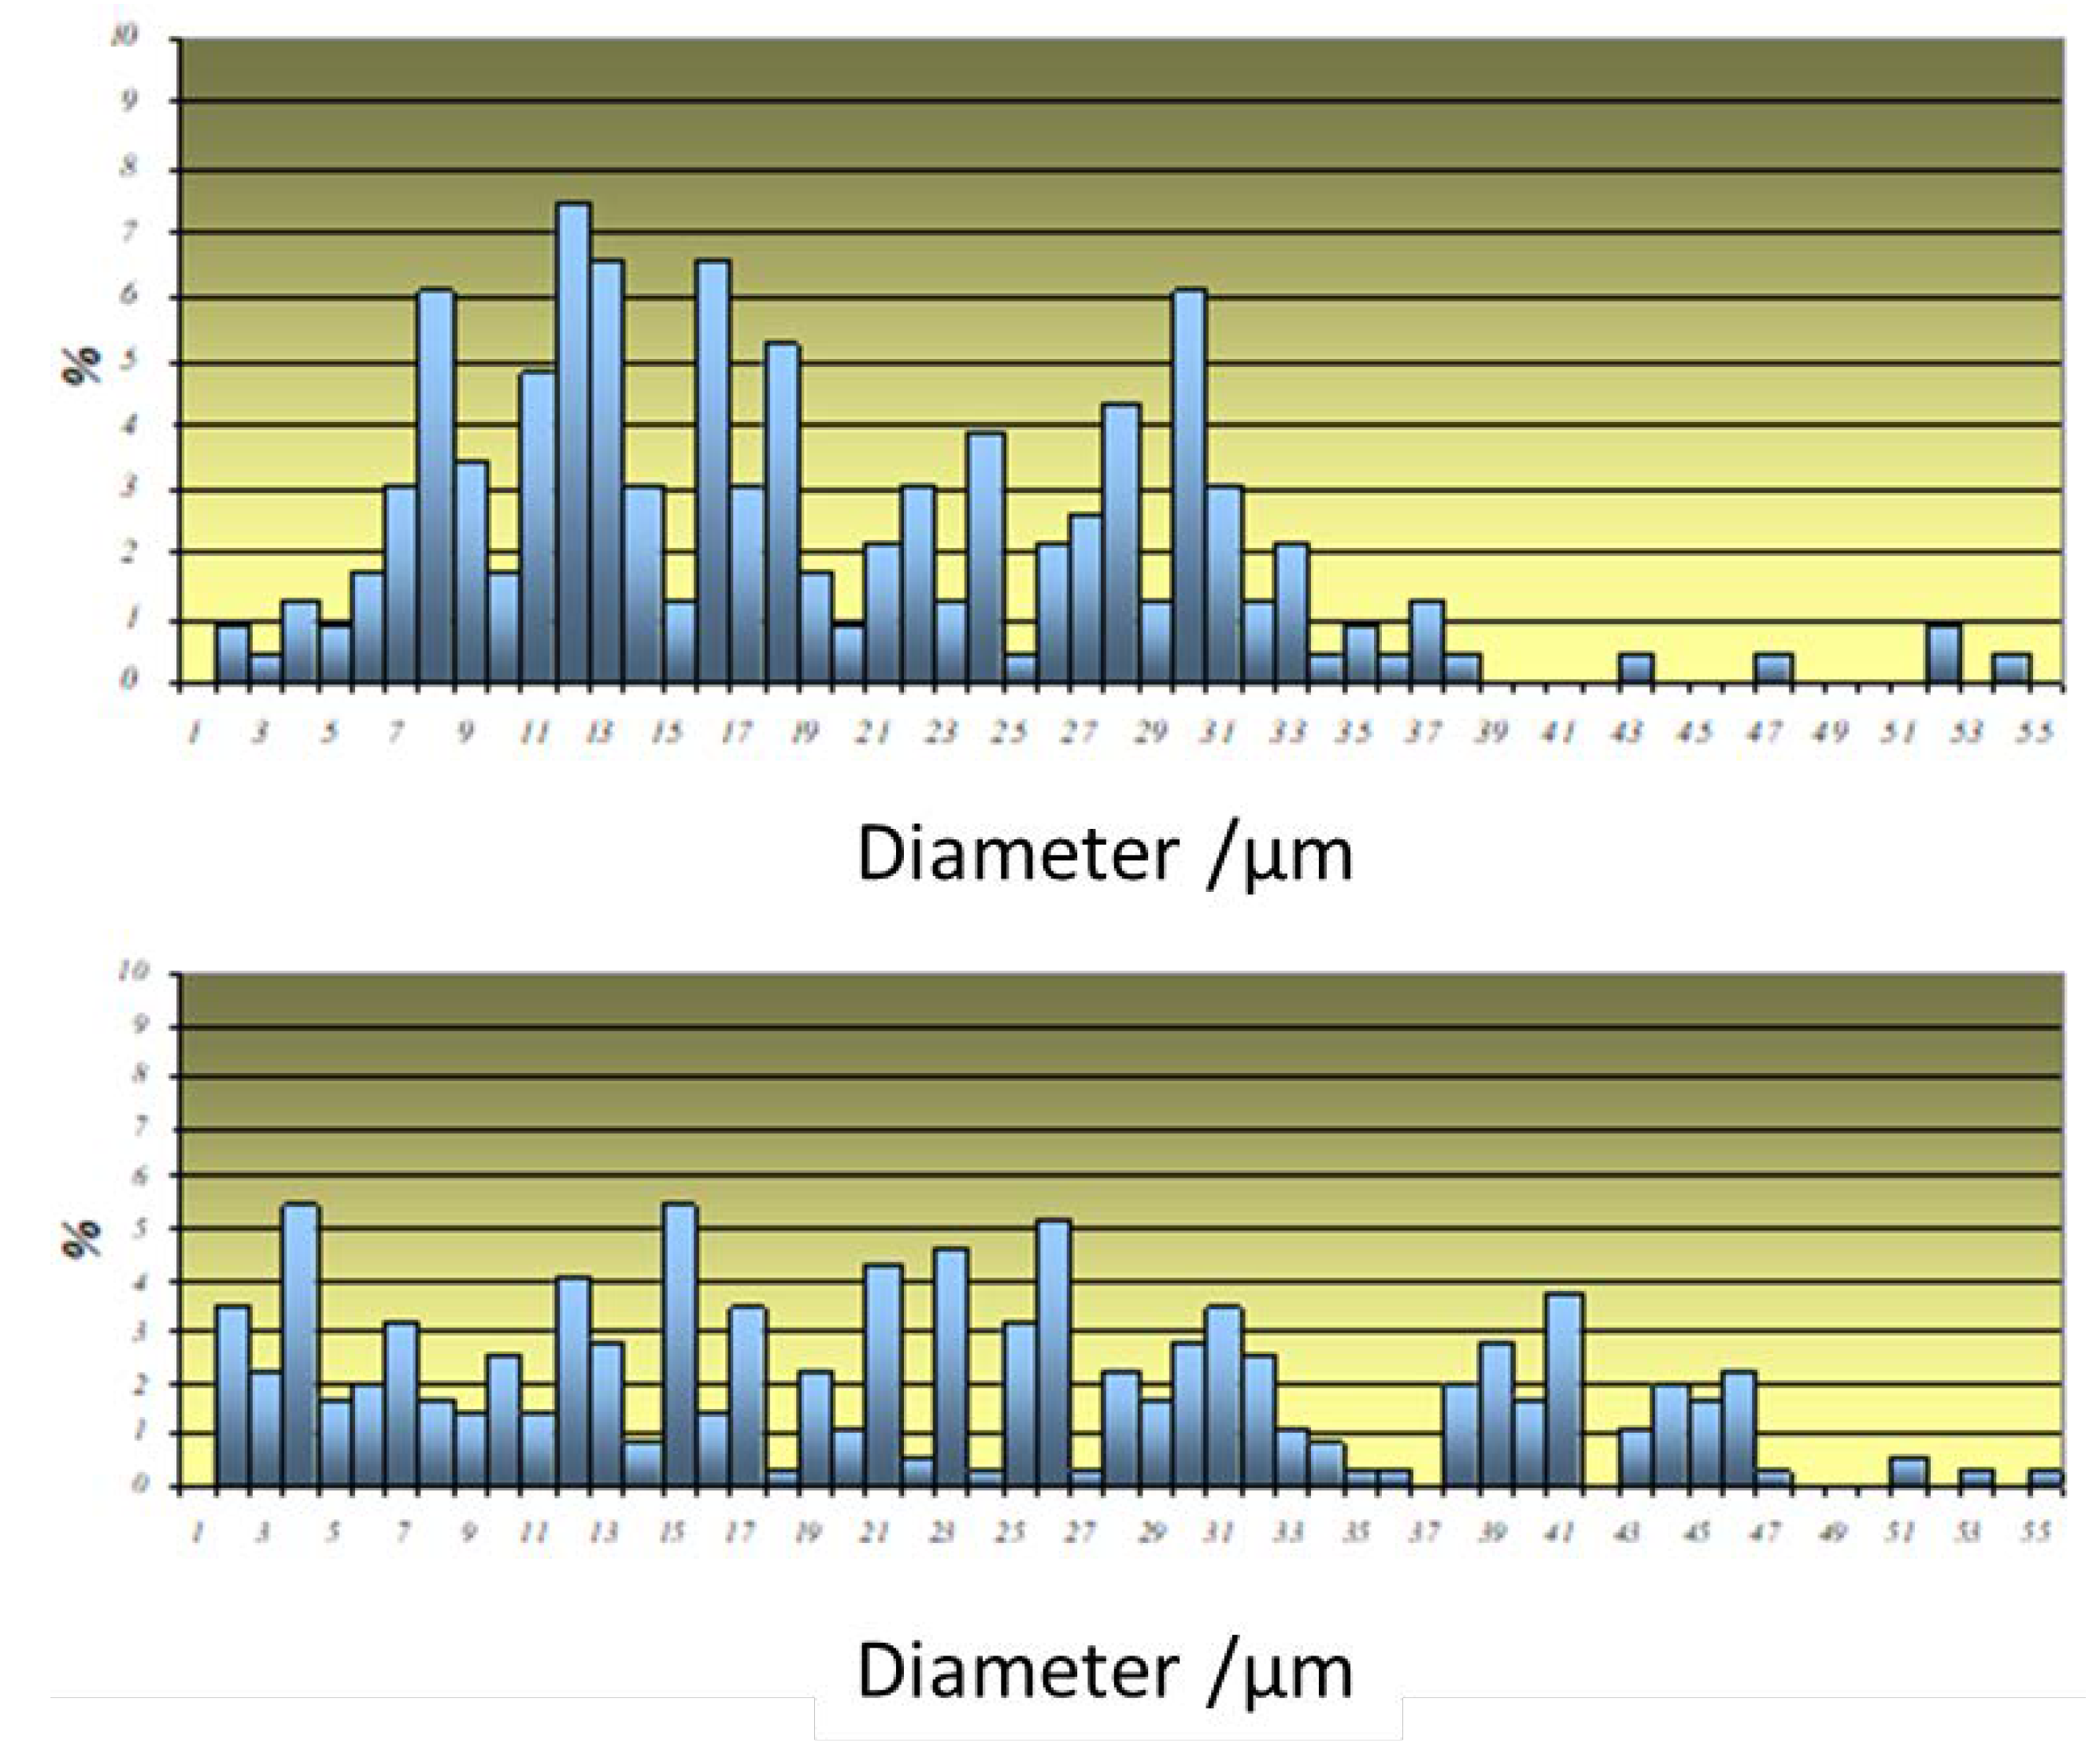
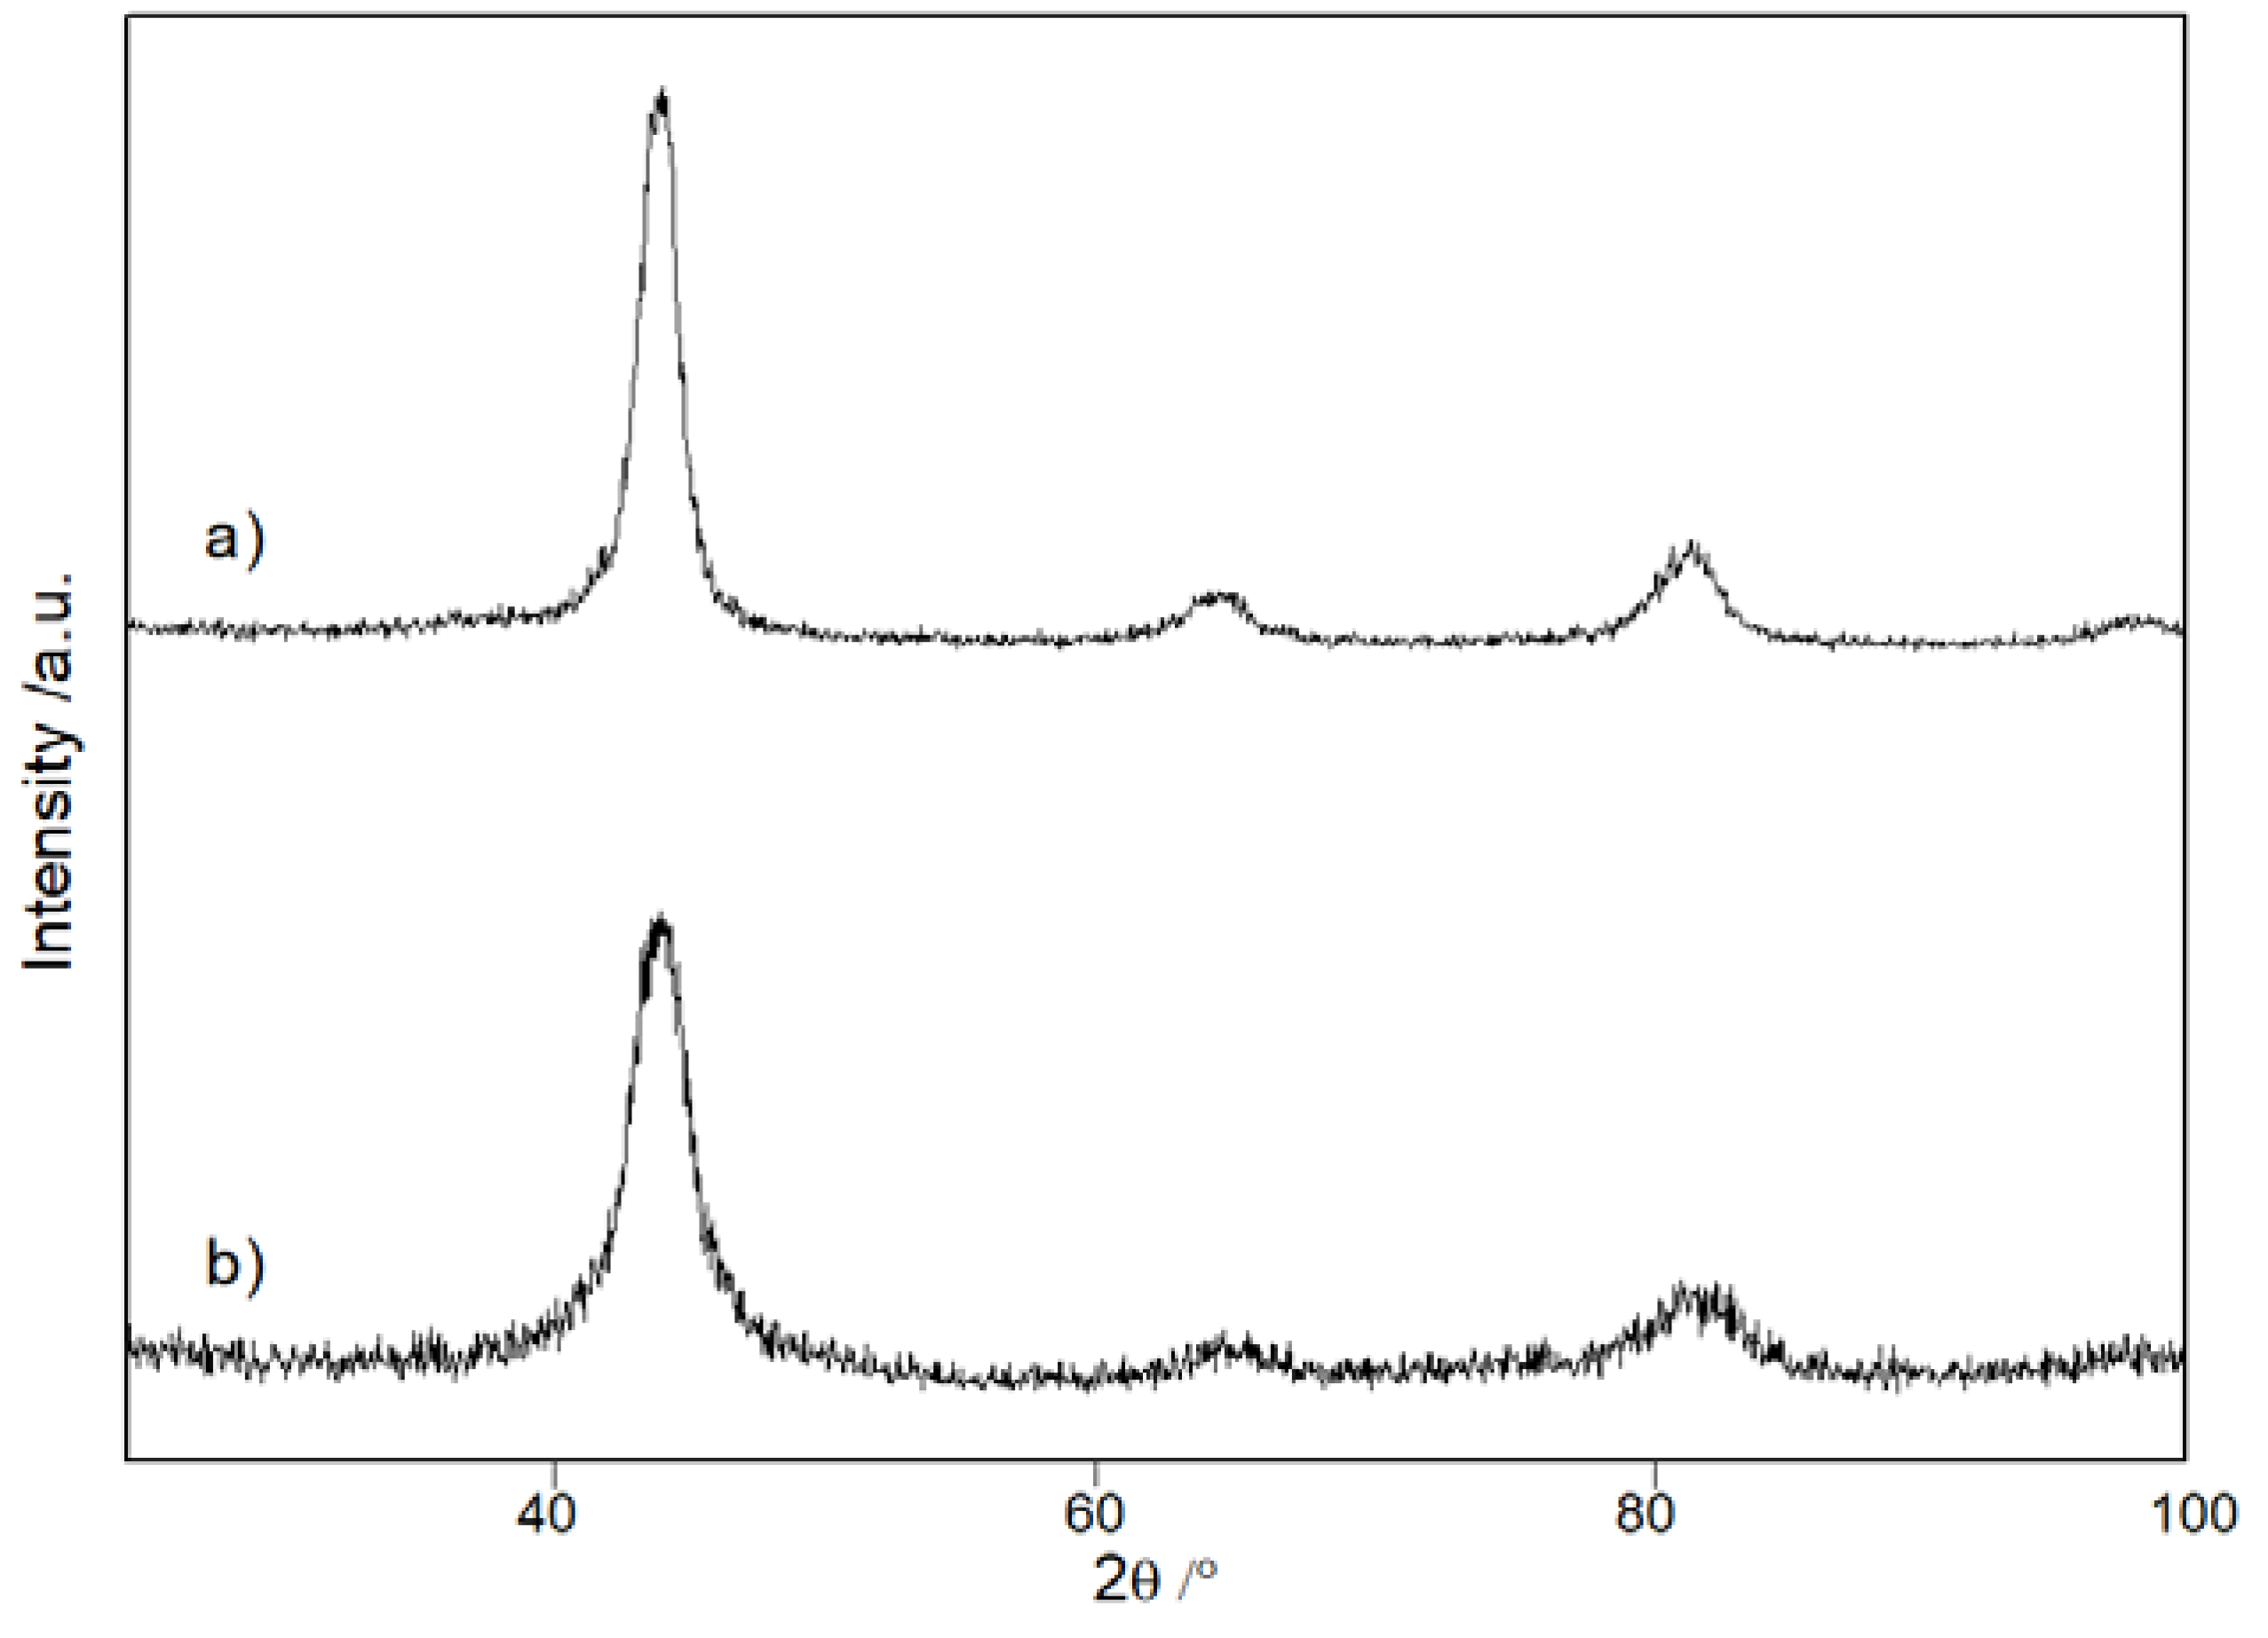
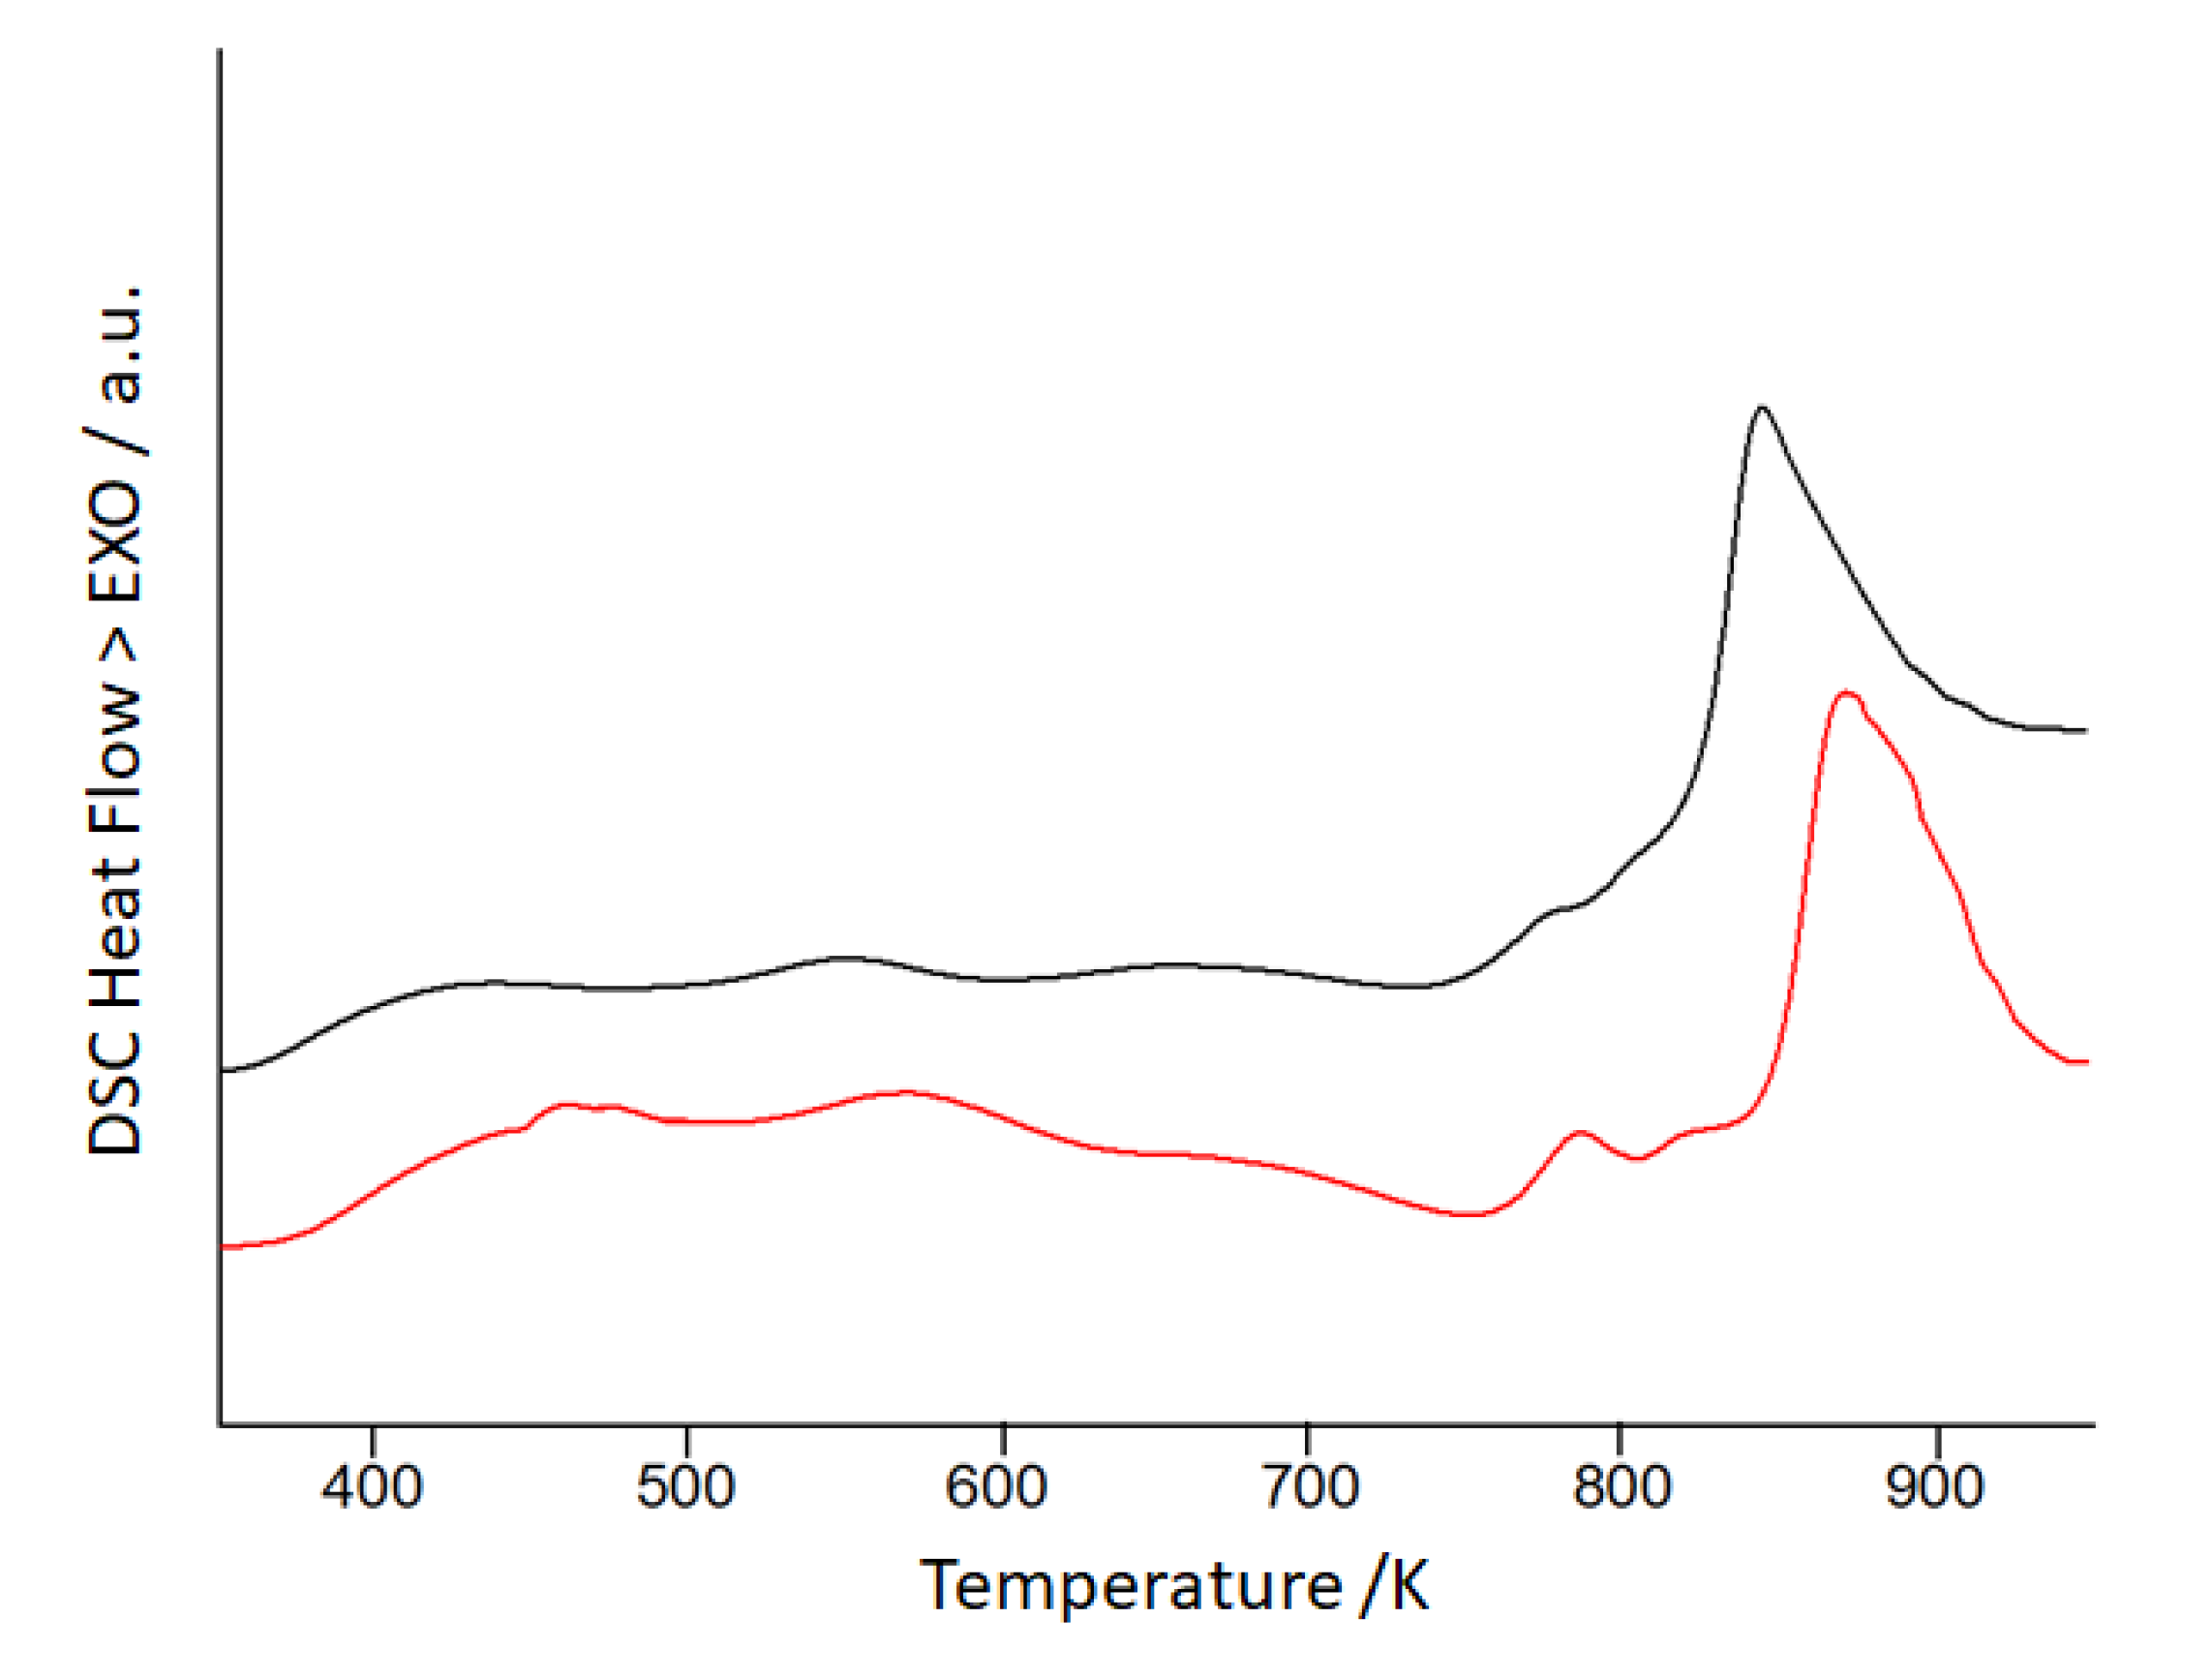
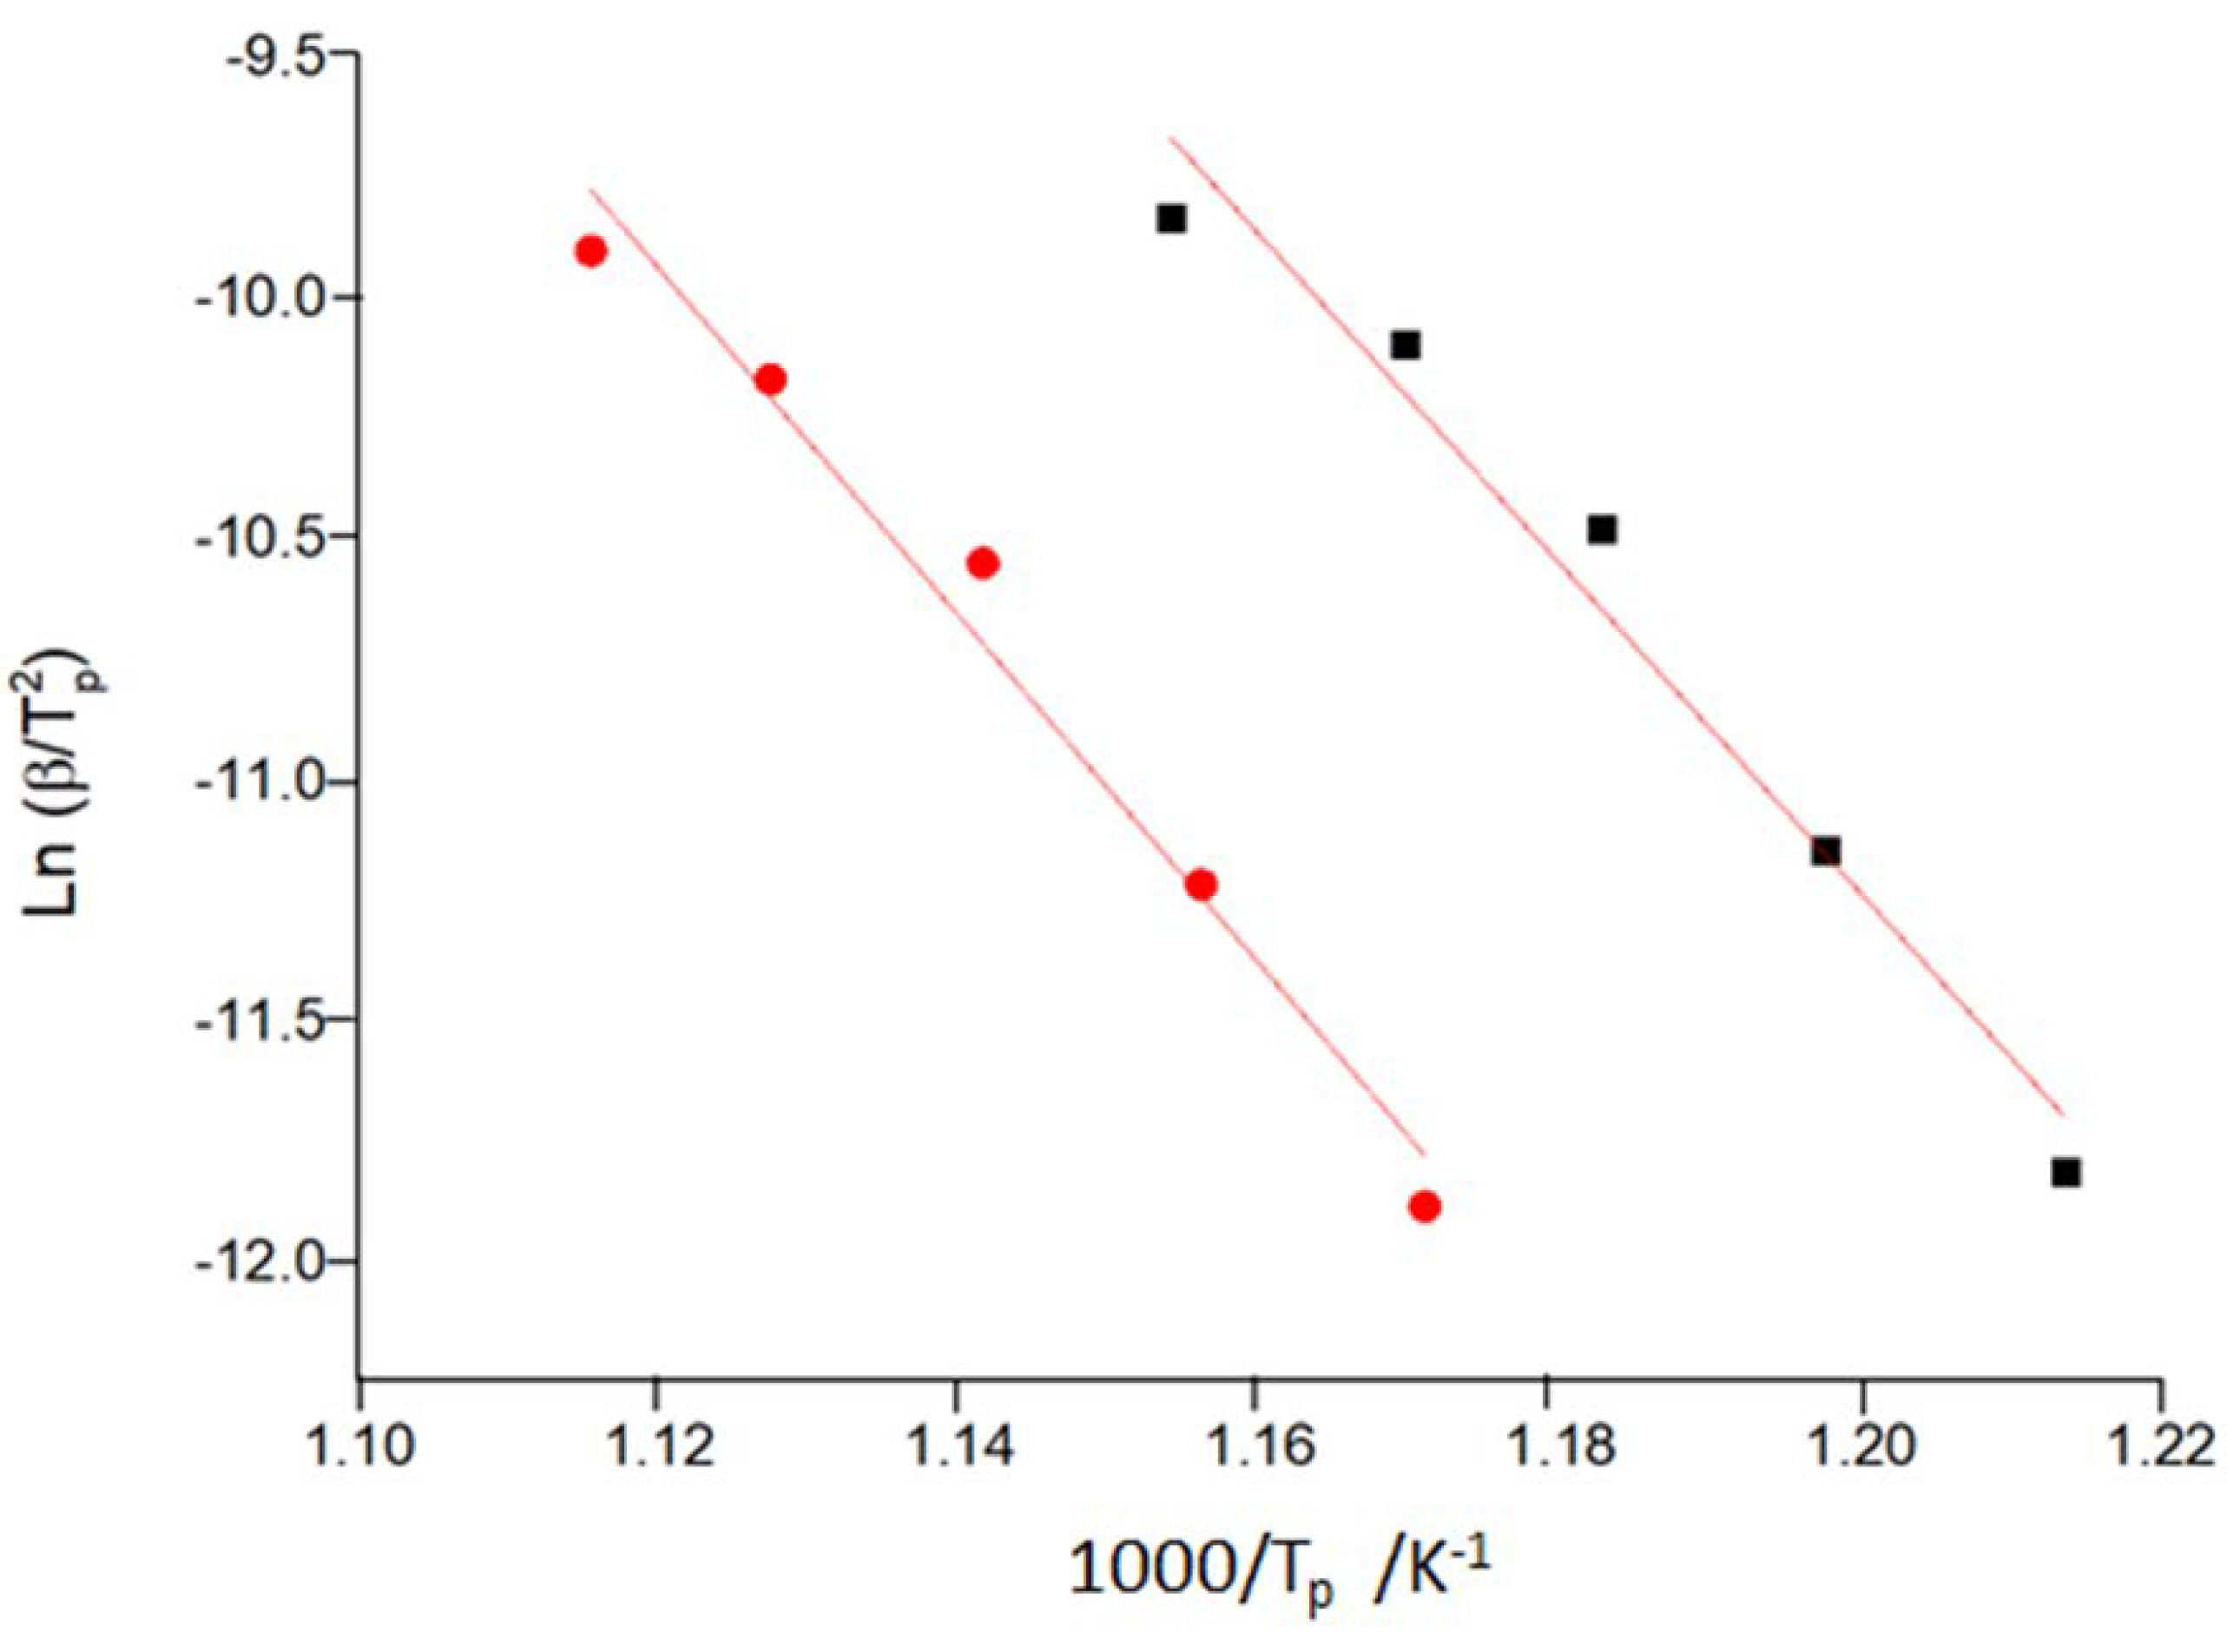
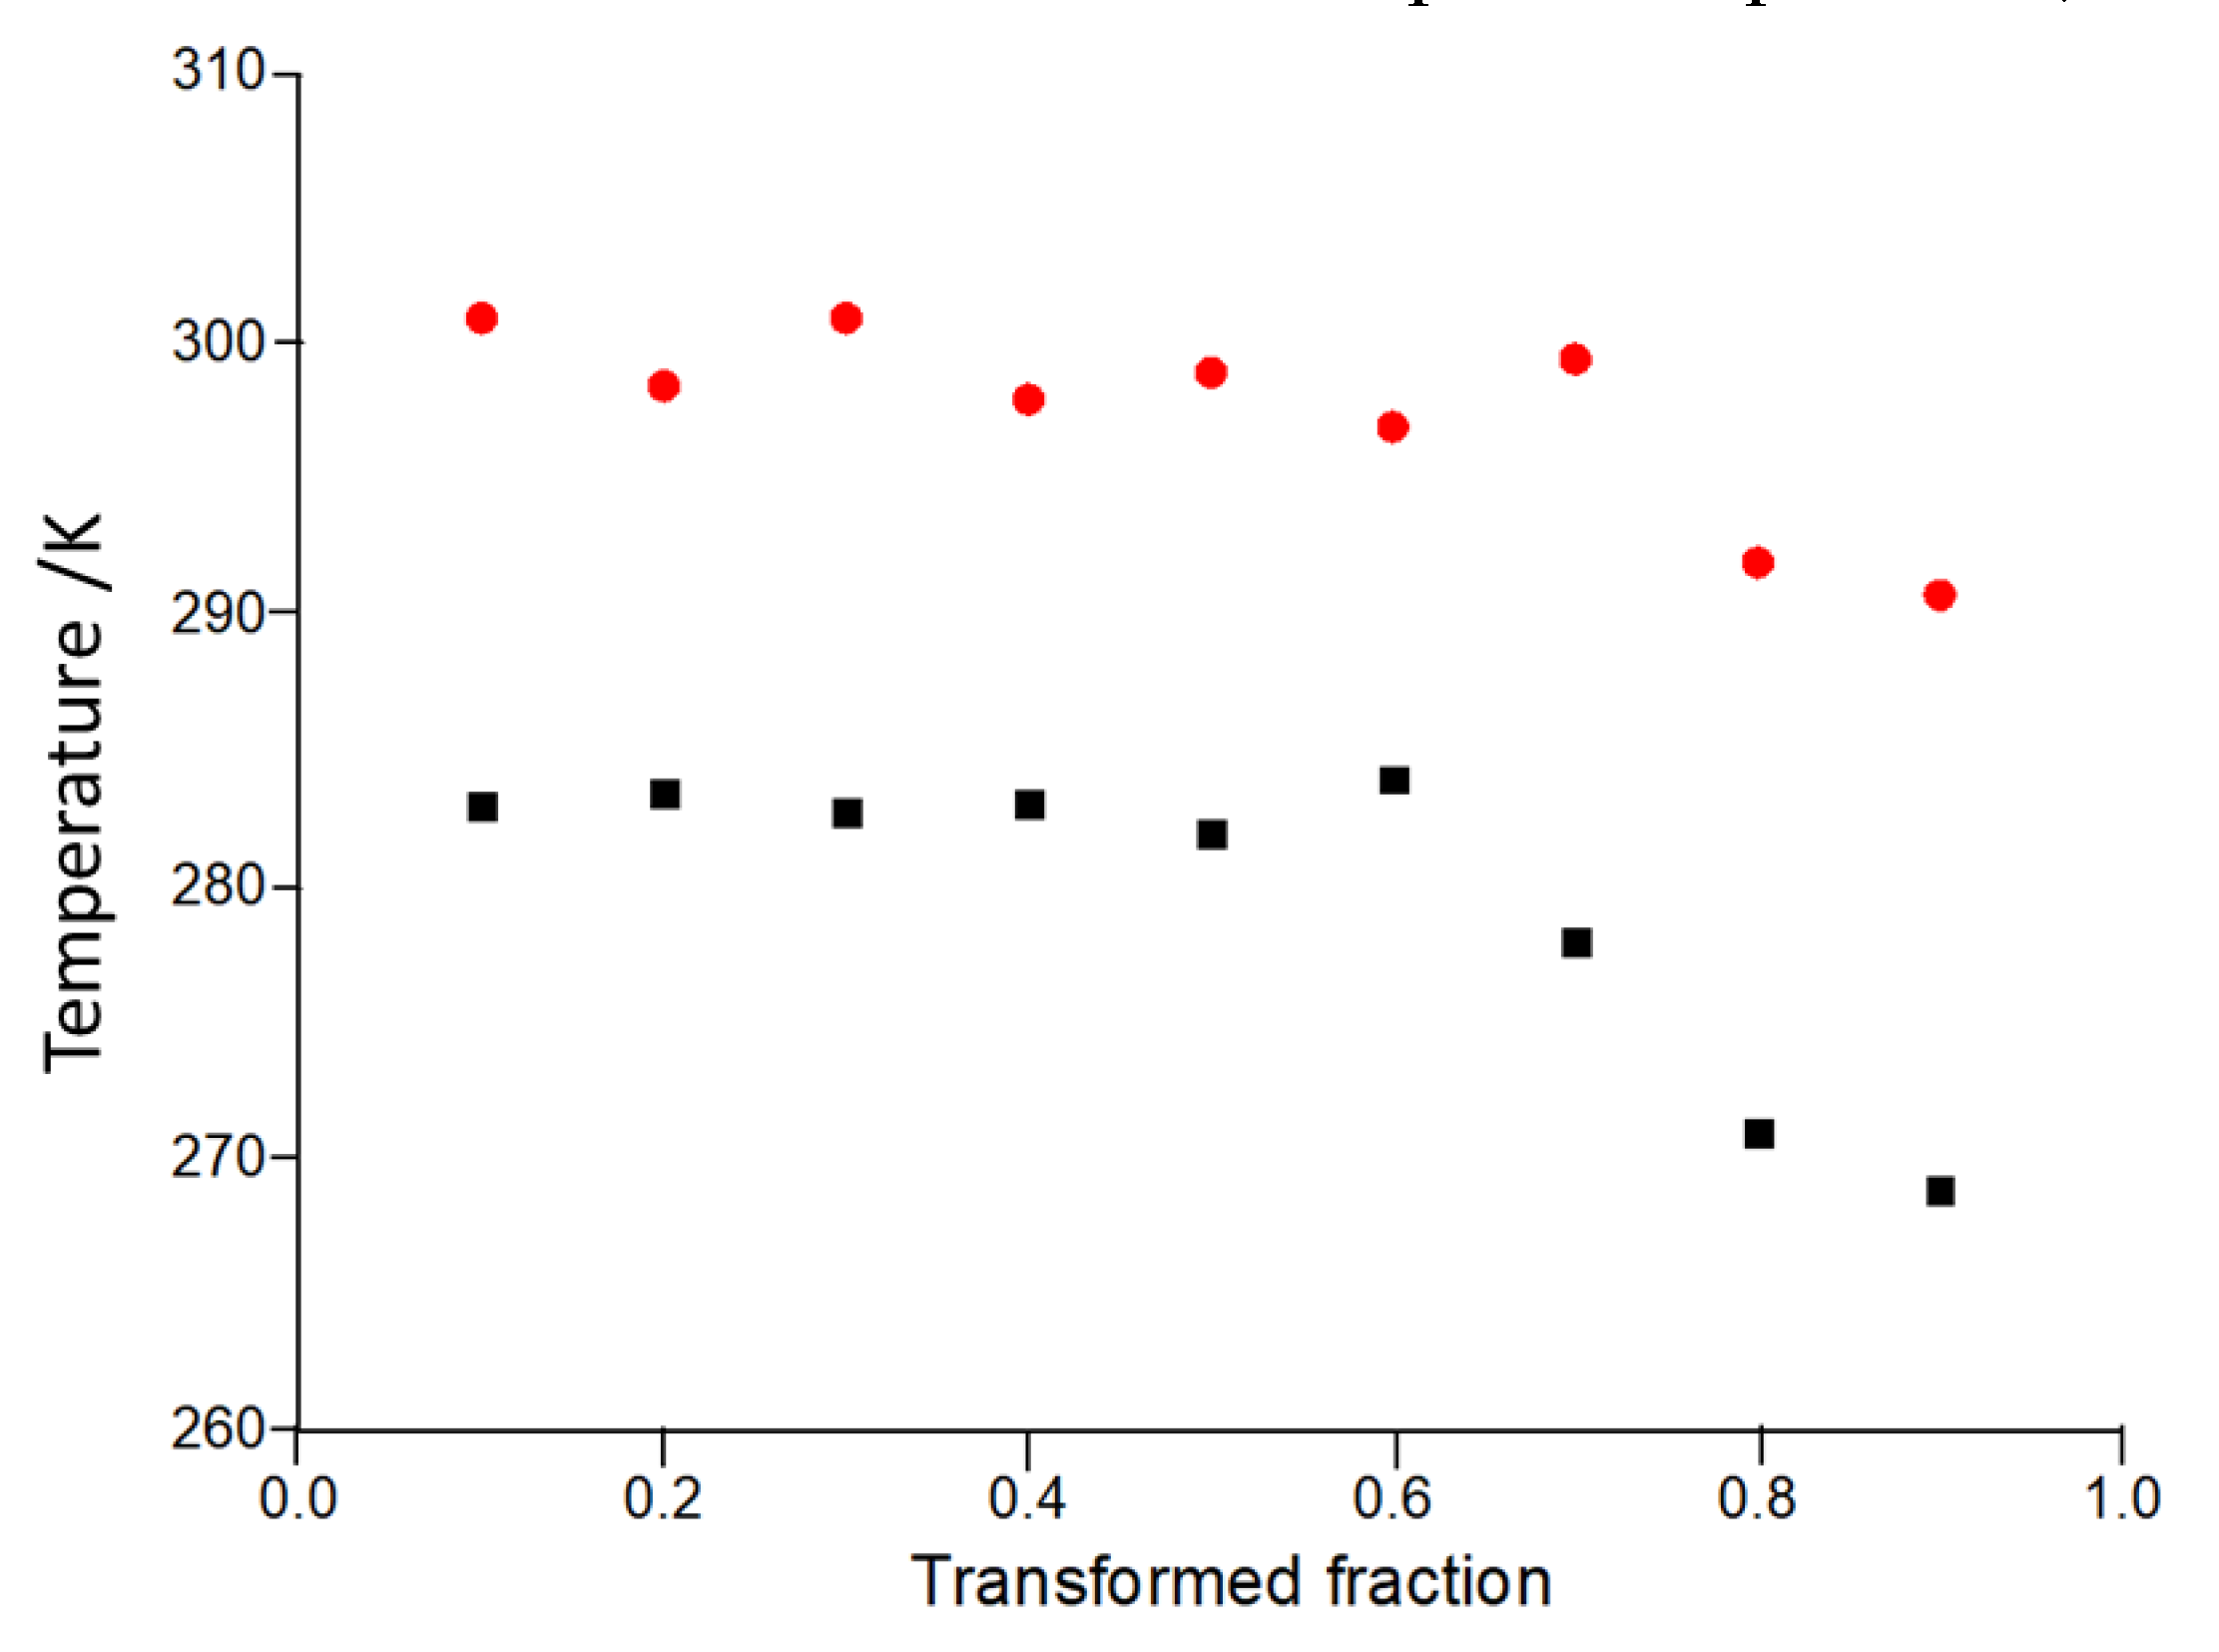
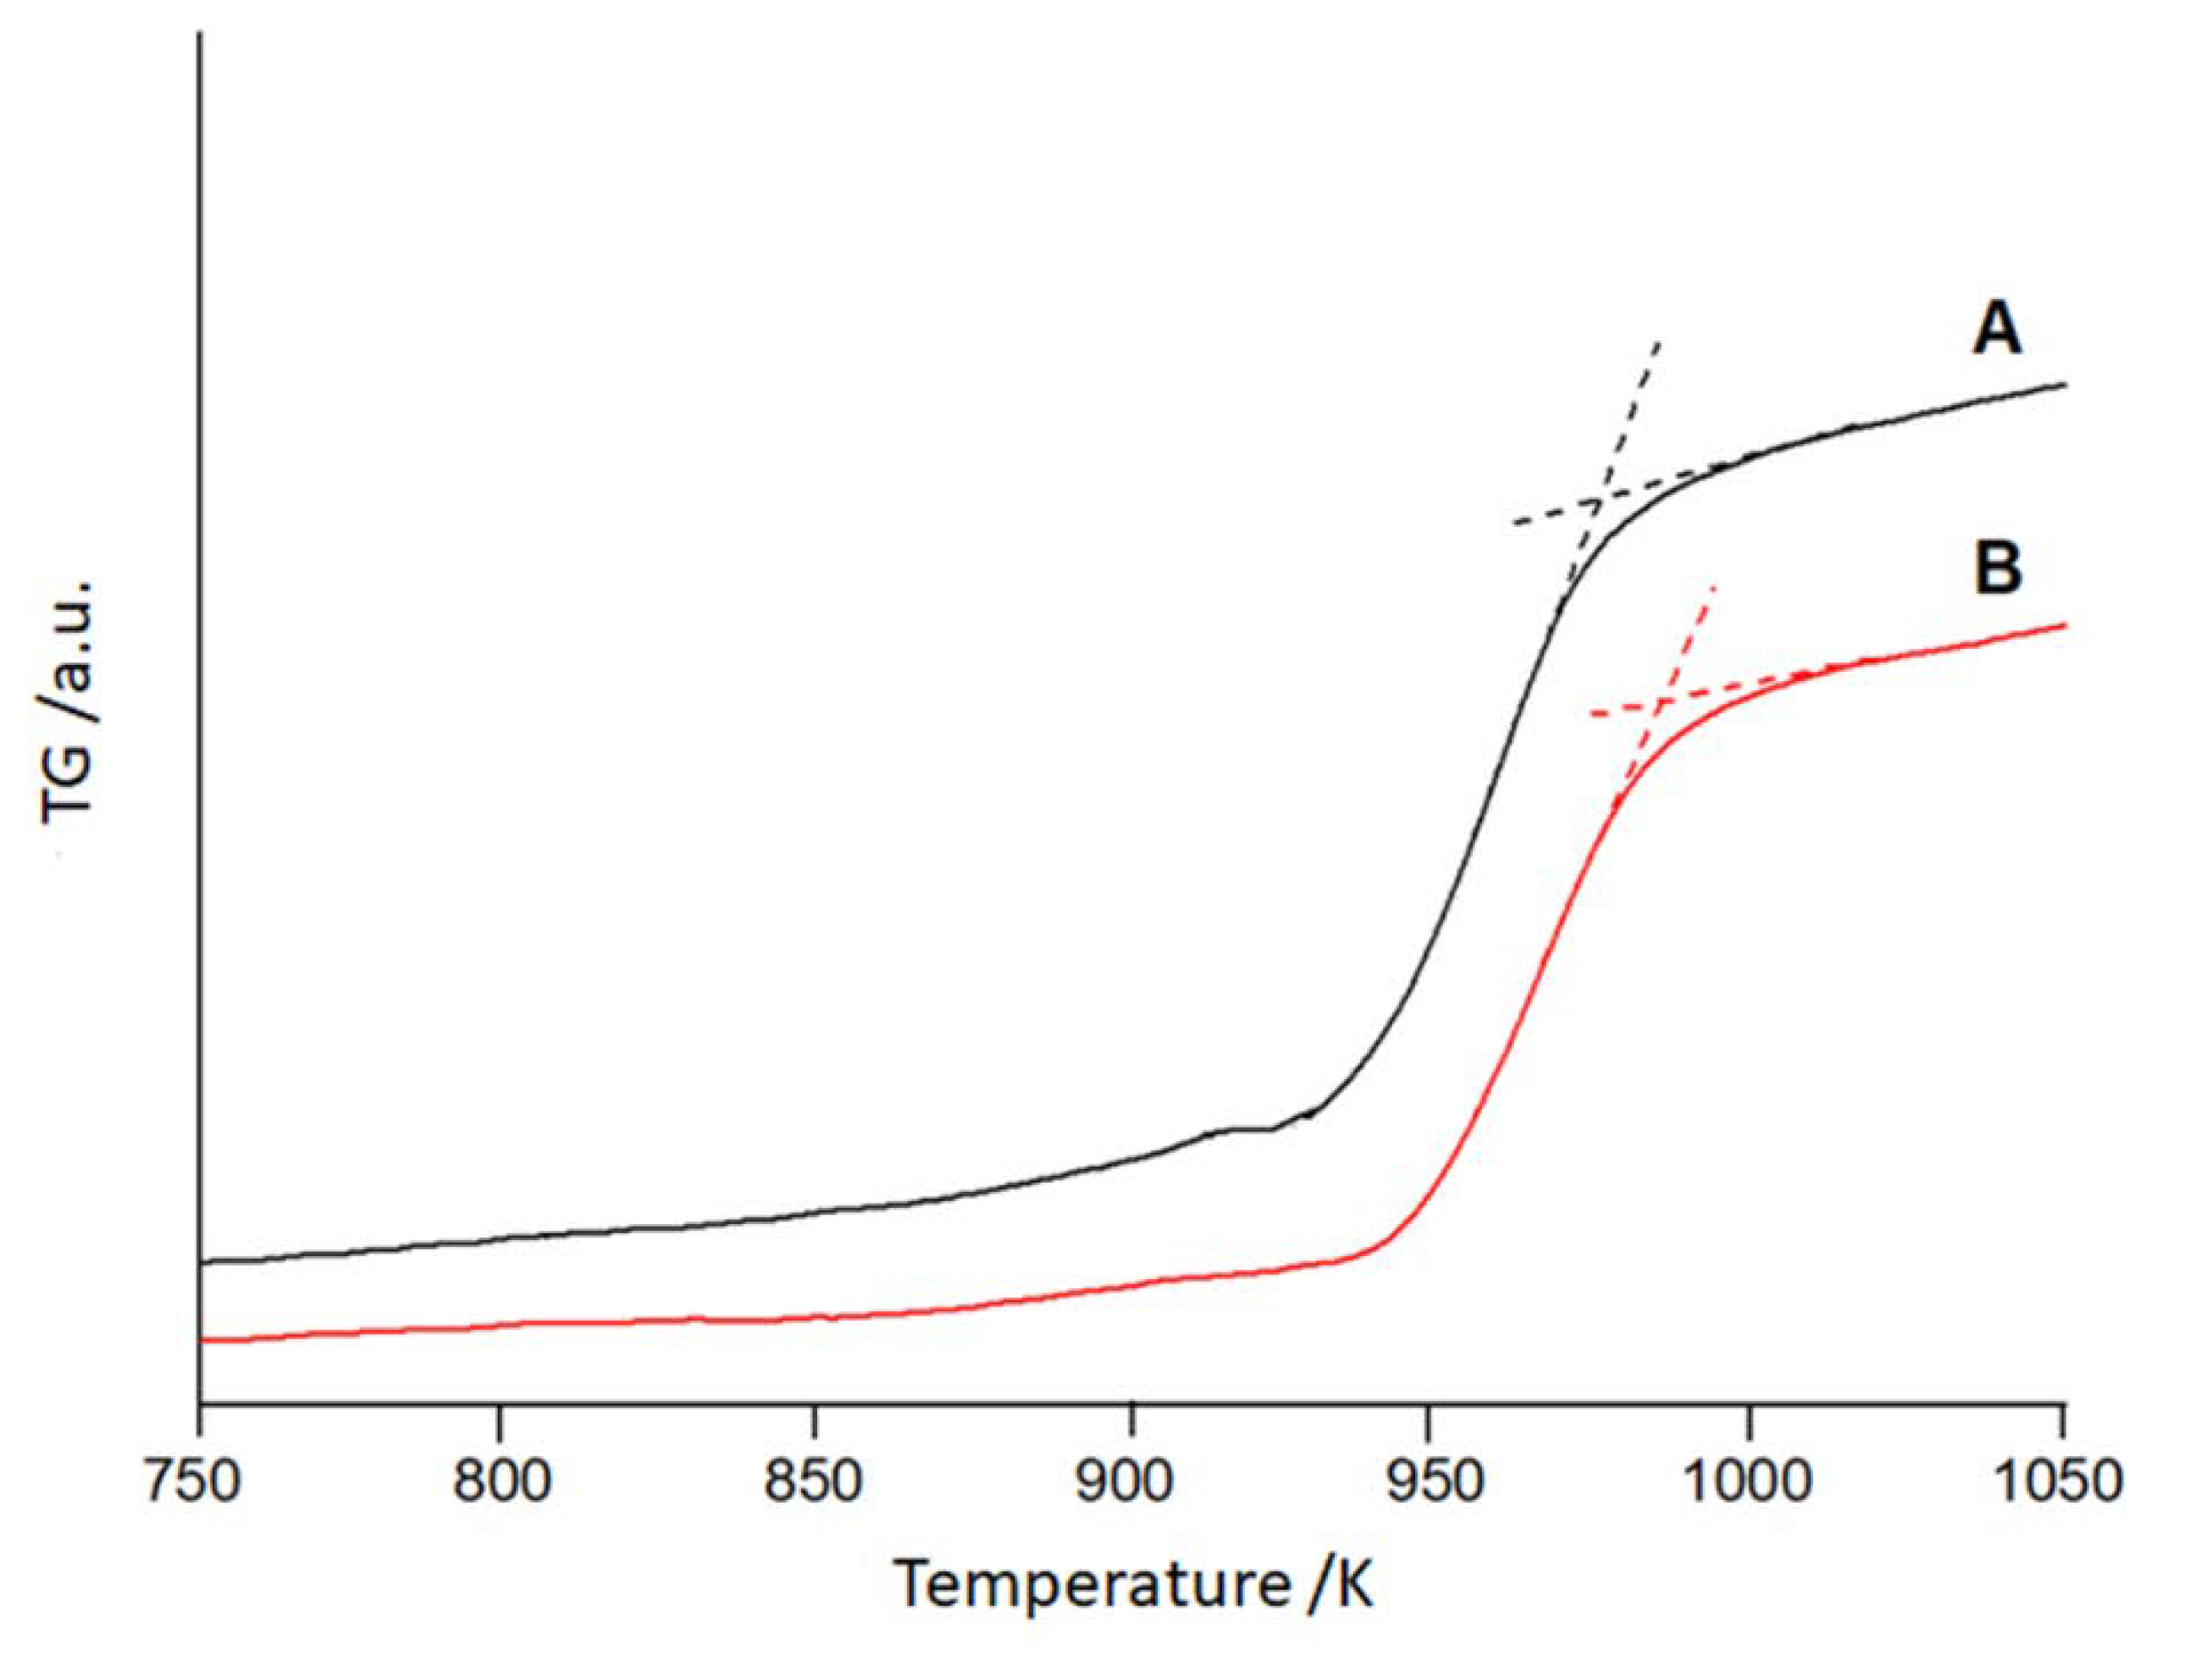
| Composition at.% | Activation energy kJ mol-1 | Initial structure | Reference |
|---|---|---|---|
| Fe83P16Cu1 | 238 | Amorphous | [19] |
| Fe68Nb6B23Mo3 | 310 | Amorphous | [20] |
| Fe80Si20 | 245 | Amorphous | [21] |
| Fe83P16Cu1 | 219 | Nanocrystalline | [22] |
| Fe83P14.5Cu1Al1.5 | 238 | Nanocrystalline | [22] |
| Fe78Si11B9 | 370 | Amorphous | [23] |
| Fe73.5Cu1B7Si15.5Nb3 | 295 | Nanocrystalline | [23] |
| Fe (99.9% purity) | 224 | Nanocrystalline | [24] |
| Fe71Si16B9Cu1Nb3 | 341 | Amorphous | [25] |
| Fe85Zr6B8Cu1 | 282 | Nanocrystalline | This work |
| Fe80Zr5B13Cu1 | 299 | Nanocrystalline | This work |
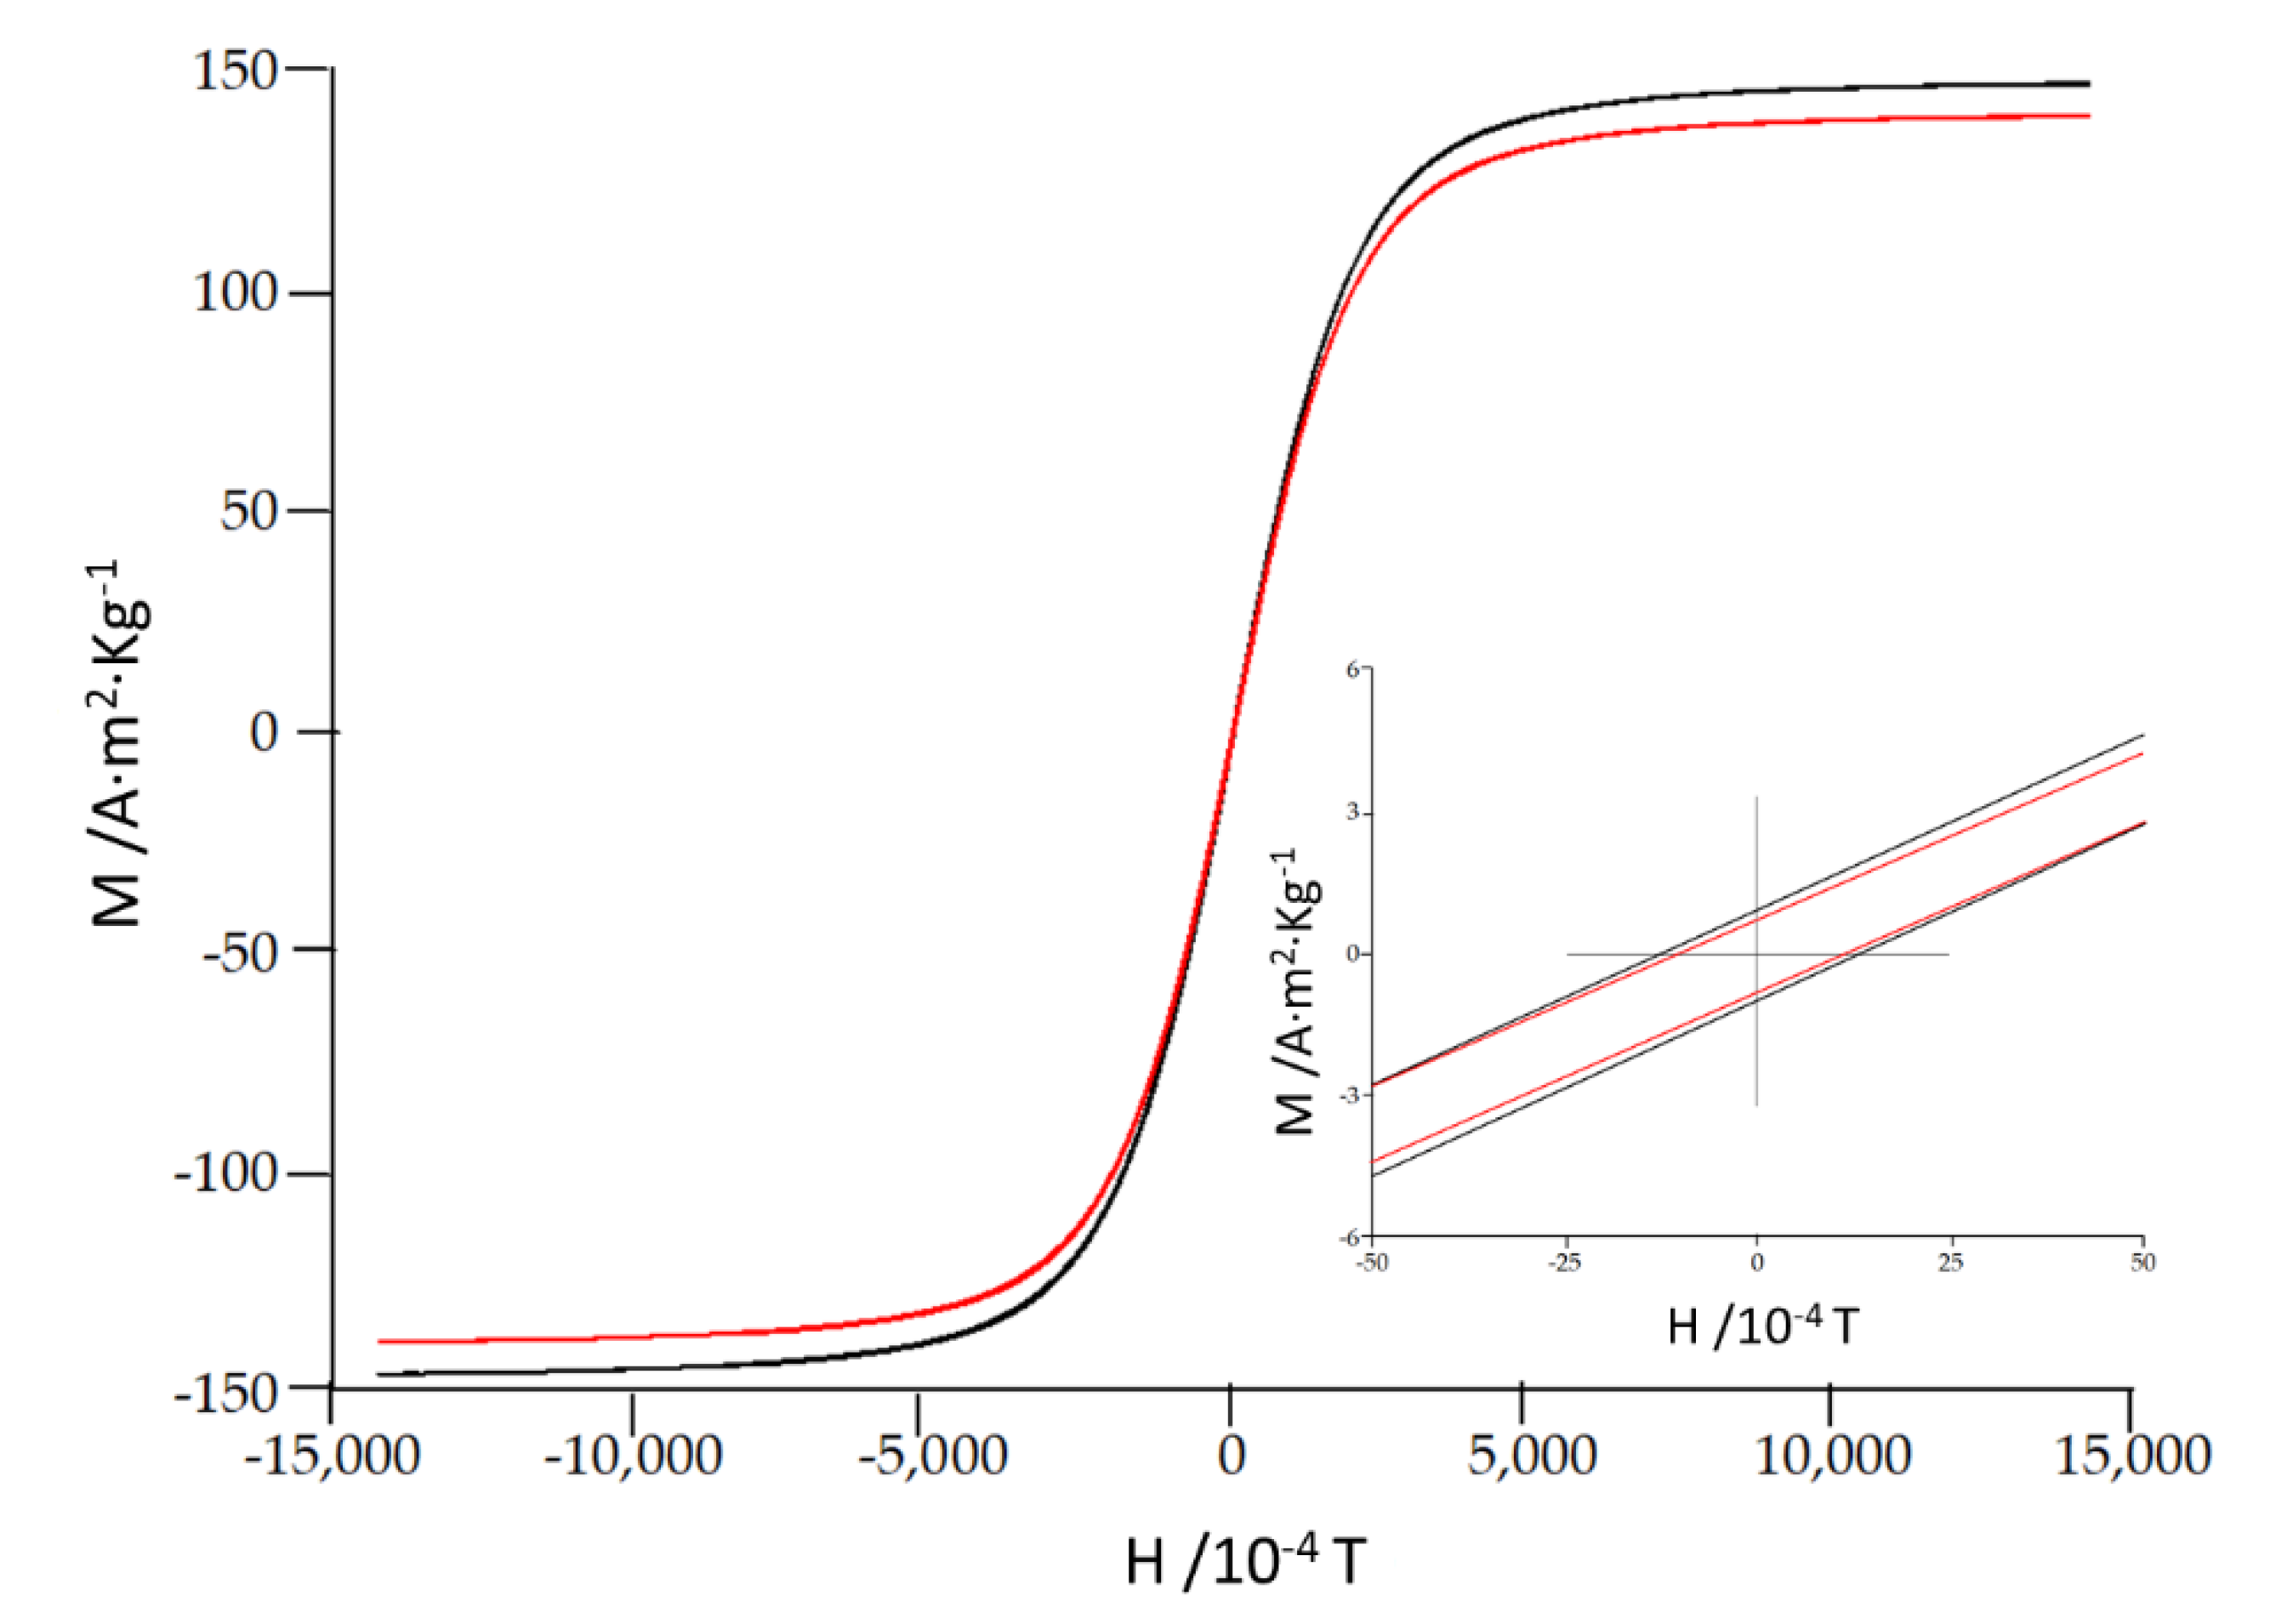
| Alloy | Hc 10-4 T | Ms A·m2·Kg-1 | Mr A·m2·Kg-1 | Mr/Ms 10-3 |
|---|---|---|---|---|
| Fe85Zr6B8Cu1 | 10.6 | 146 | 0.60 | 4 |
| Fe80Zr6B13Cu1 | 12.4 | 139 | 0.71 | 5 |
Disclaimer/Publisher’s Note: The statements, opinions and data contained in all publications are solely those of the individual author(s) and contributor(s) and not of MDPI and/or the editor(s). MDPI and/or the editor(s) disclaim responsibility for any injury to people or property resulting from any ideas, methods, instructions or products referred to in the content. |
© 2023 by the authors. Licensee MDPI, Basel, Switzerland. This article is an open access article distributed under the terms and conditions of the Creative Commons Attribution (CC BY) license (http://creativecommons.org/licenses/by/4.0/).


