Submitted:
26 April 2023
Posted:
28 April 2023
You are already at the latest version
Abstract
Keywords:
1. Introduction
2. Experimental
2.1. Preparation of nanohybrids and nanocomposites
2.2. Preparation of polymeric nanocomposites
2.3. Characterization
3. Results and discussion
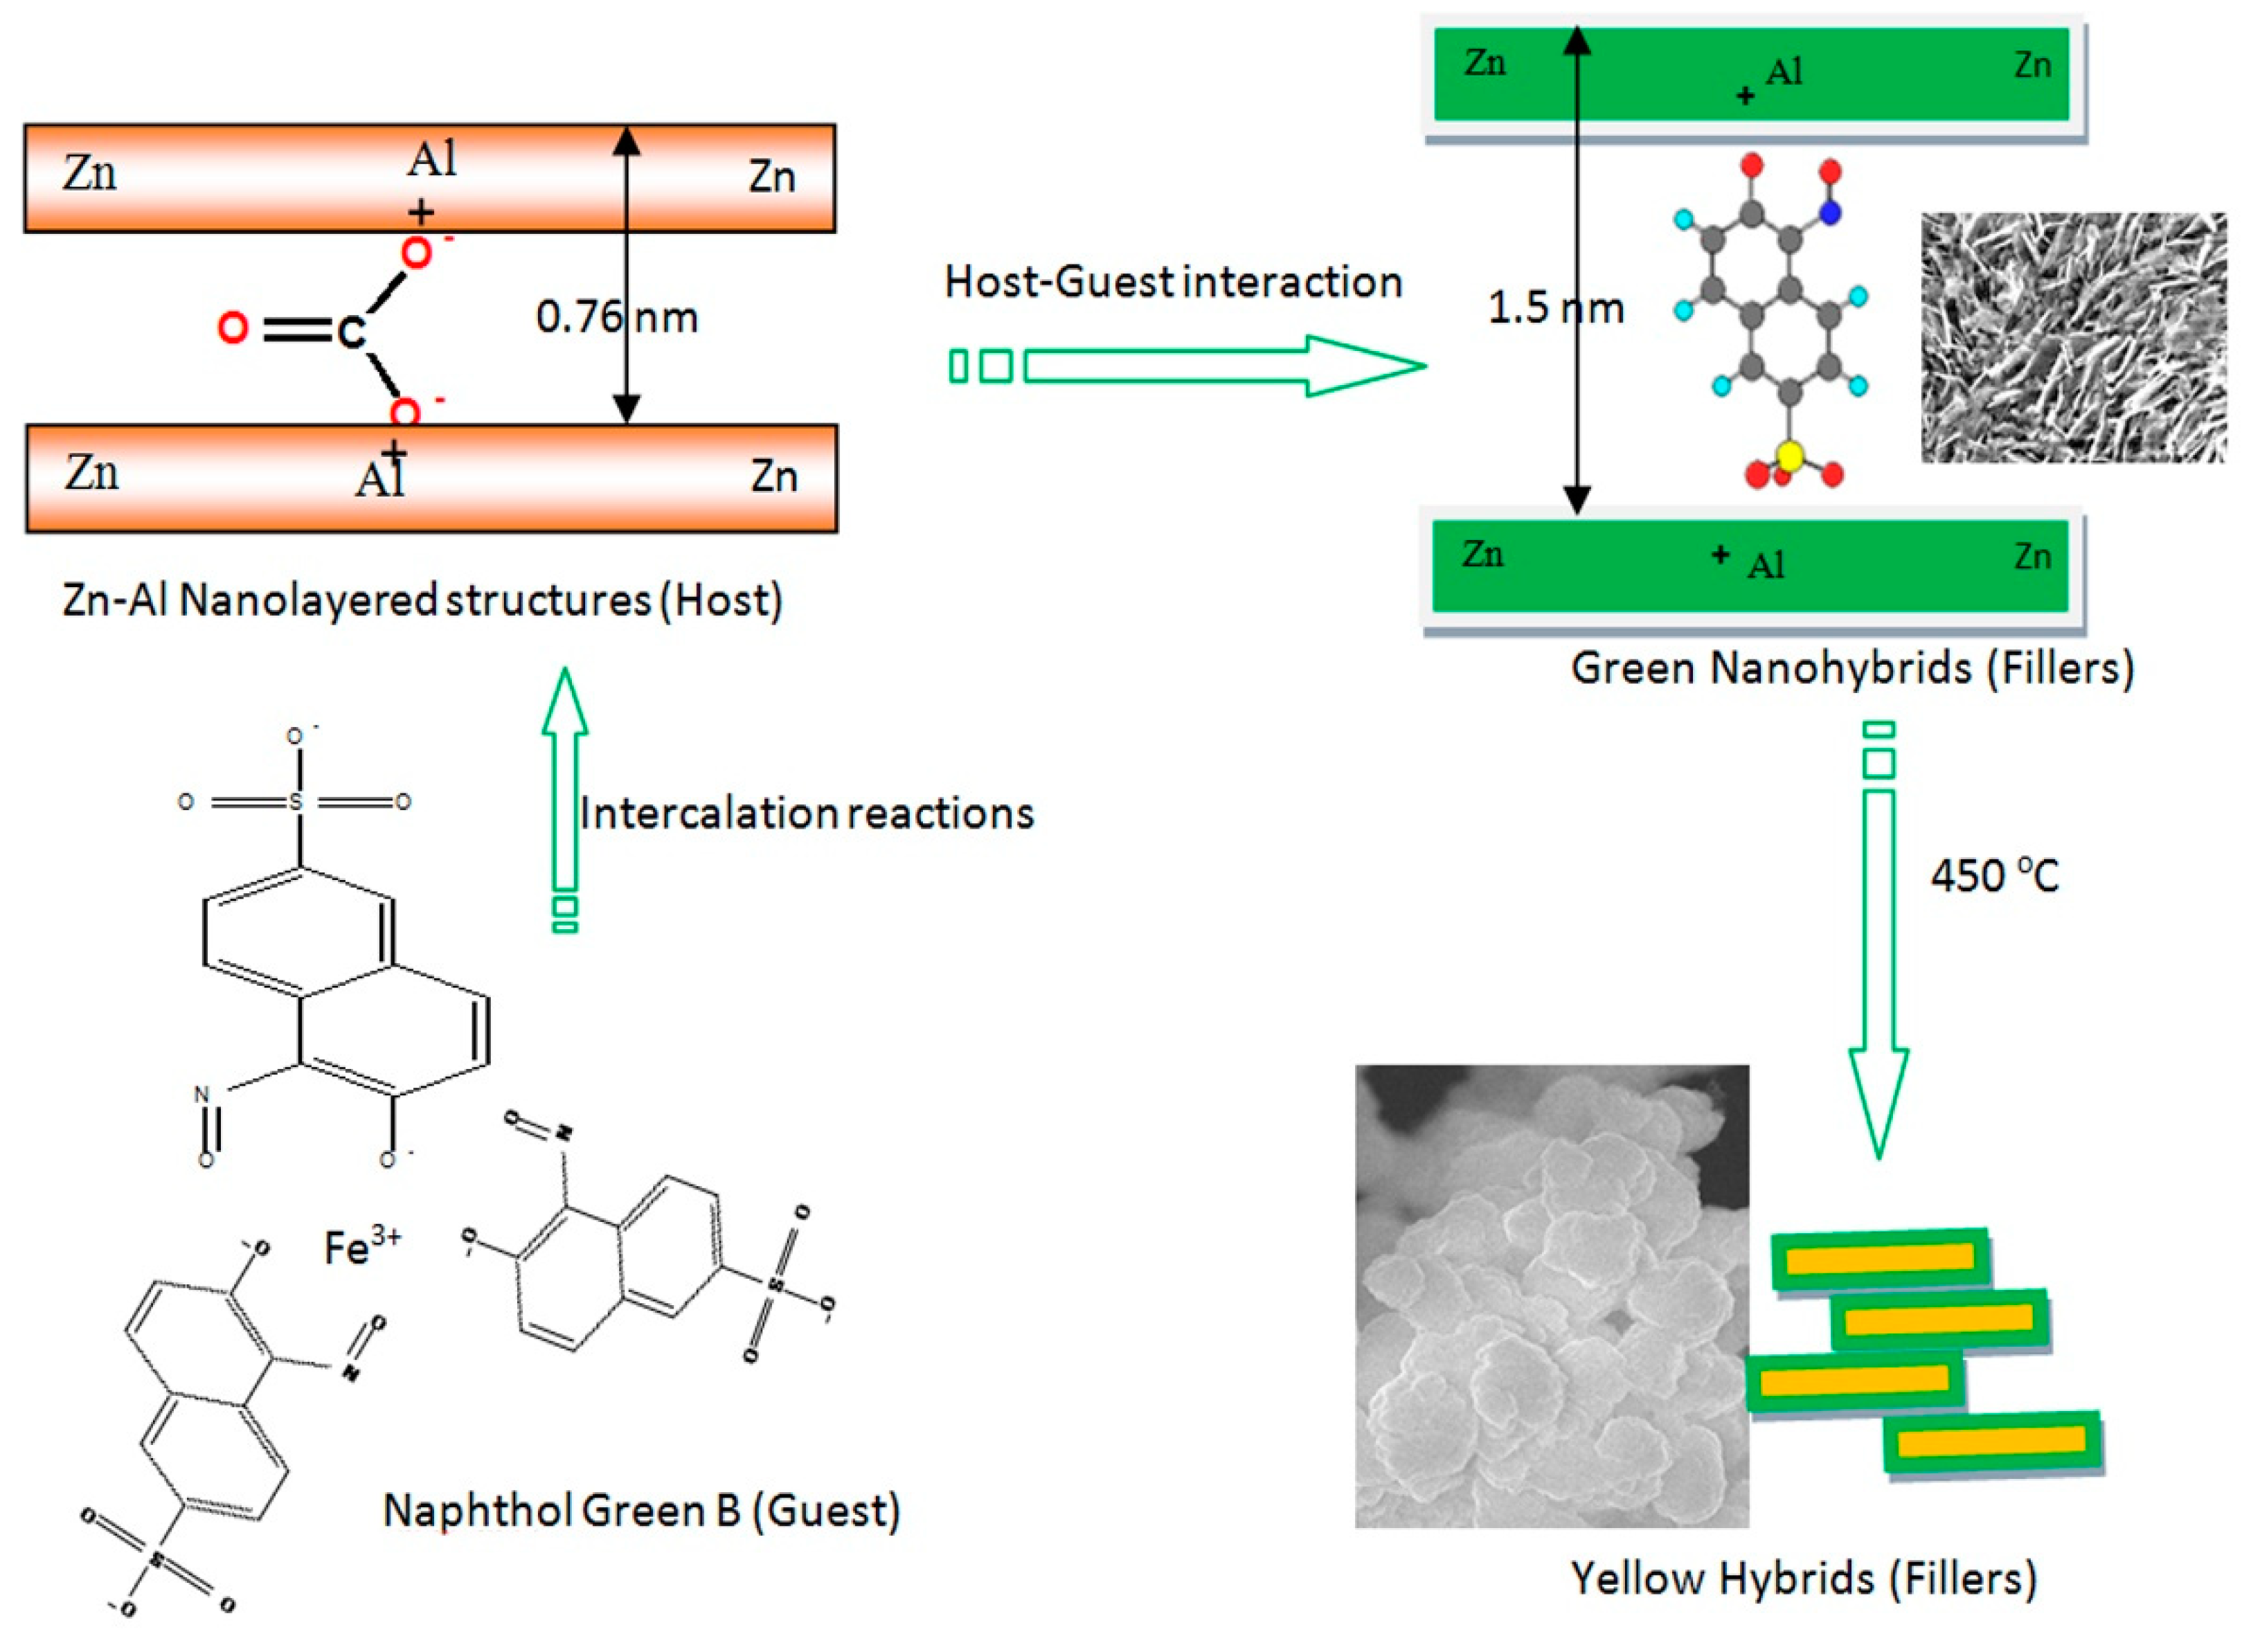
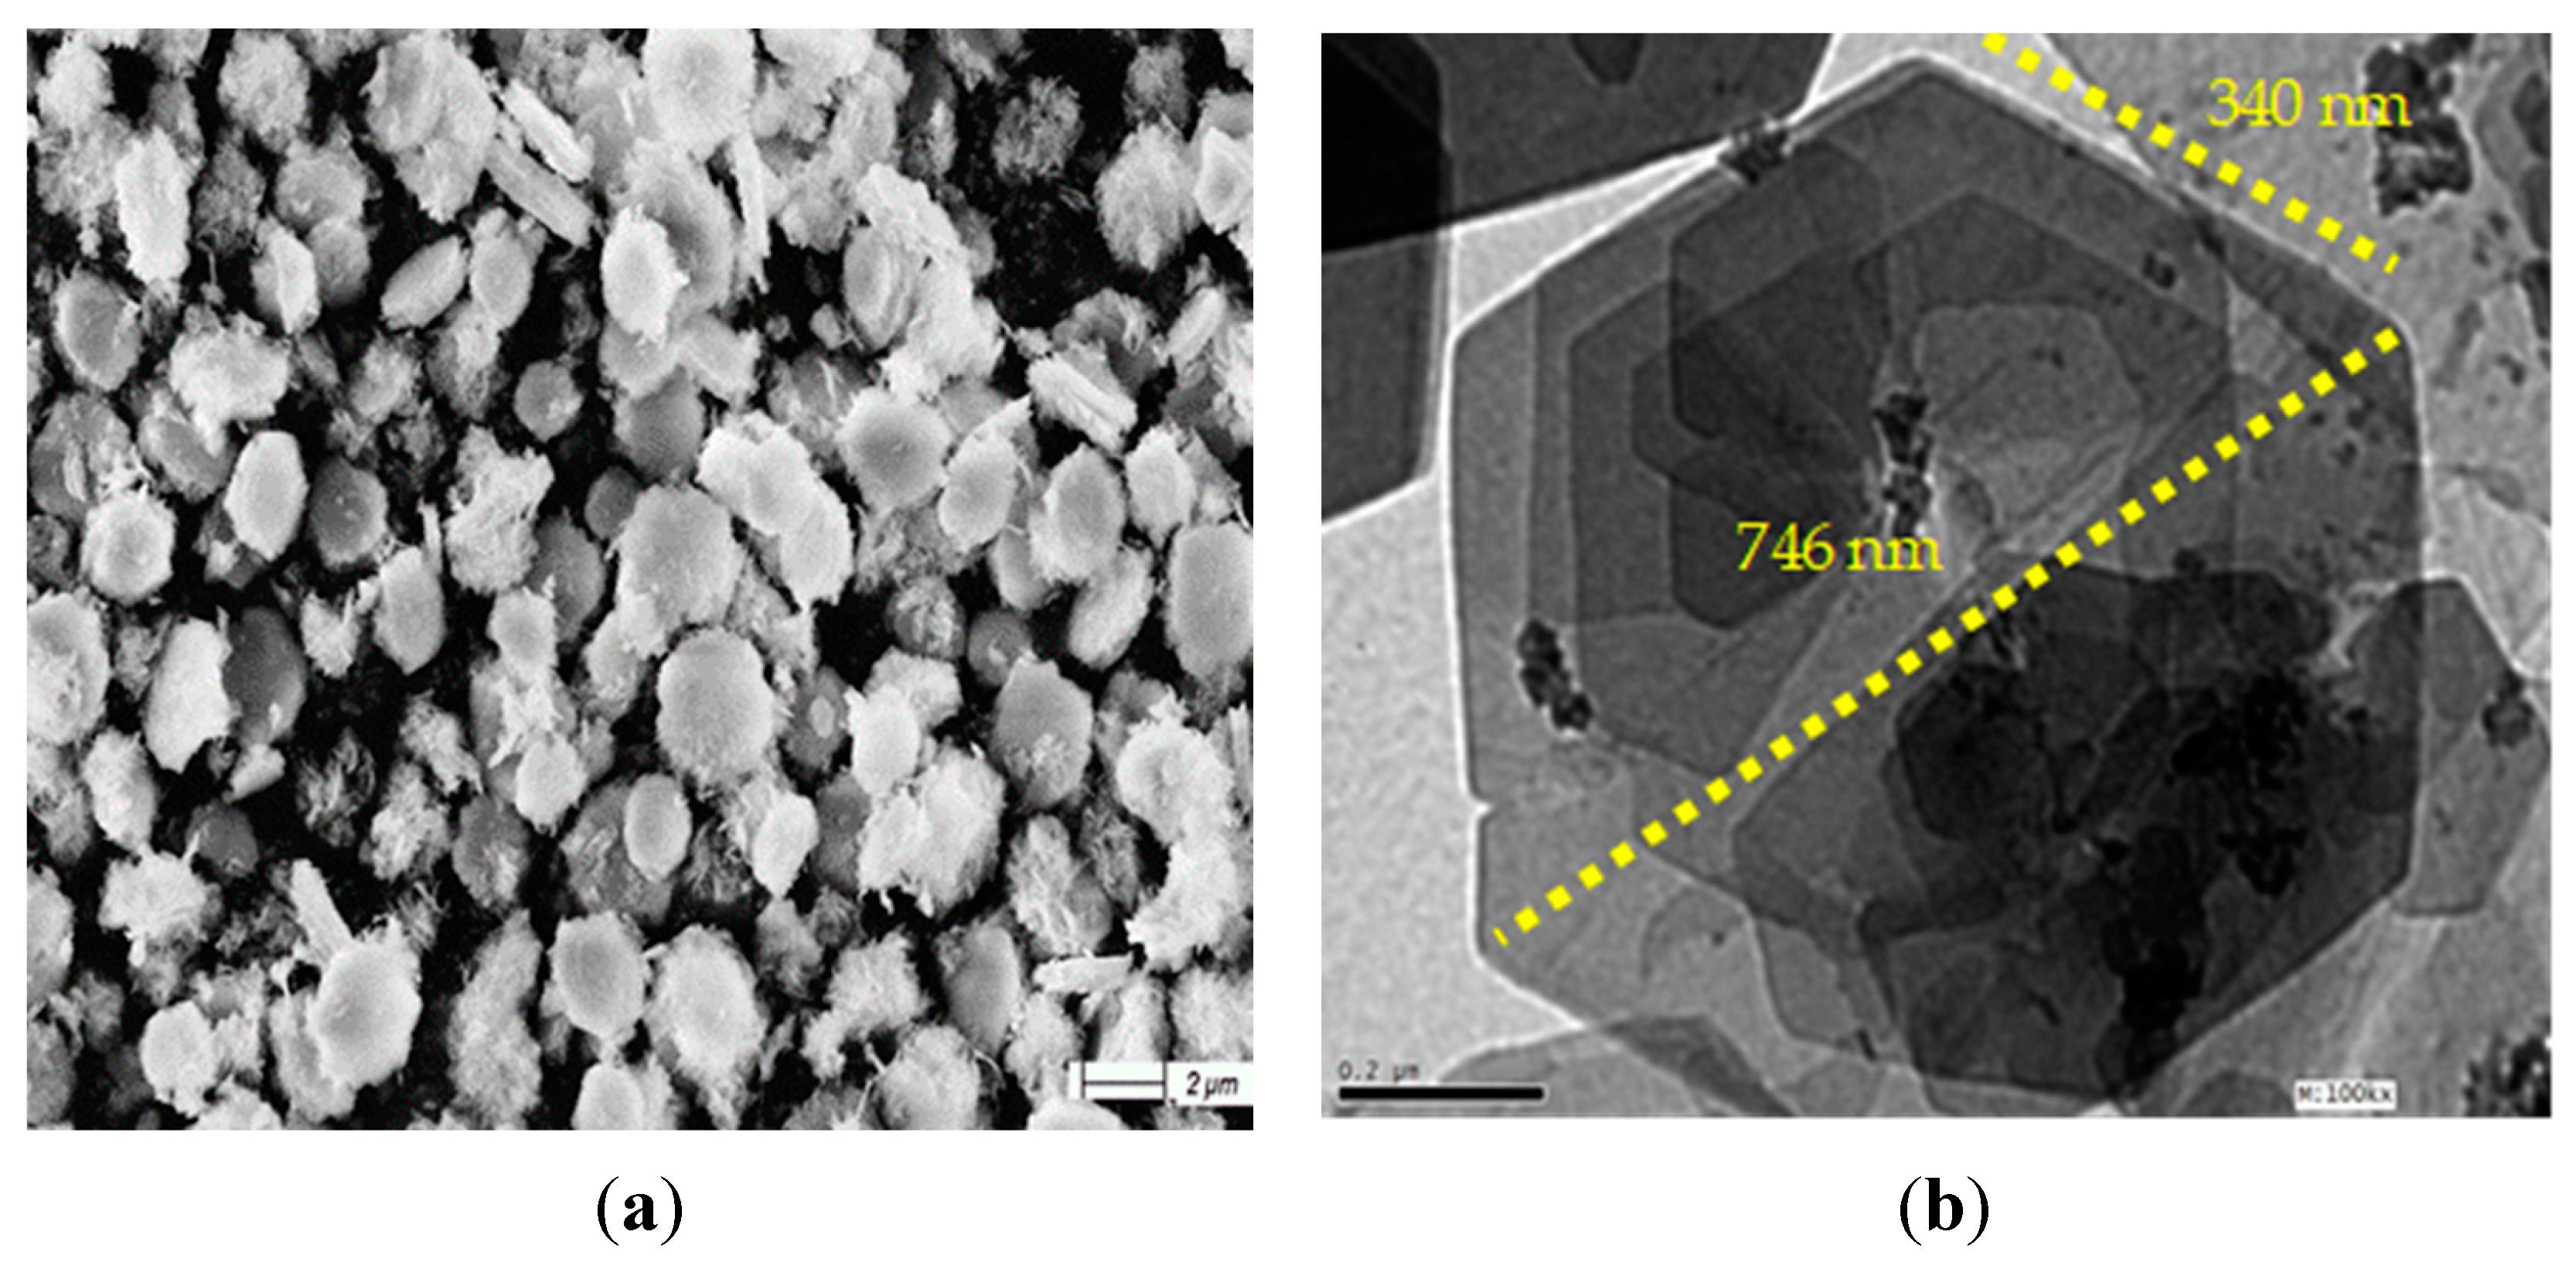
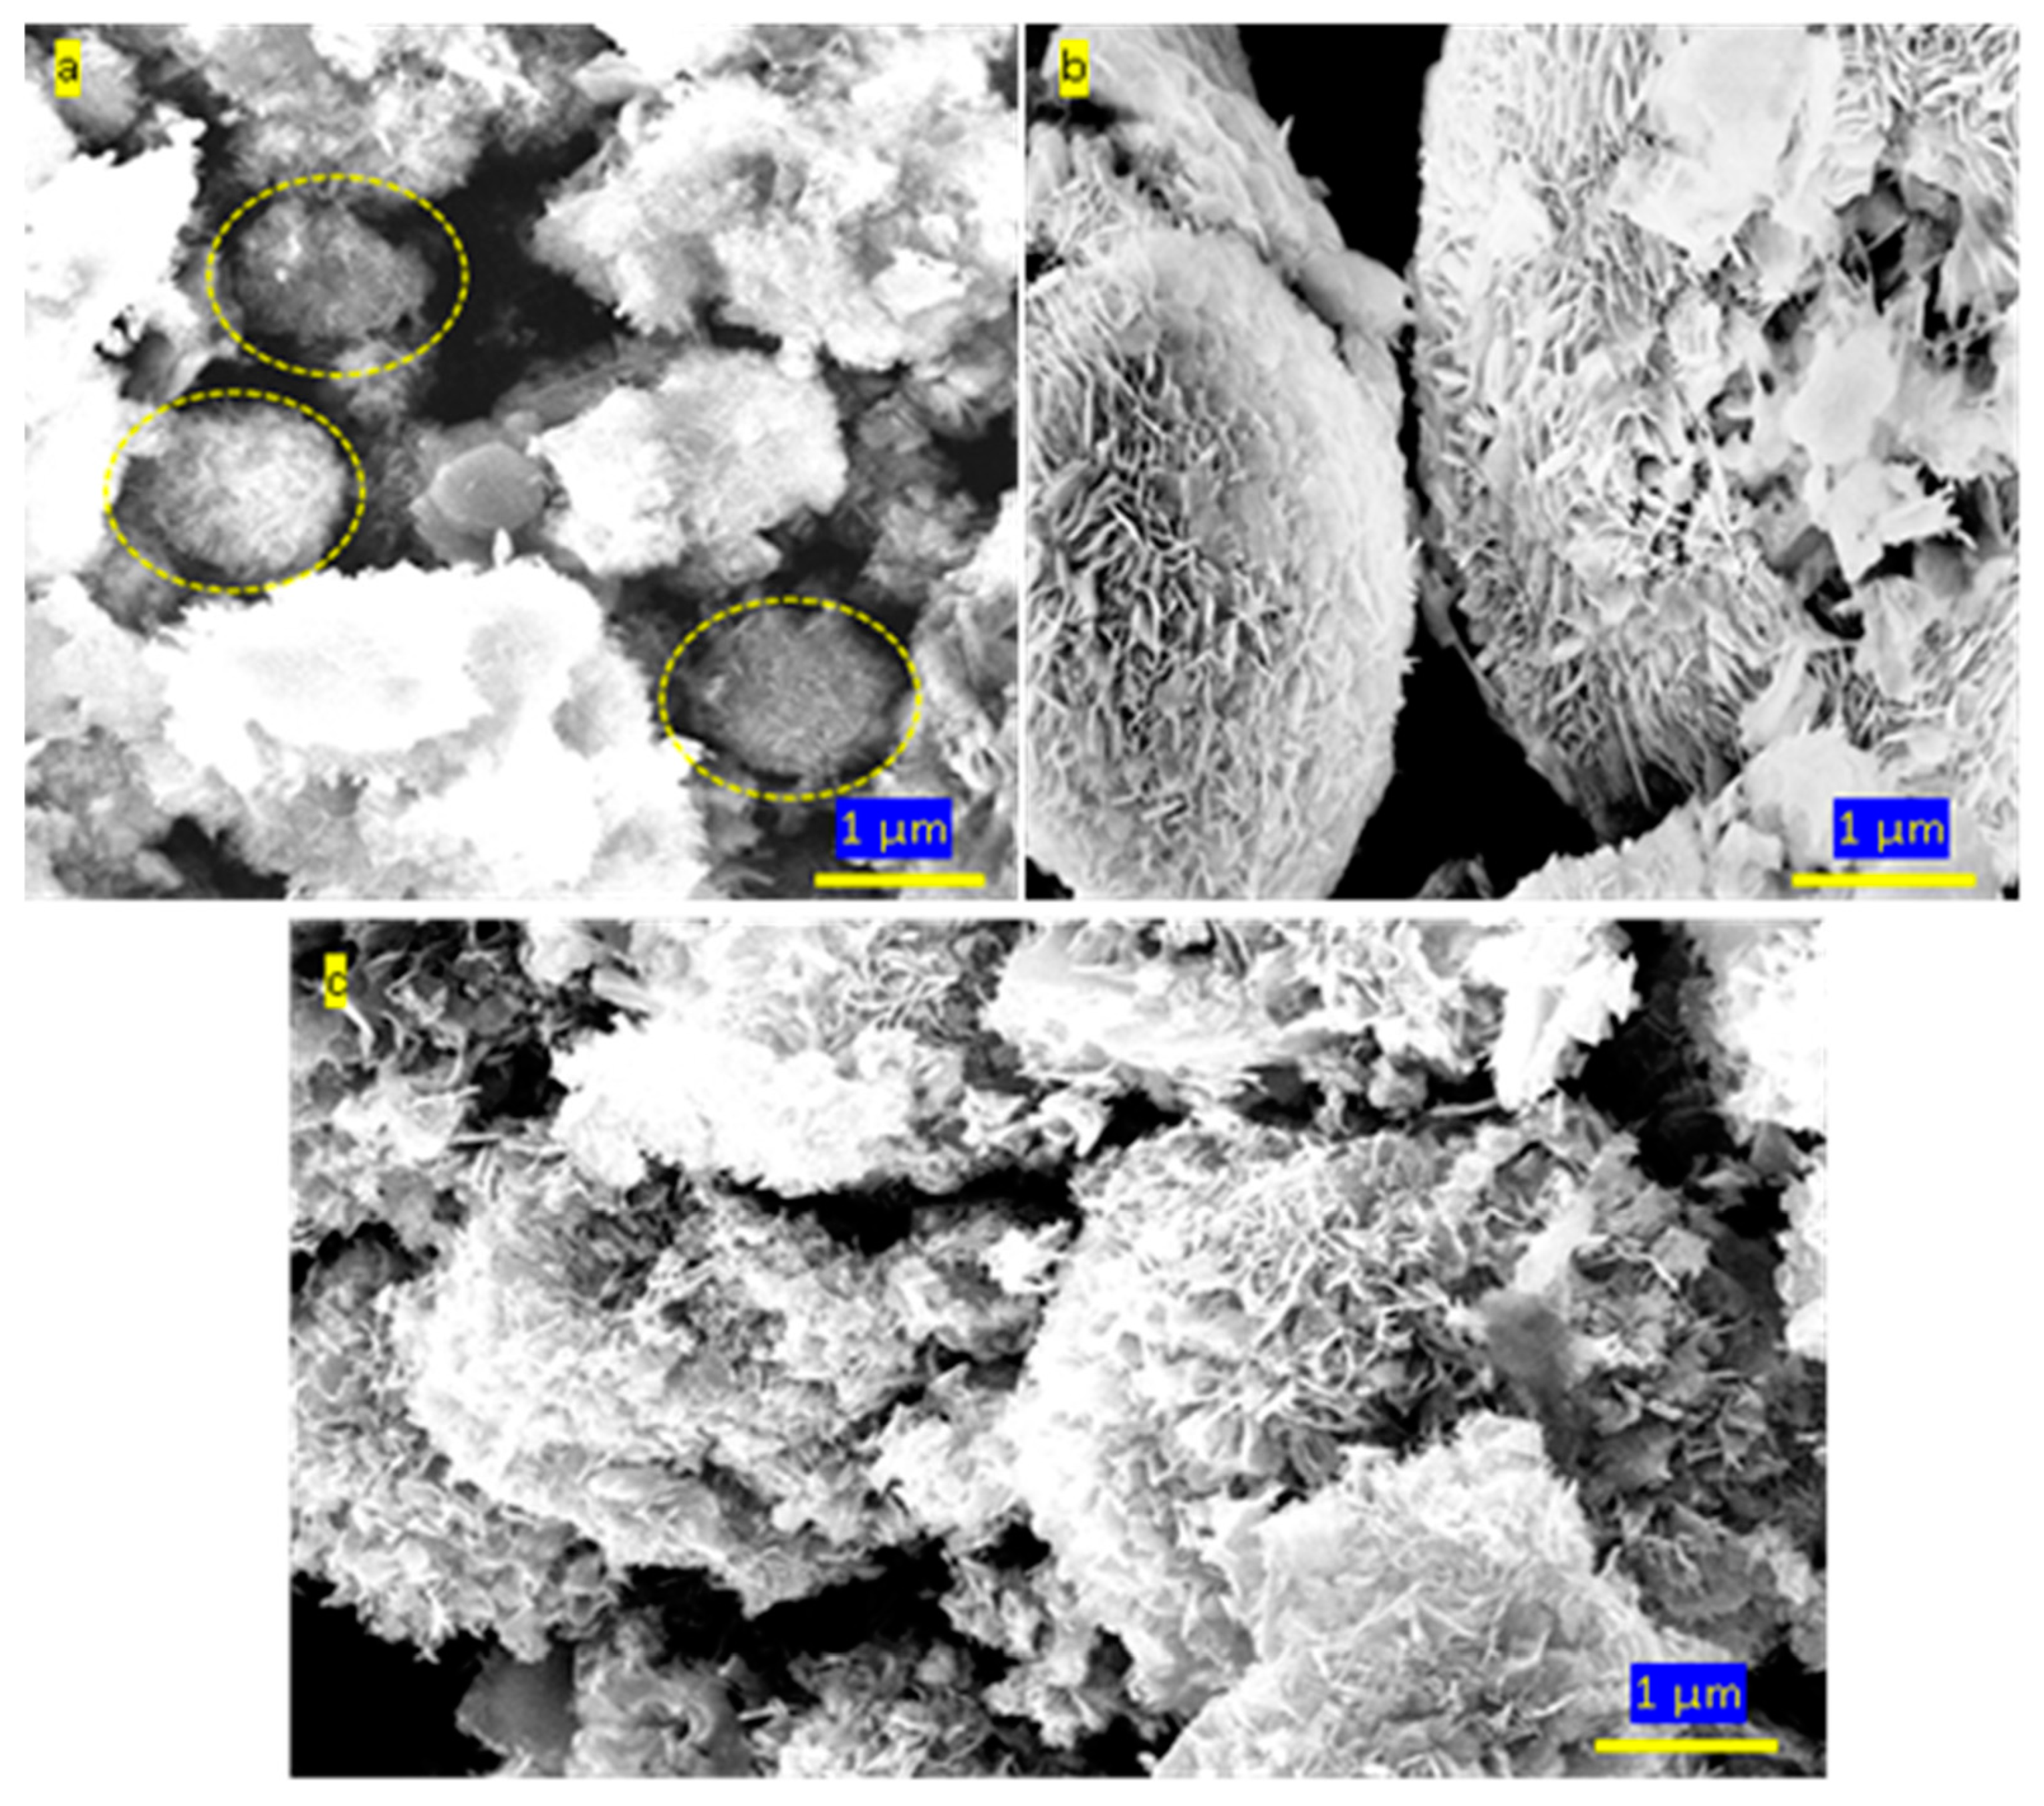
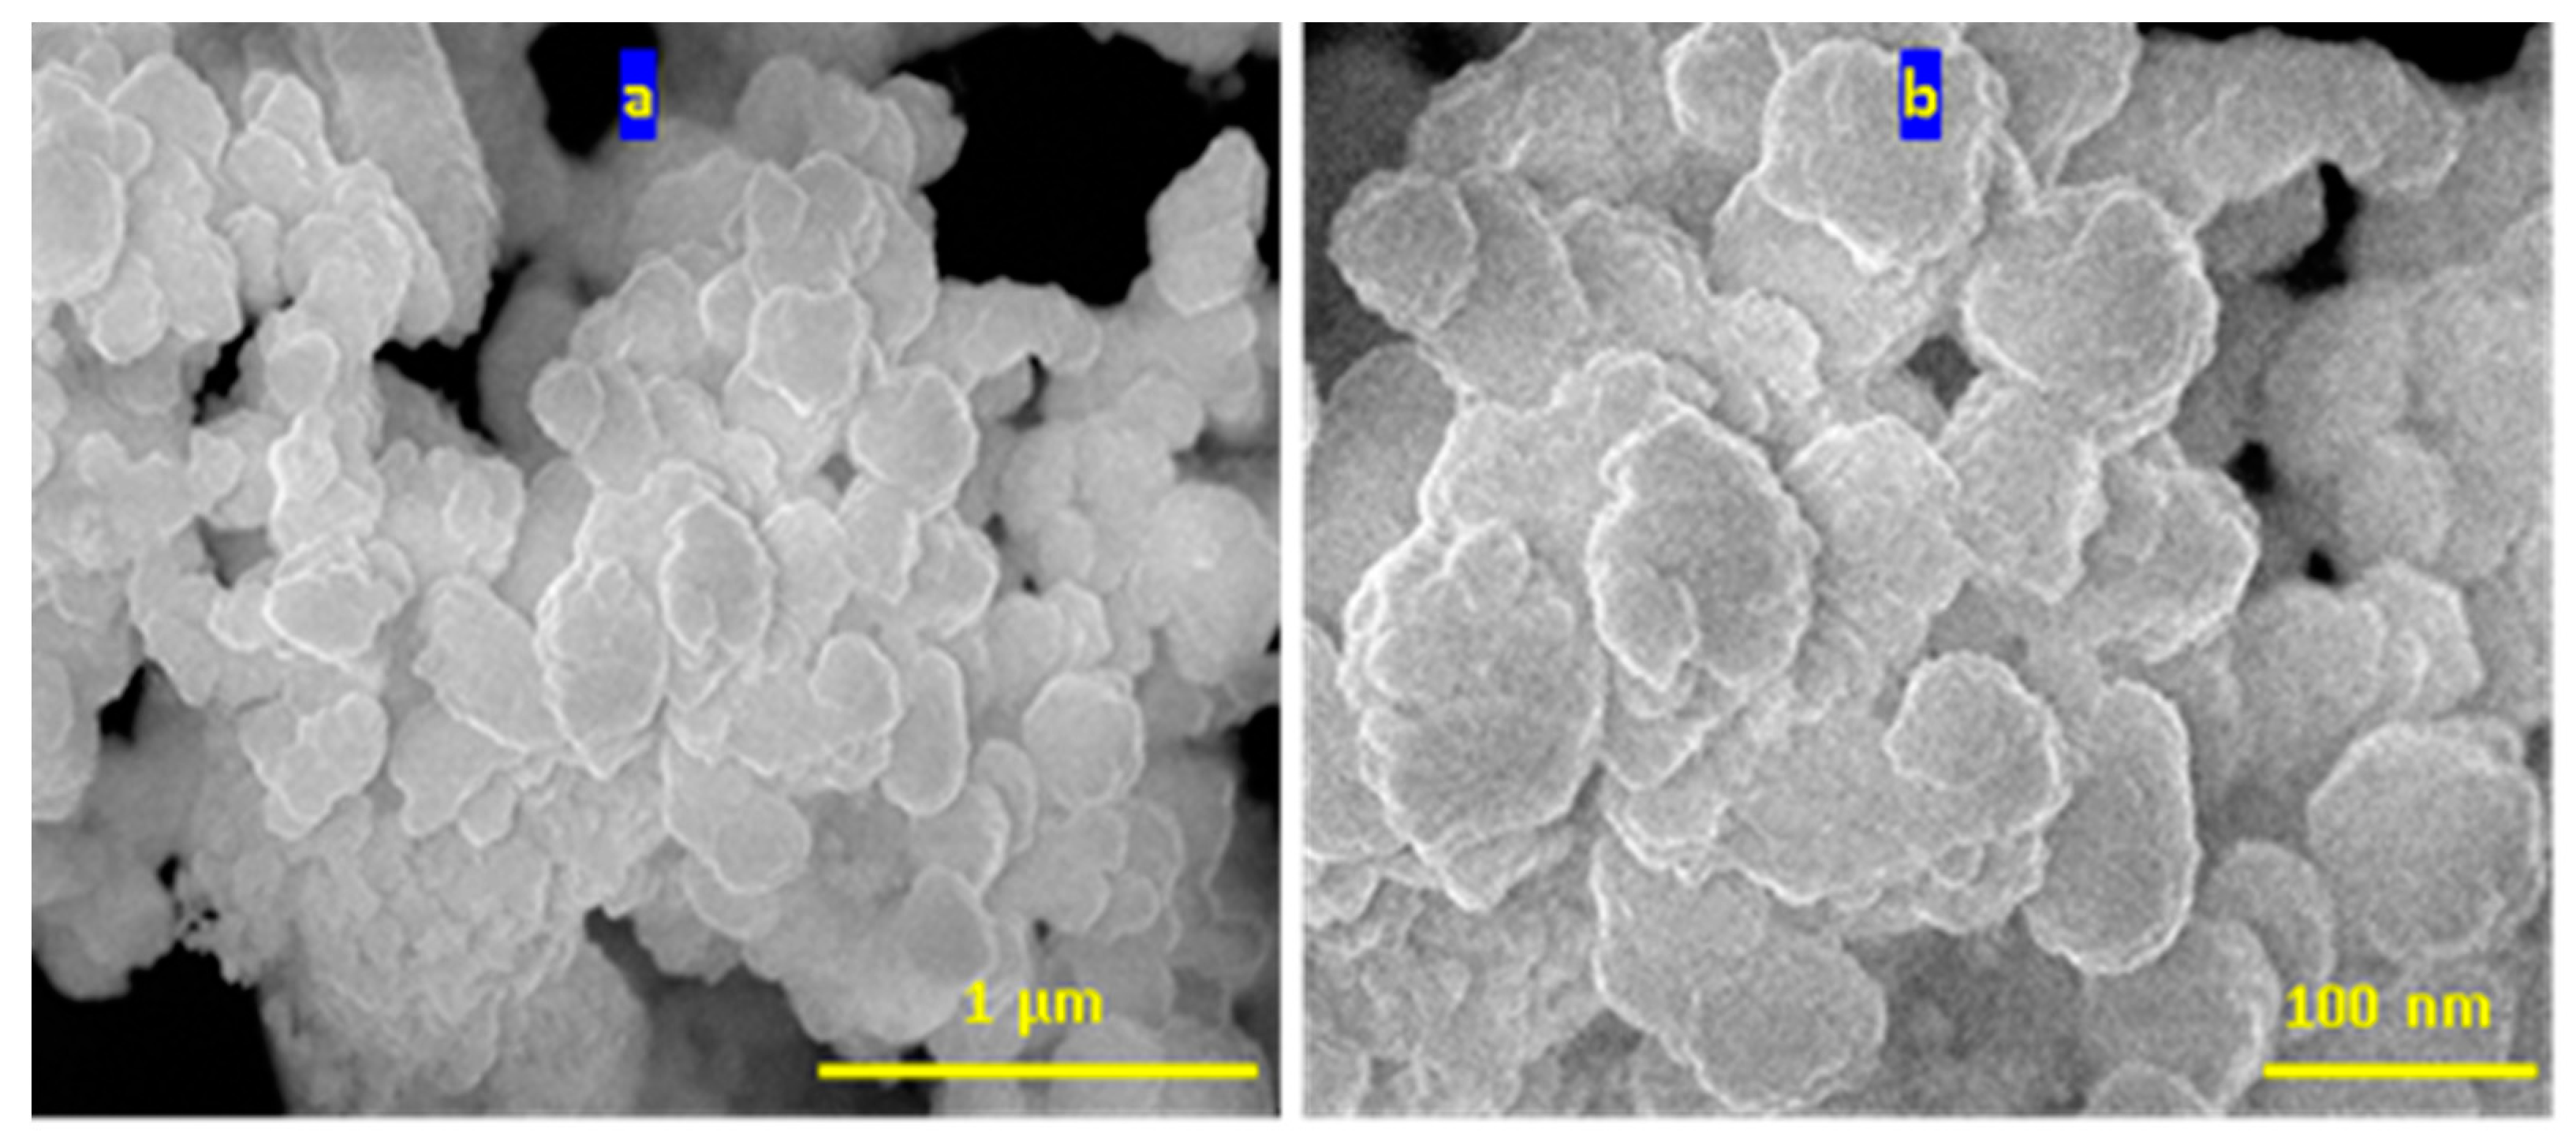
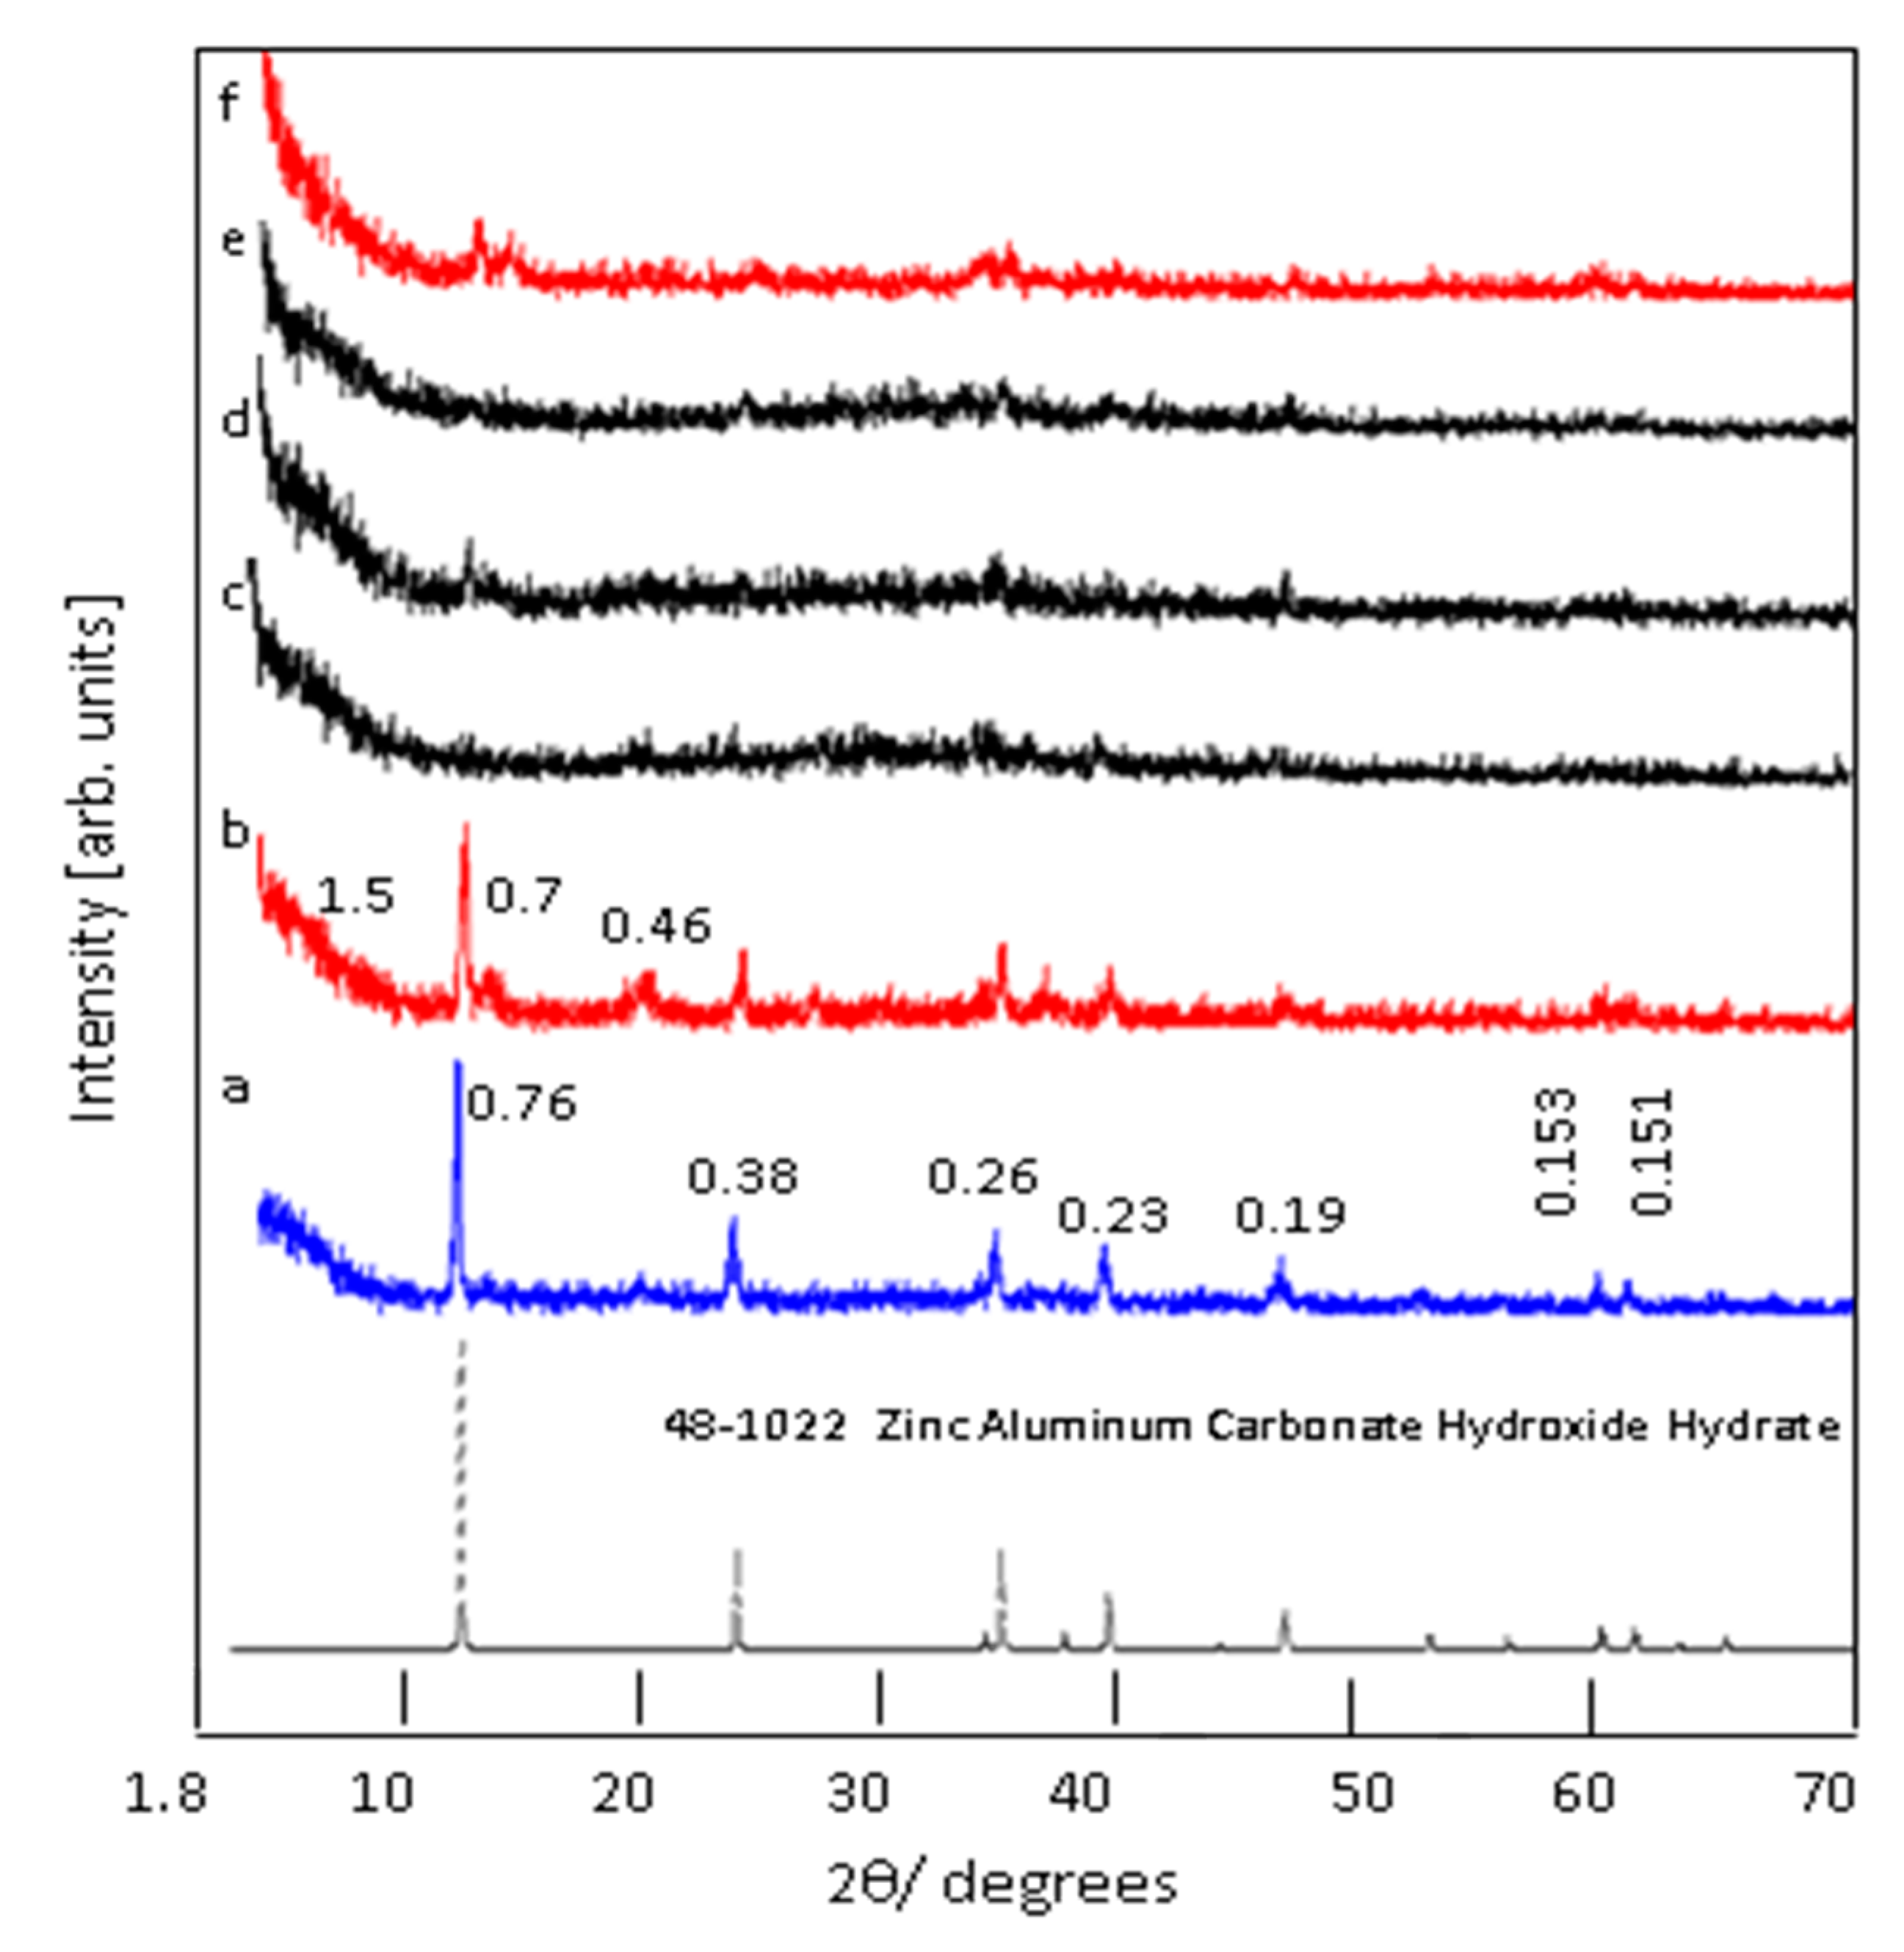
3.1. Confinement of naphthol green B in Zn-Al nanolayerd structures
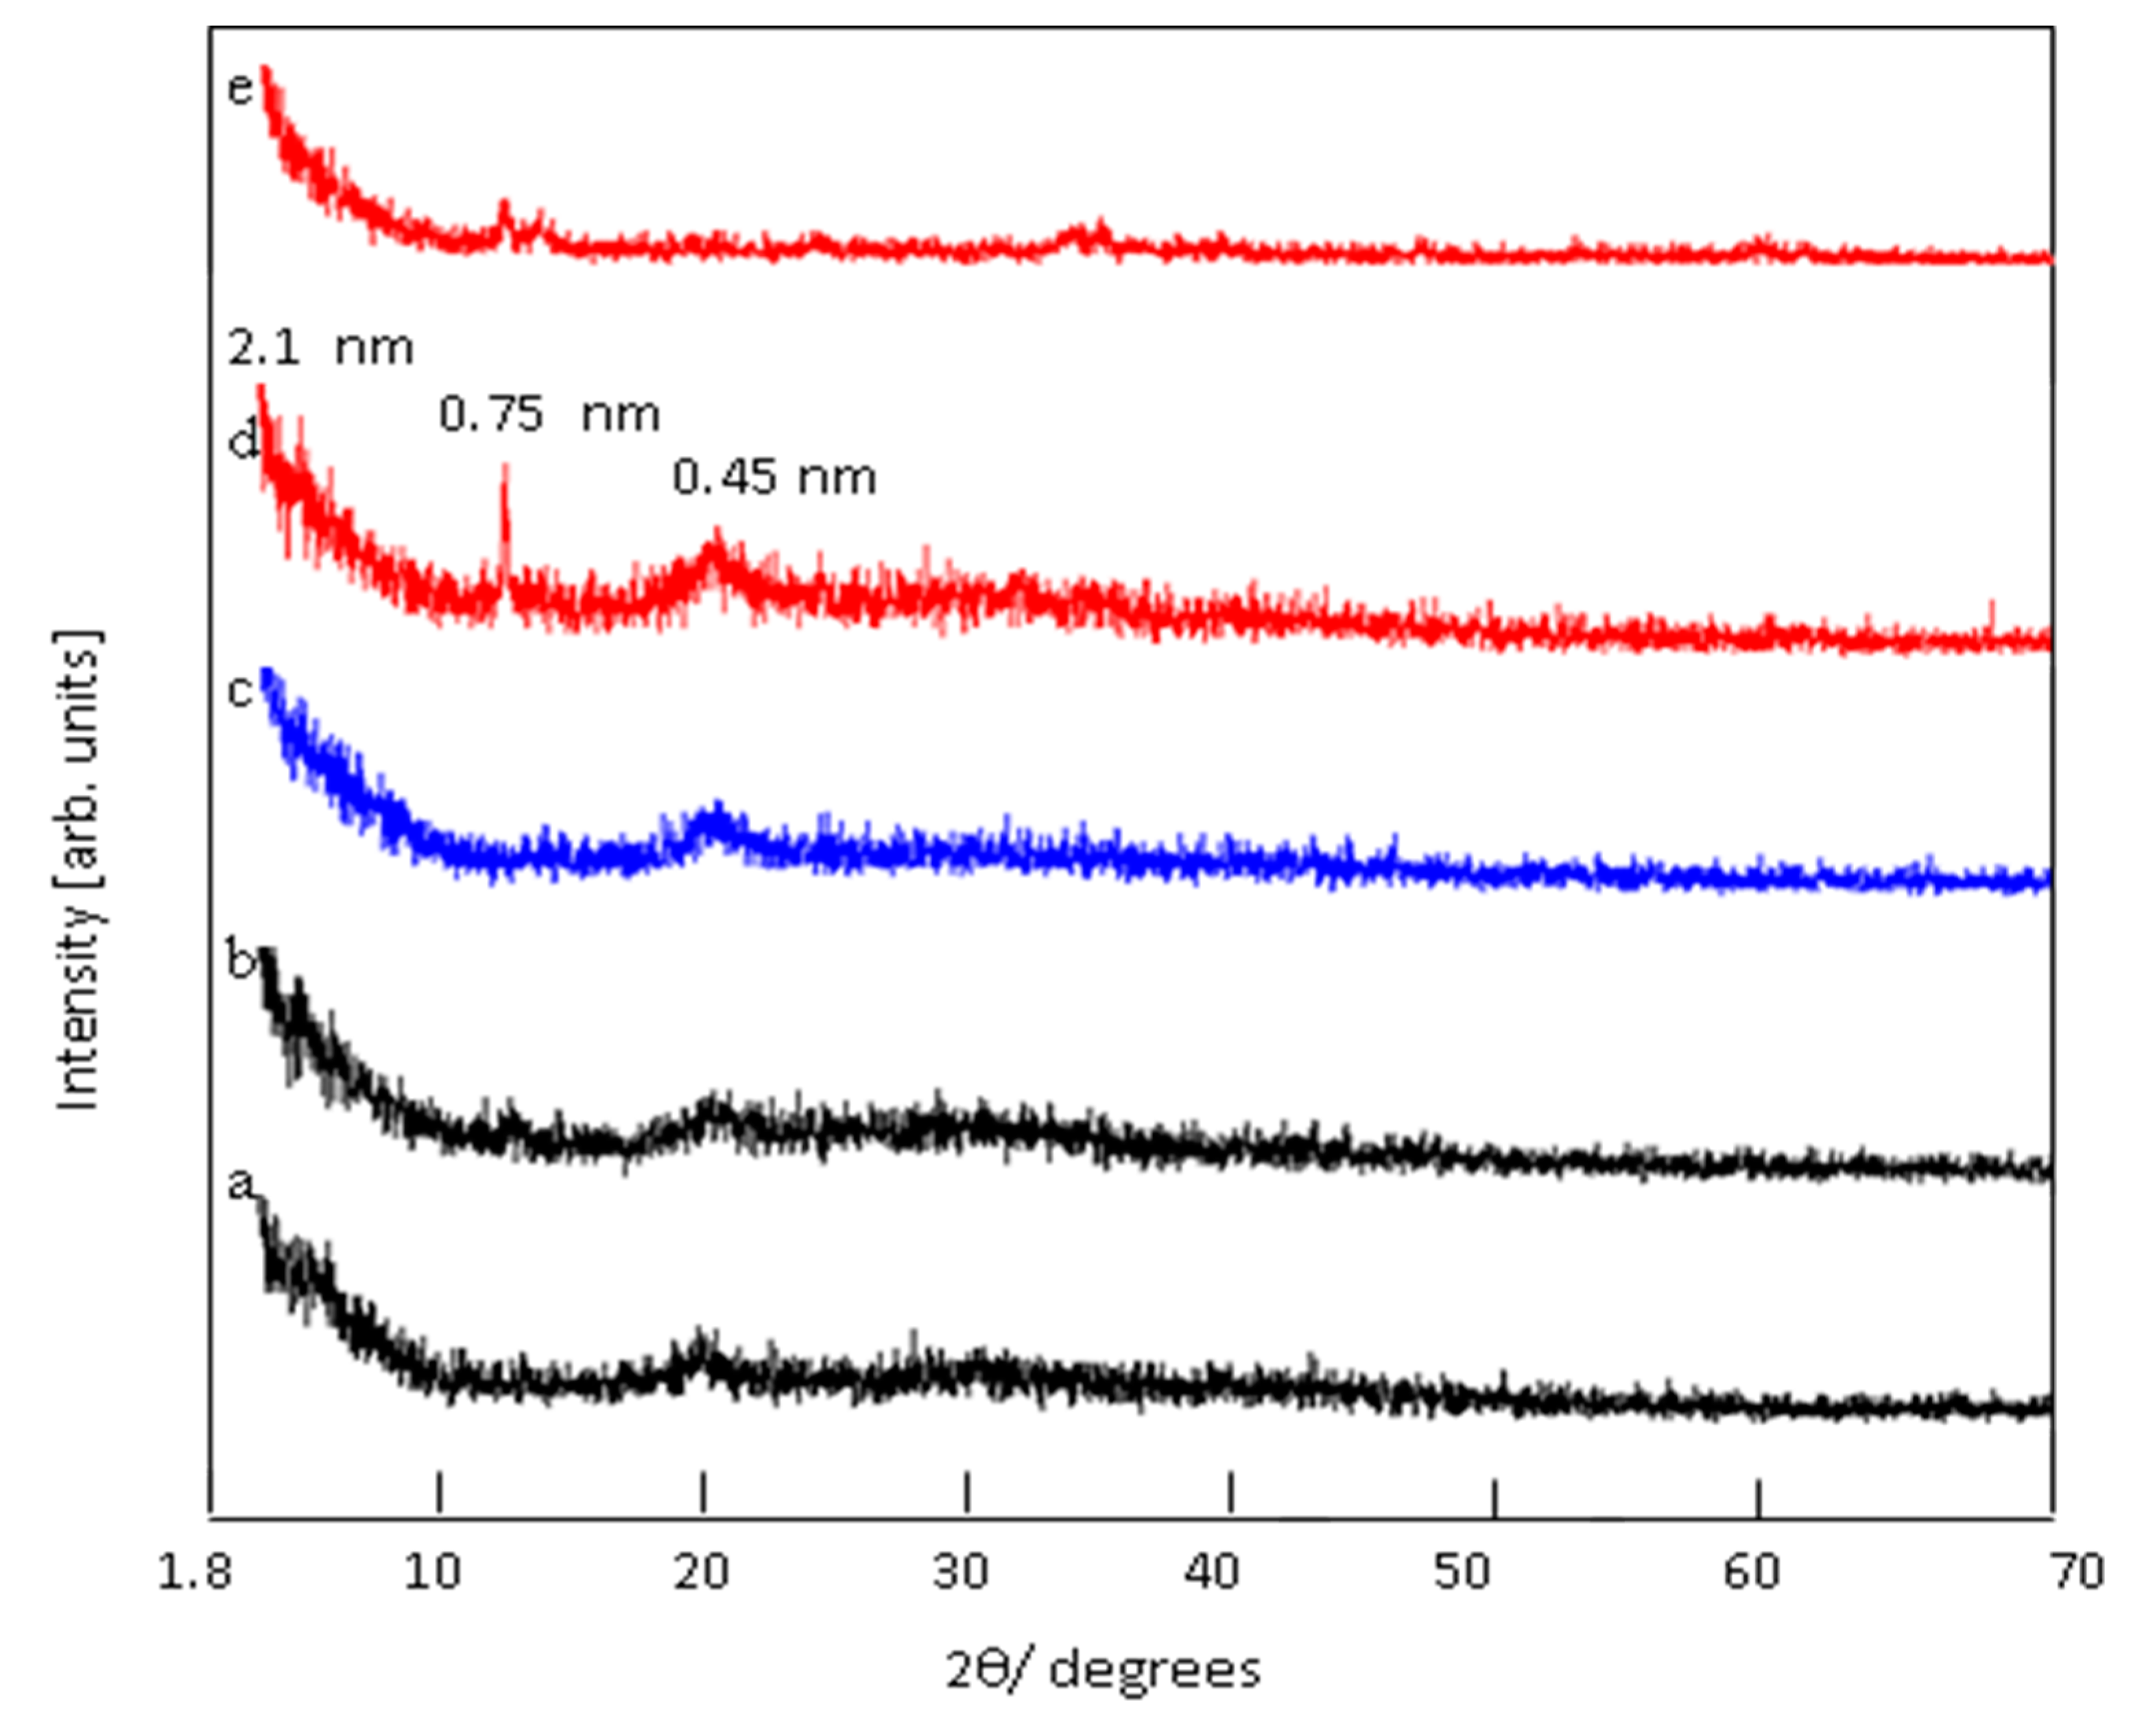
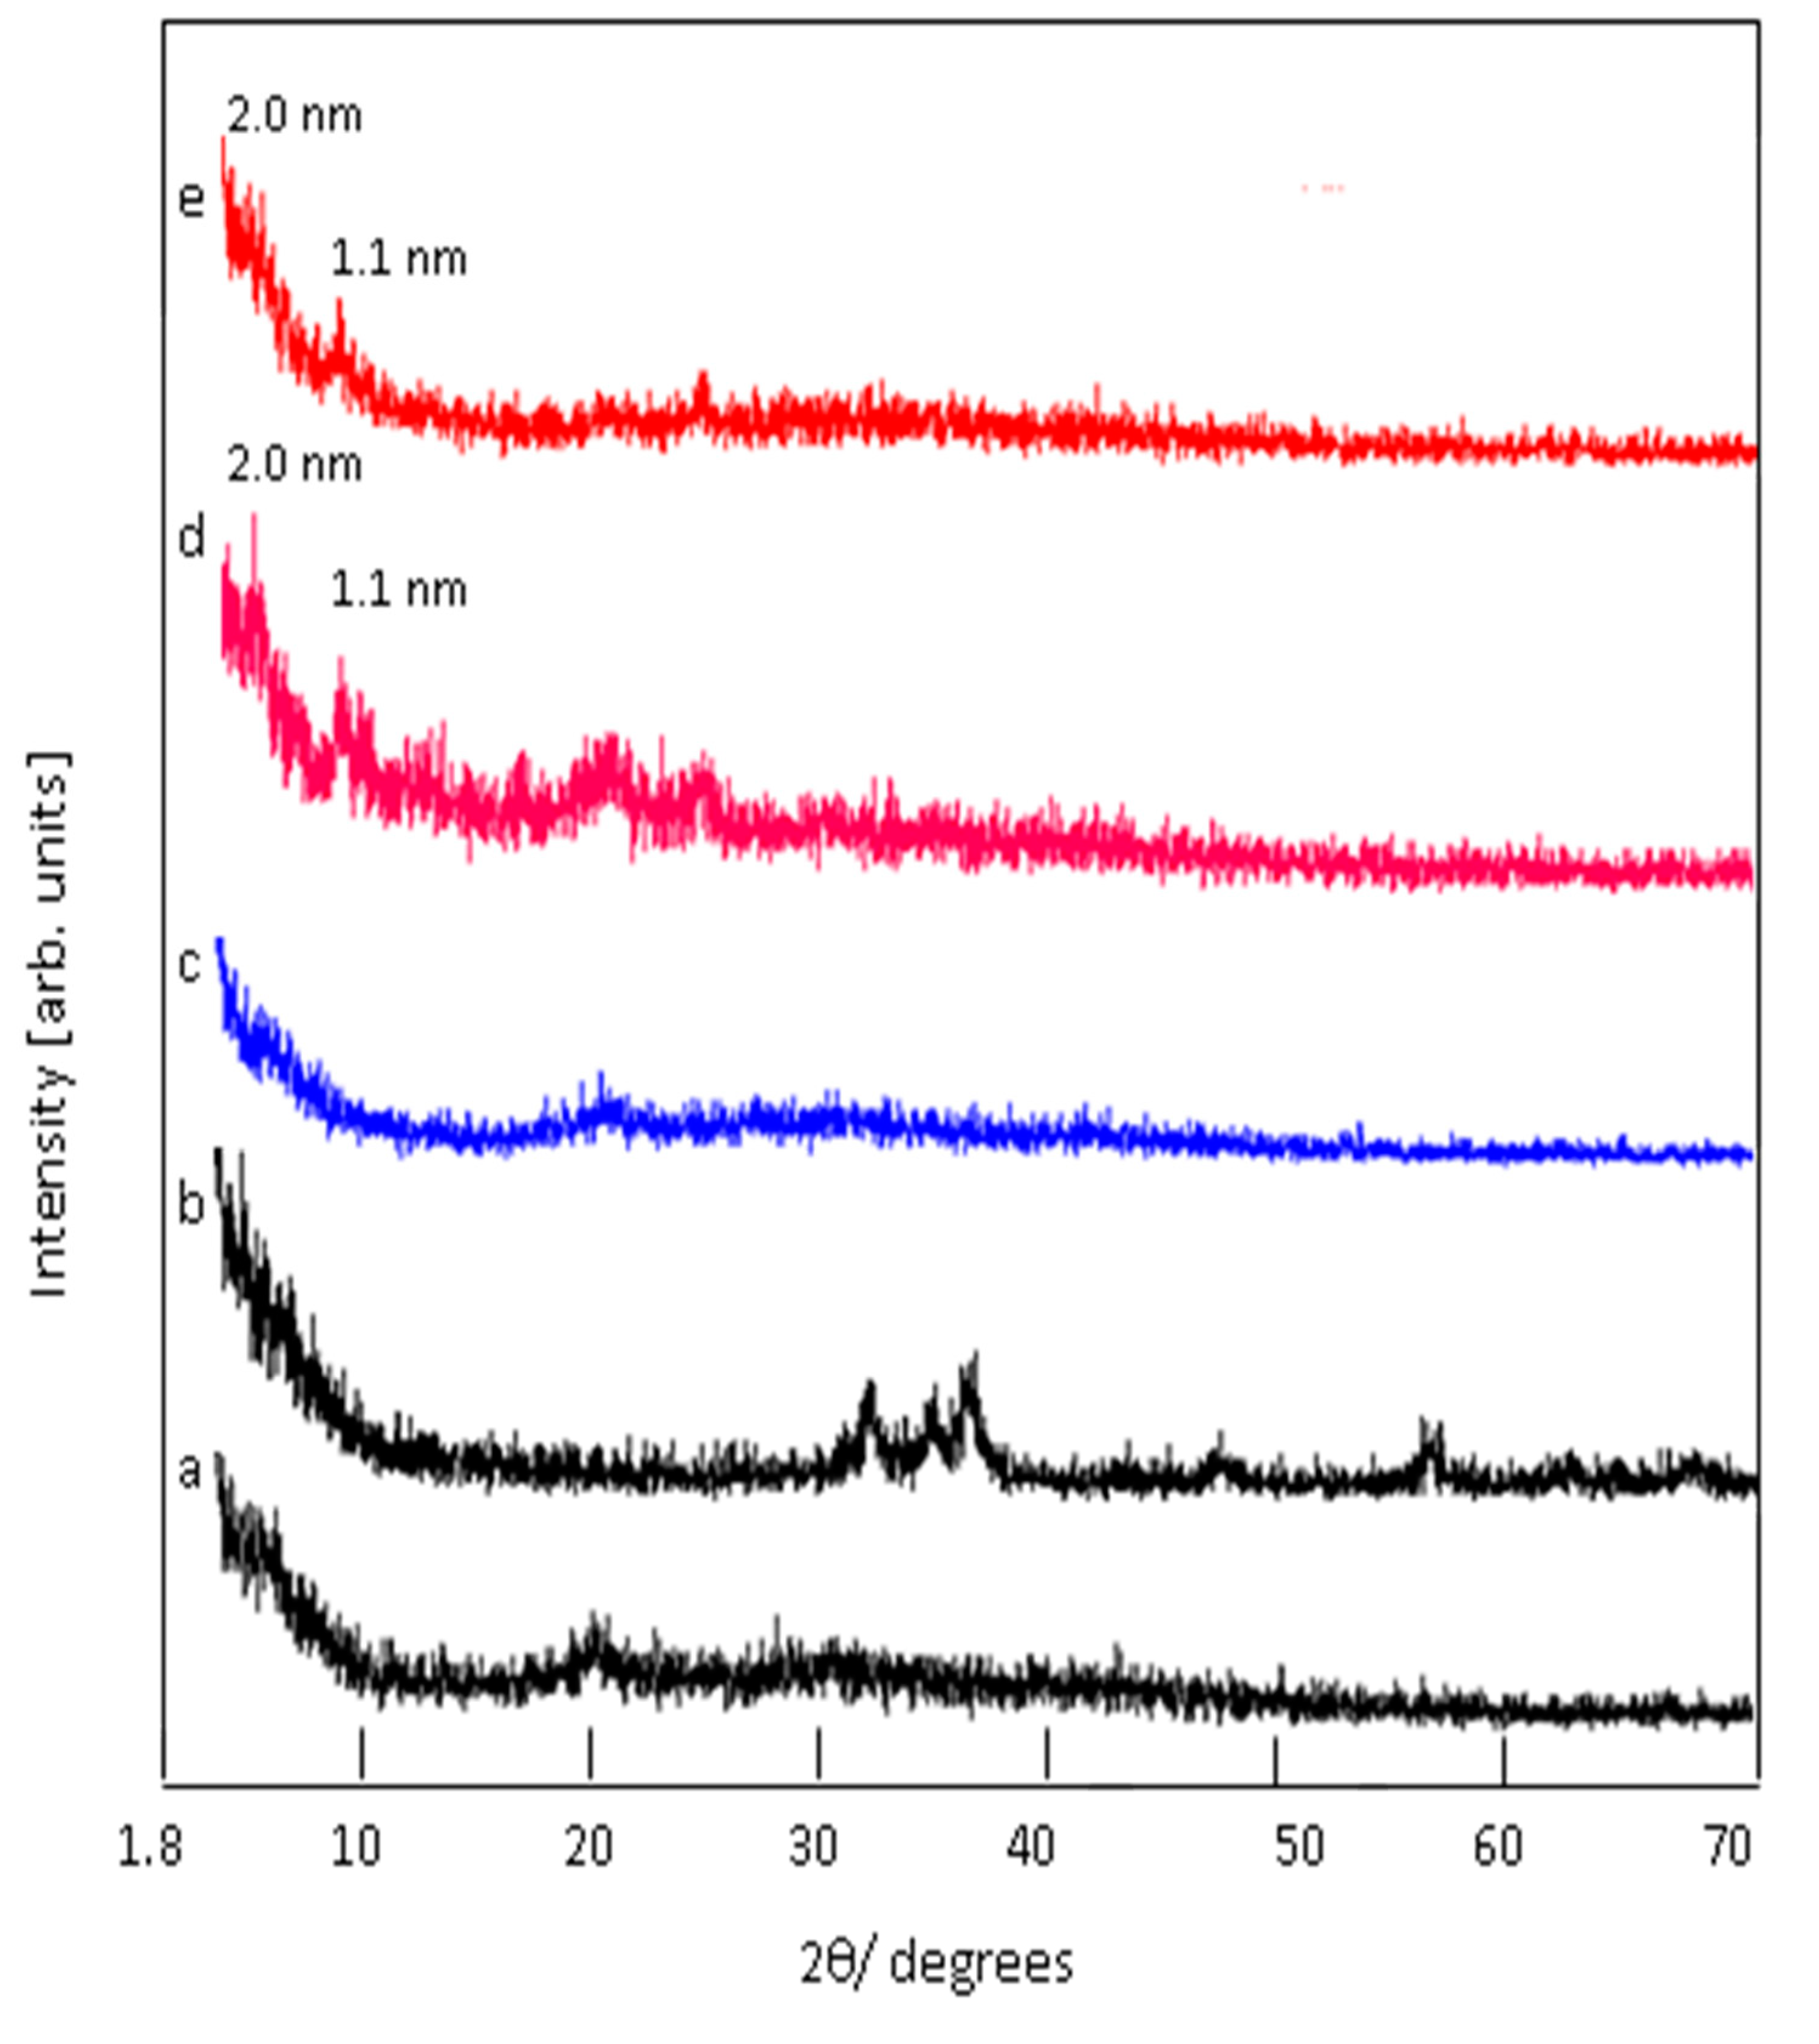
3.2. Colored polymeric nanocomposites
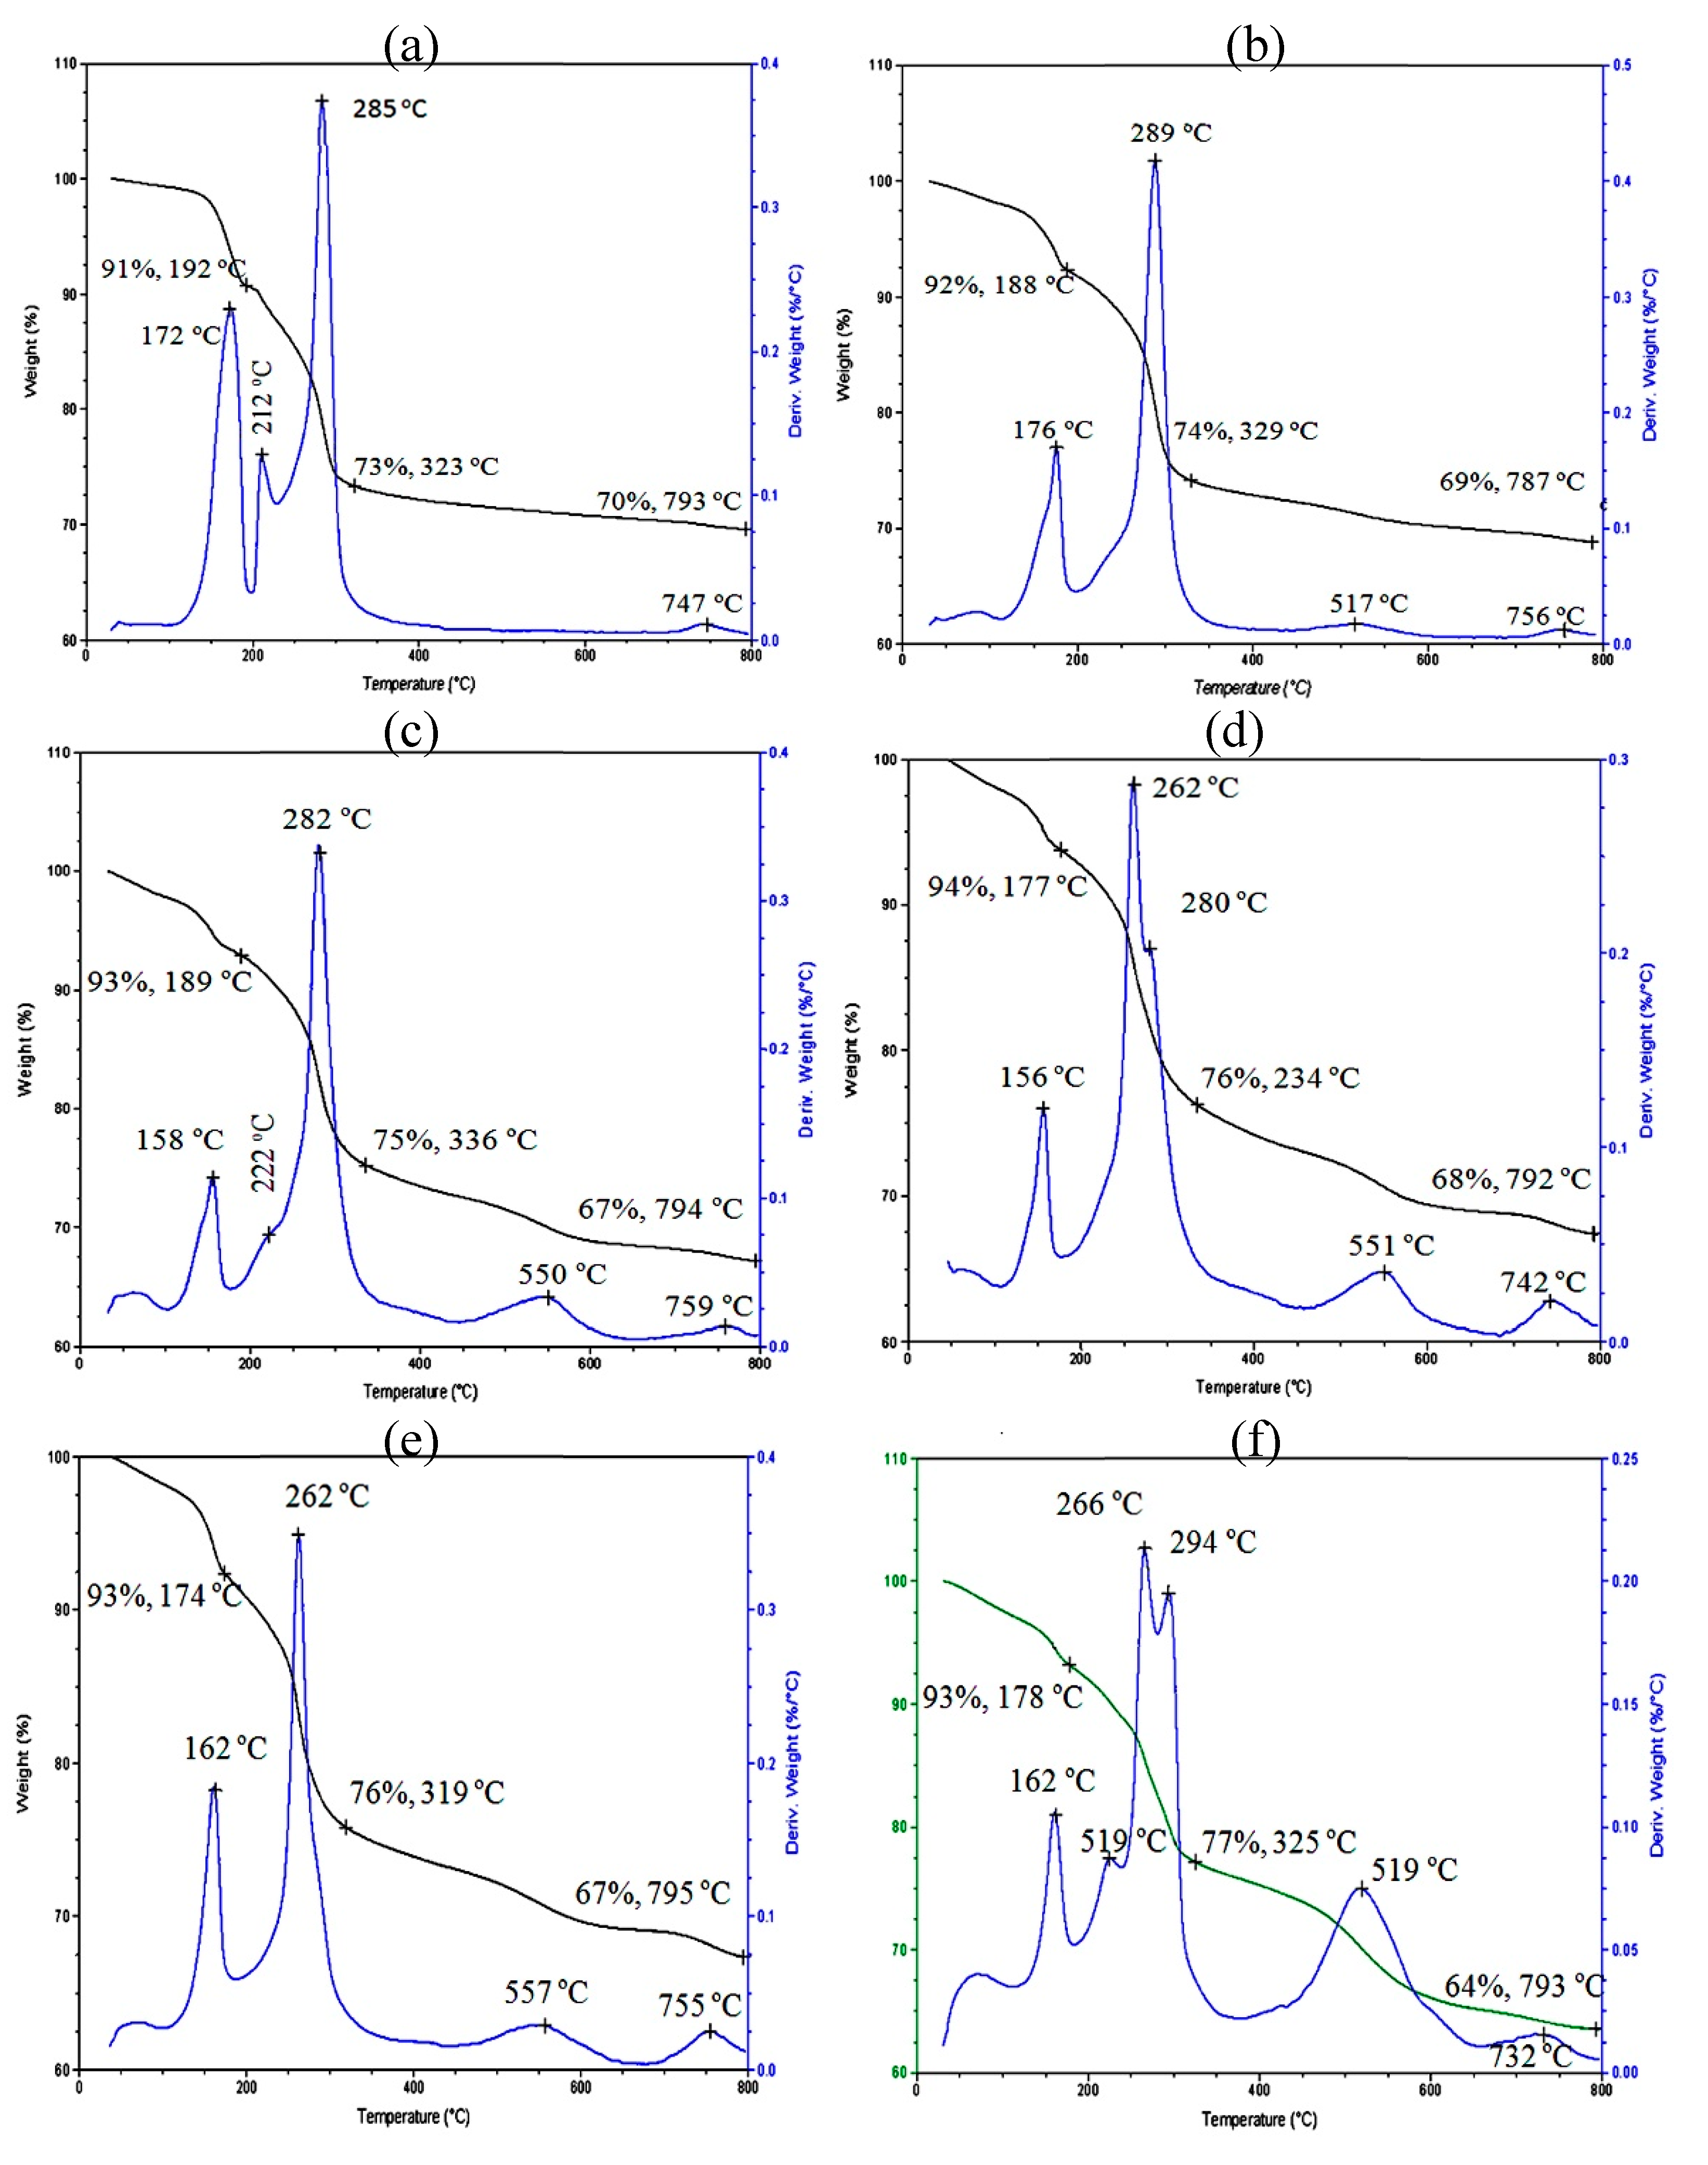
3.3. Thermal Stability
3.4. Optical Properties
4. Discussion
5. Conclusions
Acknowledgments
References
- Factori, I.M.; Amaral, J.M.; Camani, P.H.; Rosa, D.S.; Lima, B.A.; Brocchi, M.; da Silva, E.R.; Souza, J.S. ZnO Nanoparticle/Poly(vinyl alcohol) Nanocomposites via Microwave-Assisted Sol–Gel Synthesis for Structural Materials, UV Shielding, and Antimicrobial Activity. ACS Appl. Nano Mater. 2021, 4, 7371–7383. [Google Scholar] [CrossRef]
- Ngo, I.L.; Vattikuti, S.V.P.; Byon, C. A modified Hashin-Shtrikman model for predicting the thermal conductivity of polymer composites reinforced with randomly distributed hybrid fillers. International Journal of Heat and Mass Transfer 2017, 114, 727–734. [Google Scholar] [CrossRef]
- Jahani, D.; Nazari, A.; Ghourbanpour, J.; Ameli, A. Polyvinyl Alcohol/Calcium Carbonate Nanocomposites as Efficient and Cost-Effective Cationic Dye Adsorbents. Polymers 2020, 12, 2179. [Google Scholar] [CrossRef] [PubMed]
- Ngo, I.L.; Vattikuti, S.V.P.; Byon, C. Effects of thermal contact resistance on the thermal conductivity of core–shell nanoparticle polymer composites. Journal of Heat and Mass Transfer 2016, 102, 713–722. [Google Scholar] [CrossRef]
- Brza, M.A.; Aziz, S.B.; Anuar, H.; Al Hazza, M.H.F. From green remediation to polymer hybrid fabrication with improved optical band gaps. Int. J. Mol. Sci. 2019, 20, 3910. [Google Scholar] [CrossRef]
- Aziz, S.B.; Nofal, M.M.; Ghareeb, H.O.; Dannoun EM, A.; Hussen, S.A.; Hadi, J.M.; Ahmed, K.K.; Hussein, A.M. Characteristics of Poly(vinyl Alcohol) (PVA) Based Composites Integrated with Green Synthesized Al3+-Metal Complex: Structural, Optical, and Localized Density of State Analysis. Polymers 2021, 13, 1316. [Google Scholar] [CrossRef]
- Anna, P.; Petr, B.; David, H.; Eva, K.; Kamil, L.; Eva, V.; Frantisˇek, K.; Toma´sˇ, G. High-temperature X-ray powder diffraction as a tool for characterization of smectites, layered double hydroxides, and their intercalates with porphyrins. Appl Clay Sci 2010, 49, 363–371. [Google Scholar]
- Ha, J.; Xanthos, M. Novel modifiers for layered double hydroxides and their effects on the properties of polylactic acid composites. Appl Clay Sci 2010, 47, 303–310. [Google Scholar] [CrossRef]
- Chang Ch Lee, K.; Huang, C.h. The Optical Properties of Metal-Free Polymer Films with Self-Assembled Nanoparticles. Polymers 2021, 13, 4230. [Google Scholar] [CrossRef]
- Hibino, T. New nanocomposite hydrogels containing layered double hydroxide. Appl Clay Sci 2010, 50, 282–287. [Google Scholar] [CrossRef]
- Kong, X.; Jin, L.; Wei, M.; Duan, X. Antioxidant drugs intercalated into layered double hydroxide: structure and in vitro release. Appl Clay Sci 2010, 49, 324–329. [Google Scholar] [CrossRef]
- Shao, C.; Kim, H.Y.; Gong, J.; et al. Fiber mats of poly(vinyl alcohol)/silica composite via electrospinning. Mater Lett 2003, 57, 1579–1584. [Google Scholar] [CrossRef]
- Goodship, V.; Jacobs, D. Polyvinyl alcohol: Materials, processing and applications. UK: Rapra Review Report, Smithers Rapra Technology, 2005, p.12.
- Lamastra, F.R.; Bianco, A.; Meriggi, A.; et al. Nanohybrid PVA/ZrO2 and PVA/Al2O3 electrospun mats. Chem Eng J 2008, 145, 169–175. [Google Scholar] [CrossRef]
- Cascone, M.G.; Lazzeri, L.; Sparvoli, E.; et al. Morphological evaluation of bioartificial hydrogels as potential tissue engineering scaffolds. J Mater Sci Mater Med 2004, 5, 1309–1313. [Google Scholar] [CrossRef] [PubMed]
- Noguchi, T.; Yamamuro, T.; Oka, M.; et al. Poly(vinyl alcohol) hydrogel as an artificial articular cartilage: evaluation of biocompatibility. J Appl Biomater 1991, 2, 101–107. [Google Scholar] [CrossRef]
- Thanoo, B.; Sunny, M.; Jayakrishnan, A. Controlled release of oral drugs from cross-linked polyvinyl alcohol microspheres. J Pharm Pharmacol 1993, 45, 16–20. [Google Scholar] [CrossRef]
- Mangiapia, G.; Ricciardi, R.; Auriemma, F.; et al. Mesoscopic and microscopic investigation on poly(vinyl alcohol) hydrogels in the presence of sodium decylsulfate. J Phys Chem B 2007, 111, 2166–2173. [Google Scholar] [CrossRef]
- Masters, K.; Leibovich, S.; Belem, P.; et al. Effects of nitric oxide releasing poly(vinyl alcohol) hydrogel dressings on dermal wound healing in diabetic mice. Wound Repair Regen 2002, 10, 286–294. [Google Scholar] [CrossRef] [PubMed]
- Shih, C.Y.; Lai, J.Y. Polyvinyl alcohol plasma deposited nylon 4 membrane for hemodialysis. J Biomed Mater Res 1993, 27, 983–989. [Google Scholar] [CrossRef]
- Mallakpour, S.; Dinari, M. Enhancement in thermal properties of poly(vinyl alcohol) nanocomposites reinforced with Al2O3 nanoparticles. Journal of Reinforced Plastics and Composites 2013, 32, 217–224. [Google Scholar] [CrossRef]
- Mallakpour, S.; Jarang, N. Mechanical, thermal and optical properties of nanocomposite films prepared by solution mixing of poly(vinyl alcohol) with titania nanoparticles modified with citric acid and vitamin C. Journal of Plastic Film & Sheeting 2016, 32, 293–316. [Google Scholar]
- Du, H.; Liu, S.; You, F.; Wang, J.; Ren, Z.; Wu, Z. Flexible free-standing polyaniline/poly(vinyl alcohol) composite electrode with good capacitance performance and shape memory behavior. Progress in Natural Science: Materials International 2021, 31, 557–566. [Google Scholar] [CrossRef]
- Abd-Elrahman, M. I, Enhancement of thermal stability and degradation kinetics study of poly(vinyl alcohol)/zinc oxide nanoparticles composite. Journal of Thermoplastic Composite Materials 2014, 27, 160–166. [Google Scholar] [CrossRef]
- Farrag, E.A.M.; Abdel-Rahem, R.A.; Ibrahim, S.S.; Ayesh, A.S. Electrical and optical properties of well dispersed MWCNTs/PVA nanocomposites under different pH conditions. Journal of Thermoplastic Composite Materials 2019, 32, 442–453. [Google Scholar] [CrossRef]
- Peranidze, K.K.; Safronova, T.V.; Kil’deeva, N.R.; Chernogortseva, M.V.; Selezneva, I.I.; Shatalova, T.B.; Rau, J.V. Biocompatible composite films and fibers based on Poly(Vinyl alcohol) and powders of calcium salts. Smart Materials in Medicine 2021, 2, 292–301. [Google Scholar] [CrossRef]
- Zand, Z.; Salimi, P.; Mohammadi, M.R.; Bagheri, R.; Chernev, P.; Song, Z.; et al. NickelVanadium layered double hydroxide under water-oxidation reaction: New findings and challenges. ACS Sustain Chem Eng 2019, 7, 17252–62. [Google Scholar] [CrossRef]
- Prasad, C.; Tang, H.; Liu, Q.Q.; Zulfiqar, S.; Shah, S.; Bahadur, I. An overview of semiconductors/layered double hydroxides composites: Properties, synthesis, photocatalytic and photoelectrochemical applications. J Mol Liq 2019, 289, 111114. [Google Scholar] [CrossRef]
- Mallakpour, S.; Hatami, M.; Hussain, C.M. Recent innovations in functionalized layered double hydroxides: Fabrication, characterization, and industrial applications. Advances in Colloid and Interface Science 2020, 283, 102216–102246. [Google Scholar] [CrossRef]
- Perret, E.; Jakubowski, K.; Heuberger, M.; Hufenus, R. Effects of Nanoscale Morphology on Optical Properties of Photoluminescent. Polymers 2022, 14, 3262. [Google Scholar] [CrossRef]
- Beckers, M.; Vad, T.; Mohr, B.; Weise, B.; Steinmann, W.; Gries, T.; Seide, G.; Kentzinger, E.; Bunge, C.-A. Novel Melt-Spun Polymer-Optical Poly(methyl methacrylate) Fibers Studied by Small-Angle X-ray Scattering. Polymers 2017, 9, 60. [Google Scholar] [CrossRef]
- Hansen, H.; Koch, C. Synthesis and characterization of pyroaurite. Appl Clay Sci 1995, 10, 5. [Google Scholar] [CrossRef]
- Ogawa, M.; Ishiic, T.; Miyamotoc, N.; Kuroda, K. Intercalation of a cationic azobenzene into montmorillonite. Appl Clay Sci 2003, 22, 179. [Google Scholar] [CrossRef]
- Yang, Y.; Liu, C.; Wu, H. Preparation and properties of poly vinyl alcohol/exfoliated zirconium phosphate nanocomposite films. Polym Test 2009, 28, 371–377. [Google Scholar] [CrossRef]
- Qian, X.F.; Yin, J.; Huang, J.C.; Yang, X.X.; Guo, Y.F.; Zhu, Z.K. The preparation and characterization of PVA/Ag2s nanocomposite. Mater Chem Phys 2001, 68, 95. [Google Scholar] [CrossRef]
- Miyata, S. Physico-chemical properties of synthetic hydrotalcites inrelation to composition. Clays and Clay Minerals 1980, 28, 50–6. [Google Scholar] [CrossRef]
- Costa, F.R.; Leuteritz, A.; Wagenknecht, U.; Jehnichen, D.; Häußler, L.; Hein-rich, G. intercalation of Mg-Al layered double hydroxide by anionicsurfactants: preparation and characterization. Applied Clay Science 2008, 38, 153–64. [Google Scholar] [CrossRef]
- Kuljanin, J.; Comor, M.I.; Djokovic, V.; Nedeljkovic, J.M. Synthesis and characterization of nanocomposite of polyvinyl alcohol and lead sulfide nanoparticles. Mater Chem Phys 2006, 95, 67. [Google Scholar] [CrossRef]
- Chang Ch Lee, K.; Huang, C.h. The Optical Properties of Metal-Free Polymer Films with Self-Assembled Nanoparticles. Polymers 2021, 13, 4230. [Google Scholar] [CrossRef]
- Alrowaili, Z.A.; Ezzeldien, M.; Mohammed, M.I.; Yahia, I.S. Design of a low-cost laser CUT-OFF filters using carmine dye-doped PVA polymeric composite films. Results in Physics 2020, 18, 103203. [Google Scholar] [CrossRef]
- Aziz, S.B.; Rasheed, M.A.; Hussein, A.M.; Ahmed, H.M. Fabrication of polymer blend composites based on [PVA-PVP]:(Ag2S) with small optical band gaps: Structural and optical properties. Mater. Sci. Semicond. Process. 2017, 71, 197–203. [Google Scholar] [CrossRef]
- GananathaShetty, B.; Vincent Crastab Rithin Kumar, N.B.; Rajesh, K. Raghavendra Bairy. Optical Materials 2019, 95, 109218. [Google Scholar]
- Sauer, M.; Hofkens, J.; Enderlein, J. Basic principles of fluorescence spectroscopy. In: Handbook of fluorescence spectroscopy and imaging: from single molecules to ensembles. P. 1–30.
- Wen, T.; Huang, B.; Zhou, L. Facile Fabrication of Magnetic Poly(Vinyl Alcohol)/Activated Carbon Composite Gel for Adsorptive Removal of Dyes. J. Compos. Sci. 2022, 6, 55. [Google Scholar] [CrossRef]
- Xu, L.; Zhang, Y.; Pan, H.; Xu, N.; Mei, C.; Mao, H.; Zhang, W.; Cai, J.; Xu, C. Preparation and Performance of Radiata-Pine-Derived Polyvinyl Alcohol/Carbon Quantum Dots Fluorescent Films. Materials 2020, 13, 67. [Google Scholar] [CrossRef] [PubMed]
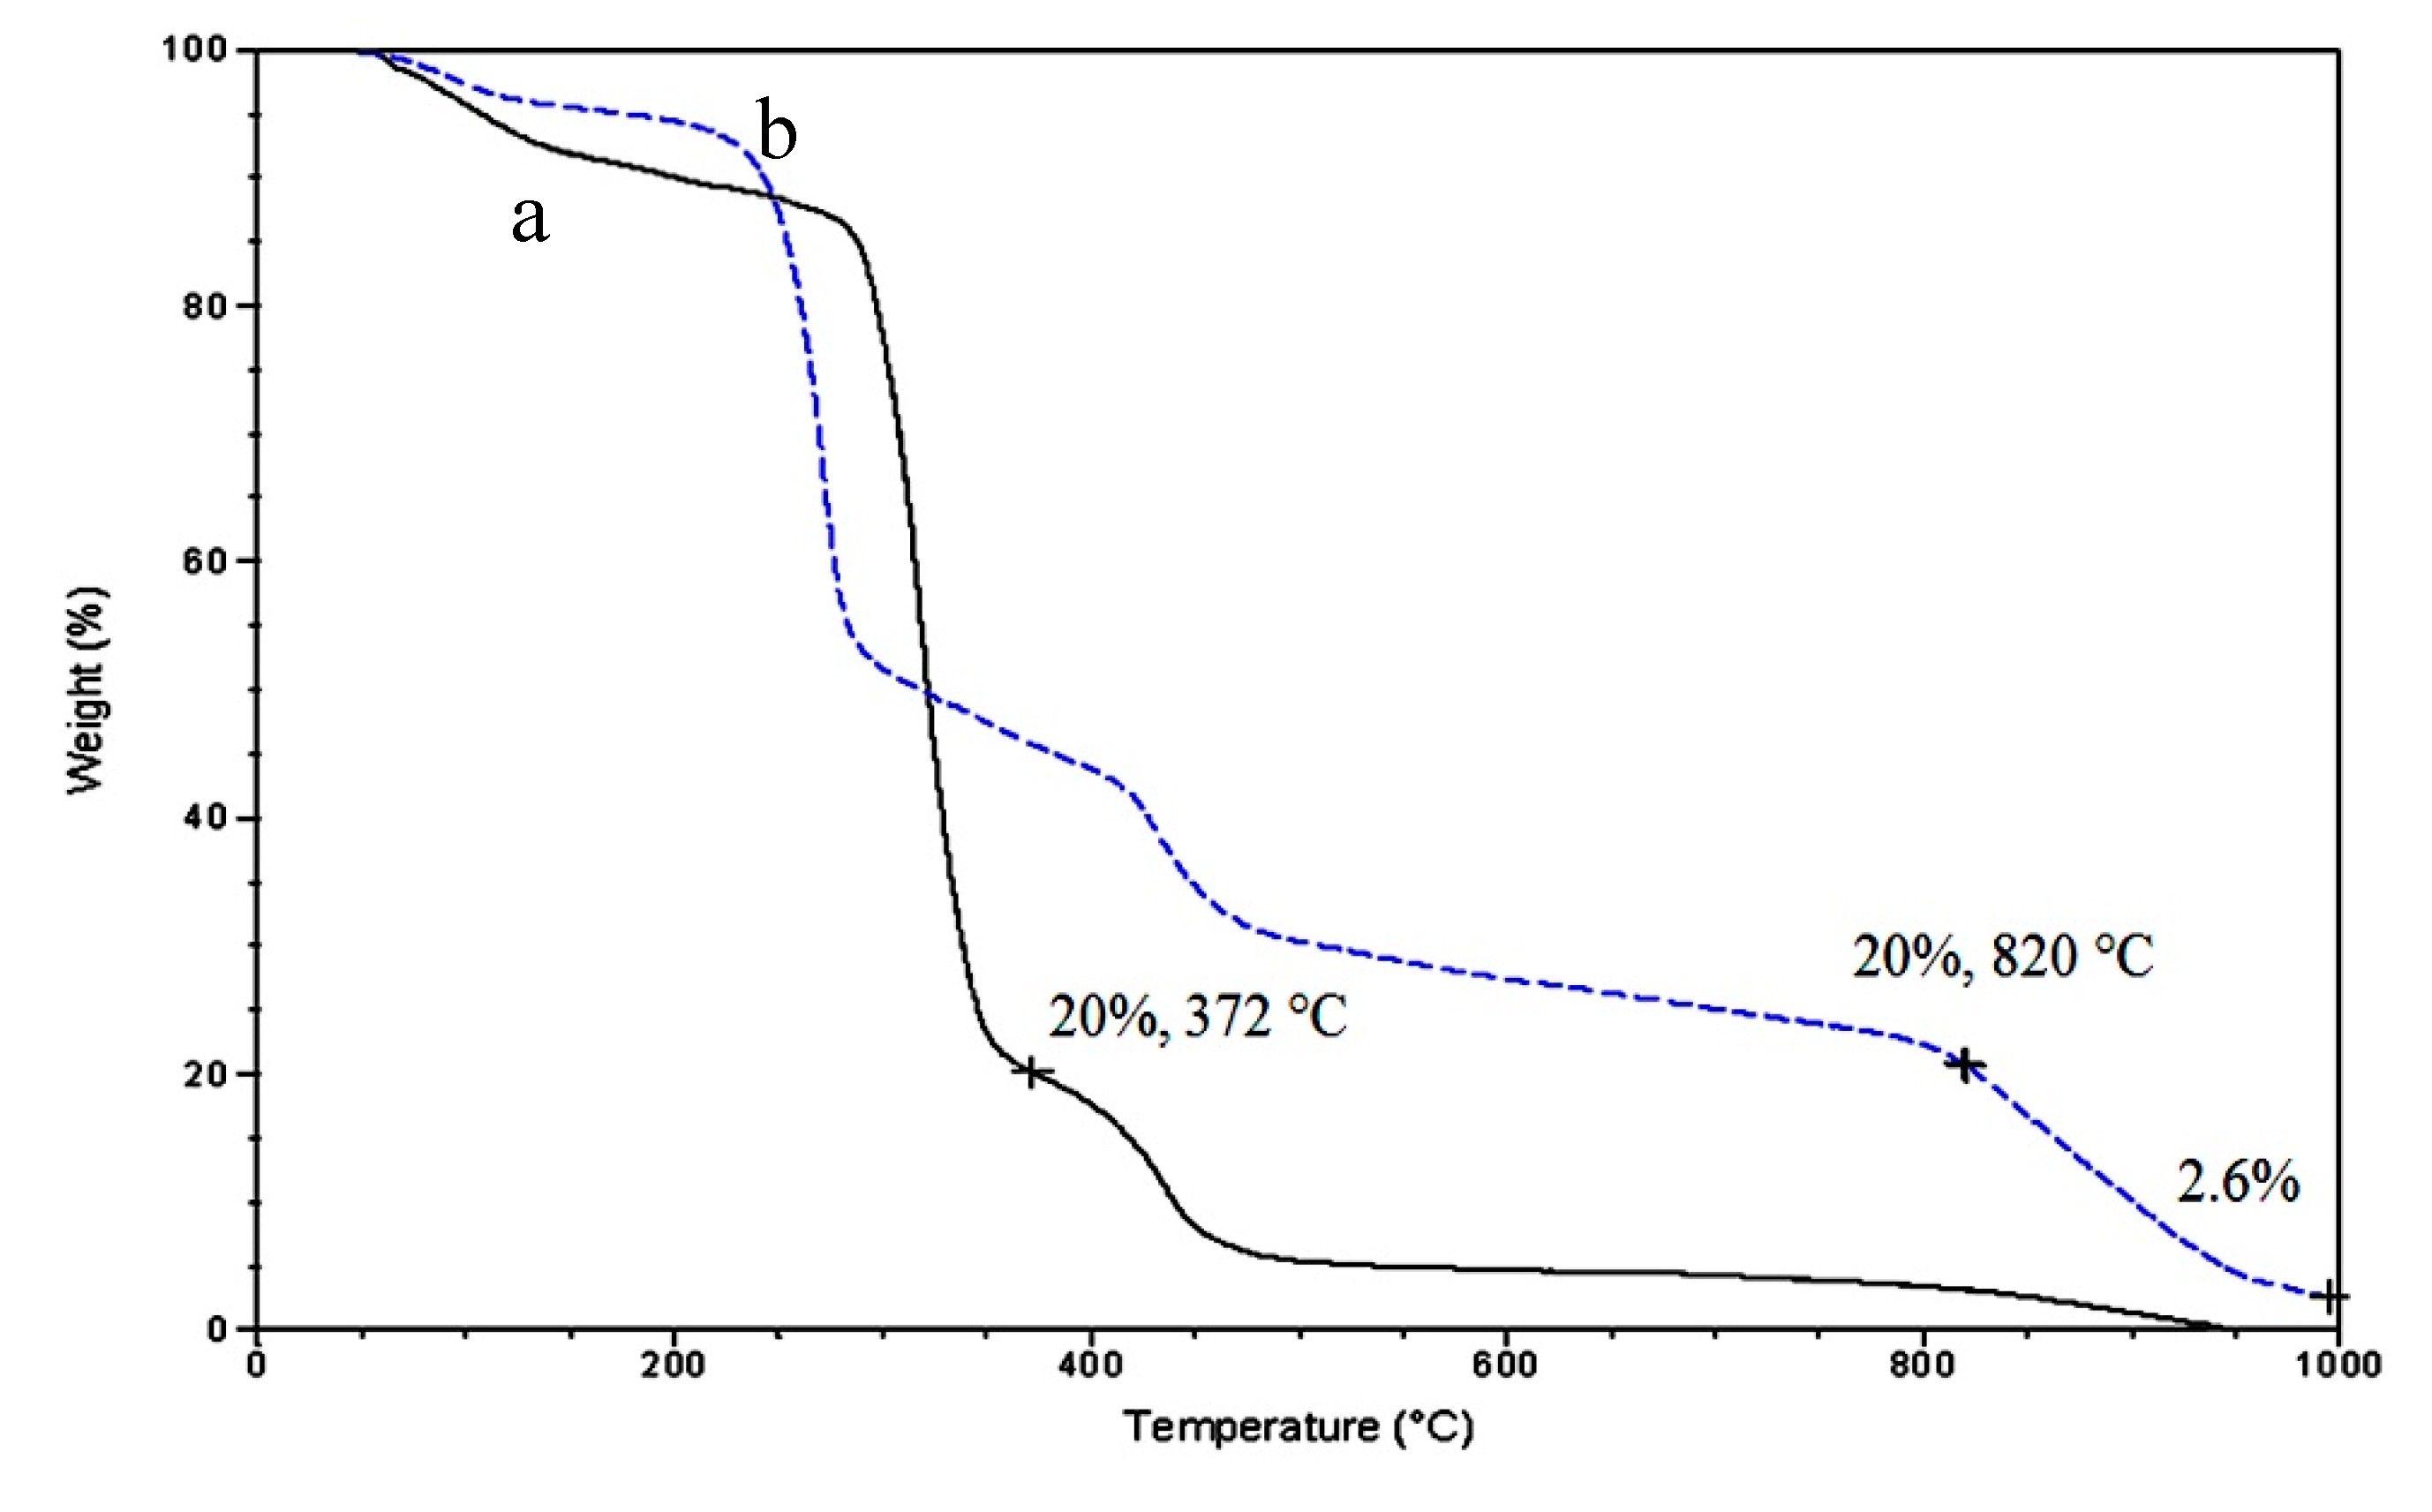

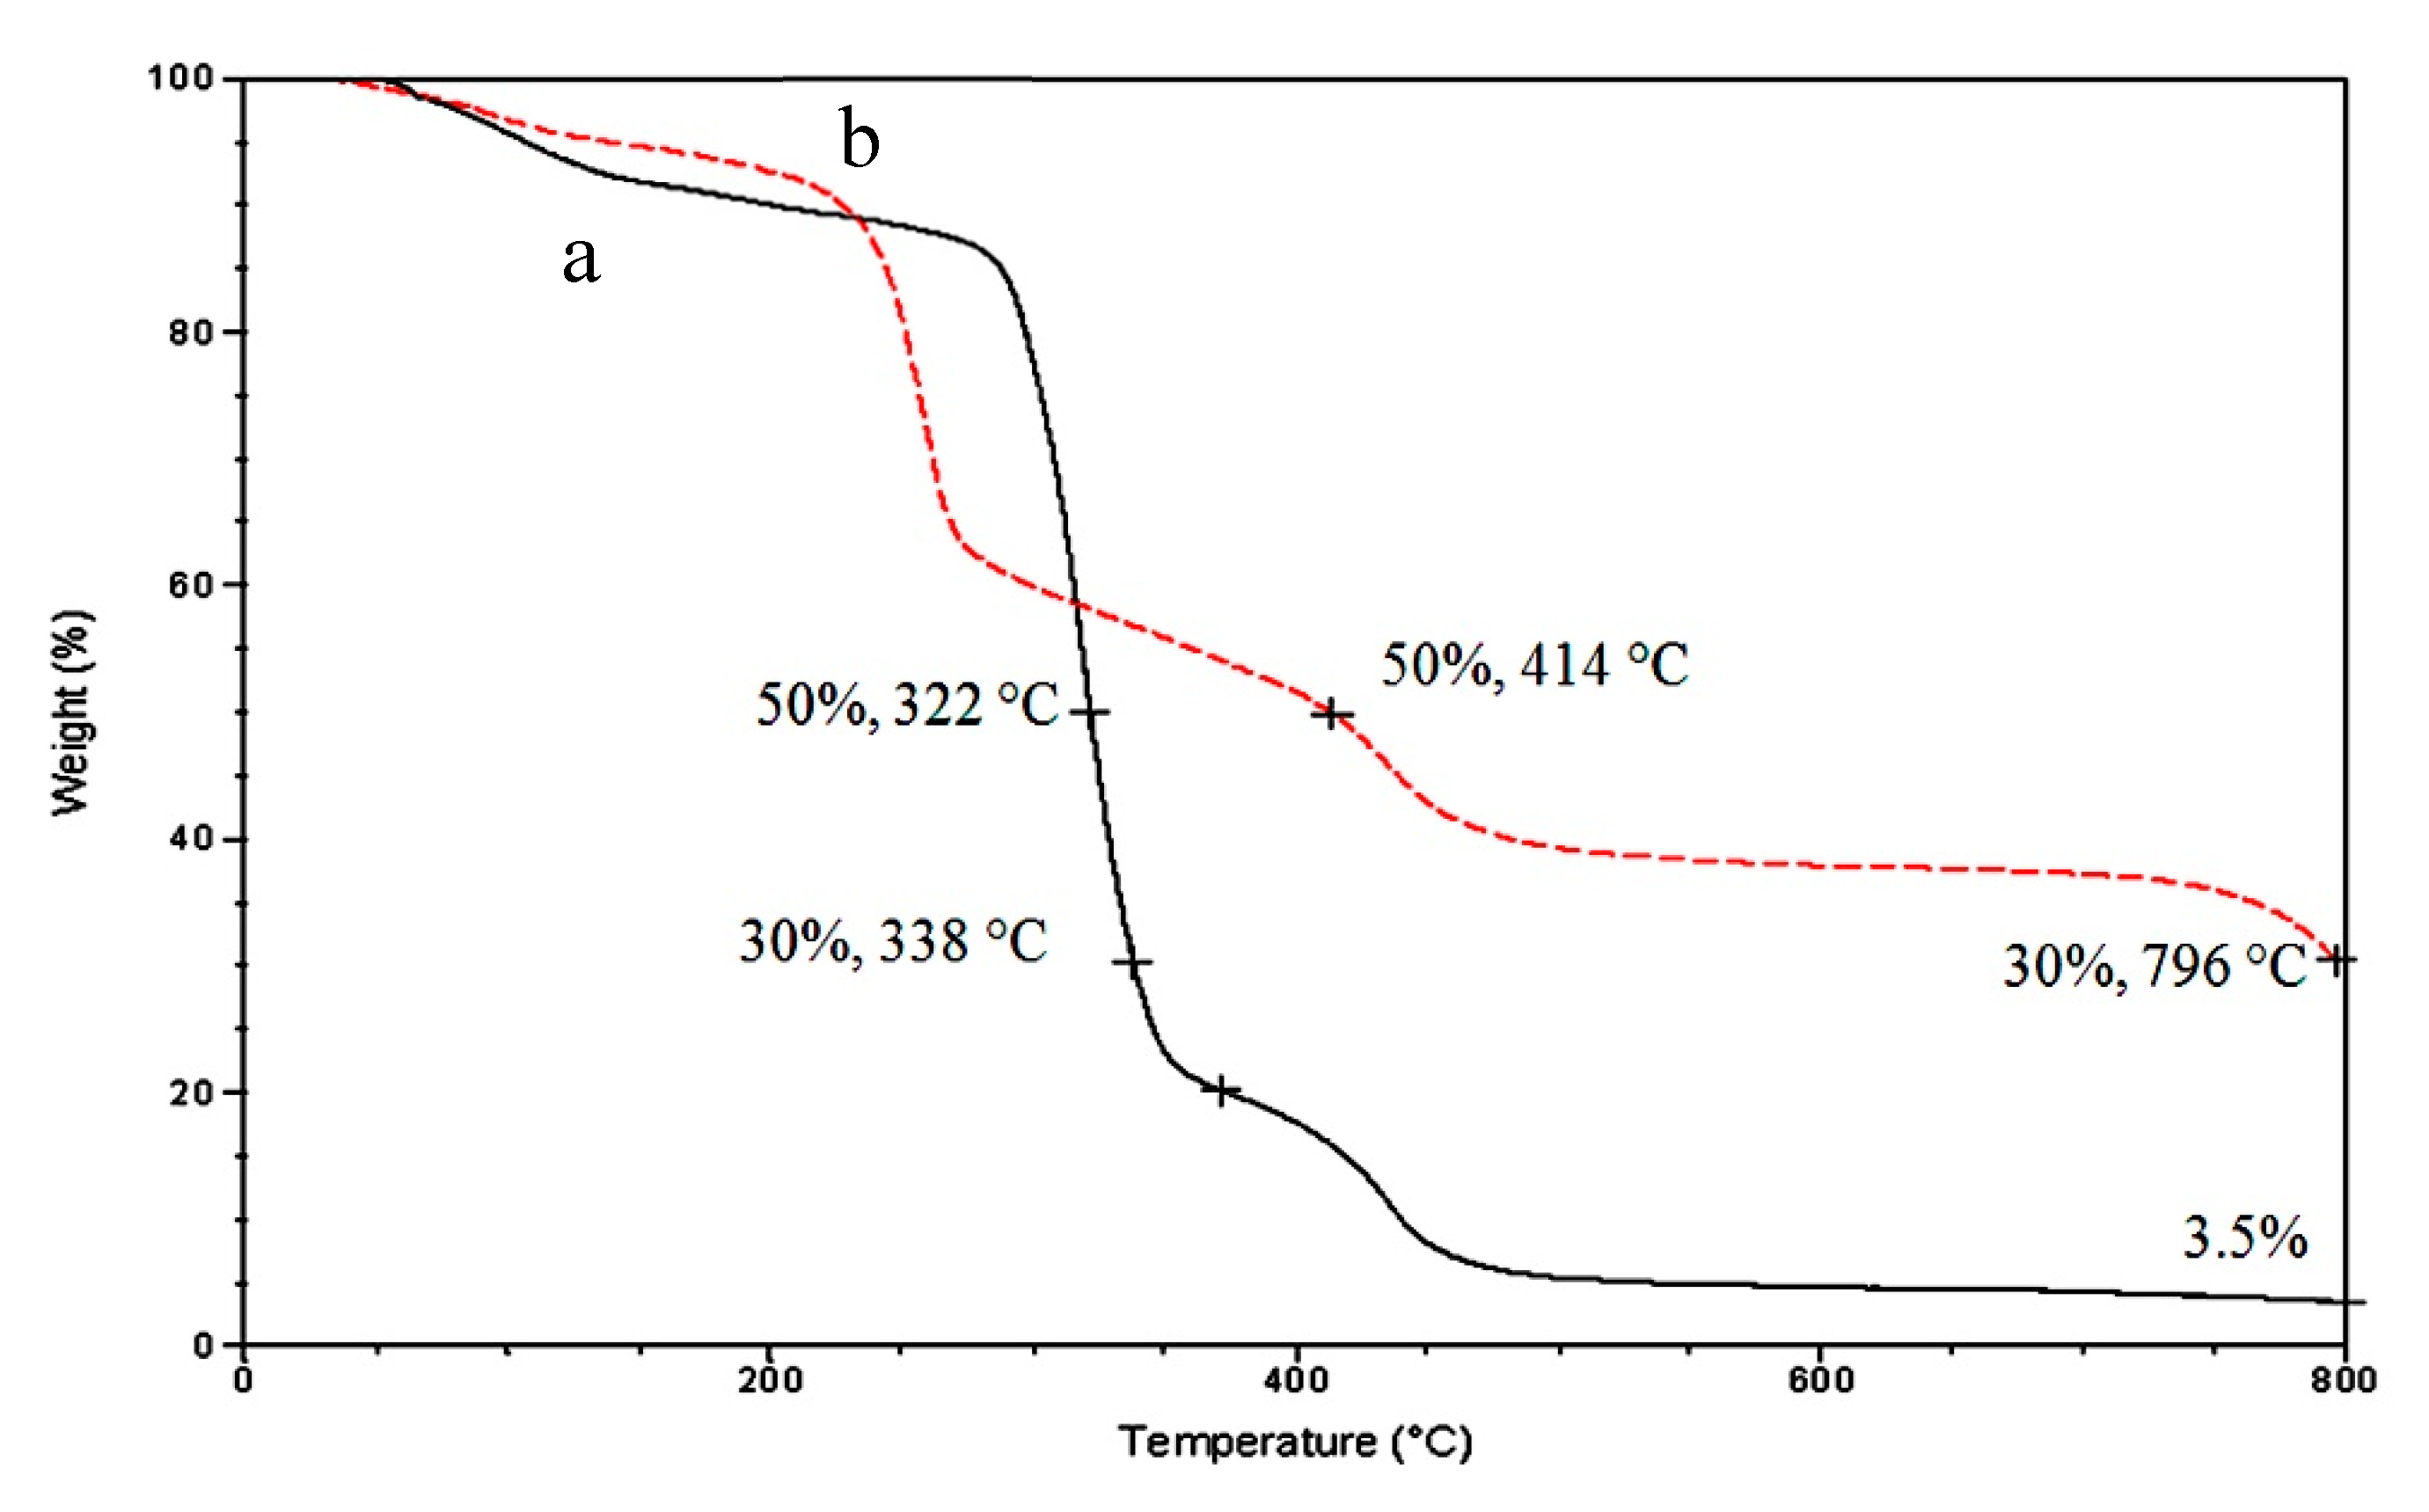
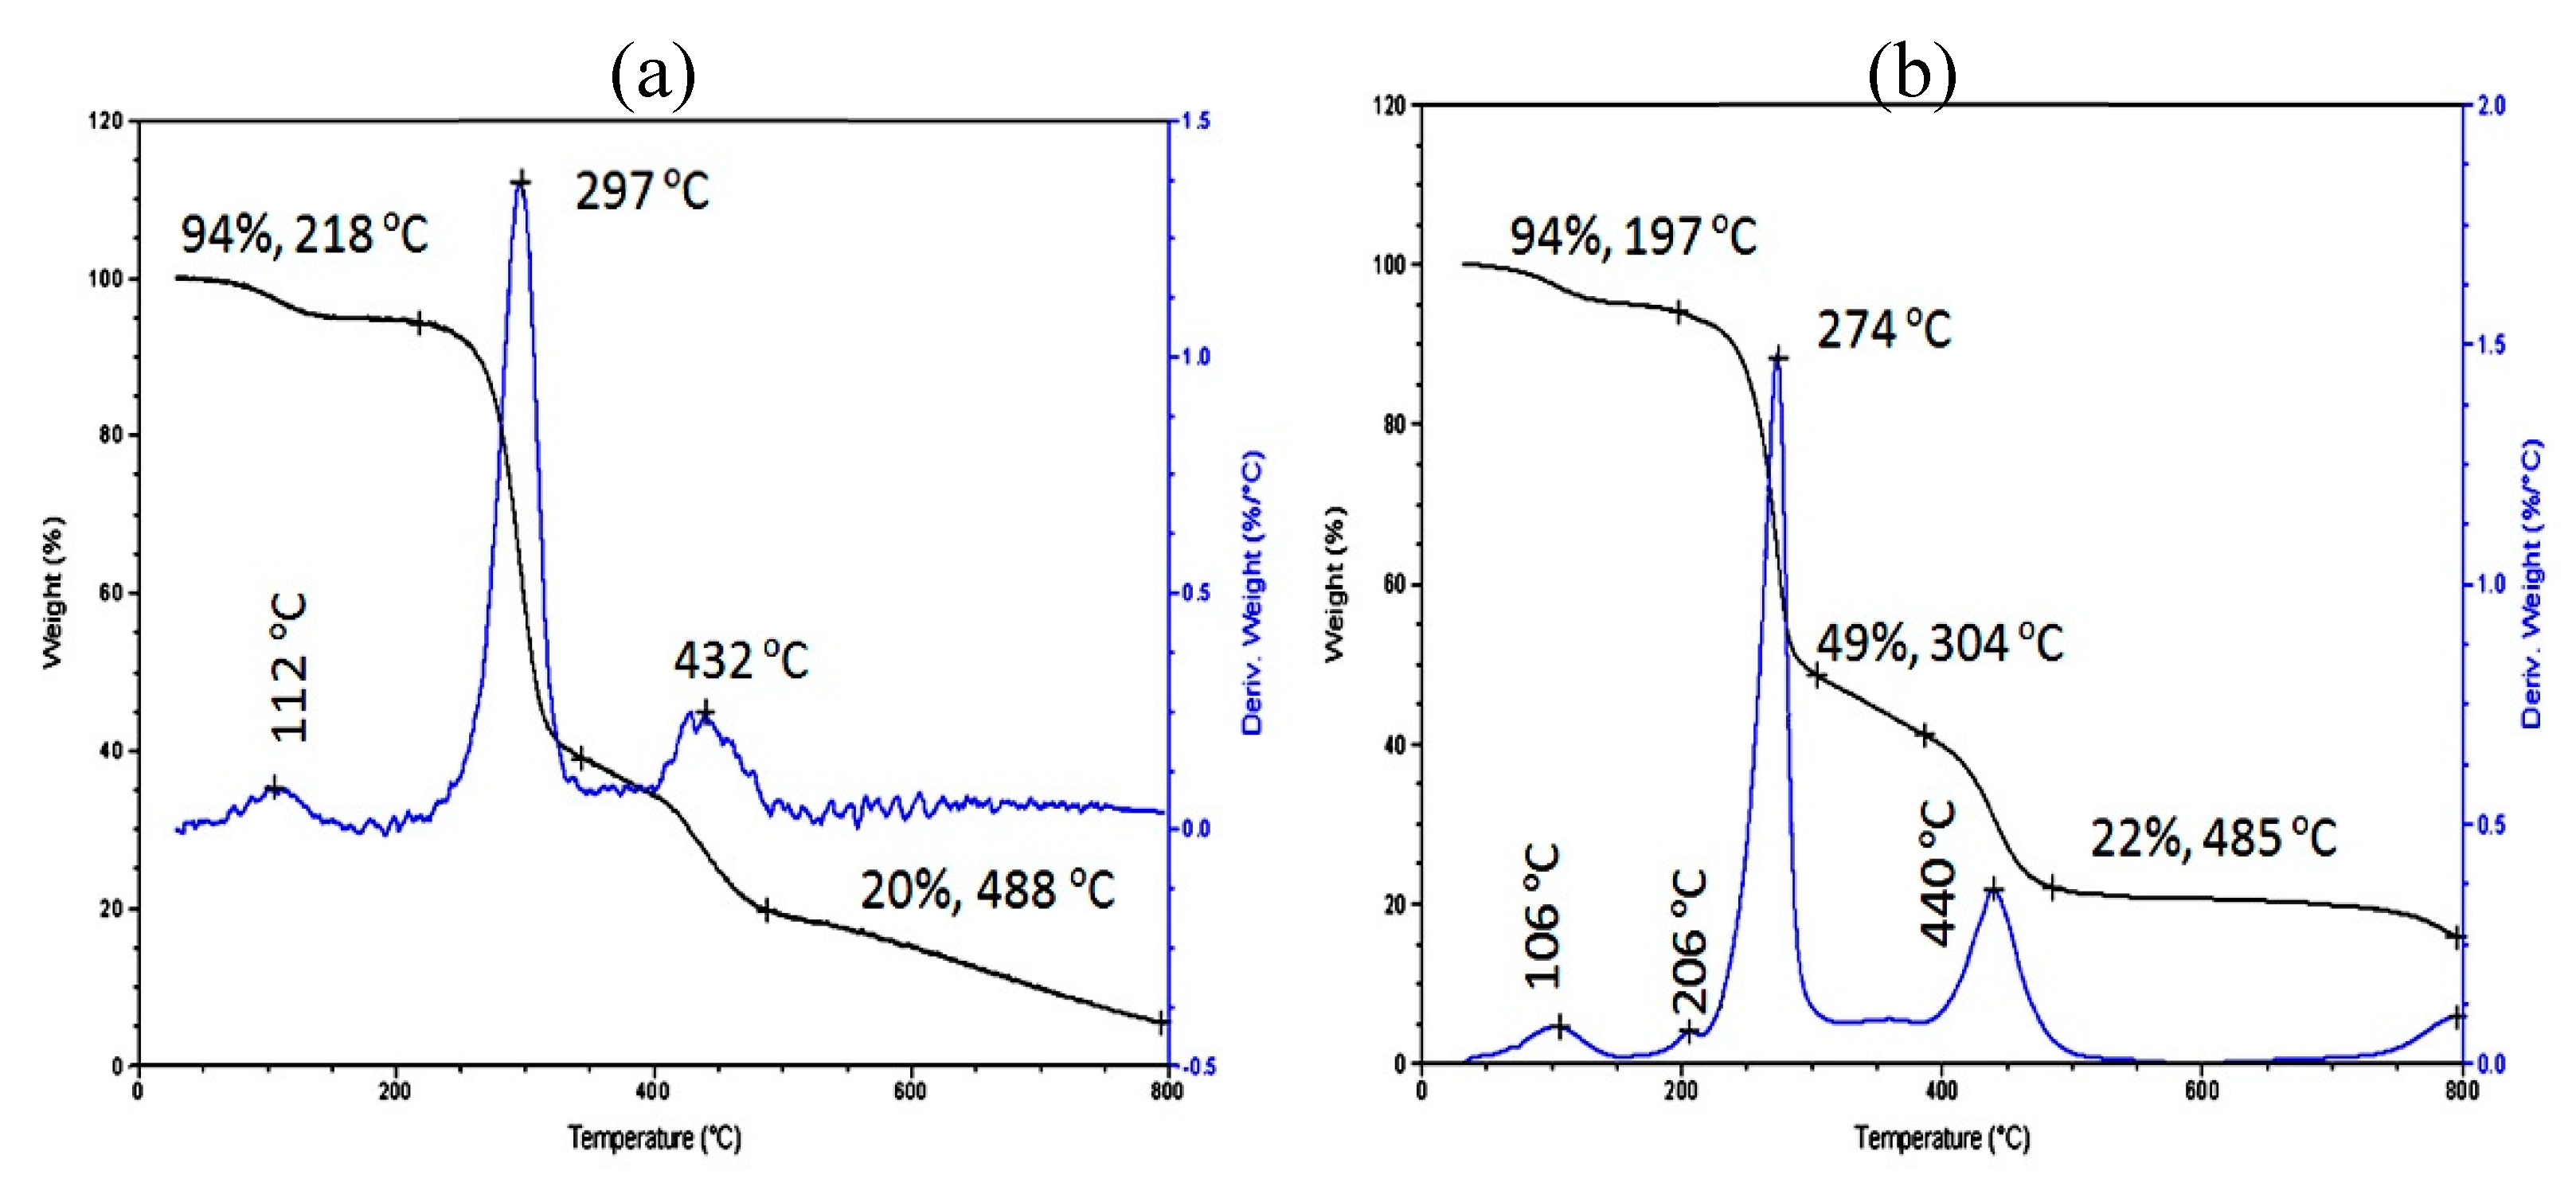
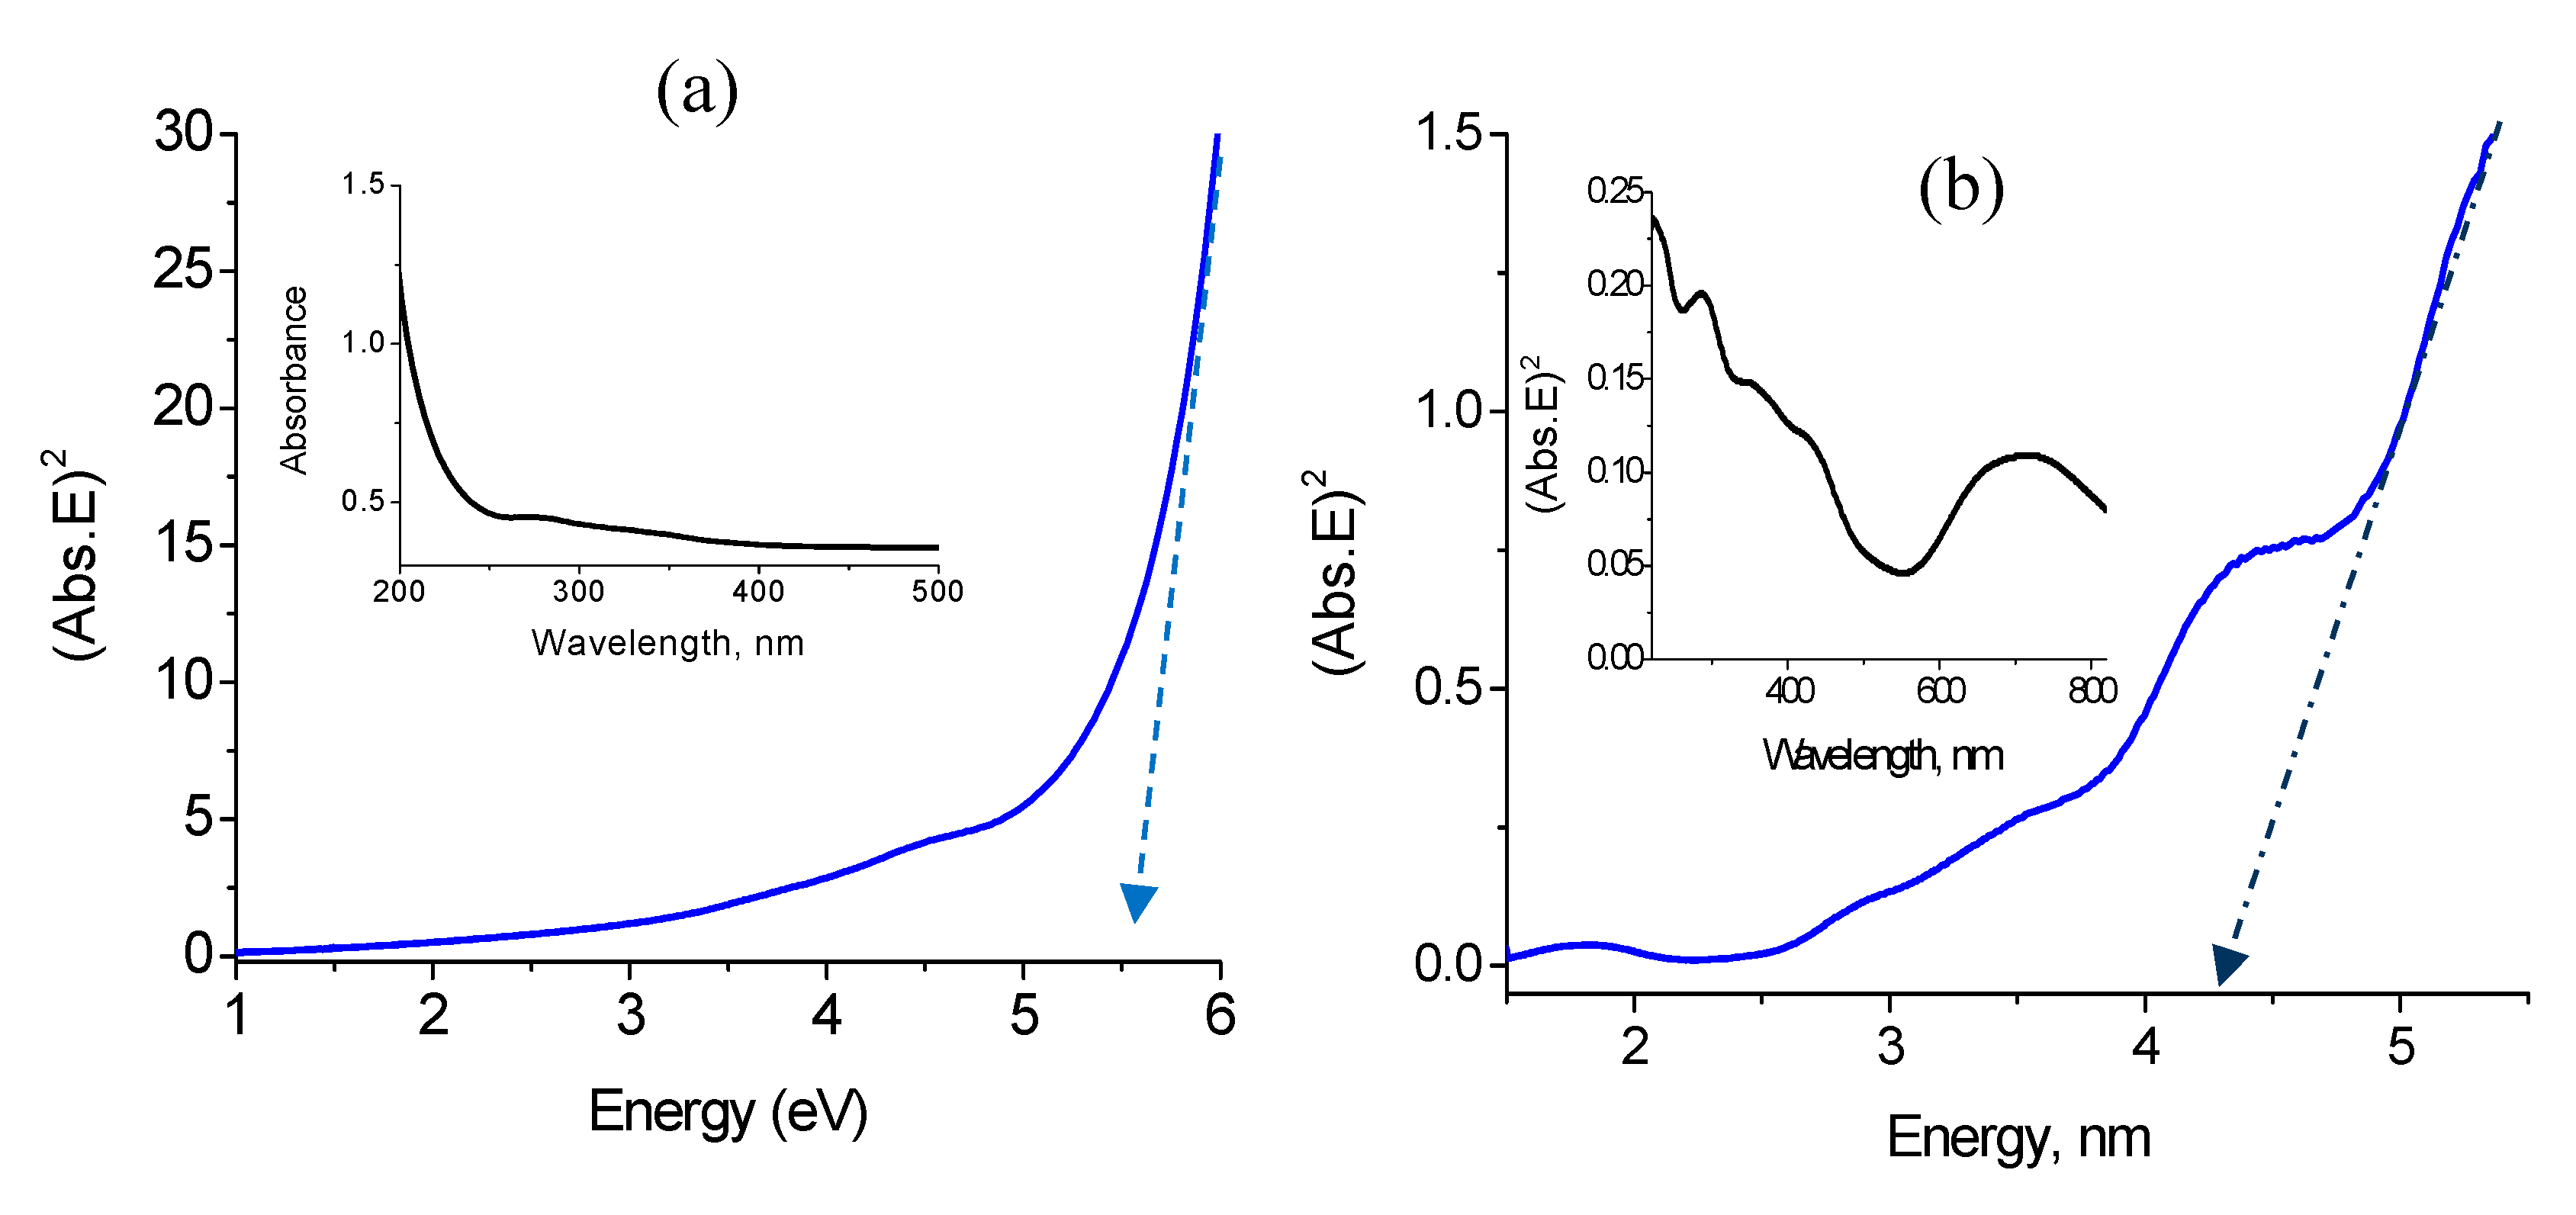

| Samples | Fillers | Fillers % | T0.05 (5%) (°C) | T0.80 (80%) (°C) |
|---|---|---|---|---|
| Pure PVA | No | 0 | 105 | 372 |
| NCP-3 | Green Nanohybrid | 20 | 175 | 820 |
| NCP-2 | Green Nanohybrid | 10 | 210 | Above 800 |
| NCP-1 | Green Nanohybrid | 2 | 250 | 457 |
| NCP-6 | Yellow Nanohybrid | 20 | 136 | Above 800 |
| NCP-5 | Yellow Nanohybrid | 10 | 160 | 691 |
| NCP-4 | Yellow Nanohybrid | 2 | 174 | 488 |
Disclaimer/Publisher’s Note: The statements, opinions and data contained in all publications are solely those of the individual author(s) and contributor(s) and not of MDPI and/or the editor(s). MDPI and/or the editor(s) disclaim responsibility for any injury to people or property resulting from any ideas, methods, instructions or products referred to in the content. |
© 2023 by the authors. Licensee MDPI, Basel, Switzerland. This article is an open access article distributed under the terms and conditions of the Creative Commons Attribution (CC BY) license (http://creativecommons.org/licenses/by/4.0/).


