Submitted:
28 April 2023
Posted:
29 April 2023
You are already at the latest version
Abstract

Keywords:
1. Introduction
2. Materials and Methods
2.1. Insects
2.2. Synthesis of carvacrol derivatives
2.3. Bioassays
2.3.1. Acute toxicity
2.3.2. Individual and collective behavior
2.3.3. Walking behavior
2.3.4. Horizontal transfer of compounds
2.4. Statistical analysis
3. Results
3.1. Acute toxicity
3.2. Individual and collective behavior
3.3. Walking behavior
3.4. Horizontal transfer of compounds
4. Discussion
Author Contributions
Funding
Institutional Review Board Statement
Data Availability Statement
Acknowledgments
Conflicts of Interest
References
- Pitts, J.P.; Mchugh, J.V.; Ross, K.G. Cladistic analysis of the fire ants of the Solenopsis saevissima species-group (Hymenoptera: Formicidae). Zoologica Scripta. 2005, 34, 493-505. [CrossRef]
- Chan, K.H.; Guénard, B. Ecological and socio-economic impacts of the red import fire ant, Solenopsis invicta (Hymenoptera: Formicidae), on urban agricultural ecosystems. Urban Ecosystems. 2020, 23,1-12. [CrossRef]
- Wylie, F.R.; Janssen-May, S. Red imported fire ant in Australia: what if we lose the war? Ecological Management & Restoration. 2017, 18, 32-44. [CrossRef]
- Lyu, D.P.; Lee, H.S. The red imported fire ant, Solenopsis invicta Buren (Hymenoptera: Formicidae: Myrmicinae) discovered in Busan sea port, Korea. Korean journal of applied entomology. 2017, 56, 437-438. [CrossRef]
- Xu, Y.; Vargo, E.L.; Tsuji, K.; Wylie, R. Exotic Ants of the Asia-Pacific: Invasion, National Response, and Ongoing Needs. Annual Review of Entomology. 2022, 67, 27-42. [CrossRef]
- LeBrun, E.G.; Plowes, R.M.; Gilbert, L.E. Imported fire ants near the edge of their range: disturbance and moisture determine prevalence and impact of an invasive social insect. Journal of Animal Ecology. 2012, 81, 884-895. [CrossRef]
- Tschinkel, W. R. The fire ants. Harvard University Press, 2013.
- Drees, B.M.; Calixto, A.A.; Nester, P.R. Integrated pest management concepts for red imported fire ants Solenopsis invicta (Hymenoptera: Formicidae). Insect Science. 2013, 20, 429-438. [CrossRef]
- Du, Y.; Zhou, A.; Chen, J. 2021. Olfactory and behavioral responses to acetate esters in red imported fire ant Solenopsis invicta. Pest Management Science. 2021, 77, 1371-1382. [CrossRef]
- Lard, C.F.; Schmidt, J.; Morris, B.; Estes, L.; Ryan, C.; Bergquist, D. 2006. An economic impact of imported fire ants in the United States of America. Texas A&M University, Department of Agricultural Economics, Texas Agricultural Experiment Station, College Station, TX. 2006.
- Xu, C.; Su, J.; Qu, X.; Zhou, A. Ant-mealybug mutualism modulates the performance of co-occurring herbivores. Scientific reports. 2019, 9, 1-11. [CrossRef]
- Gruber, M.A.M.; Janssen-May, S.; Santoro, D.; Cooling, M.; Wylie, R. Predicting socio-economic and biodiversity impacts of invasive species: Red Imported Fire Ant in the developing western Pacific. Ecological Management & Restoration. 2021, 22, 89-99. [CrossRef]
- Park, Y.; Vatanparast, M.; Sajjadian, S.M. Pathogenicity of Beauveria bassiana ANU1 to the red imported fire ant, Solenopsis invicta workers in Korea. Journal of Asia-Pacific Entomology. 2022, 25, 101913. [CrossRef]
- Angulo, E.; Hoffman, B.D.; Ballesteros-Mejia, L.; Taheri, A.; Balzani, P.; Bang, A.; Renault, D.; Cordonnier, M.; Bellard, C.; Diagne, C.; Ahmed, D. A.; Watari, Y.; Courchamp, F. Economic costs of invasive alien ants worldwide. Biological invasions. 2022, 24, 2041-2060. [CrossRef]
- Xu, T.; Xu, M.; Lu, Y.; Zhang, W.; Sun, J.; Zeng, R.; Turlings, T. C. J.; Chen, L. A trail pheromone mediates the mutualism between ants and aphids. Current Biology. 2021, 31, 4738-4747. [CrossRef]
- Montgomery, M.P.; Vanderwoude, C.; Lintermans, M.; Lynch, A.J.J. The Little Fire Ant (Hymenoptera: Formicidae): A Global Perspective. Annals of the Entomological Society of America. 2022, 115, 427-448. [CrossRef]
- Chen, J.; OI, D.H. Naturally occurring compounds/materials as alternatives to synthetic chemical insecticides for use in fire ant management. Insects. 2020, 11, 758. [CrossRef]
- Guillet, C.; Martin, O.Y.; Meincke, C.; Joerg, L.; Schmid-Grendelmeier, P. Part I: Insect stings and bites—Beyond the realm of bee and wasp allergies. Allergo Journal International. 2022, 31, 183-193. [CrossRef]
- Vinson, S.B. Impact of the invasion of the imported fire ant. Insect Science. 2013, 20, 439-455. [CrossRef]
- Fu, J.T.; Tang, L.; Li, W.S.; Wang, K.; Cheng, D.M.; Zhang, Z.X. Fumigant toxicity and repellence activity of camphor essential oil from Cinnamonum camphora Siebold against Solenopsis invicta workers (Hymenoptera: Formicidae). Journal of Insect Science. 2015, 15, 129. [CrossRef]
- Li, Y.; Yu, S.; Huang, J.; Wang, Z.; Zeng, Y.; Wu, X.; Han, K.; Zhou, H.; Wang, G.; Yu, Z. 2022. Study of behavioral, electrophysiological response, and the active compounds of the essential oils from six kinds of flowers against Solenopsis invicta Buren (Hymenoptera: Formicidae). Industrial Crops and Products. 2022, 188, 115603. [CrossRef]
- Wen, C.; Chen, J.; Qin, W. Q.; Chen, X.; Cai, J. C.; Wen, J. B.; Wen, X. J.; Wang, C. 2021. Red imported fire ants (Hymenoptera: Formicidae) cover inaccessible surfaces with particles to facilitate food search and transportation. Insect Science. 2021, 28, 1816-1828. [CrossRef]
- Tsai, C.C.; Hung, S.H.; Lin, X.R.; Huang, R.N. Herbal plants as alternatives for the management of the red imported fire ant, Solenopsis invicta. Journal of Applied Entomology. 2022, 146, 975-989. [CrossRef]
- Song, Z.; Wang, Y.; Li, C.; Tan, Y.; Wu, J.; Zhang, Z. Fumigant toxicity and behavioral inhibition of garlic against red imported fire ants (Solenopsis invicta). Environmental Science and Pollution Research. 2022, 30, 1889-1897. [CrossRef]
- Xiao, C.X.; Tan, Y. T.; Wang, F. F.; Wu, Q.H.; Qin, Q.; Zhang, Z.X. The Fumigating Activity of Litsea cubeba oil and Citral on Solenopsis invicta. Sociobiology. 2020, 67, 41-47. [CrossRef]
- Li, Y.; Yu, S.; Huang, J.; Wang, Z.; Zeng, Y.; Wu, X.; Han, K.; Zhou, H.; Wang, G.; Yu, Z. Study of behavioral, electrophysiological response, and the active compounds of the essential oils from six kinds of flowers against Solenopsis invicta Buren (Hymenoptera: Formicidae). Industrial Crops and Products. 2022, 188, 115603. [CrossRef]
- Mostafiz, M.M.; Hassan, E.; Lee, K.Y. Methyl Benzoate as a Promising, Environmentally Safe Insecticide: Current Status and Future Perspectives. Agriculture. 2022, 12, 378. [CrossRef]
- Cruz, E. M.O.; Costa-Junior, L. M.; Pinto, J.A.O.; Santos, D.A, de Araujo, S.A.; Arrigoni-Blank, M.F; Bacci, L.; Alves, P.B.; Cavalcanti, SCH.; Blank, A. F. Acaricidal activity of Lippia gracilis essential oil and its major constituents on the tick Rhipicephalus (Boophilus) microplus. Veterinary Parasitology. 2013, 195, 198-202. [CrossRef]
- Santos, A.A.; de Oliveira, B.M.S.; Melo, C.R.; Lima, A.P.S.; Santana, E.D.R.; Blank, A.F.; Picanço, M.C.; Araújo, A.P.A.; Cristaldo, P.F.; Bacci, L. Sub-lethal effects of essential oil of Lippia sidoides on drywood termite Cryptotermes brevis (Blattodea: Termitoidea). Ecotoxicology and Environmental Safety. 2017, 145, 436-441. [CrossRef]
- Melo, C.R.; Picanço, M.C.; Santos, A.A.; Santos, I.B.; Pimentel, M.F.; Santos, A.C.C.; Blank, A.F.; Araújo, A.P.A.; Cristaldo, P.F.; Bacci, L. Toxicity of essential oils of Lippia gracilis chemotypes and their major compounds on Diaphania hyalinata and non-target species. Crop Protection. 2018, 104, 47-51. [CrossRef]
- Silva, V.B.; Travassos, D.L.; Nepel, A.; Barison, A.; Costa, E.V.; Scotti, L.; Scotti, M.T.; Mendonça-Junior, F.J.B.; Santos, R.L.C.; Cavalcanti, S.C.H. Synthesis and chemometrics of thymol and carvacrol derivatives as larvicides against Aedes aegypti. Journal of Arthropod-Borne Diseases. 2017, 11, 315-330.
- Santos, A.C.C., Cristaldo, P.F, Araújo, A.P.A., Melo, CR.; Lima, A.P.S., Santana, E.D.R.; Oliveira, B.M.S.; Oliviera, J.W.S.; Vieira, J.S.; Blank, A.F.; Bacci, L. Apis mellifera (Insecta: Hymenoptera) in the target of neonicotinoids: A one-way ticket? Bioinsecticides can be an alternative. Ecotoxicology and Environmental Safety. 2018,163, 28-36. [CrossRef]
- Costa, A.C.F.; Cavalcanti, S.C.H.; Santana, A.S.; Lima, A.P.S.; Santana, E.D.R.; Brito, T. B.; Oliveira, R.R.B.; Macêdo, N.A.; Cristaldo, P.F.; Bacci, L. Formicidal activity of indole derivatives on Atta opaciceps (Borgmeier): lethal, behavioral and locomotive effects. Journal of Applied Entomology. 2019, 143, 58-68. [CrossRef]
- Lima, A.P.S.; Santana, E.D.R.; Santos, A.C.C.; Silva, J.E.; Ribeiro, G.T.; Pinheiro, A.M, Santos, I.T.B.F.; Blank, A.F.; Araújo, A.P.A.; Bacci, L. Insecticide activity of botanical compounds against Spodoptera frugiperda and selectivity to the predatory bug Podisus nigrispinus. Crop protection. 2020, 136, 105230. [CrossRef]
- Feitosa-Alcantara, R.B., Bacci, L., Blank, A.F., Alves, P.B., Silva, I.M.A., Soares, C.A.; Sampaio, T.S.; Nogueira, P.C.L.; Arrigoni-Blank, M.F. Essential oils of Hyptis pectinata chemotypes: isolation, binary mixtures and acute toxicity on leaf-cutting ants. Molecules, 2017, 22, 621. [CrossRef]
- Rocha, A. G.; Oliveira, B.M.S.; Melo, C.R.; Sampaio, T.S.; Blank, A.F.; Lima, A.D.; Nunes, R.S.; Araújo, A.P.A.; Cristaldo, P.F.; Bacci, L. Lethal effect and behavioral responses of leaf-cutting ants to essential oil of Pogostemon cablin (Lamiaceae) and its nanoformulation. Neotropical entomology. 2018, 47, 769-779. [CrossRef]
- Oliveira, B.M.S.; Melo, C.R.; Santos, A.C.C.; Nascimento, L.F.A.; Nízio, D.A.C.; Cristaldo, P.F.; Blank, A.F.; Bacci, L. Essential oils from Varronia curassavica (Cordiaceae) accessions and their compounds (E)-caryophyllene and α-humulene as an alternative to control Dorymyrmex thoracius (Formicidae: Dolichoderinae). Environmental Science and Pollution Research. 2019, 26, 6602-6612. [CrossRef]
- Rytter, W.; Shik, J.Z. Liquid foraging behaviour in leafcutting ants: the lunchbox hypothesis. Animal Behaviour. 2016, 117, 179-186. [CrossRef]
- Müller, C. Impacts of sublethal insecticide exposure on insects—Facts and knowledge gaps. Basic and Applied Ecology. 2018, 30, 1-10. [CrossRef]
- Della Lucia, T.M.C.; Souza, D.J. Importância e história de vida das formigas-cortadeiras. In: Della Lucia, T.M.C. (Ed.). Formigas-cortadeiras: da bioecologia ao manejo. Viçosa: Editora UFV, 2011, 13-26.
- Della Lucia, T.M.C.; Amaral, K.D. Past and current strategies for the control of leaf-cutting ants in Brazil. In: Forest Pest and Disease Management in Latin America: Modern Perspectives in Natural Forests and Exotic Plantations. 2020, 31-43. [CrossRef]
- Diez, L; Lejeune, P; Detrain, C. Keep the nest clean: survival advantages of corpse removal in ants. Biology letters. 2014, 10, 20140306. [CrossRef]
- Liang, M.R.; Shuang, Y.M.; Deng, J.F.; Peng, L.Y.; Zhang, S.Q.; Zhang, C.; Xu, Y.J.; Lu, Y.Y.; Wang, L. Toxicity and horizontal transfer of bifenthrin and dimefluthrin against the red imported fire ant, Solenopsis invicta Buren (Hymenoptera: Formicidae), and the efficacy of their dust applications in the field. Journal of Integrative Agriculture. 2022. [CrossRef]
- Zhang, L; Wang, L.; Chen, J.; Zhang, J.; He, Y.; Lu, Y.; Cai, J.; Chen, X.; Wen, X.; Xu, Z.; Wang, C. Toxicity, horizontal transfer, and physiological and behavioral effects of cycloxaprid against Solenopsis invicta (Hymenoptera: Formicidae). Pest Management Science. 2022, 78, 2228-2239. [CrossRef]
- Santos, M. C.; Teodoro, A. V.; Menezes, M. S.; Pinto-Zevallos, D. M.; Arrigoni-Blank, M. F.; Oliveira, E. M. C.; Sampaio, T. S.; Farias, A. P.; Coelho, C. R.; Blank, A. F. Bioactivity of essential oil from Lippia gracilis Schauer against two major coconut pest mites and toxicity to a non-target predator. Crop protection. 2019 125,104913. [CrossRef]
- Blank, A. F.; de Fátima Arrigoni-Blank, M.; Bacci, L.; Costa Junior, L. M.; Castro Nizio, D. A. Chemical diversity and insecticidal and anti-tick properties of essential oils of plants from northeast Brazil. In: Essential Oil Research: Trends in Biosynthesis, Analytics, Industrial Applications and Biotechnological Production. 2019, 235-258. [CrossRef]
- Coolen, H.K.A.C, Meeuwis, J.A.M.; Vanleeuwen, P.W.N.M, Nolte, R.J.M. Substrate selective catalysis by rhodium metal-lohosts. J Am Chem Soc. 1995, 117, 11906–11913. [CrossRef]
- Ben Arfa, A.; Combes, S.; Preziosi-Belloy, L.; Gontard, N.; Chalier. Antimicrobial activity of carvacrol related to its chemical structure. Lett Appl Microbiol. 2006, 43, 149–154. [CrossRef]
- Dolly, B. B.; Barba, F. Cathodic reduction of hydroxycarbonyl compound trichloroacetyl esters. Tetrahedron. 2003, 59, 9161–9165. [CrossRef]
- Morais, S.M.; Vila-Nova, N.S, Bevilaqua, C.M.L, Rondon, F.C, Lobo, C.H, Moura, A.D.A.N, Sales, A.D.; Rodrigues, A.P.R.; Figuereido, J.R.; Campello, C.C.; Wilson, M.E.; Andrade, H.F. Thymol and eugenol derivatives as potential antileishmanial agents. Bioorg Med Chem. 2014, 22, 21,6250–6255. [CrossRef]
- Santos, C.P.; Pinto, J.A.O.; dos Santos, C.A.; Cruz, E.M.O.; Arrigoni-Blank, M.F.; Andrade, T.M.; Santos, D.A.; Alves, P.B.; Blank, A.F. Harvest time and geographical origin affect the essential oil of Lippia gracilis Schauer. Industrial Crops and Products. 2016, 79, 205-210. [CrossRef]
- SAS/STAT User’s Guide. Cary, NC, USA. 2008.
- Santos, N.C.; Silva, J.E.D, Santos, A.C.C, Dantas, J.D.O, Tavares, S.R.S.A, Andrade, V.S.; Oliveira, S.D.S.; Blank, A.F.; Araújo, A.P.A.; Bacci, L. Bioactivity of essential oils from Croton grewioides and its major compounds: toxicity to soybean looper Chrysodeixis includens and selectivity to the predatory stink bug Podisus nigrispinus. Environmental Science and Pollution Research. 2022, 30, 1-12. [CrossRef]
- Albuquerque, E.L.; Lima, J.K.; Souza, F.H.; Silva, I.M.; Santos, A.A.; Araújo, A.P.A.; Blank, A.F.; Lima, R.F.; Alves, P.B.; Bacci, L. Insecticidal and repellence activity of the essential oil of Pogostemon cablin against urban ants species. Acta tropica. 2013. 127, 181-186. [CrossRef]
- Tong, F.; Coats, J.R. Effects of monoterpenoid insecticides on [3H]-TBOB binding in house fly GABA receptor and 36Cl – uptake in American cockroach ventral nerve cord. Pestic. Biochem. Physiol. 2010, 98, 317-324. [CrossRef]
- Oladipupo, S.O.; Hu, X.P.; Appel, A.G. Essential oils in urban insect management-A review. Journal of Economic Entomology. 2022, 115, 1375-1408. [CrossRef]
- Gaire, S.; Scharf, M.E.; Gondhalekar, A.D. Synergistic toxicity interactions between plant essential oil components against the common bed bug (Cimex lectularius L.). Insects. 2020, 11, 133. [CrossRef]
- Xie, Y.; Huang, Q.; Rao, Y.; Hong, L.; Zhang, D. Efficacy of Origanum vulgare essential oil and carvacrol against the housefly, Musca domestica L (Diptera: Muscidae). Environmental Science and Pollution Research. 2019, 26, 23824-23831. [CrossRef]
- Rodríguez, A.; Beato, M.; Usseglio, V.L.; Camina, J.; Zygadlo, J.A.; Dambolena, J.S.; Zunino, M.P. Phenolic compounds as controllers of Sitophilus zeamais: A look at the structure-activity relationship. Journal of Stored Products Research. 2022, 99, 102038. [CrossRef]
- Gong, X.; Ren, Y. Larvicidal and ovicidal activity of carvacrol, p-cymene, and γ-terpinene from Origanum vulgare essential oil against the cotton bollworm, Helicoverpa armigera (Hübner). Environmental Science and Pollution Research. 2020, 27, 18708-18716. [CrossRef]
- Anderson, J.A.; Coats, J.R. Acetylcholinesterase inhibition by nootkatone and carvacrol in arthropods. Pesticide Biochemistry and Physiology. 2012, 102, 124-128. [CrossRef]
- Lu, X.; Weng, H.; Li, C.; He, J.; Zhang, X.; Ma, Z. Efficacy of essential oil from Mosla chinensis Maxim. cv. Jiangxiangru and its three main components against insect pests. Industrial Crops and Products. 2020, 147, 112237. [CrossRef]
- Staudt, A.; Brack, Y.; Itabaiana Jr, I.; Leal, I.C.R. 2022. Biocatalytic synthesis of monoterpene esters–A review study on the phylogenetic evolution of biocatalysts. Molecular Catalysis. 2022, 528, 112464. [CrossRef]
- Natal, C.M.; Fernandes, M.J.G.; Pinto, N.F.; Pereira, R.B.; Vieira, T.F.; Rodrigues, A.R.O.; Pereira, D.M.; Souza, S.F.; Fortes, A.G.; Castanheira, E.M.S.; Gonçalves, M.S.T. New carvacrol and thymol derivatives as potential insecticides: Synthesis, biological activity, computational studies and nanoencapsulation. RSC advances. 2021, 11, 54, 34024-34035. [CrossRef]
- Kafle, L.; Shih, C.J. Toxicity and repellency of compounds from clove (Syzygium aromaticum) to red imported fire ants Solenopsis invicta (Hymenoptera: Formicidae). Journal of Economic Entomology. 2013, 106, 131-135. [CrossRef]
- Chen, J.; Cantrell, C.L.; Duke, S.O.; Allen, M.L. Repellency of callicarpenal and intermedeol against workers of imported fire ants (Hymenoptera: Formicidae). Journal of economic entomology. 2008, 101, 265-271. [CrossRef]
- Buczkowski, G. Trap–treat–release: horizontal transfer of fipronil in field colonies of black carpenter ants, Camponotus pennsylvanicus. Pest management Science. 2019, 75, 2195-2201. [CrossRef]
- Qi, Y.X.; Zeng, T.; Wang, L.; Lu, Y.Y. Biogenic amine signaling systems in the red imported fire ant, Solenopsis invicta–possible contributors to worker division of labor General and Comparative Endocrinology. 2018, 262, 59-70. [CrossRef]
- Adams, C.; Schenker, J.; Weston, P., Gut, L.; Miller, J. Path meander of male codling moths (Cydia pomonella) foraging for sex pheromone plumes: Field validation of a novel method for quantifying path meander of random movers developed using computer simulations. Insects. 2020, 11, 549. [CrossRef]
- Oliveira, B.M.; Melo, C.R.; Santos, A.C.; Nascimento, L.F.; Nízio, D.A.; Cristaldo, P.F.; Blank, A.F.; Bacci, L. Essential oils from Varronia curassavica (Cordiaceae) accessions and their compounds (E)-caryophyllene and α-humulene as an alternative to control Dorymyrmex thoracius (Formicidae: Dolichoderinae). Environmental Science and Pollution Research. 2019, 26, 6602-6612. [CrossRef]
- Melo, C.R.; Blank, A.F.; Oliveira, B.M.S.; Santos, A.C.C.; Cristaldo, P.F.; Araújo, A.P.A.; Bacci, L. Formicidal activity of essential oils of Myrcia lundiana chemotypes on Acromyrmex balzani. Crop Protection. 2021, 139, 105343. [CrossRef]


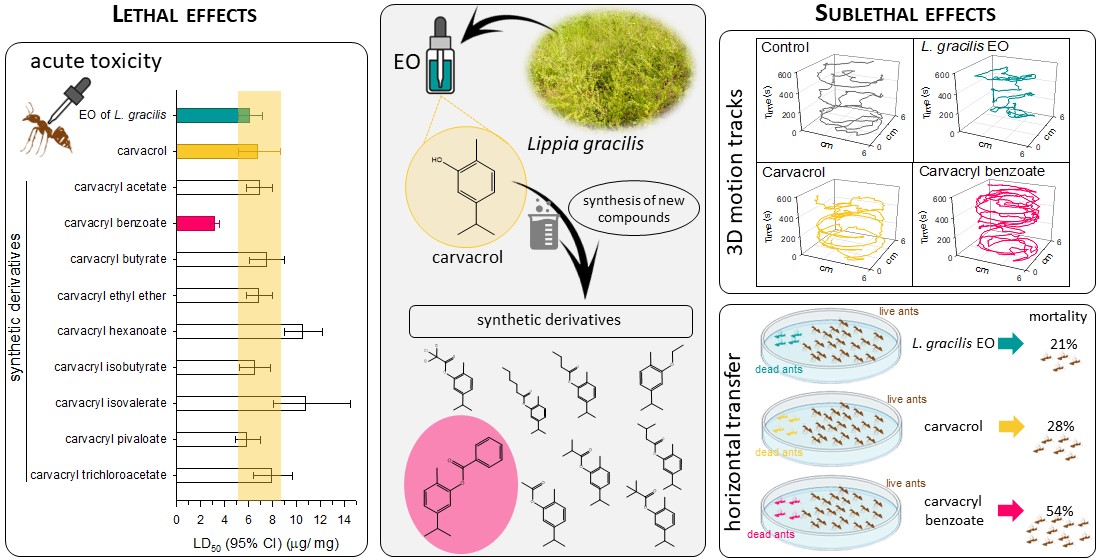
| Compounds | n1 | LD30 (CI 95%)2 |
LD50 (CI 95%)2 |
LD90 (CI 95%)2 |
Slope ± SE |
χ2 | P |
|---|---|---|---|---|---|---|---|
| -------------------- μg/ mg -------------------- | |||||||
| Essential oil of Lippia gracilis | 336 | 3.42 (2.66-4.14) |
6.11 (5.16-7.20) |
25.2 (19.0-38.3) |
2.08 ±0.23 |
7.41 | 0.12 |
| Carvacrol | 336 | 2.76 (1.81-3.75) |
6.79 (5.19-8.71) |
60.9 (39.2-118) |
1.35 ±0.16 |
0.76 | 0.94 |
| Carvacryl acetate | 392 | 4.09 (3.17-4.94) |
6.92 (5.86-7.97) |
24.9 (20.2-33.5) |
2.30 ±0.24 |
6.39 | 0.27 |
| Carvacryl benzoate | 448 | 2.21 (1.92-2.49) |
3.20 (2.86-3.57) |
7.97 (6.90-9.53) |
3.24 ±0.24 |
4.81 | 0.57 |
| Carvacryl butyrate | 392 | 3.73 (2.67-4.75) |
7.50 (6.09-8.99) |
41.2 (30.5-64.0) |
1.73 ±0.19 |
8.62 | 0.13 |
| Carvacryl ethyl ether | 448 | 3.81 (3.12-4.51) |
6.87 (5.88-8.04) |
29.1 (22.7-40.3) |
2.05 ±0.17 |
7.96 | 0.24 |
| Carvacryl hexanoate | 336 | 6.25 (5.02-7.39) |
10.5 (8.99-12.2) |
37.1 (28.9-53.3) |
2.33 ±0.25 |
6.46 | 0.17 |
| Carvacryl isobutyrate | 336 | 3.46 (2.45-4.40) |
6.54 (5.28-7.84) |
30.9 (23.3-47.4) |
1.90 ±0.22 |
3.54 | 0.47 |
| Carvacryl isovalerate | 392 | 6.16 (3.79-8.18) |
10.8 (8.10-14.5) |
42.3 (26.8-112) |
2.16 ±0.33 |
9.92 | 0.08 |
| Carvacryl pivaloate | 392 | 3.05 (2.41-3.70) |
5.85 (4.88-7.03) |
28.7 (21.4-43.0) |
1.85 ±0.17 |
6.80 | 0.24 |
| Carvacryl trichloroacetate | 336 | 4.05 (3.00-5.12) |
7.92 (6.39-9.66) |
40.7 (30.4-60.7) |
1.80 ±0.18 |
5.99 | 0.20 |
Disclaimer/Publisher’s Note: The statements, opinions and data contained in all publications are solely those of the individual author(s) and contributor(s) and not of MDPI and/or the editor(s). MDPI and/or the editor(s) disclaim responsibility for any injury to people or property resulting from any ideas, methods, instructions or products referred to in the content. |
© 2023 by the authors. Licensee MDPI, Basel, Switzerland. This article is an open access article distributed under the terms and conditions of the Creative Commons Attribution (CC BY) license (http://creativecommons.org/licenses/by/4.0/).


