Introduction
Sorghum is a staple food for millions of people in Africa and Asia and plays a vital role in global food security (FAO, 2019), it has several nutritional benefits as its flavonoid composition because its benefits for its antioxidant, anti-inflammatory, and anticancer properties (Hollman & Katan, 1999). GWAS has been used to identify genes and genomic regions associated with the flavonoid composition of sorghum.
GWAS analysis for flavonoid pigmentation traits in sorghum has been reported by Morris et al. (2013) and Mace et al. (2013), they found that flavonoid pigmentation traits exhibited population structure, thus the authors performed the analysis using Q+K models for incorporating the population structure in the analysis. They identified loci associated with flavonoid pigmentation of Sorghum in chromosome 4. On the other hand, Genomic selection has been used to predict the flavonoid content of sorghum grains based on genomic markers (Mukri et al., 2019), they reported that the accuracy of the prediction depends on the size and quality of the training population and on the density of the genotyping data.
GS is a special type of marker-assisted selection that incorporate genome-wide dense markers and is considered a powerful tool for plant breeding because improves the prediction and selection accuracy for quantitative traits. It is used one or more training populations to calibrate or train a statistical model, then the trained model is used to predict breeding values in a validating population that only genotyped selecting parentals for the next breeding cycles reducing time in the selection process.
Most genomic selection models assume that each marker is associated with the trait even with small genetic effects, on the contrary, GWAS attempt to find individual markers associated with a larger amount of genetic variation, GWAS is used as the initial evidence for the role of a particular gene in the inheritance of a particular trait (Uffelmann et al., 2021).
The correlation coefficient between observed values and the predicted breeding values is estimated to express the prediction accuracy which is affected by different factors such as the genetic architecture of traits (Lozada et al., 2019), heritability, population structure, the selected model, training population size, marker density among others (Norman et al., 2018).
MAS had shown good prediction accuracy, but it depends on the model selected for performing the GWAS, when there is a low power, the accuracy of the prediction is low, thus it is required to analyze the data with methods with higher power for selecting a higher number of QTLs, some models have a stringent threshold in order to avoid false negatives affecting the power of the GWAS and then the accuracy of MAS (Bian et al., 2014). There are other factors that impact the identification of robust associations as allele frequencies, population structure, epistasis, genetic background, and linkage phases among populations (Bian and Holland, 2017)
Other models for genomic selection are based on least squares, but the low degree of freedom does not allow the estimation of the marker effect simultaneously, such as gBLUP and Ridge Regression. To overcome this issue, it has been proposed some Bayesian statistical methods for predicting the breeding values of the individuals and considering the variability of SNP-associated effects (Heslot et al., 2012).
A model that incorporates GWAS-selected markers into genomic selection models might provide a way to overcome the constraints generated by population structure and provide more robust associations improving genomic prediction. Different studies have reported that the use of GWAS-selected markers in genomic selection can result in an increase in prediction accuracy (Boichard et al., 2012; Su et al., 2014; Zhang et al., 2014; Brøndum et al., 2015; Veroneze et al., 2016; Lopes et al., 2017).
In this study, it was used a sample of 6000 out of the 265,487 SNPs reported by Morris et al. (2013) to estimate the prediction accuracy evaluating different models to evaluate the effect of including GWAS-selected markers in genomic selection building kinship using GWAS-selected markers in comparison with other models (gBLUP, Bayesian Ridge Regression, Bayes LASSO, Bayes A and Bayes B), and also it was analyzed other parameters that are associated with the prediction accuracy (number of QTNs, size of the training population, and heritability).
Methods
Phenotypic and Genotypic Data
In this study, it was worked with the data from Morris et al. (2013), it was sampled 6000 out of 265,487 SNPs reported in this study, there were evaluated 378 individuals of recombinant inbreeding lines for studying the flavonoid pigmentation trait of Sorghum.
Genome-Wide Association Studies
The association of flavonoid pigmentation was done using BLINK as implemented in the Genomic Association and Prediction Integrated Tools sampling 20 QTNs (Lipka et al., 2012). The genetic structure of the sorghum population was estimated using hierarchical clustering and the principal components analysis in R (R Core team, 2012).
Genomic Prediction
To evaluate the genomic prediction there were used seven different models: Marker-assisted Selection (MAS), genomic best linear unbiased prediction (gBLUP), gBLUP building kinship using GWAS-selected markers (named in this paper as gBLUP-GWAS) carried out in the GAPIT R Package (Lipka et al., 2012), Bayesian Ridge Regression, Bayes A, Bayer B, and Bayes LASSO, the Bayesian-based methods were carried out using the r package BGLR (Perez, 2014).
The cross-validation was done by sampling a population that was used as the testing population, and the remaining SNPs were the training population, different sizes of the training population were analyzed to see its effect on genomic prediction (10, 20, 50, 75, and 90% were evaluated).
To estimate the effect of the heritability and number of QTNs on the accuracy of genomic prediction. It was evaluated 25, 50, and 75% of heritability and the different numbers of QTNs sampled: 20, 40 80, and 150 QTNs.
The prediction accuracy was evaluated in terms of Pearson’s correlation between the observed adjusted phenotypic values (i.e., BLUE) and predicted values.
Results
Phenotypic Data Analysis Results
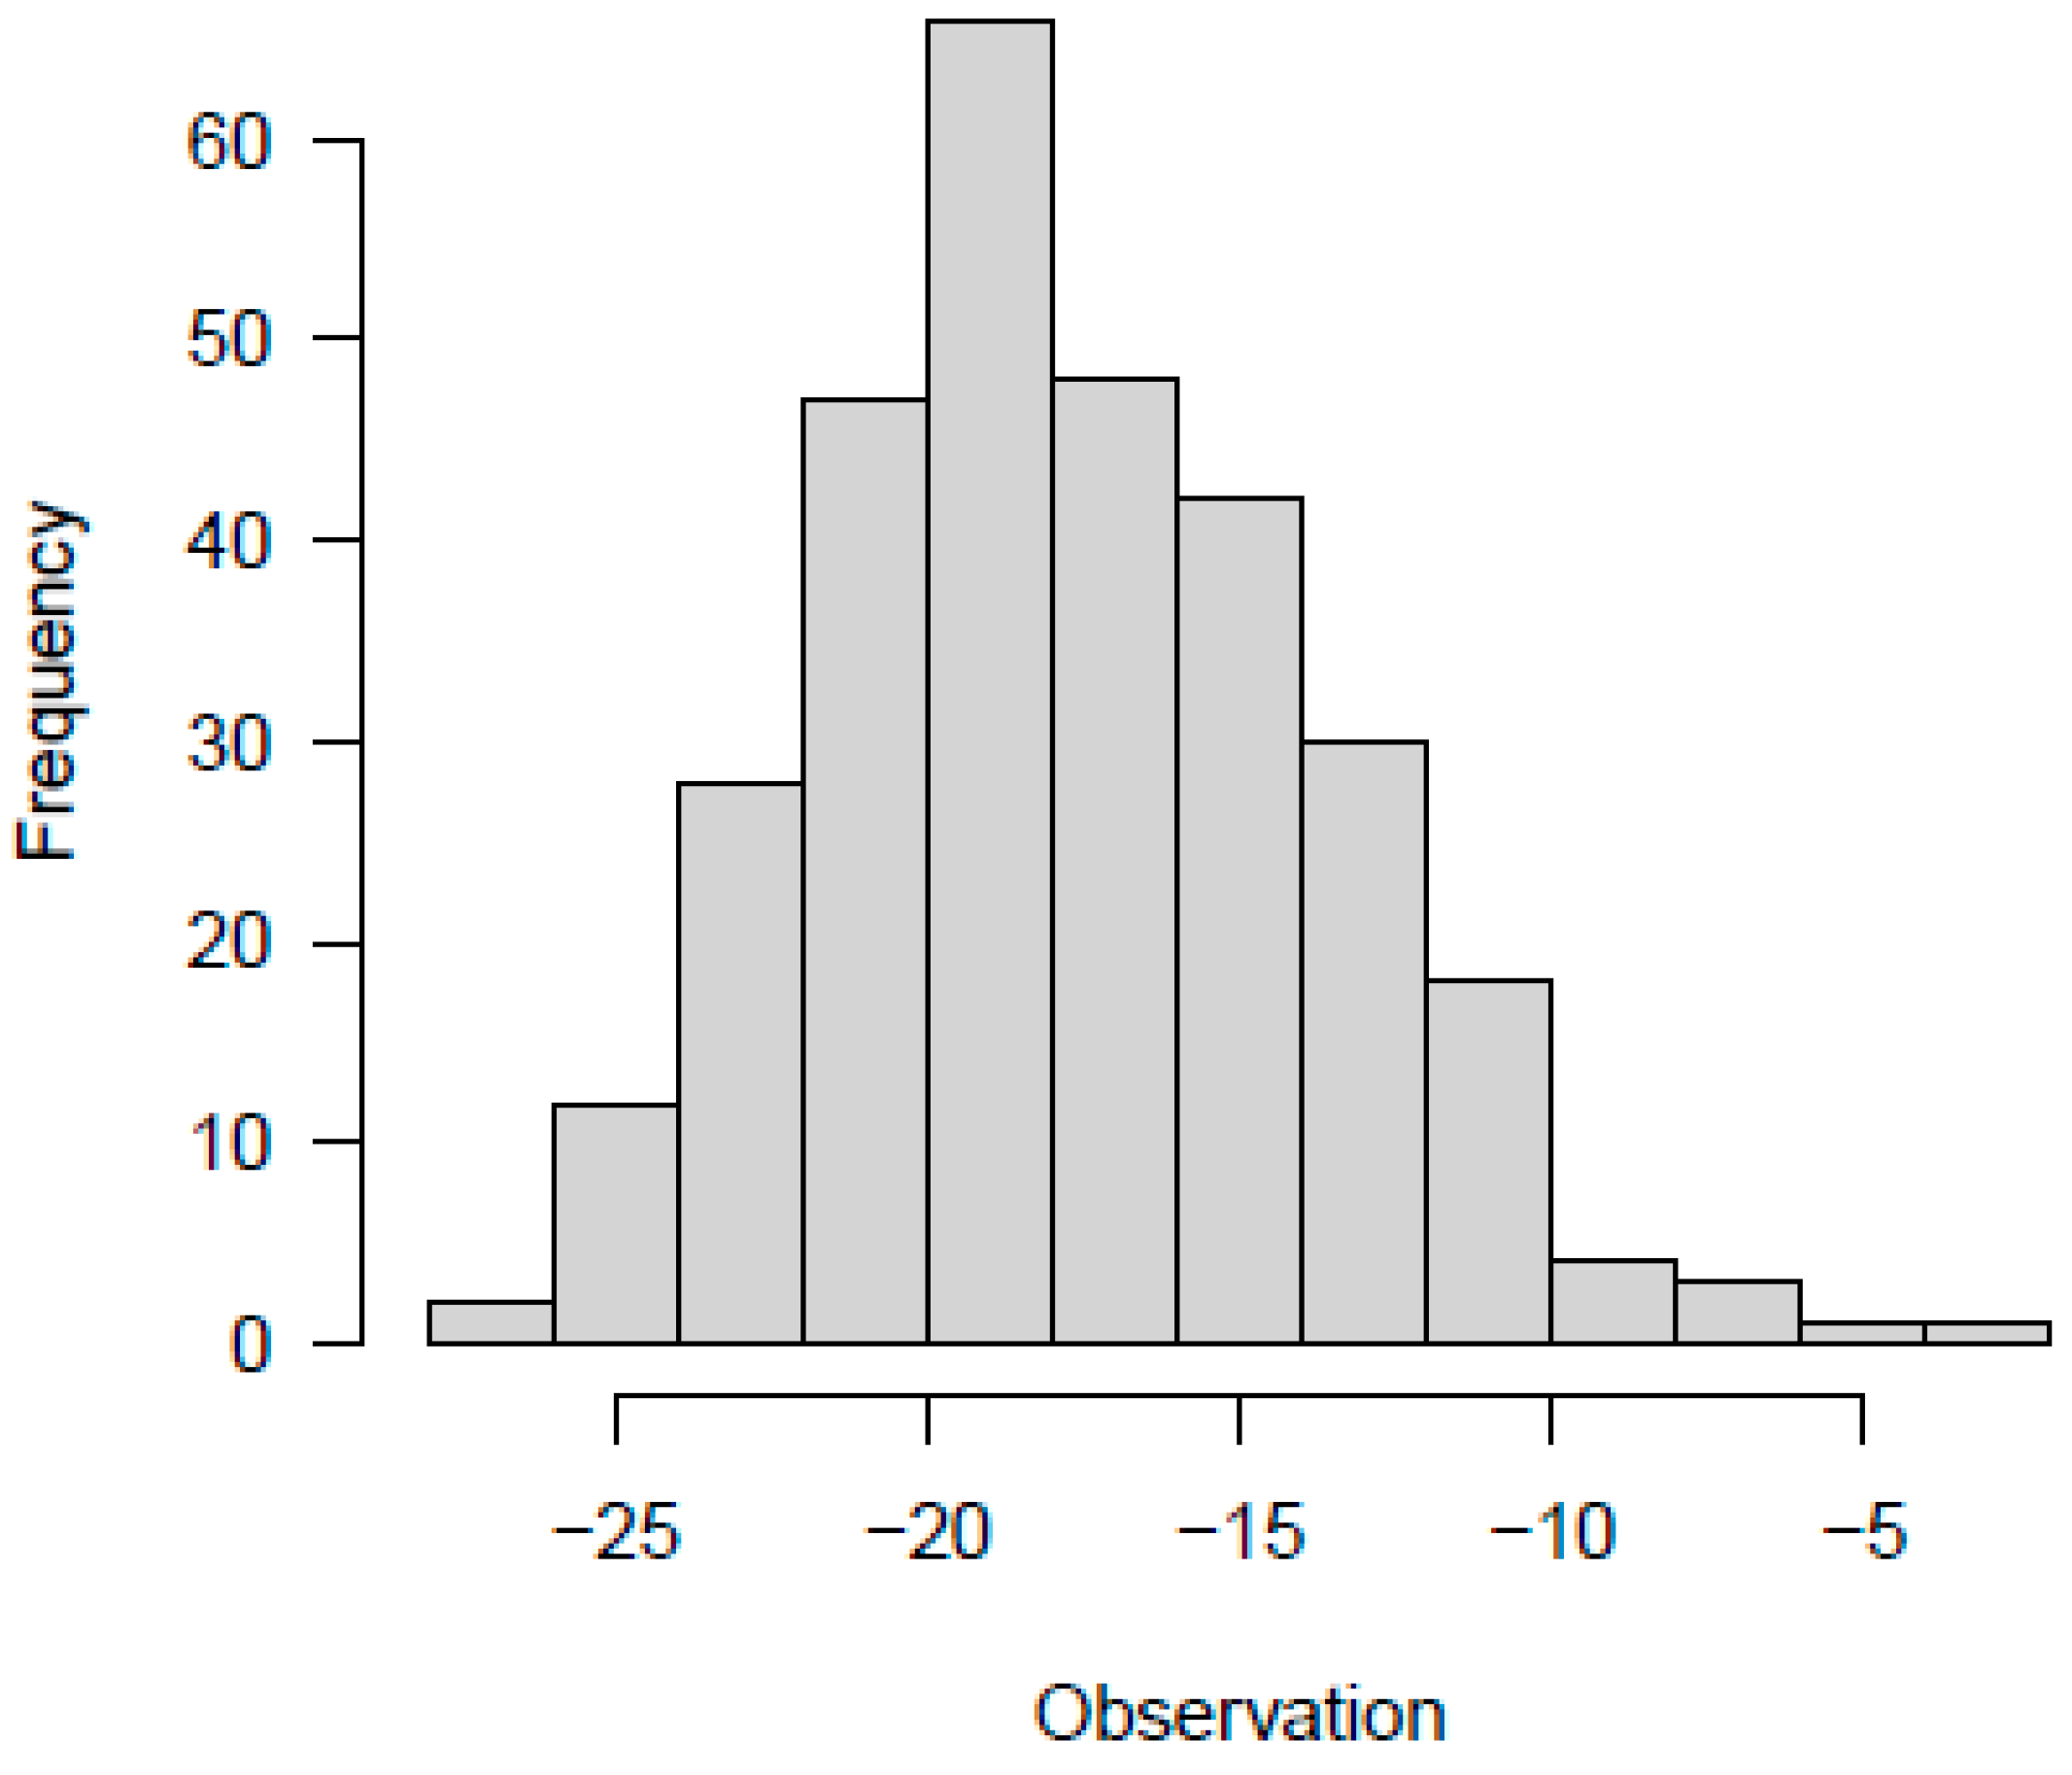
The distribution of the genetic effects seems to be normally distributed; it is centered on some genes with a high effect on the evaluated trait (distributed toward the center of the distribution), and others with a small effect on controlling flavonoid pigmentation (located toward the tails of the histogram), the distribution is near-normal distributed. The phenotype also exhibited a normal distribution and considering that it is the sum of the genetic effect and the residue it is not centered by zero, the distribution shows a higher effect of phenotype in comparison with the effect observed analyzing only the genetic effect (the means of the phenotype seems to be -19) (
Figure 1). There is a positive correlation between the effect and the phenotype (
r=0,87) and between the residual and the phenotype (
r=0,47), but no between residue and the genetic effect (
r= -0.05), which means there is an effect of the genotype in the phenotype.
Population Structure
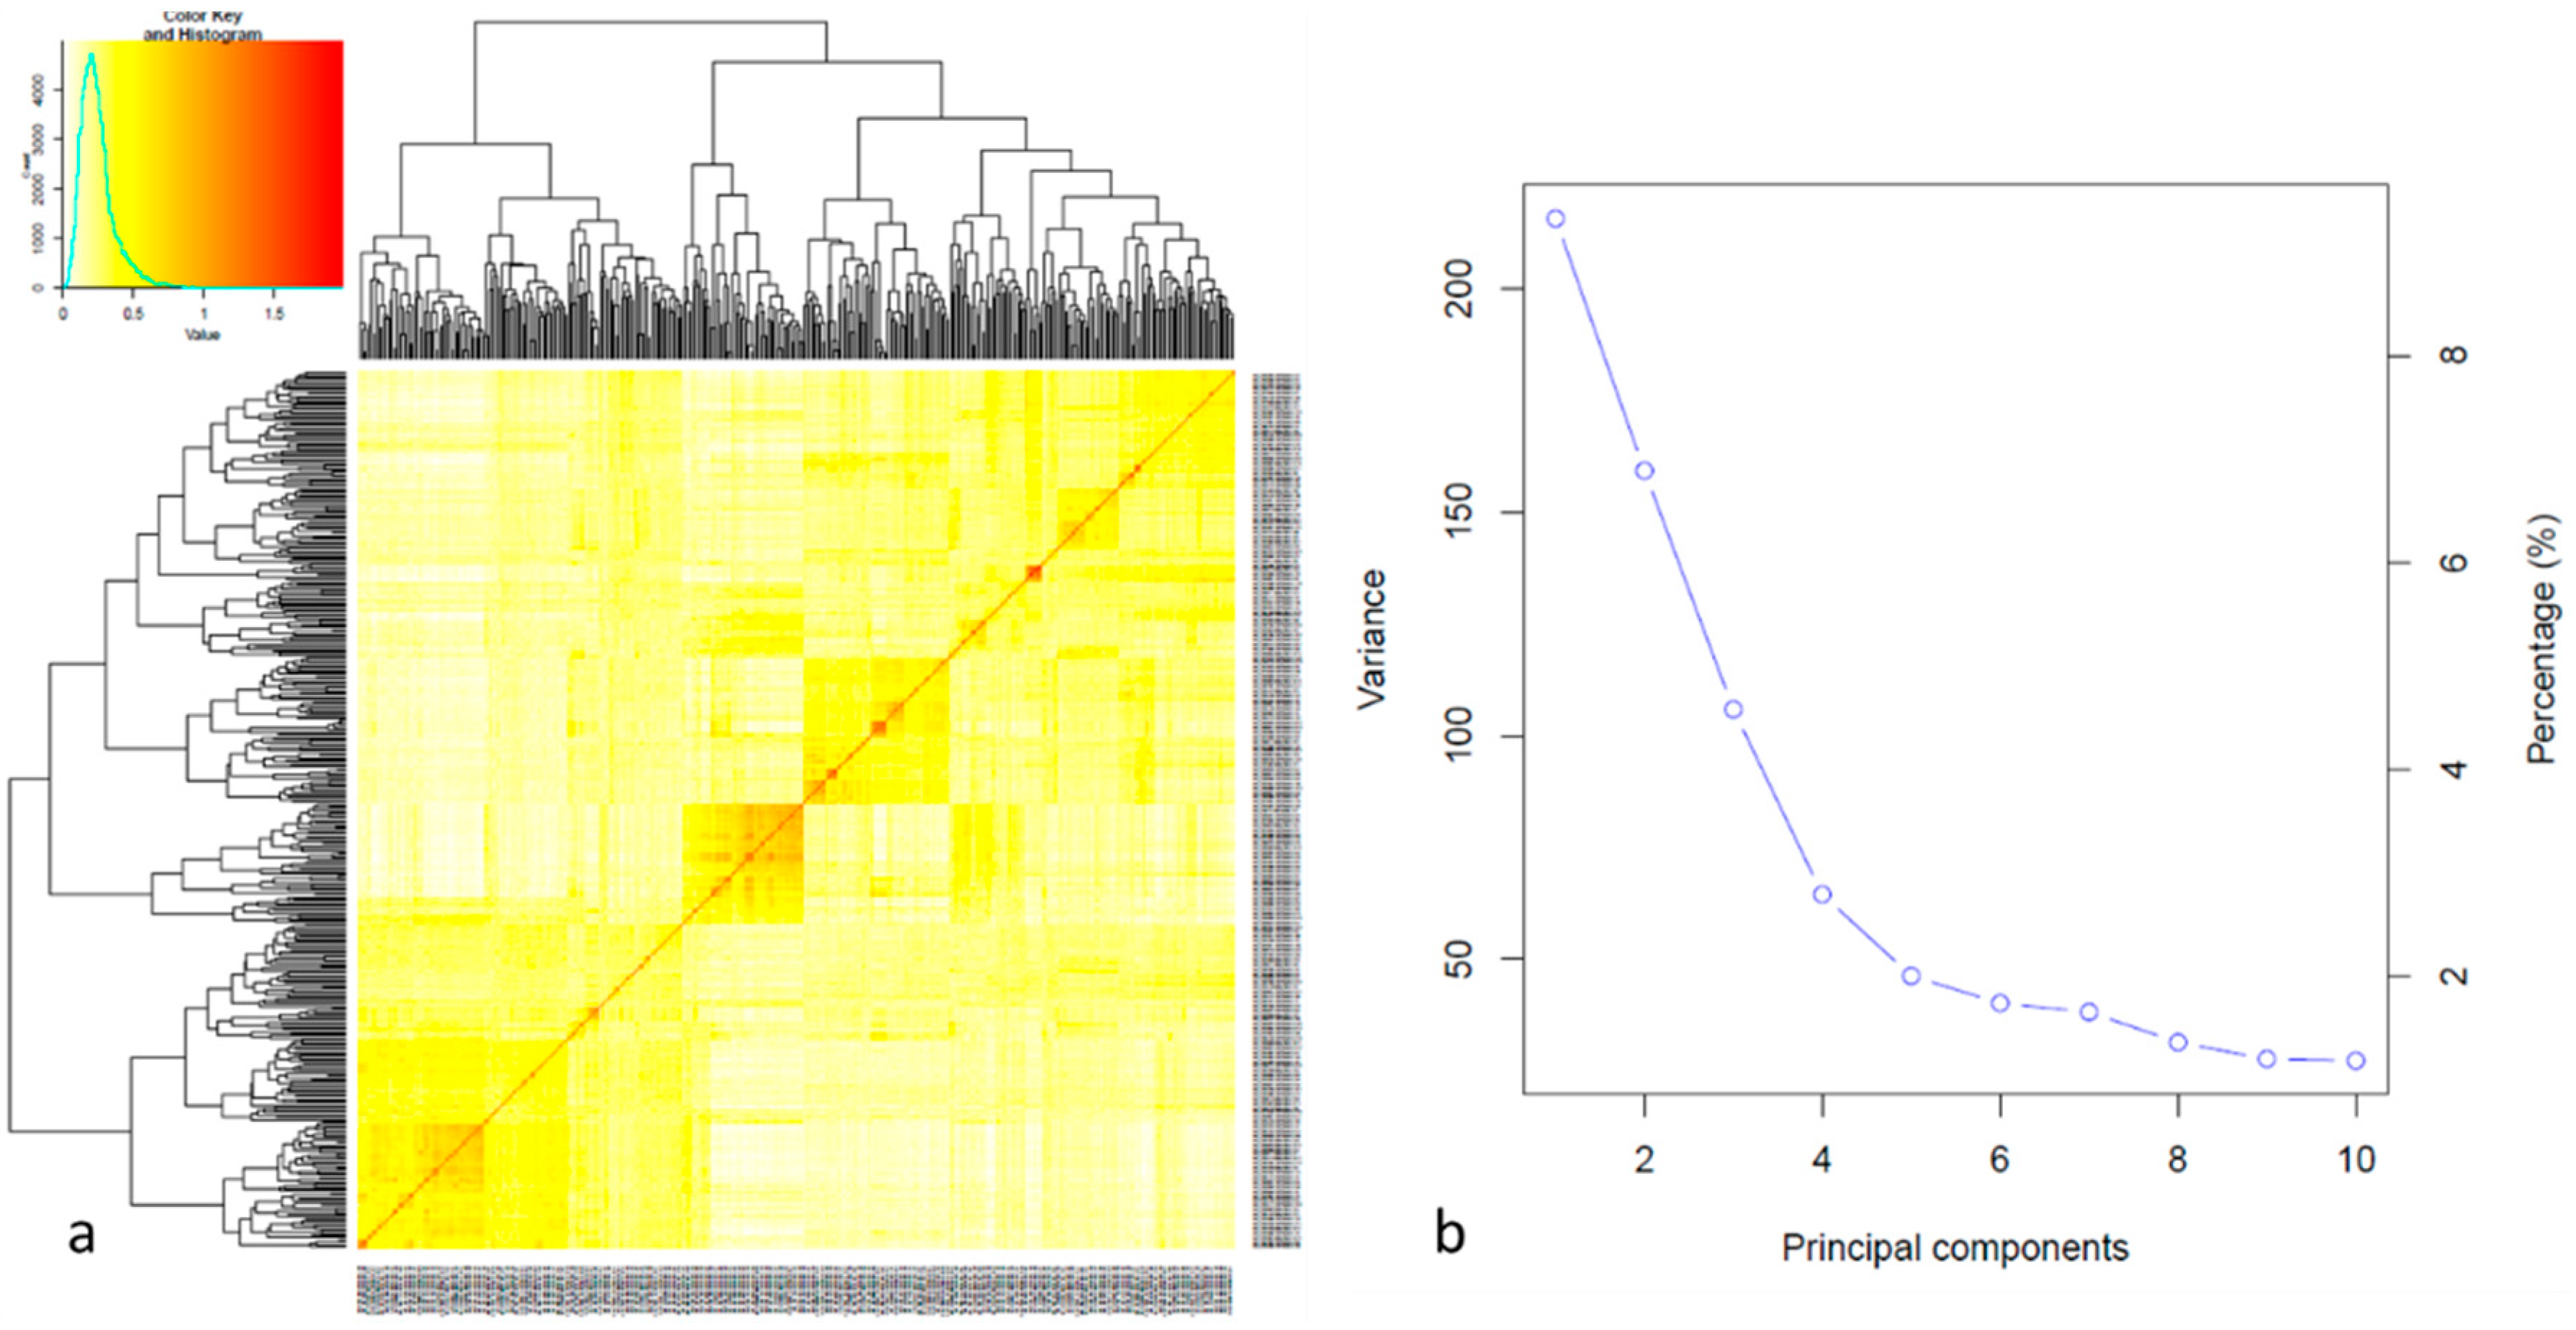
The population structure was analyzed using PCA and kinship matrix. PC1 showed the maximum variation which divided the whole population into five distinct groups. The same results were observed by the phylogenetic tree and kinship matrix (
Figure 2).
GWAS Analysis
The analysis of GWAs using BLINK performed the correlation analysis on the effect on flavonoid pigmentation in Sorghum, the Manhattan plot shows that there were seven SNPs with a significant effect on flavonoid pigmentation on Sorghum assuming a threshold of p= 1X10
-5, two SNPs were identified in the chromosome two, and one in the chromosomes three, four, five (the most significative), seven and nine, as it could be observed none of the QTNs samples were significant for the effect of flavonoid pigmentation (
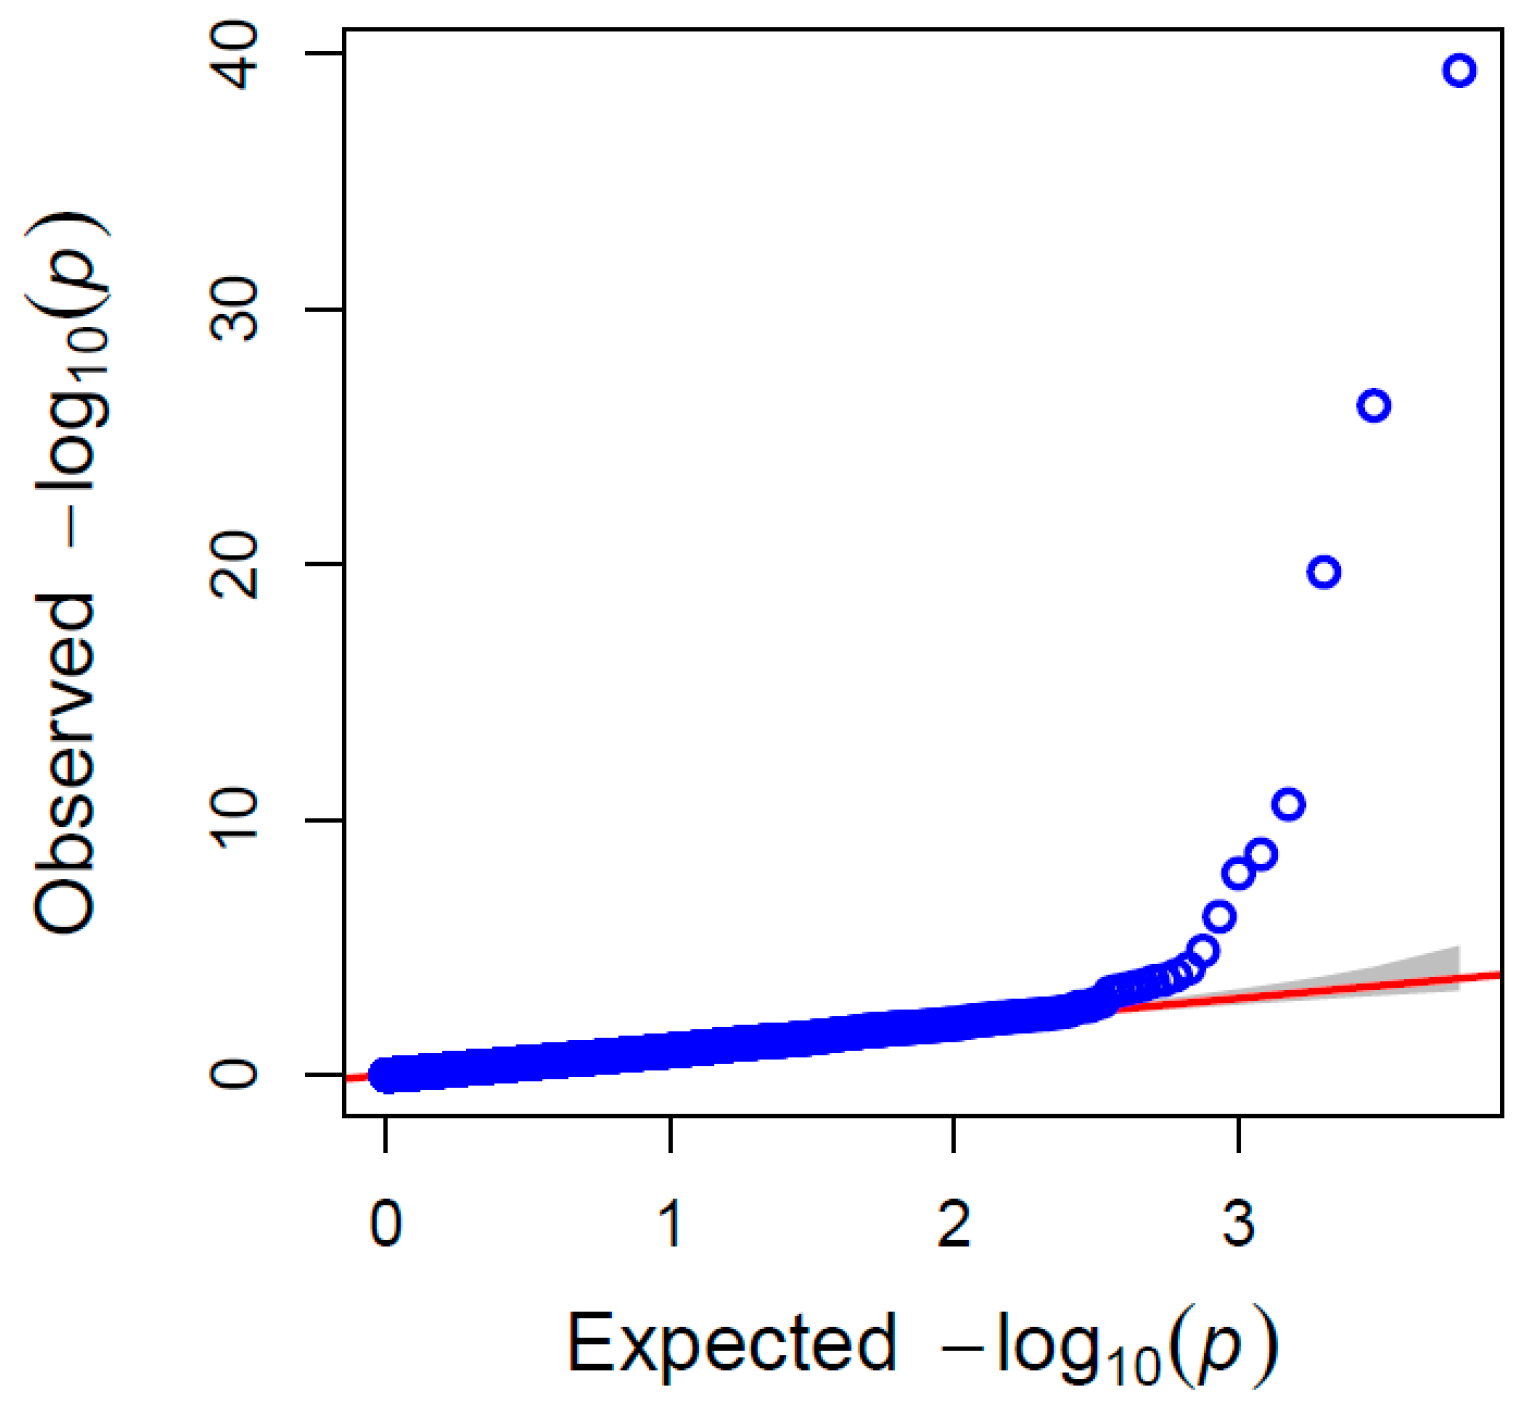
Figure 3). The results of the QQ plot showed that the SNP sites associated with significant correlation were reliable (
Figure 4).
Genomic Selection in Flavonoid Pigmentation of Sorghum
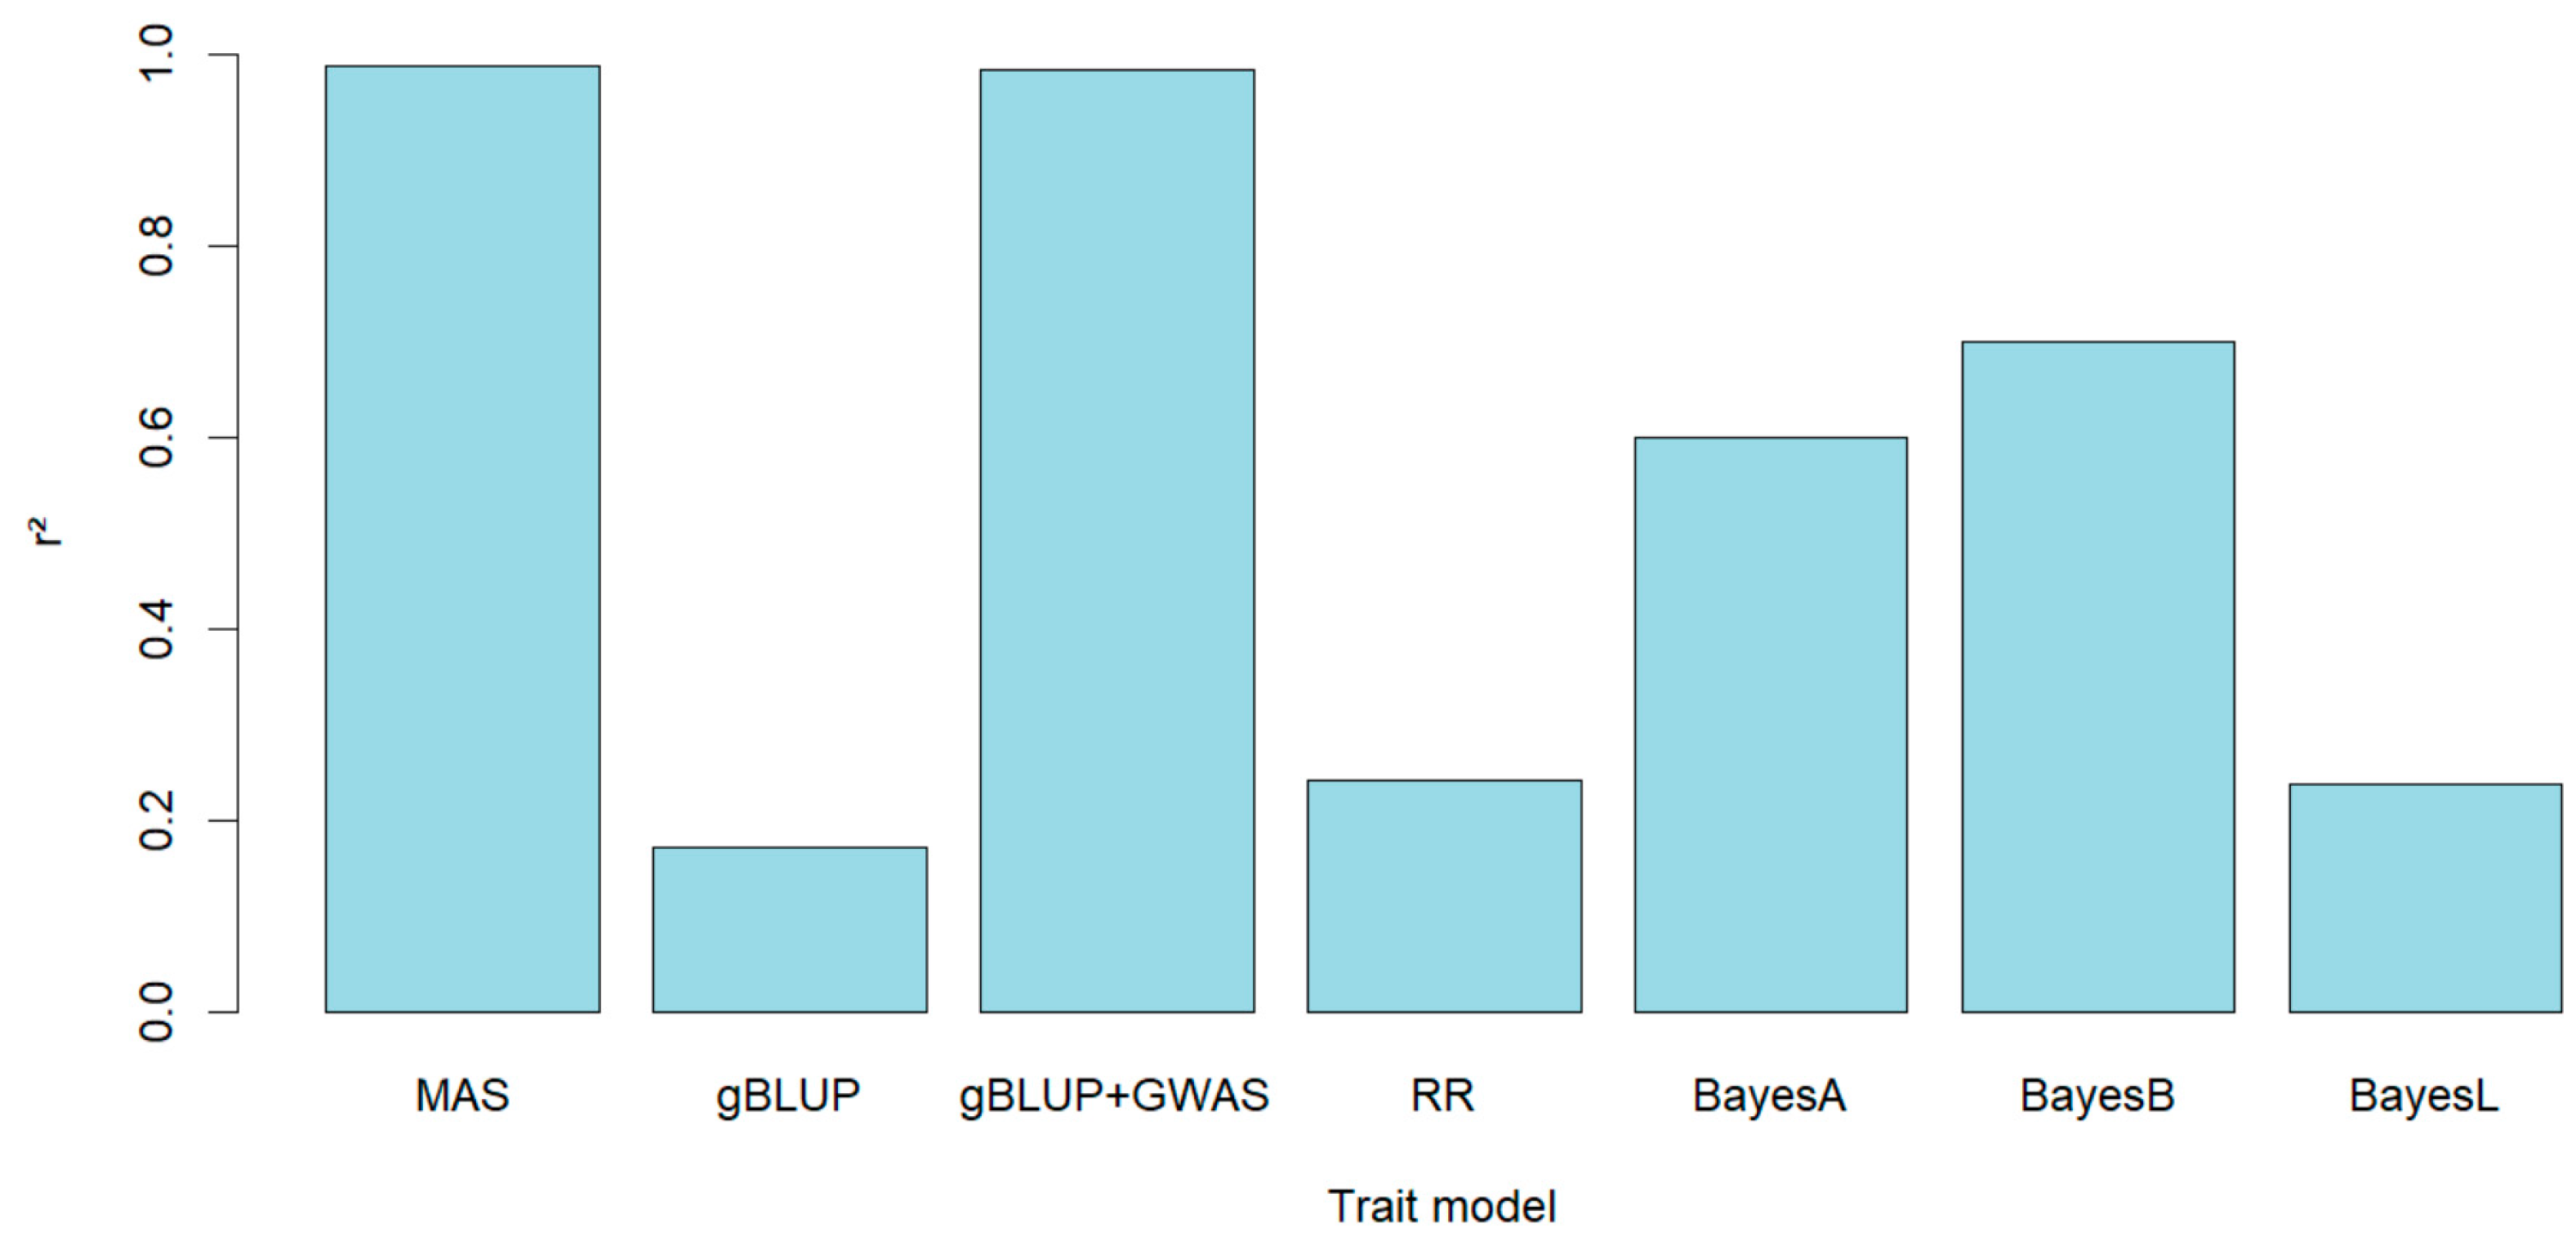
To evaluate the accuracy of genomic prediction it was used 7 types of validation: gBLUP, MAS, gBLUP-GWAS, Bayes A, Bayes B and Bayes LASSO. Mas and gBLUP-GWAS included the most significant SNPs associated from the GWAS analysis to be used during the genomic prediction. The higher prediction was attained when MAS was used (r
2=0.9875), gBLUP showed the lower accuracy (r
2=0.1711), but when GWAs was incorporated building kinship using associated markers in gBLUP the accuracy was highly increased reaching a value close to that observed with MAS (r
2=0.9841), the difference between them was small (0.0034). There were also evaluated other methods of genomic prediction based on Bayesian models (Bayes A, Bayes B and Bayes LASSO) with the last one the accuracy was similar to gBLUP (r
2=0.2238), with Bayes A and Bayes B it was observed an increase of the accuracy (r
2=0.5984 and 0.6995 respectively), even though it did not exceed the r
2 obtained with the validations in which GWAS was included in the model (MAS and gBLUP-GWAS) (
Figure 5).
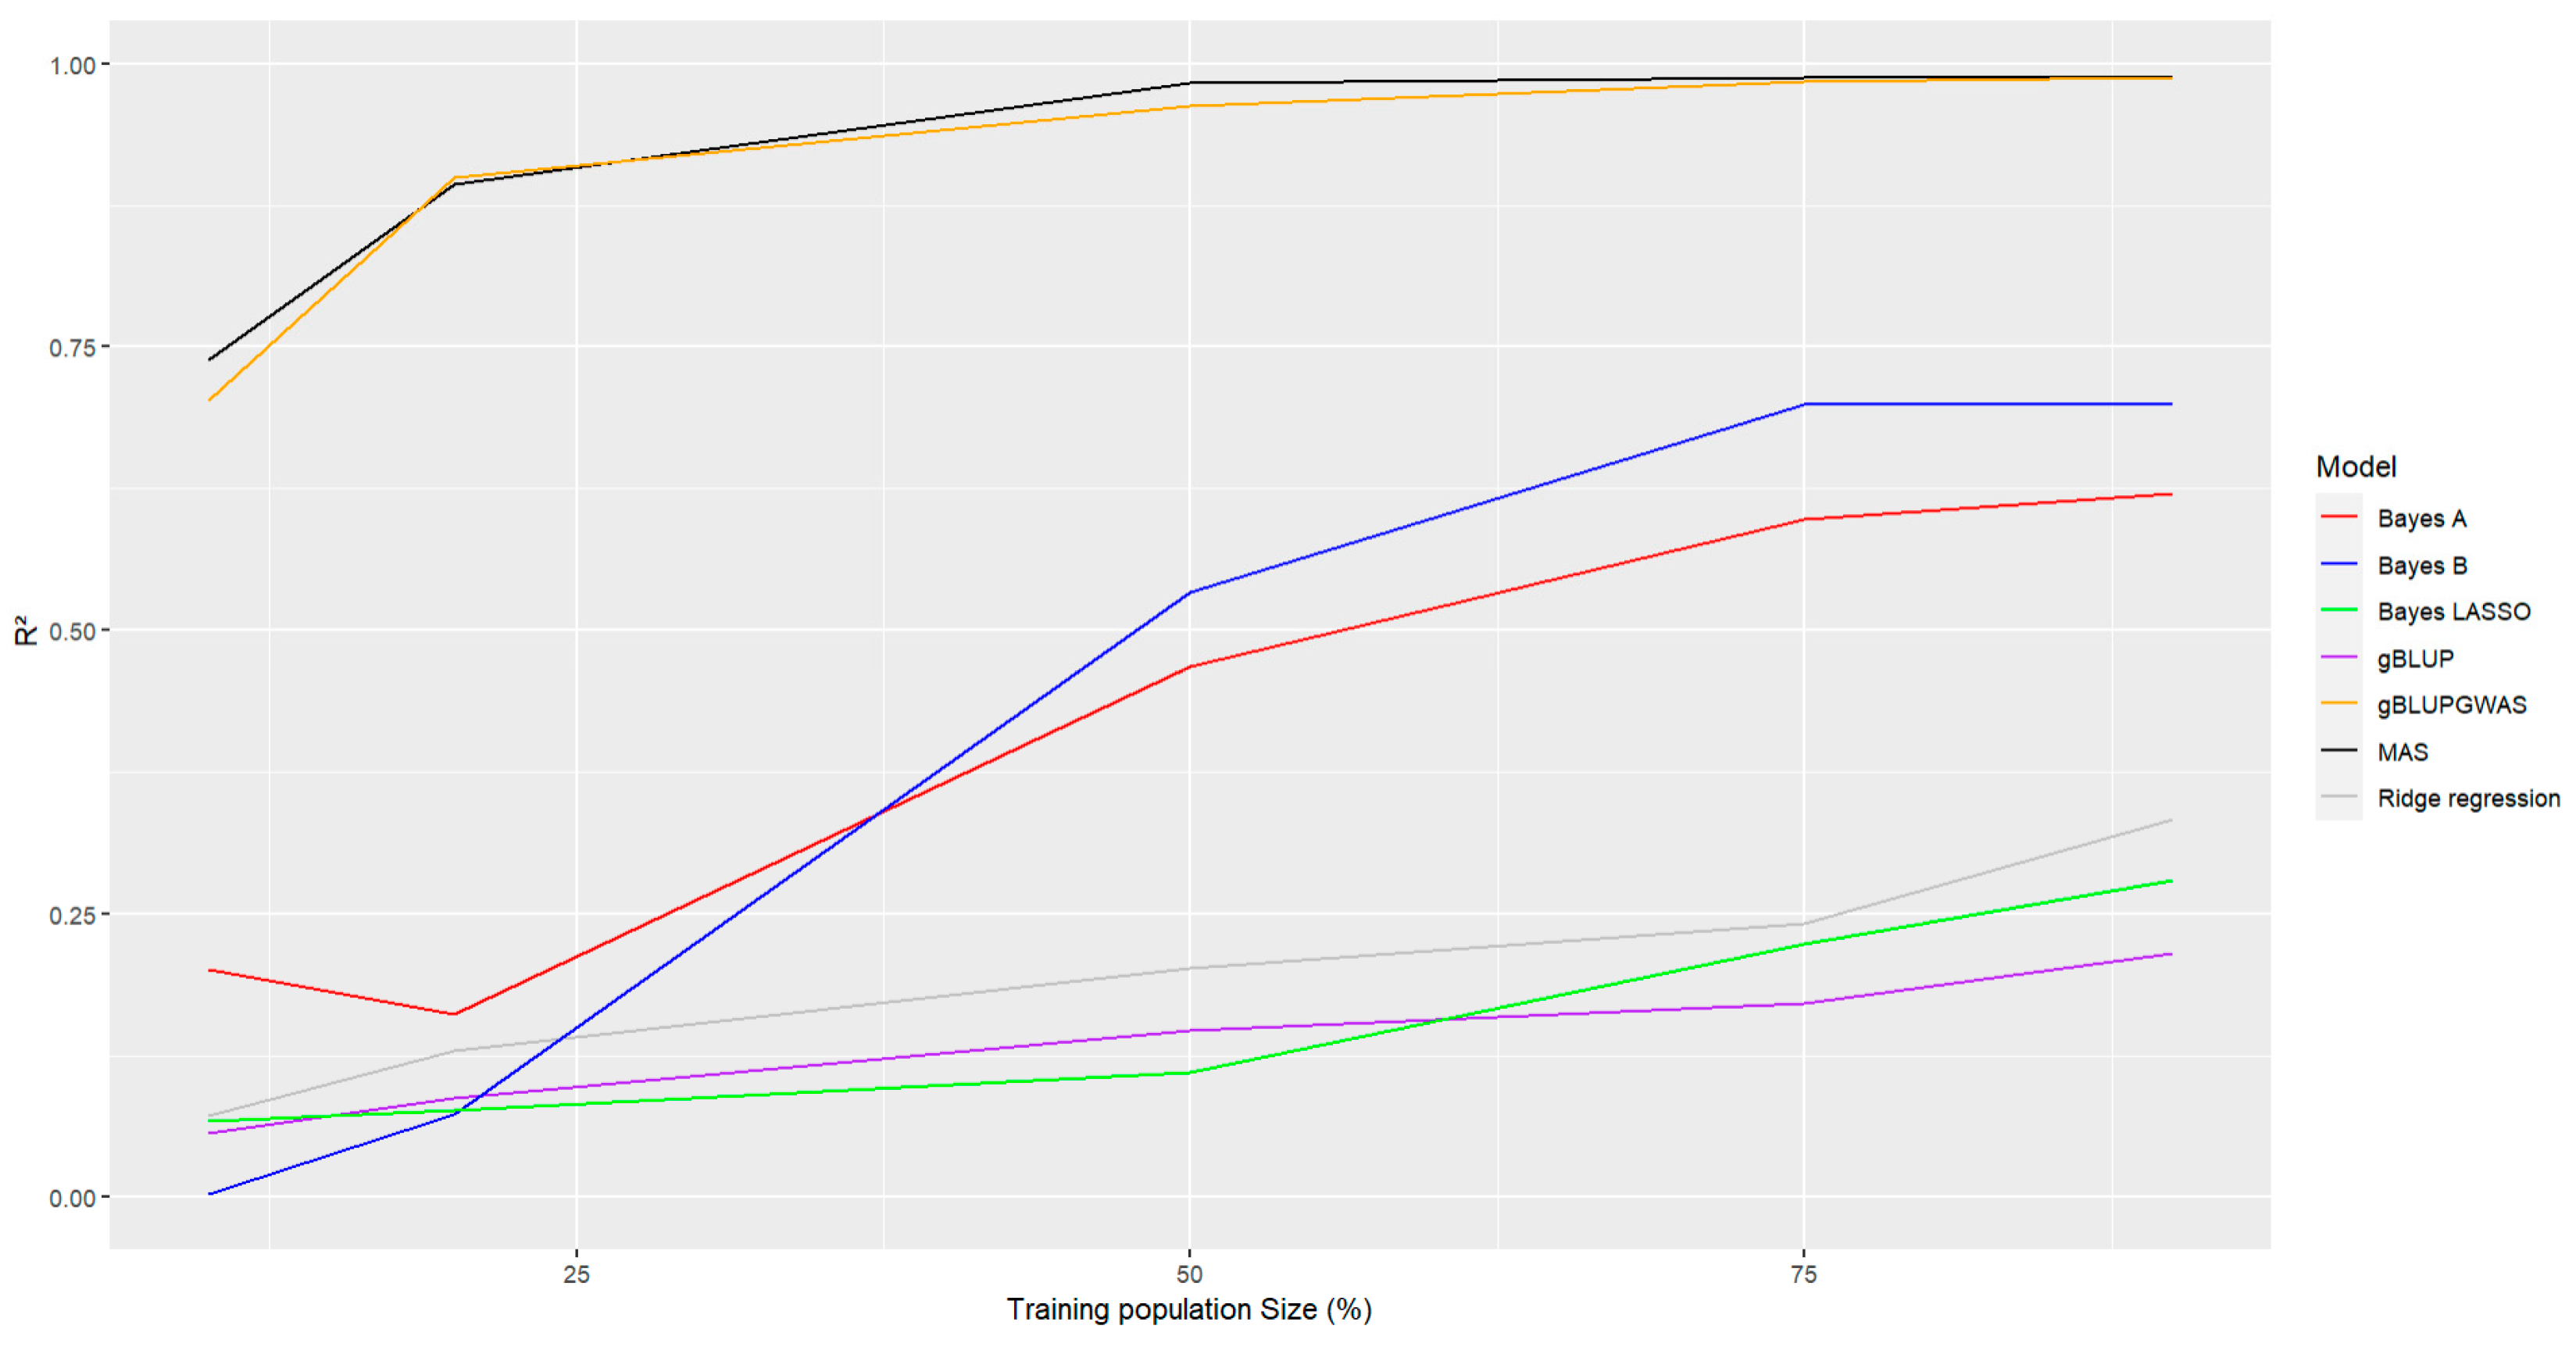
The effect of the size of the training population also was considered to evaluate its effect on the accuracy of the prediction. There were evaluated different percentages of training population (10% to 90%), it could be observed that in general all models with an increase in the training population size also increase the accuracy of the prediction, being Bayes A and Bayes B models the most affected for this parameter (
Figure 6, lines red and blue), the increase was more pronounced in this two methods when there is an increase on this parameter. Even though the remaining models also were affected by the size of the training population, with a higher accuracy with a bigger size of the training population, also it was observed that GWAS-including models have a higher accuracy in comparison with the rest. (
Figure 6, Lines black and orange). Bayes LASSO, gBLUP and Bayesian Ridge regression (
Figure 6, Lines green, purple and gray, respectively) showed the lowest accuracy among the evaluated methods when there is a change in the size of the training population.
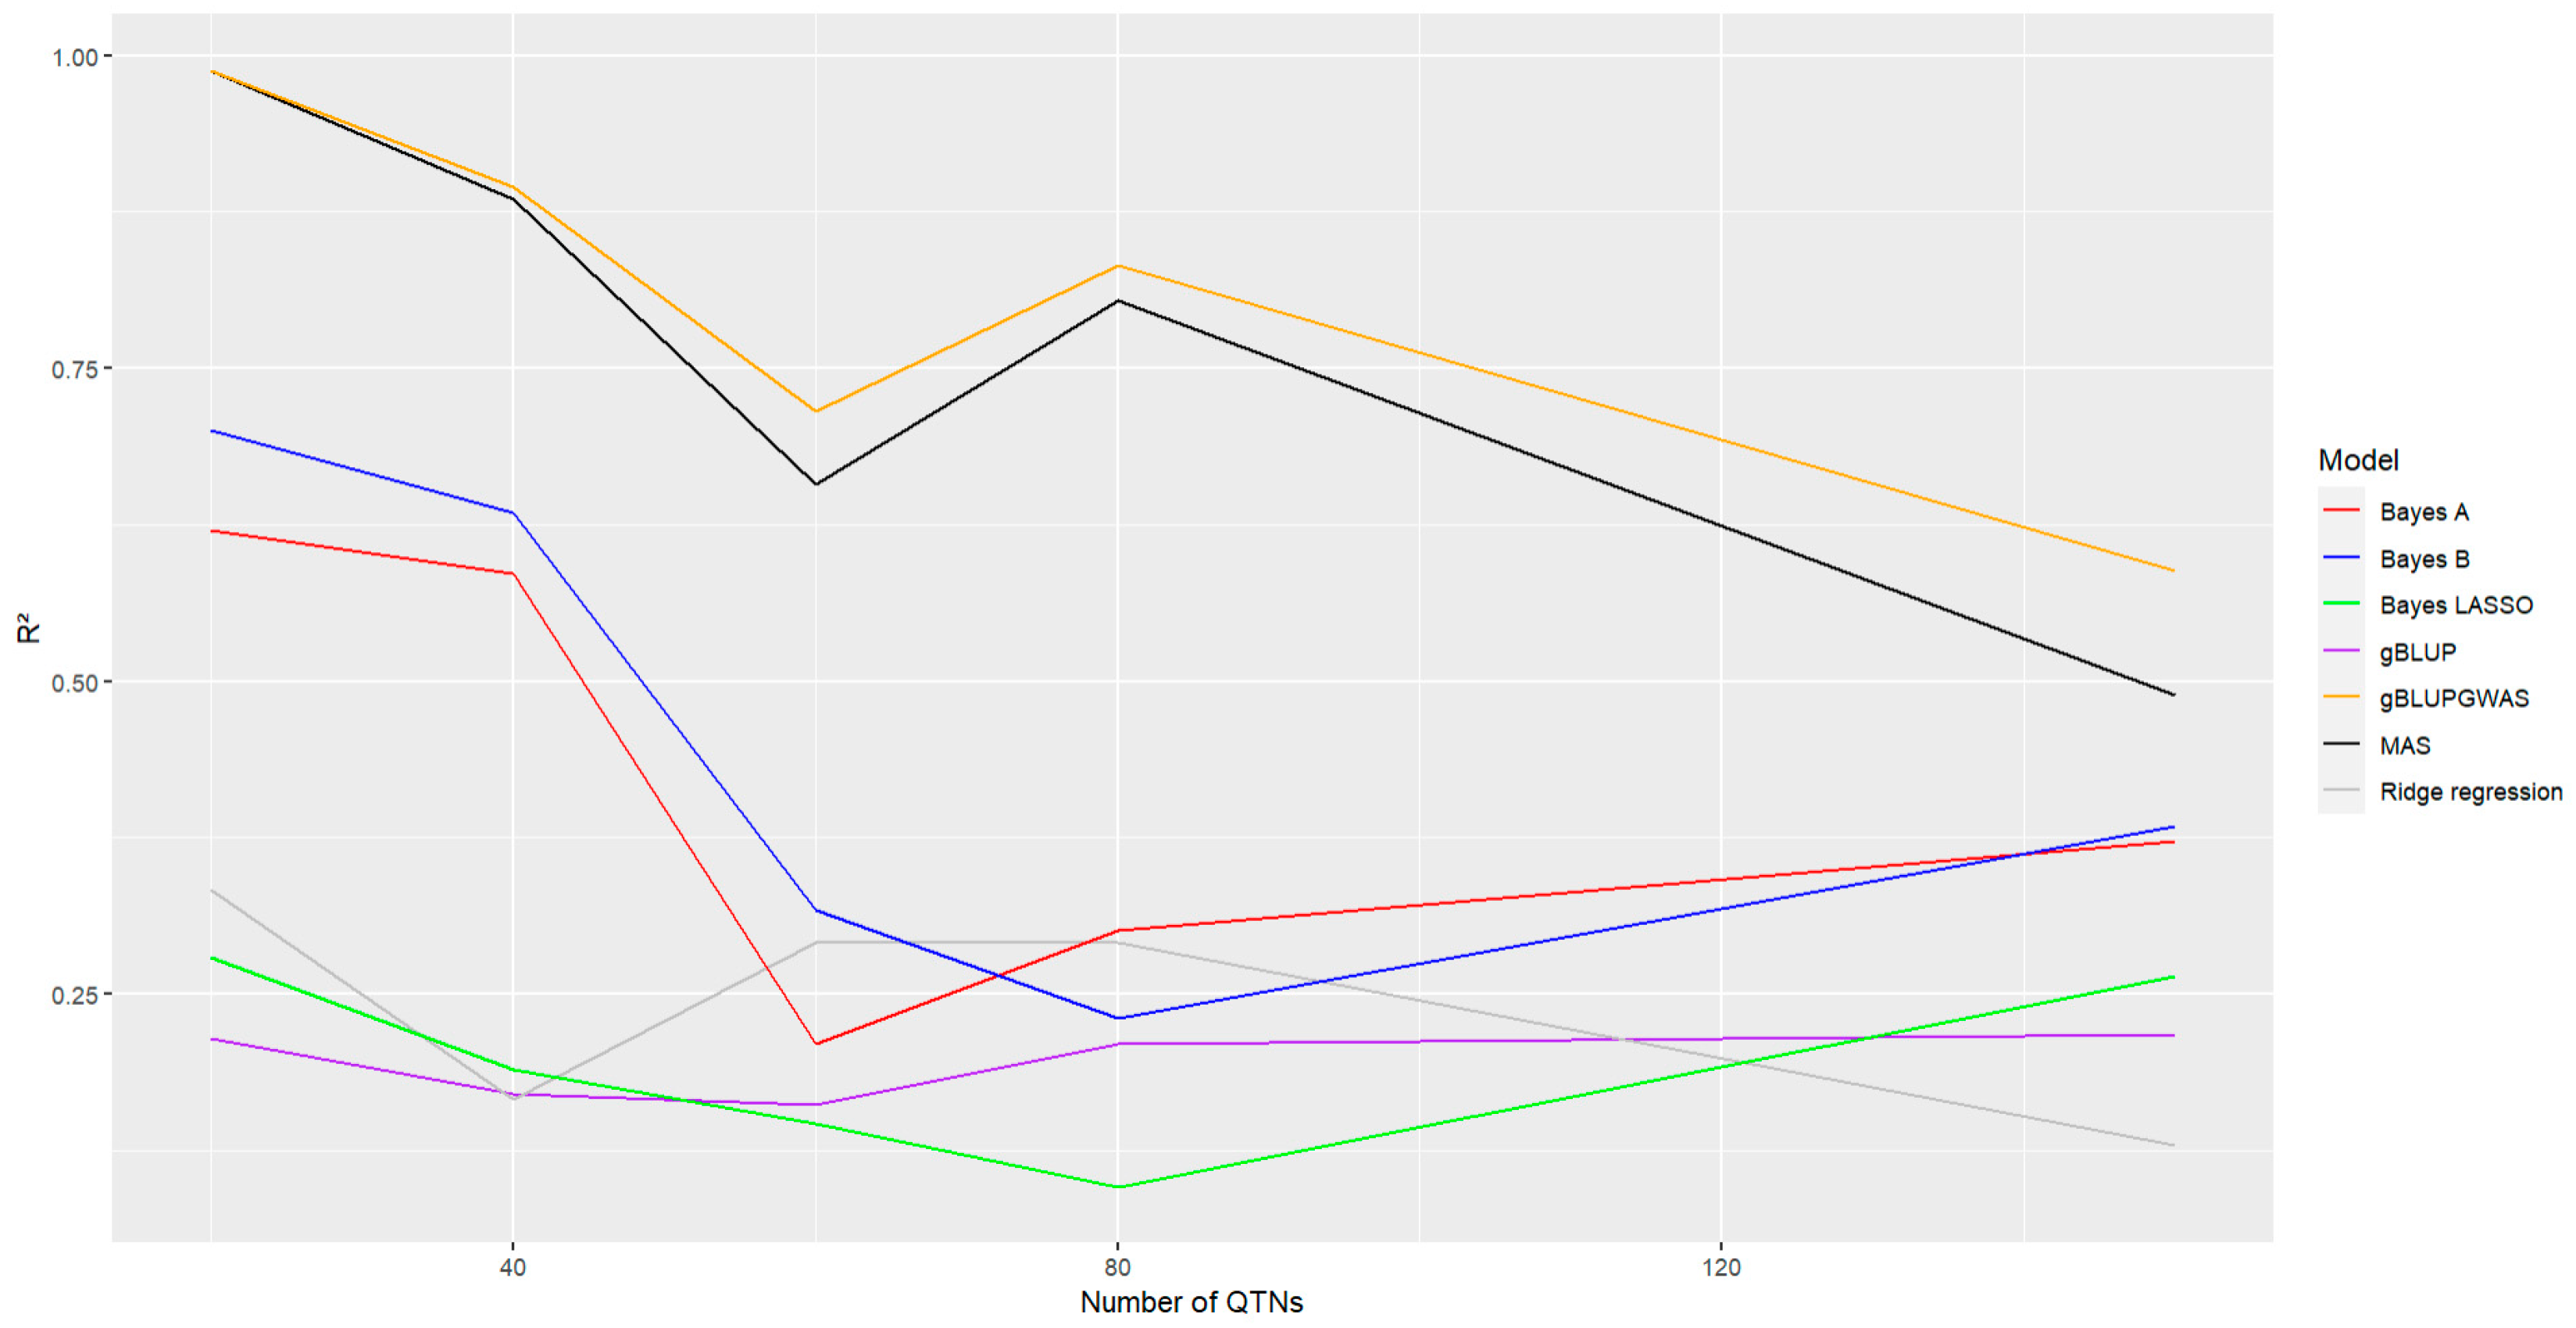
Regarding the number of QTNs included in the analysis, all methods exhibited a reduction in the accuracy of the prediction when the number of QTNs increase, with a stronger effect for the models Bayes A, Bayes B, MAS and gBLUP-GWAS (
Figure 7, Lines red, blue, black and orange, respectively), with a most pronounced decrease for this models, for the remaining models (gBLUP, Bayesian Ridge Regression, and Bayes LASSO) the effect was not as stronger as for the rest of the models, even though they presented the lowest accuracy among the analyzed methods (
Figure 7, Lines purple, gray and green, respectively). Despite this, the GWAS-based models continue showing a higher accuracy in comparison with the rest.
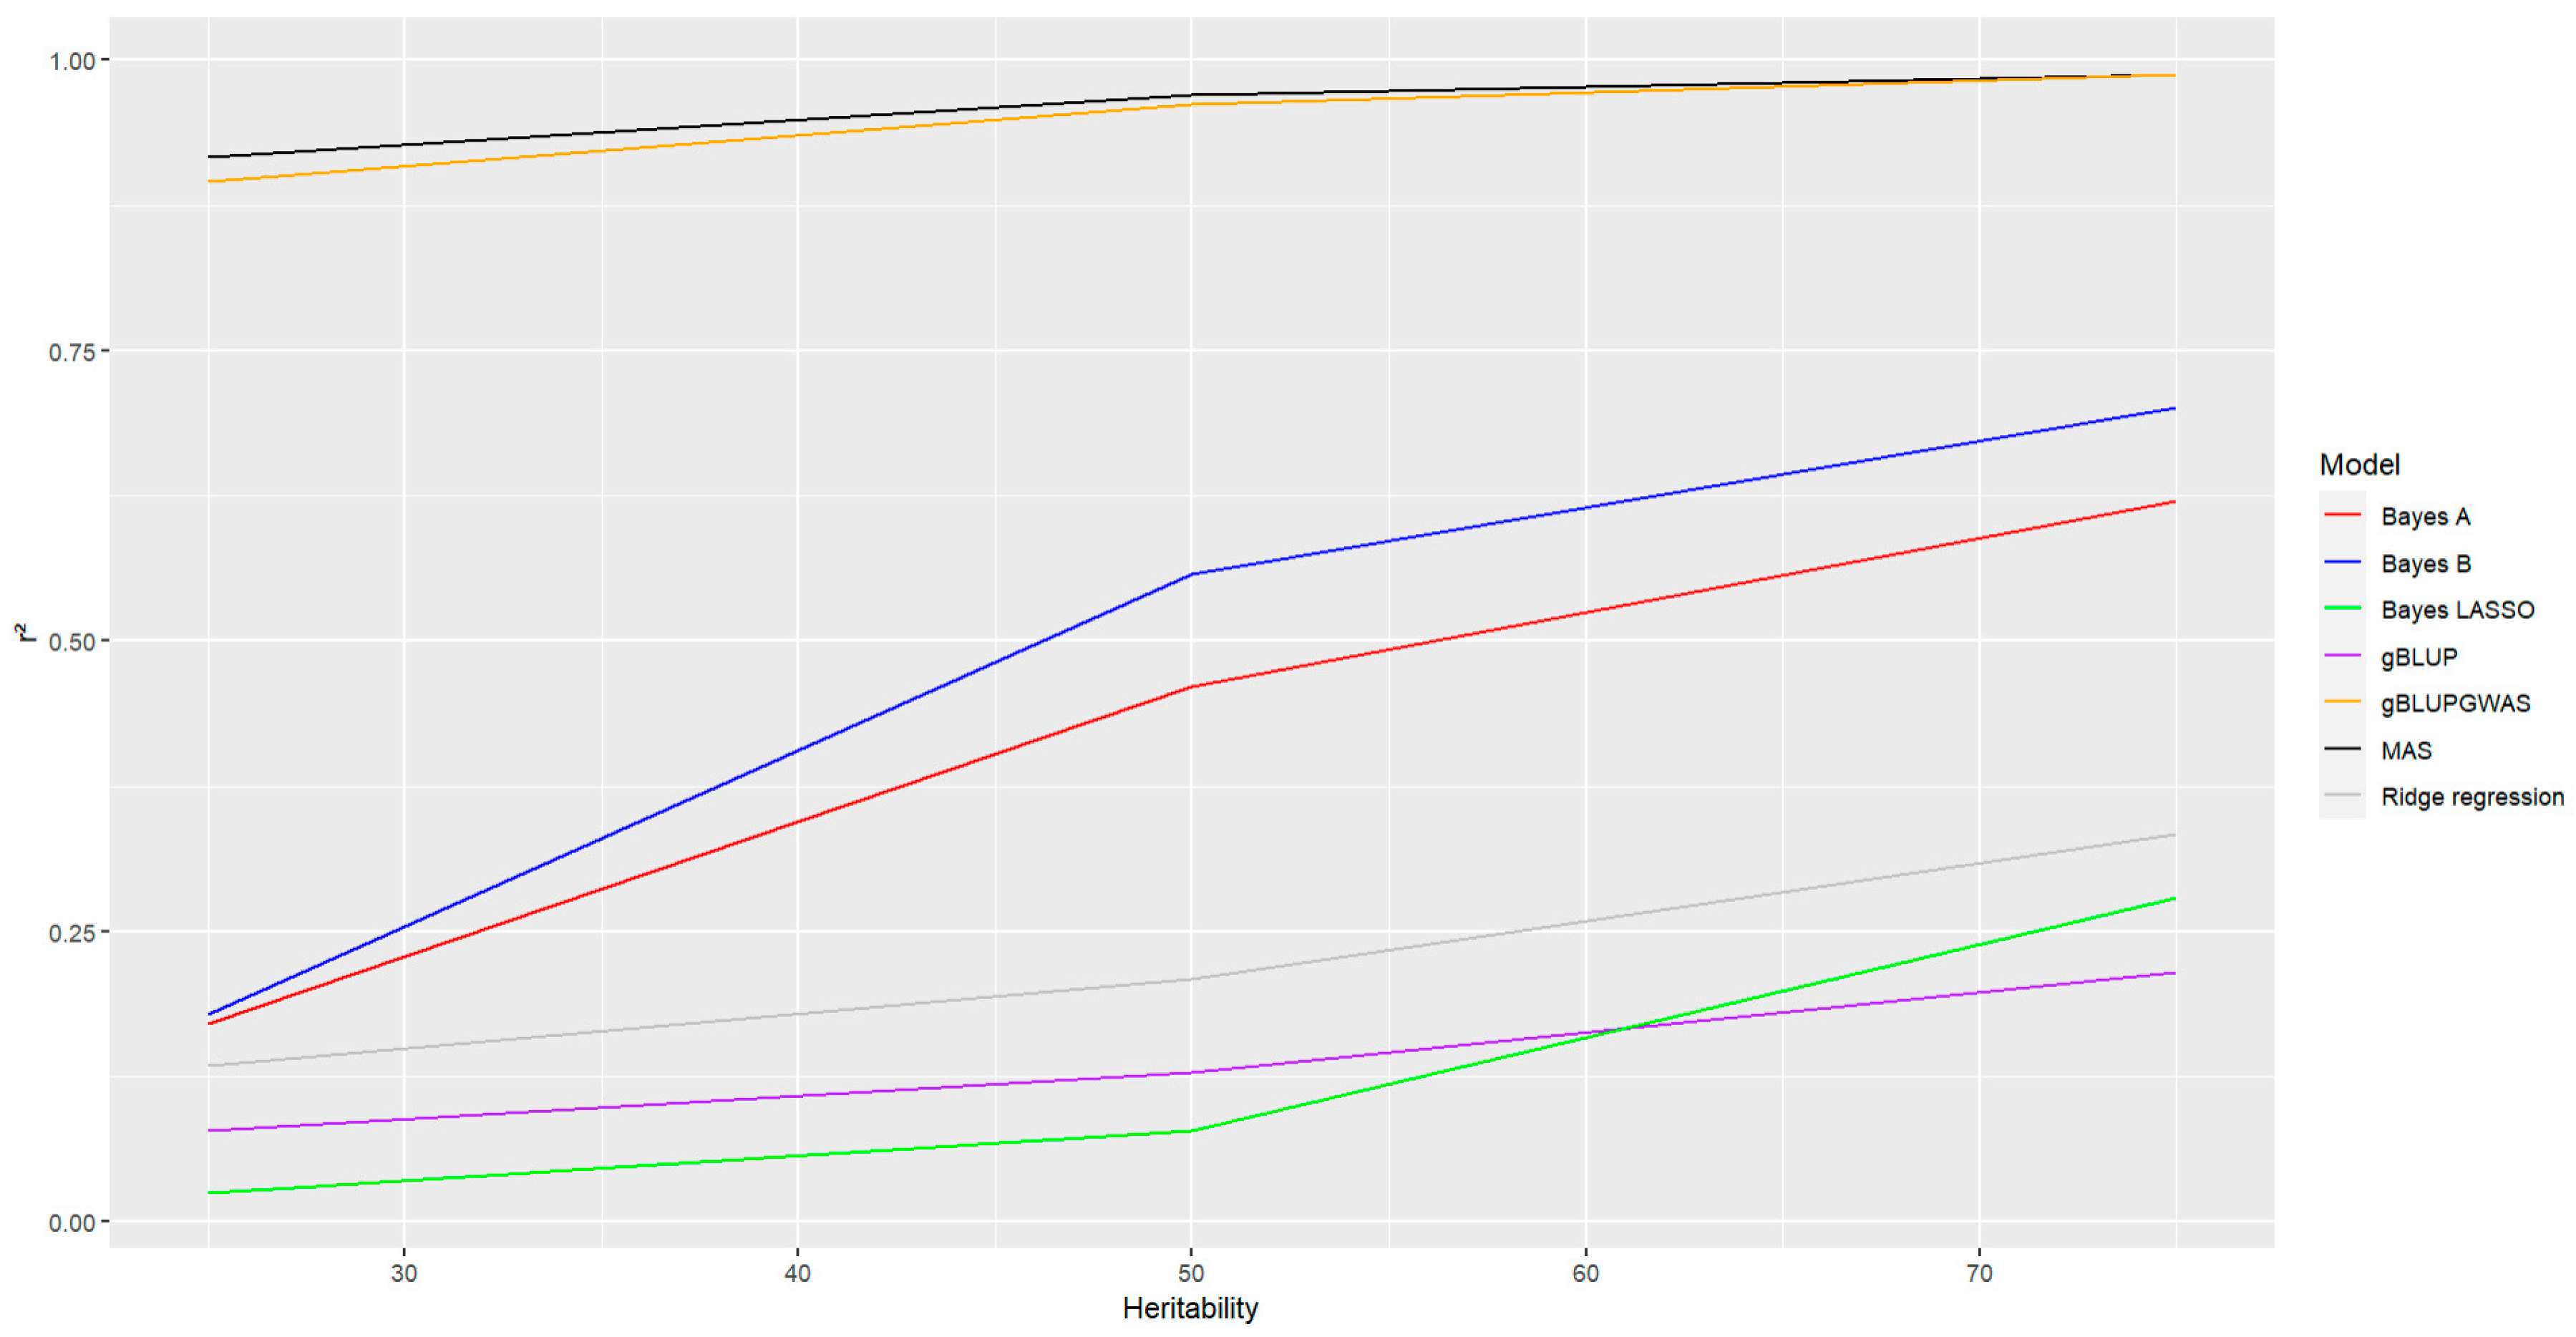
Finally, it was evaluated the effect of heritability on the accuracy of the models, as it was expected an increase in the heritability was associated with an increase in the accuracy, but as in the previous parameter considered this effect was most pronounced in the models Bayes A and Bayes B (
Figure 8, lines red and blue, respectively). The tendency also was observed in the rest models, but the effect was not as stronger as the observed for Bayes A and Bayes B. For the models where GWAS has been included the values of accuracy were the highest in comparison with other models, in particular for these two models, even the heritability affected the accuracy it was observed a slight effect, the values remain almost constant staying above 90% (
Figure 8, lines black and orange for MAS and gBLUP-GWAS, respectively). Bayesian Ridge Regression, gBLUP, and Bayes LASSO were the models with the lowest accuracy in prediction as it was observed for the other parameters described below
Figure 8, lines gray, purple and green, respectively).
Discussion
In the present study it was analyzed a population 378 individuals that was used to carry out GWAS and genomic prediction and genomic prediction analysis on flavonoid pigmentation that exhibited plant architecture trait (
Figure 2). The phenotype followed a normal distribution suggesting that flavonoid pigmentation is caused by the joint action of many genes with additive effects (
Figure 1). Considering tht sorghum exhibited a defined population structure, the genotypes were evaluated for association studies (GWAS) selecting the model BLINK, which incorporates population structure and Kinship effects into the GWAS model, considering the population structure of the flavonoid pigmentation of Sorghum it was not used MLM (Q + K model) for the association analysis because it has been reported that BLINK algorithm more statistical power in identifying true association and reducing false positives (Huang et al., 2019).
The GWAS analysis showed that flavonoid pigmentation in Sorghum was tipically controlled by multiple genes (
Figure 3), the SNPs located in this study were seven distributed in seis different chromosomes: S2_67279771:2:67279771, S2_56302383:2:56302383, S3_10518979:3:10518979, S4_6253550:4:6253550, S5_52834858:5:52834858, S7_14779516:7:14779516, and S9_55704813:9:55704813. Further study on the relevant candidate genes of these loci will be helpful to analyze the genetic mechanism, in previous studies the strongest association signals rely at ~61 Mb of chromosome 4 some of them colocalized with the
Tannin 1 locus (Morris et al., 2013), and one of the SNPs identified in this analysis correspond with these findings, but it is necessary to point out that it was not the SNP with the strongest signal identified in for this analysis. Also, there has been reported other loci associated with this trait, but it could be due to flavonoid pigmentation shows abundant natural variation in many plant species (Huang et al. 2010).
A better understanding of the factors that affect prediction accuracy is important for selecting a model within the conventional breeding scheme. In this study it was found that the GWAs-included methods have a higher accuracy of the prediction, the accuracy was the highest regardless the factors that were modified in order to evaluate its effect. One of them is the model for performing the GWAS analysis, in this case it was considered MLM due to the population structure that this population exhibited, but if is important to clarify that the results will depend on the number of significant SNPs, but the number of SNPs included in the genomic prediction has an important effect in the prediction, when the number of significant SNPs that are included in the prediction is high the accuracy of the prediction is lower, then when the association analysis is done with models as MLM in which the inclusion of the population structure has an effect in the false discovery rate and the type I error (which is lower compared with other methods of association) the prediction will be more accurate than other models. This study only used one model for the GWAS analysis (BLINK), but some parameters of this analysis were changed and they influenced the number of significant SNPs identified (QTN number and heritability), it was observed that a decrease of the accuracy of the prediction when the number of QTNs is higher, meaning that the selection of the GWAs analysis for its inclusion in genomic prediction is crucial (
Table 1).
The focus of this paper was to compare GWAs-including models for genomic prediction (MAS and gBLUP including GWAS), but it also included some models that are not based on GWAs (Bayes A, Bayes, B, Bayes LASSO, Bayesian Ridge Regression, and gBLUP). As for GWAS where the selection of the method considers the population structure, the false discovery rate, the type 1 error, the p-inflation, among other parameters; the selection of the genomic prediction model also may have to consider different parameters, for this it was analyzed other parameters that impact not only the genomic selection model but also the GWAS analysis and hence the genomic selection model if GWAS is included.
In this study, it was only considered one trait, but it is important to highlight that genomic prediction varied substantially among traits and genomic selection models (Ali et al., 2020), it also depends on the architecture structure and heritability of the traits.
With high-heritability traits result in high prediction accuracy, whereas low-heritability traits result in low prediction accuracy. Other studies reported that heritability impact the accuracy of the prediction regardless of the GS model (Thavamanikumar et al., 2020), but this was not observed in this study, the GWAS-based genomic selection models were affected by the heritability, but the effect was not as strong as for other models, gBLUP-GWAs model and MAS showed an almost constant accuracy over the different heritabilities that were analyzed and the accuracy continued to be the highest compared with the other models (above 90%). On the contrary in the rest of the models the impact of the heritability was stronger, more pronounced in particular for Bayes A and Bayes B models (
Figure 8), and the tendency was to show smaller accuracy (below to 75%). This study agrees with the previous where an increase in the heritability results in an increase in the accuracy of the prediction (Combs and Bernardo, 2013; Lian et al., 2014)
In general GWAS-based genomic selection methods had a higher accuracy of prediction, which corresponds with studies reported by other authors (Lozada et al., 2019; Ali et al., 2020) who showed that a higher accuracy is reached when GWAs-derived markers are used in genomic selection. It could be due to different reasons as the number of markers used for the prediction is smaller than the whole population of markers, even though it was observed using different numbers of significant SNPs derived from GWAS when the number of SNPs was higher the accuracy of the prediction was smaller. On the other hand, the selected SNPs are related to the traits, it is important to point out that it also applies to the model selected, as a consequence p inflation and false positives also will impact the SNPs that are associated with the trait, with lower p-inflation and lower false negatives the accuracy of the prediction will be also improved, hence the importance of selecting a model with low p-inflation and low type I error.
This study included two models in which were used GWAS selected SNPs, even both of them showed similar results in terms of the parameter analyzed, it is important to take into account if the evaluated trait is controlled by few genes or if on the contrary if it is controlled by multiple genes. In the first scenario, MAS will be the best option for the prediction, but if the trait is controlled by multiple genes genomic selection might be selected, in those cases gBLUP incorporating GWAS-selected SNPs would be a better model for the prediction with higher accuracy.
Even with the better accuracy shown by GWAS-selected markers for genomic prediction, it is important to consider that only the Stably detected GWAS markers will be helpful for improving the genomic selection, but it requires a careful selection of the threshold for including those markers in the genomic selection.
Conclusion
In general, as in other reports the inclusion of GWAS based markers into the genomic selection using gBLUP improved the model prediciton ability (Lozada et al., 2019; Ali et al., 2020, Kim et al., 2022). Even though, the GWAS-selected marker should be tested in varios testing populations to confirm the results. This type of study provides a foundation for identifying molecular markers associated with flavonoid pigmentation trait in Sorghum, and how genomics can be used for plant breeding. The model based on the SNP selected from GWAS for the prediction exhibited the highest accuracy in comparison with the model where GWAs selected SNPs are not included. The high accuracy suggests that this agronomic trait can be selected in molecular breeding. However, the results presented here require validation.
Supplementary Materials
The following supporting information can be downloaded at the website of this paper posted on
Preprints.org.
Data, Scripts, Code, and Supplementary Information Availability
Conflict of Interest Disclosure
The author declare that they comply with the PCI rule of having no financial conflicts of interest in relation to the content of the article.
References
- Ali M, Zhang Y, Rasheed A, Wang J, Zhang L. (2020). Genomic Prediction for Grain Yield and Yield-Related Traits in Chinese Winter Wheat. International Journal of Molecular Sciences. 21(4):1342. [CrossRef]
- Bian Y, Holland JB. (2017). Enhancing genomic prediction with genome-wide association studies in multiparental maize populations. Heredity 118(6):585-593. [CrossRef]
- Bian Y, Yang Q, Balint-Kurti PJ, Wisser RJ, Holland JB. (2014). Limits on the reproducibility of marker associations with southern leaf blight resistance in the maize nested association mapping population. BMC Genomics 15: 1068. [CrossRef]
- Boichard, D., Guillaume, F., Baur, A., Croiseau, P., Rossignol, M. N., Boscher, M. Y., Druet, T., Genestout, L., Colleau, J., Laurent, J., Ducrocq, V., and Fritz, S. (2012). Genomic selection in French dairy cattle. Anim. Prod. Sci. 52, 115–120. [CrossRef]
- Brøndum, R. F., Su, G., Janns, L., Sahana, G., Guldbradtsen, B., Boichard, D., and Lund, M. (2015). Quantitative trait loci markers derived from whole genome sequence data increases the reliability of genomic prediction. J. Dairy Sci. 98, 4107–4116. [CrossRef]
- Combs E., Bernardo R. (2013). Accuracy of genomewide selection for different traits with constant population size, heritability, and numbers of markers. Plant Genome 6, 1–7. https://doi.org/10.3835/plantgenome2012.11.0030. [CrossRef]
- Endelman, J.B. (2011). Ridge regression and other kernels for genomic selection with R package rrBLUP. Plant Genome, 4, 250–255. [CrossRef]
- Lian L., Jacobson A., Zhong S. Q., Bernardo R. (2014). Genomewide prediction accuracy within 969 maize biparental populations. Crop Sci. 54, 1514–1522. [CrossRef]
- Lipka A. E., Tian F., Wang Q., Peiffer J., Li M. Bradbury, P., Gore, M., Buckler, E., Zhang, Z. (2012). GAPIT: genome association and prediction integrated tool. Bioinformatics 28: 2397–2399. [CrossRef]
- Lozada, D.N.; Mason, R.E.; Sarinelli, J.M.; Brown-Guedira, G. (2019). Accuracy of genomic selection for grain yield and agronomic traits in soft red winter wheat. BMC Genet. 20, 82. [CrossRef]
- Heslot, N.; Yang, H.P.; Sorrells, M.E.; Jannink, J.L. (2012). Genomic selection in plant breeding: A comparison of models. Crop Sci. 52, 146–160. [CrossRef]
- Hollman, P. C. H., & Katan, M. B. (1999). Dietary flavonoids: intake, health effects and bioavailability. Food and Chemical Toxicology, 37(9-10), 937-942. [CrossRef]
- Huang M, Liu X, Zhou Y, Summers RM, Zhang Z. (2019). BLINK: a package for the next level of genome-wide association studies with both individuals and markers in the millions. GigaScience.; 8(2):giy154. [CrossRef]
- Huang X., Wei X., Sang T., Zhao Q., Feng Q. Zhao, Y., Li, C., Zhu, C., Lu, T., Zhang, Z., Li, M., Fan, D., Guo, Y., Wang, A., Wang, L., Deng, D., Li, W., Lu, Y., Weng, Q., Liu, K., Huang, T., Zhou, T., Jing, Y., Li, W., Ling, Z., Buckler, E., Qian, Q., Zhang, Q., Li, J and Han, B. (2010). Genome-wide association studies of 14 agronomic traits in rice landraces. Nat. Genet. 42: 961–967. [CrossRef]
- FAO. (2019). Sorghum: A traditional crop in a changing world. http://www.fao.org/3/i9956en/I9956EN.pdf.
- Geon Woo Kim, Ju-Pyo Hong, Hea-Young Lee, Jin-Kyung Kwon, Dong-Am Kim, Byoung-Cheorl Kang. (2022). Genomic selection with fixed-effect markers improves the prediction accuracy for Capsaicinoid contents in Capsicum annuum, Horticulture Research, (9), uhac204. [CrossRef]
- Lopes, M. S., Bovenhuis, H., van Son, M., Nordbo, O., Grindflek, E. H., Knol, E. F., and Bastiaansen, J. (2017). Using markers with large effect in genetic and genomic predictions. J. Anim. Sci. 95, 59–71. [CrossRef]
- Mace, E. S., Tai, S., Innes, D. J., Godwin, I. D., Hu, W., Campbell, B. C., Gilding, E., Cruickshank, A., Prentis, P., Wang, J & Jordan, D. R. (2013). The plasticity of NBS resistance genes in sorghum is driven by multiple evolutionary processes. BMC Plant Biology, 13(1), 1-13. [CrossRef]
- Morris GP, Rhodes DH, Brenton Z, Ramu P, Thayil VM, Deshpande S, Hash CT, Acharya C, Mitchell SE, Buckler ES, Yu J, Kresovich S. (2013). Dissecting genome-wide association signals for loss-of-function phenotypes in sorghum flavonoid pigmentation traits. G3 (Bethesda). 6;3(11):2085-94. [CrossRef]
- Mukri, G., Potupureddi, G., Ponnusamy, S., & Gupta, S. K. (2019). Genomic selection for improvement of sorghum for biofuel and bioproducts. In Genomic Selection for Crop Improvement (pp. 375-387). Springer, Cham.
- Norman, A.; Taylor, J.; Edwards, J.; Kuchel, H. (2018). Optimising genomic selection in wheat: Effect of marker density, population size and population structure on prediction accuracy. G3 Genes Genomes Genet. 8, 2889–2899. [CrossRef]
- Perez P, de los Campos G (2014). “Genome-Wide Regression and Prediction with the BGLR Statistical Package.” Genetics, 198(2), 483–495. [CrossRef]
- R Core Team, (2012). R: A Language and Environment for Statistical Computing. R Core Team, Vienna, Austria.
- Su, G., Christensen, O. F., Janss, L., and Lund, M. S. (2014). Comparison of genomic predictions using genomic relationship matrices built with different weighting factors to account for locus-specific variances. J. Dairy Sci. 97, 6547–6559. [CrossRef]
- Thavamanikumar, S.; Dolferus, R.; Thumma, B.R. (2015). Comparison of genomic selection models to predict flowering time and spike grain number in two hexaploid wheat doubled haploid populations. G3 Genes Genomes Genet. 5, 1991–1998. [CrossRef]
- Uffelmann, E., Huang, Q.Q., Munung, N.S. et al. Genome-wide association studies. Nat Rev Methods Primers 1, 59 (2021). [CrossRef]
- Veroneze, R., Lopes, P.S., Lopes, M.S., Hidalgo, A.M., Guimarães, S.E., Harlizius, B., Knol, E., van Arendonk, J., Silva, J., and Bastiaansen, J. (2016). Accounting for genetic architecture in single- and multipopulation genomic prediction using weights from genome wide association studies in pigs. J. Anim. Breed. Genet. 133, 187–196. [CrossRef]
- Zhang, Z., Ober, U., Erbe, M., Zhang, H., Gao, N., Jinlong, H., Li, J., Simianer, H. (2014). Improving the accuracy of whole genome prediction for complex traits using the results of genome wide association studies. PLoS One 9:e93017. [CrossRef]
- VanRaden, P.M. Efficient methods to compute genomic predictions. J. Dairy Sci. 2008, 91, 4414–4423. [CrossRef]
|
Disclaimer/Publisher’s Note: The statements, opinions and data contained in all publications are solely those of the individual author(s) and contributor(s) and not of MDPI and/or the editor(s). MDPI and/or the editor(s) disclaim responsibility for any injury to people or property resulting from any ideas, methods, instructions or products referred to in the content. |
© 2023 by the authors. Licensee MDPI, Basel, Switzerland. This article is an open access article distributed under the terms and conditions of the Creative Commons Attribution (CC BY) license (http://creativecommons.org/licenses/by/4.0/).
