1. Introduction
This study analyses the detection efficiency of the Worldwide Lightning Location Network (WWLLN) over Spain, and comparison is made with the Meteorological Spanish Agency (AEMET) Lightning Detection Network as a ground truth. We installed our WWLLN-Valencia station in June 2011, at that time the Valencia station was the 69th station in the WWLLN network. Although WWLLN provides data for the whole Earth, the interest of present work is the Iberian Peninsula, and WWLLN performance in Spanish land. The AEMET data was open-access until 2012, and we use lightning location data from 1st January 2012 to 30st April 2012 from AEMET, also from some days having strong lightning activity in 2020, 2021, and 2022. Our work shows that WWLLN provides an excellent detection efficiency (DE) and location accuracy (LA) in Spanish land.
1.1. The WWLLN network
The Worldwide Lightning Location Network (WWLLN) operates a ground based planetary distributed network of Very Low Frequency (VLF) antennas which detect lightning VLF signals around the Earth. Very high currents from lightning strokes radiate strong VLF signals in the band 6-22 kHz, which are detected up to 10,000 km. The WWLLN deployed by University of Washington (USA) and the University of Otago (New Zealand) with the cooperation and maintenance of a large number of Universities and Research Institutions around the globe achieves global location of lightning stroke at a planetary scale with a with a constantly improved accuracy, (Dowden et al., 2002; Lay et al., 2004; Jacobson et al., 2006; Rodger et al., 2005, 2006, 2009).
The distance between WWLLN sensors was around 5000-15000 km before 2012. These sensors are designed to detect VLF radio signals in the top of the audio frequency band, their sensor receive the radiofrequency emissions of lightning in this frequency band which excite electromagnetic wave modes in the region between the ground and the lower ionosphere which acts as a parallel plate waveguide. These waves propagate as a superposition of Transversal Electric (TE), Transversal Magnetic (TM) or Transversal Electromagnetic (TEM) modes. The location of the lightning current is obtained from the distance to several sensors similarly to modern Global Navigation Systems. It works with the time delay in detection to each sensor using the timing signal of GPS.
The VLF signal from a lightning stroke is named sferic, is a time limited electromagnetic signal in the band 6-22 kHz with duration of milliseconds. The detection of the sferic arrival is complicated inside the background noise, and improved trigger techniques are developed combined with minimization methods to provide the correct timing of the arrival. The Time of Group Arrival (TOGA) method and later improvements can be found in the work of Dowden et al. (2002) and Rodger et al. (2009). The lightning is processed and registered in the WWLLN records when the signal is detected by a minimum of 5 sensors.
There is a very high spectral power of lightning emissions inside the VLF band, and the special propagating conditions of the earth-ionosphere waveguide for this frequencies allow the sferic to be detected at distances of the order of 10,000 km, that is a quarter of the terrestrial hemisphere. Therefore, the measuring sensors can be placed at distances of the order of ten thousand kilometers, (Crombie, 1964). In the WWLLN context the location of sensors is somewhat anecdotic because the distance between sensors in Iberian Peninsula is around 760 km. The WWLLN detection relies in the sferic detection, which is related to the excitation of Tranversal Electric (TE), Transversal Magnetic, (TM) or Transversal Electromagnetic (TEM) modes in the earth-ionosphere waveguide (EIWG) which are in the kHz range, thus the Detection Efficiency (DE) of WWLLN is high for strong lightning strokes capable of a proper excitation of TE, TM or TEM waveguide modes. These modes are in the kHz range because the cuttoff frequency (
fc) of TE-TM EIWG modes is defined by the ionosphere altitude
fc =c/2h, where h ~ 80-90 km and c is the velocity of light. The WWLLN had 40 receiving sensors in 2010, giving a DE~11% in 2010 for peak currents greater than 20kA (Abreu et al. 2010) and distance accuracy ~ 5 km. The number of sensors increased in the period 2010-2012. The Valencia station was set in operation in the University of Valencia in June 2011, contributing to the data information of the WWLNN network, and WWLLN had 69 stations in September 2012, in 2023 the number of active sensors is around 70. The performance of WWLLN improved at that time providing a maximum DE close to 15% for CG strokes, the DE increased for high power strokes, giving DE >50% for CG strokes > 40kA, (see
Table 1). At that time the average accuracy improved to ~3 km, and the timing accuracy ± 16 μs (Holtzworth and Hutchins, 2012).
WWLLN receiving sensors use a single 1.5m whip antenna to measure the vertical polarization of the electric field (vertical to ground) associated to the sferic. The sensing procedure does not provide differences between discharges cloud-to-ground, named CG, or discharges cloud to cloud, named Intra-Cloud or IC. The whip antenna is sensitive to the vertical electric field, and the electric field coming from the CG or IC strokes cannot make any difference. EIWG modes associated to the sferic signal are mainly excited by CG vertical strokes although are also excited by strong IC strokes. Therefore, differences between IC and CG strokes are difficult to be inferred from the sferic signal and both IC and CG are included with the available data, (Hutchins et al, 2012b).
The WWLLN data is in ASCII, and mat (MatlabTM) files providing the following information for each lightning stroke:
-Date and time in UTC, time resolution is given in microseconds.
-Latitude and Longitude are in degrees with four decimals.
-Residual fit time error in microseconds (<30 microseconds)
-Number of sensors which detect the signal
-RMS power (kW) estimation from 7 to 17 kHz in 1.3ms sample time.
-Power uncertainty (kW) in the power calculation.
-Number of sensors which detect the stroke used for the power estimation. A subset of sensors within the range <10,000 km distant from stroke are used for the power estimation.
Each WWLLN station includes a Global Positioning System (GPS) device, a whip antenna, a preamplifier close to the antenna and a soundcard. The WWLLN sensor detects the VLF signal, in the kHz range, emitted by the lightning stroke. Whip antenna, preamplifier, and GPS are located outside the building wired connected to a soundcard. The soundcard is a typical commercial soundcard inserted in the board of a desktop computer, which has Internet connection inside the building. This computer process the sferic time domain signal combined with the GPS timing signal and transmits the data to the processing stations. The antenna is anchored to the steel structure of the building to have a good ground plane, this provides a good signal to noise ratio in the sferic bandwidth (Dowden et al., 2002). The WWLLN receivers are designed to be sensitive to the vertical electric field from lightning strokes, minimizing the influence of magnetic induction, therefore these have a strong immunity to artificial VLF magnetic fields (Lay et al., 2004), that are difficult to isolate from industrial machines, household appliances, and other electronic systems.
Minimization methods were used to obtain the TOGA time and lightning locations, the quality of these data are given by time differences lower than 30 μs, (Rodger et al., 2009). Finally, the current of the lightning stroke is calculated by means of the detected electric field since 2012.
1.2. The AEMET network
AEMET's sensors are spaced at distances of less than 400 km and are therefore suitable for the dimensions of the Iberian Peninsula. These sensors detect the low frequency (LF) emissions of lightning. LF is the ITU designation for radio frequencies (RF) in the range of 30–300 kHz. LF signals from lightning strokes are intense and propagate with little attenuation per surface waves over the Earth's surface. An IMPACT (Improve Performance for Combined Technology) technology is used by AEMET, which consists of first determining the direction from which the electromagnetic signal arrives (MDF or Magnetic Direction Finder), (Orville & Huffines, 1999; Cummins et al., 1998, Pérez-Puebla, 2004), (AME 2012). Using the information received by at least two sensors, the intersection of the lines, by triangulation, determines the location of the lightning. In addition, the propagation time of the signal to the sensor is determined, which depends on the distance of the sensor to the surface impact point of the discharge. Using the information from two sensors, the Time of Arrival (TOA) delay between them determines a hyperbola with the possible locations of the discharge. Each pair of sensors detecting the discharge will determine a hyperbola, and the intersection of the different hyperbolas will set the possible discharge location. At least 4 sensors are needed so that the location is not too ambiguous. Finally, to optimize the location, the intersection of circles is used instead of hyperbolas. Both techniques, MDF and TOA are used in combination to obtain a better accuracy in the discharge location.
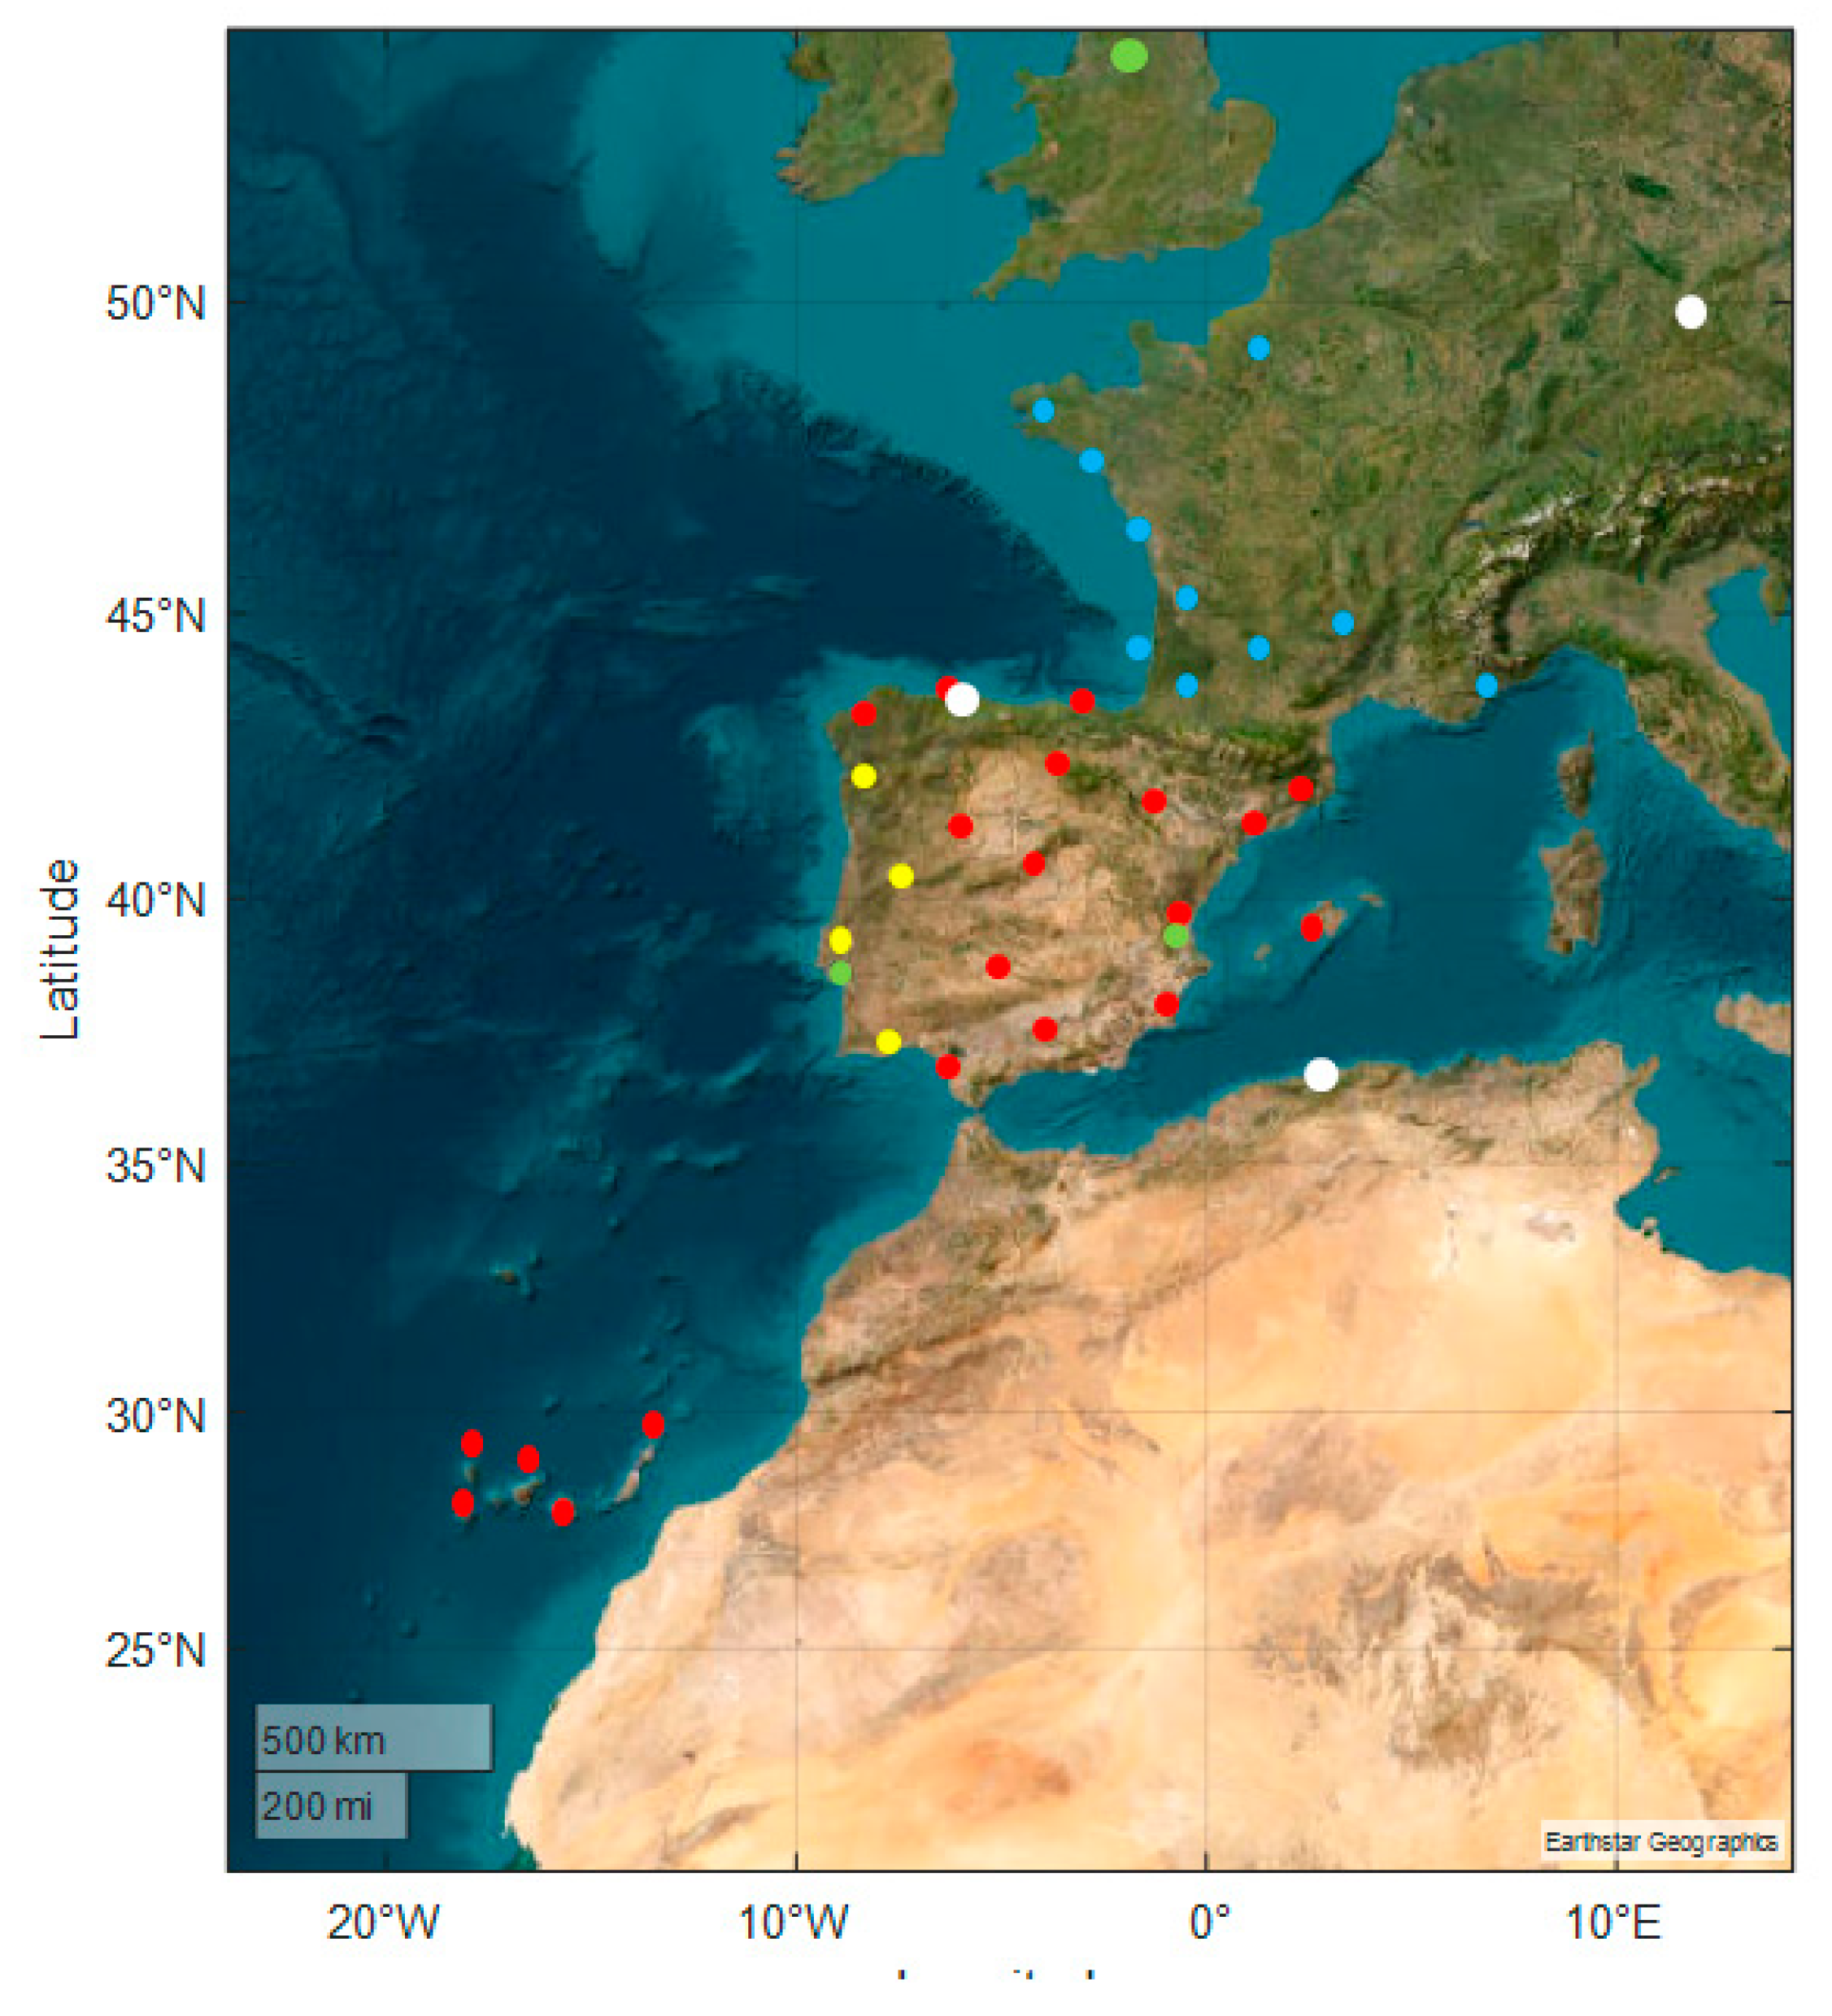
AEMET's lightning detection network is made up of twenty electric discharge detectors (IMPACT ES /ESP and LS7000/7001 of the company VAISALA) (Orville & Huffines, 1999; Cummins et al., 1998, Pérez-Puebla, 2004), (AME 2012) distributed throughout the peninsular territory (14) the Balearic (1) and Canary (5) archipelagos. These detectors capture, analyze and discriminate the electromagnetic radiation generated in atmospheric electrical discharges occurring within their range, between 50 and 1000 km. Through collaboration agreements, information is also received from four sensors belonging to the network of the Portuguese meteorological service (IPMA); and from ten sensors of the French meteorological service (Météo-France). The map with these sensors is in
Figure 1, where is also shown the position of WWLLN sensors in 2012, and 2023. These data are integrated into the system and allow optimal coverage of the entire Iberian Peninsula and the surrounding seas. Among the current technological innovation projects carried out by AEMET some of the detectors are being replaced by others with superior technology (Nuñez Mora et al. 2019).
The CG lightning detection probability of this type of network ranges between 85% and 95%. In terms of localization accuracy, ranges from 100-200 m to 1 km. Likewise, the median of the peak intensity (maximum value of recorded electrical intensity) has an accuracy error of about 15-20 % and the accuracy in determining the polarity (sign of the electrical discharge) is 100 %.
The combination of data provides AEMET with a detection efficiency of more than 90% for lightning strokes >5KA (Rodrigues et al, 2010, Santos et al, 2013), with accuracy <<0.5 km. The networks detect and keep track of lightning stroke events providing the time and geo location, also information from originating current. The raw data files were obtained in ASCII format where each lightning stroke was registered giving the above information. These files were available in the web page of AEMET until the end of year 2012. Our data was obtained from the AEMET web page at that time for Spain area.
The cooperation between AEMET, IPMA and Météo-France was directed to the detection of CG lightning. The IC lightning were registered, however at post-processing were discarded taking in account its calculated current. Some IC lightning could not be filtered out (because of its strong current) as it happens in NLDN and CLDN networks (Abarca et al., 2010; Fleenor et al., 2009), thus, a reduced percentage of IC which is not known, is included in the files. There are roughly 5 to 10 times as many flashes that remain in the cloud (IC) as there are lightning strokes which travel to the ground (CG) (Nuñez Mora et al. 2019). IC flashes do not strike the ground, the objective of regional and national networks is the detection and tracking of CG strokes. CG lightning strokes are those that pose a danger to people and cause death and other economic damage, such as forest fires or other disasters. For instance, in the period 1941-1981, there were 1981 deaths caused by lightning in Spain, (Nuñez Mora et al. 2019). Also is important in areas such as those of energy and telecommunications network management. In the current year 2023 the risk of forest fires is extremely high, due to the long period of drought affecting the Iberian Peninsula, which now puts practically the whole country at high risk (
https://www.aemet.es/es/eltiempo/prediccion/incendios).
There is no current threshold to differentiate CG from IC. The classification between IC or CG is assigned depending on the rate of change of electromagnetic field (Rakov & Uman, 2003), this is obtained in the time domain measurement of the signal arrived from the lightning stroke. The misclassification IC-CG was first addressed in the 1994/1995 of the U.S. NLDN (Cummings et al. 1998; Wacker and Orville 1999; Jerauld et al. 2005; Orville et al. 2002; Cummings et al. 2006; Biagi et al. 2007). Low current ICs are erroneously classified as CGs. In 1998 it was proposed that positive CG strokes with peak currents less than 10kA are discarded, or reclassified as intracloud IC, (Grant et al. 2012).
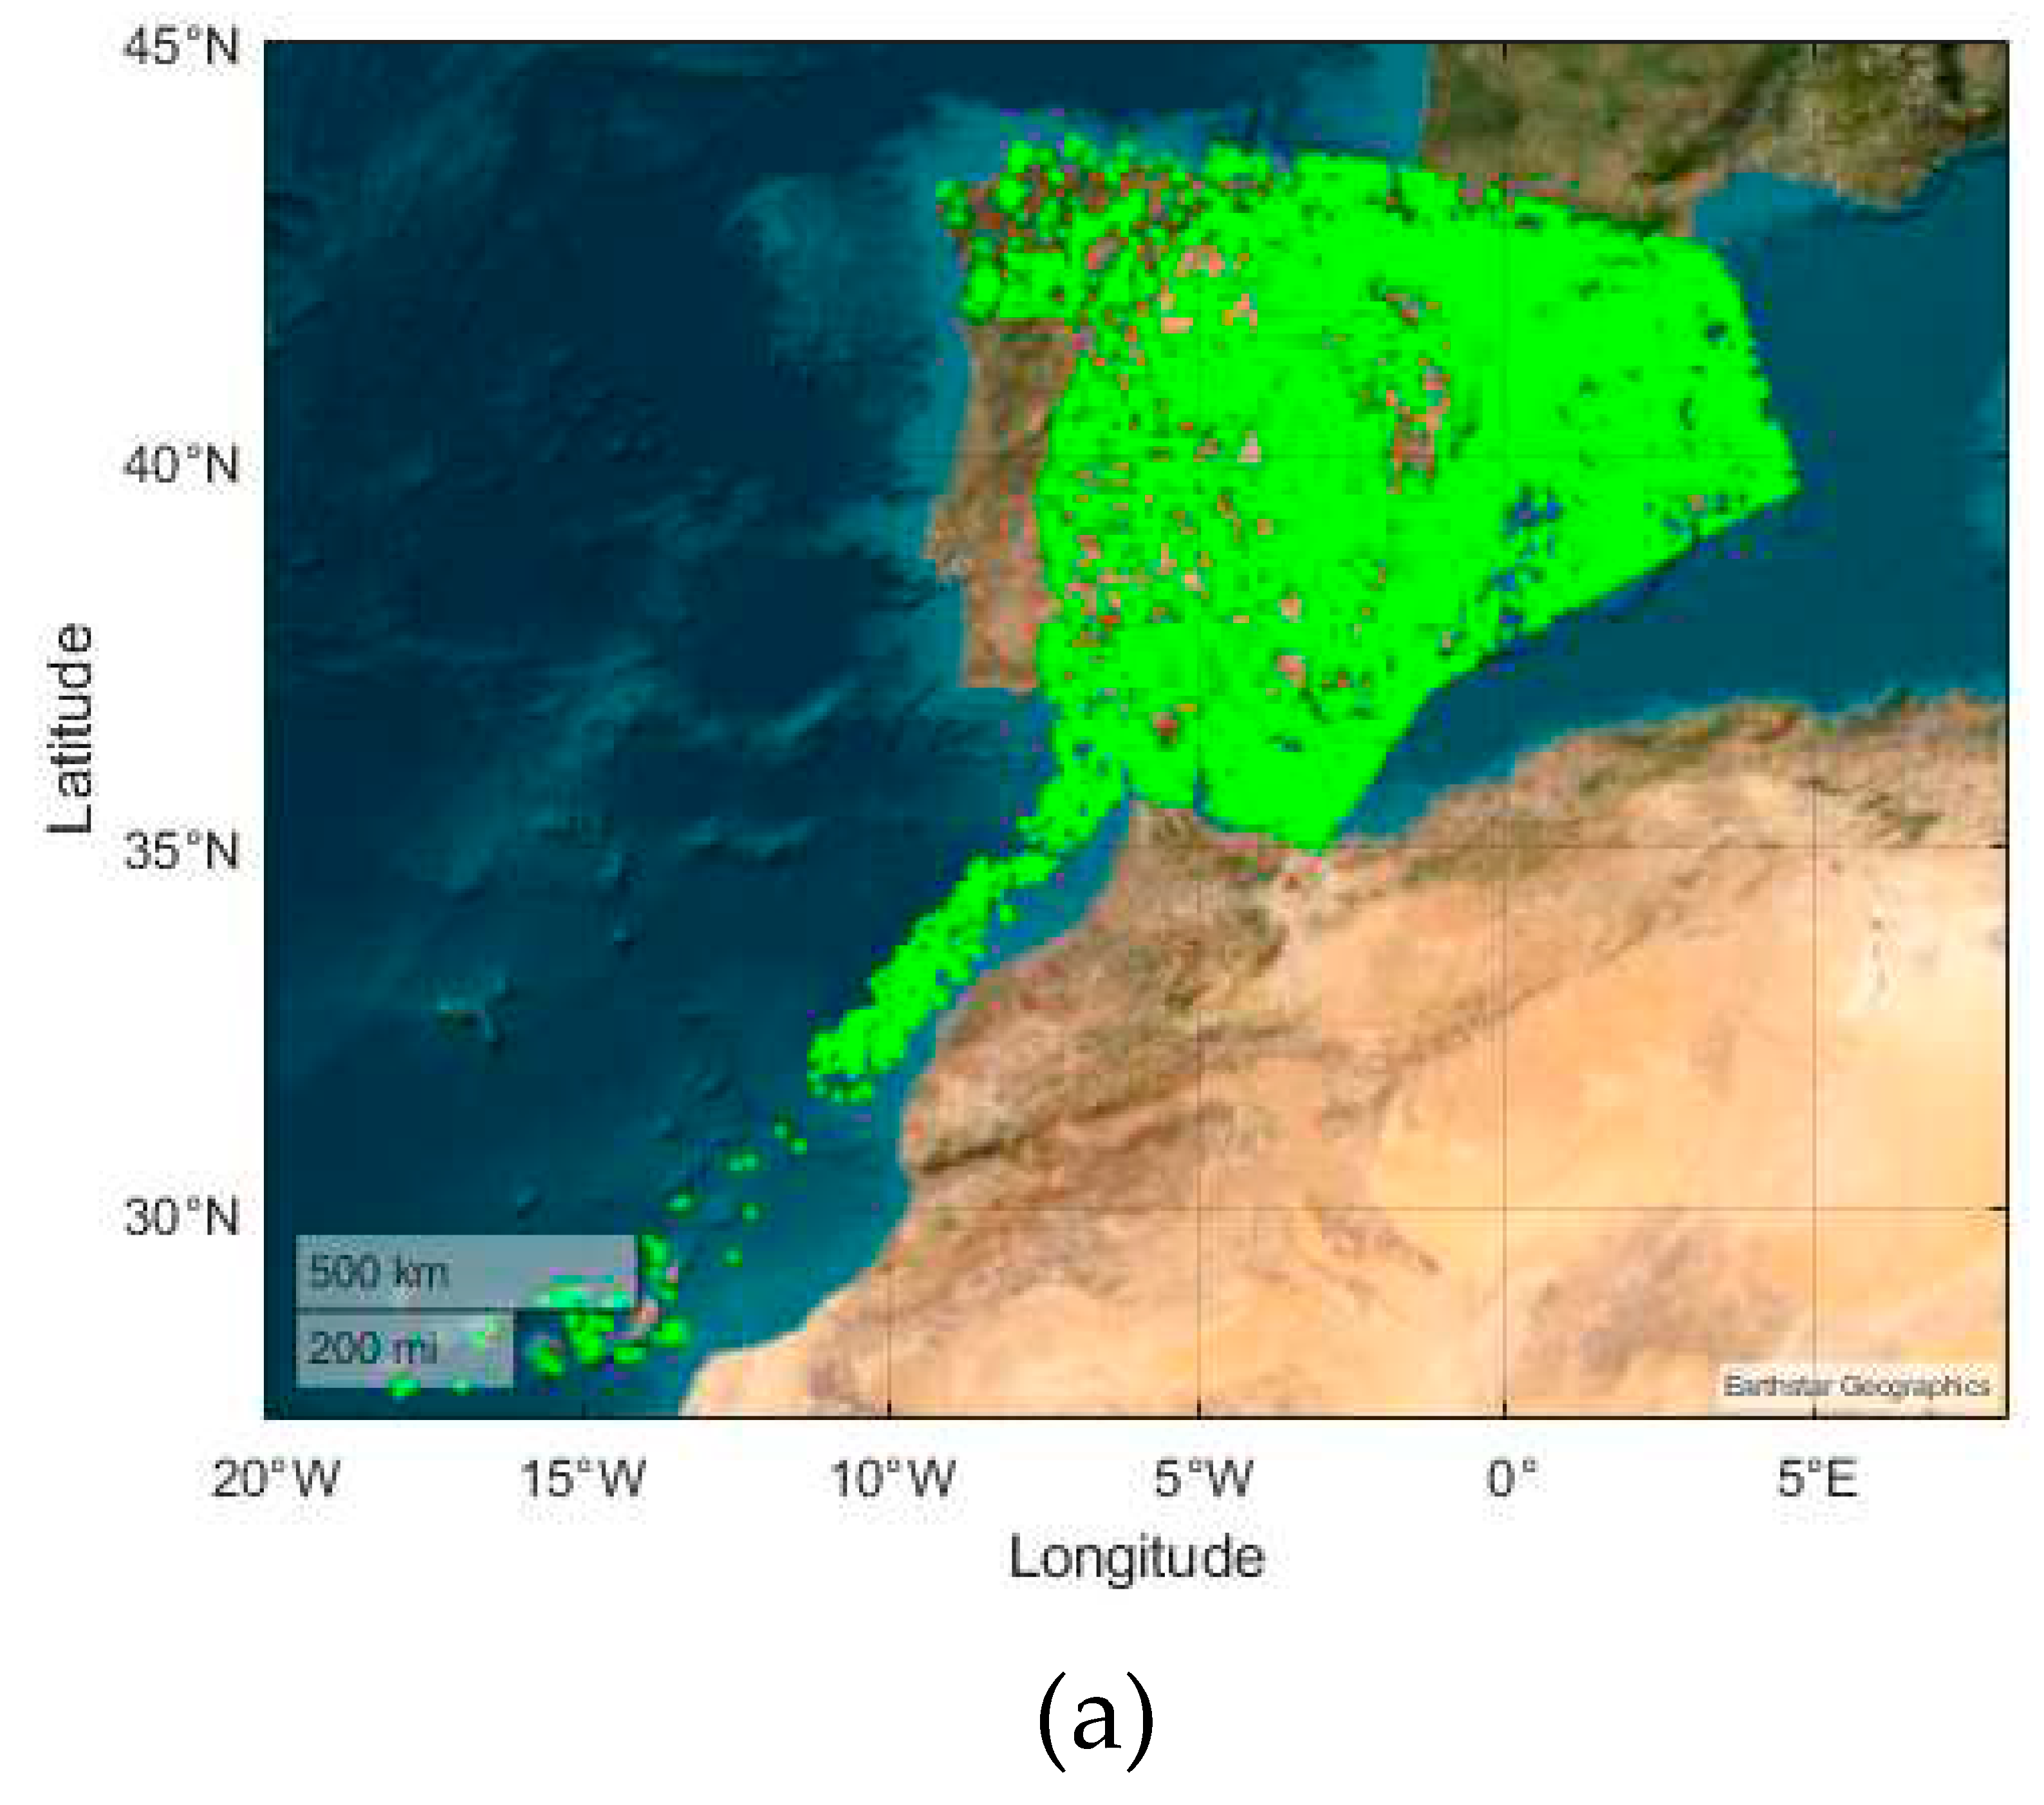
The data that was openly available at that time provided the time of the events with 1s time resolution. Information about the current was also given for the first stroke. The procedure used for the location of lightning was a combination of time delay of arrival, and direction finding. In the filtering AEMET just saves the lightning strokes located in Spanish land, and Islands. The lightning strokes stored by the AEMET network during the period January 1, 2120 - April 30, 2012 are shown in
Figure 2 as green dots on the terrestrial map in the area of Latitude [32N,45N] longitude [20W, 5E] , in which the spatial filtering for Spain is clearly visible.
2. Performance of WWLLN in IBERIA
There are previous works in analyzing WWLLN performance in other areas of the world, shown in
Table 1. In (Rodger et al. 2006) was found a decreasing DE of WWLLN in the daytime, the DE decreased gradually with distance beyond 8,000 km, the DE being negligible after 14,000 km. The DE was good between 10,000 and 12,000 km at night time. It was found a DE worsening when lightning distances to sensors were lower than 500 km, in these cases there was not possible to obtain good values for TOGA, because the propagating TE-TM EIWG modes that WWLLN detects are mainly in the frequency band
c/2h and
c/h, and these electromagnetic propagating modes need some wavelengths distance to properly couple to the EIWG, this minimal distance is half the wavelength at the cutoff frequency or in terms of the ionosphere altitude ~ 2h, this gives a minimum distance to the sensors >6h, of more than 600 km, and the TOGAs calculated from very near strokes to the sensors have large errors.
At the time period under study, sixty-nine WWLLN stations were in operation in the world, and there were two active receivers in Iberia, in 2012, and three later on as shown in
Figure 2. There are several papers comparing WWLLN DE and LA with other lightning location technologies, these are summarized in
Table 1. In these, the WWLLN results are contrasted with those of other terrestrial networks and, to a lesser extent with satellite detection systems. The information coming from satellite is not global and at any instant, since the systems orbit over a certain area of the Earth at each instant, in these cases there is no information of the whole Earth at all times. In addition they mostly detect Intra Cloud (IC) flashes with photodiode detectors embedded in the satellite, (Suszcynsky et al., 2000), while the WWLLN mainly detects CG lightning. The detection efficiency (DE) of the WWLLN roses markedly with increasing stroke peak current in previous studies for positive and negative CG lightning (Fan et al. 2018), see
Figure 5 in (Rodger et al. 2006).
Table 1 presents a summary of previous studies of WWLLN performance by comparing with other networks. In short, previous results show a very low DE of the WWLLN, which are in the order of the one percent of the total detected lightning stroke, this is a shortcoming of WWLLN. Large differences are found in DE and LA estimations. The DE was assessed at 0.3% in March 2003 in Brazil (Lay et al., 2004), while the assessment conducted in Florida between April and September 2004 was about 4% for currents larger than 50 kA in absolute value (Jacobson et al., 2006). The best data recorded by WWLLN so far was a DE≈13% in Australia (Rodger et al., 2005). The discrepancies in the results may be due to changes in the WWLLN sensors, for example, the network has increased the number of sensors over the years. There were 11 in the first evaluation in 2003, 20 in 2004. Also, differences are related to increasingly sophisticate processing techniques (Rodger et al., 2004, 2005, 2009). Moreover, the WWLLN has changed the distribution of active receiving sensors in different areas of the World. Other explanations for the discrepancies may be due to the assumed “ground truth” of the different networks used to compare with WWLLN, (Abarca et al. 2010), which have a DE, which is assumed to be between 80%-90%, (Lay et al., 2004), (Brundell et al., 2002), (Rodger et al., 2006). The technology deployed is focused in the detection of CG, with exception of Los Alamos Sferic Array (Jacobson et al., 2006), which DE is similar for both CG and IC strokes. These regional and national networks are directed to the detection of CG strokes and make very coarse estimations of IC strokes. In (Rodger et al. 2004, 2005) in a regional scale was estimated 3.5 times more IC strokes than CG ones (Mackerras et al. 1998), (Soriano & de Pablo, 2007) and the WWLLN ratio of the detected CG/IC events was estimated roughly 2:1 (Hutchins et al, 2012b).
Table 1 shows the size of the areas used to evaluate WWLLN. The largest assessment area was ∼15° × 15° in Brazil (Lay et al, 2004) and New Zealand (Rodger et al. 2006). The assessment area is regional or national, while WWLLN operates and provides data on a planetary scale. The global scale assessment could be carried out by using a combination of regional networks or by satellite monitoring, but as said above, these technologies have other drawbacks and constraints (Lay et al. 2007). Regional or national networks do a temporal monitoring but do not cover the whole planet, on the other hand, satellite on-board systems cover the whole planet, but not at any instant at a high resolution, that is the advantage of WWLLN, despite its limitations. The WWLLN data can be used efficiently by knowing its performance and limitations. The WWLLN increased the number of sensors and improved the detection algorithm, (Rodger et al., 2006), (Rodger et al., 2004), (Lay et al. 2004), and is an extremely useful tool for thunderstorm tracking in combination with other techniques (Du et al. 2022).
Previous research has been carried out at different periods of time with different WWLLN stations. The more number of sensors, more density is the WWLLN, and more stations receive the signal from each lightning stroke. At least five WWLLN stations are required to determine the time of group arrival (TOGA) for each lightning stroke location (
https://wwlln.net/). Therefore, the more measuring sensors that receive the signal, and more than five, the greater the accuracy in locating lightning discharges, similarly as it happens with the satellite Global Positioning System. The sensitivity of sensors to different stroke energies can vary, and that the number of strokes that may be missed can be estimated based on the sensitivity of the sensors and the distance between lightning stroke and sensors, this influence the attenuation, or the environment around the sensor, which can limits its sensitivity. However, these factors do not directly affect the minimum number of five sensors required to locate and store a stroke in WWLLN. If less than five sensors do not detect the stroke this is not stored for further processing.
WWLLN is capable of detecting lightning strokes with varying peak currents. However, the minimum detectable energy is dependent on the specific location and relative distance stroke-sensor, because of attenuation, as is explained in the paragraph above. Therefore, there may not be a single minimum current threshold that applies globally to all lightning strokes detection. WWLLN sensors detect kHz signals, and these are produced mainly when TE-TM-TEM propagating modes are excited in the EIWG, mainly when strong lightning strokes with high currents are produced. WWLLN DE is very high for lightning current amplitudes higher than 30 kA; providing a spatial accuracy of around 15 km, good enough to resolve convective-storm cells within a larger storm complex (Jacobson et al. 2006).
Table 1 is interesting because it compiles all previous research in the study of WWLLN DE and spatial accuracy. From
Table 1 is seen that WWLLN LA remains similar from its beginning, and DE has improved because of a more dense network and larger coverage of the Earth. IC and CG discharges with comparable DE, are detected and recorded by WWLLN as long as they have a high current (>30 kA), both positive and negative polarity; however most regional networks are focused in detection of CG discharges.
Fan et al. (2018), compares with two sets of data, data from national terrestrial sensors, and satellite data. In doing the comparison with the terrestrial network the coincidences are established for a time difference of 0.5s and a distance of 50km, however the comparison with satellite data is not filtered for a distance of 50km and provides better accuracy in distance. The DE of Fang is low, but also the DE of other research, comparing with our results. We may have better results because in a 2000 km x 2000 km square covering the Iberian Peninsula we had five WWLLN stations, the three stations shown in green color in the map of
Figure 1, and not show in the map are: Madeira (Portugal), Tihany (Hungary) and Tel Aviv University (this last one at ~ 4000Km). Normally WWLLN has been deployed trying to cover distances of 10,000 km, which is the maximum that kHz signals can propagate without significant attenuation. This situation ensures that lightning is detected at least by 5 sensors.
2.1. Estimation of Detection Efficiency of WWLLN using AEMET data
The WWLLN performance was analyze using data from this network (
http://www.wwlln.com) during the period from 1th January 2012 to 30th April 2012. The data was generated using the most recent technique (Rodger et al., 2009). We had open data from AEMET for this time period; for this reason, this time period was chosen. The objective was to compare the detection efficiency of WWLLN using the AEMET data as the true data (Abarca, 2010).
The time span of the lightning data is a period with low seasonal activity in Iberian Peninsula. The main storm activity in Iberia prior to 2012 was typically distributed in the period May-September, in which ~84% of the storm phenomena with lightning events were detected (Soriano et al. 2005). Although the period under study had a low activity in terms of lightning strokes, the AEMET data contains 20,651 lightning strokes covering the latitude interval 27.39°N- 43.83°N and longitude interval 18.01°W- 4.66°E. The area under study includes continental Spain, and islands. The 2012 AEMET data is a file with 20.651 lines, each line is a detected lightning stroke, having 9 rows with data: Month, day, hour, minute, second, discharges, peak current (kA), latitude, and longitude.
To analyze the WWLLN detection efficiency relative to the AEMET network, we look for time coincidences and location coincidences with a given deviation. Different criteria were used to define shared strokes events, to establish a coincidence, depending on the availability of data of the compared networks. The other networks assumed as a true data. Obviously the coincidence in time and location were used, with a given deviation or "tolerance" of the coincidence. Lay et al. (2004) and Rodger et al. (2005) used both a time deviation and a space deviation, 3 ms and 50 km to establish the coincidence. Jacobson et al. (2006) used a time gap within 1 ms and a maximum distance of 100 km each other, however Rodger et al. (2006) used only the time coincidence looking for events within 0.5 ms each other. When the data available has a high temporal resolution the time criterion is reasonably enough to characterize shared events, for instance, the time data of WWLLN is given in microseconds (Rodger et al., 2006), whereas the CLDN data is in nanoseconds (Abreu et al. 2010). The AEMET-available data for the present work provided the lightning data with 1 s time resolution. The coarse time resolution of the AEMET data forces the use of both criteria temporal coincidence and spatial coincidence, to ensure confidence in this analysis. The availability of both data makes its use very logical and therefore we consider the need to use both to define the coincidence of events and to establish a correspondence between them. As the AEMET data was given with a resolution of 1s, we established a maximum time difference of 0.5s between AEMET and WWLLN events to define the temporal coincidence. This large time tolerance is far from the range 3ms-0.5ms used by other researchers (Rodger et al. 2005, Jacobson et al. 2006, and Rodger et al. 2006), however is the same as in (Abarca et al. 2010) . Therefore, in this work, there is coincidence if the two criteria of temporal and spatial coincidence are met: A difference in time of 0.5 s between both events and a distance lower than 20 km. Lightning strokes considerably separated in space, more than 20 km, were not considered shared.
The area of the world under study was the area of Spain and small areas of Atantic Ocean and Mediterranean Sea inside the latitude interval 27.39°N- 43.83°N and longitude interval 18.01°W- 4.66°E. The limits of this rectangular area are defined by the maximum and minimum latitudes and longitudes of the AEMET available data shown in
Figure 2, where is seen how AEMET data is filtered for Spanish land. The WWLNN network collects global Earth data, and these are very large files, these files were geographically filtered to obtain data for this area of the Earth.
To complete this work, we analyze the performance of the network in the monitoring of three major regional storms on the Mediterranean coast, in 2020, 2021 and 2022. For the monitoring of these storms the WWLLN already had three sensors in the Iberian Peninsula, so it is of great interest for the WWLLN network itself to know how the results improve by increasing the spatial density of sensors.
3. Results
The AEMET covered area is shown in
Figure 2, where lightning strokes during the period January 1, 2012 - April 30, 2012 are located as green dots in the map. The area with the green dots of AEMET is not a rectangular region of latitude and longitude, and does not fit with the rectangular land, [27.39°N, 43.83°N] x [18.01°W, 4.66°E]. The limits of Portugal can be easily observed in
Figure 2. The data recorded by Aemet during the period January 1, 2012 to April 30, 2012 were 20,651 strokes in the green area of
Figure 2.
We look for the WWLLN lightning strokes that are coincident with AEMET data following the given criteria of time coincidence and spatial coincidence. Firstly, we filter the WWLLN data for the period January 1, 2120 to April 30, 2012, which is global Earth data, in doing so we obtain a file of 8.1 Gb. Later on we filter Latitude-Longitude rectangle, [27.39°N, 43.83°N] x [18.01°W, 4.66°E], from previous file. In this way we obtain a manageable file size of 2.7Mb with 54,079 lightning strokes. This last file was used for further processing in order to compare it with AEMET data, although it does not correspond to the same geographical area. Finally, this file was spatially filtered with the AEMET spatial filter providing a small file with 12,855 lightning strokes.
In a second step, we filter the WWLLN data to a smaller rectangular area inside the continental area of Spain, to make a more homogenous study, we restrict the work to an inner area of continental Spain, latitude [38°- 42°N]x longitude [6W°- 1°W], which is inside the plateau area of Iberian Peninsula.
To look for shared events WWLLN-AEMET, for each lightning stroke in the file of WWLLN data a correspondence was looked in the file of AEMET2012 data. In the first loop we look for temporal coincidence of each WWLLN event with AEMET events with a time deviation of 0.5 s. In the second loop the distance between the WWLLN and AEMET event is evaluated.
The criteria for saying that both events are coincident:
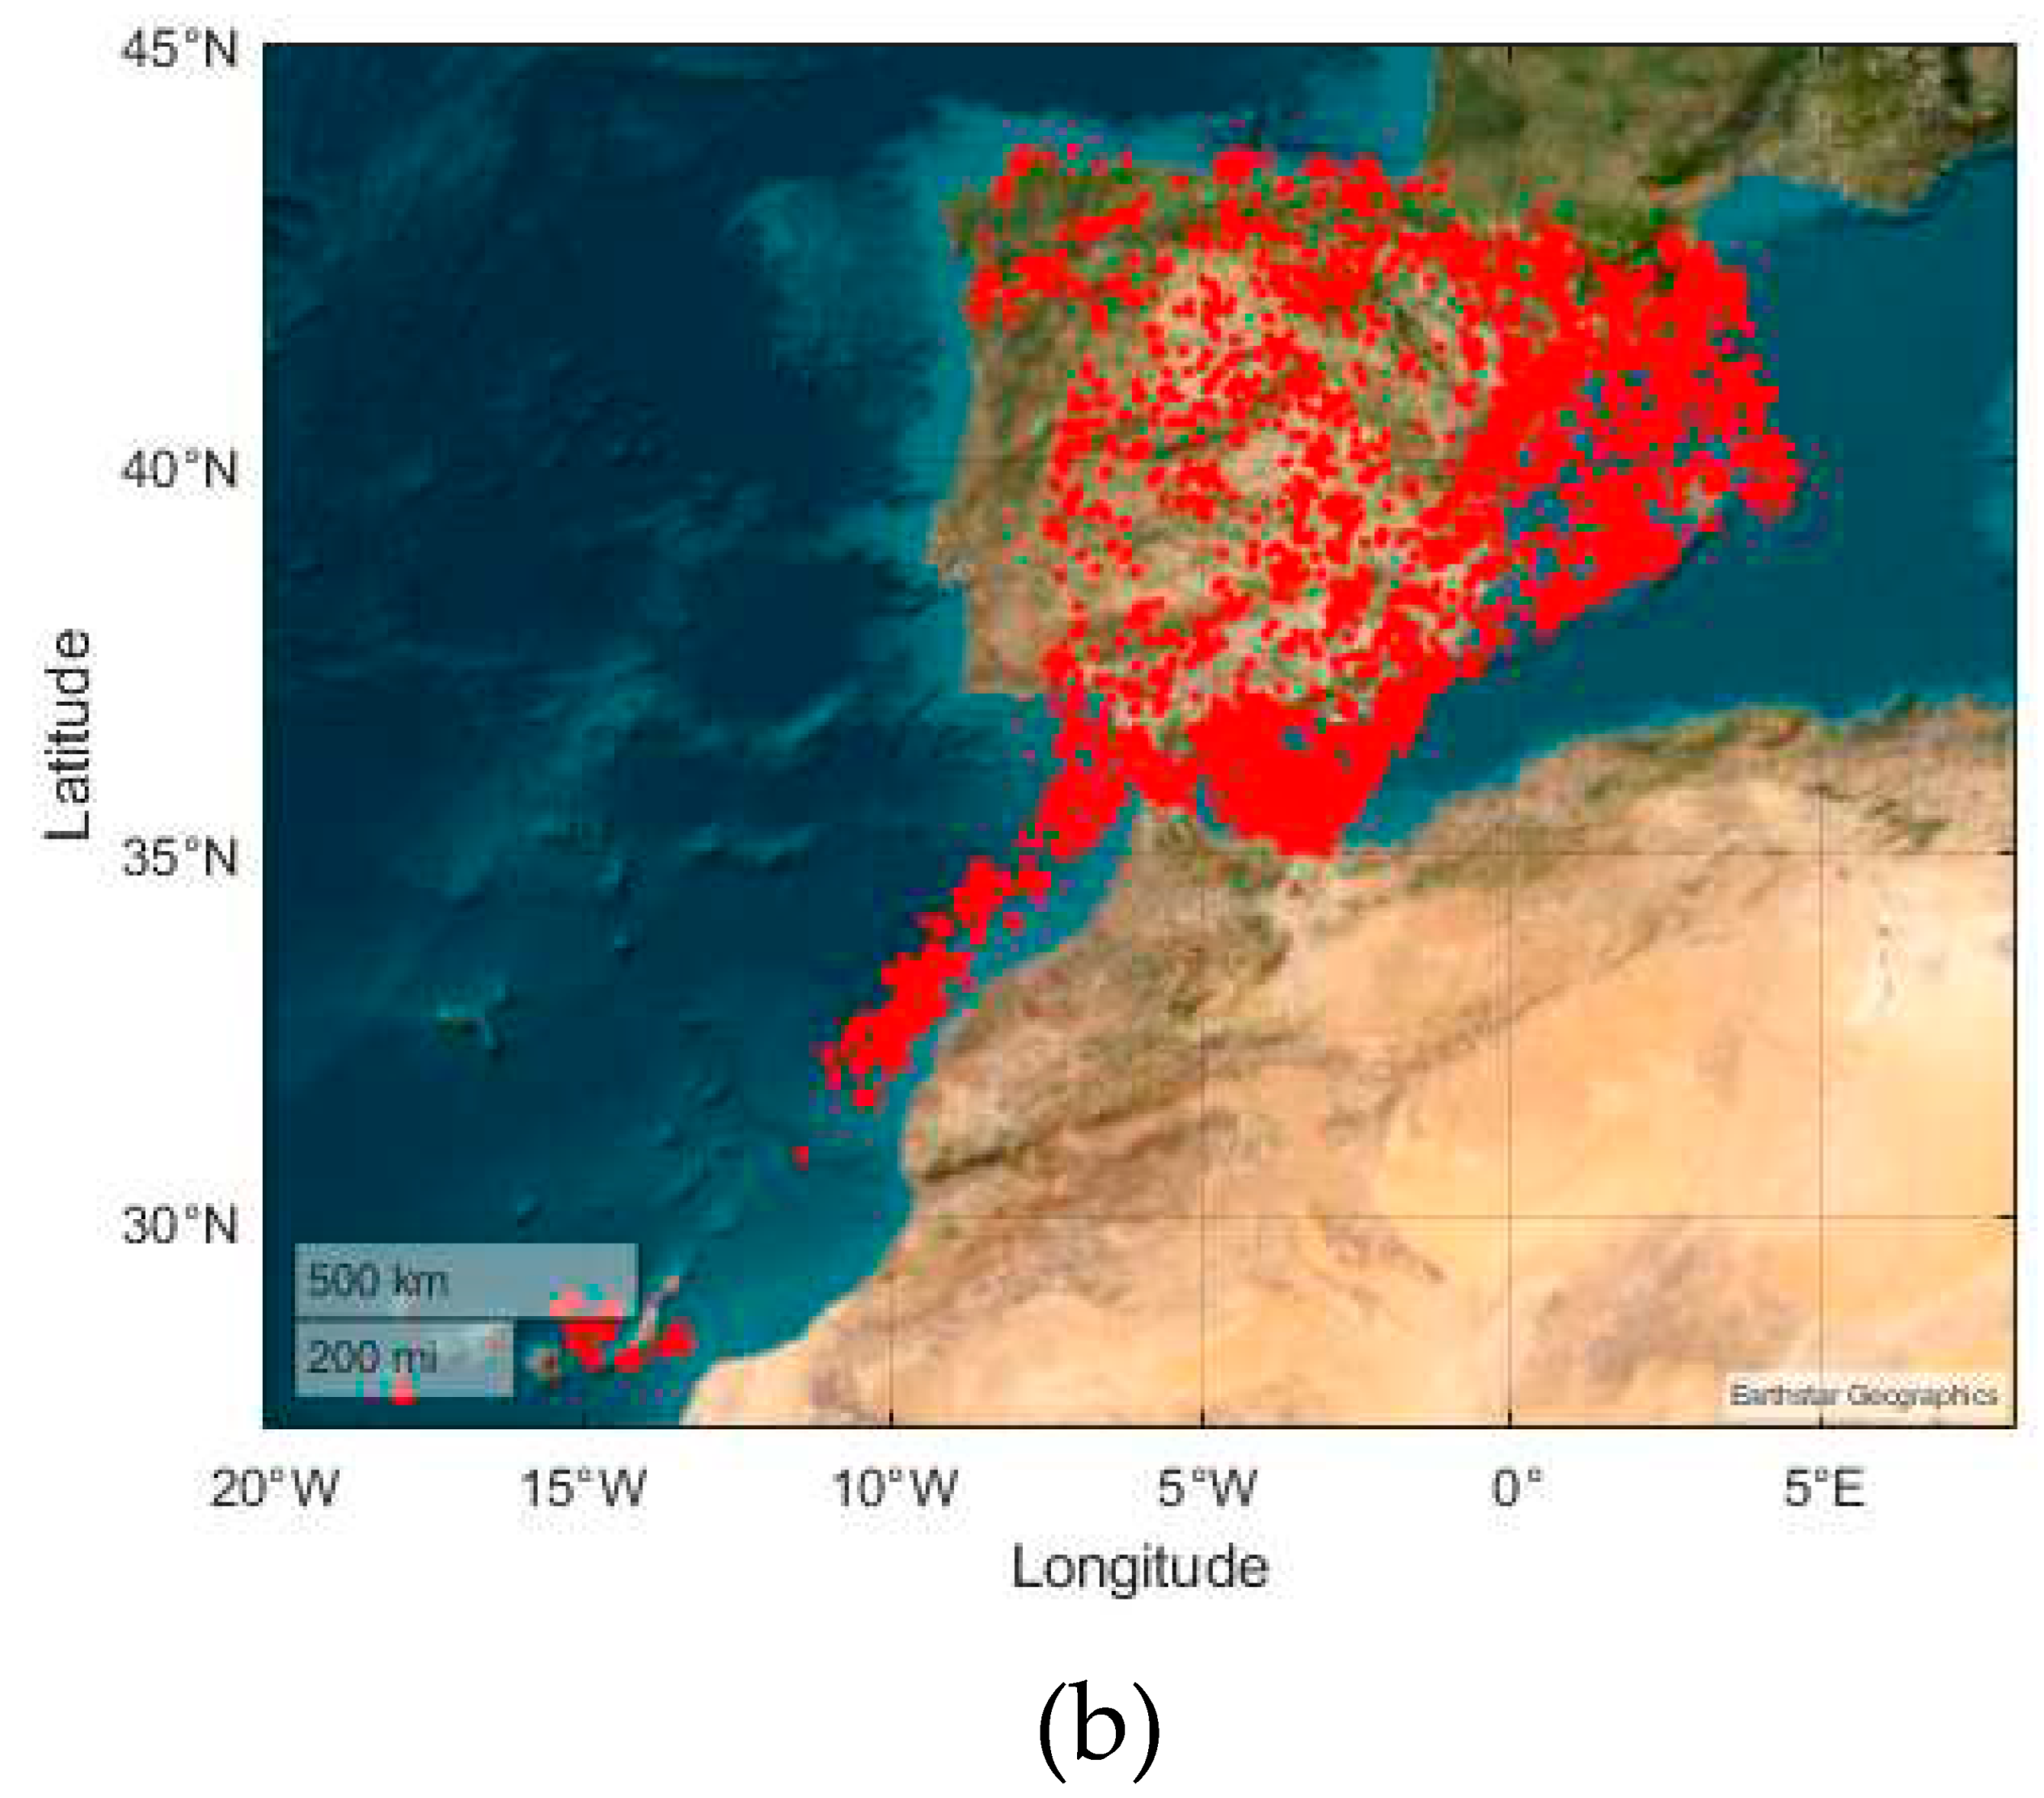
In doing this we obtain 7,843 coincidences with both 0.5s time difference and 20 km space difference, i.e. WWLLN network detects 38% of the 20,651 AEMET lightning strokes. These coincidences are plot in
Figure 2b, and are used for further analysis as it is the LA.
The 7,843 coincidences are 61% of the 12,855 lightning strokes of WWLLN filtered for the AEMET territory, and 38% of AEMET data has correspondence with WWLLN data. This gives a WWLLN DE relative to AEMET network (used as a ground truth) of 38%, i.e. assuming that AEMET data is the true data, and 61% of WWLLN detections could be considered true detections without any comparison frame.
Figure 2.
(a) Lightning strokes detected by the AEMET network during the period January 1, 2012 - April 30, 2012. (b) The shared events or coincidences between WWLLN and AEMET networks during the period January 1, 2012 - April 30, 2012.
Figure 2.
(a) Lightning strokes detected by the AEMET network during the period January 1, 2012 - April 30, 2012. (b) The shared events or coincidences between WWLLN and AEMET networks during the period January 1, 2012 - April 30, 2012.
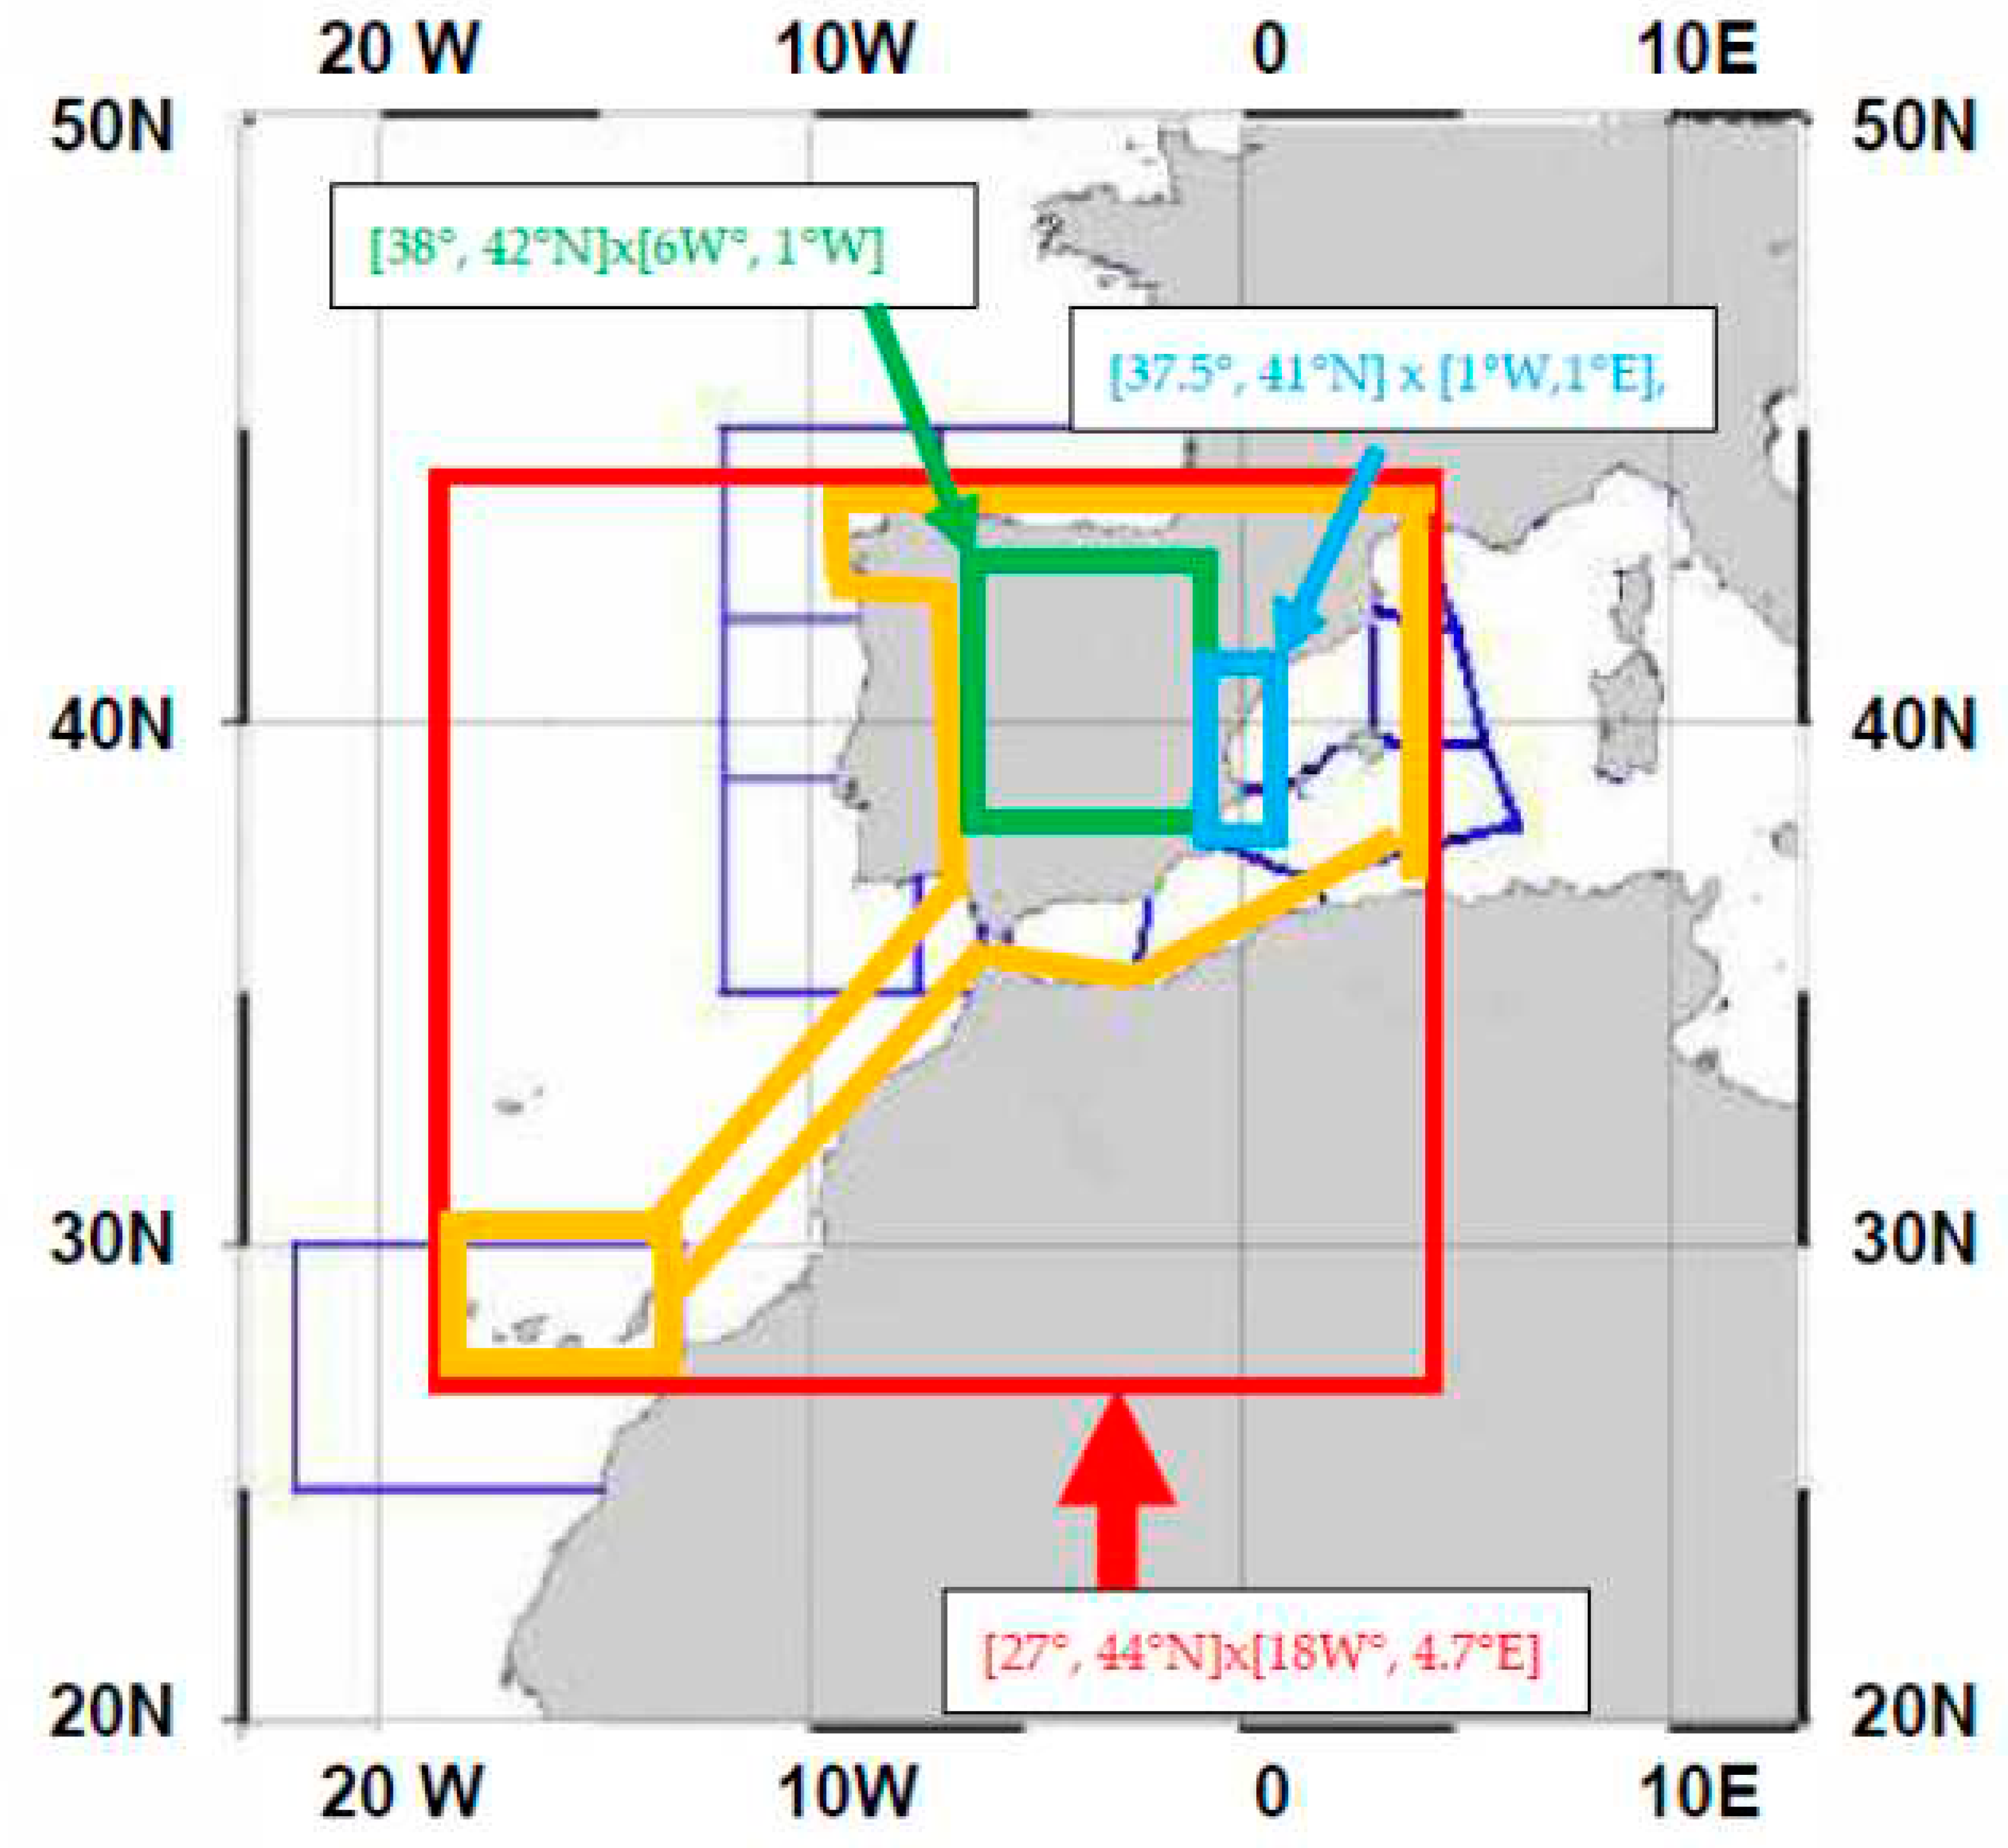
Figure 3.
Blue lines define the typical areas covered by the AEMET network. Yellow lines enclose AEMET data during the period January-April 2012. Red,green, and cian lines define the rectangular area of WWLLN data used in this work [27°, 44°N]x[18W°, 4.7°E], [38°, 42°N]x[6W°, 1°W] and [37.5°, 41°N] x [1°W,1°E].
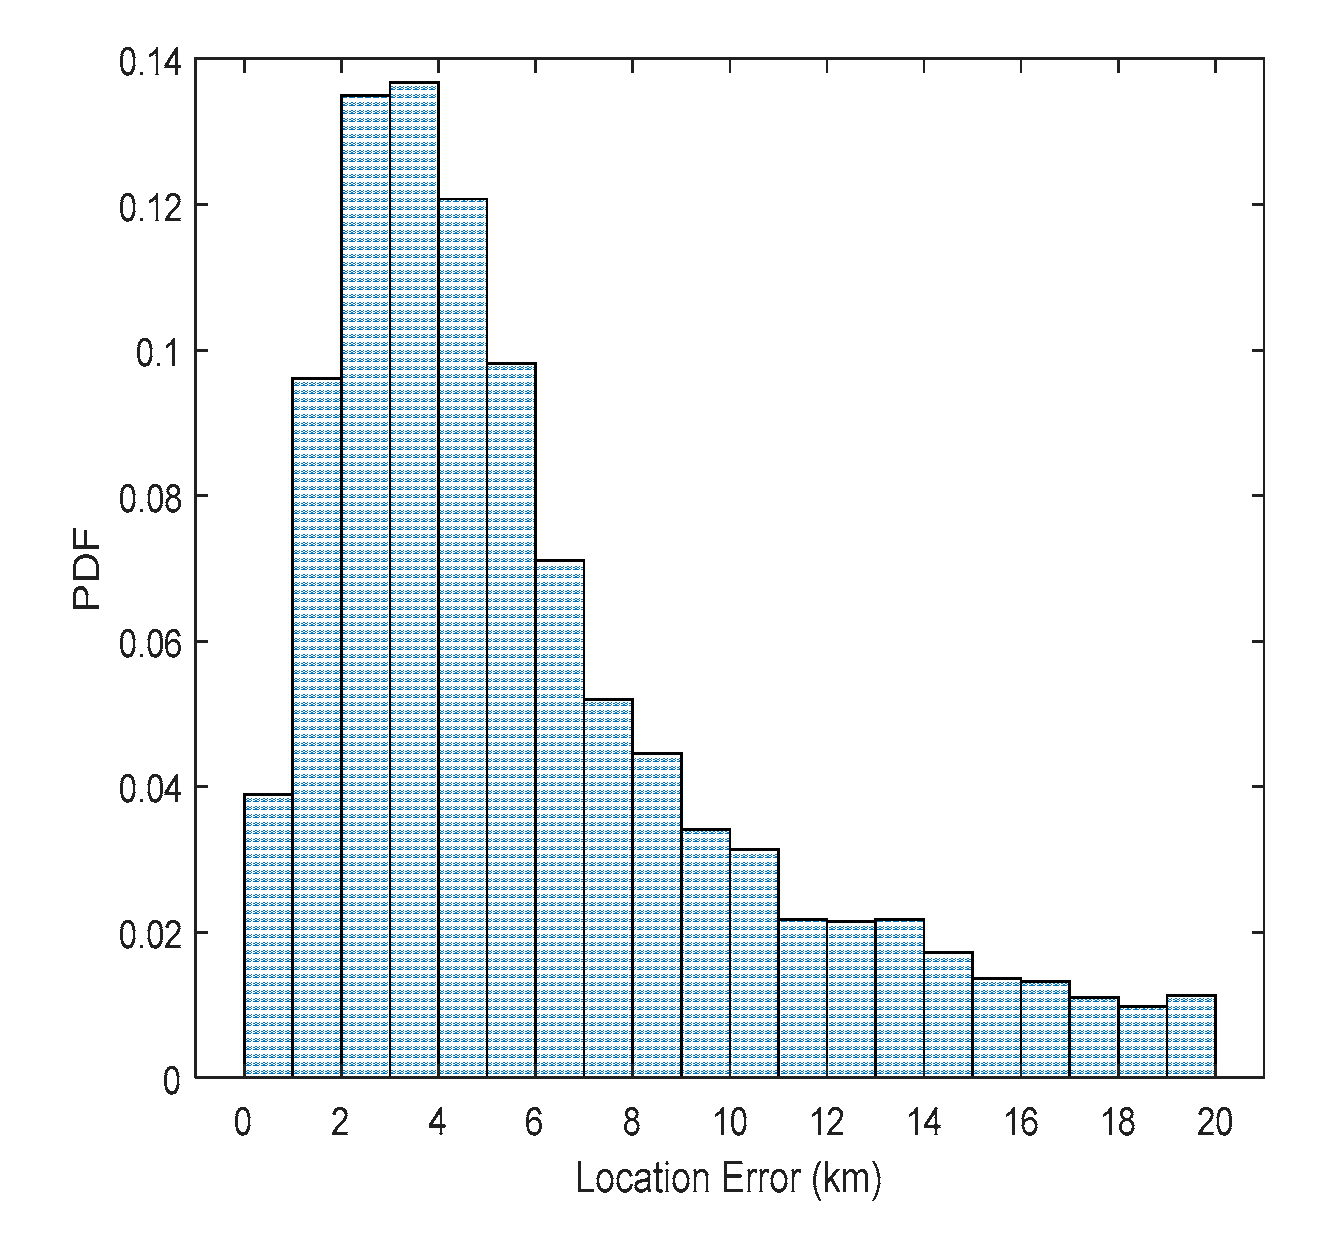
The distribution of the detected lightning strokes, according to above criteria, are presented in
Figure 4. It seems a clear Rayleigh distribution, a distribution typical for nonnegative-valued random variables. This distribution is often observed when the overall magnitude values are related to two independent components. This is our case, where the location error depends on two parameters, latitude and longitude. The detection error has a maximum probability at 3.5 km for the interval 0-20 km.
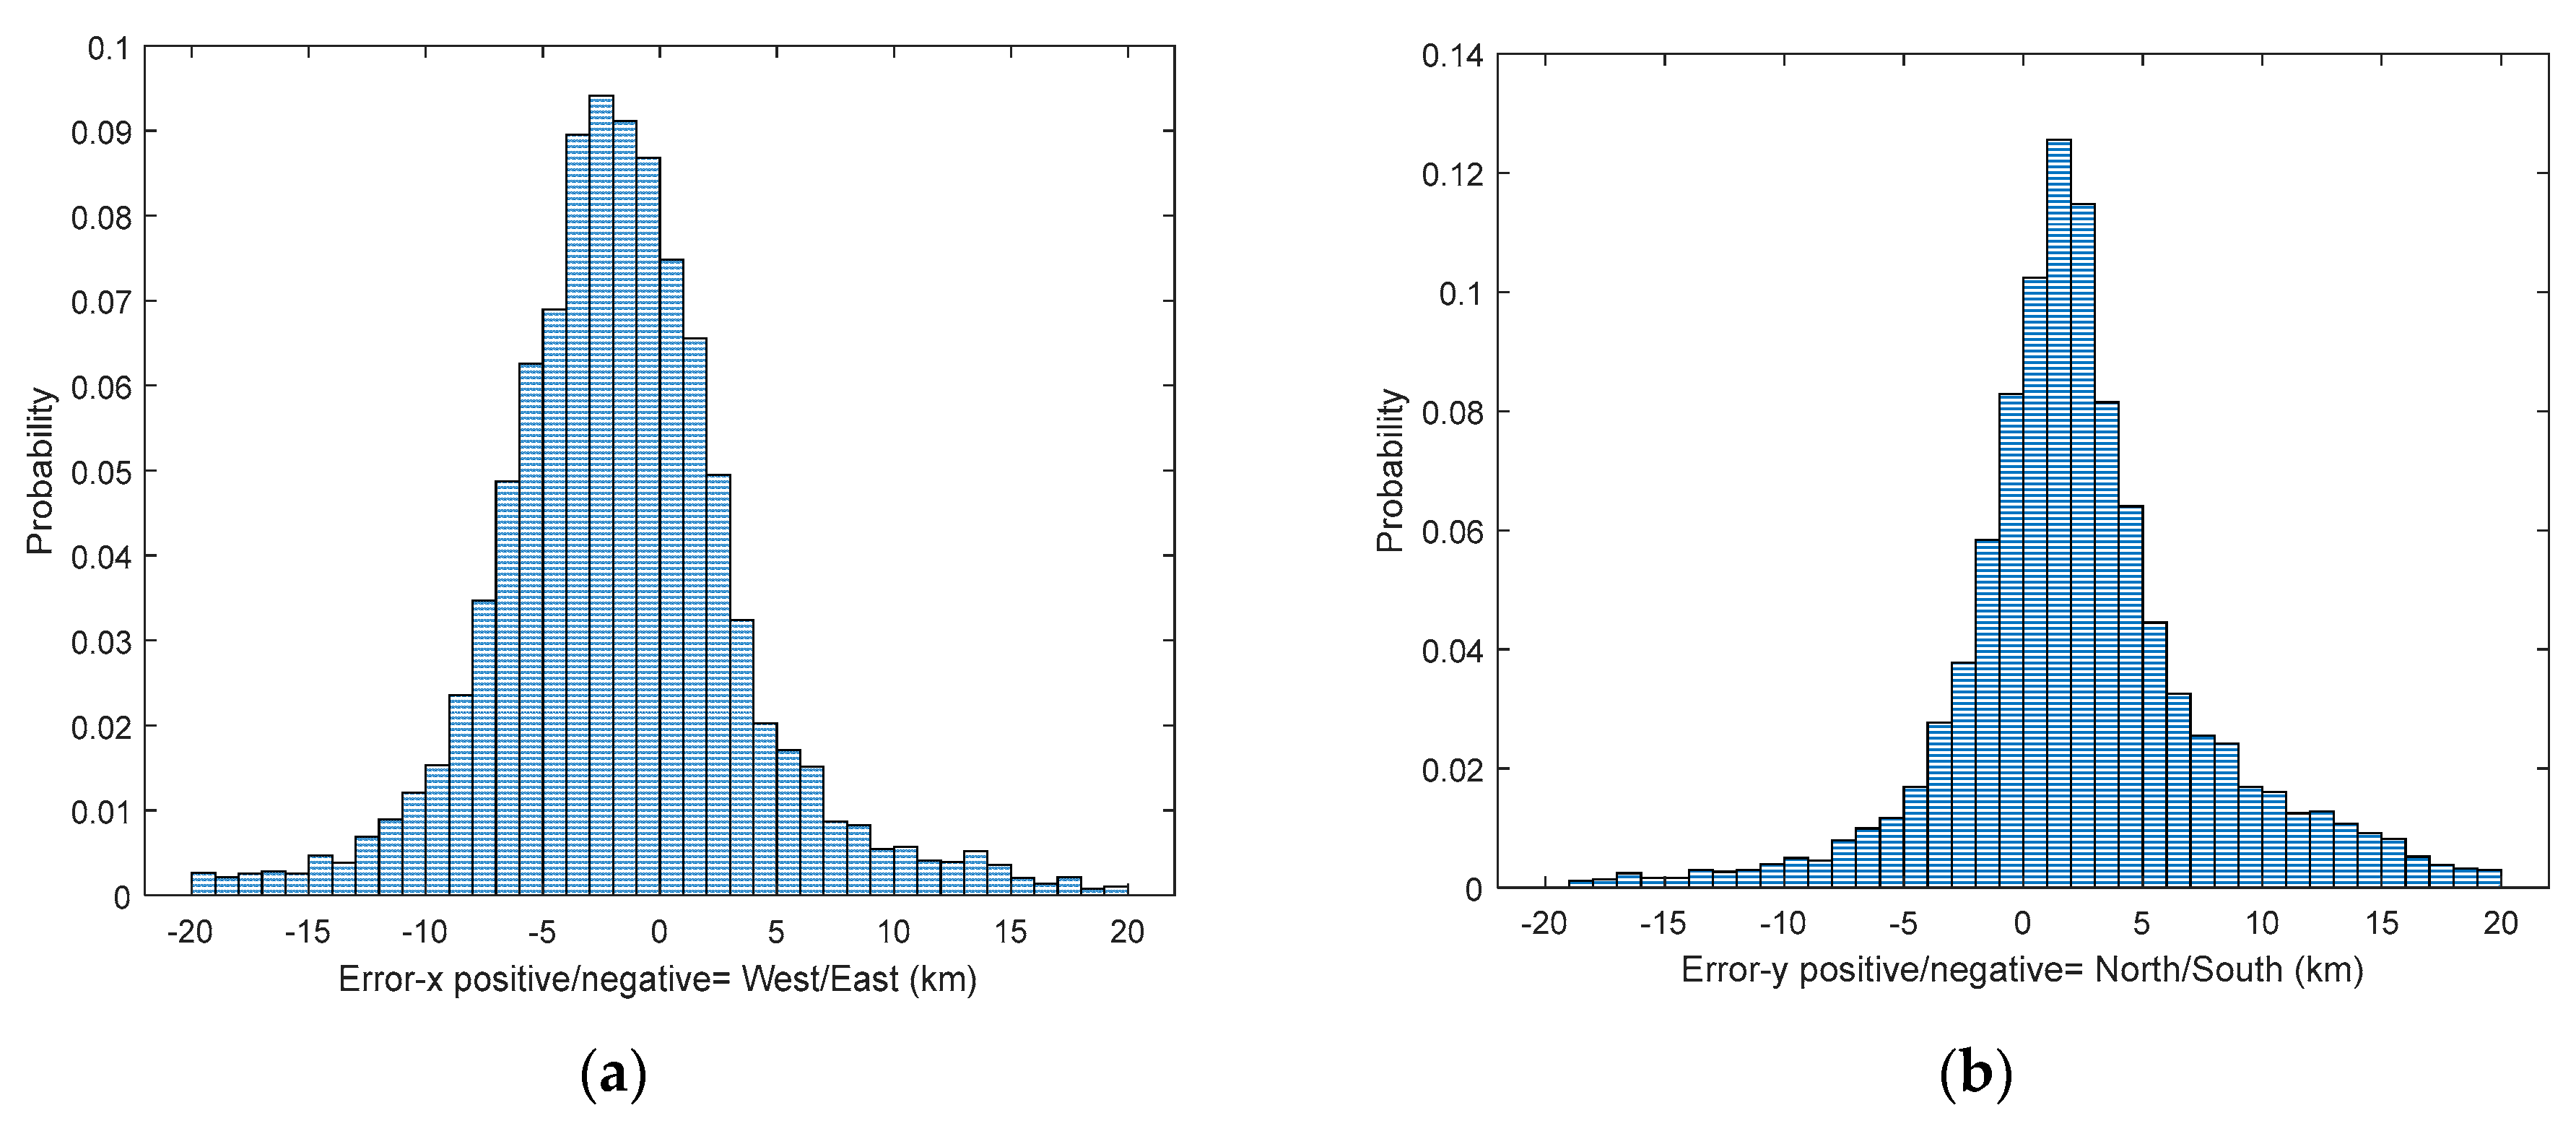
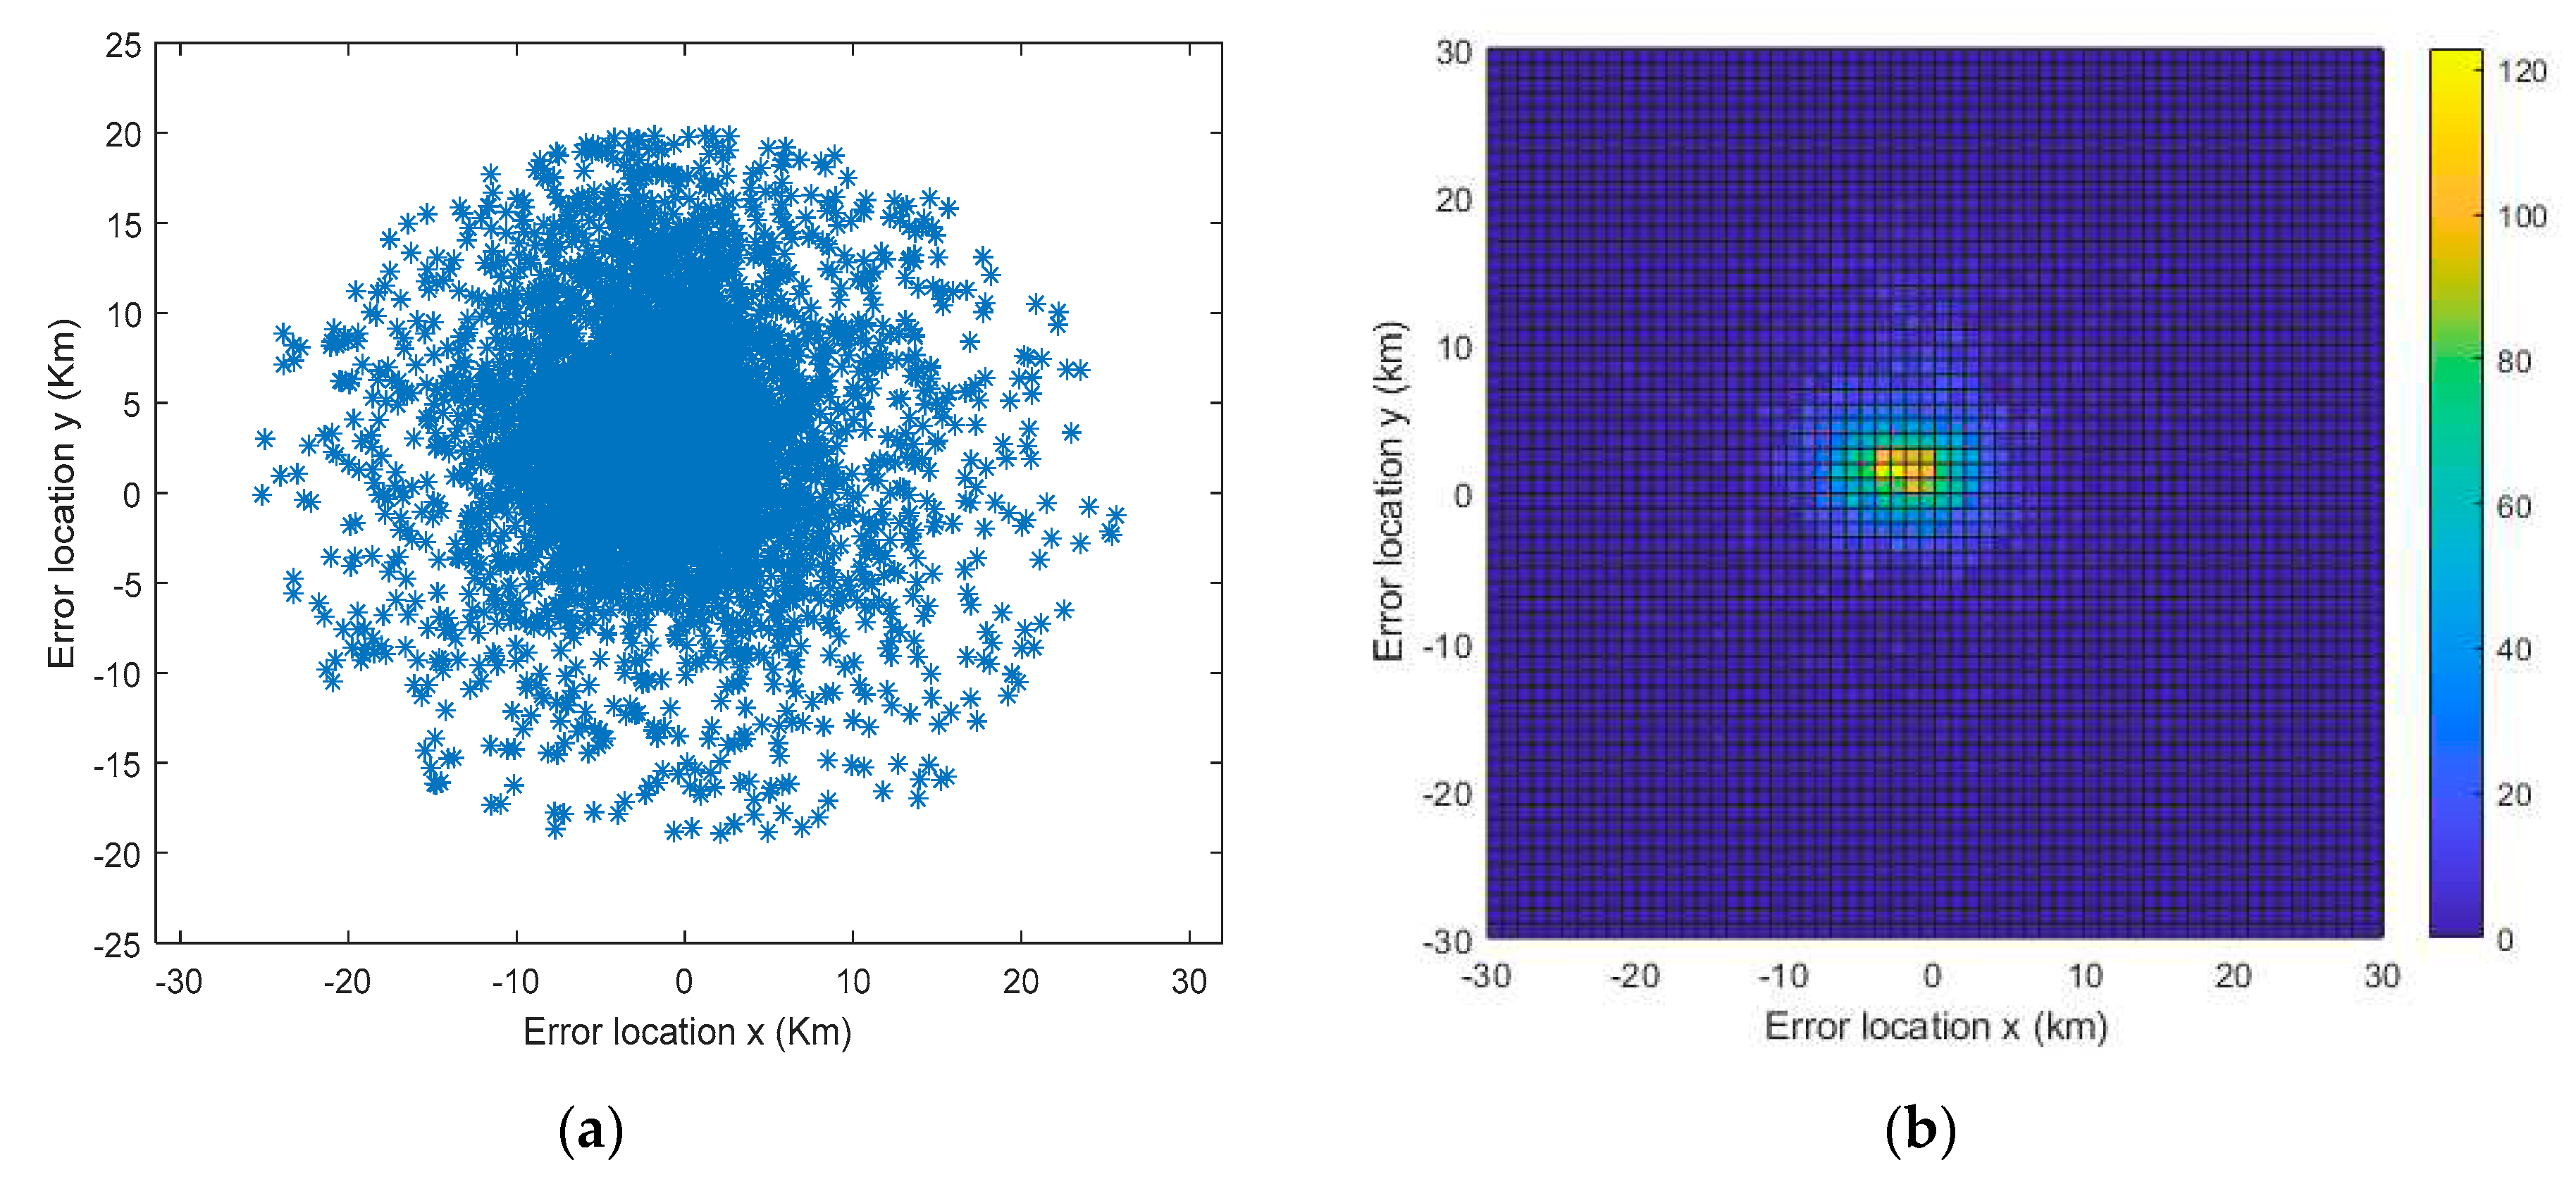
The distribution of locating errors along longitude (∆x) and latitude (∆y) are shown in
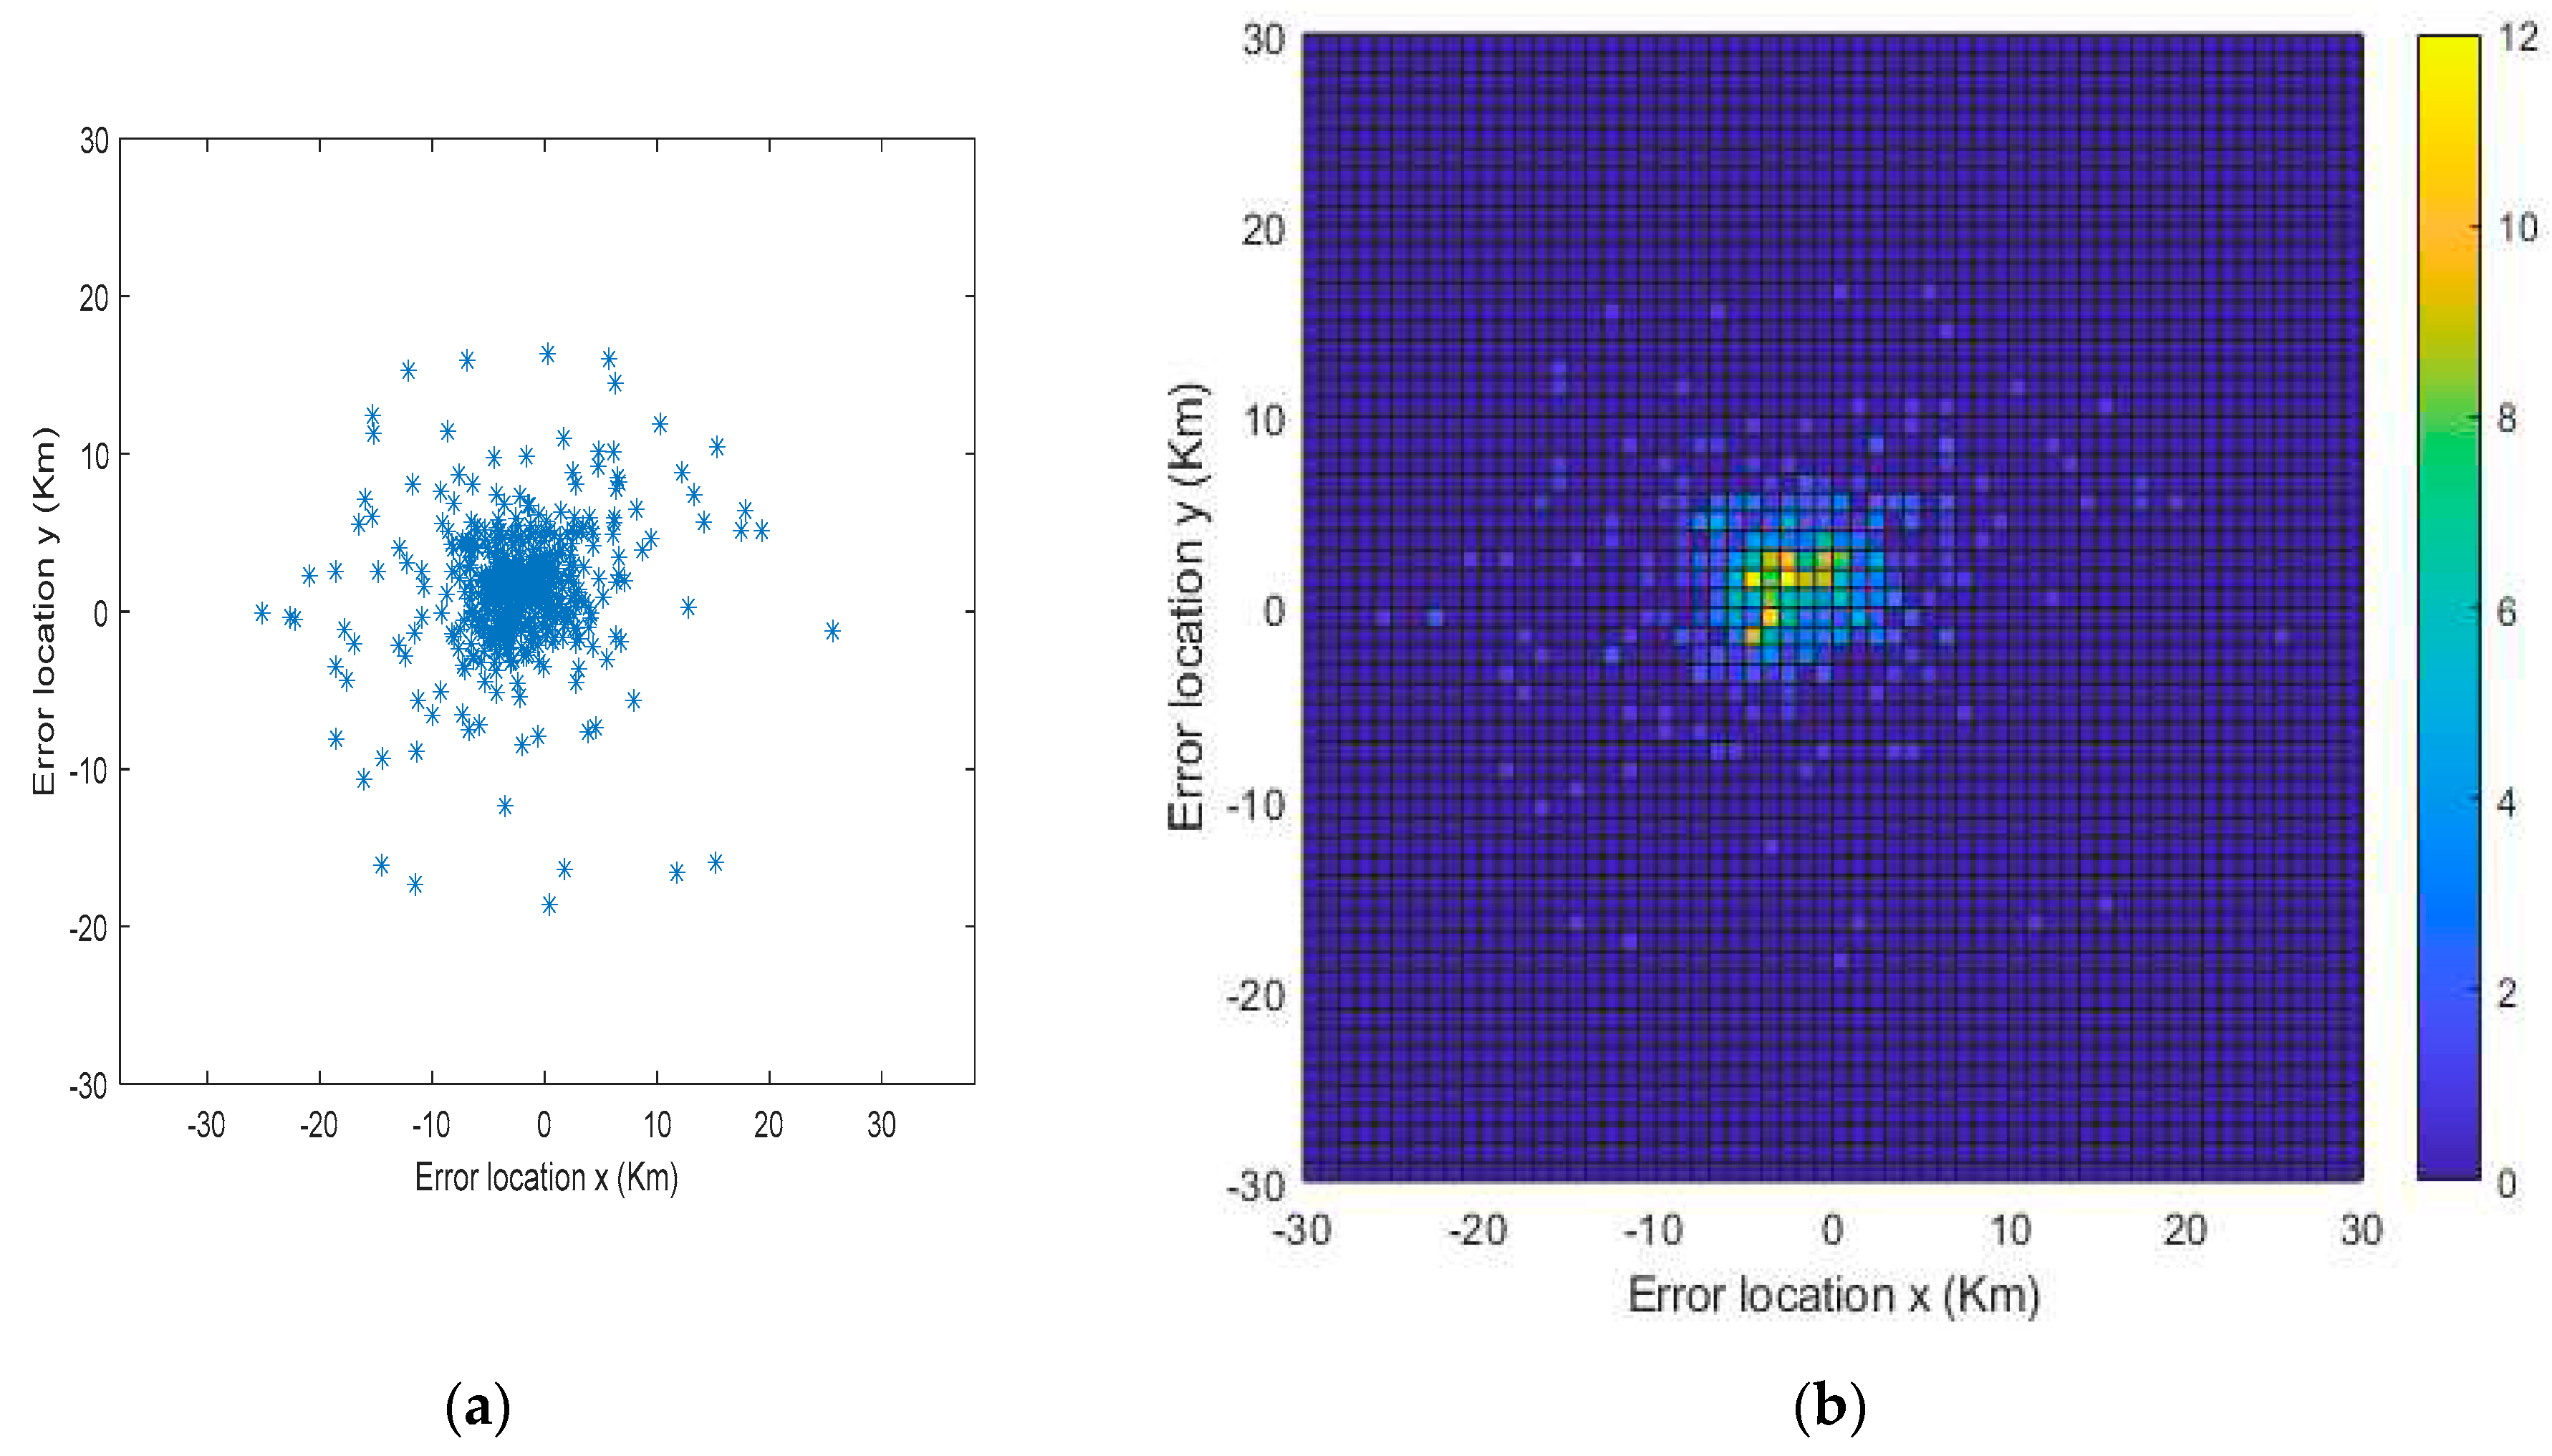
Figure 5a-b and as a scatter plot in
Figure 6, in which a slightly systematic error in the location is observed in northward and westward directions. The standard error is larger in the East-West direction as the Gaussian broadens in the East-West error.
Figure 5.
Location error along longitude and latitude. (a) Error in km along longitude.; (b) Error in km along latitude.
Figure 5.
Location error along longitude and latitude. (a) Error in km along longitude.; (b) Error in km along latitude.
From
Figure 5 and
Figure 6 the average error along East-West direction is ∆x=-2.4 km (minus is a deviation towards west), 95% confidence interval [-2.6, -2.1] km, and the average error along South-North is ∆y=2.05, 95% confidence interval [1.8, 2.3]. The deviation is larger along East-West (σx=5.4 km) than along South-North (σy=4.7 km).
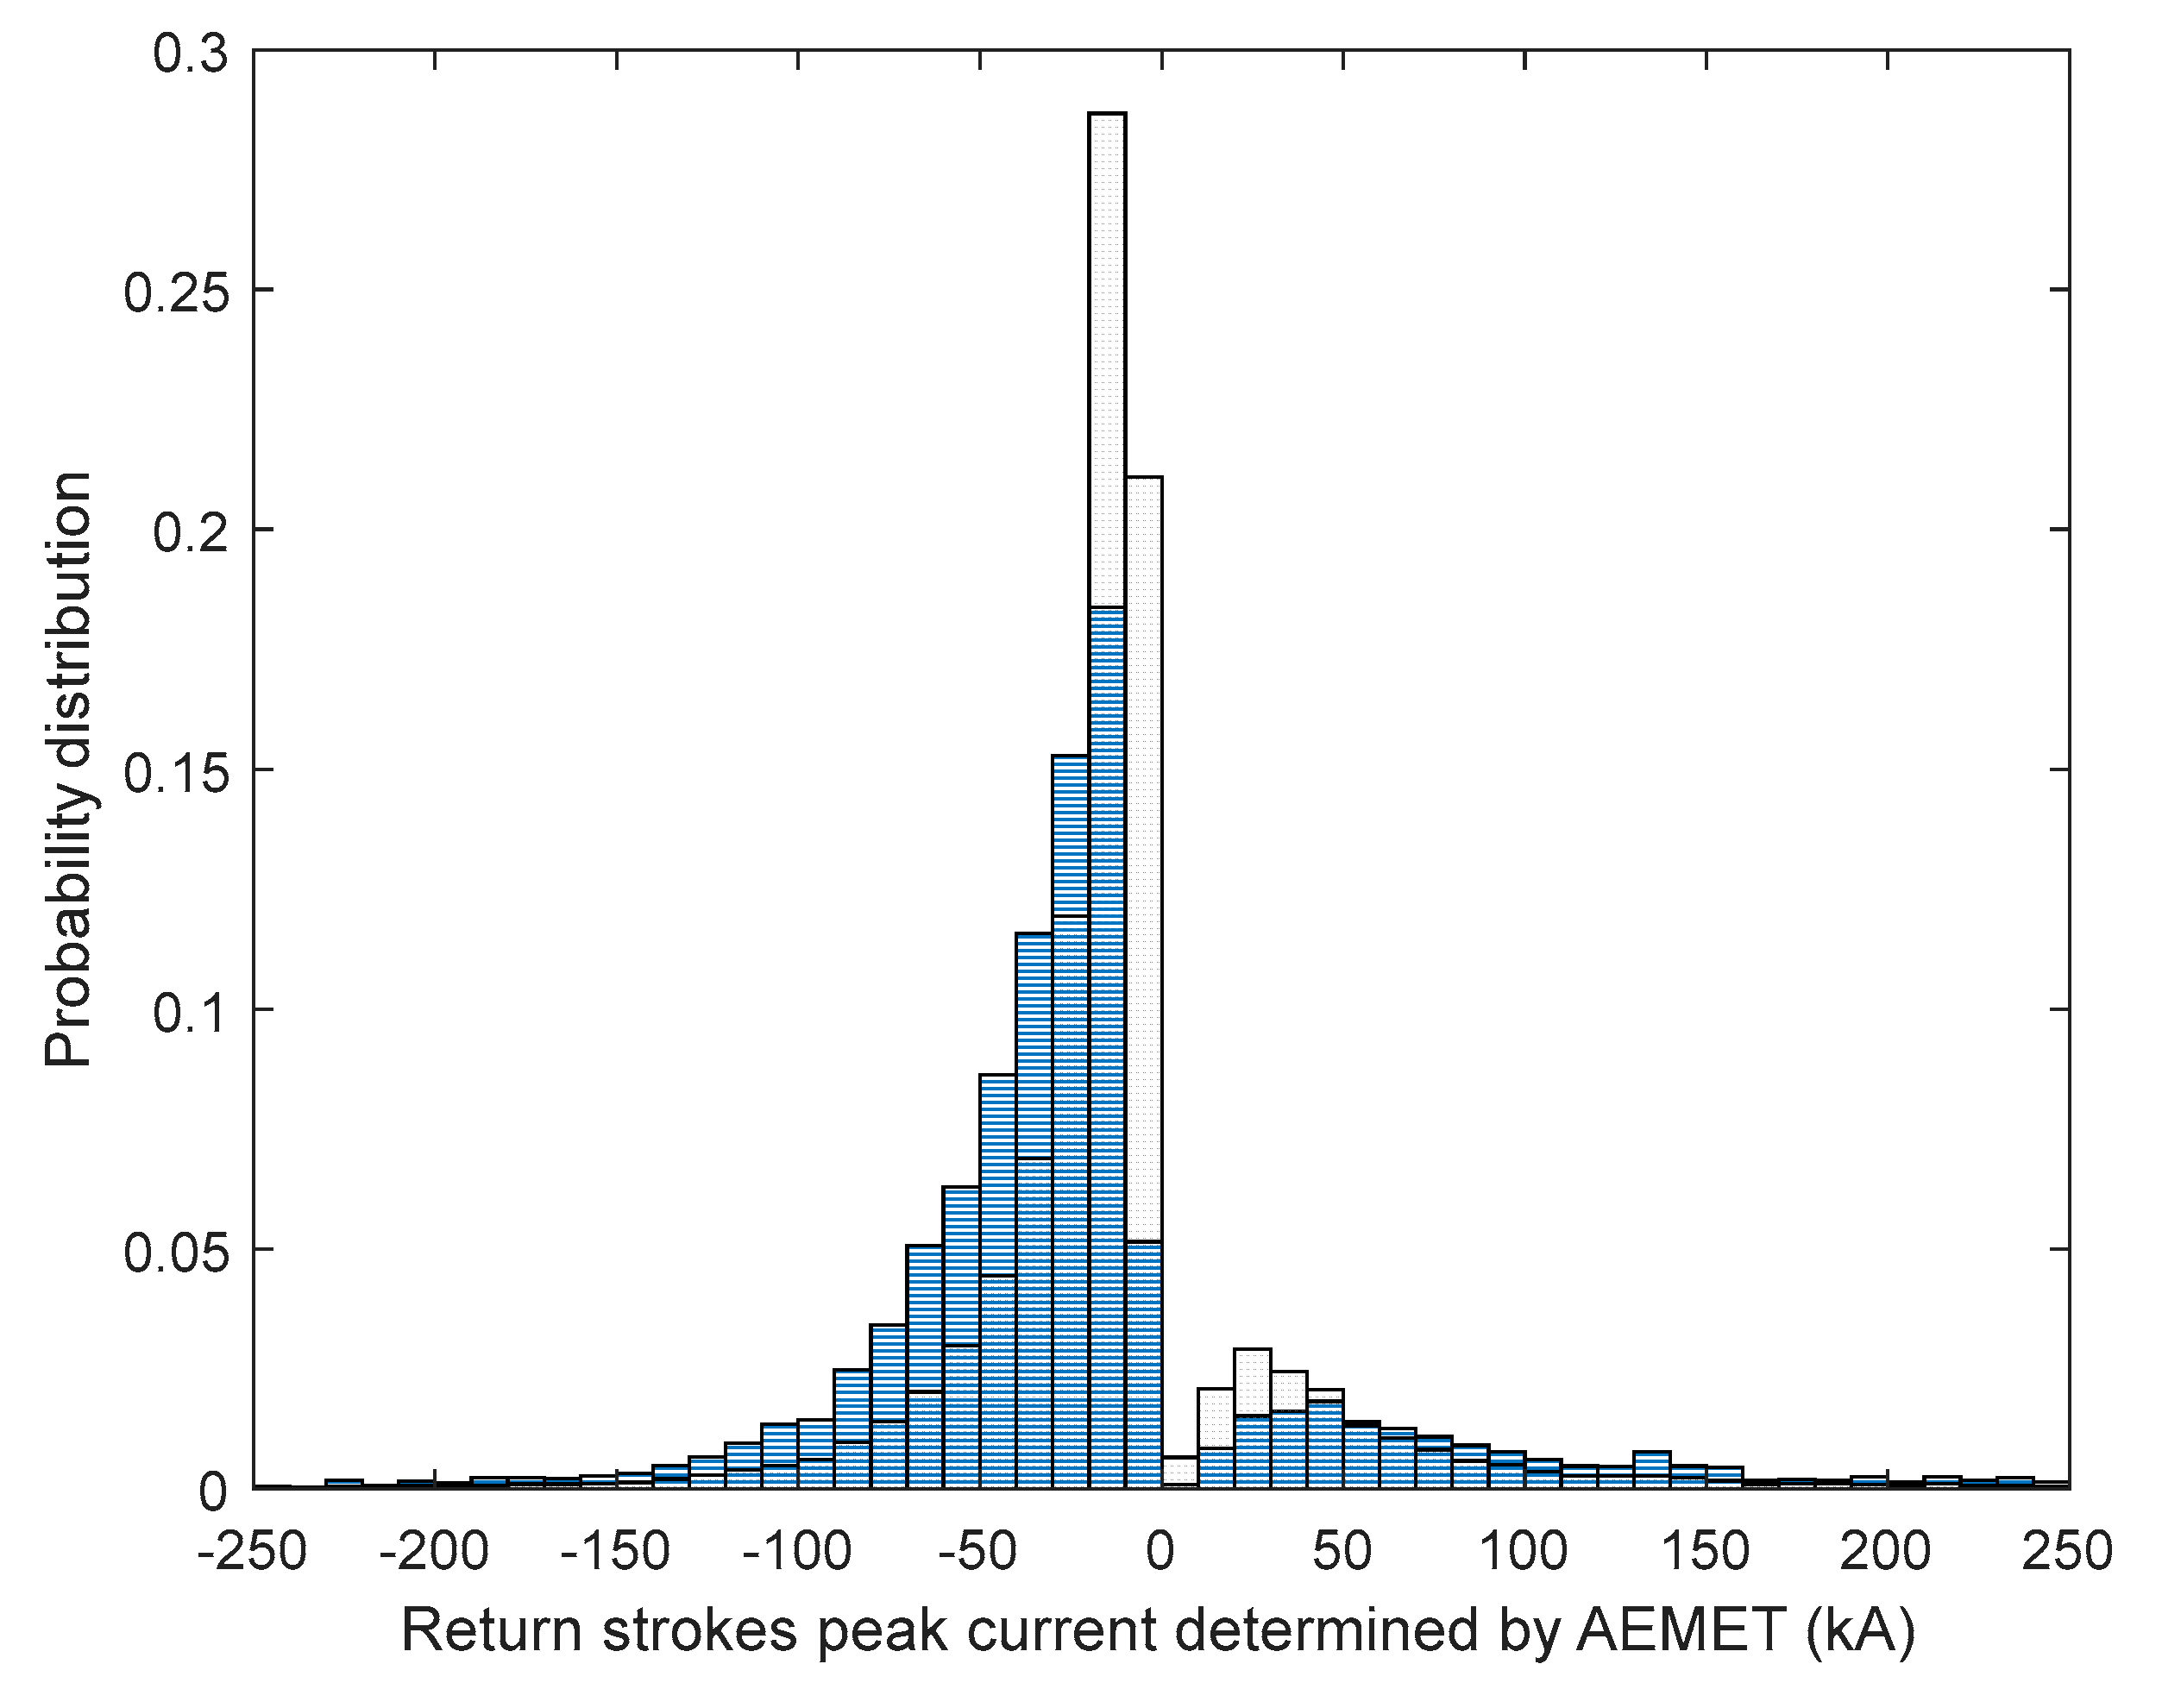
The detected WWLLN return strokes are distributed in terms of the peak current (kA) in
Figure 7, the peak current was obtained by the matching AEMET data.
Figure 7 also shows the number of return strokes from AEMET in bins of 10kA. The distribution of peak currents is shifted toward negative strokes, which is concordant with known climatology.
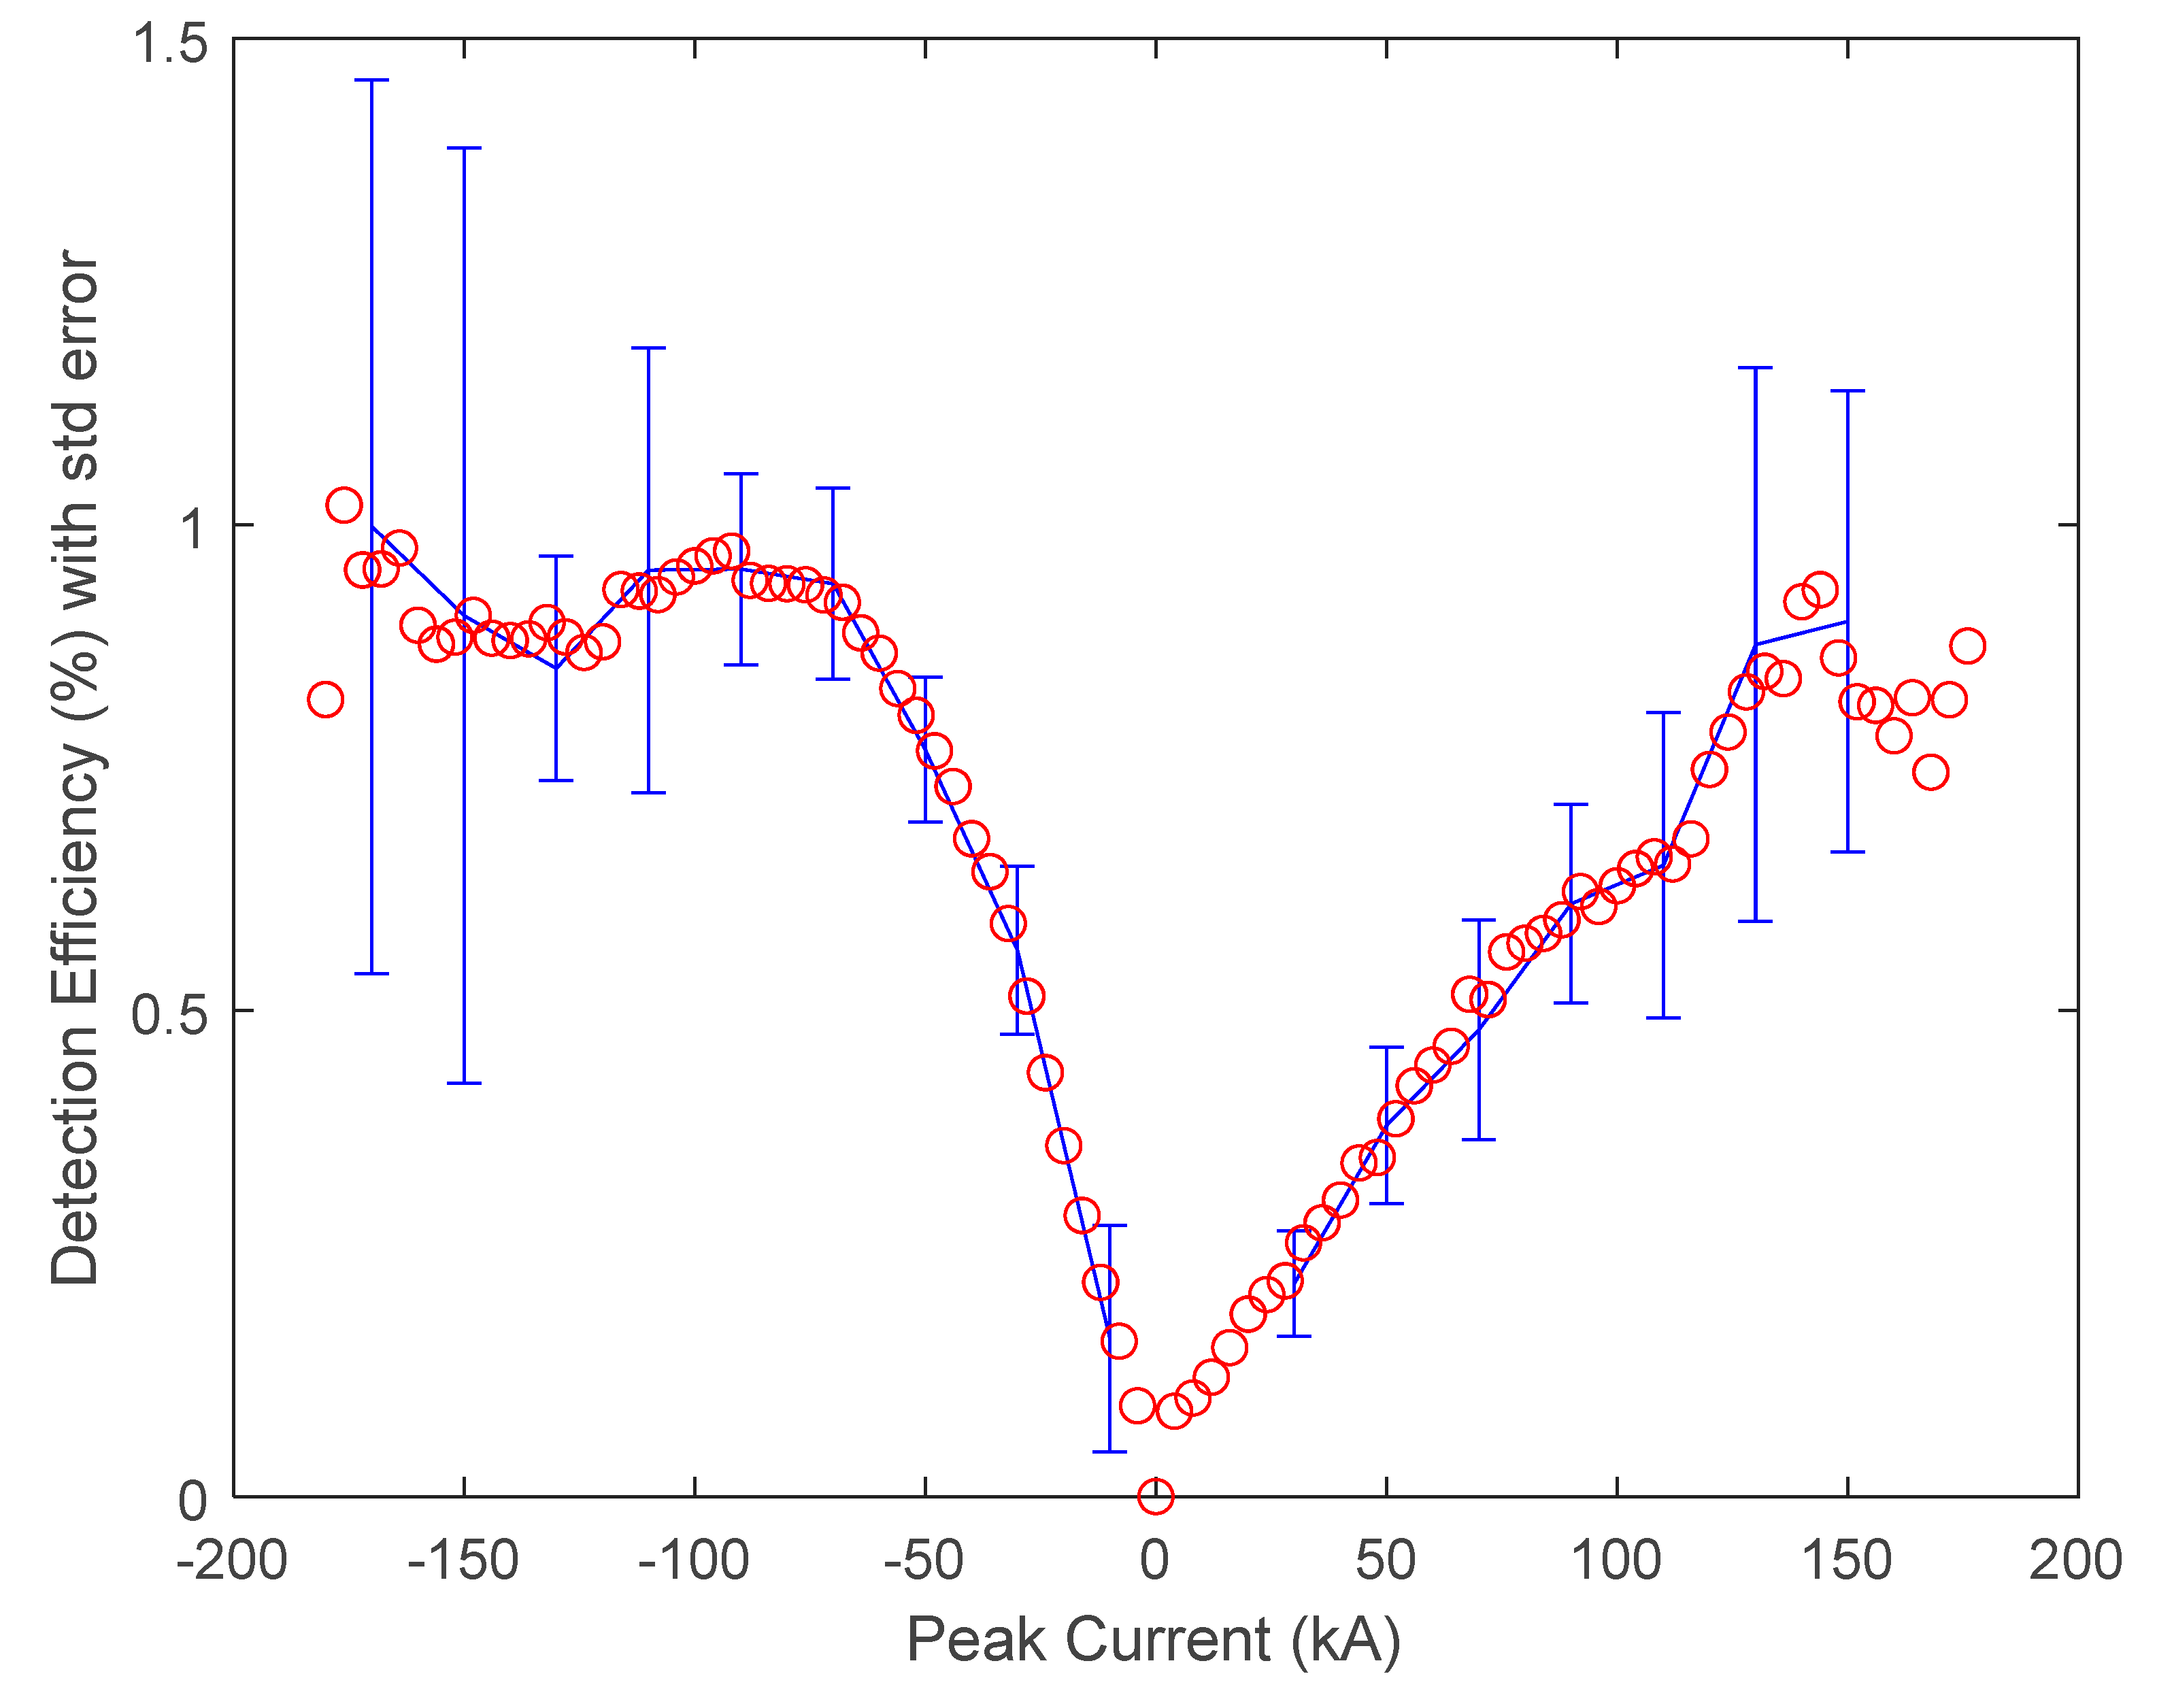
Figure 8 shows the DE of WWLLN in bins of 2kA, the peak current is obtained from the match with AEMET data. The average peak current of the lightning detected by WWLLN is observed higher than that detected by AEMET. Also, DE increases for strong lightning discharge, as it is expected in WWLLN, because very high peak currents are necessary to excite the TEM-TE-TM modes in the EIWG waveguide, these modes are detected in the WWLLN stations at distances between 1000- 8000 km from stroke. WWLLN is more effective in the detection of strong discharges. These results are concordant with previous work related in
Table 1 (Lay et al. 2004; Rodger et al. 2004, 2006; Jacobson et al. 2006; Abreu et al. 2010).
There are 3,471 CG positive lightning strokes (positive peak current), versus 17,180 negative lightning strokes in AEMET data, a 16.8% of detected CG strokes. The same ratio is preserved for the subset of 7,843 detected WWLLN. Negative CG are 83.2%. strokes. When electrons and negative ions from the cloud are transferred to the ground the discharge is named Cloud to Ground (CG) or negative lightning strokes, in this case the peak current is negative, and this is the most frequent CG stroke, nearly 90% of globally lightning. In the positive CG the current is opposite and these events are much less frequent. The average negative peak current in negative CG is -25.40kA, and in positive CG is 8.59kA in AEMET data, for the matched WWLLN the results are -39.53 kA average for negative CG and 13.43 kA for positive CG. These results show a clear shift of the WWLLN operation towards detection of high power lightning strokes, which have power enough to excite the propagating modes in EIWG waveguide.
The distribution of the DE is calculated in bins of 2 kA, in which the coincidences are distributed using the AEMET peak current in kA. This provides the DE in small intervals of peak currents, which is shown in
Figure 8. In
Figure 8 each point (red circles) represents the results for an interval of 2 kA. The results are also smoothed with a five point mobile average (in blue color) to show clearly the obtained results, giving the standard error in bars. The information provided by both data in
Figure 7 and
Figure 8 shows that DE increases with the peak current, however in absolute value above 100 kA the DE looks noisy, which we believe is due to the small amount of available data (see
Figure 7 for peak currents greater than 100 kA in absolute value). The DE also shows more fluctuations or worse performance for positive peak currents, which also is related to the small amount of positive CG strokes, however the DE of WWLLN seems good enough also for positive CG with a high peak current. Results of
Figure 8 are very similar to previous work related in
Table 1. (Abarca et al. 2010,
Figure 3.b); (Rodger et al. 2006,
Figure 5); (Fan et al. 2018
Figure 6.a).
We restrict the analysis to a smaller rectangular area inside the continental area of Spain, we choose an inner area of continental Spain, latitude [38°, 42°N] x longitude [6°W,1°W], which is inside the plateau area of Iberian Peninsula. Geographically is a homogenous region. This area is depicted within the green rectangle in
Figure 3. In this case the AEMET file contains 3,389 lightning strokes and the WWLLN file has 1,229. There are 493 coincidences, which are 14.5% of the lightning strikes recorded by AEMET and 40% of the lightning strikes detected by WWLLN. The average error along Est-West direction is ∆x= -2.3 km, CI 95% [-2.81149, -1.81169], with deviation σx=5.6 km, and the average error along South-North is ∆y=1.4, CI 95% [1.0, 1.7], with deviation σy=4.2 km. These results for ∆x, ∆y, are not significantly different from results using the larger area, however the results for the scattered plot of ∆x, ∆y seem better than previous ones. The results have lower standard deviation which can be seen graphically in the differences between
Figure 6 and
Figure 9.
Figure 9 shows how the data are more concentrated around their mean, which corresponds to lower standard deviations. For this area, the average negative peak current in negative CG is -17.92 kA, and in positive CG is 10.26 kA in AEMET data, for the matched WWLLN the results are -28.23 kA average for negative CG and 31.01 kA for positive CG. In this area the differences in absolute value between positive and negative CG lightning strokes is lower than in former larger area, probably related to the characteristics of the storms not related to the characteristics of the sensors, results continue to show a clear shift of WWLLN operation towards high power lightning detection.
Finally, we analyzed the three major lightning and hail storms that affected the Valencia region. The territory under study is a small area of Spain inside [37.5°, 41°N] x [1°W,1°E], the following days, April 18, 2020, August 30, 2021, and August 17, 2022. This last storm of year 2022 there was hail of almost 5cm diameter.
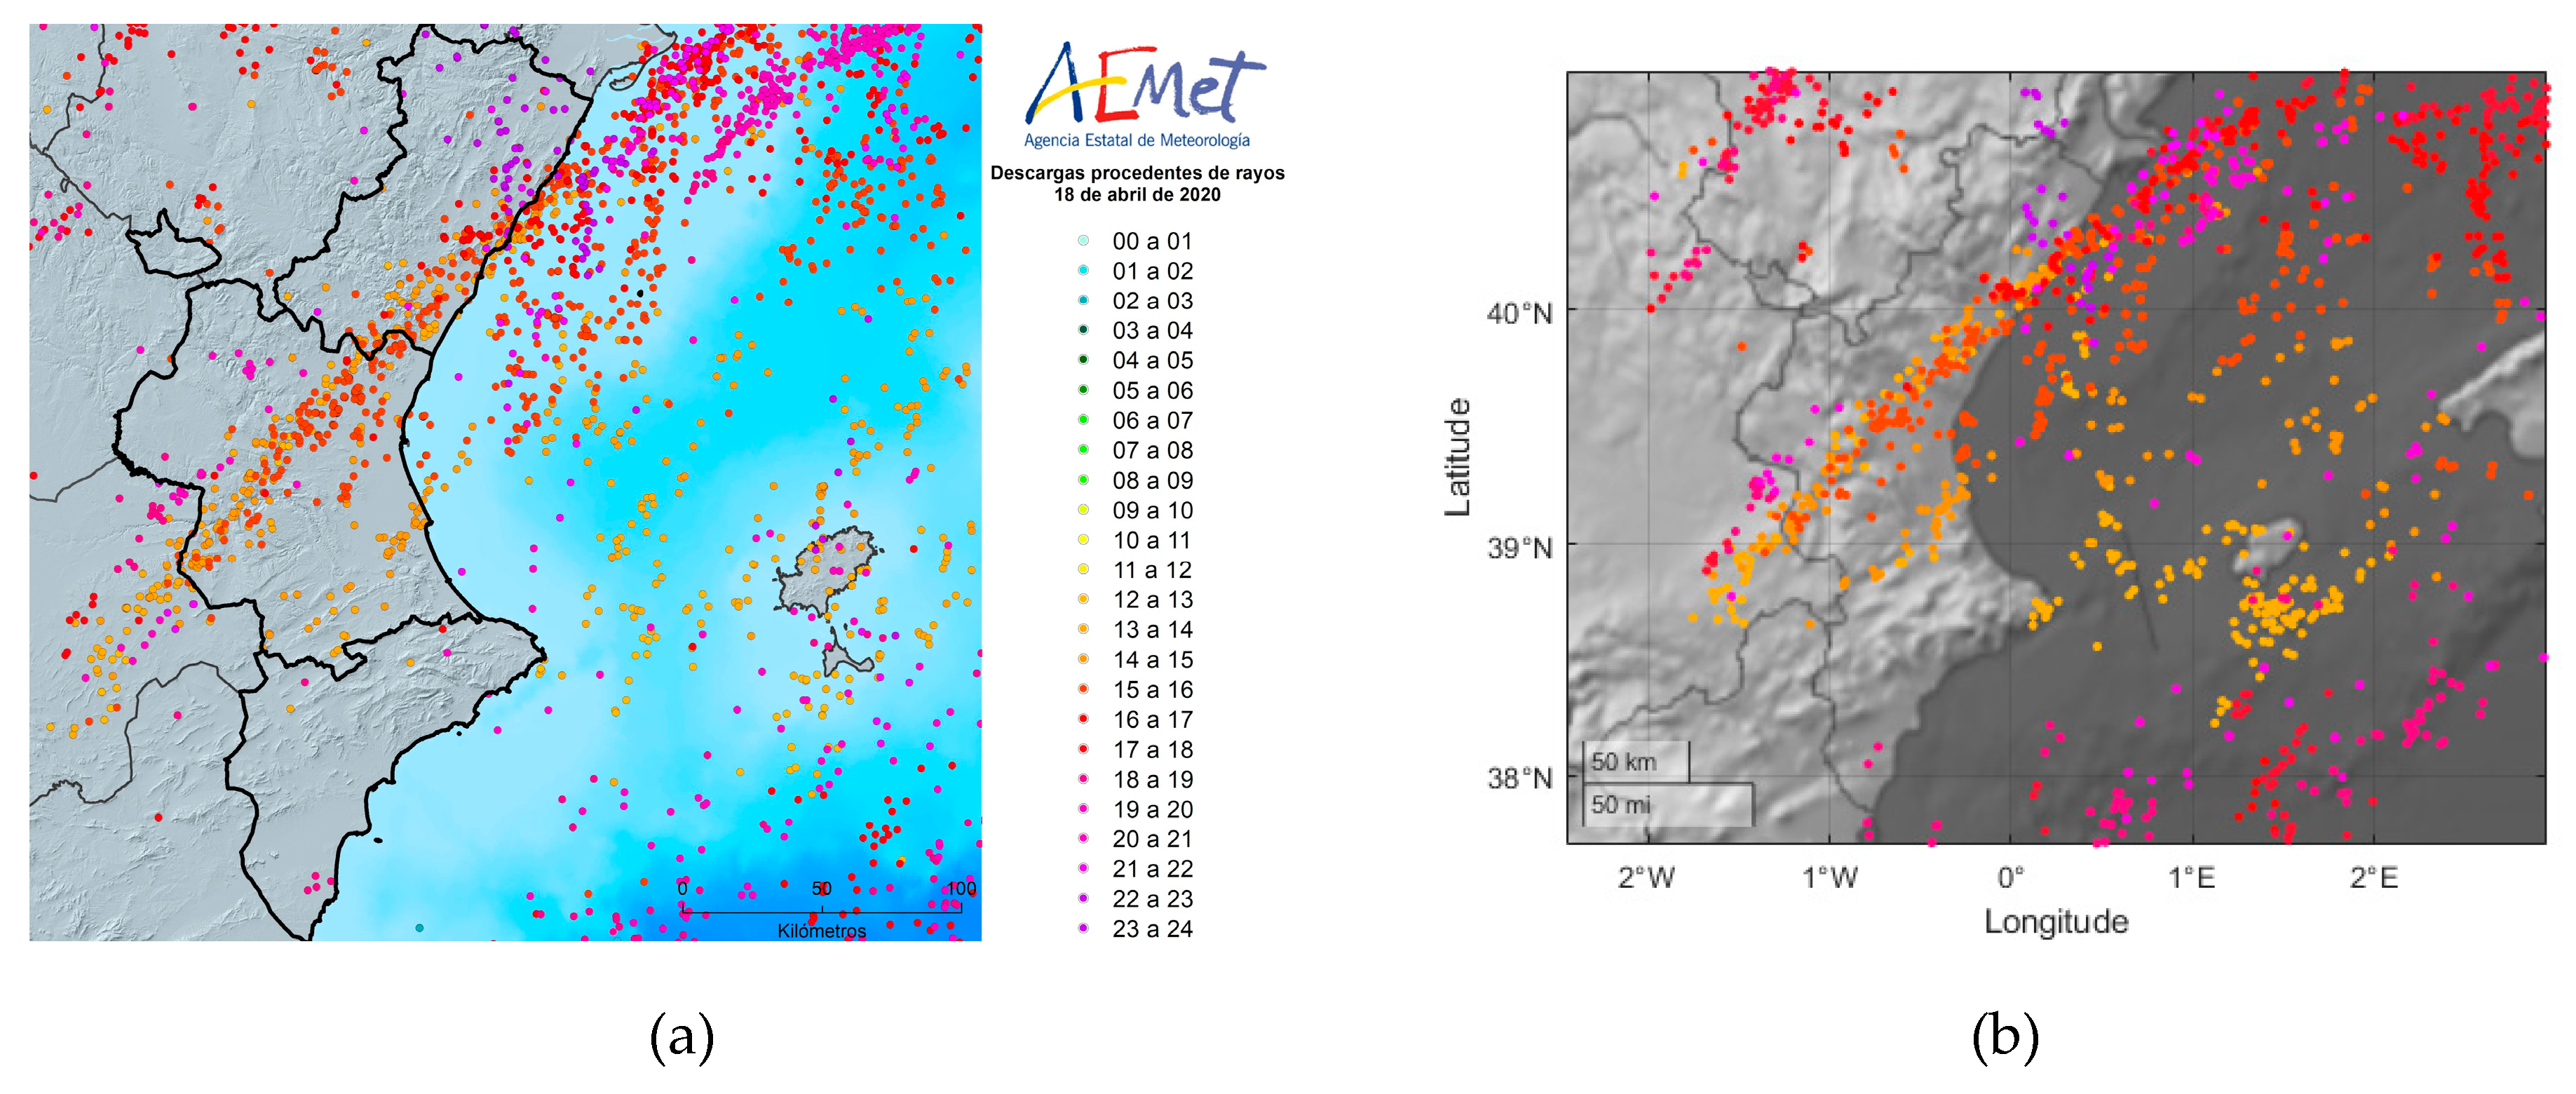
The storm of April 18, 2020 is shown in
Figure 10. In
Figure 10a are shown the lightning strokes detected by AEMET, and
Figure 10b shows the ones detected by WWLLN. There were more than 11,000 lightning strokes in Valencia land and sea, and 510 lightning strokes (CG) in Valencia land.
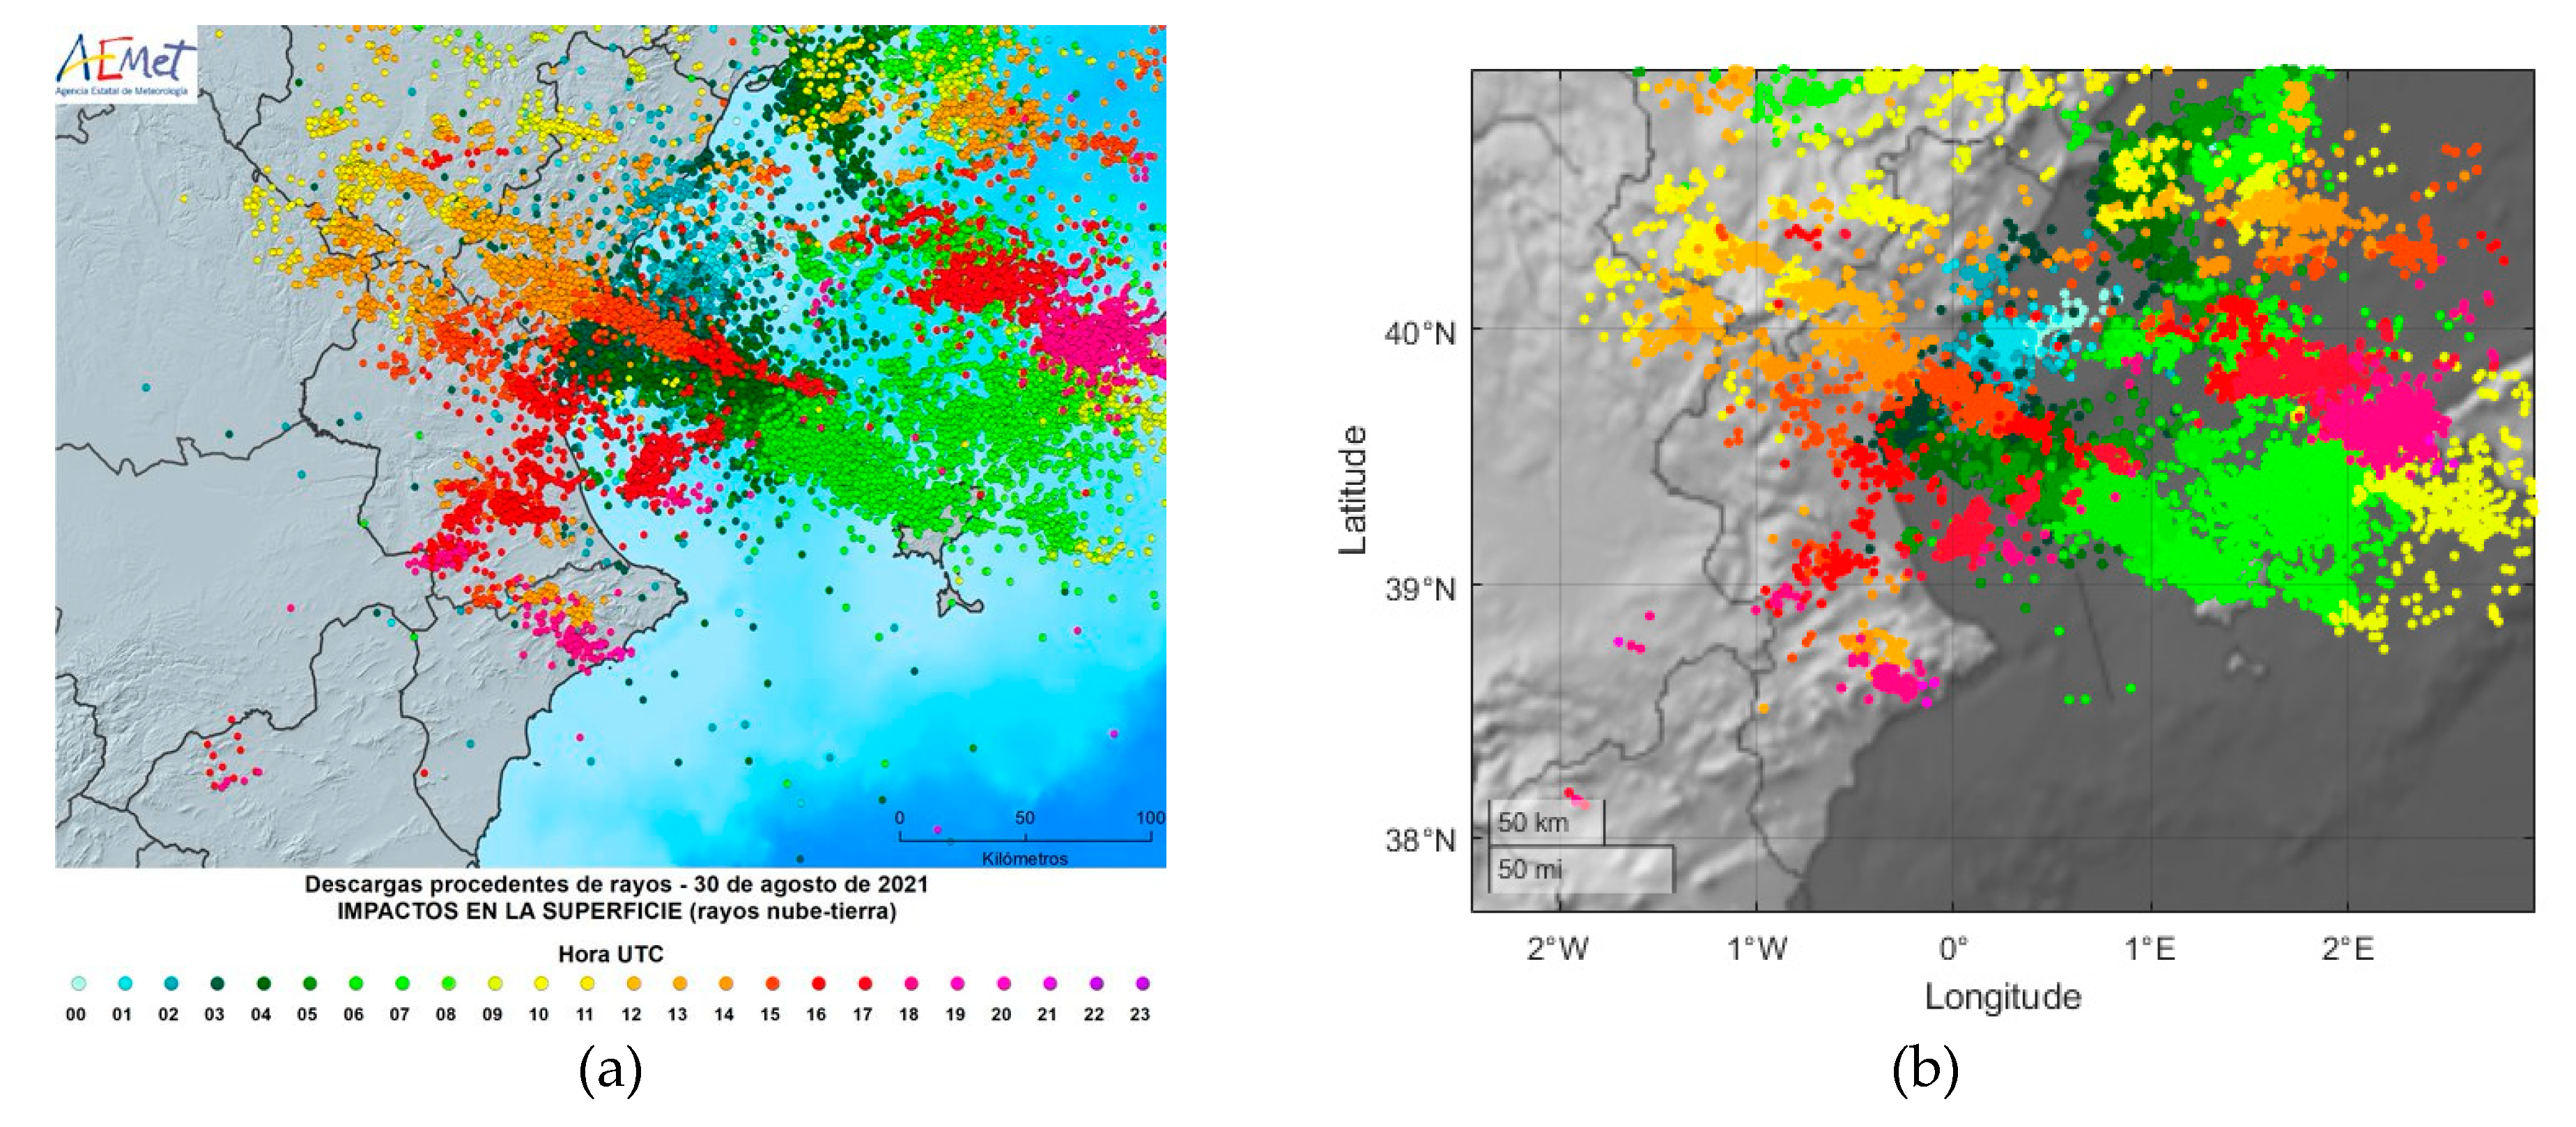
The storm of August 30, 2021 is shown in
Figure 11. In
Figure 11a are shown the lightning strokes detected by AEMET, and
Figure 11b shows the ones detected by WWLLN. There were 2,510 CG lightning strokes in Valencia region land, There were 3,740 IC lightning strokes, and 13,681 CG+IC in Valencia land and sea.
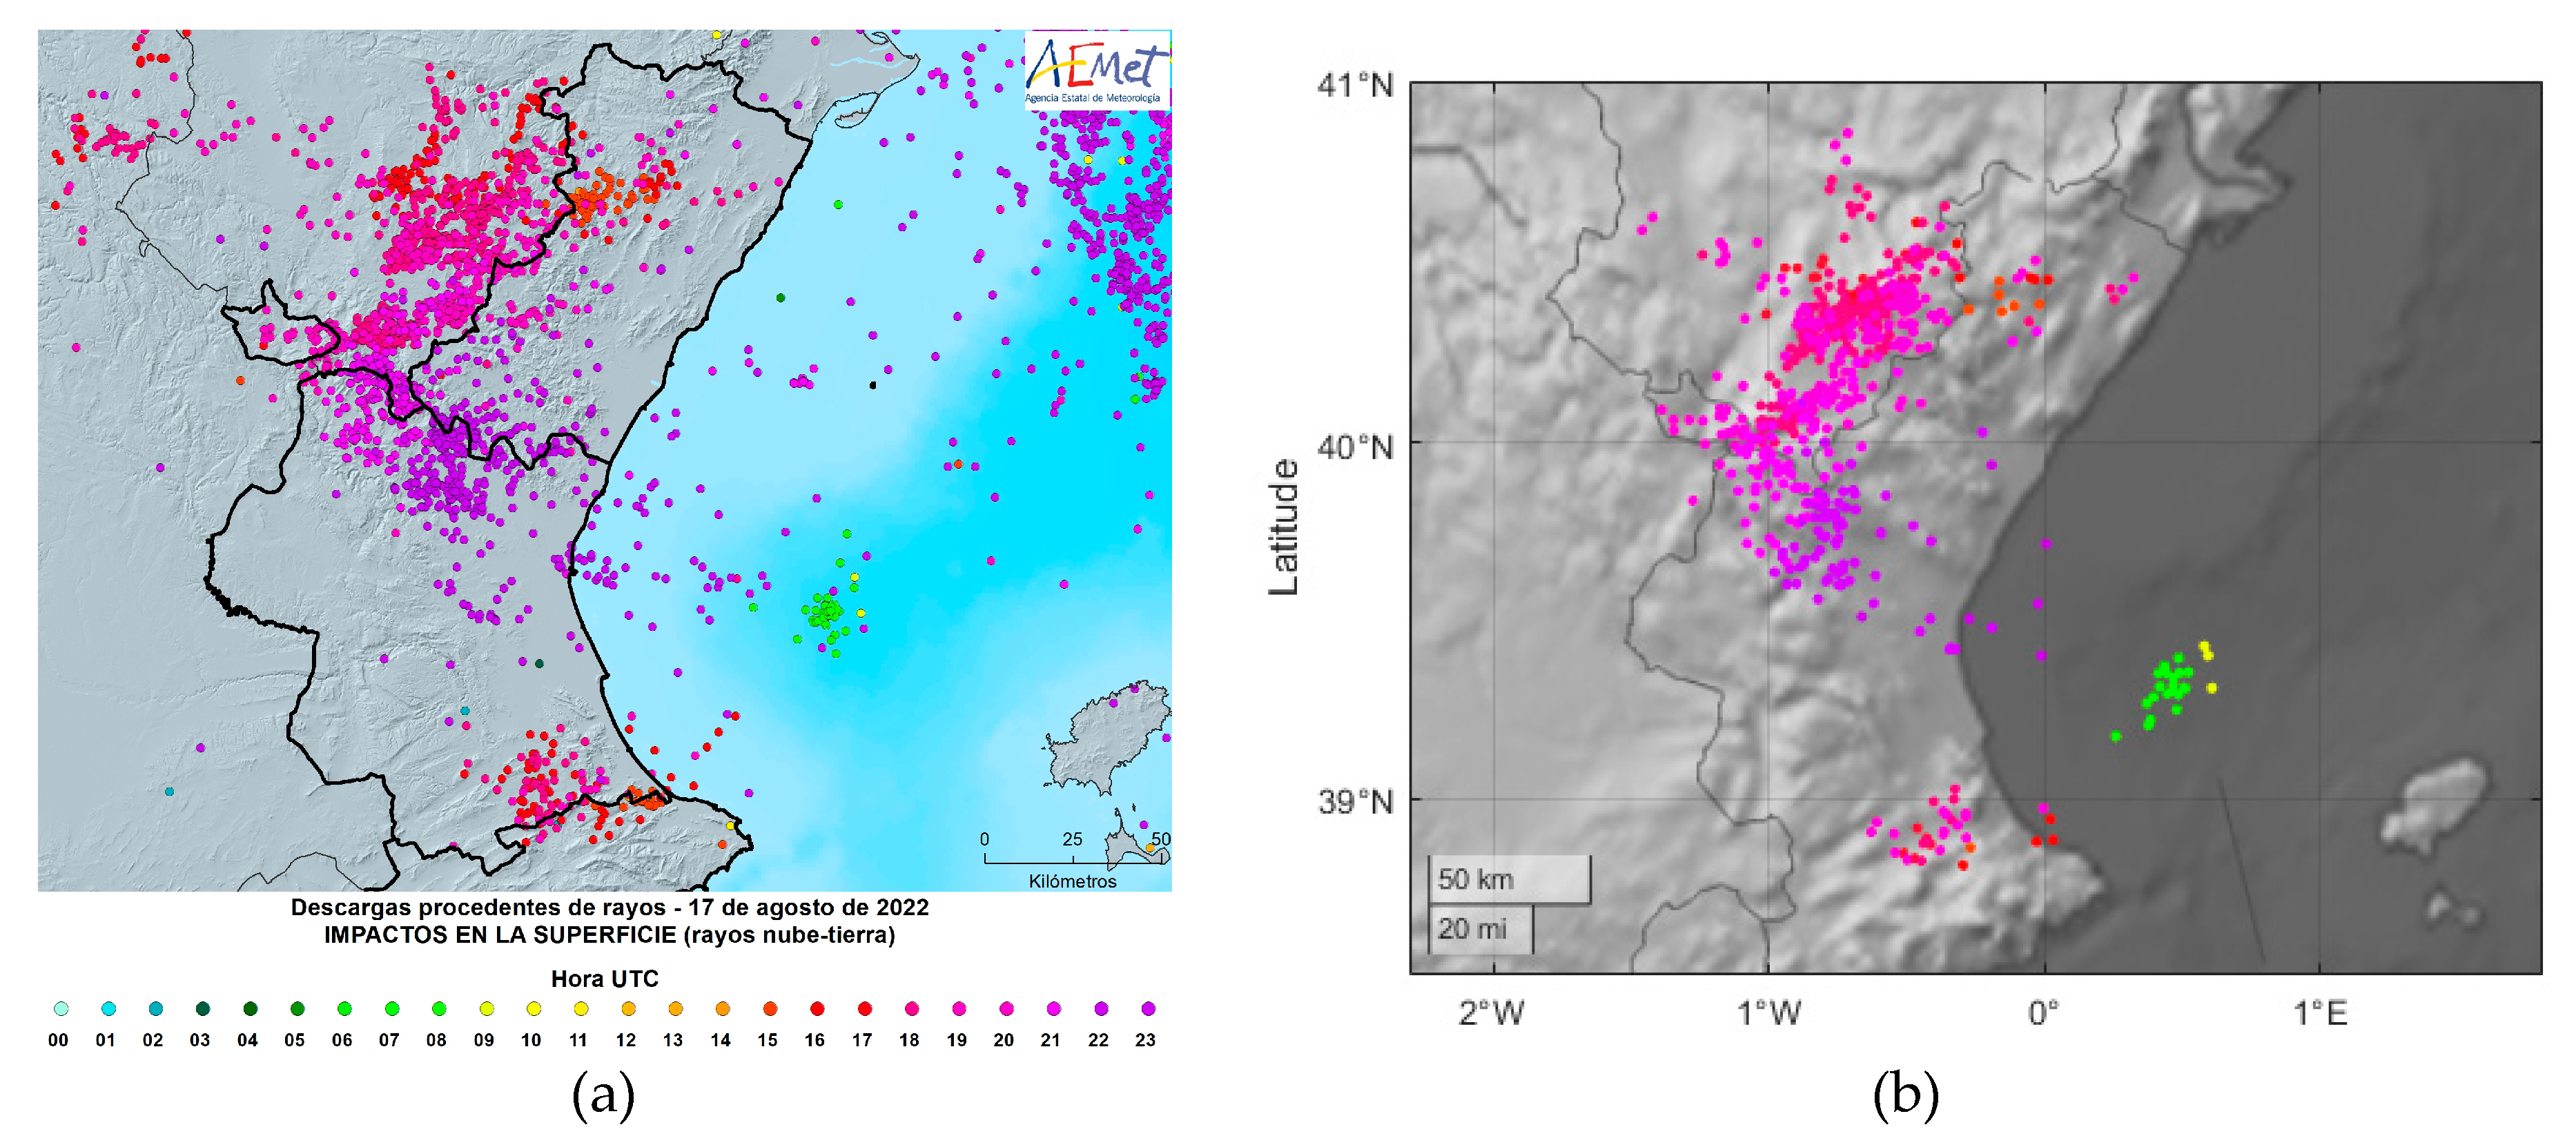
The storm of August 17, 2022 is shown in
Figure 12. In
Figure 12a are shown the lightning strokes detected by AEMET, and
Figure 12b shows the ones detected by WWLLN. There were 28,666 lightning strokes in Spain; in Valencia region there were 810 CG and 2,514 IC, total 3,324 (CG+IC).
Figure 10a,
Figure 11a and
Figure 12a are taken directly from AEMET, and
Figure 10b,
Figure 11b and
Figure 12b have been generated with WWLLN data. In these Figures the locations of the lightning discharges are indicated with dots. A color code is used to temporally locate the lightning discharges in one-hour bands. For each day and for each one-hour interval starting from 00:00h to 23:00h, the lightning location is plotted with a different color. An acceptable match is observed. Good concordance is observed for the point distribution giving location and the color for the time. The WWLLN network detects less lightning than AEMET because it does not detect low power discharges, as shown in
Figure 8, the DE decrease below 50 kA. On the other hand, WWLLN detects IC lightning that AEMET has discarded, which justifies that discharges detected by WWLLN do not appear in the AEMET map.
Table 2.
WWLLN performance in Valencia region (Spain), [37.5°, 41°N] x [1°W,1°E], in 2020-2022.
Table 2.
WWLLN performance in Valencia region (Spain), [37.5°, 41°N] x [1°W,1°E], in 2020-2022.
| Time Period |
Error Est-West |Δx| |
95%CI |
Error South-North |Δy| |
95%CI |
| April 18, 2020 |
0.70 |
[-1.61, 0.25] |
1.52 |
[0.96, 2.07] |
| August 30, 2021 |
1.77 |
[-2.07, -1.46] |
2.13 |
[1.86, 2.40] |
| August 17, 2022 |
0.76 |
[-0.40, 1.93] |
2.17 |
[1.25, 3.09] |
The average DE for these three storms is 39% and the average error is ∆x= -1.10 km, along Est-West direction, and ∆y= 1.94 km, along South-North. The
Figure 10b,
Figure 11b and
Figure 12b provide an adequate location of the lightning strokes, and an excellent description in time and space of the storm displacement.
4. Conclusions
This study contributes to the set of studies that analyze the operation of WWLLN in other parts of the World. Performance is evaluated in Spain by comparison with data from the Spanish AEMET network as ground truth, in time period from 1th January 2012 to 30th April 2012. For this time interval there were 20,651 lightning strokes. In the present work the criteria used to define the coincidence is 0.5 s time difference and 20 km distance. The election of criteria was due to the coarseness of AEMET data, which was available with 1 s resolution. With the given criteria in time and distance, we detect 7,843 CG from the 20,651 AEMET data, a theoretical CG detection of 38% of the true lightning strokes detected by AEMET. As it was observed in previous studies the DE increased with the peak current of lightning stroke. The WWLLN provided a good coverage for lightning strokes since 2012 in the Iberian Peninsula where sensors are very close in terms of distance between WWLLN receivers. The sensors are at a distance of 760 km, were typical receivers are around >5000-15000 km. The results are consistent with previous work, for instance DE of WWLLN was about 11% in 2010 for peak currents greater than 20KA (Abreu et al. 2010), and a distance accuracy of about 5 km, having 40 receiving sensors at that time. In September 2012 there were 69 stations, having a DE of around 38% for CG strokes and >50% for CG strokes > 40KA, the average LA was around 3 km, and the timing accuracy ± 16 μs (Holtzworth and Hutchins, 2012).
The WWLLN datasets contain both CG and IC lightning strokes. The measurement procedure of the sensors and therefore the data do not allow differentiate between CG and IC. WWLLN receiving stations use a single 1.5 m whip antenna to measure the vertical polarization of the electric field, vertical to ground, this antenna is located close to some building and has no any special filter to provide differences between IC and CG strokes, when the signal arrives to the antenna the electromagnetic field is distorted by the close environment, and the geometry of the antenna is not a valid filter. Thus, WWLLN cannot make differences between signals that arrive from IC and CG, and has mixed IC-CG records in the data. In the work of Soriano and de Pablo (2007), it was estimated a ratio IC/CG of 3.48 in the Iberian Peninsula, and a ratio 3.53-4.05 in (Mackerras et al. 1998; Fang et al 2018). Taking in account this ratio we can conclude that WWLLN provides an excellent coverage for Iberian Peninsula, close to Atlantic Ocean and Mediterranean basin, and obtained results for error location along latitude-longitude could be used to make further improvements.
It is worth to say that is difficult to find open-access continuously updated global lightning time series, (Kaplan et al. 2021). The only completely unrestricted, open-access ground-based lightning datasets currently available in the World are provided by the Alaska Interagency Coordination Center (AICC;
https://fire.ak.blm.gov/predsvcs/maps.php, last access: 30 March 2023). The conclusions of our work analyzing data of 2012, 2020, 2021 and 2022 show improvements of DE and LA of WWLLN. Although detection hardware did not change, it changed the number of sensors in Western Europe. There were seven sensors within a 2,000 km x 2,000 km including the Iberian Peninsula, typically WWLLN was deployed trying to cover distances of 10,000 km with the sensors, a more dense network improved the detection performance.
