Preprint
Article

Remote Sensing and Ecological Variables Related to Influenza a Prevalence and Subtype Diversity in Wild Birds in the Lluta Wetland of Northern Chile

Altmetrics

Downloads

116

Views

82

Comments

0

A peer-reviewed article of this preprint also exists.

Submitted:

03 May 2023

Posted:

04 May 2023

You are already at the latest version

Alerts
Abstract
The Lluta River is the northernmost coastal wetland in Chile, representing a unique ecosystem and an important source of water in the extremely arid Atacama Desert. During peak season, the wetland is home to more than 150 species of wild birds and is the first stopover point for many migratory species that arrive in the country along the Pacific migratory route, representing a priority site for avian influenza virus (AIV) surveillance in Chile. The aim of this study was to determine the prevalence of influenza A virus (IAV) in the Lluta River wetland, to identify subtype diversity and to evaluate ecological and environmental factors that drive the prevalence at the study site. The wetland was studied and sampled from September 2015 to October 2020. In each visit, fresh fecal environmental samples (n = 178) of wild birds were collected for IAV detection by real-time RT-PCR. Furthermore, a count of wild birds present at the site was performed and environmental variables, such as temperature, rainfall, vegetation coverage (Normalized Difference Vegetation Index - NDVI) and water body size were determined. A generalized linear mixed model (GLMM) was built to assess the association between AIV prevalence and explanatory variables. Influenza positive samples were sequenced, and the host species was determined by barcoding. Of the 4,349 samples screened during the study period, overall prevalence in the wetland was 2.07% (95% CI: 1.68 to 2.55) and monthly prevalence of AIV ranged widely from 0% to 8.6%. A great diversity of hemagglutinin (HA) and neuraminidase (NA) subtypes were identified, and 10 viruses were isolated and sequenced, including low pathogenic H5, H7 and H9 strains. In addition, several reservoir species were recognized (both migratory and resident birds), including the newly identified host Chilean flamingo (Phoenicopterus chilensis). Regarding environmental variables, prevalence of AIV was positively associated with NDVI (OR=3.65, p<0.05) and with the abundance of migratory birds (OR=3.57, p<0.05). These results emphasize the importance of the Lluta wetland as a gateway to Chile for viruses that come from the Northern Hemisphere and contribute to the understanding of AIV ecological drivers.
Keywords: 
Subject: Biology and Life Sciences  -   Animal Science, Veterinary Science and Zoology
*Co-corresponding authors: Pedro Jimenez-Bluhm; Pontificia Universidad Católica de Chile, Escuela de Medicina Veterinaria; Av. Vicuña Mackenna 4860, Santiago, Chile; Phone: +56 223547488; Email: pedro.jimenez@uc.cl; Christopher Hamilton-West; Universidad de Chile, Departamento de Medicina Preventiva Animal; Av. Santa Rosa 11735, Santiago, Chile; Phone: +56 229785578; Email: christopher.hamilton@veterinaria.uchile.cl
Article summary line: Remote sensing and ecological variables related to Influenza A in wild birds in a wetland in Chile.

1. Introduction

Considering that all influenza A virus (IAV) subtypes have the potential to contribute to the emergence of a pandemic strain, knowledge of infection dynamics and surveillance in wild birds is central to prevent the disease in humans and food-producing animals [1,2].
Wild waterfowl, particularly the Anseriformes and Charadriiformes orders, are considered as main reservoirs of IAV in its low pathogenic form (LPAI) [1,3]. These birds have the potential to spread IAV when they migrate within and between continents, representing a risk for the emergence of highly pathogenic avian influenza (HPAI) outbreaks in domestic birds [4]. However, while much is known about IAV prevalence in Eurasian and North American wild birds [5,6,7], there remains a lack of information on IAV prevalence in wild birds from South America, despite recent effort [8,9,10,11,12].
Chile has a coastline of more than 4,000 kilometers, along which there are hundreds of wetlands that serve as breeding grounds for resident birds and wintering areas for the many migratory species that arrive each year on the Pacific and Atlantic flyways [1,13]. Recent studies carried out by our research group have demonstrated the presence of a wide diversity of IAV subtypes in wild birds including low pathogenic H5 and H7 strains [8]. Sporadic outbreaks of LPAI have also been found in commercial farms and a widespread circulation of IAV in backyard production systems (BPS), which could be the result of spillover events from wild birds [14,15,16].
Along the Chilean coastline, there are also a wide diversity of climates, which determines the environmental characteristics of each wetland. For example, Lluta river wetland in Arica and Parinacota Region has a desert climate (< 1mm yearly rainfall); El Yali wetland in the Valparaíso Region (central zone) has a climate of cloudy steppe, warm temperate with winter rainfall, temperate steppe with winter precipitation, cold mountain steppe and high mountain tundra; and Itata river in Biobio Region (southern zone) has a warm temperate climate with dry and rainy season. This environmental variety of Chilean wetlands and the size of the country may affect the structure and composition of bird assemblages , however this is still poorly studied in Chile, especially in the northern zone [17,18].
The coastal wetlands of northern Chile, being important sources of water in an extremely arid area, are ecosystems that shelter and serve as refuge for many species of wild birds [18]. The Lluta River wetland is the northernmost coastal wetland in Chile and belongs to the biogeographical province of the Coastal Desert. Its main water source is the Lluta River, the only exoreic river in the province, exhibits its most important floods during the summer season (December to March), due to the “highland winter” rains. The average annual temperature fluctuates between 16° and 22°C and rainfall is almost inexistent throughout the year, reaching an annual maximum of 1.5 mm [18,19].
This wetland representing the main habitat of the local avifauna in the Atacama Desert and the gateway to the country for many migratory species belonging mainly to the Pacific route [18,20]. The movements of these species may play an important role in the maintenance and spread of North American lineage viruses, therefore, this wetland may be a possible point of confluence where North and South American IAVs intermix [8], representing a priority site for avian influenza virus surveillance in Chile.
However, to understand the role of wild birds in the spread and persistence of IAV, surveillance efforts must focus not only on the isolation and characterization of circulating viruses at sites where these birds concentrate, but it is also critical that environmental factors that may impact IAV prevalence in these ecosystems to be considered [21]. These factors include abiotic elements, such as rainfall and temperature; biotic factors, such as bird species present and amount of vegetation; and anthropogenic factors, such as land use and land cover types [21,22,23,24,25]. However, to date, studies that include ecological aspects of the virus and that explore the interaction between IAV prevalence in wild birds and the environment remain scarce [11,21,23,24,26]. So far, the only study performed in Chile that explores ecological and environmental factors related to the prevalence of IAVs in wild birds, has demonstrated that the prevalence of IAV in central Chilean wetlands is not constant over the year, being higher in the summer and fall months. Environmental factors driving this prevalence included minimum temperature, NDVI and size of the wetland water body [11].
The aim of this study was to determine the prevalence of IAV in the Lluta River wetland between September 2015 and October 2020, to identify subtype diversity, and to evaluate ecological and environmental factors that drive these variables at the study site.

2. Materials and Methods

2.1. Study area

Lluta wetland (S 18° 24' 55''- W 70° 19' 20'') geographically belongs to the Lluta River watershed, the only exoreic river in the province of Arica in the Region of Arica and Parinacota. It is located on the coastal border, 10 kilometers north of downtown Arica and 8 kilometers from the border with Peru. It has an area of approximately 300 ha, of which only 31 ha are protected under the denomination of "Municipal Nature Reserve". For birds, it is the most important wetland in northern Chile, hosting more than 150 species (both resident and migratory), which represents 32% of the bird species described for the country [18,19,20]. In 2010, it was designated as a shorebird reserve by the Western Hemisphere Shorebird Reserve Network (WHSRN), a conservation initiative for the protection of the ecological integrity of critical habitats for shorebirds throughout the Americas [19].
This wetland corresponds to the first stopover point for many migratory species that arrive in the country along the Pacific migratory route, such as Franklin’s gull (Leucophaeus pipixcan), Whimbrel (Numenius phaeopus), Least sandpiper (Calidris minutilla), Baird’s sandpiper (Calidris bairdii), Lesser Yellowlegs (Tringa flavipes) and Greater Yellowlegs (Tringa melanoleuca) among others, which congregate in high densities during the spring and summer months [13,18, 20].

2.2. Sampling and sample size

Sampling was carried out between September 2015 and October 2020, performing a total of 19 samplings campaigns during that period. Samples were collected at irregular intervals. In each visit, fresh fecal samples of wild birds were collected for IAV detection. To minimize the probability of sampling the same individual´s feces twice, samples were collected uniformly by line transects throughout the area where a flock was previously observed. Limited samples were taken per each flock, with several sampling points in the site [11]. Samples were collected using single-use sterile flocked swabs (Copan®, Italy) and stored in tubes containing 1mL of universal transport medium (UTM, Copan®, Italy). Samples were maintained at 4°C until arrival at the laboratory of Veterinary Epidemiology of the School of Veterinary Sciences of the University of Chile. Samples were stored at -80°C until processing. A minimum sample size of 178 samples per sampling occasion was calculated, which was estimated from the sample size calculation formula for detecting the presence of disease for finite populations (Equation 1) [27]. A population size of 1,000 fresh feces at the site was considered. In addition, based on results from a previous study [8], a minimum expected prevalence of 1.5% with a significance level of 5% was considered,.
Equation 1:
n = 1 ( α ) 1 D N D 1 2   ,  
where:
  • n = required sampling size
  • N = population size
  • ∝ = 1-confidence level
  • D = estimated minimum number of positive samples

2.3. Influenza A virus detection

The collected samples were processed individually, and RNA extraction and real-time RT-PCR (RT-qPCR) analysis were performed at the Laboratory of Veterinary Epidemiology. Briefly, viral RNA extraction was performed on 50 μL of swab sample using the Ambion MagMax-96 AI/ND viral isolation kit (Life Technologies Corporation, Grand Island, NY, USA). Sample screening was done by RT-qPCR (Stratagene mx3000p Santa Clara, CA, USA) with the TaqMan Fast Virus 1-Step Master Mix (Applied Biosystems, Foster City, CA, USA). Specific primer/probes for the influenza M gene were used for the RT-qPCR reaction as s described [28]. Samples with a cycle threshold value (Ct) ≤38 were considered positive [29]. Swab samples that tested positive by RT-qPCR with a Ct ≤35 were inoculated in embryonated chicken eggs to virus isolation as previously described [30]. Host identification was attempted for IAV positive fecal samples using primers designed to amplify a segment of the mitochondrial cytochrome-oxidase I as described elsewhere [31].

2.4. Sequencing and phylogenic analysis

Sample sequencing was carried out at the St. Jude Children’s Hospital Hartwell Center on the Illumina platform on a MiSeq sequencer (Illumina, San Diego, CA, USA). Libraries were prepared using the Nextera XT DNA-Seq library preparation kit, as described [32]. Reads were De novo assembled using SAPDes package [33]. Reference sequences for the phylogenetic analysis were obtained from the Influenza Virus Database [34]. Representative sequences from North America, Europe and Asia were included in each tree. Briefly, sequence editing was performed using BioEdit version 7.2.5 [35] and sequence alignment with MUSCLE version 3.8.3 [36]. Phylogenetic inference was done to the HA’s of the H5, H7 and H9 isolates by maximum likelihood, with a general time-reversible model and gamma-distributed rate variation among sites. Maximum likelihood analysis was performed using RAxML version 8.0 [37]. To provide statistical robustness to each node, 1000 bootstrap resampling processes were performed. Trees were visualized on FigTree (v.1.4.3). Genbank accession numbers KX185901, KX185918, MH499035, MH498968, MH498978, MH499057, MH499142, MK164009, OP888556 and OQ820949.

2.5. Ecological and environmental variables

The ecological and environmental variables evaluated in this study were grouped into three categories (Table 1):
Wild bird community: At each visit and prior to sampling, a count of wild birds present at the site was performed during morning hours. A point counting approach with several experienced observers was used [11]. This data were used to estimate total bird abundance, species richness and abundance of migratory birds present at the time of sampling.
Landscape variables: The vegetative cover of the wetland and the size of the water body was measured for each sampling month, using images of the LANDSAT 7-ETM and 8-OLI satellites. In addition, to assess the cumulative effect of landscape characteristics and IAV prevalence at the site, these variables were also collected one month, two months and three months before the sampling month [11]. Satellite images were downloaded from the website of the United States Geological Survey (USGS EarthExplorer) and processed using ENVI® software. Normalized Difference Vegetation Index (NDVI) was used as an indicator of the vegetation cover and to delineate water bodies, Modified Normalized Difference Water Index (MNDWI) was used [38,39].
Meteorological data: Monthly average temperatures, humidity and cumulative rainfall were measured for each sampling month. To investigate the cumulative effect of rainfall, humidity, and temperature on IAV prevalence, these variables were also collected one month, two months and three months before beforehand [11]. The information was obtained from the Lluta Bajo weather station, belonging to Agrometeorological Network (Agromet) of the Agricultural Research Institute (INIA) (http://agrometeorología.cl).

2.6. Statistical analysis

To determine the association between the prevalence of IAV in the wetland and the ecological and environmental explanatory variables defined in Table 1, a GLMM was used. The response variable was defined as the number of IAV positive samples obtained in each sampling in relation to sample size (prevalence). The sampling occasion was entered as a random effect in the model [11]. The unconditional association between IAV prevalence and each of the recorded explanatory variables was assessed in the first bivariate GLMM. Variables associated with the outcome at a liberal p-value of <0.15 were selected for inclusion in the multivariable model.
The linearity of continuous explanatory variables against the log odds of IAV positivity was assessed visually. Non-linear variables were categorized using the median. A forward stepwise inclusion of variables, guided by Akaike Information Criteria (AIC), was performed to build the final multivariable mixed model. All analyses were performed using R statistical software using the 'glmer' function of the 'lme4' package [40]. The significance level was set at 5%.

3. Results

3.1. Influenza Prevalence and species richness

Between September 2015 and October 2020, a total of 4,349 fecal samples were collected, of which 90 (2.07 %, 95% CI: 1.68 to 2.55) were positive for influenza virus M gene by RT-qPCR. During this time, the prevalence at the site fluctuated between 0% and 8.6% (Figure 1).
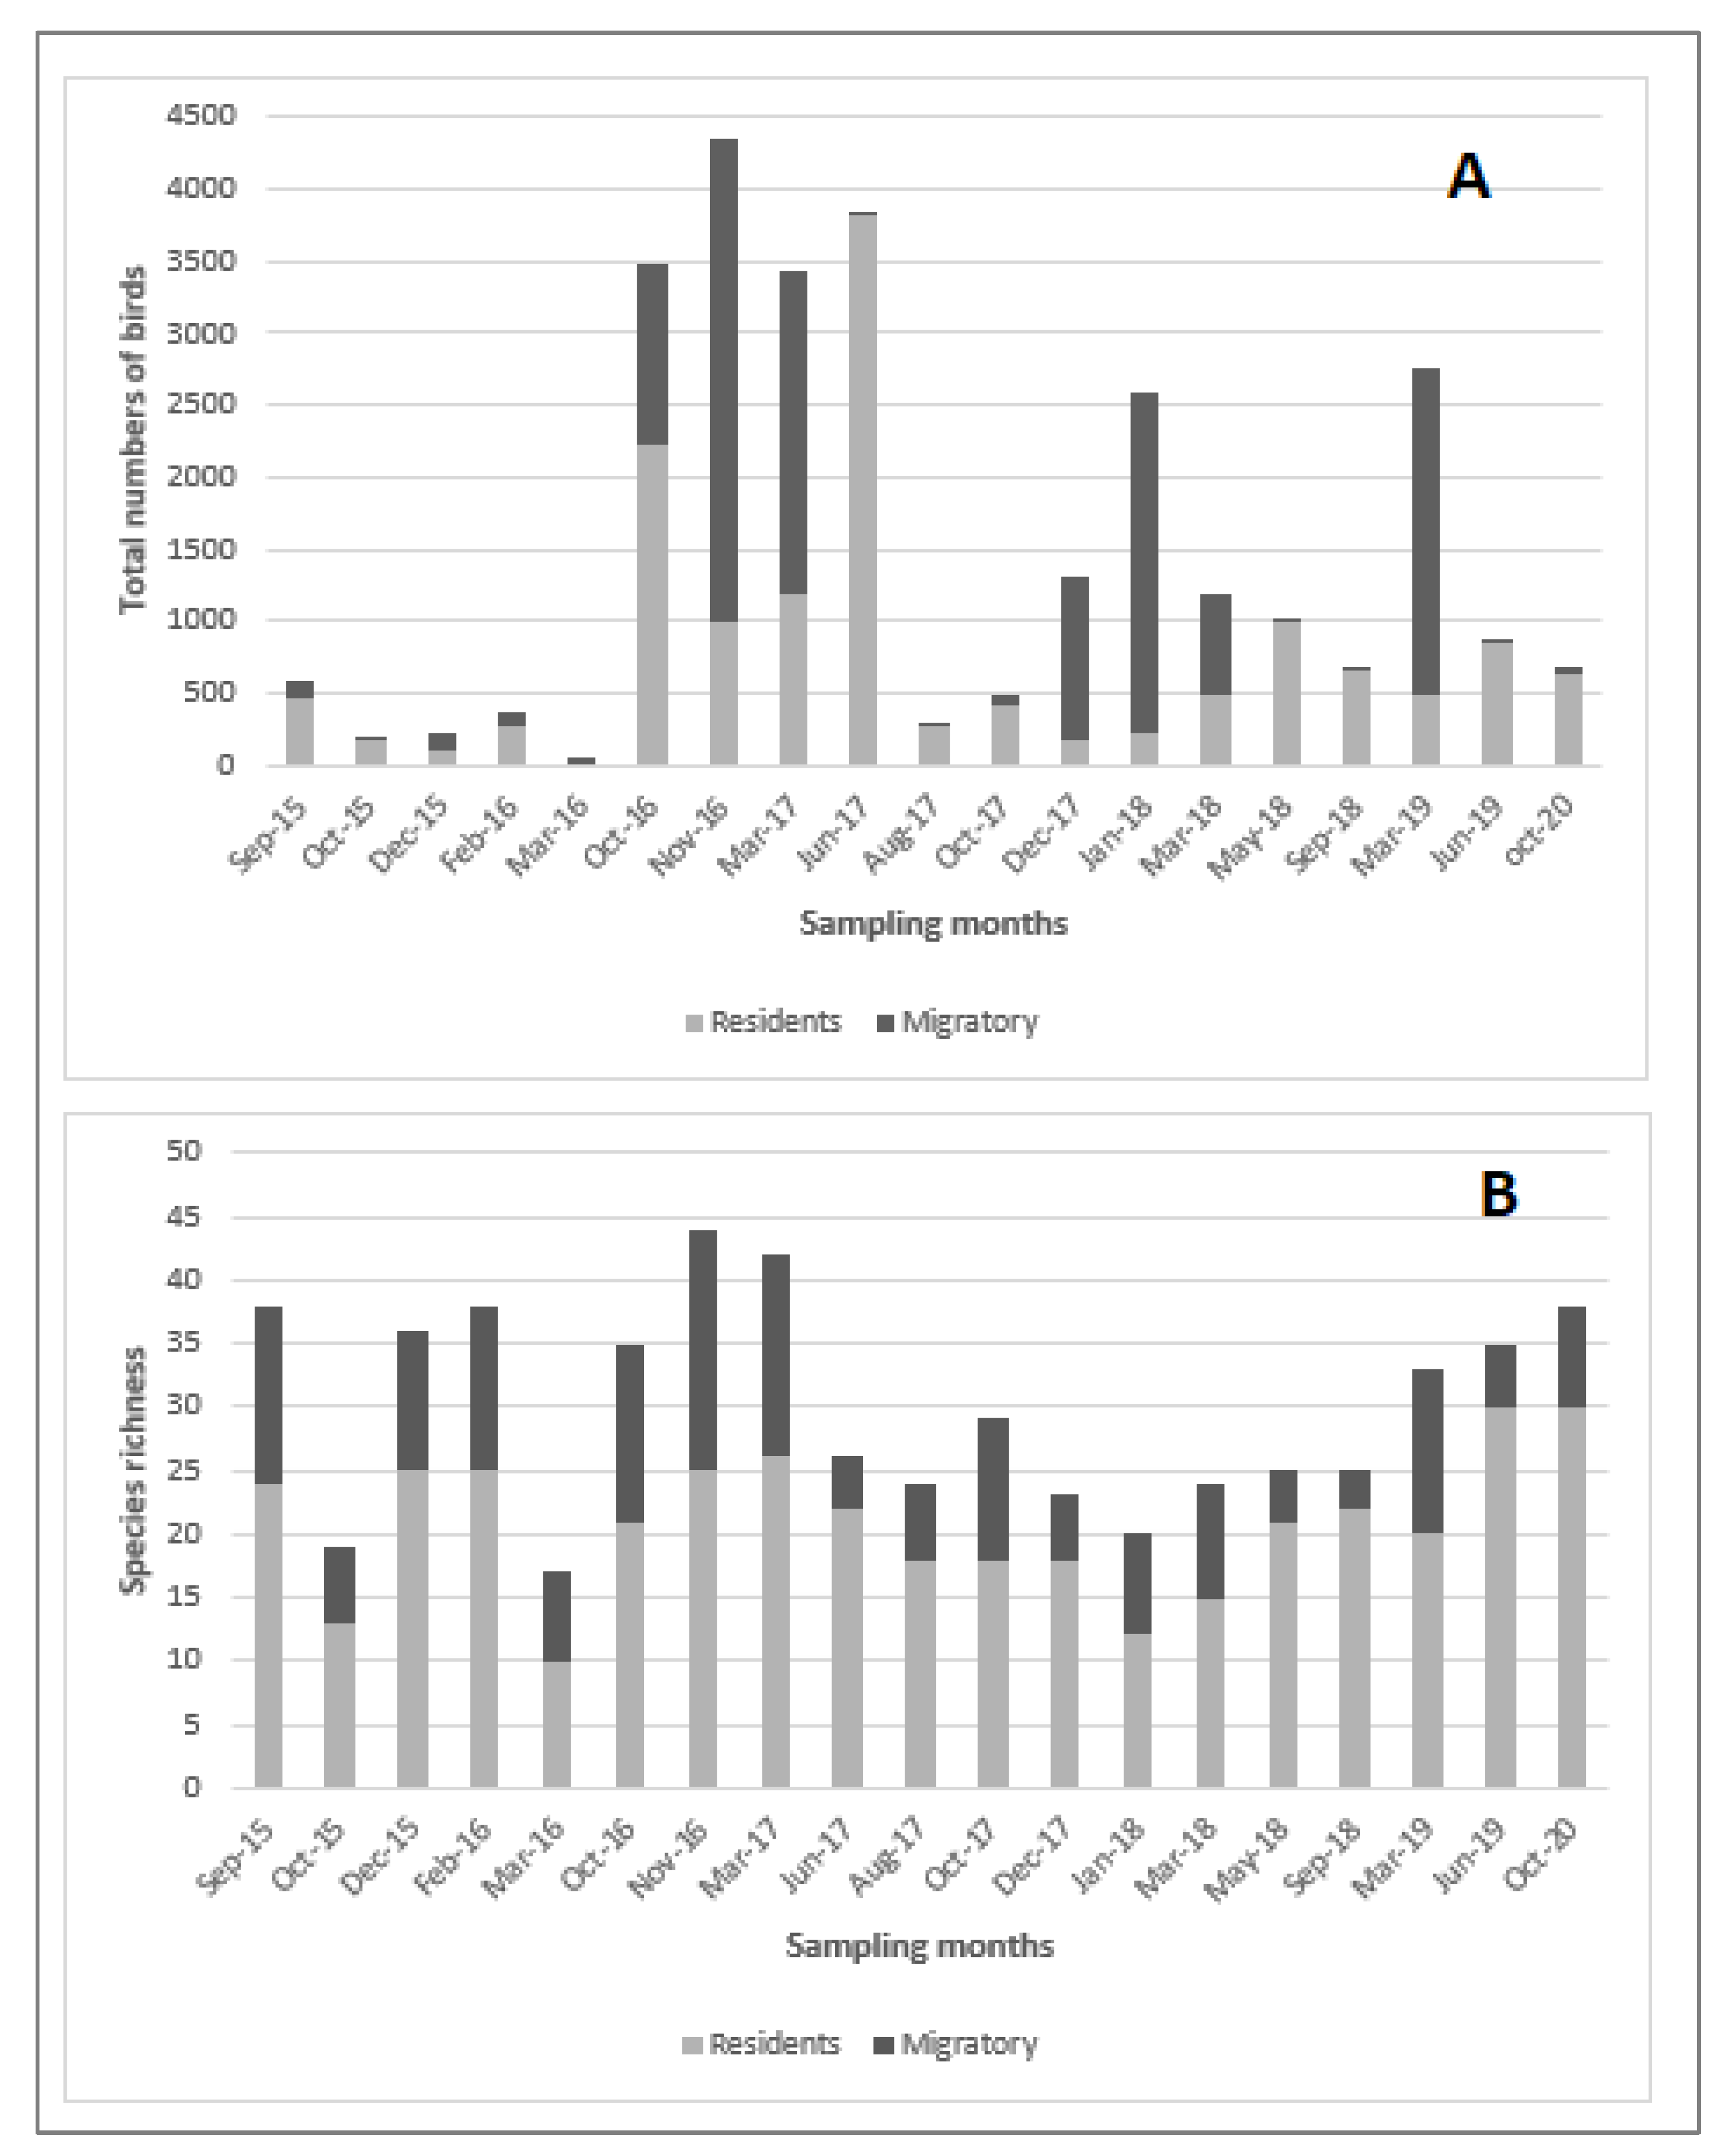
Bird numbers fluctuated widely among sampling occasions over the study period (Figure 2A), where a greater number of individuals were observed during the summer and early autumn months, mainly due to the arrival of migratory birds at the site, highlighting species such as Franklin’s gull (Leucophaeus pipixcan), Whimbrel (Numenius phaeopus) and many species of shorebirds.
Species richness observed during the study months ranged from a minimum of 17 to a maximum of 44, showing an increase during the spring and summer months with the arrival of migratory species from the northern hemisphere (Figure 2B). During the study period, a total of 71 species were identified in the wetland, of which 41 are considered resident, 21 migratory and 9 accidental (Supplemental Table 1).

3.2. Environmental Variables

Meteorological variables (precipitation, humidity, maximum and minimum temperatures) did not show large variations during the months of study (Supplemental Table 2) and none of them showed significance with prevalence of IAV in the wetland.
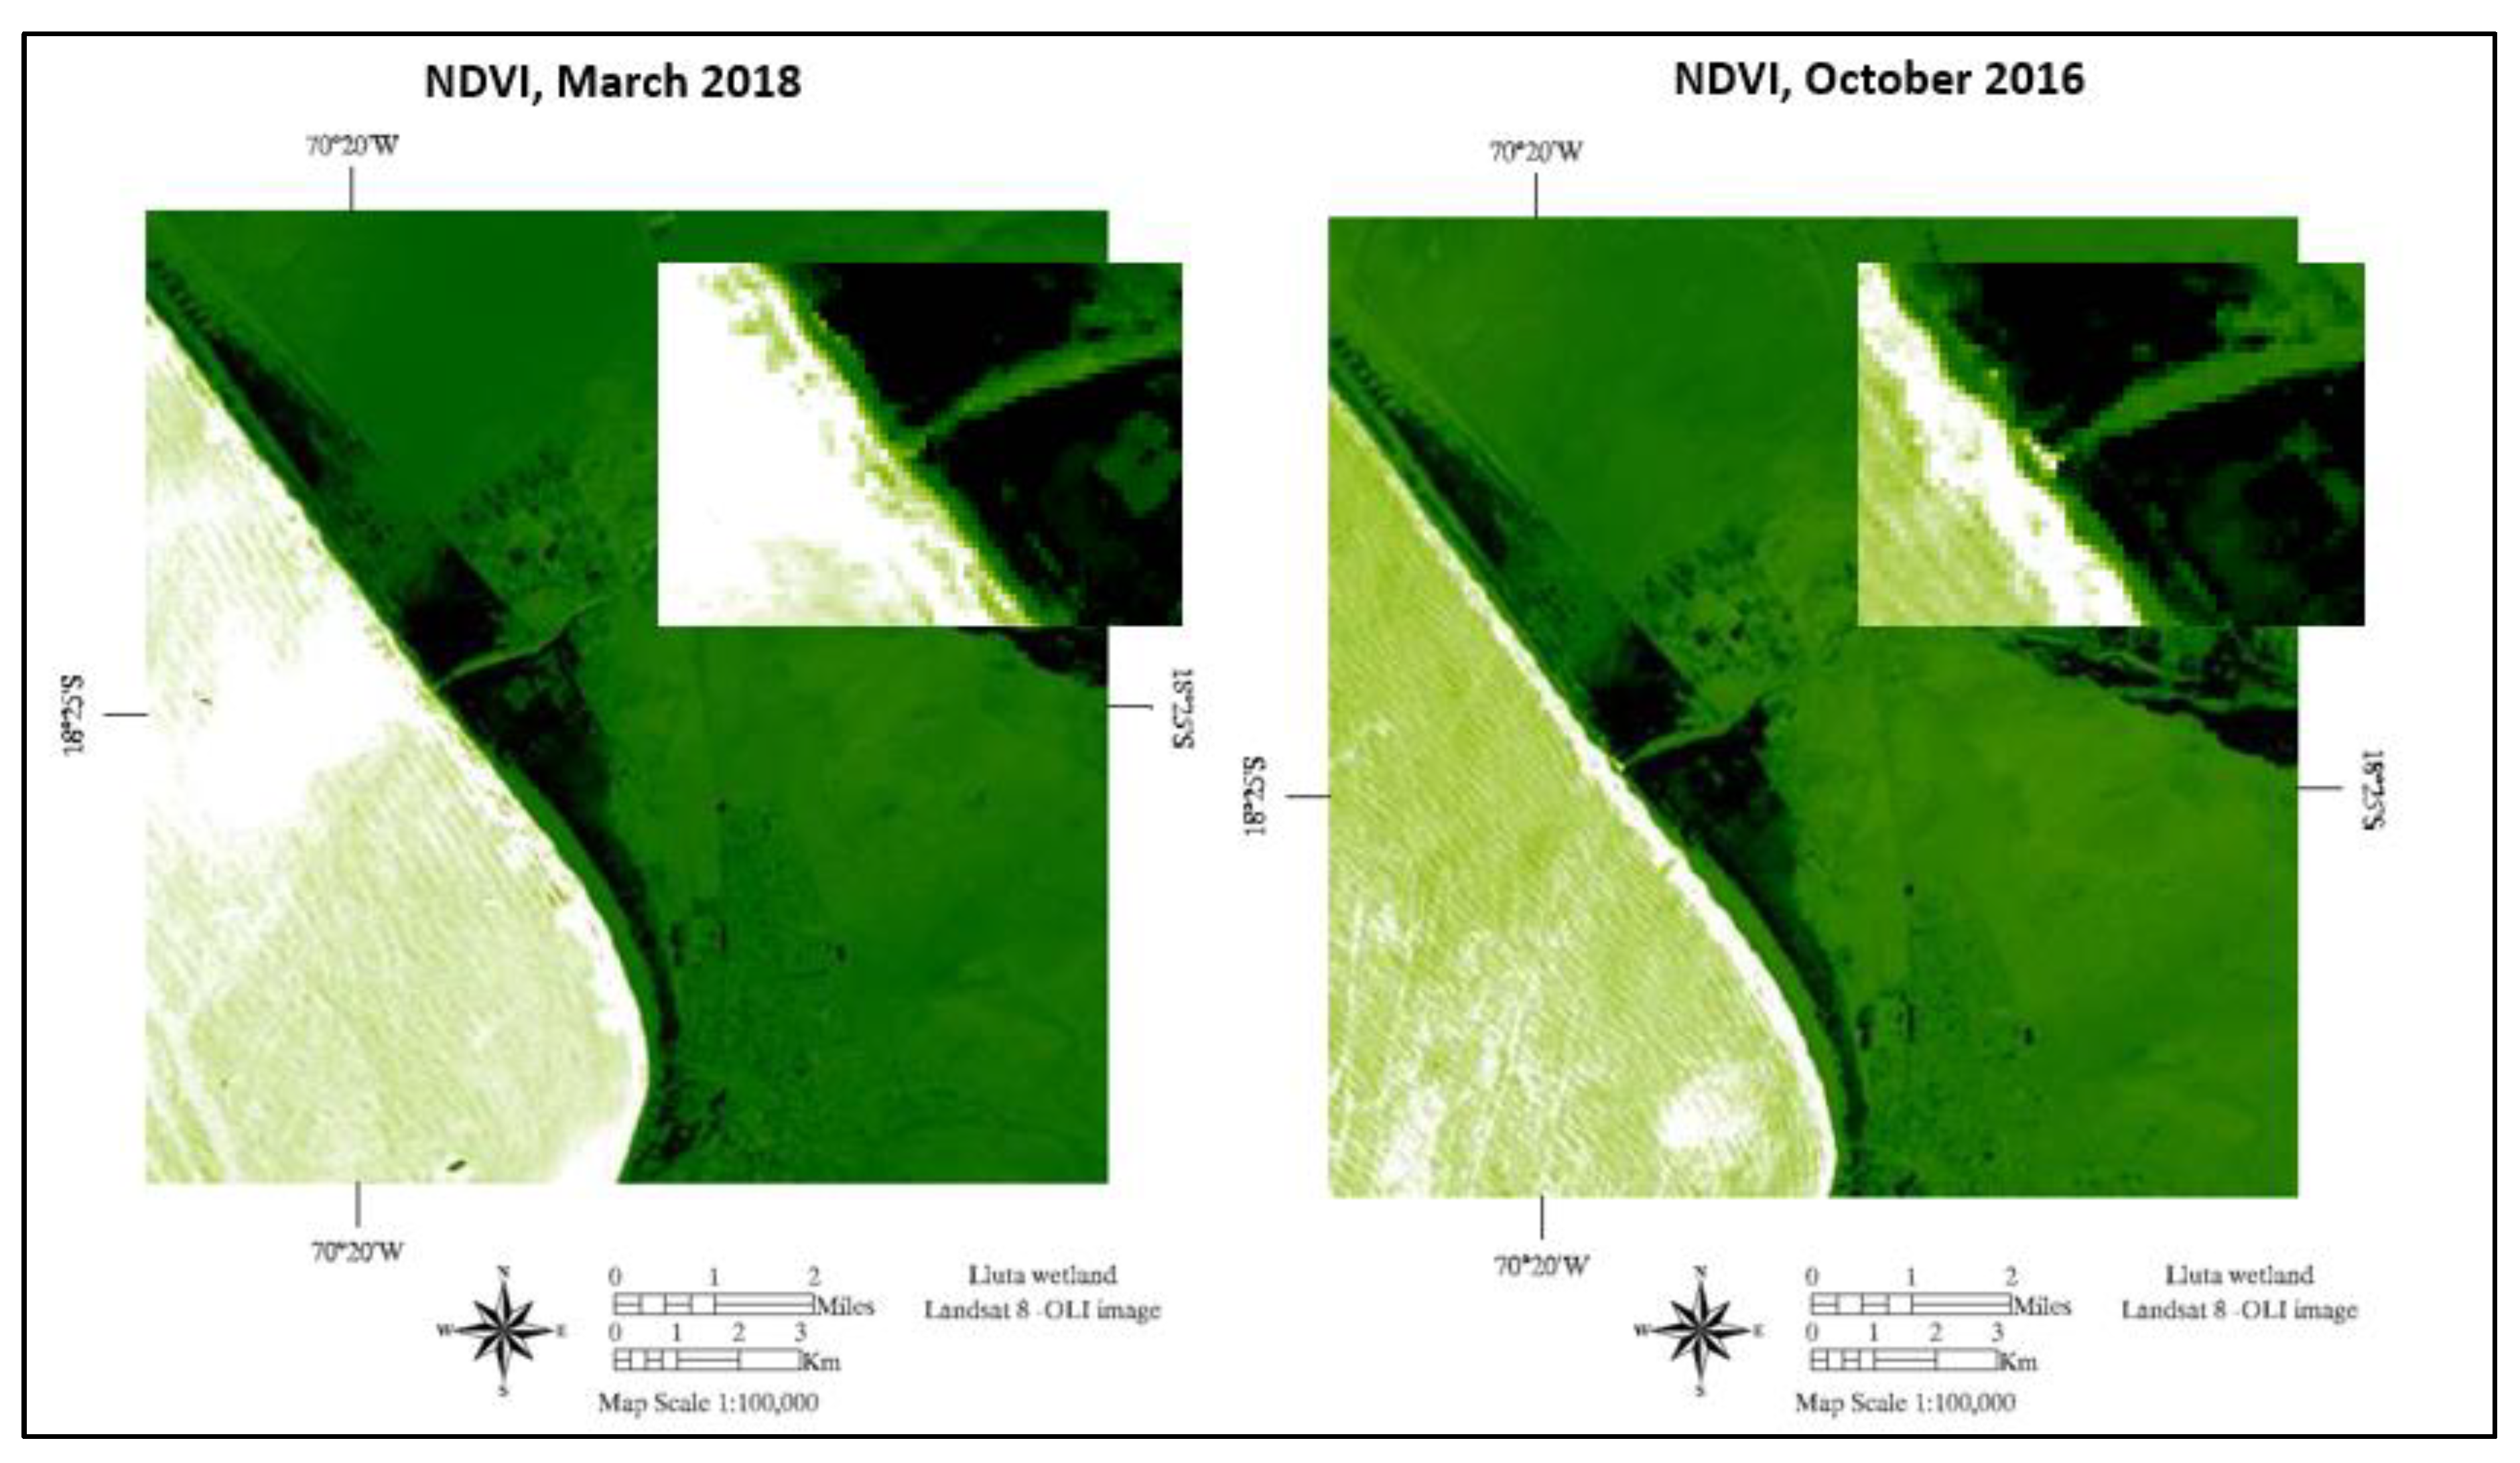
Regarding environmental variables, the amount of water in the wetland increased between January and March and reached its lowest level between October and December. While the vegetation cover (measured by NDVI) was higher between February and March and reached its lowest level in the months of October and November. Figure 3 shows the months in which the greatest variations in NDVI (lowest and highest) occurred during the study period.
The final multivariable model showed that IAV prevalence was positively associated with NDVI for the month of sampling and with the abundance of migratory birds (Table 2). The months in which 113 or more individuals belonging to migratory species were counted were associated with higher prevalence (OR=3.57, p<0.05). With respect to vegetation, the months in which NDVI values were equal to or greater than 0.27 were associated with higher prevalence (OR=3.65, p<0.05).
None of the variables included in “Meteorological data” category was retained in the final multivariable model.
IAVs isolated from wild birds in and hosts species

3.3. Subtype diversity and sequence analysis

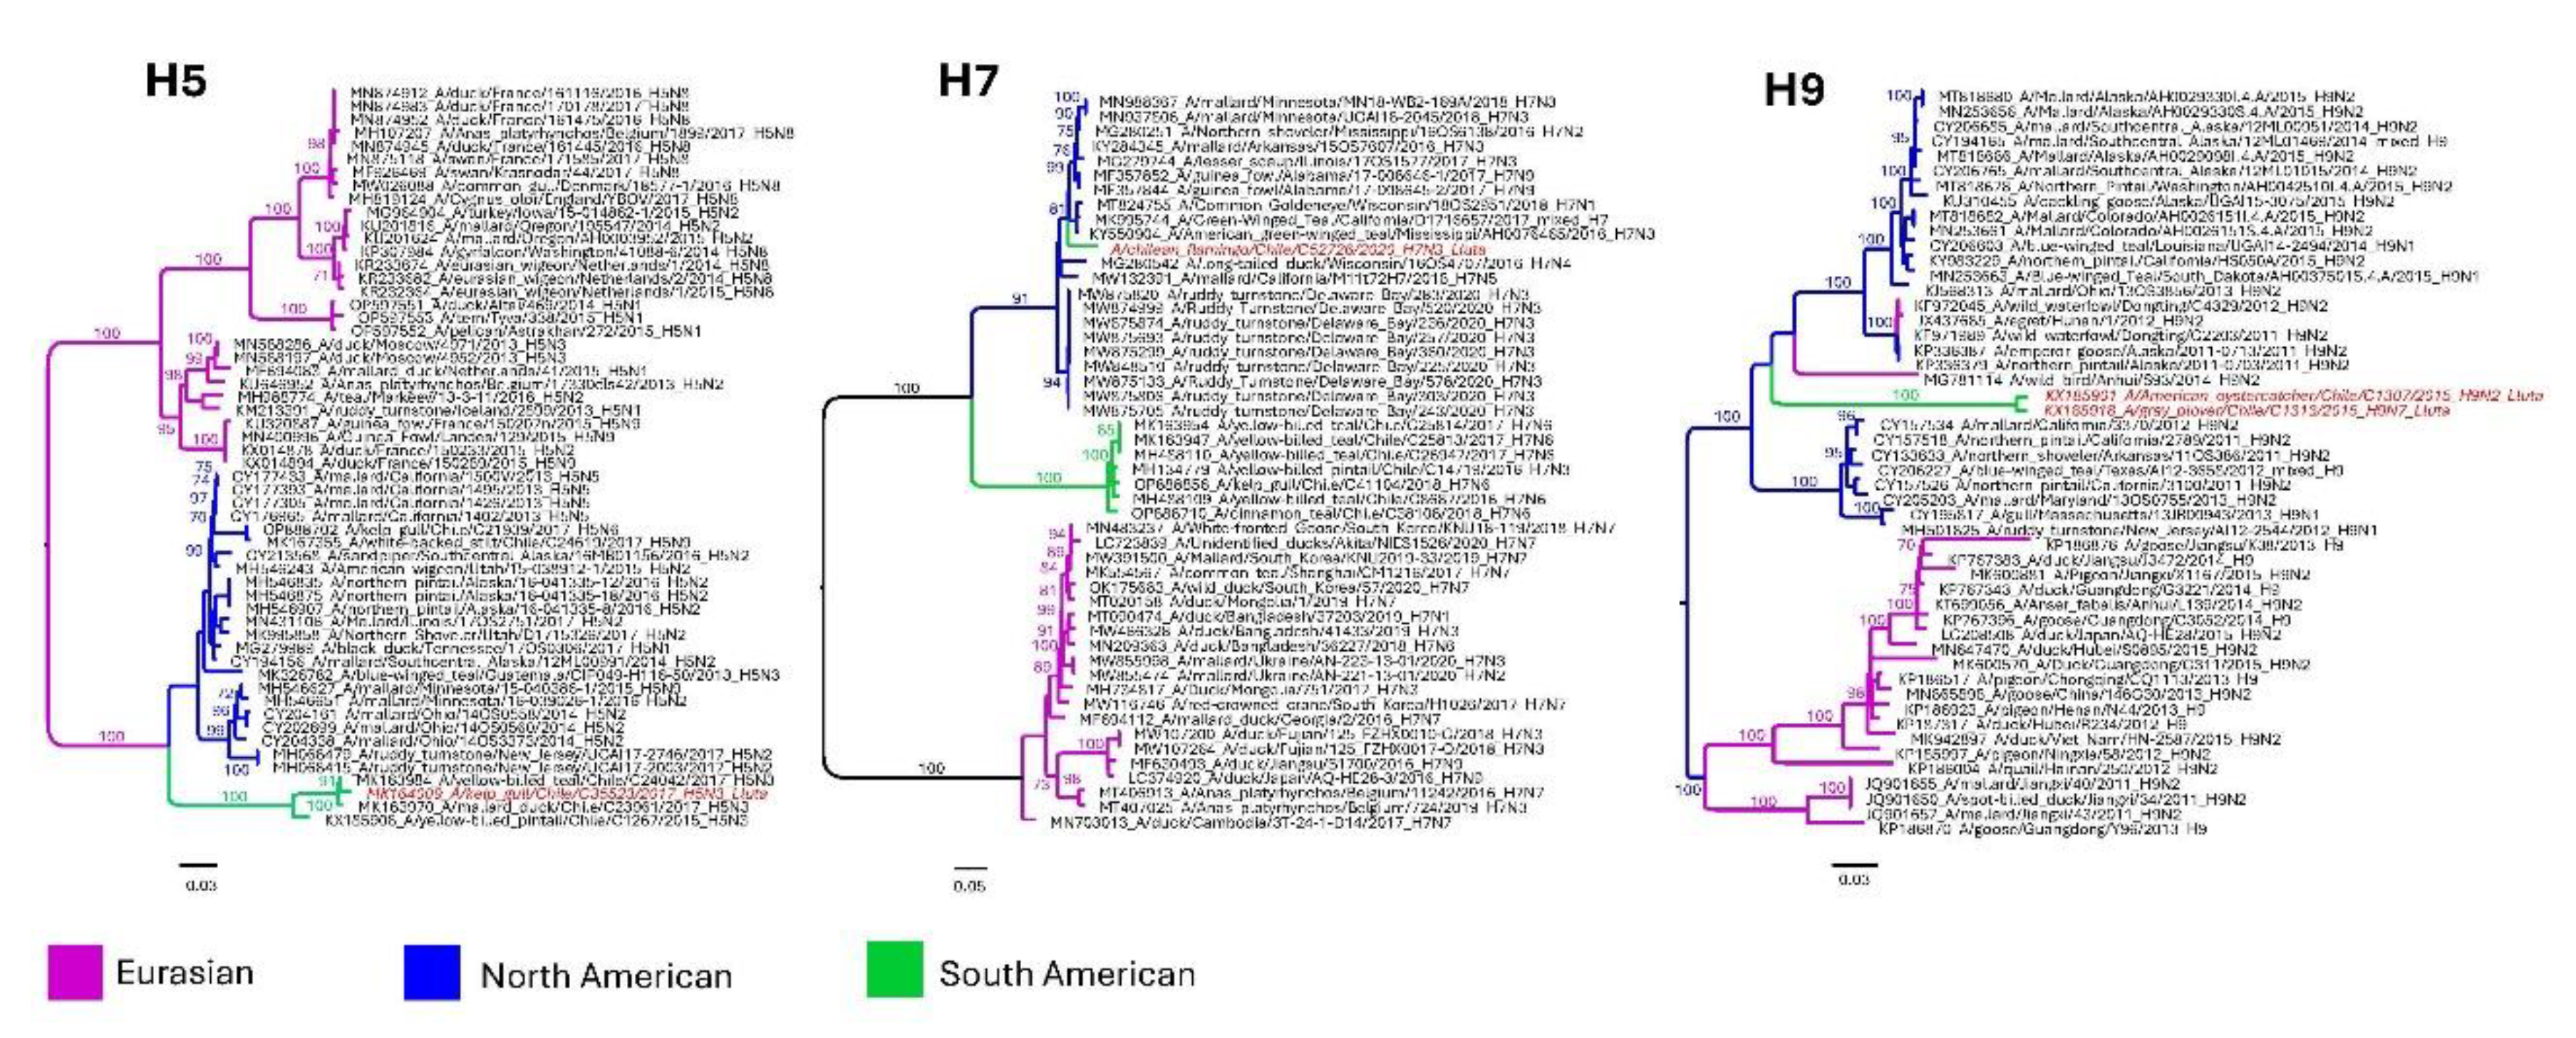
A wide diversity of hemagglutinin (HA) and neuraminidase (NA) subtypes were identified, and 10 viruses were isolated including low pathogenic H5 and H7 strains (Table 3). Six reservoir species were recognized, including Larus dominicanus (Kelp gull, n = 2), Haematopus palliatus (American oystercatcher, n=3), Haematopus ater (Blackish oystercatcher, n=1), Larus pipixcan (Franklin's gull, n=2), Pluvialis squatarola (Grey plover, n=1) and newly identified host Phoenicopterus chilensis (Chilean flamingo, n=1). All obtained viruses were LPAI by HA cleavage sequence analysis. Results of the phylogenetic analysis performed on H5, H7 and H9 hemagglutinins (Figure 4), revealed that the H5 hemagglutinin was most like other H5 hemagglutinins obtained in the central region of Chile between 2015 and 2017. Conversely, the H7 hemagglutinin belonged to the North American clade of viruses, with similar sequences obtained from birds belonging to the Mississippi and Pacific flyways. Additionally, H9 viruses did not form a distinct clade within the global H9 phylogeny but were closely related to each other and to other isolates obtained in North America.

4. Discussion

This study provides information on the prevalence of IAV and the environmental factors that could influence its occurrence in a wetland of great importance for IAV surveillance in Chile. In addition, this wetland has been a key site for surveillance of the current HPAI H5N1 2.3.4.4b outbreak that is affecting several countries in South America, being the site where the first positive case was detected in Chile in December 2022 [41,42]. Therefore, our results provide important considerations for structuring surveillance and early warning actions in a wetland that is the gateway to the viruses from North America.
The overall IAV prevalence identified at the Lluta wetland during the months sampled was 2.07% (95% CI: 1.68 -2.55), which is lower than that recorded in sites in the central zone of Chile during the same study period (4.28%) [11]. This could be due to the difference between the bird assemblages in both areas. While in Lluta wetland the predominant species correspond to shorebirds, in the wetlands of central Chile there are many resident ducks that have already been identified as primary hosts of IAV viruses [8] and may have an important role in the perpetuation of the virus throughout the year [11]. In another previously published study that included sampling in the Lluta wetland, the prevalence found was also higher (5.15%), however the aforementioned prevalence corresponds to a single sampling event [8].
Regarding subtype diversity and origins, this is the first time that a north American origin H7 virus has been found in the northern part of Chile, and its presence may have significant implications. Unlike the South American clade of H7 viruses, which has only been associated with HPAI in South America once [43], North American strains have been responsible for numerous outbreaks of HPAI [44,45]. On the other hand, the H5 and H9 HAs appear to be of South American origin, although further genomic surveillance is necessary to definitively establish their clade formation.
With respect to the ecological variables evaluated in this study, only the abundance of migratory birds was positively related to the prevalence of IAV at the site. None of the other variables in the "bird community" category (species richness and total bird abundance) showed statistical association with prevalence. This is probably because bird abundance also increased in months where prevalence was low (autumn and winter), due to large numbers of birds that are considered resident at the site, such as the Grey gull (Leucophaeus modestus). On the other hand, although species richness has been considered a factor influencing the prevalence of the virus in studies carried out in Spain [24,26], other studies around the world have found that bird density or the abundance of migratory species have a greater influence on the prevalence of AIV than bird richness [21,46,47], which is in agreement with the present results obtained in Lluta wetland.
The number of migratory birds in the Lluta River wetland increases considerably between October and March, with high densities at the site, and then almost disappears during the rest of the year. These species belong to the families Laridae, Scolopacidae and Charadriidae, which have been identified as important reservoirs of IAV [1,3]. Franklin's Gull (Leucophaeus pipixcan), Whimbrels (Numenius phaeopus) and Sanderling (Calidris alba) were the species with the highest number of individuals during the sampling period (Supplemental Table 1). In addition, it is important to highlight that 3 viral isolates in our study were found in migratory species, two in Franklin's gulls (H13N9) and one H9N7 subtype in a Grey plover (Pluvialis squatarola). Recent studies in Chile and Peru have already described the infection of IAV in Franklin's Gulls [8,48,49], Grey plover [8] and Whimbrels [8,9,50]. In one of these studies, which determined a wide diversity of IAVs in wetlands in Chile, it was also found that the viruses isolated in Lluta were the most genetically diverse, with segments of viruses from North American and South American lineages [8], confirming the thesis of the importance of migratory birds in the dissemination of IAV and in the emergence of new subtypes.
With respect to the meteorological variables evaluated in this study, none were significantly associated with IAV positivity to the virus in the wetland, although climatic variables such as temperature and precipitation have been described as important drivers of AIV in wild birds in other regions of the world [23,25,51,52]. This could be explained mainly because climatic conditions in the wetland are stable throughout the year. Precipitation in the area is almost non-existent and the average annual temperature is around 18°C [20]. The same is observed in wetlands in tropical Africa, where climatic factors were poorly related to IAV prevalence in wild birds, but host ecological factors (such as bird density in wetlands and the arrival of migrants from Eurasia) played a much more important role [21]. This highlights the relevance of conducting studies that include environmental factors in a local context.
Regarding landscape variables, vegetative coverage in the sampling month (measured by NDVI) was positively associated with the prevalence of IAV in the wetland. During the study period, NDVI values fluctuated between 0.18 and 0.31, which is related to the presence of shrub and herbaceous vegetation [53] consisting mainly of communities of horsetail, chilca shrubs, salt grass and reed [18]. The months in which NDVI values were equal to or greater than 0.27 were associated with higher prevalence. These results are similar to those found in Europe, where vegetation surrounding wetlands has been recognized as an important driver in the presentation dynamics of the IAV [24,25], because wild birds are impacted by the availability of food resources and shelter provided by a wetland. Higher NDVI may indicate the presence of better vegetative food resources and shelter, favoring a higher concentration of birds and therefore a higher risk of pathogen transmission [24,54]. In another study conducted in the Poyang Lake wetland in China, it was determined that there is a positive correlation coefficient between NDVI and the number of birds present in the wetland, especially migratory birds [54]. In Lluta wetland, NDVI reaches its maximum between October and March. These months coincide with the arrival of migratory birds from the northern hemisphere and with a greater growth of vegetation in spring, which extends into the summer mainly due to the increase in the flow of the Lluta River due to the “highland winter” rains (December to March).
With respect to water size, this variable was not significant in the prevalence of AIV in the Lluta wetland. These results were different from those found in central Chile where the extreme variations in the water body size experienced by the wetlands during summer months directly affect the congregation of birds and therefore the dynamics of infection of the IAV [11]. During the study period, the Lluta wetland did not show significant variations in the surface area flooded by water. Only during January 2018 was a larger area of water observed in the wetland compared to the other months sampled. However, because the area of the wetland that is flooded with water is relatively small (during the sampling months it fluctuated between 0.5 and 2 ha), the concentration of hosts in those areas, especially during the times of migrant arrivals, generates high densities of individuals favoring the increase in prevalence at the site due to density-dependent transmission of the agent. This is similar to what is observed in wetlands in tropical Africa [55].
With respect to the IAV host species identified, in addition to the two migratory species mentioned above, IAV isolates were found in American and blackish oystercatcher (Haematopus palliates, Haematopus ater), in Kelp gull (Larus dominicanus) and a Chilean flamingo (Phoenicopterus chilensis). Although the first three species have already been described as hosts in other studies in Chile and South America [8,9,10,56,57], this is the first time that VIA has been isolated in a Chilean flamingo. This species corresponds to a neotropical migrant that is widely distributed throughout South America, even reaching the Atlantic coast [58]. Therefore, it may be an important species for the spread of IAV between South American countries.

5. Conclusion

Our results demonstrate that there is a wide circulation of IAV in wild birds of the Lluta river wetland and a wide range of different influenza subtypes present in the bird populations, including ones considered as “high-risk”. However, additional long-term studies are needed to include other host-related variables (such as age structure of the population and density of individuals) and to evaluate whether there is a seasonal pattern of prevalence in this wetland. Because sampling was conducted at irregular intervals, it was not possible to determine a seasonal pattern in this prevalence. However, due to the epidemiological importance of this wetland for IAV surveillance in Chile, it would be beneficial to extend this long-term longitudinal study, including a greater number of samples at regular intervals, to determine whether there is a seasonal pattern in the prevalence of the virus at the site. This would allow a better evaluation of the risk associated with the transmission of the virus from wildlife reservoirs to domestic birds, improving surveillance programs and directing sampling efforts towards seasons that are more favorable for the maintenance and transmission of the virus.

Funding

This research project was financed by the National Institute of Allergy and Infectious Diseases grant HHSN272201400006C and 75N93021C00016 to SSC., Fondecyt grant 1191747 to CHW and Fondecyt grant 11190755 to PJB.

Institutional Review Board Statement

The animal study protocol was approved by Institutional Animal Care and Use Committee (CICUA) of the University of Chile 19265-VET-UCH.

Data Availability Statement

The data presented in this study are available on request from the corresponding author.

Acknowledgment

We would like to thank the Municipality of Arica for giving us unrestricted access to the Lluta wetland and for logistical support during sampling.

Conflicts of Interest

The authors declare no conflict of interest.

References

  1. Olsen, B., et al., Global patterns of influenza A virus in wild birds. science, 2006. 312(5772): p. 384-388.
  2. Webster, R. and D. Hulse, Microbial adaptation and change: avian influenza. Revue Scientifique et Technique-Office International des Epizooties, 2004. 23(2): p. 453-466.
  3. Webster, R.G., et al., Evolution and ecology of influenza A viruses. Microbiological reviews, 1992. 56(1): p. 152-179.
  4. Lee, D.-H., et al., Intercontinental spread of Asian-origin H5N8 to North America through Beringia by migratory birds. Journal of virology, 2015. 89(12): p. 6521-6524.
  5. Hesterberg, U., et al., Avian influenza surveillance in wild birds in the European Union in 2006. Influenza and Other Respiratory Viruses, 2009. 3(1): p. 1-14.
  6. Hoye, B.J., et al., Surveillance of wild birds for avian influenza virus. Emerging infectious diseases, 2010. 16(12): p. 1827.
  7. Munster, V. and R. Fouchier, Avian influenza virus: of virus and bird ecology. Vaccine, 2009. 27(45): p. 6340-6344.
  8. Jiménez-Bluhm, P., et al., Wild birds in Chile Harbor diverse avian influenza A viruses. Emerging microbes & infections, 2018. 7(1): p. 1-4.
  9. Nelson, M.I., et al., The genetic diversity of influenza A viruses in wild birds in Peru. PloS one, 2016. 11(1): p. e0146059.
  10. Rimondi, A., et al., Evidence of a fixed internal gene constellation in influenza A viruses isolated from wild birds in Argentina (2006–2016). Emerging microbes & infections, 2018. 7(1): p. 1-13.
  11. Ruiz, S., et al., Temporal dynamics and the influence of environmental variables on the prevalence of avian influenza virus in main wetlands in central Chile. Transboundary and emerging diseases, 2021. 68(3): p. 1601-1614.
  12. Xu, K., et al., Isolation and characterization of an H9N2 influenza virus isolated in Argentina. Virus research, 2012. 168(1-2): p. 41-47.
  13. García-Walther, J., et al., Atlas de las aves playeras de Chile: Sitios importantes para su conservación. Santiago: Universidad Santo Tomás, 2017.
  14. Bravo-Vasquez, N., et al., Presence of influenza viruses in backyard poultry and swine in El Yali wetland, Chile. Preventive veterinary medicine, 2016. 134: p. 211-215.
  15. Jimenez-Bluhm, P., et al., Low pathogenic avian influenza (H7N6) virus causing an outbreak in commercial Turkey farms in Chile. Emerging microbes & infections, 2019. 8(1): p. 479-485.
  16. Jimenez-Bluhm, P., et al., Circulation of influenza in backyard productive systems in central Chile and evidence of spillover from wild birds. Preventive veterinary medicine, 2018. 153: p. 1-6.
  17. Muñoz-Pedreros, A. and C. Merino, Diversity of aquatic bird species in a wetland complex in southern Chile. Journal of Natural History, 2014. 48(23-24): p. 1453-1465.
  18. Sielfeld, W., et al., Coastal Wetlands of Northern Chile, in The Ecology and Natural History of Chilean Saltmarshes. 2017, Springer. p. 105-167.
  19. Navarro, N., et al., The Arid Coastal Wetlands of Northern Chile: Towards an Integrated Management of Highly Threatened Systems. Journal of Marine Science and Engineering, 2021. 9(9): p. 948.
  20. Peredo, R., La Desembocadura del Río Lluta: un humedal para las aves, en el desierto costero de Chile. 2007.
  21. Gaidet, N., et al., Understanding the ecological drivers of avian influenza virus infection in wildfowl: a continental-scale study across Africa. Proceedings of the Royal Society B: Biological Sciences, 2012. 279(1731): p. 1131-1141.
  22. Cumming, G.S., et al., A social–ecological approach to landscape epidemiology: geographic variation and avian influenza. Landscape Ecology, 2015. 30(6): p. 963-985.
  23. Ferenczi, M., et al., Avian influenza infection dynamics under variable climatic conditions, viral prevalence is rainfall driven in waterfowl from temperate, south-east Australia. Veterinary research, 2016. 47(1): p. 1-12.
  24. Pérez-Ramírez, E., et al., Ecological factors driving avian influenza virus dynamics in Spanish wetland ecosystems. PLoS One, 2012. 7(11): p. e46418.
  25. Si, Y., et al., Environmental factors influencing the spread of the highly pathogenic avian influenza H5N1 virus in wild birds in Europe. Ecology and Society, 2010. 15(3).
  26. Torrontegi, O., et al., Long-term avian influenza virus epidemiology in a small Spanish wetland ecosystem is driven by the breeding Anseriformes community. Veterinary research, 2019. 50(1): p. 1-12.
  27. Dohoo, I.R., W. Martin, and H.E. Stryhn, Veterinary epidemiologic research. 2003, Charlottetown, P.E.I.: University of Prince Edward Island.
  28. Organization, W.H., CDC protocol of realtime RTPCR for swine influenza A (H1N1), in CDC protocol of realtime RTPCR for swine influenza A (H1N1). 2009, World Health Organization (WHO).
  29. Shu, B., et al., Design and performance of the CDC real-time reverse transcriptase PCR swine flu panel for detection of 2009 A (H1N1) pandemic influenza virus. Journal of clinical microbiology, 2011. 49(7): p. 2614-2619.
  30. Moresco, K.A., D.E. Stallknecht, and D.E. Swayne, Evaluation and attempted optimization of avian embryos and cell culture methods for efficient isolation and propagation of low pathogenicity avian influenza viruses. Avian diseases, 2010. 54(s1): p. 622-626.
  31. Cheung, P.P., et al., Identifying the species-origin of faecal droppings used for avian influenza virus surveillance in wild-birds. Journal of clinical virology, 2009. 46(1): p. 90-93.
  32. Kaplan, B.S., et al., Novel highly pathogenic avian A (H5N2) and A (H5N8) influenza viruses of clade 2.3. 4.4 from North America have limited capacity for replication and transmission in mammals. Msphere, 2016. 1(2): p. e00003-16.
  33. Prjibelski, A., et al., Using SPAdes de novo assembler. Current protocols in bioinformatics, 2020. 70(1): p. e102.
  34. Bao, Y., et al., The influenza virus resource at the National Center for Biotechnology Information. Journal of virology, 2008. 82(2): p. 596-601.
  35. Hall, T.A. BioEdit: a user-friendly biological sequence alignment editor and analysis program for Windows 95/98/NT. in Nucleic acids symposium series. 1999. [London]: Information Retrieval Ltd., c1979-c2000.
  36. Edgar, R.C., MUSCLE: multiple sequence alignment with high accuracy and high throughput. Nucleic acids research, 2004. 32(5): p. 1792-1797.
  37. Jones, P., et al., InterProScan 5: genome-scale protein function classification. Bioinformatics, 2014. 30(9): p. 1236-1240.
  38. Rouse Jr, J.W., et al., Monitoring the vernal advancement and retrogradation (green wave effect) of natural vegetation. 1973.
  39. Xu, H., Modification of normalised difference water index (NDWI) to enhance open water features in remotely sensed imagery. International journal of remote sensing, 2006. 27(14): p. 3025-3033.
  40. Team, R.C., R: A language and environment for statistical computing; 2018. 2018.
  41. EMPRES-i, F. Diseases. 2022; Available from: https://empres-i.apps.fao.org/diseases.
  42. WAHIS. Sistema Mundial de Información Zoosanitaria. 2022; Available from: https://wahis.woah.org/#/home.
  43. Jones, Y.L. and D.E. Swayne, Comparative pathobiology of low and high pathogenicity H7N3 Chilean avian influenza viruses in chickens. Avian Diseases, 2004. 48(1): p. 119-128.
  44. Youk, S., et al., Evolution of the North American Lineage H7 Avian Influenza Viruses in Association with H7 Virus’s Introduction to Poultry. Journal of Virology, 2022. 96(14): p. e00278-22.
  45. Dietze, K., et al., From low to high pathogenicity—Characterization of H7N7 avian influenza viruses in two epidemiologically linked outbreaks. Transboundary and Emerging Diseases, 2018. 65(6): p. 1576-1587.
  46. Caron, A., et al., Persistence of low pathogenic avian influenza virus in waterfowl in a Southern African ecosystem. EcoHealth, 2011. 8(1): p. 109-115.
  47. Van Dijk, J.G., et al., Juveniles and migrants as drivers for seasonal epizootics of avian influenza virus. Journal of Animal Ecology, 2014. 83(1): p. 266-275.
  48. Di Pillo, F., et al., Novel Low Pathogenic Avian Influenza H6N1 in Backyard Chicken in Easter Island (Rapa Nui), Chilean Polynesia. Viruses, 2022. 14(4): p. 718.
  49. Mathieu, C., et al., Avian influenza in wild birds from Chile, 2007–2009. Virus research, 2015. 199: p. 42-45.
  50. Ghersi, B.M., et al., Avian influenza in wild birds, central coast of Peru. Emerging infectious diseases, 2009. 15(6): p. 935.
  51. Farnsworth, M.L., et al., Environmental and demographic determinants of avian influenza viruses in waterfowl across the contiguous United States. PLoS One, 2012. 7(3): p. e32729.
  52. Fuller, T., et al., Seasonality dynamics of avian influenza occurrences in Central and West Africa. bioRxiv, 2014: p. 007740.
  53. Ashok, A., H.P. Rani, and K. Jayakumar, Monitoring of dynamic wetland changes using NDVI and NDWI based landsat imagery. Remote Sensing Applications: Society and Environment, 2021. 23: p. 100547.
  54. Wu, X., et al., Normalized difference vegetation index dynamic and spatiotemporal distribution of migratory birds in the Poyang Lake wetland, China. Ecological indicators, 2014. 47: p. 219-230.
  55. Gaidet, N., Ecology of avian influenza virus in wild birds in tropical Africa. Avian diseases, 2016. 60(1s): p. 296-301.
  56. Mathieu, C., et al., Pandemic (H1N1) 2009 in breeding turkeys, Valparaiso, Chile. Emerging infectious diseases, 2010. 16(4): p. 709.
  57. Pereda, A.J., et al., Avian influenza virus isolated in wild waterfowl in Argentina: evidence of a potentially unique phylogenetic lineage in South America. Virology, 2008. 378(2): p. 363-370.
  58. Sullivan, B.L., et al., eBird: A citizen-based bird observation network in the biological sciences. Biological conservation, 2009. 142(10): p. 2282-2292.
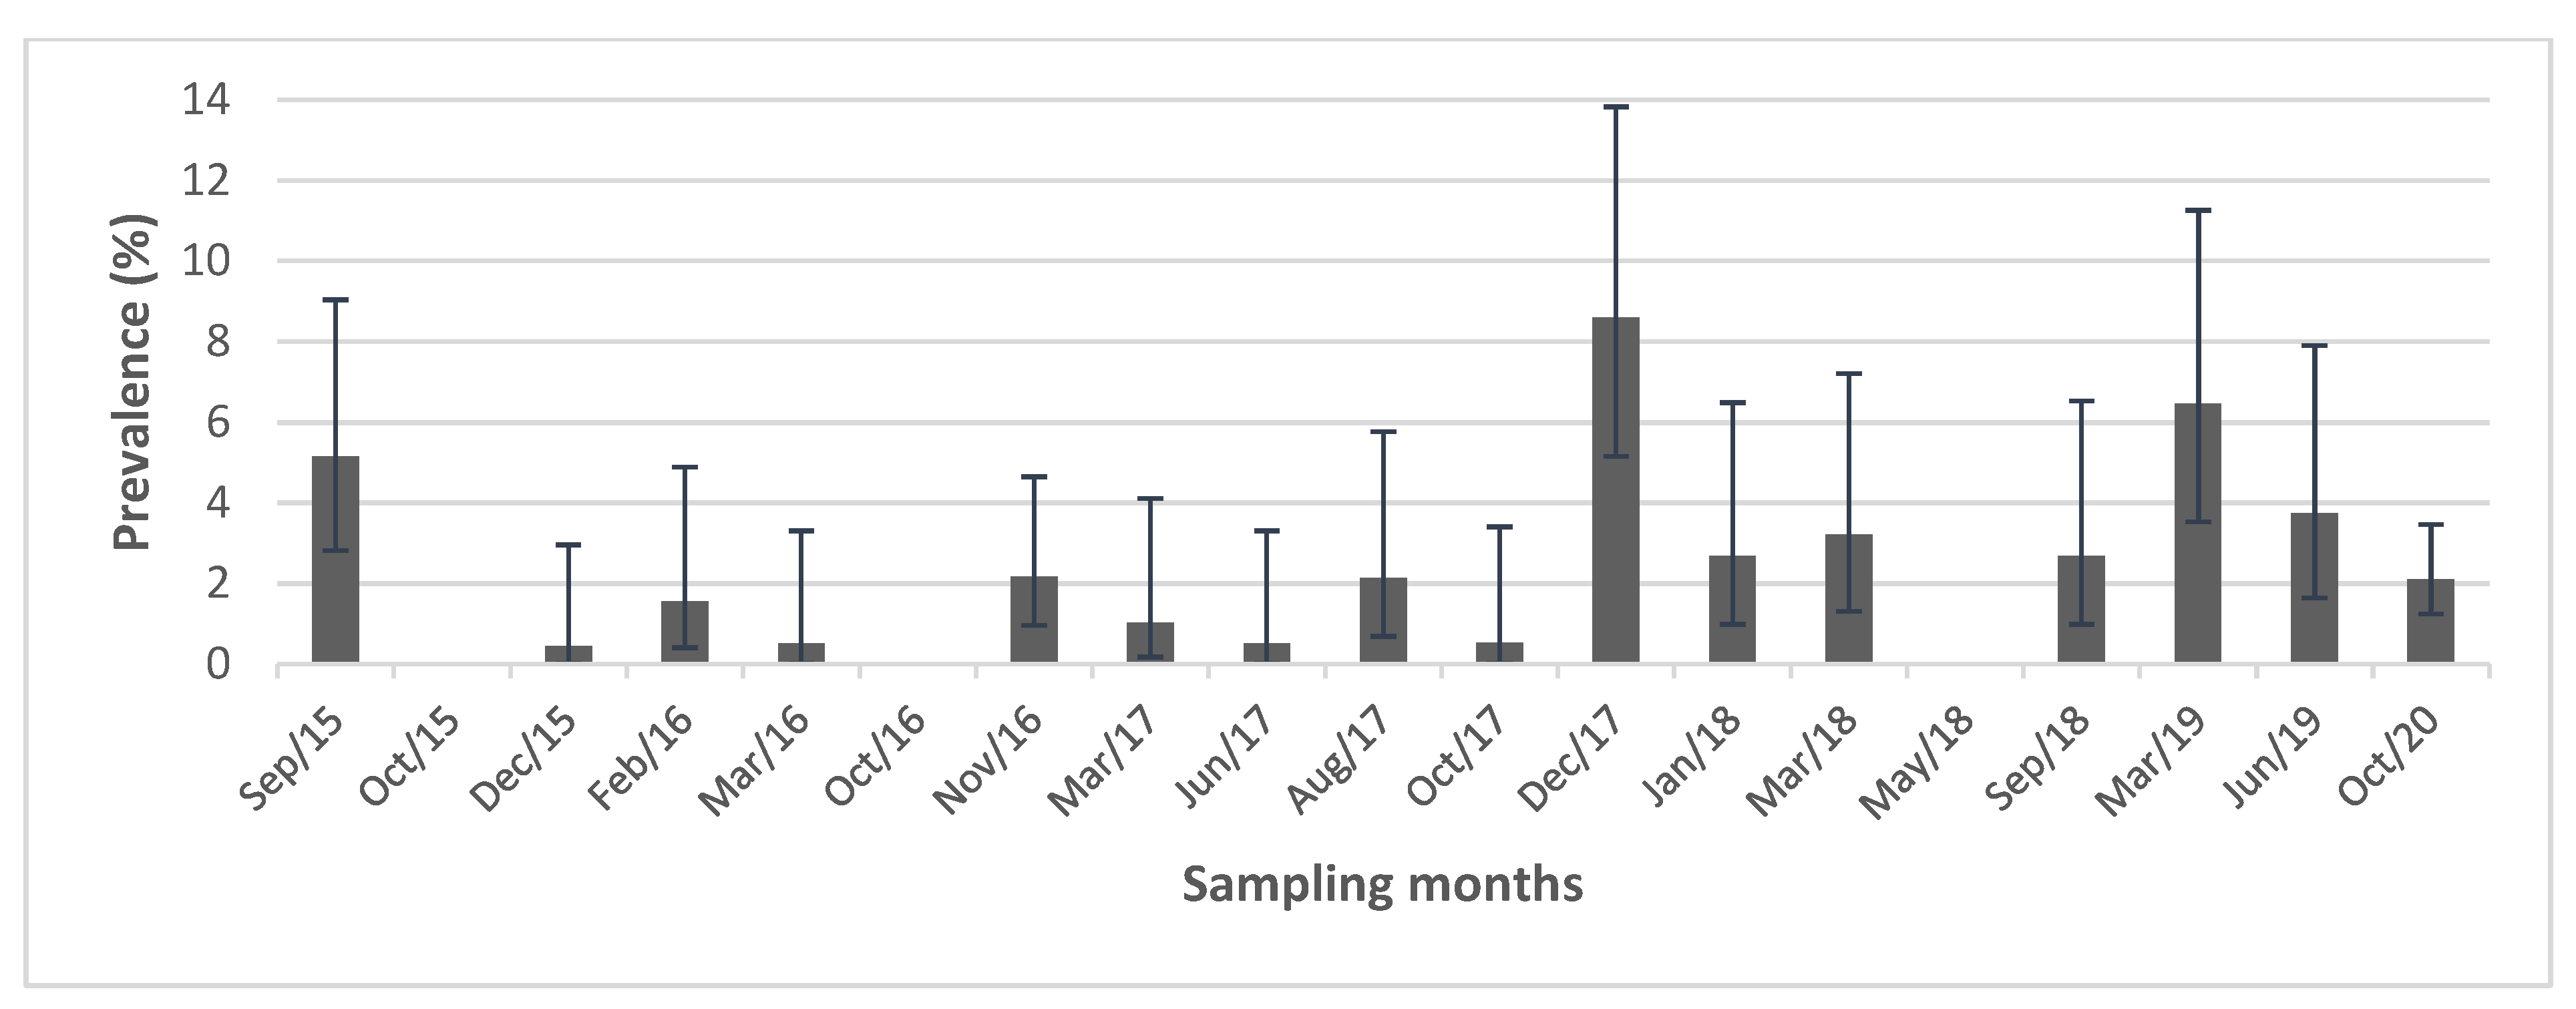
Figure 1. Prevalence (95% CI) of influenza A virus in the Lluta wetland during the sampling months.
Preprints 72610 g001
Figure 2. Total number of birds counted (A) and species richness (B) identified during the sampling months in the Lluta River wetland.
Preprints 72610 g002
Figure 3. NDVI images in Lluta wetland in the months of highest (March 2018) and lowest (October 2016) vegetation cover values during the study period.
Preprints 72610 g003
Figure 4. Maximum-likelihood phylogenetic analysis of the hemagglutinins H5, H7 and H9. North American clade in green, Eurasian clade in Purple and South American clade in green. Study sequences in red and italic. Bootstrap support >70% indicated.
Preprints 72610 g004
Table 1. Definition of ecological and environmental variables.
Variables Definition


Wild bird community
Total abundance Total number of birds present at the time of sampling
Species richness Number of species present at the time of sampling
Abundance of migrants Number of migratory birds present at the time of sampling

Landscape

Vegetation coverage
Mean NDVI for the month of sampling, one month before, two months before and three months before sampling.

Water body size (km2)
Water body size for the month of sampling, one month before, two months before and three months before sampling.


Meteorological data

Maximum monthly temperature (°C)
Monthly mean of maximum daily temperature for the month of sampling, one month before, two months before and three months before sampling.
Minimum monthly temperature (°C) Monthly mean of minimum daily temperature for the month of sampling, one month before, two months before and three months before sampling.
Total monthly rainfall (mm) Total rainfall at the month of sampling, one month before, two months before and three months before sampling.
Humidity (%) Relative air humidity at the month of sampling, one month before, two months before and three months before sampling.
Table 2. Multivariable model results of the association between IAV prevalence and environmental variables.
Variables Categories Estimate p-value OR 95% CI
(Intercept) -5.5872 <0.001 0.003 (0.001-0.01)
NDVI Low (< 0.27) Reference
High (≥ 0.27) 1.2949 0.00230 3.65 (1.58-8.39)
Abundance of Migrants Low (< 113) Reference
High (≥ 113) 1.2727 0.00733 3.57 (1.41- 9.05)
Table 3. IAV Strain name by year, subtypes, host species and GenBank accession of IAVs identified in the Lluta River wetland between September 2015 and October 2020.
Strain name Year Isolate Subtype Hot species Order Accession Number
A/American oystercatcher/Chile/C1307/2015 (H9N2) 2015 H9N2 Haematopus palliatus Charadriiformes KX185901
A/Grey plover/Chile/C1313/2015 (H9N7) 2015 H9N7 Pluvialis squatarola Charadriiformes KX185918
A/American oystercatcher/Chile/C17359/2016 (H3N8) 2016 H3N8 Haematopus palliatus Charadriiformes MH499035
A/American oystercatcher/Chile/C17400/2016 (H3N8) 2016 H3N8 Haematopus palliatus Charadriiformes MH498968
A/Franklin’s gull/Chile/C17421/2016 (H13N9) 2016 H13N9 Larus pipixcan Charadriiformes MH498978
A/Franklin’s gull/Chile/C17422/2016 (H13N9) 2016 H13N9 Larus pipixcan Charadriiformes MH499057
A/Kelp gull/Chile/C27733/2017 (H13N8) 2017 H13N8 Larus dominicanus Charadriiformes MH499142
A/Kelp gull/Chile/C35523/2017 (H5N3) 2017 H5N3 Larus dominicanus Charadriiformes MK164009
A/blackish oystercatcher/Chile/C40194/2018 (H13N2) 2018 H13N2 Haematopus ater Charadriiformes OP888556
A/Chilean flamingo/Chile/C52796/2020(H7N9) 2020 H7N3 Phoenicopterus chilensis Phoenicopteriformes OQ820949
Disclaimer/Publisher’s Note: The statements, opinions and data contained in all publications are solely those of the individual author(s) and contributor(s) and not of MDPI and/or the editor(s). MDPI and/or the editor(s) disclaim responsibility for any injury to people or property resulting from any ideas, methods, instructions or products referred to in the content.
Copyright: This open access article is published under a Creative Commons CC BY 4.0 license, which permit the free download, distribution, and reuse, provided that the author and preprint are cited in any reuse.
Prerpints.org logo

Preprints.org is a free preprint server supported by MDPI in Basel, Switzerland.

Subscribe

© 2024 MDPI (Basel, Switzerland) unless otherwise stated