Preprint
Article

Triggering RNA Interference by Photoreduction under Red Light Irradiation

Altmetrics

Downloads

104

Views

27

Comments

0

A peer-reviewed article of this preprint also exists.

This version is not peer-reviewed

Submitted:

03 May 2023

Posted:

04 May 2023

You are already at the latest version

Alerts
Abstract
RNA interference (RNAi) using small interfering RNAs (siRNAs) is a powerful tool to target any protein of interest and is becoming more implementable for in vivo applications due to recent developments in RNA delivery systems. To exploit RNAi for cancer treatment, it is expedient to increase its selectivity by e.g. a prodrug approach to activate the siRNAs upon external triggering, e.g. by using light. Red light is especially well suitable for in vivo applications due to its low toxicity and higher tissue penetration. Known molecular (not nanoparticle based) red light activatable siRNA prodrugs rely on singlet oxygen (1O2) mediated chemistry. 1O2 is highly cytotoxic. Additionally one of the side products in the activation of the known siRNA prodrugs is anthraquinone, which is also toxic. We here report on an improved red light activatable siRNA prodrug, which do not require 1O2 for their activation. The 5’ terminus of its antisense strand is protected with an electron-rich azobenzene promoiety. It gets reduced and cleaved upon red light exposure in the presence of Sn(IV)(pyropheophorbide a)dichloride acting as a catalyst and ascorbate required as a bulk reducing agent producing active siRNAs.
Keywords: 
Subject: Chemistry and Materials Science  -   Medicinal Chemistry

1. Introduction

Due to recent developments in in vivo oligonucleotide delivery systems, RNA-based therapeutic approaches are becoming more and more enticing. Hence, next to e.g. RNA-based vaccines, five silencing RNA (siRNA) drugs have been clinically approved (patisiran, givosiran, lumasiran, inclisiran, and vutrisiran) that act via the mechanism of RNA interference (RNAi) to downregulate specific genes [1-5]. All five siRNA drugs on the market treat metabolic or neurodegenerative diseases. As an alternative application, targeting cancer cells by downregulation of genes that are essential for e.g. mitosis would be attractive as well. In that way, also proteins that are considered undruggable could be targeted. However, similar to small molecular drug approaches, the mere targeting of mitosis and thus fast dividing cells, results in dose-limiting side effects concerning non-cancerous cells that rely on fast proliferation, resulting in myelosuppression, cytopenia, hepatotoxicity, etc. One possible solution to increase cancer selectivity is the application of prodrugs that get activated in a specific cancer microenvironment or upon an external trigger. Accordingly, few examples of siRNA prodrugs have been reported [6-8]. Following this approach we have already developed ROS-responsive siRNAs that get activated by elevated H2O2 concentrations [9], a hallmark of many cancers [10]. In addition, we reported on red light-responsive siRNAs (Figure 1), in which the passenger strand is modified with a photosensitizer that generates 1O2 upon red-light irradiation. The on-demand generated 1O2 cleaves the 9-anthracenyl promoiety on the antisense strand, yielding the active siRNA. While, the activation is efficient, side effects by these harsh oxidative conditions are to be expected, especially for in vivo applications. That can be one of the reasons why this system has never been applied in vivo. In search of alternative promoieties, which are not activated under strong oxidative conditions, we explored azobenzenes. The application of azobenzene triggers in a biological context comes with some challenges, as two distinct processes can be initiated, the first one being photoisomerization and the second one being reduction. Photoisomerization of azobenzenes is in most cases triggered by UV light, which is toxic to cells and does not show significant tissue penetration. Nevertheless, some stable azobenzenes were successfully applied in living cells or in vivo to activate certain processes (e.g. disassembly of complex biomolecules) by photoswitching to the cis isomer [11-13]. Exploiting the second process, few approaches have also been developed towards reducible azobenzenes, e.g., as sensors of hypoxia [14, 15]. For this study, we aimed for a stable azobenzene moiety to avoid unspecific intracellular reduction of the siRNA prodrug. However, upon external trigger, the promoiety should be reduced efficiently. We, therefore, selected electron-rich azobenzene “RF” (Scheme 1), which was shown to be non-cleavable under conditions mimicking the cellular environment [16]. We hoped that this residue still will be photo reducible in the presence of previously reported photocatalysts Sn(IV)(pyropheophorbide a)dichloride (SnPPA) [16]. SnPPA could mediate the photoreduction by electron transfer to cleave the azobenzene moiety and thus activate the siRNA prodrug (Figure 1).
In preliminary tests, an RF-DNA model strand (DNA 1) was synthesized, characterized, and its stability in the presence of various potentially reactive molecules found in the intracellular environment (H2O2, NaSH, KO2, sodium ascorbate) was confirmed. In contrast, we observed that DNA 1 is indeed activated upon irradiation with red light in the presence of photosensitizer SnPPA and ascorbate as an electron source. Next, the RF-RNA guide strand (RNA 2) was synthesized and its similar to DNA 1 behavior was confirmed in cell-free settings. Finally, the corresponding siRNA prodrug (RNA 2/3) was assembled. As gene target, KIF11 was chosen because it is an essential gene for mitosis that is overexpressed in some cancers, making it a promising target for cancer treatment [17]. We investigated the RNAi efficiency of the siRNA prodrug in human ovarian carcinoma cells A2780 by reverse transcription quantitative PCR (RT-qPCR) in the presence and absence of the photosensitizer SnPPA, showing selective activation and good knockdown efficiency upon irradiation with red light.
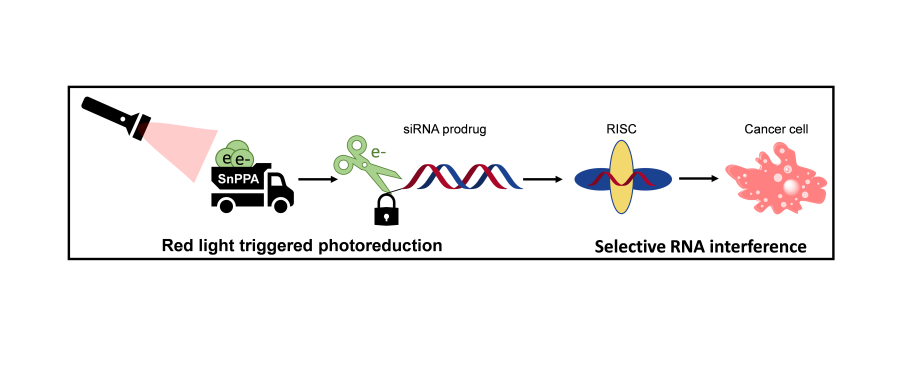
Figure 1. State-of-the-art in siRNA prodrugs. The 9-anthracenyl promoiety on the guide strand of the siRNA is cleaved by 1O2 that is photogenerated on the passenger strand upon red-light irradiation. The 1O2, as well as the anthraquinone side product, are potentially harmful to the cells and the surrounding tissue. In this work, we report on an improved siRNA prodrug, which does not require 1O2 for the activation: it is activated upon red light-induced electron transfer in the presence of photosensitizer SnPPA.
Preprints 72548 g001

2. Results

2.1. Design, Synthesis, and Characterization of DNA 1 and RNA 2
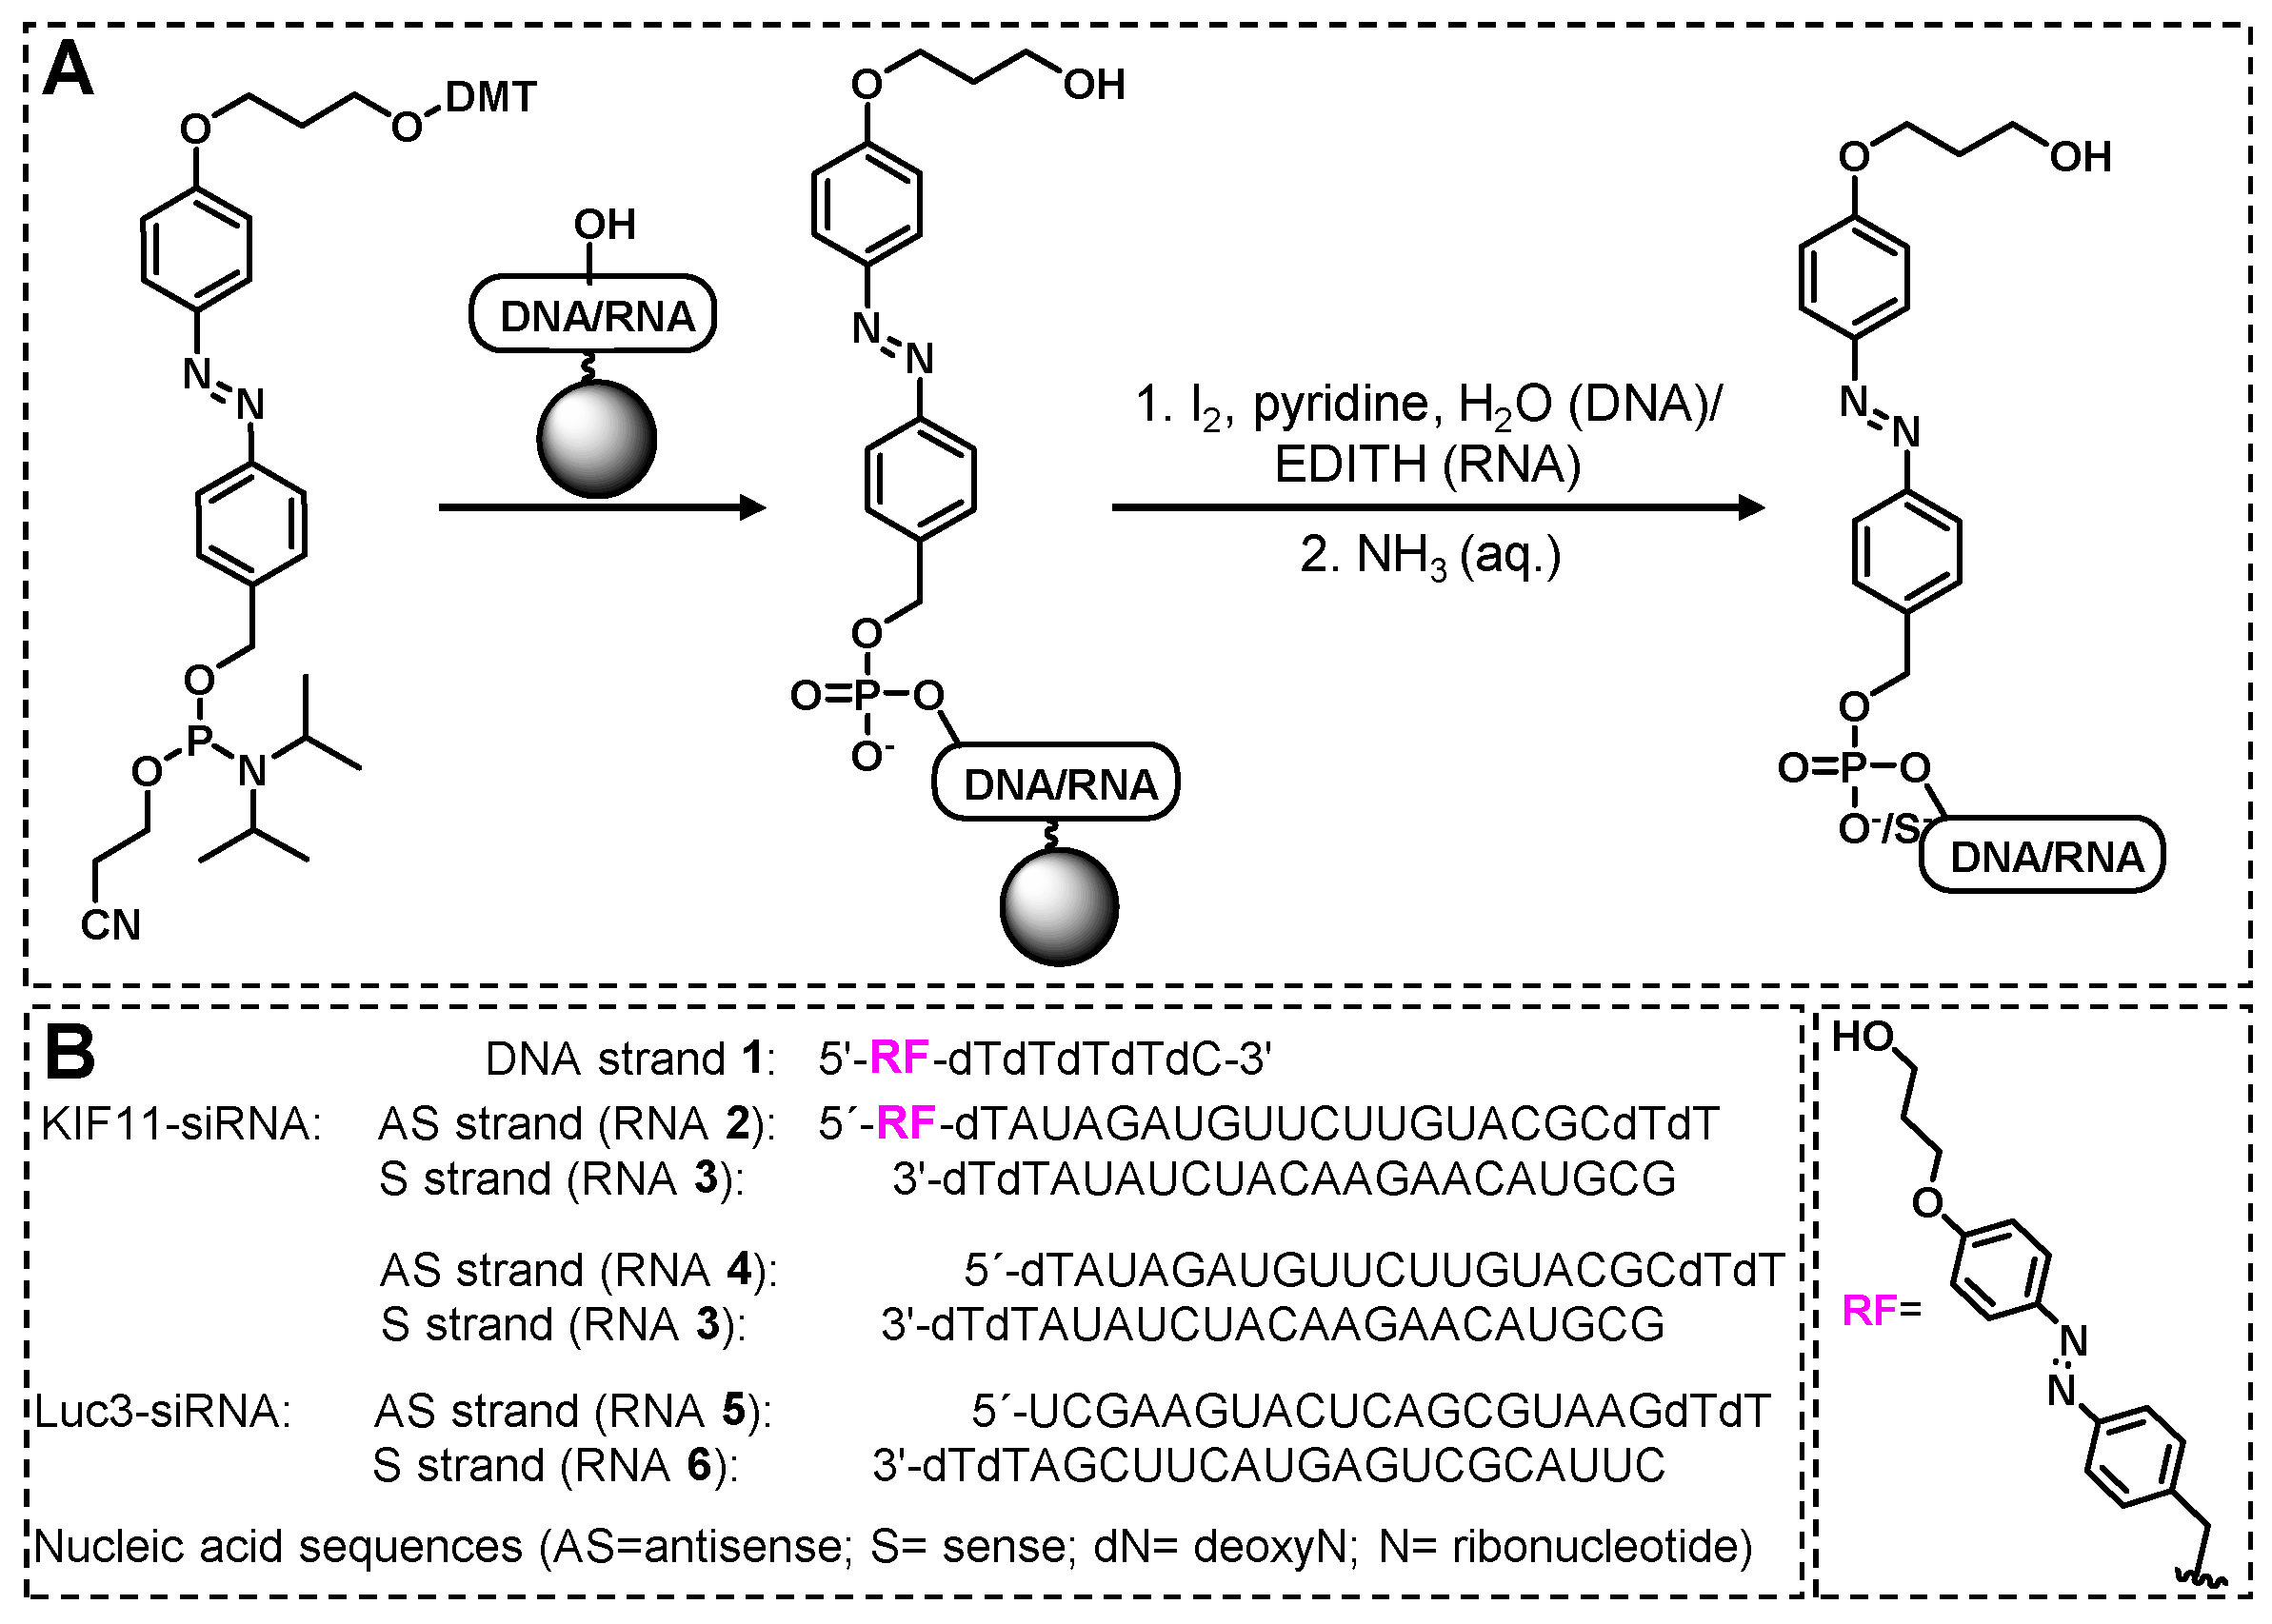
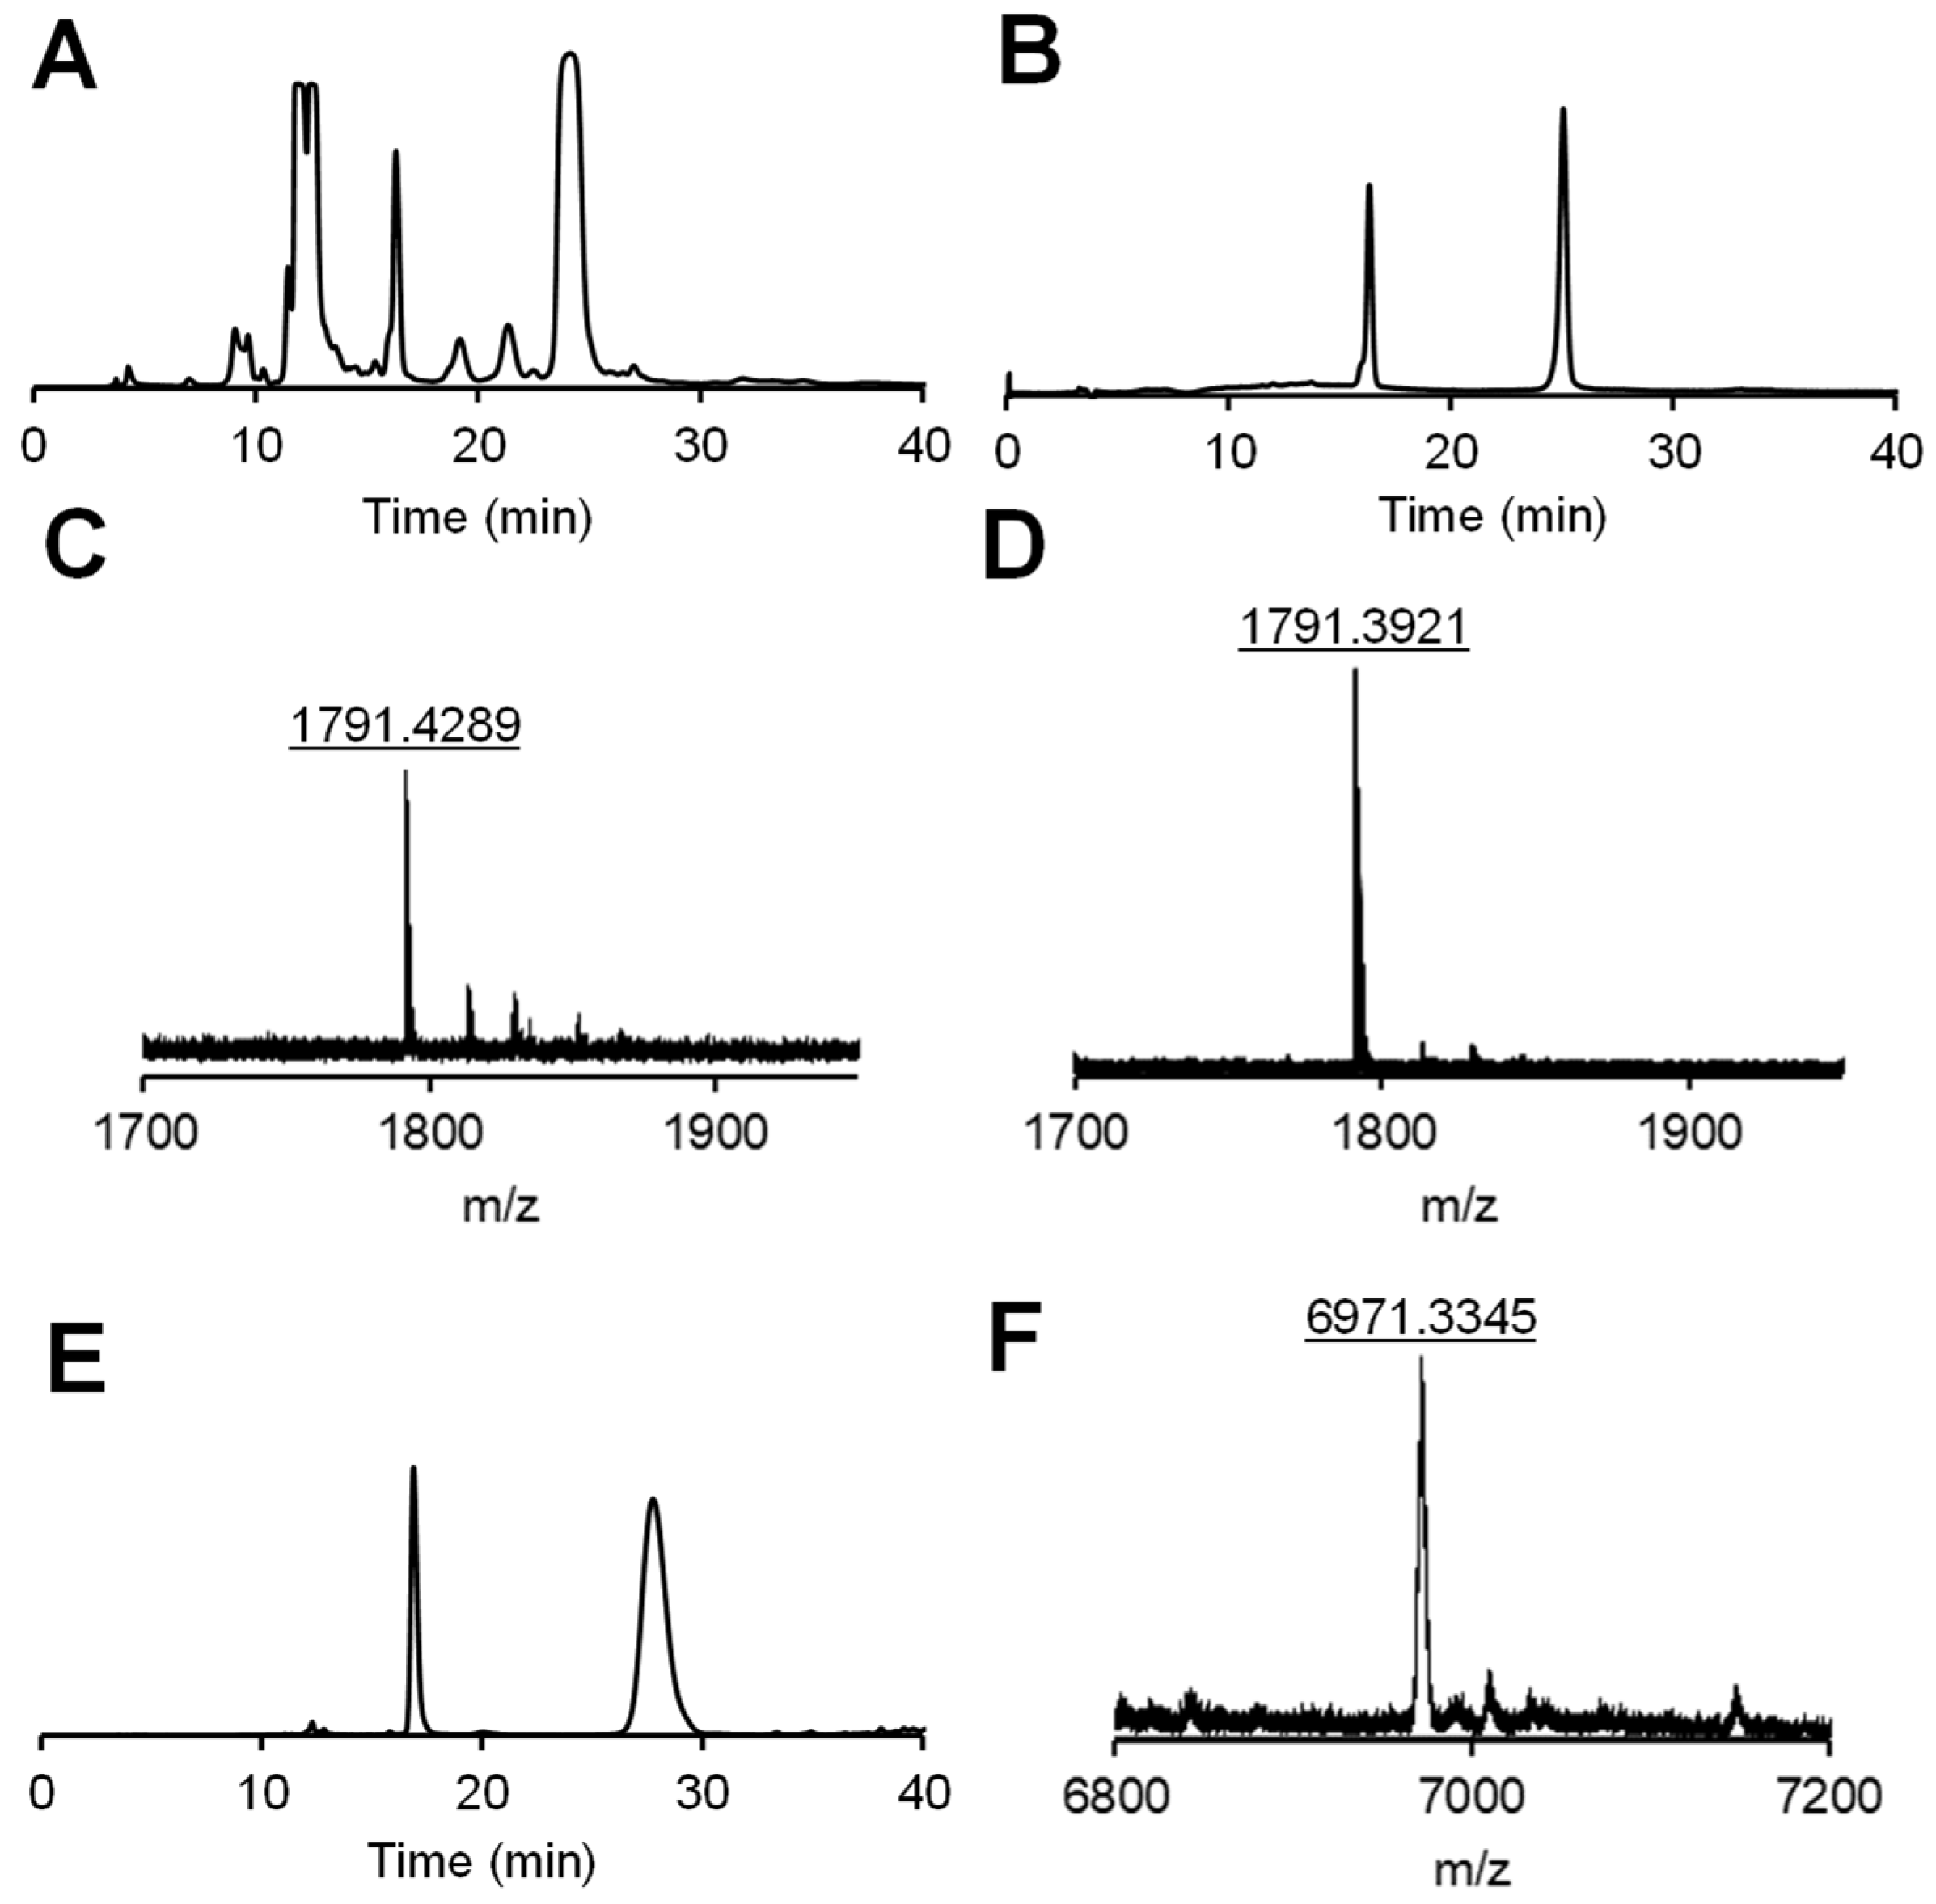
The RF-phosphoramidite (Scheme S1) was synthesized as described earlier [16] and applied for the solid phase synthesis of model strand DNA 1 using commercially available standard DNA phosphoramidites (Schemes 1 and S2, supporting information (further SI)). The nucleobase of the C phosphoramidite was protected with a benzoyl group. The analytical HPLC profile of the crude synthesis mixture is shown in Figure 2 A. The overall yield of the desired product was found to be higher than 50%. The purification of the DNA by reserve phase chromatography gives rise to the analytically pure product as confirmed by HPLC (Figure 2 B). We identified the obtained product by MALDI-TOF-MS. In particular, we observed two peaks with the identical mass of 1791 Da (Figure 2 C+D) that correspond to the expected brutto formula of DNA 1 (calculated for C65H82N13O35P5 [M-H+]-: m/z=1791 Da). We calibrated MALDI-TOF-MS by using an external standard, which gives rise to accuracy in determination in m/z = 0.1% of the detected mass (e.g. for a peak with m/z = 1791 Da the expected deviation would be +/- 1.8 Da). Thus, the product is a mixture of two isomers corresponding to the cis and the trans forms of the azobenzene-DNA.
Scheme 1. (A): Synthesis scheme of DNA 1/RNA 2 by solid phase synthesis. While the 5’ P(III) of DNA 1 was oxidized by I2, pyridine in H2O, the 5 ‘ P(III) of RNA 2 was oxidized with 3-ethoxy-1,2,4-thiazoline-5-one (EDITH), giving rise to the phosphodiester and the phosphorothioate, respectively. (B): Structure of promoiety RF and sequences of DNA/RNAs used in this work.
Preprints 72548 sch001
We prepared the RNA part of the RF-RNA strand 2 (Scheme 1 and S3) by solid phase RNA synthesis using commercially available dioxo-thiomorpholine (TC) RNA phosphoramidites according to manufacturer recommendations. We conducted the coupling of the azobenzene phosphoramidite RF analogously to DNA 1 synthesis, except that we performed the oxidation step with 3-ethoxy-1,2,4-thiazoline-5-one (EDITH) to yield the corresponding phosphorothioate. This modification was utilized, as it shows improved stability towards unspecific phosphatases in cells. The characterization (analytical HPLC, and MALDI-TOF MS spectra) is shown in the Figure 2 E + F. As expected, again two distinct peaks with identical mass were observed (calculated for C216H266N71O152P21S [M-H+]-: m/z=6970 Da; found: m/z=6971 Da), corresponding to the cis and the trans isomer of RNA 2. The sense strand RNA 3, the unmodified KIF11 RNA antisense strand RNA 4, and the RNA strands for a control (scrambled) siRNA without any cellular target (RNA 5 and RNA 6) were custom-made by Sigma Aldrich (Scheme 1). We annealed the RNA strands via temperature gradient (from 90 °C for 15 min to 22 °C in 45 min) in the presence of high salt concentrations (500 mM NaCl) and ethylenediaminetetraacetic acid (EDTA, 10 mM).
Figure 2. Crude (A) and analytical (B) HPLC profile of DNA 1 and MALDI-TOF MS spectra of the peaks in (B) eluted after 18 min (C) and 25 min (D). Analytical HPLC of RNA 2 (E) and corresponding MALDI-TOF MS spectra of the peak eluted after 28 min (F). Reversed-phase HPLC was performed with a gradient of solution B (ACN) in solution A (TEAA buffer, 150 mM, 5 % ACN, pH 7.4): From 0 to 10 min; to 15 % B until 15 min; from 15 - 20 min to 20 % B; until 35 min (DNA 1) and from 0 to 10 min to 15 % B until 20 min, then from 20 - 40 min to 30 % B (RNA 2) by monitoring the absorbance at 260 nm.
Preprints 72548 g002

2.2. Cis-trans isomerization of DNA 1 and its photoreduction.
To investigate the cis-trans isomerization of DNA 1 (Figure 3 A) and to further prove the identity of the two elution peaks in the HPLC profile, a UV-vis spectrum of DNA 1 was recorded before and after irradiation with 365 nm for 1 min (Figure 3 B). As expected, the absorbance at 365 nm, which is characteristic of the trans isomer, is decreasing upon irradiation, while the absorbance at 440 nm, characteristic of the cis isomer, is increasing. In the HPLC profile, light irradiation is shifting the equilibrium toward the peak that is eluted first (compare Figure 3 C and D), indicating that this peak is corresponding to the cis isomer. Already five minutes after the irradiation, the equilibrium is shifted nearly completely back to the initial state (Figure 3 E).
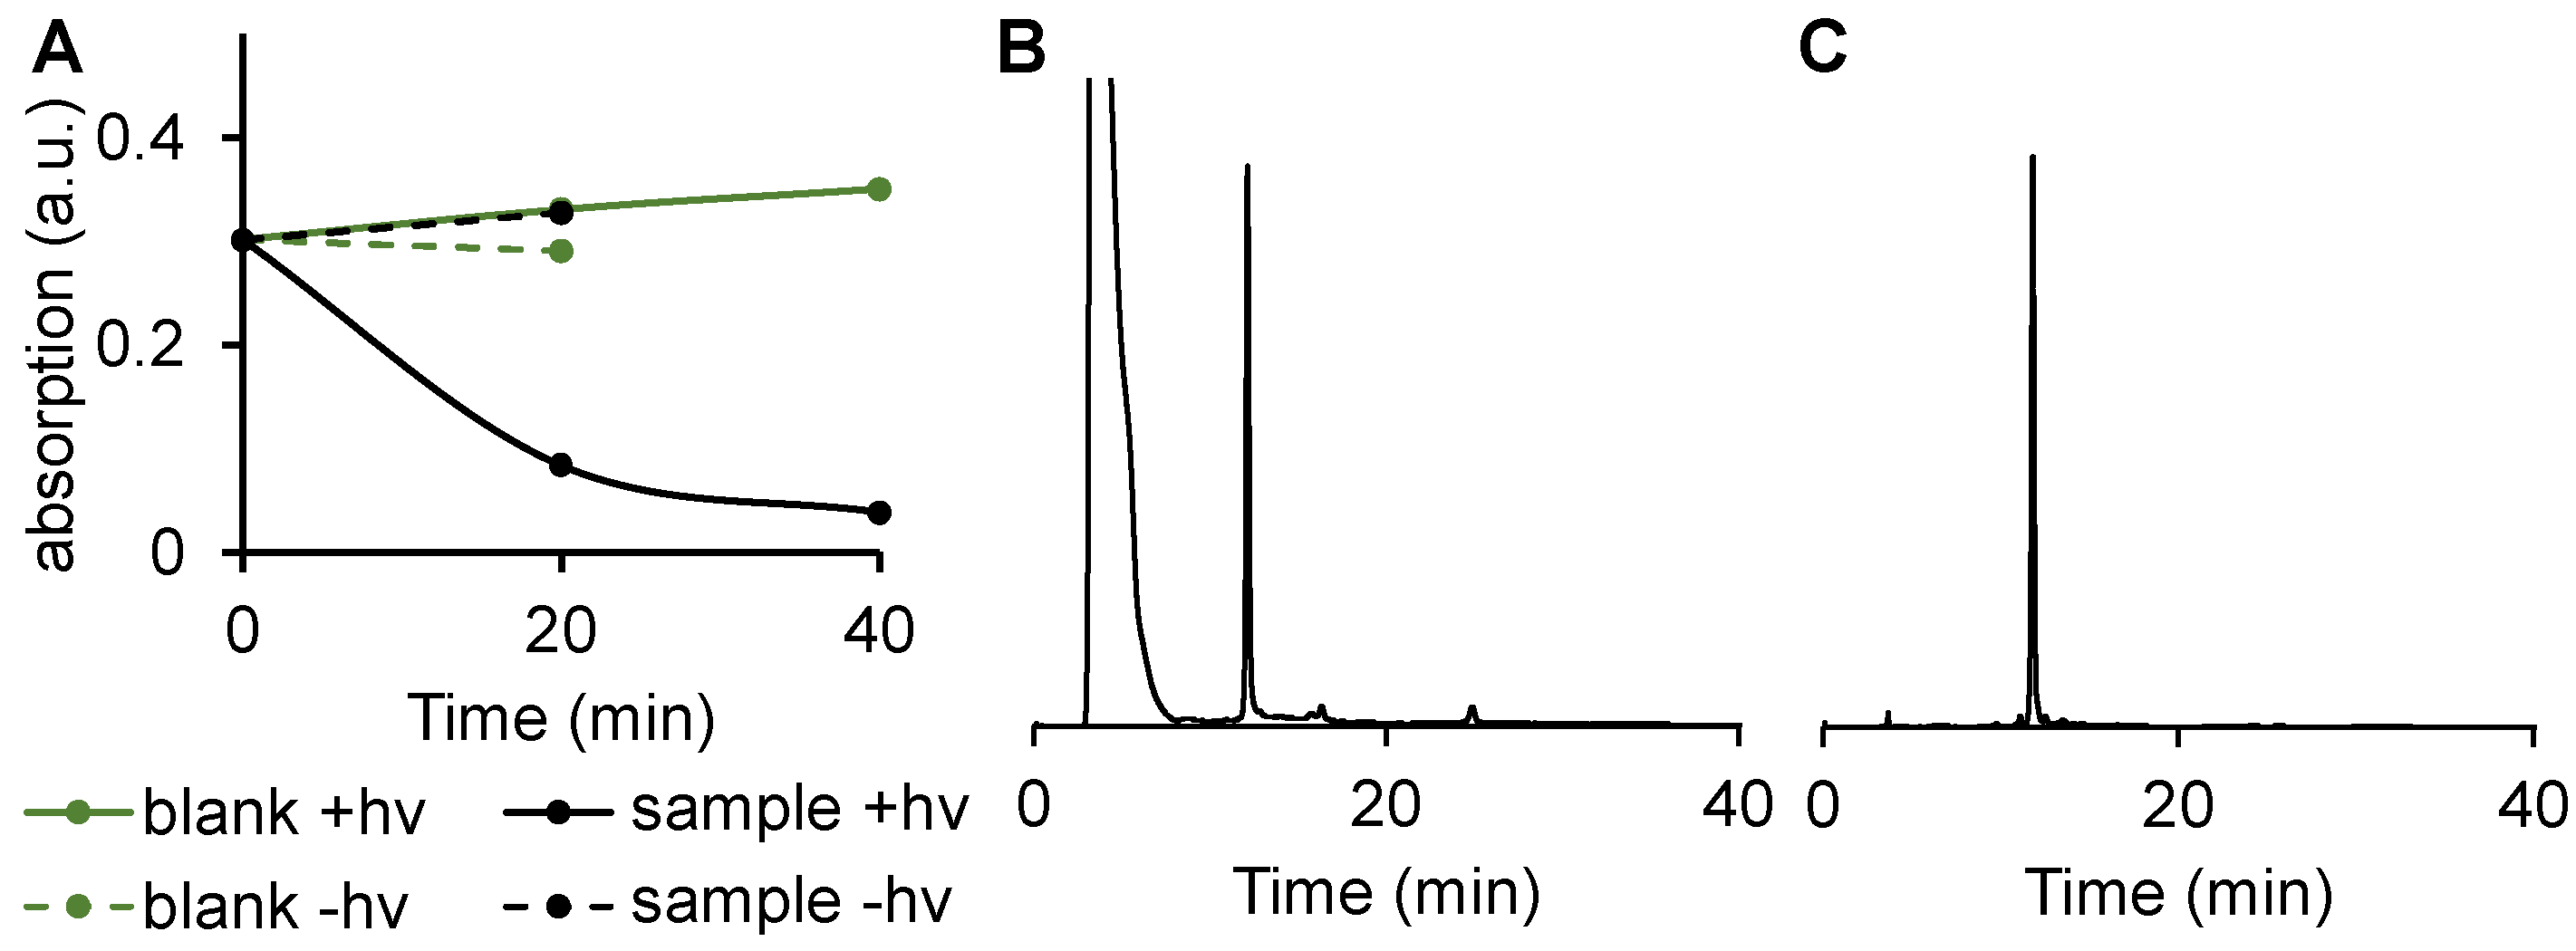
To investigate the cleavage of DNA 1 by photoreduction, we incubated DNA 1 with sodium ascorbate in the presence (“sample”) or absence (“blank”) of photosensitizer SnPPA. The photosensitizer was selected as a catalyst of photoreduction based on our previously published study (synthesis as described in [16], for MS spectra, see Figure S1, SI). The samples were either irradiated with red light (660 nm) (+hv) or kept in the dark (-hv) and the absorption at 351 nm (characteristic for the more abundant trans isomer of DNA 1, see Figure 3 B) was recorded after 20 min and 40 min (Figure 4 A). In the presence of the photosensitizer and red light, the bleaching of the azobenzene is taking place as detected by the reduced absorbance. In contrast, in the absence of either light or catalyst, no degradation of DNA 1 is detectable. These data confirm the first step of the mechanism of DNA 1 photoreduction outlined in Scheme 2.
To identify product(s) formed in the latter reaction, we subjected the sample after 40 min irradiation in the presence of SnPPA to HPLC. The corresponding profile (Figure 4 B), shows one major peak (approximately 80% of eluted peaks after injection peak), that is eluted after 11.8 min. The corresponding MALDI-TOF MS spectrum (Figure S3, SI) indeed shows the mass (calculated for C49H66N11O35P5 [M-H+]-: m/z=1523 Da, found: m/z = 1524 Da) of the expected 5’-phosphorylated DNA after azobenzene reduction and subsequent 1,6-elimination of para-quinone methide followed by its quenching with water with formation of 4-hydroxymethylaniline (Scheme 2). As an additional control, we synthesized the 5’-phosphorylated DNA strand and subjected it to HPLC (Figure 4 C), showing the same elution time (11.8 min) as the product of the photoreduction, further confirming the identity of the cleavage product.
Figure 4. Photoreduction of DNA 1 in PBS (10 mM, 150 mM NaCl, 10 mM sodium ascorbate, pH 7.4) in the presence (“sample”) or absence (“blank”) of SnPPA (4 µM). The mixtures were either irradiated with red light (+hν) or kept in the dark (-hν). UV-vis absorbance at 351 nm was recorded after 20 and 40 min (A). HPLC profile of the 20 min irradiated sample containing SnPPA using a gradient of solution B (ACN) in solution A (TEAA buffer, 150 mM, 5 % ACN, pH 7.4): From 0 to 10 min to 15 % B until 15 min. From 15 - 20 min to 20 % B until 35 min (B). All peaks were collected and analyzed by MALD-MS spectrometry (see S2, SI). HPLC profile of 5’-phosphorylated DNA strand (C).
Preprints 72548 g004

2.3. DNA 1 cleavage selectivity and RNA 2 photoreduction.

To challenge the selectivity of RF cleavage by red light induced electron transfer, DNA 1 was incubated with biorelevant redox species, namely H2O2 (200 mM), KO2 (100 µM), and NaSH (630 µM) for 1h. As shown in Figure 5 A-D, no cleavage products could be detected under these conditions. Note that the large injection peak in B is caused by H2O2 light absorption. This proves the selectivity of RF cleavage by electron transfer, forming a solid foundation for applications in a biological context.
To approach our goal of in vitro application, we repeated the cleavage experiments on an RNA level, by incubation of RNA 2 with sodium ascorbate and the photosensitizer SnPPA in the absence or presence of red light. In the dark, no cleavage takes place (compare Figure 6 A and B). However, upon irradiation, two major cleavage products could be detected (Figure 6 C). The first one, eluted after 12 min, corresponds to the phosphorylated RNA strand (calculated for C200H250N69O151P21 [M-H+]-: m/z=6687 Da; found: m/z= 6676), according to the MALDI-TOF MS spectra (Figure S3, SI). The second one, eluted 1 min later, corresponds to the thiophosphorylated RNA strand (calculated for C200H250N69O151P21 [M-H+]-: m/z=6702 Da; found: m/z= 6703 Da). Both species would catalyze RNAi in a cellular context.

2.4. Knockdown efficacy of RNA 2/3

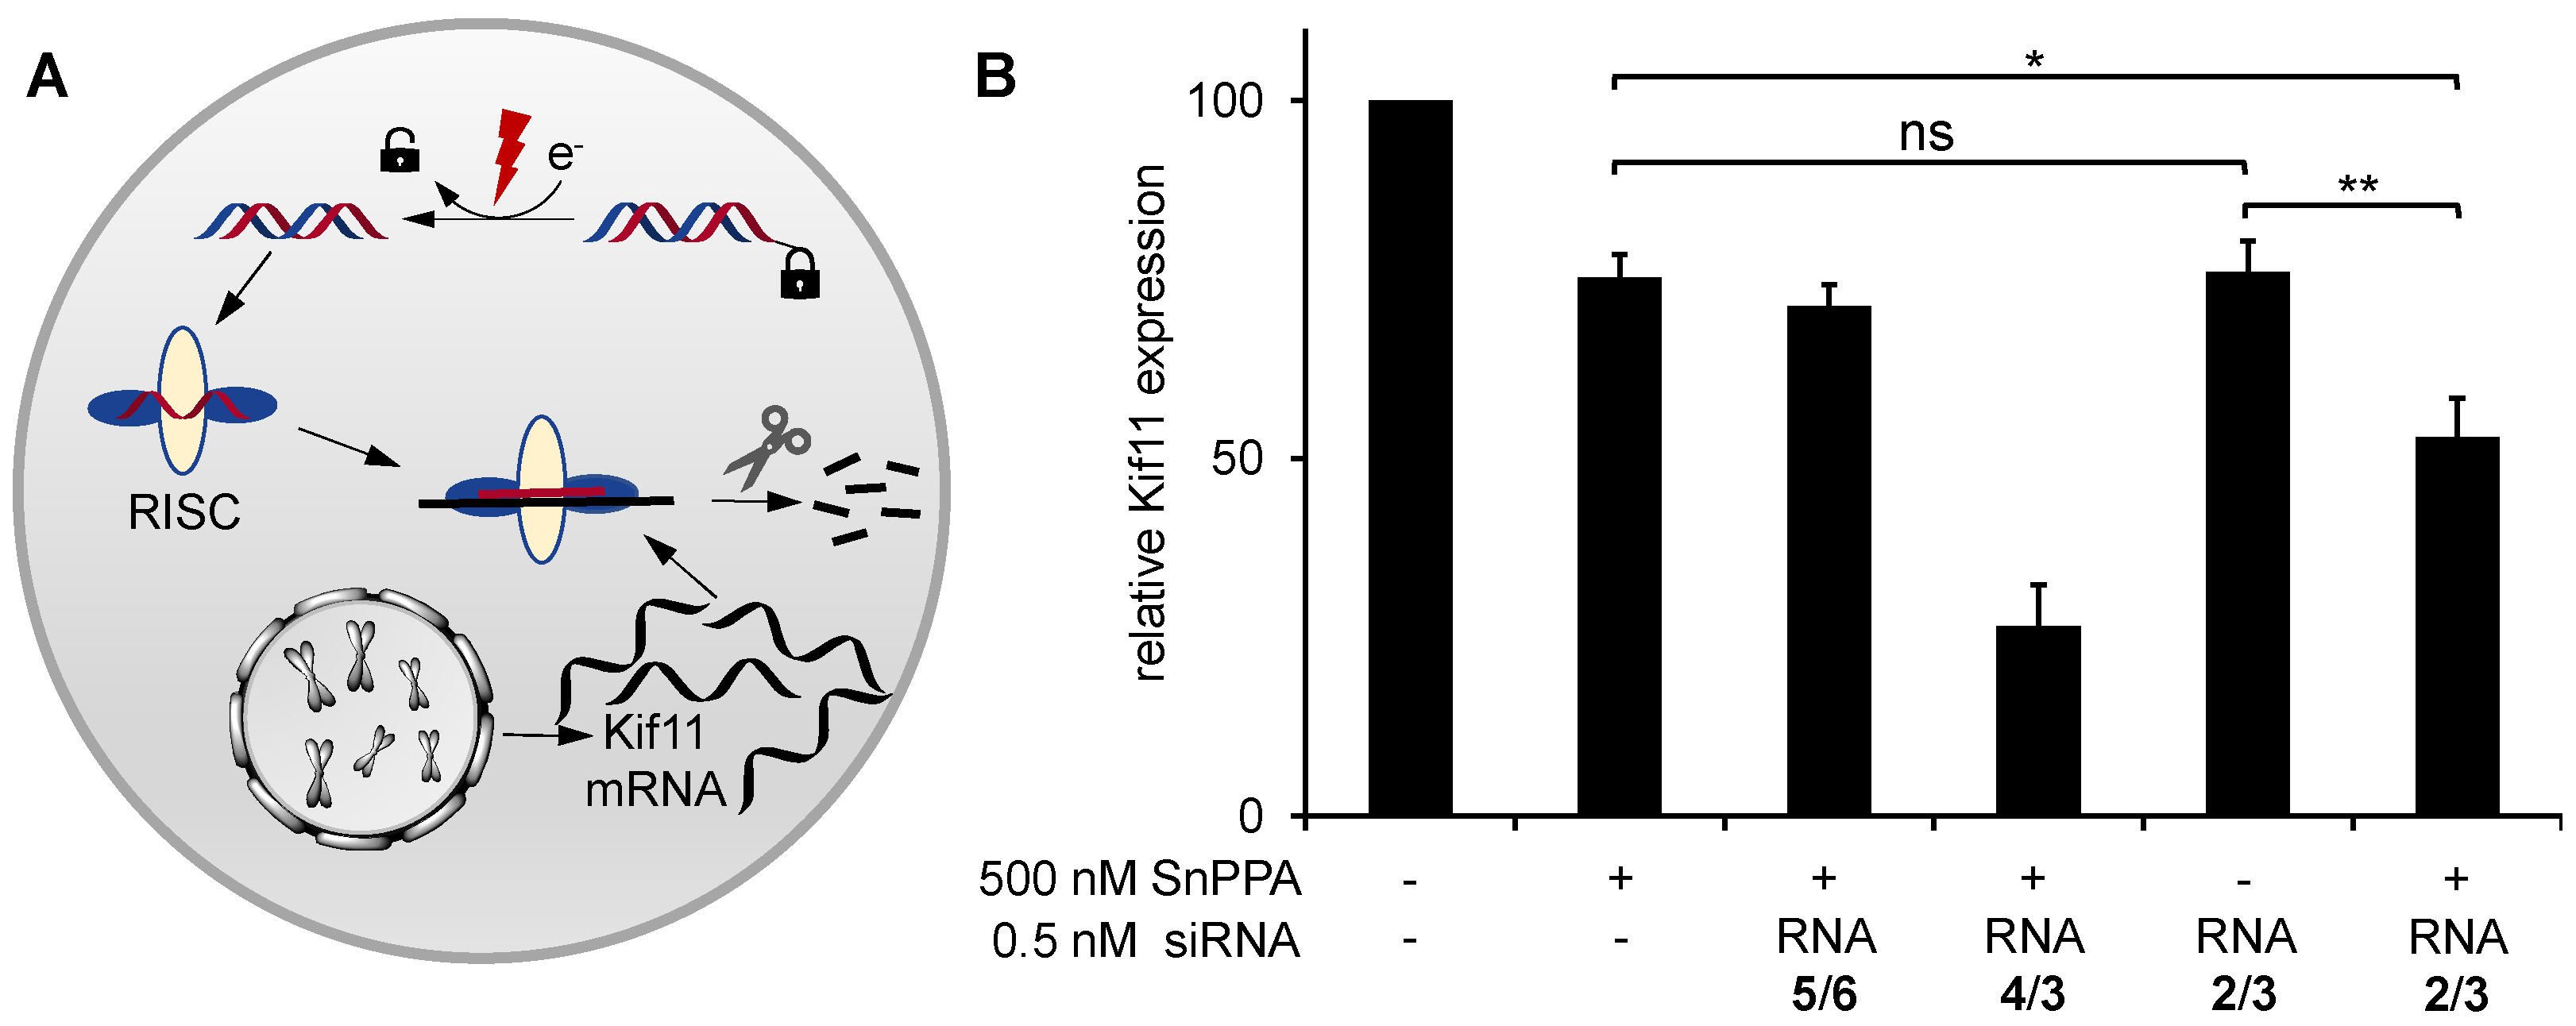
Encouraged by these results, we annealed RNA 2 with its corresponding passenger strand RNA 3 and formulated it with the standard commercially available transfection agent Lipofectamine™ RNAiMAX for transfection of A2780 cancer cells. We applied the unmodified KIF11 siRNA 4/3 as a positive control and the scrambled siRNA 5/6 as a negative control. Upon completed transfection (14 h), we added the photosensitizer SnPPA. All samples were irradiated, 30 min later, with red light (660 nm). After an additional 23 h, the relative KIF11 expression was quantified by RT-qPCR. It is expected, that upon light irradiation, the azobenzyl group at the 5’ end of the antisense strand is cleaved, allowing the siRNA to be activated by the RNA-induced silencing complex (RISC) (Figure 7 A). The siRNA antisense strand then serves as a template for the selective binding of mRNAs with the corresponding sequence (in this case: KIF11), followed by mRNA degradation. By RT-qPCR the relative mRNA content of single genes can be quantified and normalized to the one of a consecutively expressed housekeeping gene (in this case: GAPDH). As shown in Figure 7 B, RNA 2/3, indeed, significantly decreased the KIF11 mRNA concentration in the presence of the photosensitizer as compared to cells only treated with the photosensitizer (p<0.01, unpaired Student’s t test). In contrast, no significant RNAi could be observed in the absence of SnPPA. These results not only demonstrate the successful activation of RNA 2/3 in cells but also its selective on-demand activation in the presence of photosensitizer SnPPA.

3. Conclusion

In this study, we present electron-rich azobenzene “RF” as a suitable promoiety for the design of siRNAs activated under reductive conditions upon irradiation with red light. This can be achieved in the presence of SnPPA acting as a photocatalyst mediating the transfer of electrons from intracellular electron sources (e.g., ascorbate) to the azobenzene. In particular, the RF-based prodrug is not reduced both in dark and upon irradiation with red light in the presence of bioavailable redox species such as H2O2, NaSH, KO2, or ascorbate if SnPPA is not present. We first characterized the promoiety on a DNA model strand in cell-free settings and then successfully synthesized and characterized an RF-carrying RNA strand. Finally, we transferred the concept into cells, by application of an RF-siRNA prodrug, which was transfected with a standard transfection agent into ovarian carcinoma cells (A2780). We showed that also in cells, the siRNA is selectively activated upon red light irradiation in the presence of photosensitizer SnPPA inducing KIF11 knockdown. With this siRNA prodrug approach, we avoid the formation of toxic metabolites such as 1O2 and anthraquinone, making this concept superior to the previously published one. The RNAi is triggered by biologically tolerated red light, due to the application of catalyst SnPPA, which uses naturally abundant metabolites such as ascorbic acid as electron sources. Presumably, the here described promoiety can be easily attached to any siRNA sequence by the presented synthesis route and the resulting prodrug can be formulated with standard transfection reagents, making this approach a versatile tool to improve siRNA selectivity.

4. Materials and Methods

4.1. Synthesis of modified oligonucleotides

Automated oligonucleotide synthesis was performed on a 1 μmol-scale by using the standard (3′→5’) synthesis according to the recommendations of the manufacturer. For DNA synthesis dC(bz) CPG (1000 Å, 28 µmol/g), and for RNA synthesis dT CPG (1000 Å, 25 – 35 µmol/g) was used. The phosphoramidite carrying RF was coupled manually under argon atmosphere for 10 min. For that, the phosphoramidite in water-free acetonitrile (0.1 mL, 0.1 M) was mixed on the solid phase with a solution of ETT activator in acetonitrile (0.1 mL, 0.5 M). After oxidation with a standard iodine solution and DMT-deprotection coupling was repeated. For RNA 2, oxidation was performed with 3-ethoxy-1,2,4-thiazoline-5-one (EDITH, 0.05 M, in acetonitrile) with 20s oxidation time. The synthesized and chemically modified oligonucleotides were purified on reversed-phase HPLC with a gradient of solution B (ACN) in solution A (TEAA buffer, 150 mM, 5 % ACN, pH 7.4). For DNA a gradient from 0 to 10 min to 15 % B until 15 min and then from 15 - 20 min to 20 % B until 35 min was used. RNA was purified with a gradient from 0 to 10 min to 15 % B until 20 min, then from 20 - 40 min to 30 % B. Concentrations of modified and non-modified RNAs and DNAs were determined by measuring the absorption at 260 nm. Annealing of RNA/DNA strands (10 µM each strand) was performed in Tris buffer (100 mM Tris, pH 7.8, 500 mM NaCl, and 10 mM EDTA by heating the mixture to 90 °C for 15 min and cooling it by 3 °C per 2 min to 22 °C.

4. 2 Cis-trans isomerization of DNA 1

UV-vis absorbance of DNA 1 (15 µM) in PBS (10 mM, 150 mM NaCl, pH 7.4) was measured before (t = 0 min) and after irradiation with 365 nm light for 1 min (Figure 3 B). In addition, DNA 1 (20 µM) in PBS (10 mM, 150 mM NaCl, pH 7.4) was injected into HPLC before (Figure 2 C) and after 5 min irradiation at 365 nm (Figure 3 D) and after 5 min irradiation with 365 nm plus additional 5 min incubation (Figure 3 E) using a gradient of solution B (ACN) in solution A (TEAA buffer, 150 mM, 5 % ACN, pH 7.4): From 0 to 10 min to 15 % B until 15 min. From 15 - 20 min to 20 % B until 35 min.

4.3 DNA 1 cleavage by red-light-induced photoreduction

DNA 1 (50 µM) was dissolved in PBS (10 mM, 150 mM NaCl, 10 mM sodium ascorbate, pH 7.4) in the presence or absence of SnPPA (4 µM) (for synthesis and structure see [16]). The mixtures were either irradiated (+hν) or kept in the dark (-hν) and UV-Vis spectra were recorded after 20 and 40 min (351 nm) (Figure 4 A). The 20 min irradiated sample containing SnPPA was additionally injected into HPLC using a gradient of solution B (ACN) in solution A (TEAA buffer, 150 mM, 5 % ACN, pH 7.4): From 0 to 10 min to 15 % B until 15 min. From 15 - 20 min to 20 % B until 35 min (Figure 4 B). All peaks were collected and analyzed by MALD-MS spectrometry (see SI, Figure S2). The HPLC profile was compared to the one of the unmodified DNA strand (Figure 4 C).

4.4 Stability in presence of oxidizing/reducing agents

DNA 1 (75 µM) was dissolved in PBS (10 mM, 150 mM NaCl pH 7.4) (Figure 5 A), in presence of 200 mM H2O2 (Figure 5 B), in presence of KO2 (100 µM (1 % DMSO)) (Figure 5 C) or in presence of NaSH (630 µM) (Figure 5 D) and incubated for 1 hour at 37 °C. Solutions were injected to reversed-phase HPLC using a gradient solution B (ACN) in solution A (TEAA buffer, 150 mM, 5 % ACN, pH 7.4): From 0 to 10 min to 15 % B until 15 min. From 15 - 20 min to 20 % B until 35 min.

4.5 RNA 2 cleavage by red-light-induced photoreduction

RNA 2 (50 µM) was dissolved in PBS buffer (10 mM, 150 mM NaCl, pH 7.4) containing sodium ascorbate (10 mM) and SnPPA (10 µM) and directly injected into HPLC (Figure 6 A) or kept in the dark (-hν) (Figure 6 B) or irradiated with red light for 30 min at 23 °C (Figure 6 C) and subsequently injected into HPLC using a gradient solution B (ACN) in solution A (TEAA buffer, 150 mM, 5 % ACN, pH 7.4): From 0 to 10 min to 15 % B until 20 min, then from 20 - 40 min to 30 % B. HPLC fractions were analyzed by MALDI-TOF mass spectrometry (see S3, SI)

4.6 Transfection

A2780 were seeded in 6-well plates (100 cells/μL, 2 mL RPMI 1640, containing FBS (5 %), penicillin/streptomycin (1 %), and L-Glutamine (1 %) per well). For the transfection, 1 pmol (for 0.5 nM end concentration) siRNA in biograde water (10 µL) was diluted with Gibco™ Opti-MEM™ Reduced Serum Media (Opti-MEM) (40 μL). In addition, LipofectamineTM RNAiMAX (1.5 μL) was diluted in Opti-MEM (48.5 μL) and incubated for 5 min at 22 °C before both solutions were combined. The transfection solution was then incubated for 20 min at 23 °C while recurring shaking every 5 min. The cells were washed with PBS (2.5 mL per well) and a fresh portion of RPMI 1640 medium (1.9 mL per well) containing FBS (5 %), penicillin/streptomycin (1 %), and L-Glutamine (1 %) was added. Finally, the 100 μL transfection solution was added to the cells. The samples were incubated for 14 h.

4.7 Relative gene expression quantification by RT-qPCR

SnPPA (500 nM, 0.1% DMSO) was added to the cells. As a control, to one of the siRNA 2/3-treated sample, no SnPPA was added. The samples were incubated for 30 min in the dark, and subsequently irradiated for 30 min with a red LED lamp compiled of eighteen 2-watt super bright red LEDs (λ = 660 nm, Flux = 1086 lm, efficacy: 56.6 lm/w; half width at half maximum = 26.4 nm; distance to samples = 30 cm). The samples were incubated for 23 h in the dark. To isolate total RNA from cells, the cultivation medium was removed, the cells were washed with PBS, and TRI reagent® (1 mL/well) was added for lysis. After 5 min incubation at 22 °C, the cell lysate was transferred into 1.5 mL Eppendorf tubes, and the aqueous phase of the samples was extracted by adding chloroform (200 µL, 4 °C) followed by thorough mixing and centrifugation (12,000x g, 4 °C, 15 min). The aqueous phase was mixed with ethanol (400 µL, 4 °C) and transferred onto Zymo-Spin IC Columns. The samples were subsequently centrifuged (1 min, 8,000x g, 4 °C). The eluate was discarded. The RNA on the column was washed with first sodium acetate buffer (3 M, 500 µL, 4 °C, pH = 5.2) and secondly with ethanol (500 µL, 75 %, v/v, in water, 4 °C), by solvent addition, subsequent centrifugation as above and eluate removal. Finally, pure ethanol (500 µL, 4 °C) was added and the samples were centrifuged (3 min, 10,000x g, 4 °C) to dry the column. The RNA was eluted by adding RNase-free water (25 µL), incubation for 5 min at 22°C, and subsequent centrifugation (2 min, 8,000x g, 4 °C). To transcribe the isolated RNA into cDNA, RNA (1 µg in 12.5 µL RNase-free water) was incubated (65 °C for 5 min) with random hexamer primer (1 µL). Subsequently, reverse transcriptase (0.5 µL), RT 5x buffer (4 µL), and dNTPs (2 µL) were added per sample. Finally, the reverse transcription protocol (10 min at 25 °C; 60 min at 42 °C; 10 min at 70 °C; forever at 4 °C) was run at the Dual Block Gradient PCR Thermal Cycler. For the relative quantification of the genes of interest, LightCycler® 480 SYBR® Green Master (5 µL) was mixed with a primer pair (1 µL) and cDNA (4 µL, 1:10 diluted) and subjected to the LightCycler® 480. The applied primer sequences were CAGCTGAAAAGGAAACAGCC; ATGAACAATCCACACCAGCA for KIF11 and CTTCACCACCATGGAGGAGGC; GGCATGGACTGTGGTCATGAG for the housekeeping gene GAPDH. The reaction mixtures were initially heated at 95 °C for 5 min, followed by 45 cycles, which consisted of 10 s at 95 °C, 30 s 60 °C, and 10 s at 72 °C. The Ct value of the KIF11 cDNA amplification of each sample was subtracted by the Ct value of the GAPDH cDNA amplification of the same sample (∆Ct). For the evaluation of the fold change, the 2-ΔCt value was calculated. The 2-ΔCt value of untreated cells was set to 100. Three independent experiments were performed and the mean ± standard deviation was calculated and are shown in Figure 7.

Supplementary Materials

The following supporting information can be downloaded at the website of this paper posted on Preprints.org, with details about applied chemicals and instruments, Scheme S1: Structure of DMT-RF-carrying phosphoramidite, Scheme S2: Structure of DNA 1, Scheme S3: Structure of RNA 2, Figure S1: High resolution mass spectrum of SnPPA, Figure S2: MALDI-TOF-MS spectra of DNA 1 stability test, Figure S3: MALDI-TOF-MS spectra of DNA 1 cleavage experiments, details about cells and cell culture.

Author Contributions

Conceptualization, A.M.; methodology, J.R. and I.K.; synthesis, J.R.; Analytics, J.R.; cell experiments, I.K.; writing—original draft preparation, I.K.; writing—review and editing, A.M.; visualization, I.K.; supervision, A.M..; funding acquisition, A.M. All authors have read and agreed to the published version of the manuscript.

Funding

This research was funded by the joint program of German Research Council (DFG, project 1419 / 11-1

Acknowledgments

We thank Subrata Dutta for the synthesis of SnPPA.

Conflicts of Interest

The authors declare no conflict of interest.

References

  1. Scott, L.J., Givosiran: First Approval. Drugs, 2020. 80(3): p. 335-339. [CrossRef]
  2. Scott, L.J. and S.J. Keam, Lumasiran: First Approval. Drugs, 2021. 81(2): p. 277-282. [CrossRef]
  3. Wood, H., FDA approves patisiran to treat hereditary transthyretin amyloidosis. Nat Rev Neurol, 2018. 14(10): p. 570. [CrossRef]
  4. Lamb, Y.N., Inclisiran: First Approval. Drugs, 2021. 81(3): p. 389-395.
  5. Keam, S.J., Vutrisiran: First Approval. Drugs, 2022. 82(13): p. 1419-1425. [CrossRef]
  6. Han, S.P., et al., Programmable siRNA pro-drugs that activate RNAi activity in response to specific cellular RNA biomarkers. Mol Ther Nucleic Acids, 2022. 27: p. 797-809. [CrossRef]
  7. Hayashi, J., et al., Effective gene silencing activity of prodrug-type 2'-O-methyldithiomethyl siRNA compared with non-prodrug-type 2'-O-methyl siRNA. Bioorg Med Chem Lett, 2018. 28(12): p. 2171-2174. [CrossRef]
  8. Mikat, V. and A. Heckel, Light-dependent RNA interference with nucleobase-caged siRNAs. Rna, 2007. 13(12): p. 2341-7. [CrossRef]
  9. Rühle, J., et al., Reactive oxygen species-responsive RNA interference. Chemical Communications, 2022. 58(27): p. 4388-4391. [CrossRef]
  10. Antunes, F. and E. Cadenas, Estimation of H2O2 gradients across biomembranes. FEBS Letters, 2000. 475(2): p. 121-126.
  11. Rybak, C.J., et al., Dinickel-Catalyzed N═N Bond Rotation. Inorg Chem, 2023. 62(15): p. 5886-5891.
  12. Johnson, T.G., A. Sadeghi-Kelishadi, and M.J. Langton, A Photo-responsive Transmembrane Anion Transporter Relay. J Am Chem Soc, 2022. 144(23): p. 10455-10461. [CrossRef]
  13. Samanta, S., et al., Photoswitching azo compounds in vivo with red light. J Am Chem Soc, 2013. 135(26): p. 9777-84. [CrossRef]
  14. Tian, X., et al., Near-Infrared Fluorescent Probes for Hypoxia Detection via Joint Regulated Enzymes: Design, Synthesis, and Application in Living Cells and Mice. Anal Chem, 2018. 90(22): p. 13759-13766. [CrossRef]
  15. Guisán-Ceinos, S., et al., Turn-on Fluorescent Biosensors for Imaging Hypoxia-like Conditions in Living Cells. J Am Chem Soc, 2022. 144(18): p. 8185-8193. [CrossRef]
  16. Dutta, S., et al., Red light-triggered photoreduction on a nucleic acid template. Chem Commun (Camb), 2020. 56(69): p. 10026-10029. [CrossRef]
  17. Jiang, M., et al., KIF11 is required for proliferation and self-renewal of docetaxel resistant triple negative breast cancer cells. Oncotarget, 2017. 8(54): p. 92106-92118. [CrossRef]
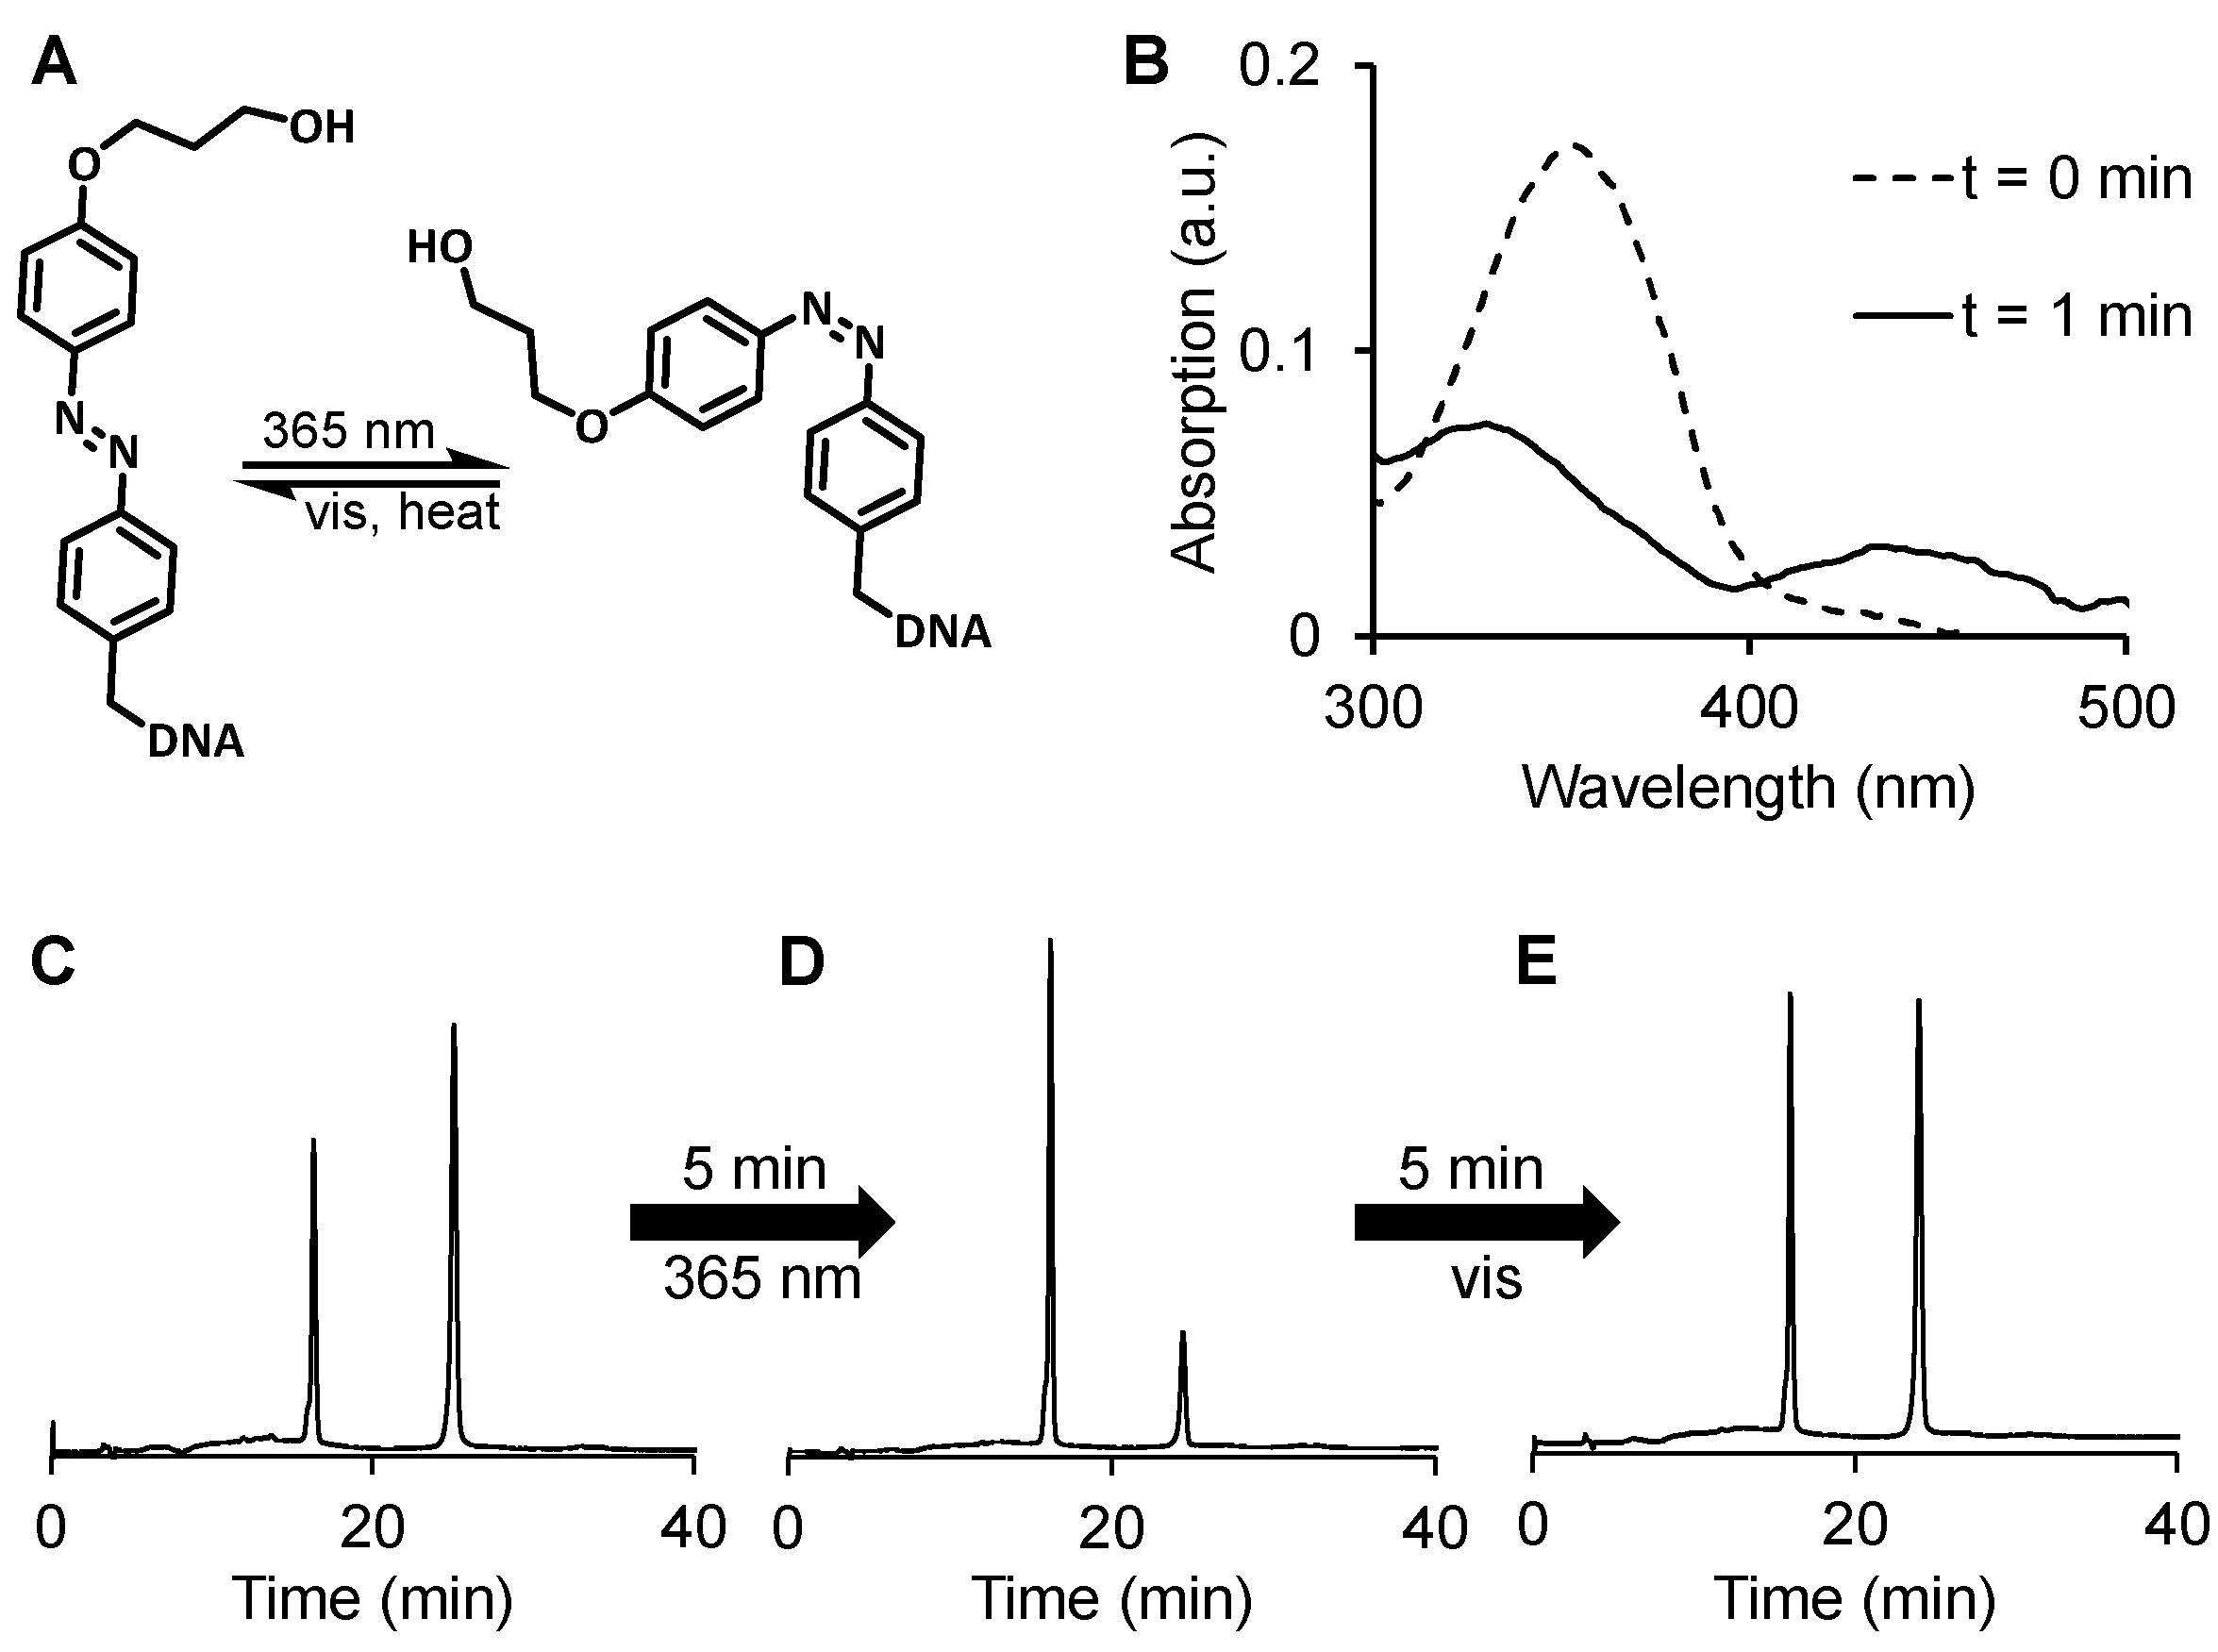
Figure 3. Cis-trans isomerization of DNA 1 (A) as observed by UV vis absorbance (B) before and after 1 min irradiation at 365 nm. HPLC profile (absorbance at 260 nm) of DNA 1 before (C) and after (D) 5 min irradiation at 365 nm and after an additional 5 min at room light (E), using a gradient of solution B (ACN) in solution A (TEAA buffer, 150 mM, 5 % ACN, pH 7.4): From 0 to 10 min to 15 % B until 15 min. From 15 - 20 min to 20 % B until 35 min.
Preprints 72548 g003
Scheme 2. Cleavage mechanism of DNA 1 upon irradiation with red light in the presence of SnPPA and ascorbate (Asc).
Preprints 72548 sch002
Figure 5. DNA 1 stability in PBS (10 mM, 150 mM NaCl pH 7.4) (A), in the presence of 200 mM H2O2 (B), KO2 (100 µM (1 % DMSO)) (C) or NaSH (630 µM) (D) after 1 incubation at 37 °C as analyzed by HPLC using a gradient solution B (ACN) in solution A (TEAA buffer, 150 mM, 5 % ACN, pH 7.4): From 0 to 10 min to 15 % B until 15 min. From 15 - 20 min to 20 % B until 35 min.
Preprints 72548 g005
Figure 6. Photoreduction of RNA 2 in PBS buffer (10 mM, 150 mM NaCl, pH 7.4) containing sodium ascorbate (10 mM) and SnPPA (10 µM) as observed by HPLC. The sample was either directly injected into HPLC (A), or incubated in the dark (B), or irradiated with red light for 30 min (C). A gradient of solution B (ACN) in solution A (TEAA buffer, 150 mM, 5 % ACN, pH 7.4): From 0 to 10 min to 15 % B until 20 min, then from 20 - 40 min to 30 % B was used. HPLC fractions were analyzed by MALDI-TOF mass spectrometry (see Figure S3, SI).
Preprints 72548 g006
Figure 7. (A) After the photoreduction of the siRNA prodrug, the guide strand of the siRNA is uptaken into the RNA-induced silencing complex (RISC) to selectively cleave the complementary KIF11 mRNA, resulting in reduced KIF11 expression. (B) Relative KIF11 mRNA concentrations of A2780 cells treated with 0.5 nM the unmodified KIF11 siRNA 4/3 or the modified analog siRNA 2/3 for 38 h. As a negative control siRNA 5/6, which has no target mRNA in the cells, was applied. After 14 h incubation, SnPPA (500 nM, 0.1 % DMSO, end concentration) was added to the indicated samples ad incubated for 30 min. All samples were irradiated for 30 min with red light, and subsequently, incubation was continued in the dark. As a housekeeping gene, GAPDH was used. 2-ΔCt values were calculated and normalized to the one of untreated cells. Three independent experiments were performed.
Preprints 72548 g007
Disclaimer/Publisher’s Note: The statements, opinions and data contained in all publications are solely those of the individual author(s) and contributor(s) and not of MDPI and/or the editor(s). MDPI and/or the editor(s) disclaim responsibility for any injury to people or property resulting from any ideas, methods, instructions or products referred to in the content.
Copyright: This open access article is published under a Creative Commons CC BY 4.0 license, which permit the free download, distribution, and reuse, provided that the author and preprint are cited in any reuse.
Prerpints.org logo

Preprints.org is a free preprint server supported by MDPI in Basel, Switzerland.

Subscribe

© 2024 MDPI (Basel, Switzerland) unless otherwise stated