Preprint
Article

Upconversion Nanoparticle-Based Fluorescent Film for Distributed Temperature Monitoring of Mobile Phone Integrated Chips

Altmetrics

Downloads

123

Views

40

Comments

0

A peer-reviewed article of this preprint also exists.

Submitted:

04 May 2023

Posted:

05 May 2023

You are already at the latest version

Alerts
Abstract
As one of the most critical parameters to evaluate the quality and performance of mobile phones, real-time temperature monitoring of the mobile phone integrated chips is vitally important in the electronics industry. Although several different strategies for chip surface temperature measurement have been proposed in recent years, distributed temperature monitoring with the high spatial resolution is still a hot issue to be solved urgently. In this work, a fluorescent film material with photothermal properties containing thermosensitive upconversion nanoparticles (UCNPs) and polydimethylsiloxane (PDMS) is fabricated for chip surface temperature monitor-ing. The presented fluorescent films have thicknesses ranging from 23 to 90 μm and are both flexible and elastic. Using the fluorescence intensity ratio (FIR) technique, the temperature sens-ing properties of these fluorescent films are investigated. The maximum sensitivity of the fluo-rescent film was measured to be 1.43% K-1 at 299 K. By testing the temperature at different posi-tions of the optical film, a distributed temperature monitoring with a high spatial resolution down to 10 μm on the chip surface is successfully achieved. It is worth mentioning that the film maintains stable performance even under pull stretch up to 100%. The correctness of the method is verified by taking infrared images of the chip surface with an infrared camera. These results demonstrate that the as-prepared optical film is a promising anti-deformation material for high spatial resolution temperature monitoring on-chip surfaces.
Keywords: 
Subject: Physical Sciences  -   Optics and Photonics

1. Introduction

In recent years, the continuous development of science and technology has made mobile phones a necessity for personal and global wireless communication [1,2]. With the advent of large-scale integrated circuits and the advancement of consumer electronics, it is the current industry trend to integrate more and more functions into mobile phones while continuing to reduce weight and rapidly minimise device feature sizes[3,4]. Higher integration and smaller size lead to a significant increase in power density, which makes it important to achieve high-precision, high-sensitivity, and reliable temperature measurement of integrated chips at various scales[5]. The main reason is that elevated temperatures may increase circuit delays, while chips are susceptible to excessive temperature and shorten chip life[6,7,8]. The traditional thermometers that obtain the thermal behavior of chips, such as liquid glass thermometers and various types of electronic thermometers, cannot meet the requirements of harsh environments (high electromagnetic field interference, corrosive environments, etc.) and small spaces, real-time, and rapid temperature measurement, resulting in inaccurate monitoring signals[9,10,11]. When measuring the temperature of chips, traditional infrared measurement methods are known to suffer from several limitations, including destructiveness, low spatial resolution, and limited accuracy. [12,13]. Therefore, real-time monitoring of chip temperature during normal operation and obtaining temperature distribution during safe operation are crucial measures to ensure the reliability of the chip.
Ratiometric optical thermometers have gained extensive attention in the field of high-precision and high-sensitivity temperature measurement due to their ability to accurately measure temperature under conditions of power fluctuation and luminous loss[14,15,16,17,18,19,20]. Among the ratiometric optical thermometers, those based on Er3+/Yb3+ co-doping in different host matrices are the most widely studied, as Er3+ has abundant ladder-like arranged energy levels and Yb3+ has a sensitization effect that can produce strong green-upconversion luminescence (UCL) [20,21]. By exciting the 980 nm laser, the transition of the 2H11/24I15/2 and 4S3/24I15/2 energy levels can occur, thereby producing an upconversion luminescence fluorescence intensity ratio (FIR) [22,23,24]. FIR technology establishes the relationship between temperature and optical signal by taking advantage of the excellent thermal coupling characteristics between the 2H11/2 and 4S3/2 levels of Er3+, thereby allowing it to achieve high-quality temperature sensing under various extreme conditions, such as high voltage and strong electromagnetic fields, to reduce the influence of external environmental interference in the process of fluorescence recording[25,26,27]. Core-shell NaYF4:Er3+/Yb3+@NaYF4 upconversion nanoparticles are highly regarded for their exceptional fluorescence efficiency and strong temperature dependence, positioning them as promising materials for the development of high-precision and high-sensitivity temperature sensors [28,29].
Combining upconversion materials that can convert thermal radiation into light signals with polymer materials, which are materials with a polymer structure, results in a composite material with dual functionality that can be used for high-precision temperature measurements. This composite material has advantages such as high spatial resolution, high sensitivity, and non-contact measurement [30,31,32,33]. In the realm of microelectronics, high spatial resolution temperature distribution is vital in real-time monitoring of circuit temperature and offering feedback, which can improve circuit reliability and extend the lifespan of electronic components [34]. Consequently, the development and implementation of UCNP/polymer optical films as distributed temperature sensors presents a promising avenue for future research.
In this study, Polydimethylsiloxane (PDMS) was chosen as the polymer host due to its high light transmittance and simple curing process. β-NaYF4: Er3+/Yb3+@NaYF4 was synthesized by thermal decomposition technology, and bright green upconversion fluorescence can be observed by the naked eye under the excitation of a 980 nm laser. Optical films with photothermal properties were fabricated containing β-NaYF4: Er3+/Yb3+@NaYF4 UCNPs/PDMS. The maximum sensitivity of the optical film was measured as 1.43% K-1 at 299 K. This result indicates that the fabricated optical film can be used for temperature monitoring. It is worth mentioning that the film maintains stable performance even under pull stretch up to 100%. Experiments show that the film can be used to monitor the temperature of mobile phone chips in real-time and achieve high spatial resolution distribution temperature measurement. The reported polymer-based optical temperature measurement films have great application potential in temperature measurement of integrated circuits and mobile phone chips.

2. Materials and Methods

2.1. Chemicals

All chemical reagents were obtained from Aladdin (Beijing, China) and used without further purification. Ammonium fluoride (NH4F, > 98%), sodium hydroxide (NaOH, > 98%), 1- octadecene (ODE, 90%), oleic acid (OA, 90%), yttrium chloride (YCl3, 99%), ytterbium chloride (YbCl3, 99%), erbium chloride (ErCl3, 99%), methanol, chloroform, cyclohexane, ethanol and polydimethylsiloxane (PDMS SYLGARD 184).

2.2. Synthesis of NaYF4:Er3+/Yb3+@NaYF4 nanoparticles

Synthesis of NaYF4:Er3+/Yb3+. Weighed and mixed 1 mmol of lanthanide chloride (ErCl3, YbCl3, and YCl3) with a ratio of 2:18:80, dissolved in 10 mL of methanol. Added 15 mL of ODE and 10 mL of OA into a 100 mL three-neck flask, and then added the above methanol mixture. The reaction environment was purged with Ar airflow to ensure that no oxygen was present during the entire reaction. The mixed solution was stirred continuously with a magnetic stirrer to ensure uniform heating. The three-neck flask was heated to 150 °C and maintained for 30 min. After cooling to room temperature, 13 mL of methanol solution containing 4 mmol of NH4F and 2.5 mmol of s NaOH was added into the three-neck flask. The mixture was then heated to 150 °C and maintained for 30 min to completely evaporate the methanol in the mixture. The three-neck flask was then heated to 300 °C for 90 min. After heating, the reaction was stopped, and the sample was naturally cooled to room temperature. The upconversion nanoparticles were prepared by washing the mixture with anhydrous ethanol through centrifugation, sonication, and precipitation steps. Repeat the washing steps until the dispersed solution of the sample becomes clear and transparent. Finally, the obtained sample was dried at 60 °C for 24 h to obtain NaYF4:Er3+/Yb3+ nanoparticles.
Synthesis of NaYF4:Er3+/Yb3+@NaYF4. NaYF4:Er3+/Yb3+@NaYF4 was prepared using a similar strategy as described above. 15 mL of ODE, 10 mL of OA, and 1 mmol of YCl3 chloride were dissolved in 10 mL of methanol and placed into a 100 mL three-necked flask. Ar airflow was continuously introduced to ensure an oxygen-free reaction environment. A magnetic stirrer was added and stirred continuously to ensure uniform heating of the mixed solution. The mixture was heated at 150 °C for 30 minutes. After cooling to room temperature, a 13 mL methanol solution containing 4 mmol of ammonium fluoride, 2.5 mmol of sodium hydroxide, and 1 mmol of NaYF4:Er3+/Yb3+ nanoparticles was added to the flask using a pipette. The flask was heated at 150 °C for 30 minutes to evaporate the methanol completely. The flask was then heated to 300 °C for 90 minutes, and then cooled to room temperature. The resulting upconverted nanocrystals were washed with anhydrous ethanol using centrifugation, sonication, and precipitation steps. The washing process was repeated until the dispersed solution of the sample became clear. The obtained sample was dried at 60 °C for 24 hours to yield NaYF4:Er3+/Yb3+@NaYF4 nanoparticles.

2.3. Fabrication of NaYF4:Er3+/Yb3+@NaYF4-PDMS film

The specific preparation steps for the UCNPs/PDMS thin film are as follows: 0.5 g of PDMS main solvent is added to 5 ml of chloroform solution. 0.005 g of UCNPs were dissolved in 5 ml of cyclohexane. The above-mentioned two drugs were mixed with ultrasonic treatment for 1h, and stood at 60 °C for 24 hours until the cyclohexane and chloroform were completely volatilized to obtain a composite material. To the prepared composite was added 0.05 g of curing agent. Place the composite on a glass slide before the composite is cured and cover the composite with another slide. Due to adsorption and gravity, the composite is flat between the two glass slides. Then, the composite was cured in an atmosphere of 80 °C for 40 minutes. After curing, demould and clean the composite to obtain a composite film. For the specific process, see Figure S3.

2.4. Characterization

The size distribution and morphology of the as-prepared NaYF4: Er3+/Yb3+@NaYF4 UCNPs were measured by transmission electron microscopy (TEM). The crystallographic orientations of NaYF4: Er3+/Yb3+@NaYF4 UCNPs were analyzed and verified by high-resolution transmission electron microscopy (HRTEM) and X-ray diffraction (XRD, Cu Kα radiation). The morphology and distribution of UCNPs in polymer films (UCNP/PDMS) were investigated by scanning electron microscopy (SEM), TEM and elemental mapping techniques. The microscopic images of the polymer films (UCNP/PDMS) were observed using an optical microscope equipped with a CCD camera. The upconversion Luminescence (UCL) spectra of UCNPs under 980 nm laser excitation were recorded using a spectrometer.

3. Results and Discussion

Based on previous experience, NaYF4: Er3+/Yb3+@NaYF4 was synthesized with appropriate modifications using the thermal decomposition technique. Under the excitation of 980 nm laser, Yb3+ was excited to 2F5/2 after gaining energy as a sensitizer, followed by energy transfer to activate Er3+. After this Er3+ emits three emission bands corresponding to the 2H11/2 - 4I15/2, 4S3/2 - 4I15/2, 4F9/2 - 4I15/2 [35,36]. The whole process can be seen in Figure 1a. Figure 1a shows a schematic diagram of the principle by which core-shell UCNPs can enhance upconversion luminescence. The TEM image of the synthesized NaYF4:Er3+/Yb3+@NaYF4 UCNPs and the size distribution of NaYF4: Er3+/Yb3+@NaYF4 is shown in Figure S1. According to the pictures, it can be clearly observed that the NaYF4: Er3+/Yb3+@NaYF4 UCNPs form a hexagonal structure. The size of the UCNPs measured 100 times shows that the average length of NaYF4: Er3+/Yb3+@NaYF4 is about 57.11 nm and the width is about 29.56 nm. Clear lattice fringes and an overall rod-like structure can be seen in the inset of Figure 1b. The d-spacing of the two lattice fringes with the shortest distance is about 0.29 nm, which is located in the (101) plane of the β-NaYF4 crystal. In Figure 1c, the purple curve represents the diffraction pattern of the as-prepared NaYF4: Er3+/Yb3+@NaYF4, and the black straight segment parallel to the y-axis is the standard β-NaYF4 (JCPDS No. 16-0334). Through the analysis and interpretation of the XRD patterns and HRTEM images of the materials, UCNPs are nanomaterials with single crystal properties and hexagonal structure. NaYF4: Er3+/Yb3+ and NaYF4: Er3+/Yb3+@NaYF4 exhibited green upconversion luminescence macroscopically under 980nm laser excitation, and their corresponding upconversion fluorescence emission spectra are shown in Figure 1d. The upconversion fluorescence photos of NaYF4: Er3+/Yb3+ (left) and NaYF4: Er3+/Yb3+@NaYF4 (right) cyclohexane solutions under the same power of 980 nm laser excitation can be observed in the inset of Figure 1d can be seen that the right side is brighter than the left side. The energy level transitions of UCNPs at 2H11/2 - 4I15/2 and 4S3/2 - 4I15/2 correspond to green emission at 525 nm and 540 nm, respectively. Core-shell UCNPs show 8.2 and 9.3 times higher intensity compared to core-only UCNPs at 525 nm and 540 nm energy level transitions, as calculated by fluorescence spectroscopy. The stronger upconversion fluorescence intensity of core-shell structured UCNPs is attributed to the addition of an inert NaYF4 shell layer at the interface between the core and the shell. The NaYF4 shell layer can reduce surface defects and non-radiative energy transfer, thereby reducing surface quenching effects. Additionally, the shell layer can serve as an additional protective layer to prevent oxidation and degradation of rare earth ions in the core. Moreover, the shell layer can also modulate the surface properties of the core-shell UCNPs, such as altering the surface charge and increasing biocompatibility, thus presenting potential applications in biomedical imaging and therapy [37,38].
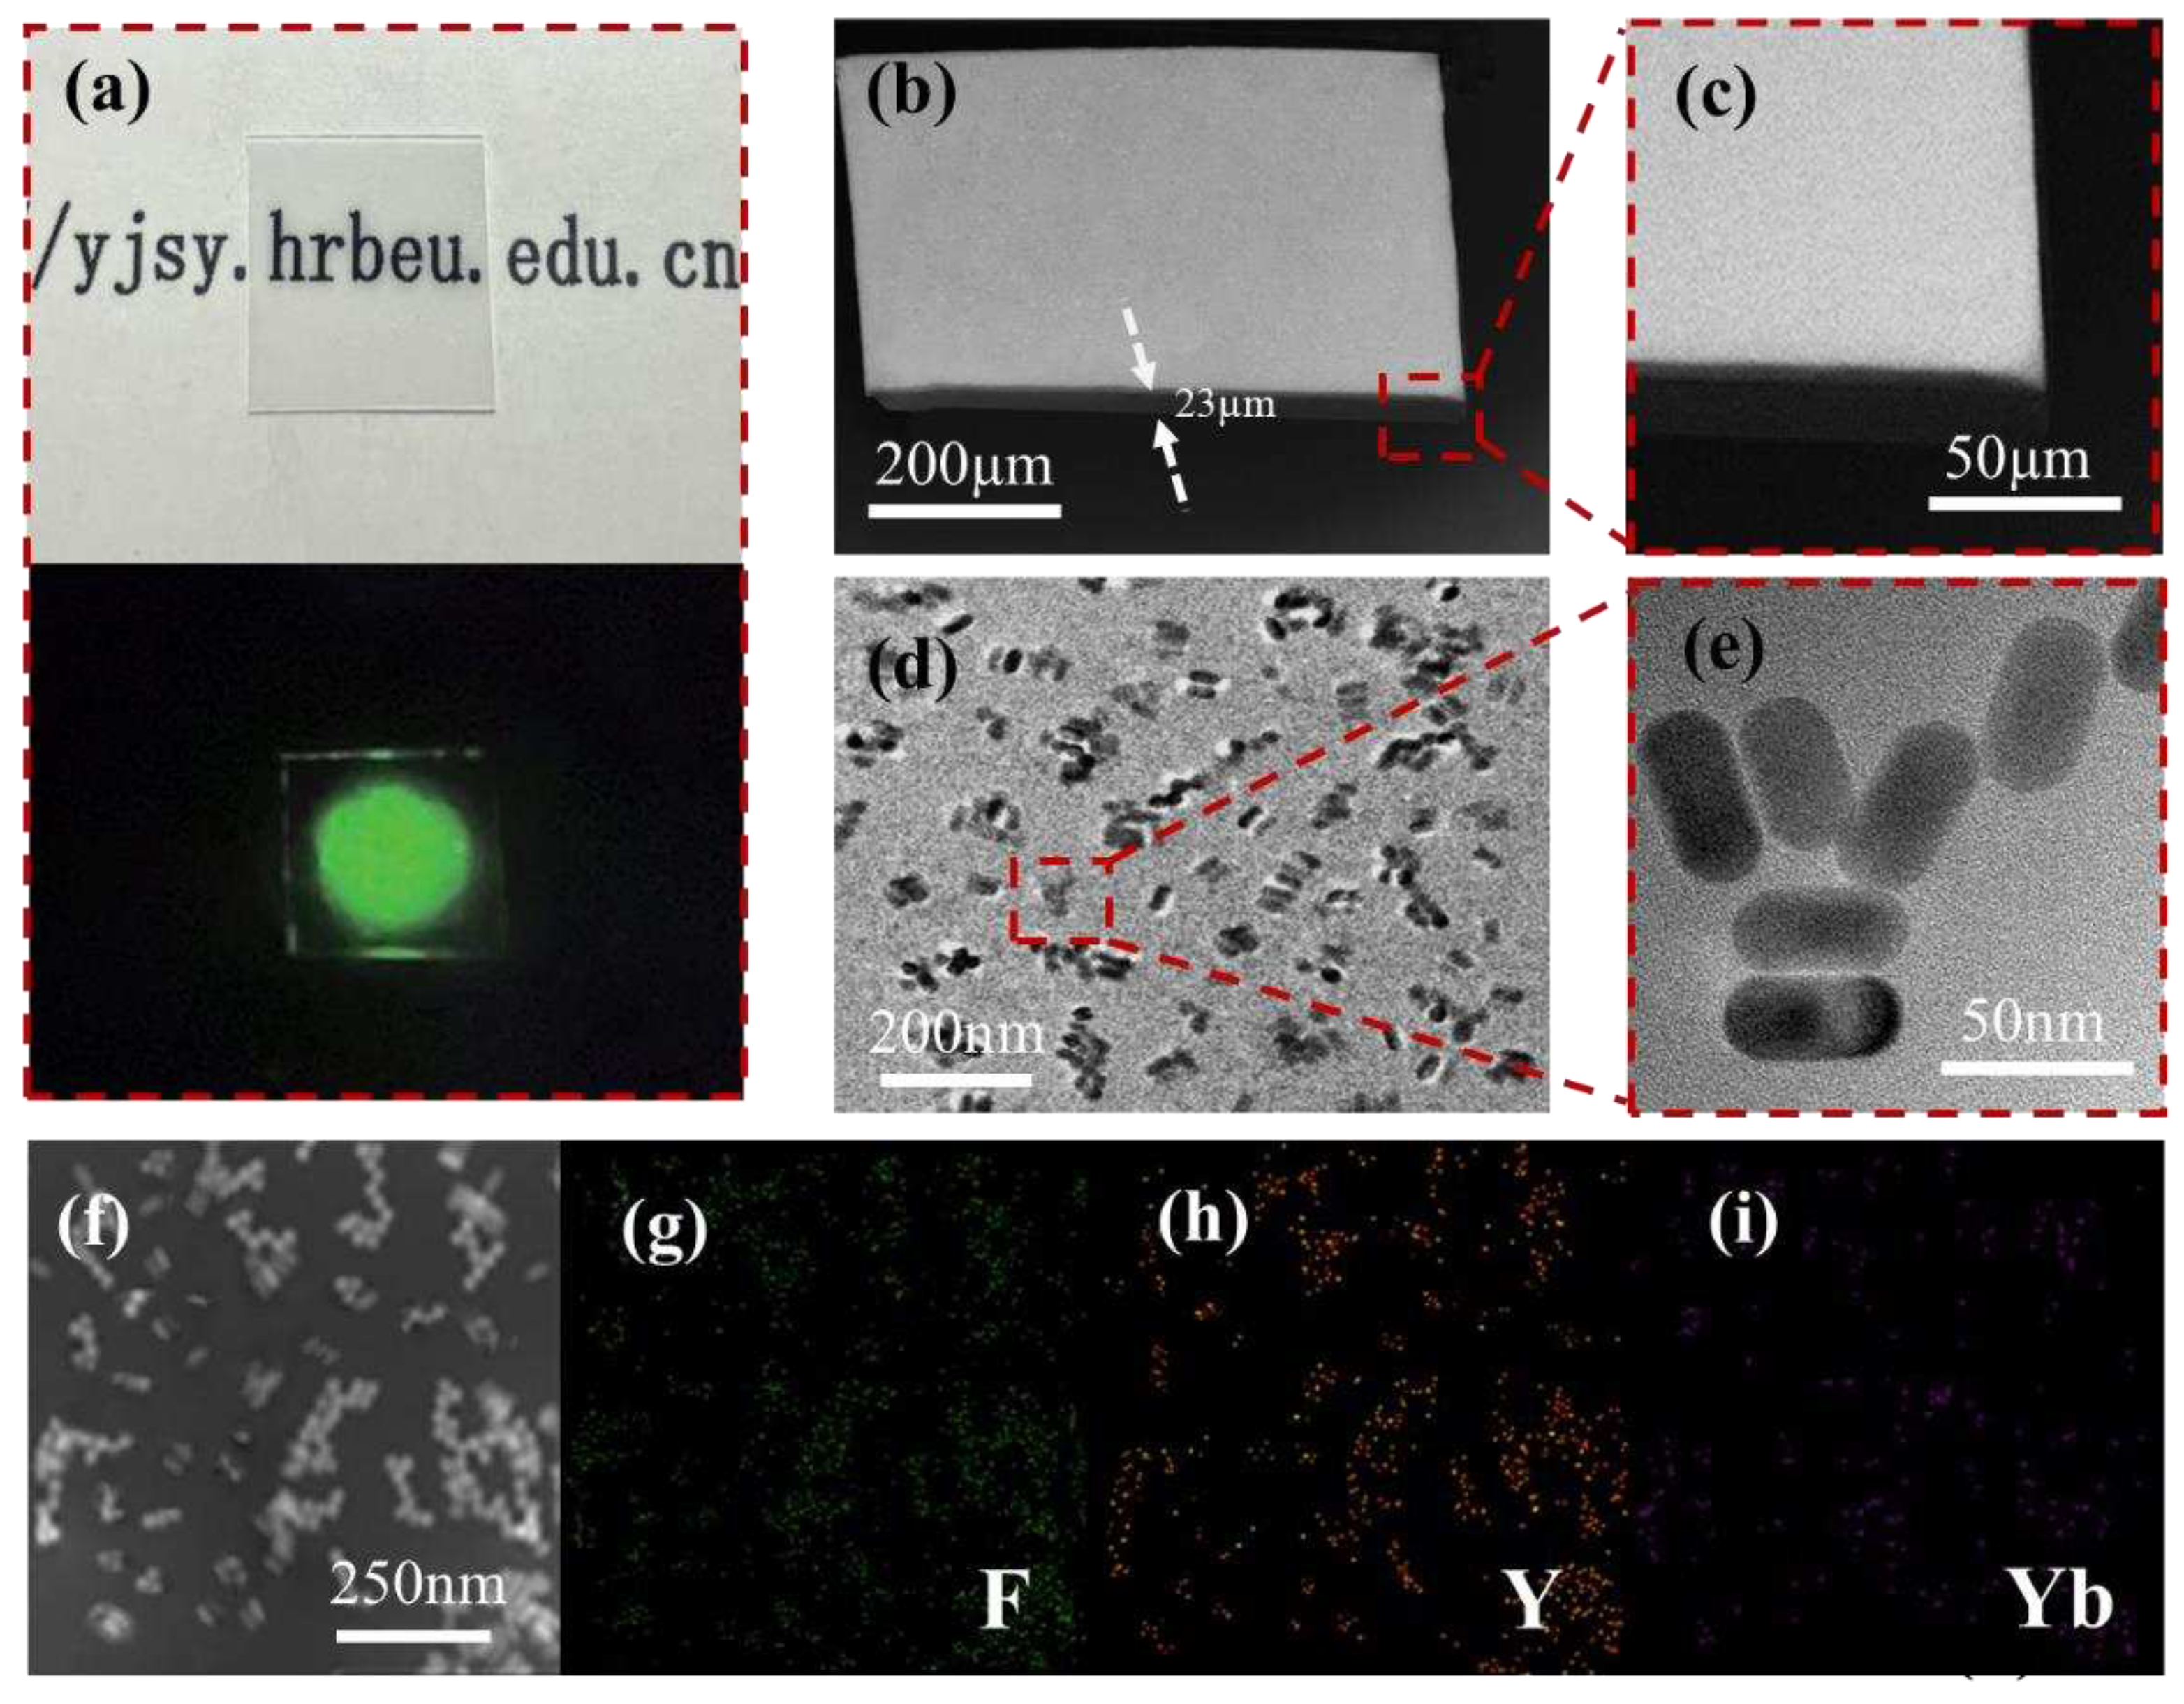
PDMS can be used as an optical waveguide material due to its excellent optical transparency and low refractive index (1.406). Its relative low dielectric constant can reduce the loss of optical signals, making it suitable as a substrate or channel for optical devices[39,40]. Based on the above advantages, we used PDMS hybrid UCNPs to fabricate fluorescent film. The curing of PDMS is based on crosslinking reactions between the base and the curing agent. Through multiple experiments, it was found that when we choose 1 wt%, the UCNPs in PDMS can maintain good optical properties. The structural features of this optical film can be analyzed and determined by SEM, TEM and elemental mapping. Figure 2a is a film (UCNP/PDMS) photograph taken by a digital camera. As shown, the film exhibits high definition in sunlight (top) and a distinct green emission (bottom) when excited by a 980 nm laser under darkfield conditions, demonstrating the excellent UCL performance of these materials. Figure 2b–c shows the SEM images of the films (UCNP/PDMS) at different scales, from which it can be seen that the films form a planar structure with a smooth surface and uniform thickness (thickness ≈ 23 μm).
The TEM images of the polymer films at different resolutions are shown in Figure 2 d–e. Large or small clusters in the film confirmed the distribution of UCNPs in the polymer, but some UCNPs may be agglomerated due to van der Waals forces[41] and electrostatic attraction[42] between their own molecules or atoms. Figure 2f–i, F, Y and Yb elements were successfully distributed in PDMS. The distribution of the remaining elements is shown in Figure S2. The distribution of various elements showed that NaYF4:Er3+/Yb3+@NaYF4 was incorporated into PDMS.
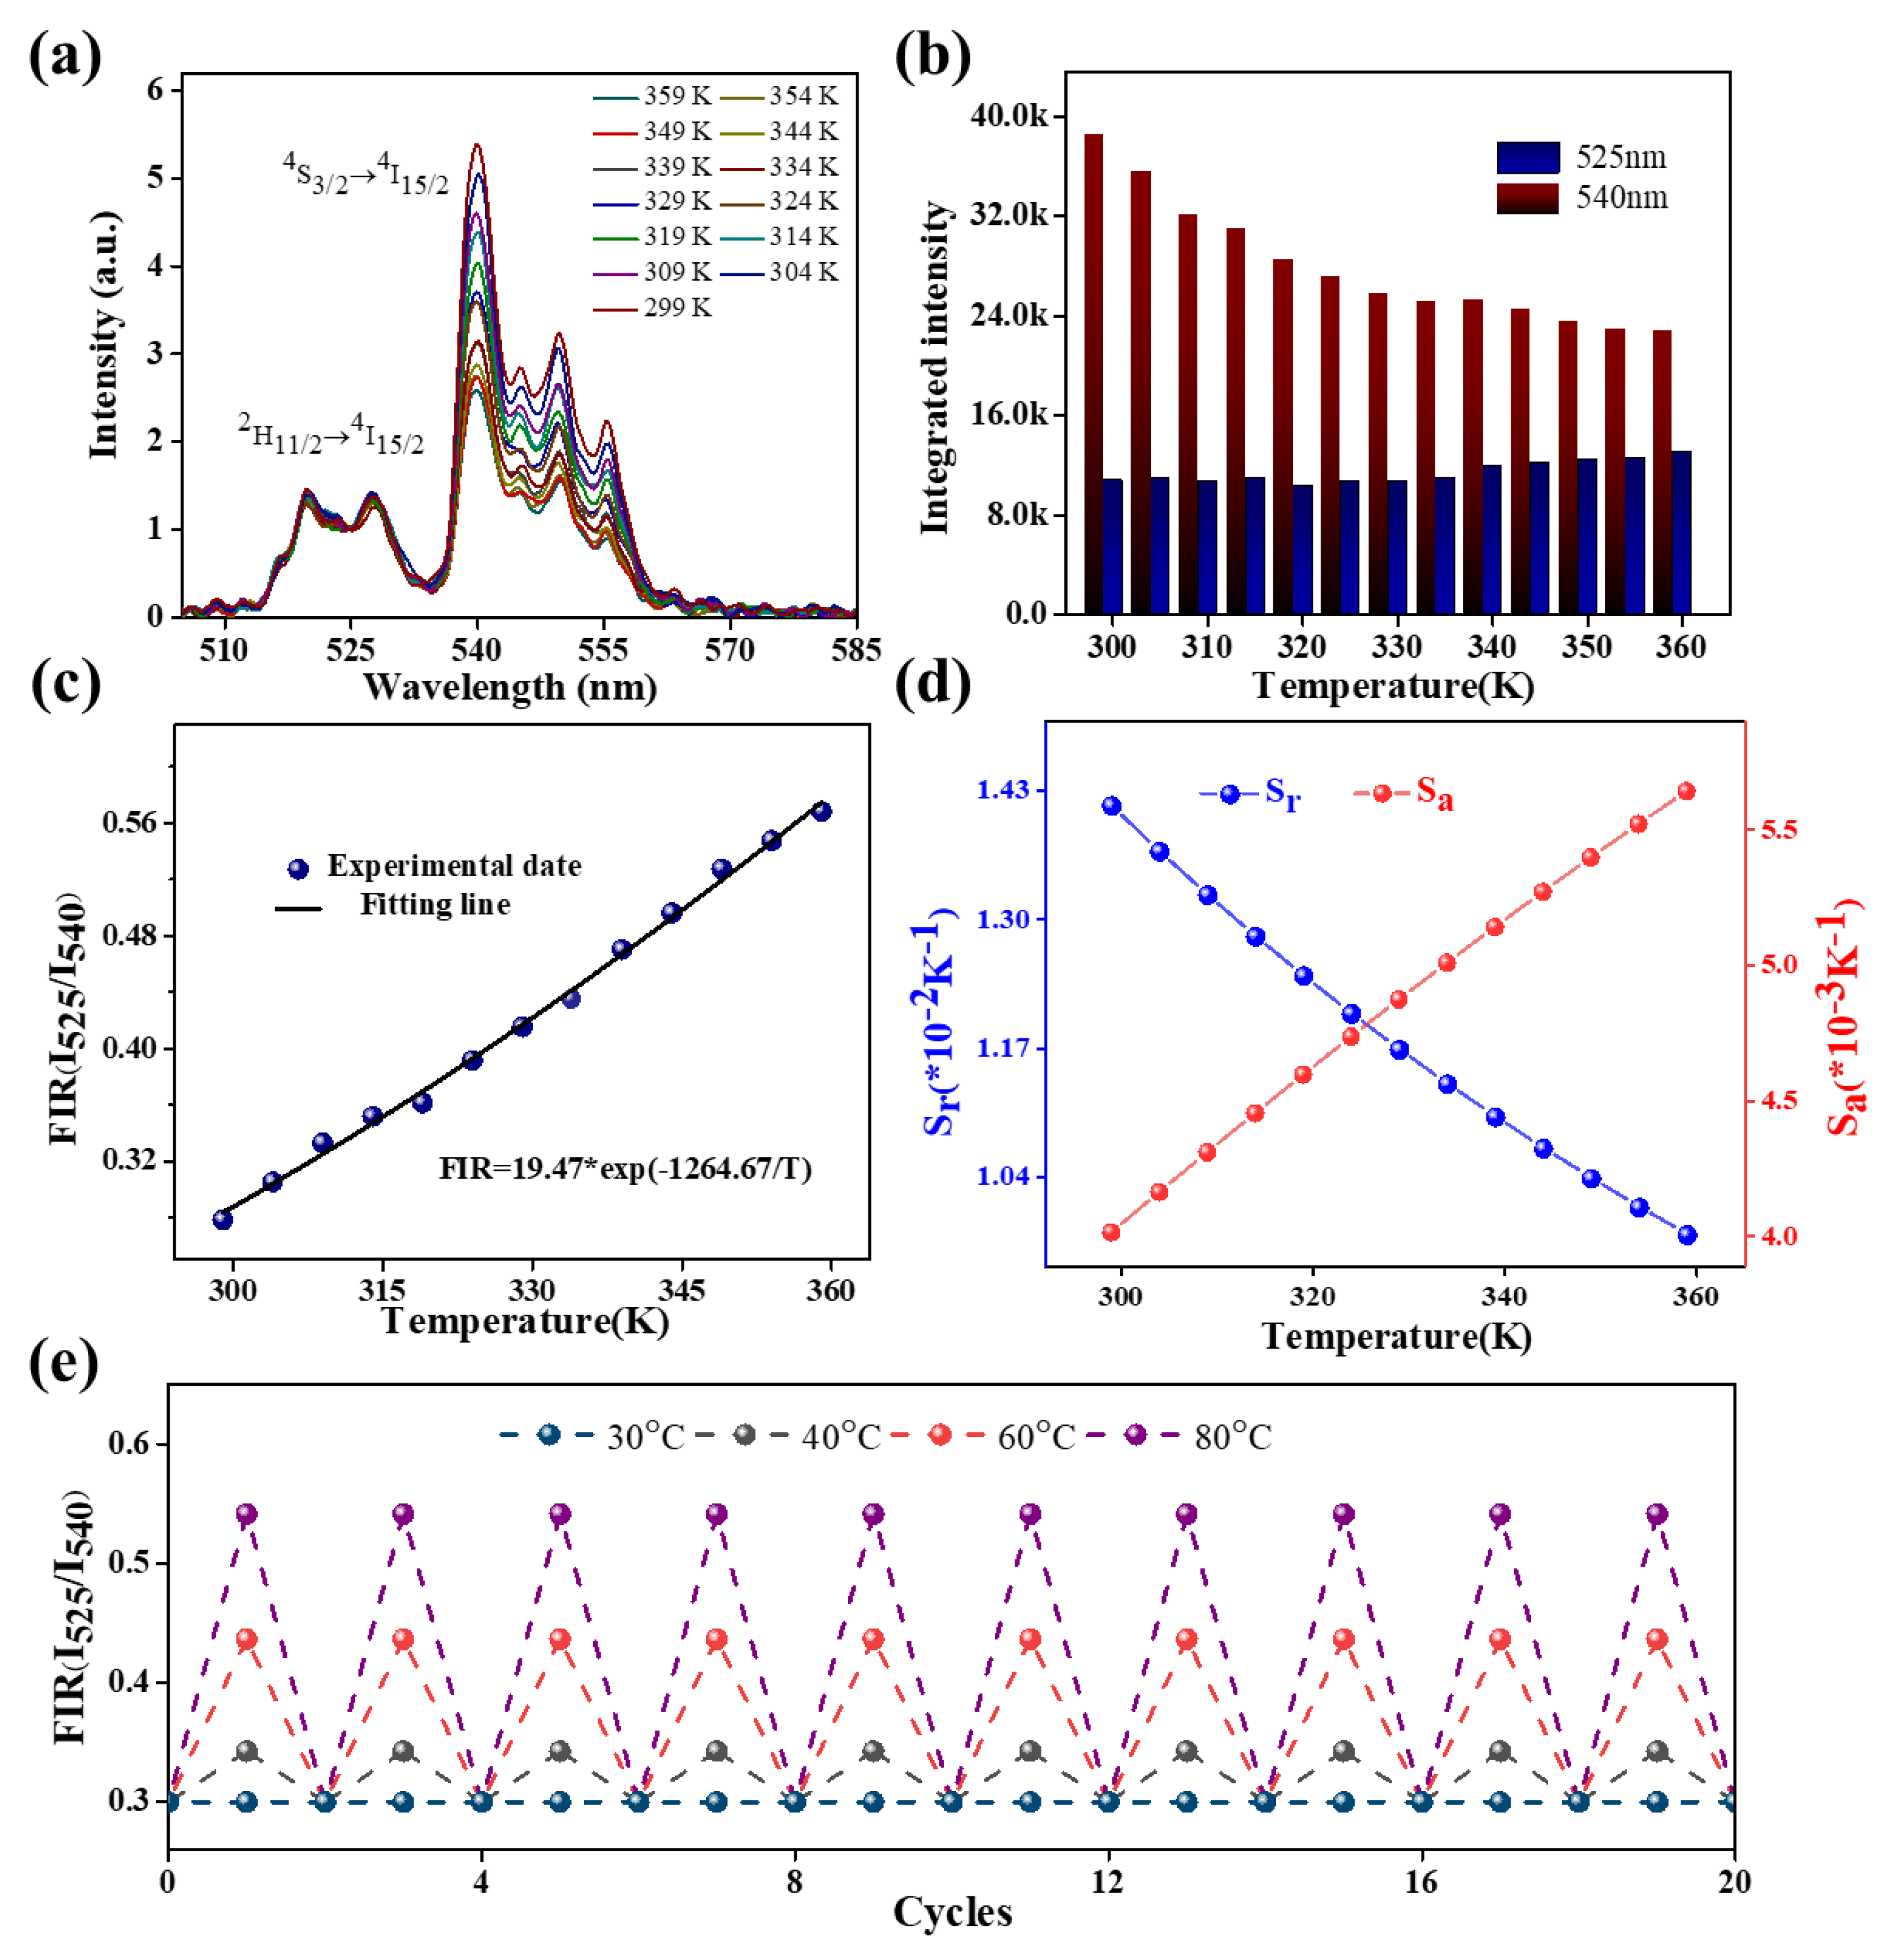
The photothermal properties of NaYF4:Er3+/Yb3+@NaYF4/PDMS films were investigated to assess the optical temperature sensing capability of the prepared polymer films. A fiber was connected to a 980nm laser (LWIRL980-7W, Laserwave) as the pump light source, and the fiber tip was placed in close proximity to the polymer film to observe green emission in the local area at a power of 5 mW. UCL spectra were recorded using a portable spectrometer (QEpro, Ocean Optics) capable of measuring upconversion fluorescence emission. The temperature around the polymer film was controlled by a temperature control device with a resolution of 0.1K that could read temperature data at any time. When the temperature was stable and the readings of the temperature control device were fixed, the spectrum was recorded. The specific equipment used to study the photothermal properties of polymer films is shown in Figure S4. Figure 3a shows the evolution of the upconversion fluorescence spectrum of the NaYF4:Er3+/Yb3+@NaYF4/PDMS film when the local temperature was increased from 299K to 359K. The images indicate that the upconversion luminescence peaks of NaYF4:Er3+/Yb3+@NaYF4 UCNPs are at 525 nm and 540 nm. As the temperature increases, the upconversion luminescence intensity at 540 nm gradually decreases, while the upconversion luminescence centered at 525 nm increases slowly. The specific intensity changes are shown in Figure 3b, and the rate of upconversion intensity changes in 2H11/2 - 4I15/2 is significantly smaller than that in 4S3/2 - 4I15/2. Due to the small energy difference existing between the 2H11/2 energy level and the 4S3/2 energy level, the ratio of the 2H11/2 - 4I15/2 transition intensity to the 4S3/2 - 4I15/2 transition intensity varies with temperature as the temperature increases [43,44]. This is the fluorescence intensity ratio (FIR) technique that can be used for temperature measurement. The population of the two thermal coupling energy levels 2H11/2 and 4S3/2 following the Boltzmann distribution law can be expressed as[33,43]:
F I R = I H I S = C e x p Δ E K T
in which IH and IS are the integrated intensities of the 2H11/2 - 4I15/2 and 4S3/2 - 4I15/2 transitions, respectively. C is a constant, ΔE represents the energy gap between 2H11/2 and 4S3/2 levels, k is the Boltzmann constant, and T is the temperature in Kelvin. Figure 3b shows the upconversion fluorescence intensity integral of the material, and notices that the IH value fluctuates at 339k, which may be caused by the instability of the excitation power. In the process of gradually increasing the temperature from 299k to 359k, the value of FIR gradually increased from 0.28 to 0.44. eqn (1) can be used to fit the relationship between temperature and FIR value more accurately. According to Figure 3c, it can be concluded that a regression coefficient (R2) fits all the measured points more accurately, and the fitting results show that the values of C and ΔE in this experiment are 19.47 and 916 cm-1, respectively. The value of ΔE shows that this is consistent with the Er3+ energy level difference.
The rate of change of FIR with temperature can be used to quantitatively characterize the temperature sensing performance of optical temperature measurement materials in practical applications. The absolute change value of FIR when the temperature changes by 1K and the relative change rate with respect to itself are usually defined as the absolute sensitivity (Sa) and relative sensitivity (Sr), respectively. For absolute sensitivity (Sa), it can be understood as the rate of change of FIR with temperature, which is calculated as follows[45]:
S a = d F I R d T = F I R Δ E K T 2
Relative sensitivity (Sr) is the normalization of absolute sensitivity (Sa) relative to FIR, which is widely used in temperature measurement[43,46].
S r = 1 F I R d F I R d T = Δ E K T 2
The fitting curves of the values of Sa and Sr in the temperature range of 299-359 K are shown in Figure 3d. It is evident from the picture that the value of Sa is proportional to the temperature, with a maximum value of 0.57 % K-1 at 359K, while the value of Sr is inversely proportional to the temperature, with a maximum value of 1.43% K-1 at 299K. The FIR values at different positions of the same membrane were measured, and the fitting curves of FIR and temperature at different positions were obtained, as shown in Figure S5. Experiments show that the photothermal properties of different positions of the same film are exactly the same, which makes it possible to use this polymer film to achieve the idea of a distributed temperature measurement method. Table 1 compares the sensitivity of several Er3+ in different host materials. Compared with some previous reports, the film used for this measurement has higher sensitivity, indicating that it has better photothermal properties. The membrane was placed in an environment of 30 °C, 30 - 40 °C, 30-60 °C, and 30-80 °C to record the FIR values cyclically, as shown in Figure 3e. This result indicates that the film has high reliability and repeatability.
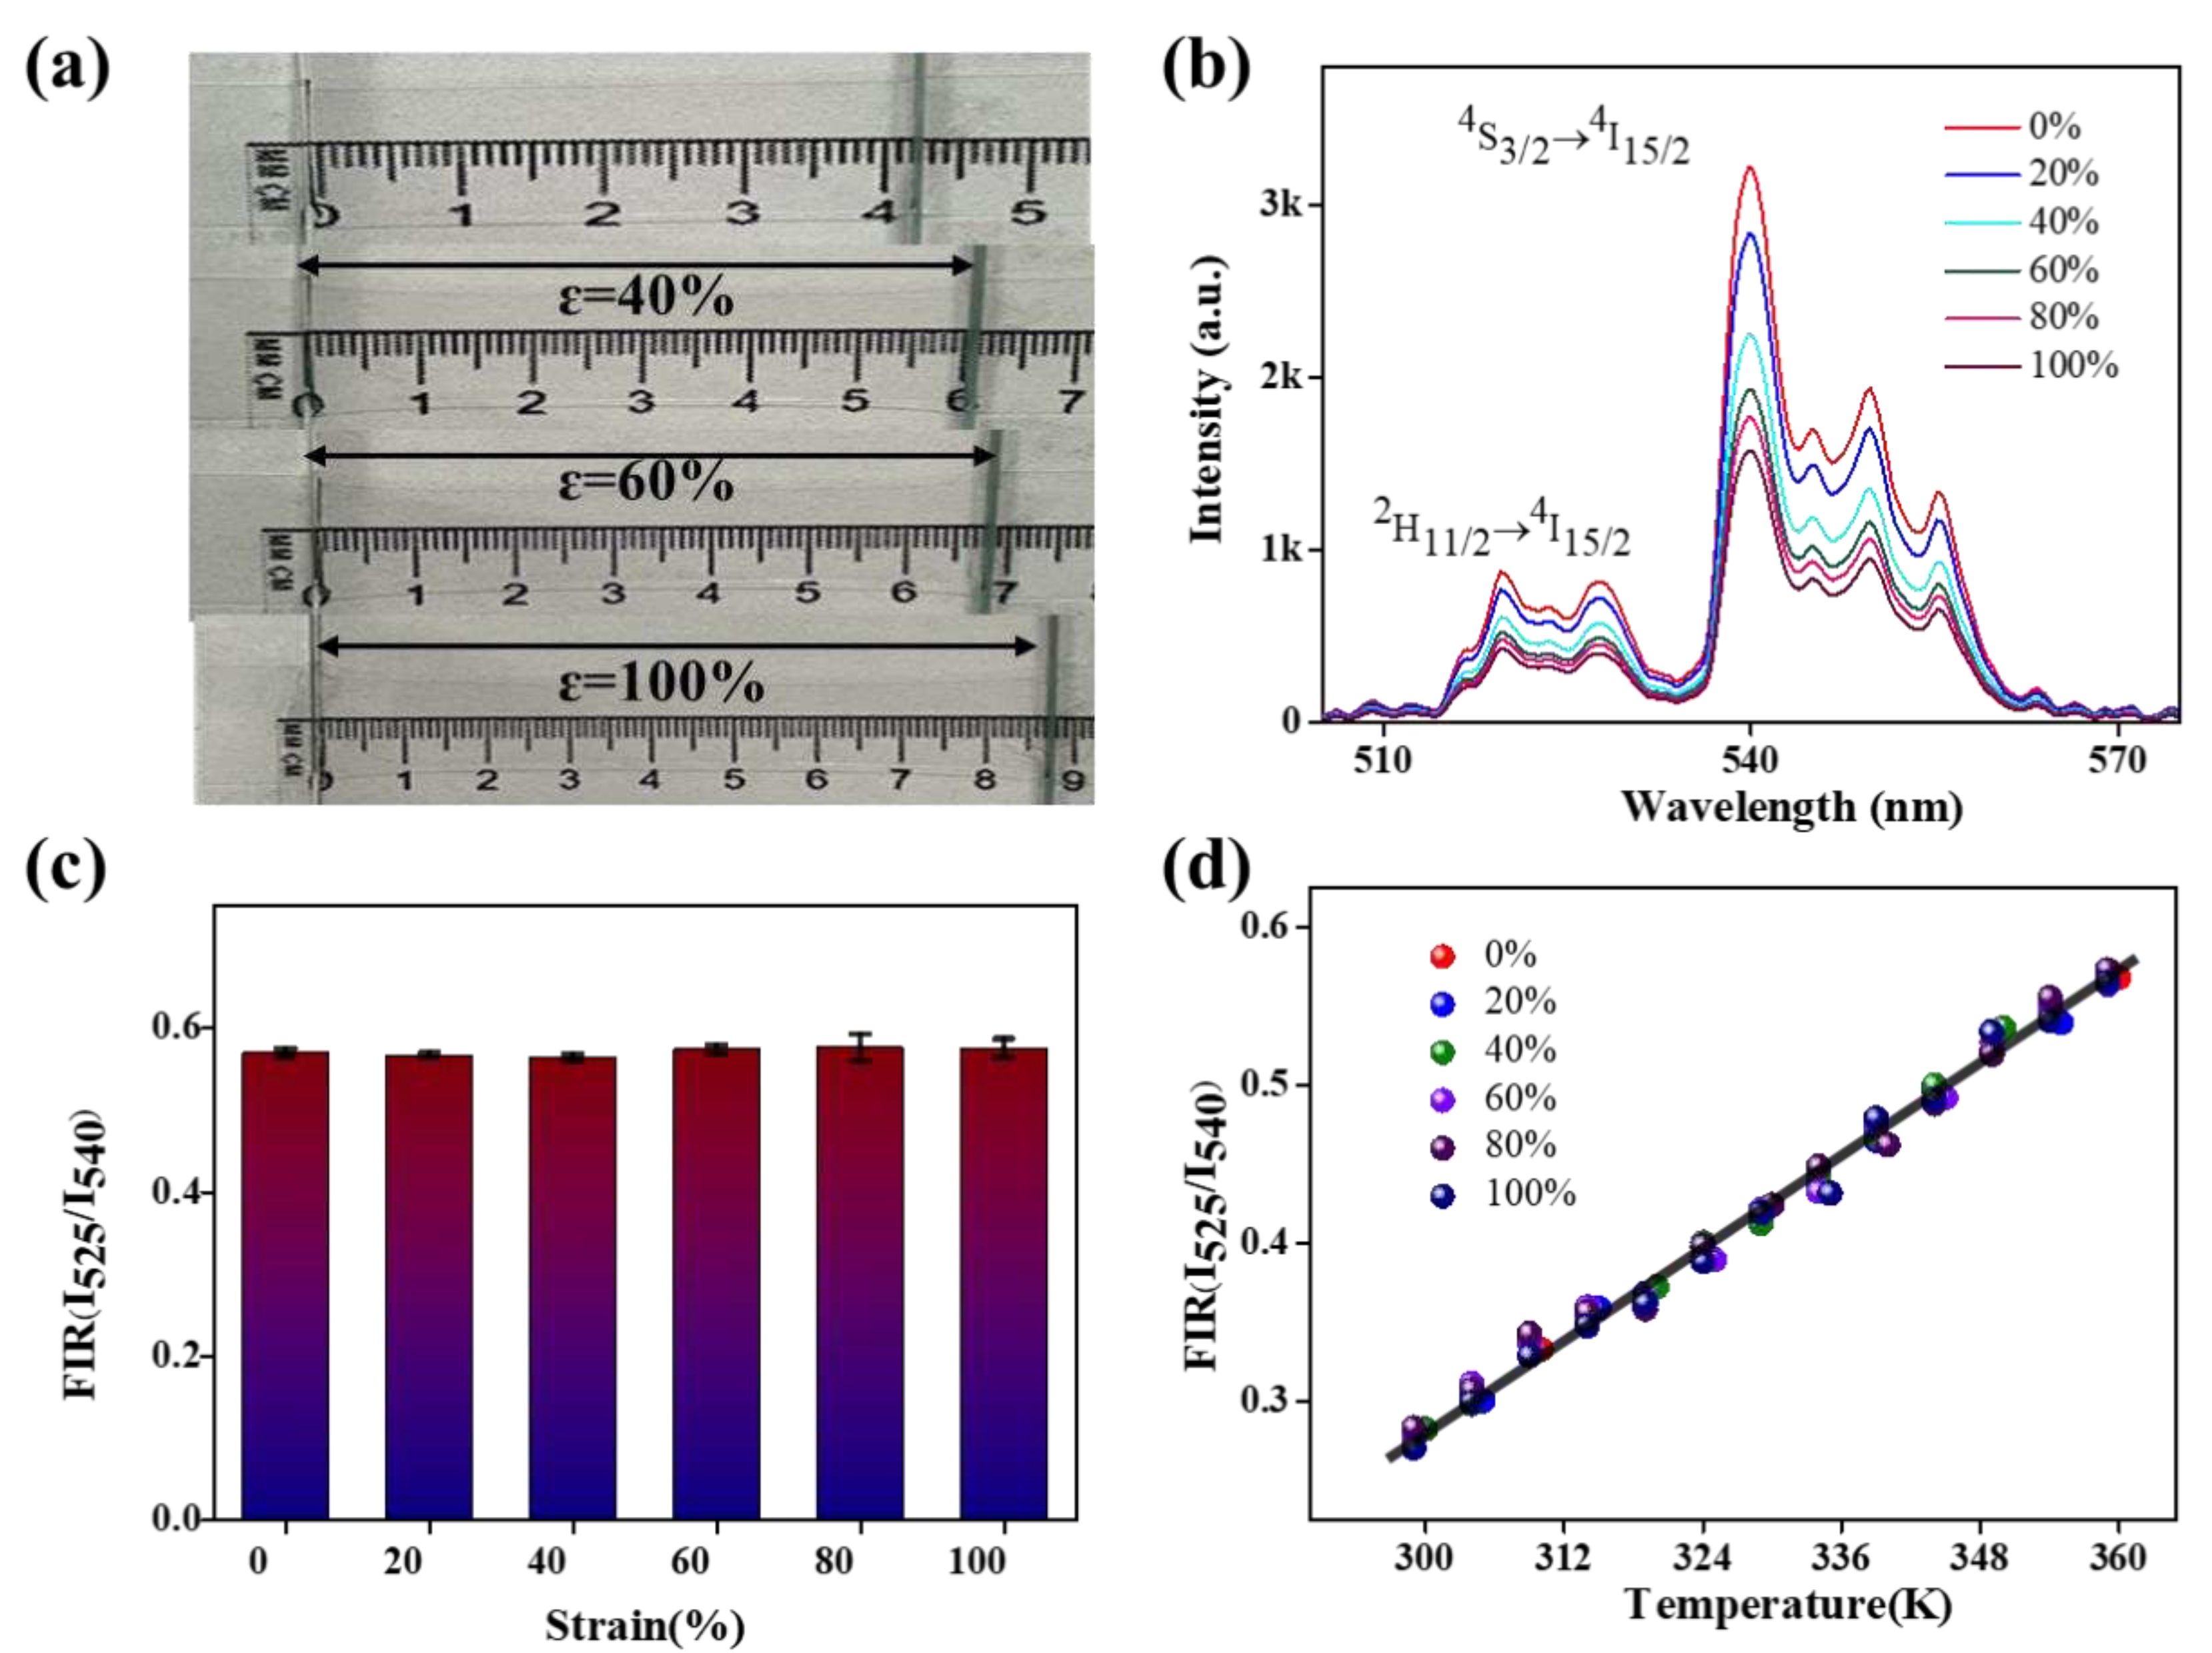
PDMS is a flexible organic silicone material with good elasticity and deformability. In practical applications, PDMS may be subjected to external forces, such as deformation and stretching. Therefore, it is necessary to study its performance and response characteristics under deformation to ensure its reliability and accuracy in complex environments. This can provide practical performance data and references for relevant applications, and can improve the design and performance of relevant instruments[31,51,52]. A polymer film of appropriate size was selected and fixed at both ends to apply opposing forces, as shown in Figure 4a. The same experimental method was used to record the photothermal characteristics of the film under different degrees of stretch.
Figure 4b shows the UCL spectra of the film under various degrees of stretching. It can be observed from the fluorescent spectrum that the UCL intensity of the film gradually decreases as the stretching strength increases, which may be due to the length of the light attenuation path. However, according to Figure 4c, the effects of different stretching strengths at the same temperature have a negligible impact on the FIR value. This suggests that the deformation has minimal impact on the experimental results when using a polymer film for temperature measurement. Figure 4d shows the relationship between the FIR values and temperatures under different degrees of deformation. The fitting curve of the FIR value and temperature in the stretched state also satisfies eqn (1) when compared with the case where there is no stretching. Furthermore, three other films of varying thicknesses were studied, and the FIRs obtained from these sensors in the 299-349 K range are shown in Figures S6-S8. Through this series of experimental results, it is demonstrated that the photothermal properties of the NaYF4:Er3+/Yb3+@NaYF4/PDMS-based polymer film can be used as a deformation-resistant optical temperature sensor due to its high sensitivity and stability.
The NaYF4: Er3+/Yb3+@ NaYF4/PDMS film prepared, benefiting from the strong anti-electromagnetic interference ability of PDMS, can be used for temperature measurement in electronic devices. Here, the Exynos7420 chip in Galaxy S6 edge+ is selected as the main research object. The optical temperature measurement of an external pump source mainly measures the average temperature of the excitation zone, and high spatial resolution distributed temperature measurement can be achieved as long as the excitation zone is as small as possible. Using a fiber tip to guide the excitation light to the film to excite the fluorescence material can achieve high sensitivity optical measurement on a small surface. The focusing principle of the fiber tip is similar to that of a lens, which can focus the light to a small area with a diameter of a few hundred nanometers without damaging the sample during measurement[53,54,55]. Therefore, a fiber optic tip with a top diameter of ≈2μm is chosen to excite the upconversion fluorescence of the film under the condition of an additional laser at 980 nm. The most important part of distributed temperature measurement is the position of the fiber optic tip, which is firmly fixed on a 3D adjustment frame with a constant excitation angle. The device for measuring the temperature of the chip surface is shown in Figure S9. A UCL spectrum is recorded by moving the 3D adjustment frame every 10μm, thereby achieving high spatial resolution temperature measurement, as shown in Figure S10.
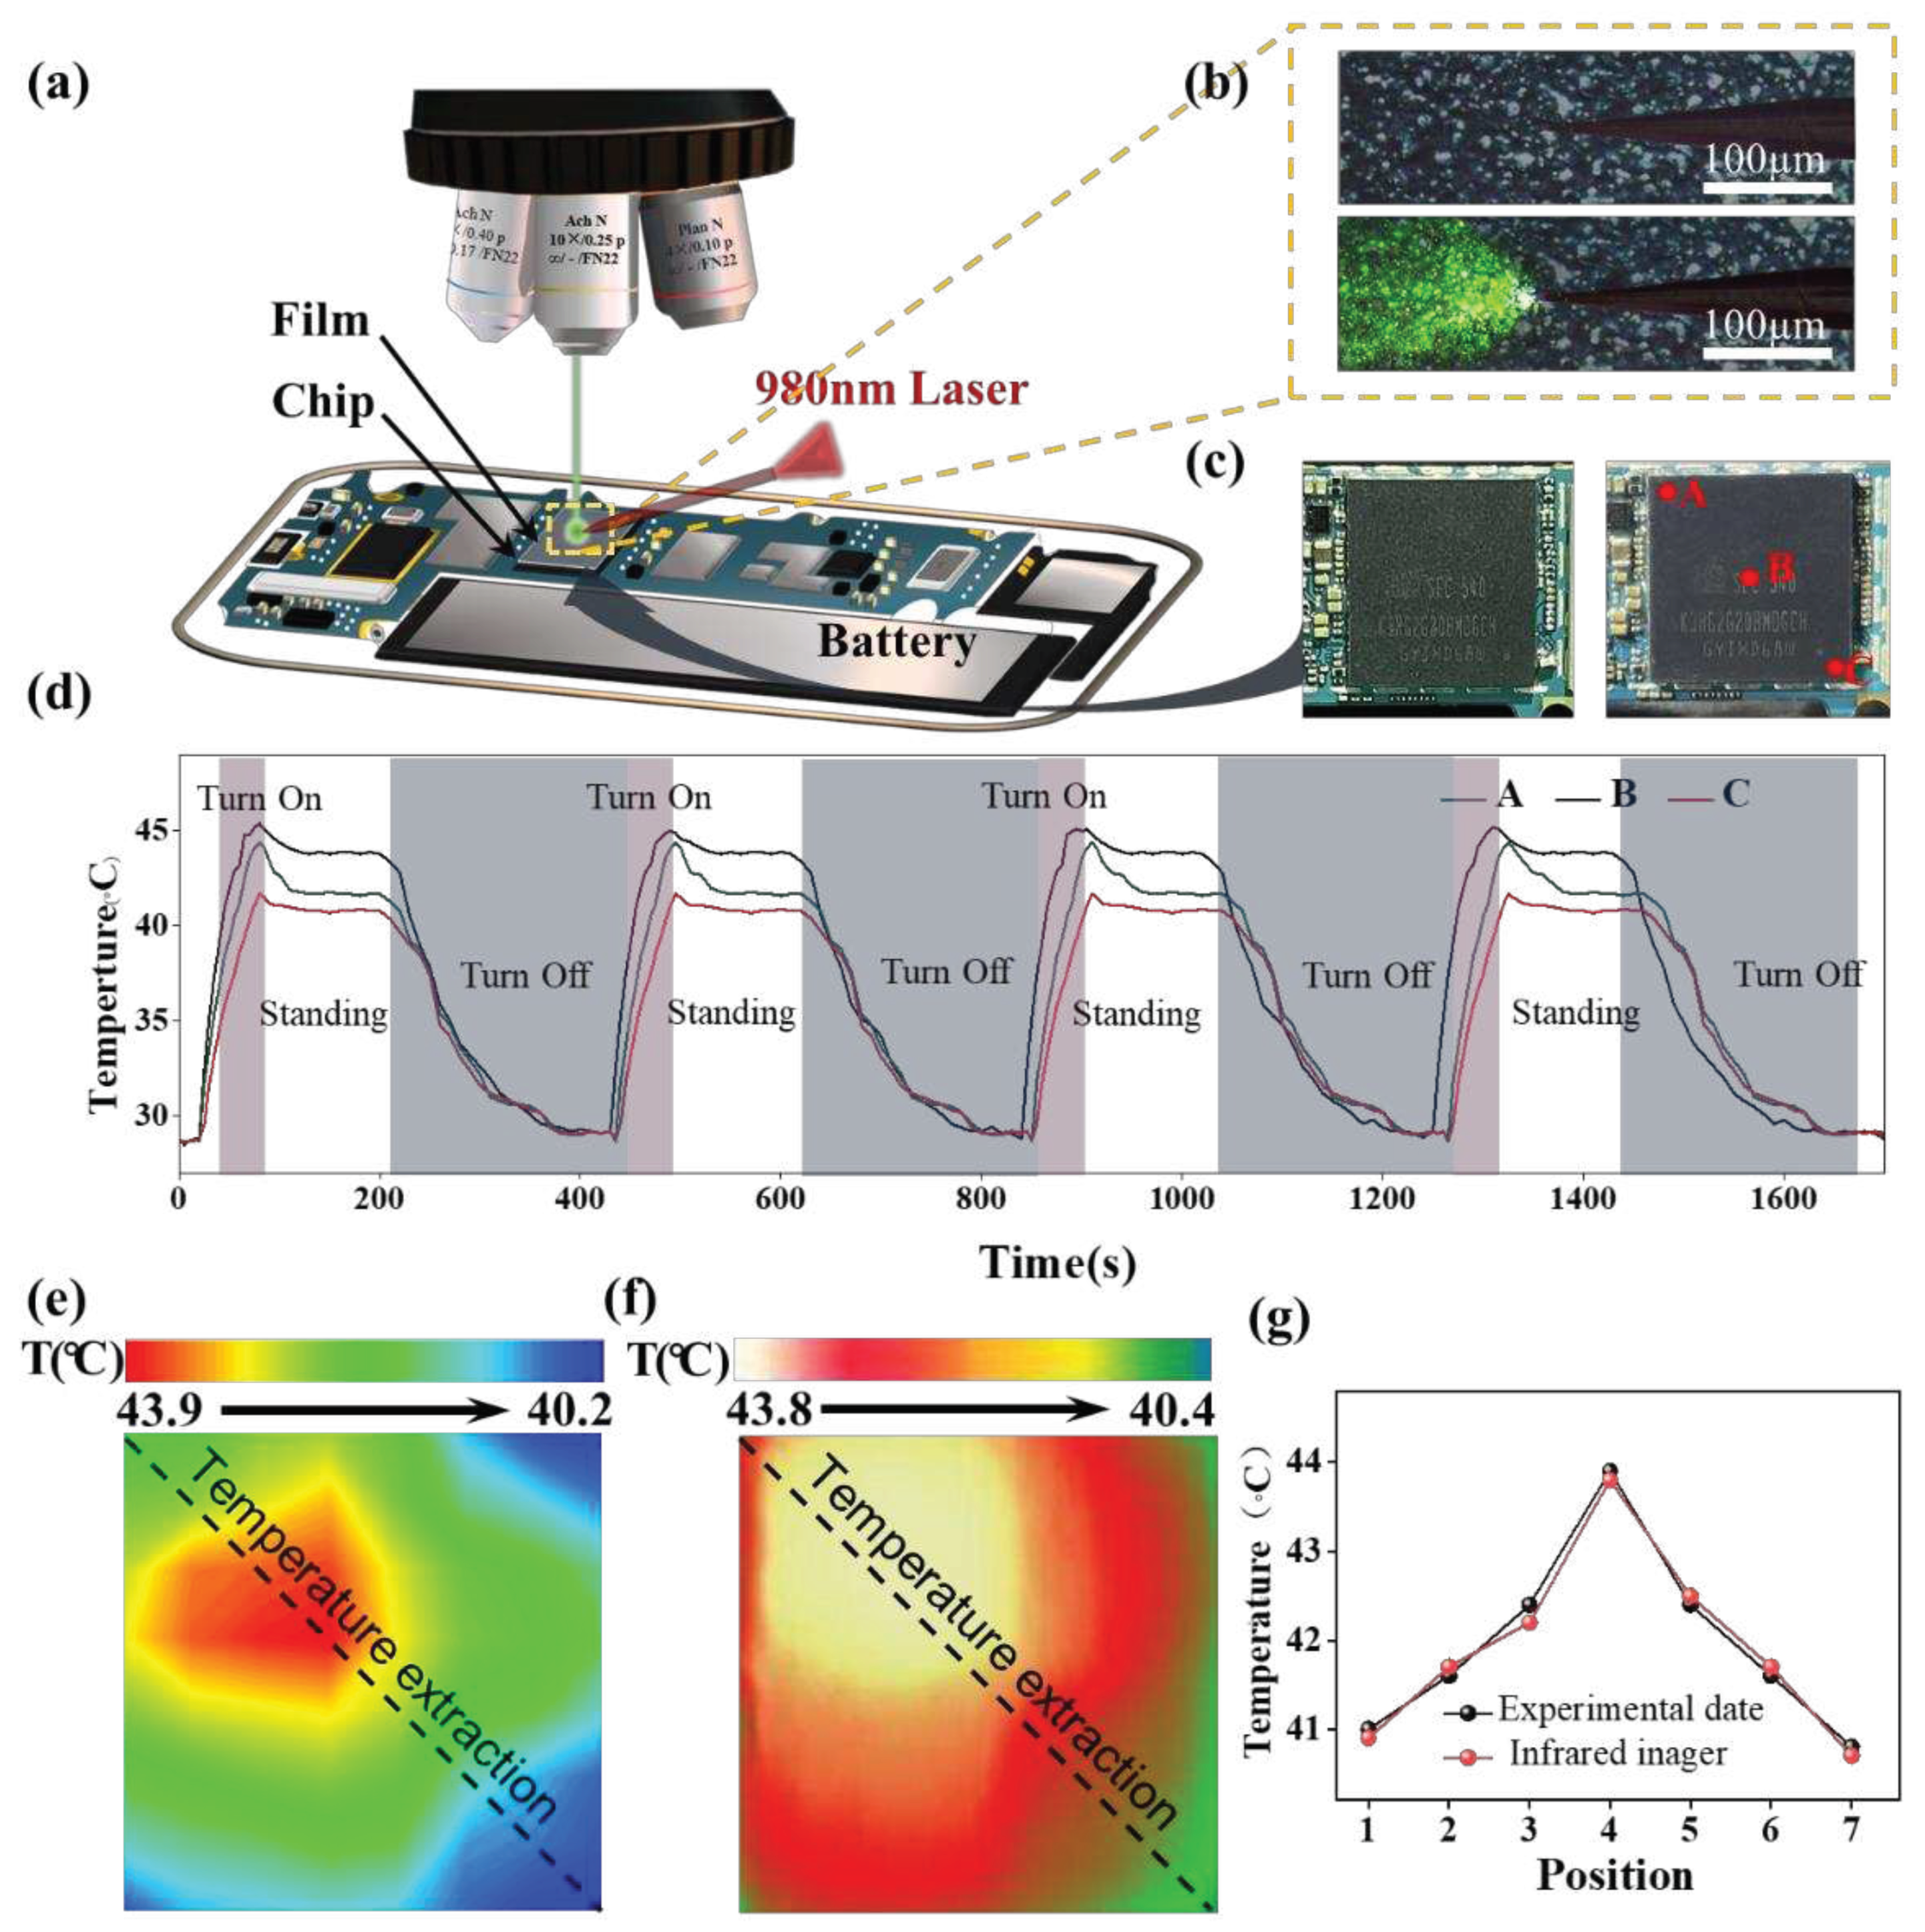
Figure 5a shows a schematic of surface temperature measurement on the chip. Figure 5b displays a micrograph of the fluorescent film on the chip surface excited by a 980 nm laser fibertip. Figure 5c shows the chip surface images before (left) and after (right) coating, with points A, B, and C selected for real-time monitoring of chip surface temperature. Figure 5d presents the temperature-time relationship of points A, B, and C during repeated on-off cycles. The phone temperature gradually rises within 30 seconds after the phone is turned on (pink region). After 50 seconds, when the phone is idle, the chip temperature stabilizes (blank region). After a stable period, the phone is turned off at 200 s (blue region), and the temperature is measured again during the following 1700 s. The real-time emission spectra of the fluorescent film during the on-off cycles within the first 200 s are shown in Figure S11. The entire chip is divided into 7x7 regions, and four temperature measurements are taken at the center of each region to obtain the average temperature of the entire area. Figure 5e displays the chip surface temperature distribution measured by the fluorescent film. Figure 5F shows the chip surface temperature distribution measured by an infrared camera (Hikvision DS-TPH10-3AUF). By comparing the two sets of data, seven identical temperature collection points are extracted along the temperature extraction line, as shown in Figure 5g. The correctness of the temperature measurement method is validated by comparing the experimental data with the infrared imaging results. It is evident that the temperature trend measured by the fluorescent-doped polymer film is entirely consistent with the one obtained from the infrared thermal imaging, which proves that the prepared film has excellent temperature measurement performance. The distributed temperature monitoring of the chip surface with high spatial resolution as low as 10 μm has been successfully realized, providing more accurate and precise information for research and applications in various fields. This method has significant application value for the design, manufacturing, and performance improvement of microelectronic devices.
Comparing the temperature distribution of different types of mobile phone chips is of great significance for understanding their thermal performance and improving their design. Using the same measurement method as described above, the surface temperature distribution of the MTK6752 chip in the Vivo X5s, the Kirin970 chip in the Huawei p20, and the A10 chip in the iPhone 7plus under stable operation was measured, as shown in the figure S12. Table 2 compares the different surface temperature distributions of different types of mobile phone chips based on upconversion materials, providing valuable insights into the thermal characteristics of these chips. The temperature difference of the Kirin970 chip is at least 2.3°C. In addition, the highest temperature of the Samsung Exynos7420 is 43.9°C, while the lowest temperature of the Apple A10 is 34.7°C. These findings contribute to improving the design of mobile phone chips to enhance their thermal performance and reduce energy consumption. As mobile phone chips become more powerful, their thermal performance becomes increasingly important for maintaining their reliability and lifespan. Future development scenarios will involve the use of advanced cooling technologies such as heat pipes and liquid cooling to effectively dissipate the heat generated by mobile phone chips. Developing more efficient and reliable cooling technologies is crucial for the design and performance of future mobile phones.

4. Conclusions

To summarize, a soft and stretchable fluorescent thermometric film has been developed successfully that can be used for real-time monitoring of electronic integrated chips. The film is composed of fluorescent films (UCNP/PDMS) with thicknesses ranging from 23-90 μm, flat surfaces, and a uniform thickness that was manufactured using a simple method. The morphology of NaYF4: Er3+/Yb3+@ NaYF4 nanoparticles in PDMS was found to be unaffected, as confirmed by characterization. The Er3+-based films showed high sensitivity within the temperature range of 299-359K, with a sensitivity coefficient of 1.43%K-1 at 299K, when using FIR technology. Remarkably, the photothermal properties of this film were found to be unaffected by deformation, such as stretching, which is of great importance for further research on portable and wearable sensors. In addition, the prepared optical film has high spatial resolution (10 μm) and is suitable for surface and distributed temperature measurements of four different types of mobile phone chips. Furthermore, the optical film's small size, high sensitivity, and resistance to strong electromagnetic interference make it well-suited for use in microelectronic applications. It is an anti-deformation material that can monitor and provide real-time feedback on circuits.

Supplementary Materials

The following supporting information can be downloaded at the website of this paper posted on Preprints.org., Figure S1: HRTEM image, TEM image and size distribution of NaYF4:Yb/Er@NaYF4; Figure S2: The element maps of UCNPs/PDMS; Figure S3: The preparation process of the optical film; Figure S4: Schematic diagram of fluorescent film temperature sensing device; Figure S5: FIR values at different positions of the film; Figure S6: The temperature sensitivity of fluorescent film with the thickness of ≈67μm; Figure S7: The temperature sensitivity of fluorescent film with the thickness of ≈67μm; Figure S8: The temperature sensitivity of fluorescent film with the thickness of ≈80μm; Figure S9: Chip temperature monitoring setup diagram; Figure S10: Distributed temperature measurement at the interval of 10μm; Figure S11: The real-time changing spectrum of the chip center points collected of the first 200s; Figure S12: The chip surface temperature measured was MediaTek 6752, Huawei Qilin 970, and Apple A10.

Author Contributions

Conceptualization, Li, H.Y.; and Yu, M.; methodology, Dai, J.C.; software, Zhou, G.Q.; validation, Sun, J.P., Li, H.Y. and Yu, M.; formal analysis, Yu, M.; investigation, Yu, M.; resources, Zhou, G.Q.; data curation, Li, H.Y.; writing—original draft preparation, Yu, M.; writing—review and editing, Yu, M; visualization, Yu, M; supervision, Dai, J.C.; project administration, Dai, J.C.; funding acquisition, Yu, M. All authors have read and agreed to the published version of the manuscript.

Funding

This research was funded by National Natural Science Foundation of China (52271344); National Key R & D plan of the Ministry of science and technology (2018YFC0310102); Joint fund for weapons and equipment (6141B020702); Natural Science Foundation of Heilongjiang Province of China (LH2021E032).

Data Availability Statement

The data presented in this study are available on request from the corresponding author.

Conflicts of Interest

The authors declare no conflict of interest.

References

  1. Brites, C.D.; Xie, X.; Debasu, M.L.; Qin, X.; Chen, R.; Huang, W.; Rocha, J.; Liu, X.; Carlos, L.D. Instantaneous ballistic velocity of suspended Brownian nanocrystals measured by upconversion nanothermometry. Nat. Nanotechnol. 2016, 11, 851. [Google Scholar] [CrossRef]
  2. Suo, H.; Zhao, X.; Zhang, Z.; Li, T.; Goldys, E.M.; Guo, C. Constructing multiform morphologies of YF: Er3+/Yb3+ up-conversion nano/micro-crystals towards sub-tissue thermometry. Chem. Eng. J. 2017, 313, 65. [Google Scholar] [CrossRef]
  3. Wang, Z.; Ananias, D.; Carne´-Sa´nchez, A.; Brites, C. D. S.; Imaz, I.; Maspoch, D.; Rocha, J.; Carlos, D. Adv. Funct. Mater. 2015, 25, 2824. [CrossRef]
  4. Luo, Z.; Cho, H.; Luo, X.; Cho, K. I. System thermal analysis for mobile phone. Applied Thermal Engineering. 2008, 28, 1889–1895. [Google Scholar] [CrossRef]
  5. Puddu, M.; Stark, W.J.; Grass, R.N. Silica microcapsules for long-term, robust, and reliable room temperature rna preservation. Small. 2016, 12, 452. [Google Scholar] [CrossRef] [PubMed]
  6. Oleksandr, A.; Savchuk, J.J.; Carvajal, C.; Cascales, M.; Aguilo. Benefits of Silica Core–Shell Structures on the Temperature Sensing Properties of Er, Yb: GdVO4 Up-Conversion Nanoparticles. J. Mater. Chem. C 2016, 4, 6602.
  7. Borkar, S. Tackling variability and reliability challenges. In IEEE Computer Society Prress. 2006, 23, 520. [Google Scholar] [CrossRef]
  8. Naouss, M.; Marc, F. Design and implementation of a low cost test bench to assess the reliability of FPGA. Microelectron Reliab 2015, 55, 1341–1345. [Google Scholar] [CrossRef]
  9. Amrouch, H.; Ebi, T.; Schneider, J.; Parameswaran, S.; Henkel, J. Analyzing the thermal hotspots in FPGA-based embedded systems. International Conference on Field Programmable Logic & Applications 2013, 1–4. [Google Scholar]
  10. Avenas, Y.; Dupont, L.; Khatir, Z. Temperature measurement of power semiconductor devices by thermo-sensitive electrical parameters-a review. IEEE Trans Power Electron. 2011, 27, 27,3081–3092. [Google Scholar] [CrossRef]
  11. Grimes, R.; Walsh, E.; Walsh, P. Active Cooling Of A Mobile Phone Handset. Applied Thermal Engineering 2010, 30, 2363–2369. [Google Scholar] [CrossRef]
  12. Yu, W.J.; Feng, S.W.; Zhang, Y.M.; Shi, B.B. Temperature distribution measurement based on field-programmable gate array embedded ring oscillators. Solid-State Electronics 2019, 158, 16–21. [Google Scholar] [CrossRef]
  13. Heckmann, T.; Mcevoy, J.P.; Markantonakis, K.; Akram, R.N. Removing epoxy underfill between neighbouring components using acid for component chip-off. Naccache, Digital Investigation 2019, 29, 198–209. [Google Scholar] [CrossRef]
  14. Suo, H.; Zhao, X.Q.; Zhang, Z.Y.; Shi, R.; Wu, Y.F.; Xiang, J.M.; Guo, C.F. Local symmetric distortion boosted photon up-conversion and thermometric sensitivity in lanthanum oxide nanospheres. Nanoscale. 2018, 10, 9245. [Google Scholar] [CrossRef] [PubMed]
  15. Sheng, C.; Zheng, J.; Zhao, J.; Yang, Z.; Fang, X. Temperature sensors: robust and stable ratiometric temperature sensor based on Zn-In-S quantum dots with intrinsic dual-dopant ion emissions. Adv. Funct. Mater. 2016, 26, 7224. [Google Scholar]
  16. Gao, G.J.; Busko, D.; Kauffmann-Weiss, S.; Turshatov, A.; Howard, I. A.; Richards, B. S. Wide-range non-contact fluorescence intensity ratio thermometer based on Yb3+ /Nd3+ co-doped La2O3 microcrystals operating from 290 to 1230 K. J. Mater. Chem. C. 2018, 6, 4163. [Google Scholar] [CrossRef]
  17. Pan, Y.; Xie, X.J.; Huang, Q.W.; Gao, C.; Wang, Y.B.; Wang, L.X. Inherently Eu2+/Eu3+ codoped Sc2O3 nanoparticles as high-performance nanothermometers. Adv. Mater. 2018, 30, 1705256. [Google Scholar] [CrossRef]
  18. Back, M.; Trave, E.; Ueda, J. Tanabe S. Ratiometric optical thermometer based on dual near-infrared emission in Cr3+-doped bismuth-based gallate host. Chem. Mater 2016, 28, 8347. [Google Scholar] [CrossRef]
  19. Jin, Y.; Pang, T. Highly efficient green upconversion luminescence of ZnMoO4:Yb3+/Er3+/Li+ for accurate temperature sensing. Spectrochim. Acta. Part A. 2019, 211, 306. [Google Scholar] [CrossRef]
  20. Zˇ, Antic´.; Dramicánin, M.D.; Prashanthi, K.; Jovanovic´, D.; Kzman S.; Thundat, T.; Pulsed Laser Deposited Dysprosium-Doped Gadolinium–Vanadate Thin Films for Noncontact, Self-Referencing Luminescence Thermometry. Adv. Mater. 2016, 28, 7745. [CrossRef]
  21. Debasu, M.L.; Amanias, D.; Pastoriza-Santos, I.; Liz-Matzan, L. M.; Rochaand, J.; Carlos, L.D. All-In-One Optical Heater-Thermometer Nanoplatform Operative From 300 to 2000 K Based on Er3+ Emission and Blackbody Radiation. Adv. Mater. 2013, 25, 4868. [Google Scholar] [CrossRef] [PubMed]
  22. Gao, Y.; Huang, F.; Lin, H.; Zhou, J.C.; Xu, J.; Wang, Y.S. A Novel Optical Thermometry Strategy Based on Diverse Thermal Response from Two Intervalence Charge Transfer States. Adv. Funct. Mater. 2016, 26, 3139. [Google Scholar] [CrossRef]
  23. Savchuk, O.A.; Carvajal, J.J.; Cascles, C.; Aguiloánd, M.; Dıáz,F. Benefits of Silica Core–Shell Structures on the Temperature Sensing Properties of Er,Yb:GdVO4 Up-Conversion Nanoparticles. ACS Appl. Mater. Interfaces 2016, 8, 7266. [CrossRef] [PubMed]
  24. Liu, L.X.; Qin, F.; Lv, T.Q.; Zhang, Z.G.; Cao, W.W. Accurate thermometry based on the red and green fluorescence intensity ratio in NaYF4: Yb, Er nanocrystals for bioapplication. Opt. Lett. 2016, 41, 4664. [Google Scholar] [CrossRef] [PubMed]
  25. Xiang, G.T.; Xia, Q.; Liu, X.T.; Wang, X.J. Optical thermometry based on the thermally coupled energy levels of Er3+ in upconversion materials. Dalton Transactions 2020, 49, 17115–17120. [Google Scholar] [CrossRef] [PubMed]
  26. Pang, T.; Wan, W.J.; Qian, D.L.; Liu, Z.L. Calibration of optical temperature sensing of Ca1-xNaxMoO4:Yb3+, Er3+ with intense green up-conversion luminescence. Alloys Compd. 2019, 771, 571. [Google Scholar] [CrossRef]
  27. Tu, Y.Y.; Zhao, S.L.; He, D.Y.; Wu, T.; Zhang, H.; Lei, R.S.; Huang, L.H.; Xu, S.Q. A portable all-fiber thermometer based on the fluorescence intensity ratio (FIR) technique in rare earth doped TeO2–WO3–La2O3–Na2O glass. J. Mater. Chem. C. 2018, 6, 7063. [Google Scholar] [CrossRef]
  28. Messias, D.N.; Vermelho, M.; Gouveia-Neto, A.S.; Aitchison, J.S. All optical integrated upconversion fluorescence-based point temperature sensing system using Er3+-doped silica-on-silicon waveguides. Rev. Sci. Instrum. 2002, 73, 476–479. [Google Scholar] [CrossRef]
  29. Mai, H.; Zhang, Y.; Sun, L.; Yan, C. Highly Efficient Multicolor Up-Conversion Emissions and Their Mechanisms of Monodisperse NaYF4:Yb, Er Core and Core/Shell-Structured Nanocrystals. J. Phys. Chem. C. 2007, 111, 13721–13729. [Google Scholar] [CrossRef]
  30. Wang, Y.; Zheng, K.; Song, S.; Fan, D.; Zhang, H.; Liu, X. Remote manipulation of upconversion luminescence. Chem. Soc. Rev. 2018, 47, 6473–6485. [Google Scholar] [CrossRef]
  31. Gao, H.; Hu, H.; Zhao, Y.; Li, J.; Lei, M.; &amp, *!!! REPLACE !!!*; Zhang, Y.; Zhang, Y. Highly-sensitive optical fiber temperature sensors based on PDMS/silica hybrid fiber structures. Sensors and Actuators A: Physical 2018, 284, 22–27. [Google Scholar] [CrossRef]
  32. Hua, Y.b.; Yu, J.S. Synthesis and luminescent properties of near-UV excited NaLa(MoO4)2:Er3+ phosphors for multifunctional applications. Journal of Alloys and Compounds. 2019, 811, 152050. [Google Scholar] [CrossRef]
  33. Cai, D.; Zhu, D.H.; Yuan, X.; Wei, G.D.; Li, H.B.; Zhao, J.L.; Han, W. Thermally stable luminescence of Mn2+ in Mn doped CsPbCl3 nanocrystals embedded in polydimethylsiloxane films. Journal of Luminescence. 2018, 202, 157–162. [Google Scholar] [CrossRef]
  34. Tong, L.; Li, X.; Hua, R.; Cheng, L.; Sun, J.; Zhang, J.; Xu, S.; Zheng, H.; Zhang, Y.; Chen, B. Microwave-assisted hydrothermal synthesis, temperature quenching and laser-induced heating effect of hexagonal microplate β-NaYF4: Er3+/Yb3+ microcrystals under 1550 nm laser irradiation. Curr. Appl. Phys. 2017, 17, 999–1004. [Google Scholar] [CrossRef]
  35. Zhang, H.; Zhao, S.L.; Wang, X.L.; Ren, X.T.; Ye, J.T.; Huang, L.H.; Xu, S.Q. The enhanced photoluminescence and temperature sensing performance in rare earth doped SrMoO4 phosphors by aliovalent doping: from material design to device applications. J. Mater. Chem. C. 2020, 7, 15007–15013. [Google Scholar] [CrossRef]
  36. Peng, Y. P.; Lu, W.; Ren, P.; Ni, Y.; Wang, Y.; Yan, P.; Zeng, Y.-J.; Zhang, W.; Ruan, S. Multi-Band Up-Converted Lasing Behavior in NaYF4:Yb/Er Nanocrystals. Nanomaterials 2018, 8, 497. [Google Scholar] [CrossRef] [PubMed]
  37. Ju, D.; Song, F.; Khan, A.; Song, F.; Zhou, A.; Gao, X.; Hu, H.; Sang, X.; Zadkov, V. Simultaneous Dual-mode Emission and Tunable Multicolor in the Time Domain from Lanthanide-doped Core-shell Microcrystals. Nanomaterials 2018, 8, 1023. [Google Scholar] [CrossRef] [PubMed]
  38. Nahorniak, M.; Patsula, V.; Mareková, D.; Matouš, P.; Shapoval, O.; Oleksa, V.; Vosmanská, M.; Machová Urdzíková, L.; Jendelová, P.; Herynek, V.; Horák, D. Chemical and Colloidal Stability of Polymer-Coated NaYF4:Yb,Er Nanoparticles in Aqueous Media and Viability of Cells: The Effect of a Protective Coating. Int. J. Mol. Sci. 2023, 24, 2724. [Google Scholar] [CrossRef]
  39. Yadhuraj, S.R.; Gandla, S.B.; Sudarshan, B.G.; Prasanna Kumar, S.C. Preparation and Study of PDMS Material. Materials Today: Proceedings. 2018, 5, 21406–21412. [Google Scholar] [CrossRef]
  40. Wang, Z.; Lin, S.; Liu, Y.; Hou, J.; Xu, X.; Zhao, X.; Wei, B. Influence of NaYF4 Inert and Active Layer on Upconversion Luminescence. Nanomaterials 2022, 12, 3288. [Google Scholar] [CrossRef]
  41. Guo, J.J.; Zhou, B.Q.; Yang, C.X.; Dai, Q.H.; Kong, L.J. Stretchable and upconversion-luminescent polymeric optical sensor for wearable multifunctional sensing. Optics Letters. 2019, 44, 5747–5750. [Google Scholar] [CrossRef] [PubMed]
  42. Chockalingam, S.; Roth, C.; Henzel, T.; Cohen, T. Probing local nonlinear viscoelastic properties in soft materials. Journal of the Mechanics and Physics of Solids. 2021, 146, 104172. [Google Scholar] [CrossRef]
  43. Li, H.Y.; Wei, F.; Li, Y.Z.; Yu, M.; Zhang, Y.; Liu, L.; Liu, Z.H. Optical fiber sensor based on upconversion nanoparticles for internal temperature monitoring of Li-ion batteries. J. Mater. Chem. C. 2021, 9, 14757–14765. [Google Scholar] [CrossRef]
  44. Seethapathy, S.; Gorecki, T. Applications of polydimethylsiloxane in analytical chemistry: A review. Analytica Chimica Acta. 2012, 750, 48–62. [Google Scholar] [CrossRef]
  45. Sheng, W.; Wang, X.; Tao, Y.; Yan, X. Detecting Variable Resistance by Fluorescence Intensity Ratio Technology. Sensors 2019, 19, 2400. [Google Scholar] [CrossRef]
  46. Xu, L.; Wang, M.; Chen, Q.; Yang, J.; Zheng, W.; Lv, G.; Quan, Z.; Li, C. Rare Earth Hydroxide as a Precursor for Controlled Fabrication of Uniform β-NaYF4 Nanoparticles: A Novel, Low Cost, and Facile Method. Molecules 2019, 24, 357. [Google Scholar] [CrossRef]
  47. Gao, J.; Ren, X.; Yang, K.; Zhao, S.; Huang, L.; Xu, S. Detection of hydrogen concentration based on an all-fiber fluorescence intensity ratio optical thermometer with Er3+/Yb3+ codoped NaBi(WO4)2 phosphors. Optik 2021, 242, 167280. [Google Scholar] [CrossRef]
  48. Wu, T.; Zhao, S.; Lei, R.; Huang, L.; Xu, S. Optical thermometry based on green upconversion emission in Er3+/Yb3+ codoped BaGdF5 glass ceramics.Mater. Res. Express 2018, 5, 025201. [Google Scholar] [CrossRef]
  49. Dong, B.; Liu, D.P.; Wang, X.J.; Yang, T.; Miao, S.M.; Li, C.R. Optical thermometry through infrared excited green upconversion emissions in Er3+–Yb3+ codoped Al2O3. Appl. Phys. Lett. 2007, 90, 181117. [Google Scholar] [CrossRef]
  50. Zhang, H.; Ye, J.T.; Wang, X.L.; Zhao, S.L.; Lei, R.S.; Huanga, L.H.; Xu, S.Q. Highly reliable all-fiber temperature sensor based on the fluorescence intensity ratio (FIR) technique in Er3+/Yb3+ co-doped NaYF4 phosphors. J. Mater. Chem. C. 2019, 7, 15269–15275. [Google Scholar] [CrossRef]
  51. Giang, L. T. K.; Trejgis, K.; Marciniak, L.; Vu, N.; Minh, L. Q. Fabrication and characterization of up-converting β-NaYF4: Er3+, Yb3+@ NaYF4 core–shell nanoparticles for temperature sensing applications. Scientific Reports 2020, 1, 14672. [Google Scholar] [CrossRef] [PubMed]
  52. Liu, X.; Zhang, M.; Hu, G. Gain Enhancement of the Optical Waveguide Amplifier Based on NaYF4/NaLuF4: Yb, Er NPs-PMMA Integrated with a Si3N4 Slot. Nanomaterials 2022, 12, 2937. [Google Scholar] [CrossRef] [PubMed]
  53. Guo, Q.; Wu, J.; Yang, Y.; Liu, X.; Jia, J.; Dong, J.; Zhang, L.; Lin, J.M.; Huang, M.L.; Wei, Y.L.; Huang, Y.F. High performance perovskite solar cells based on β-NaYF4: Yb3+/Er3+/Sc3+@ NaYF4 core-shell upconversion nanoparticles. Journal of Power Sources 2019, 426, 178–187. [Google Scholar] [CrossRef]
  54. Li, H.Y.; Sun, X.; Shahzad, M.K.; Liu, L. Facile preparation of upconversion microfibers for efficient luminescence and distributed temperature measuremen. J. Mater. Chem. C. 2019, 7, 7984–7992. [Google Scholar] [CrossRef]
  55. Li, X.; Yang, L.; Zhu, Y.; Zhong, J.; Chen, D. Upconversion of transparent glass ceramics containing β-NaYF4: Yb3+, Er3+ nanocrystals for optical thermometry. RSC advances 2019, 14, 7948–7954. [Google Scholar] [CrossRef]
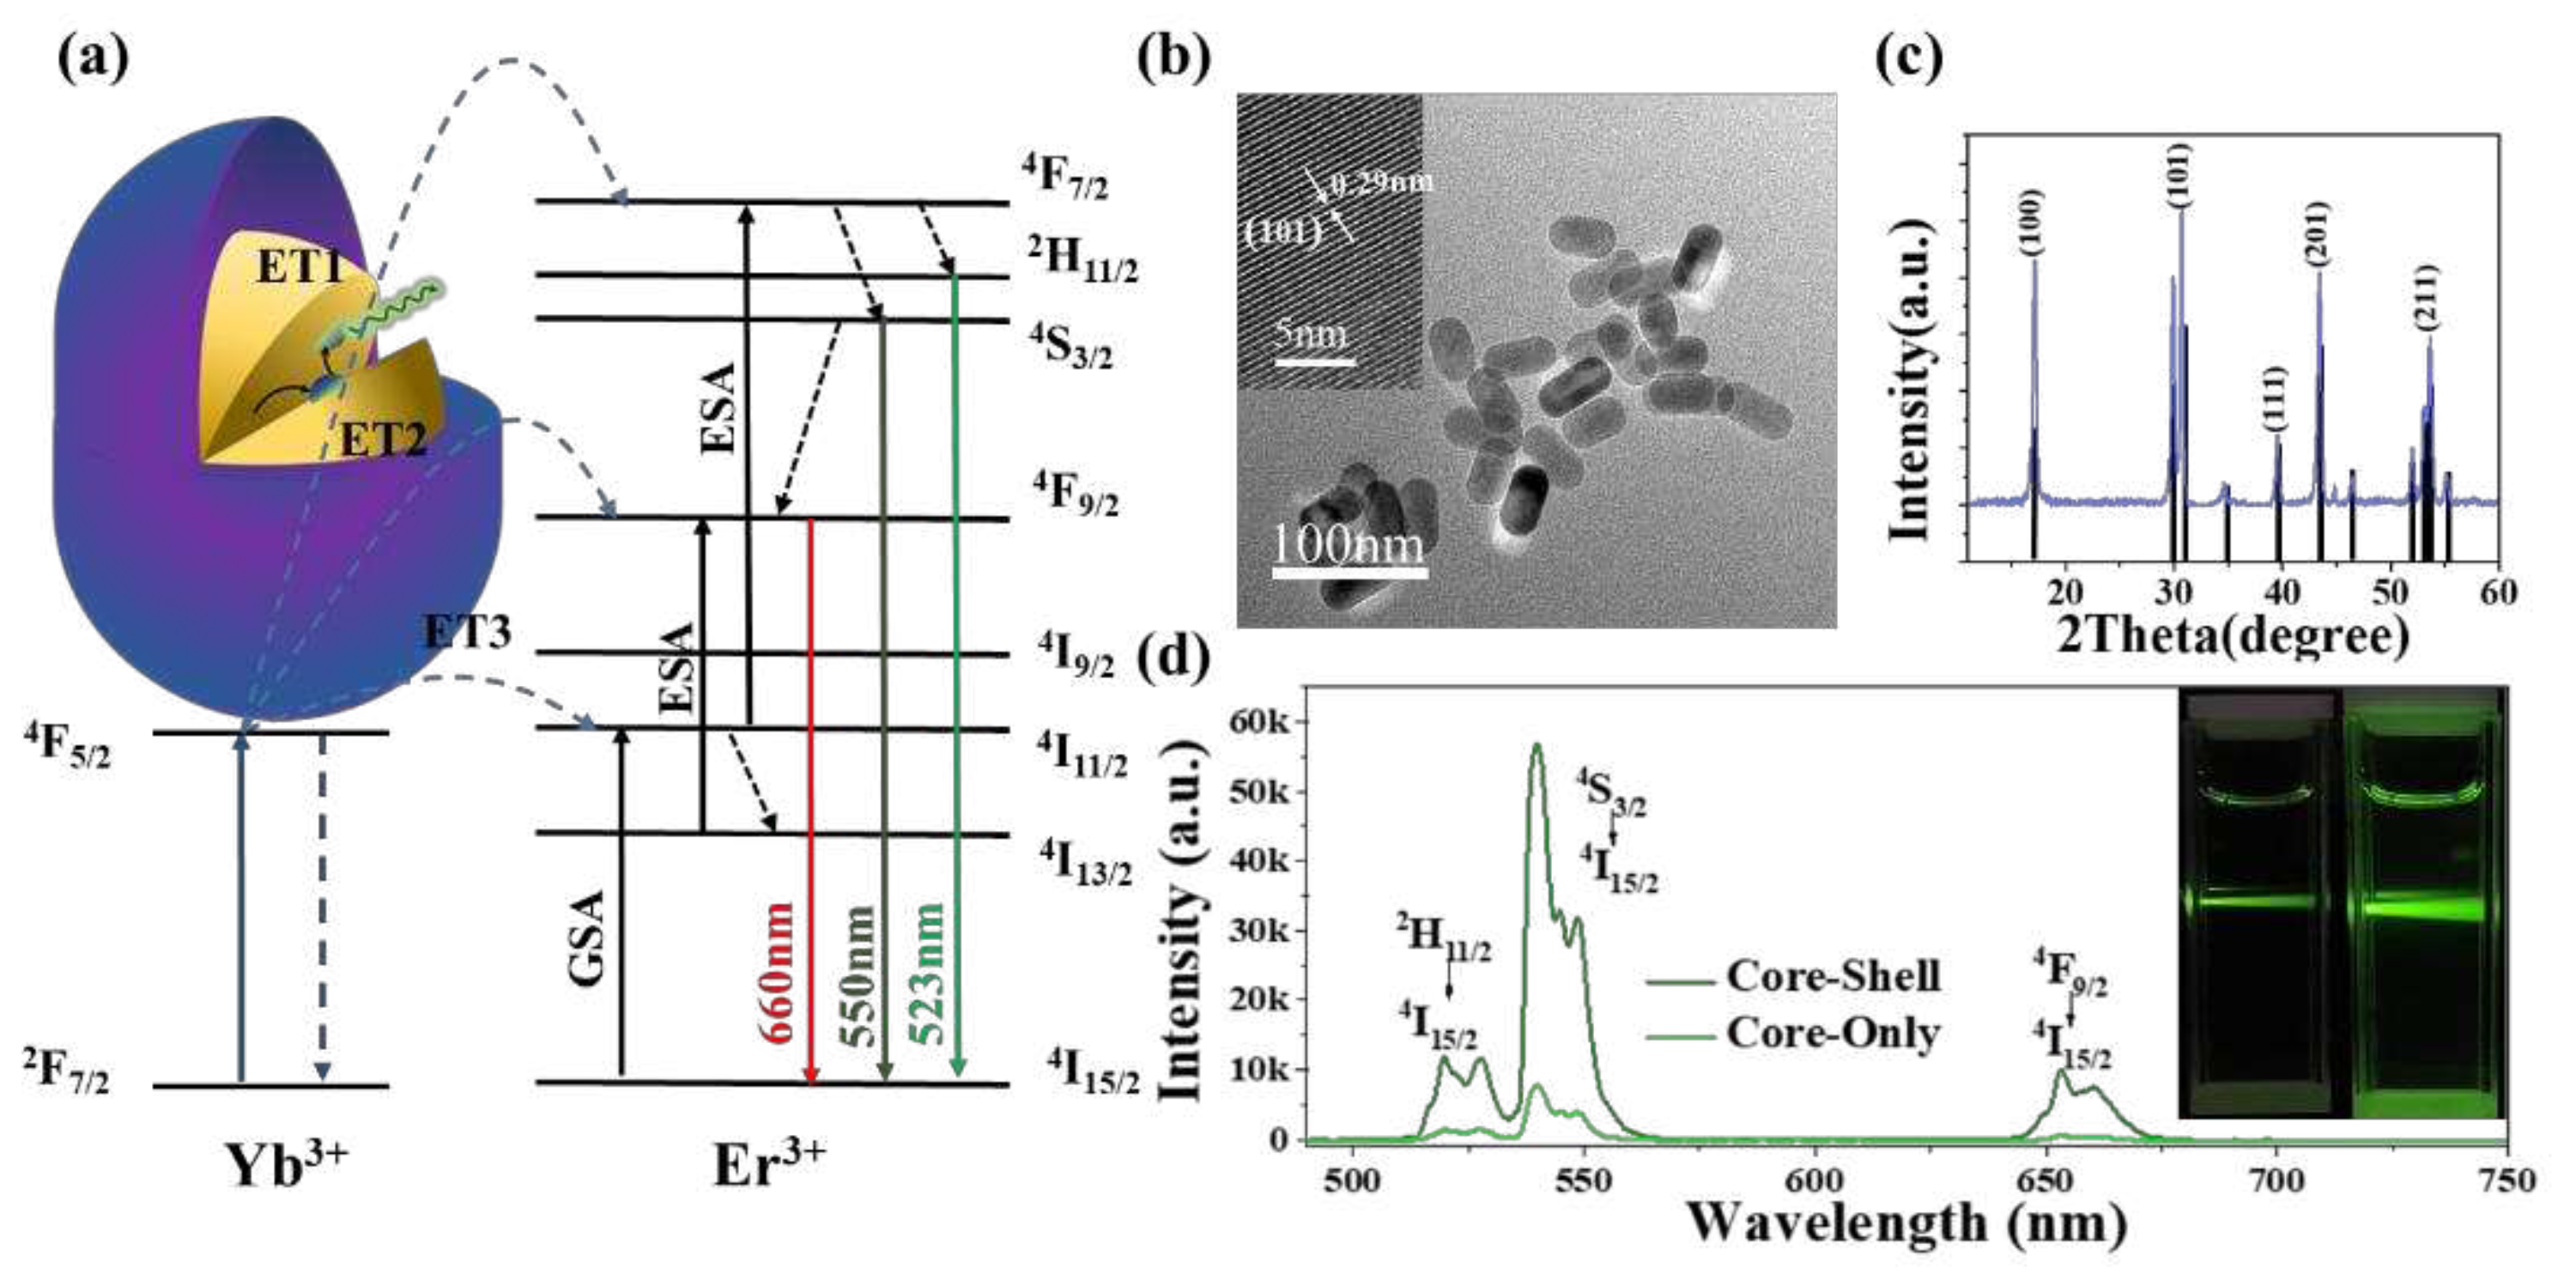
Figure 1. (a) Schematic diagram of the internal structure of the nanoparticle NaYF4:Er3+/Yb3+@NaYF4. Energy level diagram of NaYF4:Er3+/Yb3+@NaYF4 and possible up-conversion luminescence mechanisms. (b) TEM image of NaYF4:Er3+/Yb3+@NaYF4; the inset shows the HRTEM photograph of an individual NaYF4 microcrystal. (c) XRD pattern of the core-shell UCNPs (purple curve); the black line represents the standard diffraction pattern of β-NaYF4. (d) Upconversion fluorescence spectra of NaYF4:Er3+/Yb3+@NaYF4 (core-shell) and NaYF4:Er3+/Yb3+ (core-only). The inset shows UCL photographs in the mixed solution of NaYF4:Er3+/Yb3+@NaYF4 (core-shell) and NaYF4:Er3+/Yb3+ (core-only) excited by 980 nm laser were taken with a digital camera.
Preprints 72657 g001
Figure 2. (a) Photographs of the as-prepared NaYF4:Er3+/Yb3+@NaYF4/PDMS, the upper image is a photo of the optical film under sunlight, and the lower image is a photo of the film excited by a 980 nm laser under dark field conditions. (b and c) SEM images of thin films at different scales. (d and e) TEM micrographs of NaYF4:Er3+/Yb3+@NaYF4/PDMS at different scales. (f–i) Elemental mapping images of NaYF4:Er3+/Yb3+@NaYF4/PDMS compounds.
Preprints 72657 g002
Figure 3. (a) The change of the up-conversion fluorescence spectrum of the film under the excitation of 980nm and the temperature range of 299-359k. (b) Integral upconversion intensity versus temperature at 525 nm and 540 nm. (c) FIR versus temperature. (d) Temperature sensitivity versus temperature. (e) FIR values when the temperature is held constant at 30°C and periodically varied between various settings at 30°C (i.e. 40°C, 60°C and 80°C).
Preprints 72657 g003
Figure 4. (a) The image is a photograph of the optical film under various tensile strains up to 100%. (b) UCL spectra of the film under stretching. (c) The influence of different stretching strengths on FIR(I525/I545) values at the same temperature (d) Dependence of FIR(I525/I545) on the temperature (K), measured under various tensile strains up to 100%.
Preprints 72657 g004
Figure 5. (a) Experimental equipment for temperature measurement. (b) Microscopic images of the fluorescence film on the surface of the chip excited by an external 980nm laser fiber cone. (c) The actual image before and after the chip covers the film, and three temperature measurement points A, B, and C are marked. (d) The temperature time relationship diagram of points A, B, and C in the chip during repeated on/off processes. (e) Fluorescent film measurement temperature distribution image. (f) Infrared image of the tested chip. (g) Comparison of experimental data and infrared image temperature curve.
Preprints 72657 g005
Table 1. Comparison of different optical temperature sensors based upconversion materials.
Phosphor Maximum
Sensitivity
(% K-1)
Temperature
range (K)
Ref.
NaBi(WO4)2:Yb3+/Er3+ 1.24 298–373 [47]
BaGdF5:Yb3+/Er3+ 1.28 298–681 [48]
Al2O3:Yb3+/Er3+ 0.51 295–973 [49]
NaYF4:Yb3+/Er3+ 1.68 258–423 [50]
NaYF4:Yb3+/Er3+@NaYF4 1.43 299-359 This work
Table 2. Surface temperature distribution of different types of mobile phone chips.
Chip Type Mobile phone Maximun
Temperature(°С)
Minimun
Temperature(°С)
Temperature
difference(°С)
A10 Iphone 7plus 34.7 32.0 2.7
Kirin970 Huawei p20 36.9 34.6 2.3
MTK6752 Vivo X5s 40.4 37.4 3.0
Exynos7420 Galaxy S6 edge+ 43.9 43.9 3.7
Disclaimer/Publisher’s Note: The statements, opinions and data contained in all publications are solely those of the individual author(s) and contributor(s) and not of MDPI and/or the editor(s). MDPI and/or the editor(s) disclaim responsibility for any injury to people or property resulting from any ideas, methods, instructions or products referred to in the content.
Copyright: This open access article is published under a Creative Commons CC BY 4.0 license, which permit the free download, distribution, and reuse, provided that the author and preprint are cited in any reuse.
Prerpints.org logo

Preprints.org is a free preprint server supported by MDPI in Basel, Switzerland.

Subscribe

© 2024 MDPI (Basel, Switzerland) unless otherwise stated