1. Introduction
On March 11, 2020, WHO declared the current coronavirus disease (COVID-19) situation a global pandemic on the basis of “alarming levels of spread and severity, and by the alarming levels of inaction” (Bedford et al., 2020; Kitajima et al., 2020). This pandemic has caused a grave health crisis with serious consequences for the world economy due to the rigorous confinements being imposed (Ruiz-Fresneda et al., 2022), but it has also changed all the aspects in our lives, and science has not been an exception. The struggle initiated in January 2020 to combat the severe acute respiratory syndrome coronavirus 2 (SARS-CoV-2) has become the top priority for all the countries (Casado-Aranda et al., 2021), which was translated on thousands and thousands of researchers putting all their energies to fight this disease. This situation has led to substantial investment in research funding that has, in turn, triggered the hitherto unprecedented volume of production of studies on SARS-CoV-2/COVID-19 (Ruiz-Fresneda et al., 2022). It has been reported that investigation of COVID-19 became the most urgent priority while over 100,000 studies were published only in 2020 (Ji et al., 2021; Else, 2020).
The topics linked to SARS-CoV-2 are numerous, moving from the epidemiology of the disease to treatments and impacts in the different aspects of society. One of the main topics since the beginning of the COVID-19 pandemic was wastewater-based epidemiology (WBE). Wastewater monitoring has been used as a successful, non-invasive, and early-warning tool for monitoring the status and trend of COVID-19 infection and as an instrument for tuning public health response (Randazzo et al., 2020). The information obtained through the WBE complements public health data, mostly because they provide evidence of the spread of the virus relative to a specific population in a given time. This could be illustrated by an increasing discrepancy between rising viral loads in wastewater and confirmed cases may point to an undetected surge in infections (Vo et al., 2023). This technique was very revealing at the beginning of the pandemic when public health data was scarce and it can become again very useful in the present, when COVID-19 public surveillance seems to be drastically reduced. Currently, this environmental surveillance represents one of the main strategies implemented by many countries as a tool to help authorities to coordinate the exit strategy to gradually lift its coronavirus lockdown (EC, 2021).
The usefulness of WBE is not only associated with the detection of the virus in the wastewater associated with a specific population but also with an early warning alert for the detection of new variants of clinical concern for public health. Since March 2021, the European Commission adopted a recommendation on a common approach to establish and make greater use of systematic wastewater surveillance of SARS-CoV-2 as a new source of independent information on the spread of the virus and its variants in the European Union (EC, 2021).
In the South-East of Spain, systematic surveillance of SARS-CoV-2 in wastewater started in March 2020 (Randazzo et al., 2020) and continues to date, which resulted in a historical inventory of the SARS-CoV-2 concentration throughout the duration of the pandemic. However, the WBE not only is considered an important method to trace the viral circulation in a community in order to evaluate the prevalence, but it can be used to determine the genomic diversity (Xagoraraki and O’Brien, 2020). Massive sequencing techniques allow us to analyse a large number of SARS-CoV-2 genomes, including those present in symptomatic and asymptomatic persons (Pérez-Cataluña et al., 2022). The analysis of the sequences obtained from the RNA of wastewater samples allows the detection of the predominant as well as low-frequency variants, determining the variants that are circulating in a specific population. There are already many research papers demonstrating that whole genome sequencing (WGS) of SARS-CoV-2 provides additional data to complement routine diagnostic testing (Bull et al., 2020; Pérez-Cataluña et al., 2022; Vo et al., 2023). Data on the genetic diversity and emerging mutations in this pandemic have been crucial to understanding its evolution (Troyano-Hernández et al., 2022). Phylogenetic trees and clustering analyses have been used to bring light to the international spread of SARS-CoV-2 and enabled the investigation of individual outbreaks and transmission chains in specific settings (Attwood et al., 2022). Previous attempts have been already published using genome-based phylogenetic analysis and machine learning approaches to analyze the evolution of SARS-CoV-2 (Li et al., 2020; Singh and Yi, 2021). However, as far as we know, this approach has not been applied to data obtained from WBE in Spain.
The aim of the current study is to provide an overview of the historical data of WBE for SARS-CoV-2 obtained in the South-East of Spain and the use of phylogenetic trees and a machine learning approach to analyze the evolution of the pandemic in this Region of Spain.
2. Materials and Methods
2.1. Concentration Methods
Influent grab water samples were taken from two wastewater treatment plants (WWTPs) located in the two main cities (Murcia and Cartagena) of the Region of Murcia (Spain). Extraction was performed using an aluminum-based adsorption-precipitation method as previously described (Randazzo et al., 2020). A final concentrate was then formed by centrifugation at 1,900 × g for 30 min and the resulting pellet was resuspended in 1 mL of PBS, pH 7.4.
Recovery controls were prepared by spiking PEDV (CV777 strain, kindly provided by Prof. Carvajal (University of Leon, Spain). For each sample, the percentage recovery was calculated dividing the viral titer of concentrated sample by the titer of the recovery control.
2.2. Viral Extraction, Detection and Quantification
Nucleic acid extraction of SARS-CoV-2 from wastewater concentrates was performed using an automated method with the Maxwell RSC Pure Food GMO and authentication kit (Promega) with slight modifications (Pérez-Cataluña et al., 2021). Firstly, 300 μL of concentrated samples were mixed with 400 μL of cetyltrimethylammonium bromide (CTAB) and 40 μL of proteinase K solution. The mixed sample was incubated at 60 ◦C for 10 min and centrifuged for 10 min at 16,000 × g. Next, the resulting supernatant was transferred to the loading cartridge, and 300 μL of lysis buffer was added. The cartridge was then loaded in the Maxwell® RSC Instrument (Promega) using the “Maxwell RSC Viral total Nucleic Acid” running program for the nucleic acid extraction. The obtained RNA was eluted in 100 μL nuclease-free water. Negative controls were included by using nuclease-free water instead of a concentrated sample. SARS-CoV-2 nucleic acid detection was performed by RT-qPCR using One Step PrimeScriptTM RT-PCR Kit (Perfect Real Time) (Takara Bio, USA) targeting a genomic region of the nucleocapsid gene (N1 region) using primers, probes, and conditions previously described (CDC, 2020). All RT-qPCR assays were performed in duplicate on a QuantStudio™ 5 Real-Time PCR (Applied Biosystem). The Twist Synthetic SARS-CoV-2 RNA Control 1 (MN908947.3) and nuclease-free water were used as positive and negative controls, respectively.
2.3. Quantification of SARS-CoV-2 Variants
The prevalence of SARS-CoV-2 variants was assessed using five different duplex gene allelic discrimination TaqMan RT-qPCR procedures using primers, probes, and conditions previously described (Carcereny et al., 2021a; Carcereny et al., 2021b).
Each RT-qPCR analysis included duplicate wells with undiluted RNA and a 10-fold dilution to check for inhibition, as well as corresponding negative controls (amplification and extraction). Standard curves for genome quantitation of different variants were prepared using commercially available Twist Synthetic SARS-CoV-2 RNA Controls (Control 14, EPI_ISL_710528; control 16 (EPI_ISL_678597), control 17 (EPI_ISL_7926) and control 23 (EPI_ISL_15440143). The percentage of SARS-CoV-2 genomes containing each variant-specific mutation in the S gene was calculated using the formula:
2.4. SARS-CoV-2 Genome Sequencing and Analysis
Samples with RT-qPCR cycle threshold (Ct) values below 32-34 and a high recuperation percentage (≥25%) were selected for sequencing analysis. Genomic sequencing of SARS-CoV-2 present in selected wastewater samples was carried out following ARTIC protocol version 4 for retrotranscription using LunaScriptTM RT SuperMix (New England Biolabs, USA) and amplification by multiplex PCR. Sequencing libraries were built using the Native Barcoding Kit (EXP-NBD-104 and EXP-NBD-114, Oxford Nanopore Technologies, Oxford, United Kingdom). The last purified product was eluted in 15 μL of elution buffer. Finally, the library was loaded on an R9.4.1 flow cell (FLO-MIN106) and placed onto a MinION Mk1C sequencer for a 36–48 h run.
After the sequencing runs, fast5 data files were base-called using Guppy (version 4.3.4, Oxford Nanopore Technologies, Oxford, United Kingdom) to generate fastq files (available at
https://data-dataref.ifremer.fr/bioinfo/ifremer/obepine/lsem/data/dna-sequence-raw/). Successfully base-called reads were further analyzed following the ARTIC nCoV-2019 pipeline version 1.2.1.2 (ARTIC nCoV-2019 novel coronavirus bioinformatics protocol), which included demultiplexing, read filtering, primers, and barcode trimming. The resulting alignment file was used for single nucleotide variants (SNVs) calling using LoFreq version 2.1.5 with minimum base quality of 20 and 20× coverage, relative to Wuhan-Hu-1/2019 reference genome (GenBank: MN908947.3). Short indel calling was also performed using Lofreq after a preprocessing step to insert indel qualities. Samtools was used to read alignment files and an Awk-based script enabled to extract genome coverage percentages at depths 10, 30, and 100. Samtools also allowed the extraction of mean genome coverage across the distinct amplicons trimmed for primer and overlapping sequences, for each sample. For VOC analysis, we excluded samples with depth 30 coverage <70%. Based on previous studies (Martin et al., 2020; Izquierdo-Lara et al., 2021), single nucleotide variants (SNVs) and indels with coverage < 30, average quality < 30, frequency < 5%, and homopolymer run > 4 (for indels only) were excluded.
2.5. Clinical Data
Epidemiological data on COVID-19 in the Murcia Region have been retrieved from the publicly available repository of the “Servicio de epidemiologia” of the “Consejería de Salud de la Región de Murcia” (available at
http://www.murciasalud.es/principal.php).
2.6. Phylogenetic Analysis
Sixteen consensus SARS-CoV-2 sequences (in format .fasta) associated with the selected WWTPs (Murcia and Cartagena) from March to October 2022 were used for the phylogenetic analysis. The consensus sequence types were generated using ARTIC bioinformatic pipeline for SARS-CoV-2 (ARTIC nCoV-2019 novel coronavirus bioinformatics protocol) specifically designed for Nanopore data. The phylogenetic tree of the sixteen consensus sequence types was generated using an alignment-free method with feature-frequency profile methodology (Sims et al., 2009). The proper performance of this methodology depends on the choice of the optimum value k for the sequence of length k denominated k-mer. The following formula was used to determine the optimum value for k (Dong et al., 2019):
where N is the length of the SARS-CoV-2 reference genome (GenBank: MN908947.3). In this study, the selected optimum k value corresponds to the positive integer value that verifies: k>k_(H_max )
Then, N=29.903 bp hence k_(H_max )=7,43, which gives the value of optimum k = 8.
Based on the results obtained assuming an 8-mer, the pairwise distance between two genomes was estimated using the Jensen-Shannon divergence measure. This computation provided an output corresponding to a distance matrix which combined with the neighbor-joining algorithm generated the phylogenetic tree that illustrates the relatedness between the consensus sequence types. All analyses were conducted using R version 4.2.2.
2.7. Machine Learning Analysis
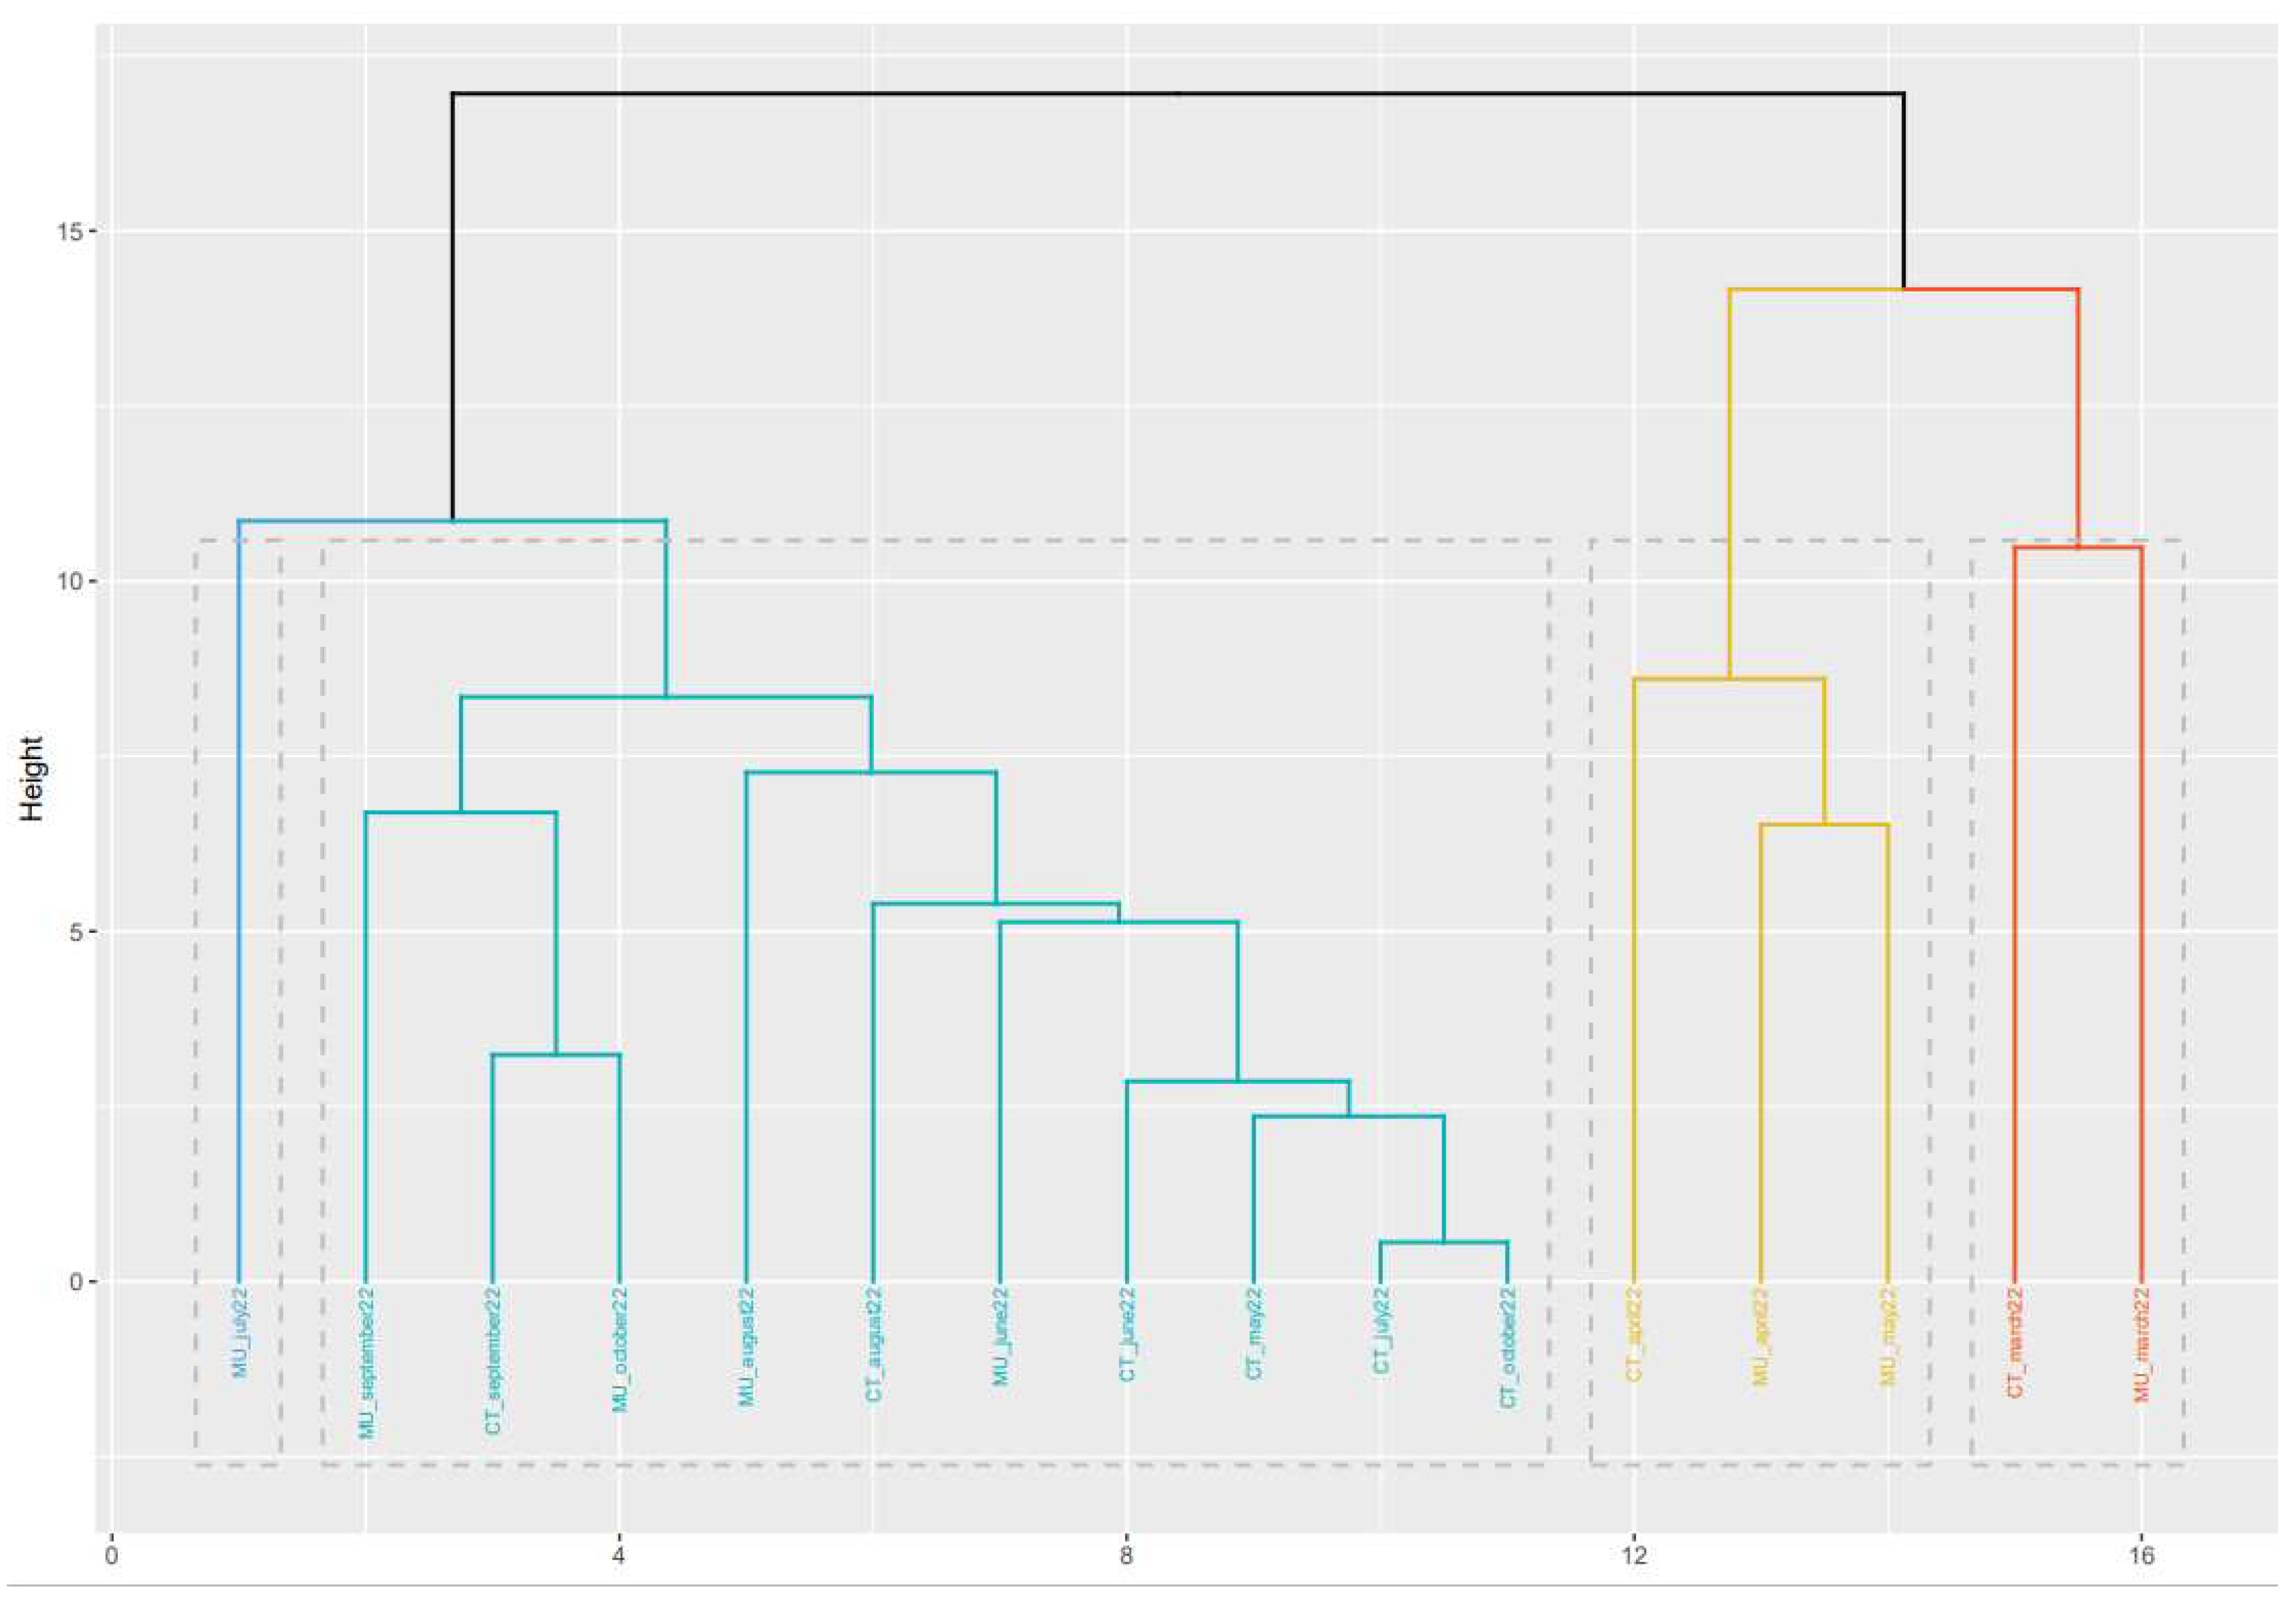
The machine learning (ML) analysis was applied to the data corresponding to the 16 SARS-CoV-2 spike protein mutation profiles associated with the selected WWTPs (Murcia and Cartagena), covering the period from March to October 2022. The different WWTP profiles were classified by means of the Hierarchical Clustering ML technique (Li et al., 2022). In this case, the Agglomerative Hierarchical Clustering technique was implemented with the following options: euclidean distance and Ward’s minimum variance method. All analyses were conducted using R version 4.2.2.
3. Results and Discussion
3.1. Overview of SARS-CoV-2 Titers in Wastewater and Clinical Cases Detected in South-East of Spain
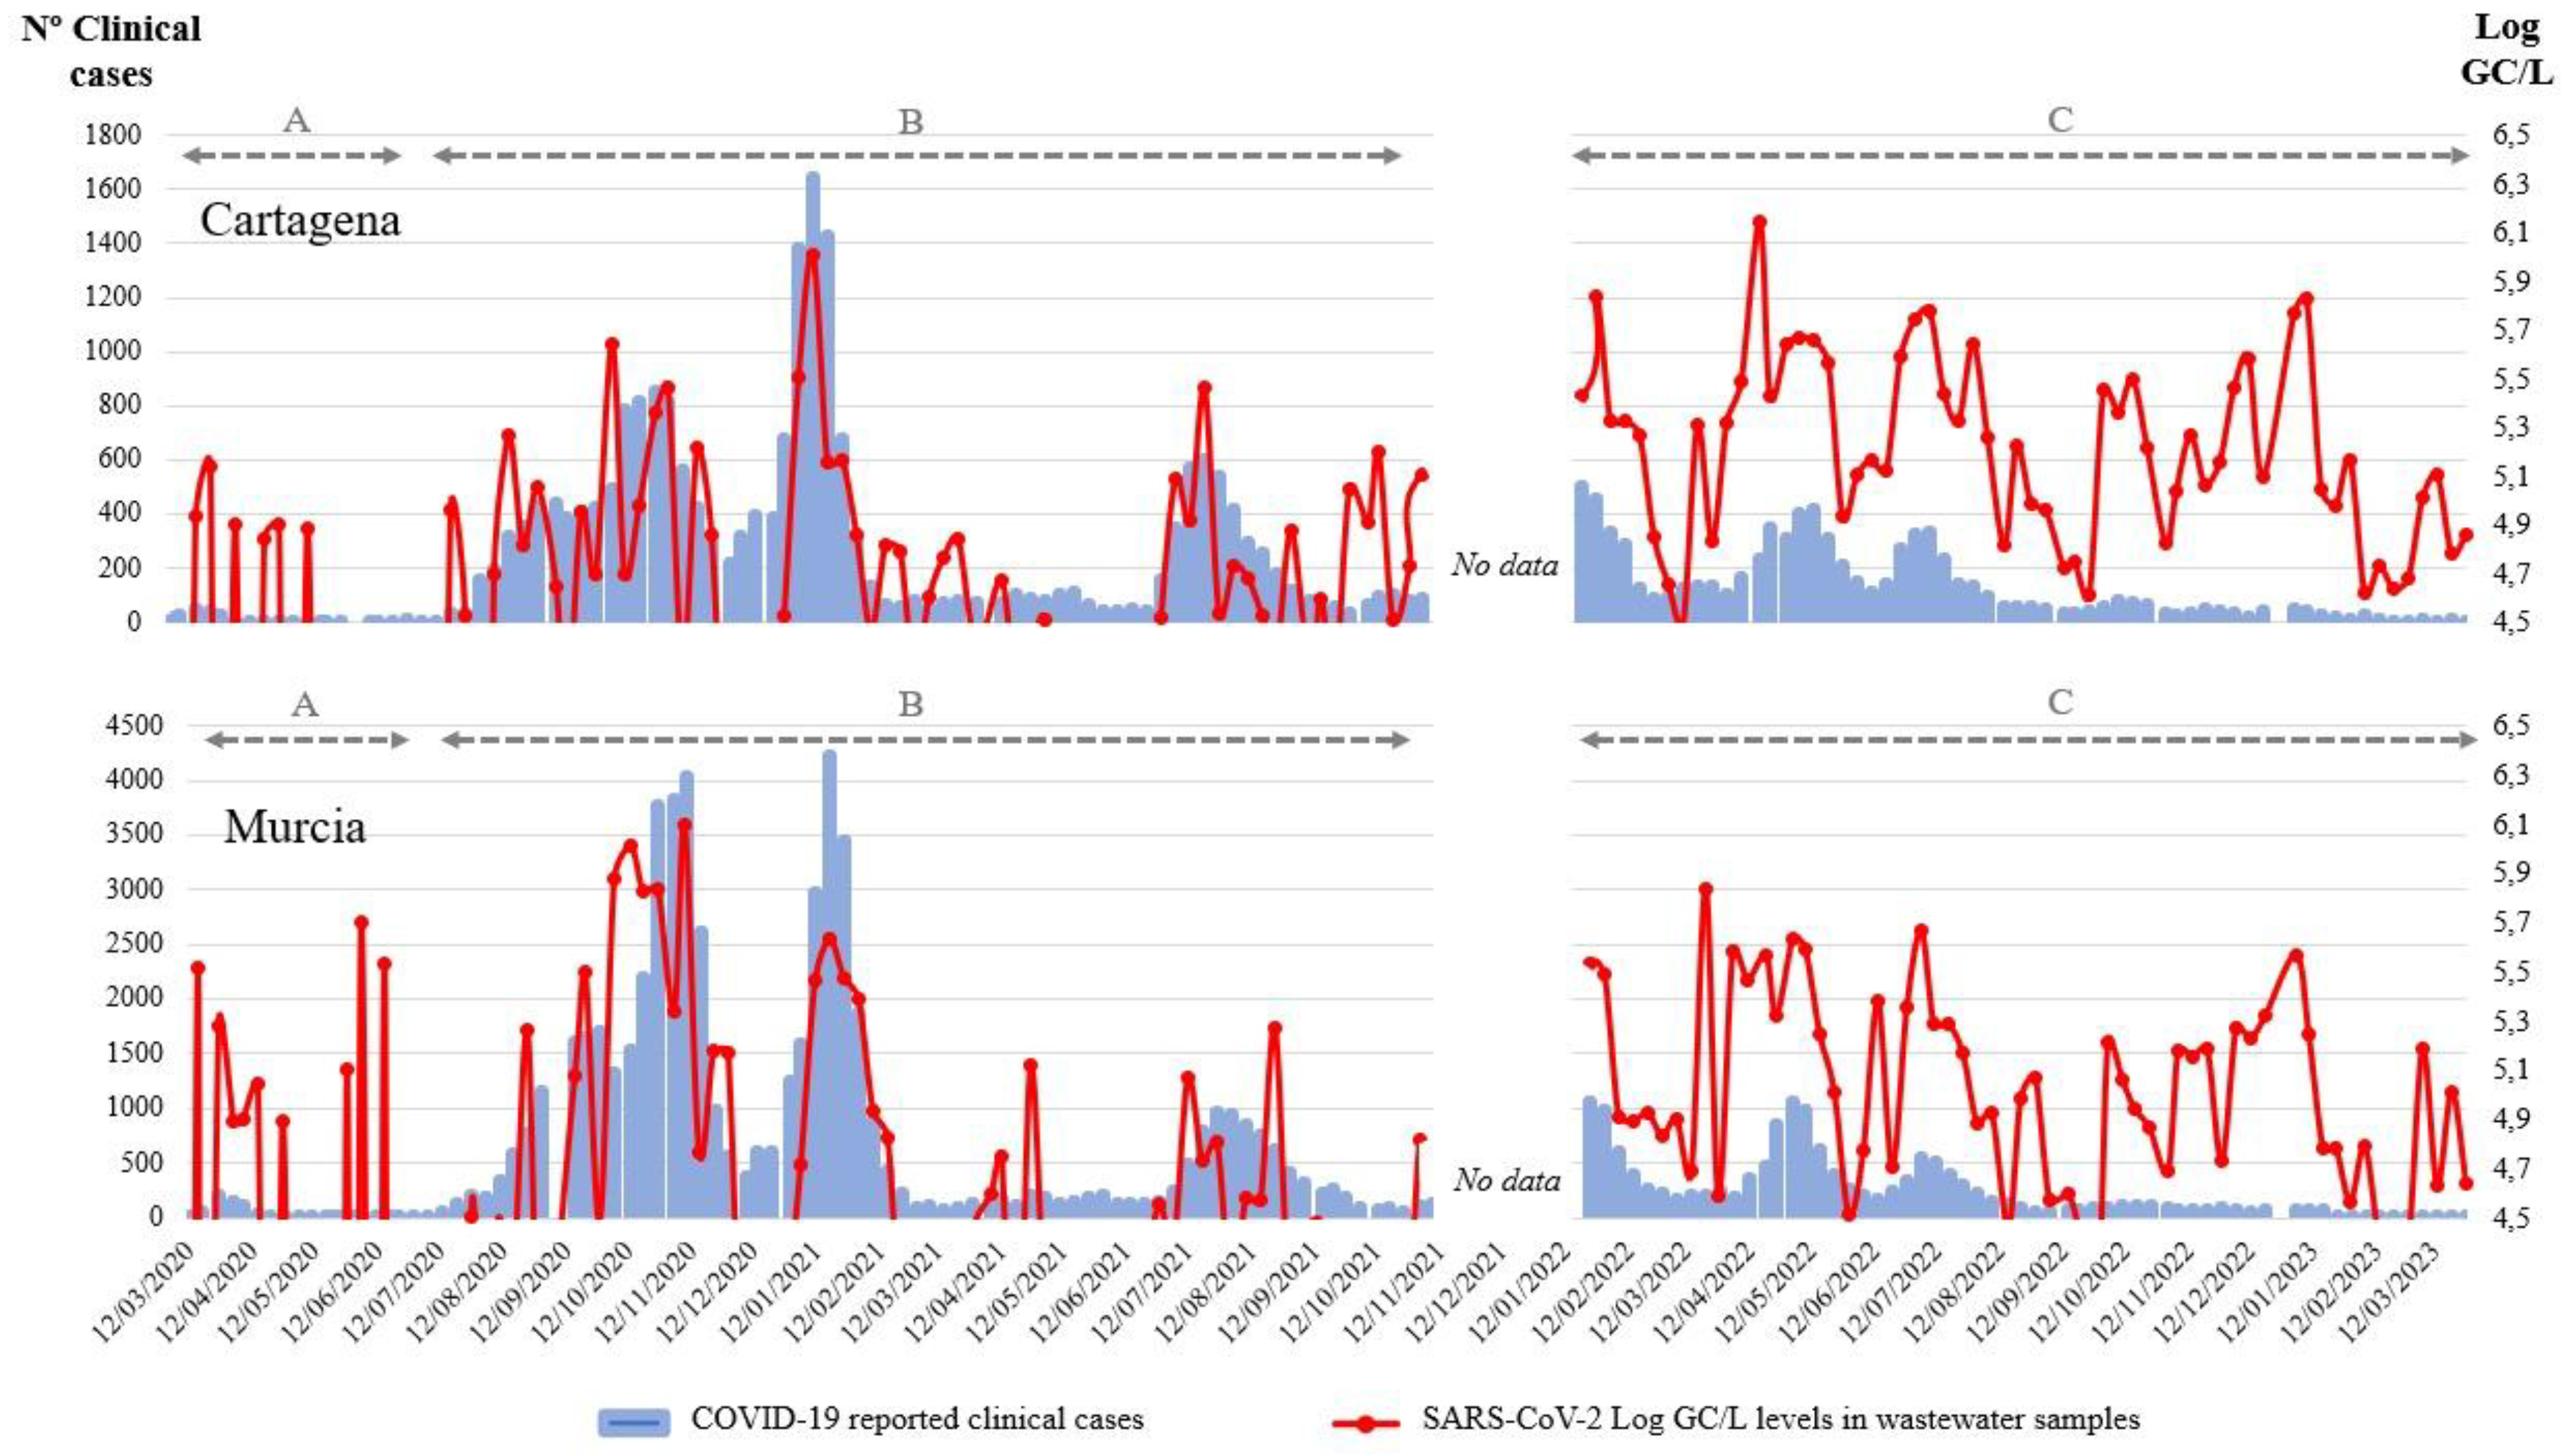
Since the beginning of the pandemic in March 2020, multiple waves of SARS-CoV-2 were recorded in Murcia (Spain). Three different situations can be identified between the WBE data and the clinical cases in the historical profile. The first of them (
Figure 1A) is characterized by a low intensity, combined with an underestimation of the cases due to a low number of diagnostic tests performed. The second period is characterized by good correlation between the WBE data and the clinical cases. This is due to the continuous performance of SARS-CoV-2 detection in wastewater and the intensive testing of COVID-19 in the population (
Figure 1B). The third period of the historical profile is characterized by a similar outline regarding the WBE data, but since only the cases that are being hospitalized are still controlled by the public health authorities, the correlation is much lower (
Figure 1C). However, based on the available data and knowing the good correlation observed in phase two of the historical profile, it could be assumed that transmission of the virus within this population is still high. Similar results have been observed by Maida et al. (2022). Therefore, the aim of searching SARS-CoV-2 in WTPs of these two cities from the southeast of Spain represents a very good proxy of the spread of the virus in the population. It is confirmed that the levels of SARS-CoV-2 in these wastewater samples changed in relation to the number of SARS-CoV-2 cases detected in the population.
3.2. Evolution of the SARS-CoV-2 Variants in South-East of Spain
Numerous international efforts have arisen to identify SARS-CoV-2 in sewage systems during the pandemic. These efforts employ various analytical procedures that rely on RT-qPCR, genetic material preparation, and enrichment (La Rosa et al., 2020). Throughout the pandemic’s progression, new variants of the virus have emerged, with specific mutations resulting in worldwide infections.
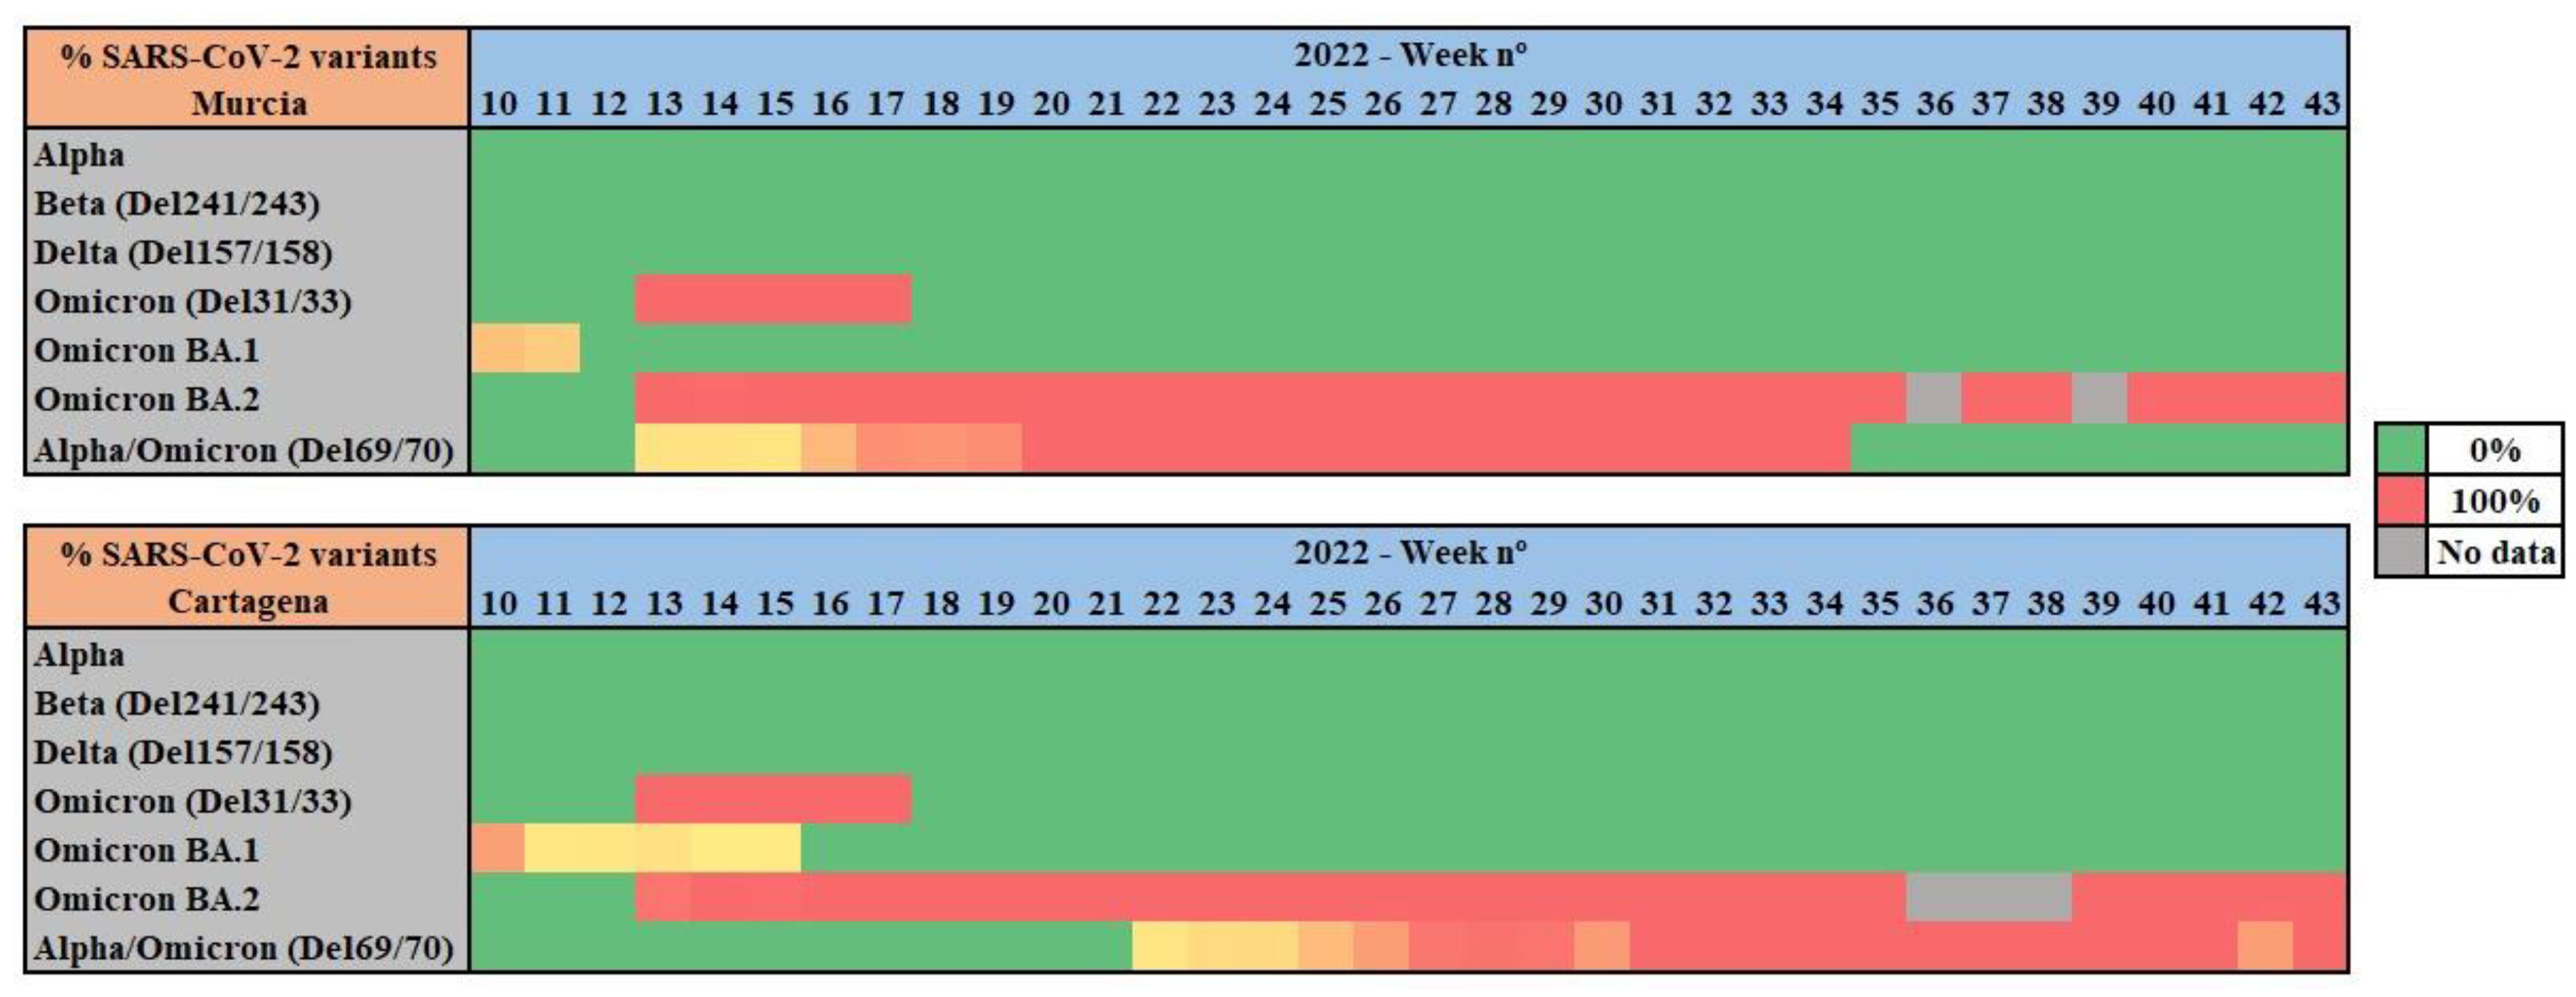
For all wastewater samples collected weekly from Cartagena and Murcia WWTPs, RT-qPCR was performed to identify and analyze the prevalence of UK/Alpha (Del 69/70), Beta (Del241/243), Delta (Del 157/188), Omicron (Del. 31/33), Omicron BA.1. (Ins 2/14), Omicron BA.2. (Del. 25/27, and Omicron (Del. 69/70) variants of concern (
Figure 2).
RT-qPCR results show a 100% prevalence of the Omicron variant all along the studied period of 2022. Notably, between weeks 11 and 13 of 2022 a shift from Omicron BA.1. variant to Omicron BA.2. variant was observed. The 69/70 deletion, associated with Alpha VOC at the first stages of the pandemic, was detected during the studied period, as both Alpha and Omicron share this mutation.
As other studies report, in mid-December 2021 the Omicron variant overtook the Delta variant, which had been in the majority during the months of October and November 2021. The transition from Delta to Omicron occurred rapidly in 2-3 weeks in the month of December (weeks 49 to 51 of 2021) (Fall et al., 2022; Lee et al., 2022), thus our results covering a posterior period of time with Omicron prevalence are in line with existing bibliography.
3.3. Phylogenetic Analysis of SARS-CoV-2 in Wastewater in South-East of Spain
By calculating the Accumulated Indicator Functions of nucleotides, we can further find an Accumulated Natural Vector (ANV) for each sequence. This new ANV not only can capture the distribution of each nucleotide, but also provide the covariance among nucleotides. Thus global comparison of DNA sequences or genomes can be done easily in R application.
Algorithm-based phylogenetic methods have been used to classify SARS-CoV-2 sequences based on their similarity and to infer evolutionary relationships between different isolates obtained at different time intervals from the WWTPs of Murcia and Cartagena. The phylogenic tree was based on the complete genome sequences found in the wastewater at the different sampling times and locations (Cartagena and Murcia). In this case, the approach presented by Dong et al. (2019) based on the ANV method, which represents each RNA sequence by a point in the R application, was used to investigate the variability of SARS-CoV-2 in different wastewater samples obtained from different locations and sampling times. Mathematical algorithms were used to compare the whole genome of SARS-CoV-2 and to construct the tree-like diagram, called a phylogenetic tree, that represents the evolutionary history of the sequences.
The aim was to determine if the consensus sequence types obtained from a specific sampling showed similarities or differences with other samples. This could be used as a preliminary screening to determine if a drastic change in the variants that are present in a population occurs between one sampling times and another or among different populations. If changes between two samples are observed, a more depth study could be needed to determine if this is due to the introduction of new variants.
Similar approaches have been already used to determine if multiple lineages are present and circulating in a given population (Faleye et al., 2021; Van et al., 2023). In this case, the selected algorithm-based phylogenetic methodology is a computational approach that has helped to identify the evolutionary relationships among these RNA sequences.
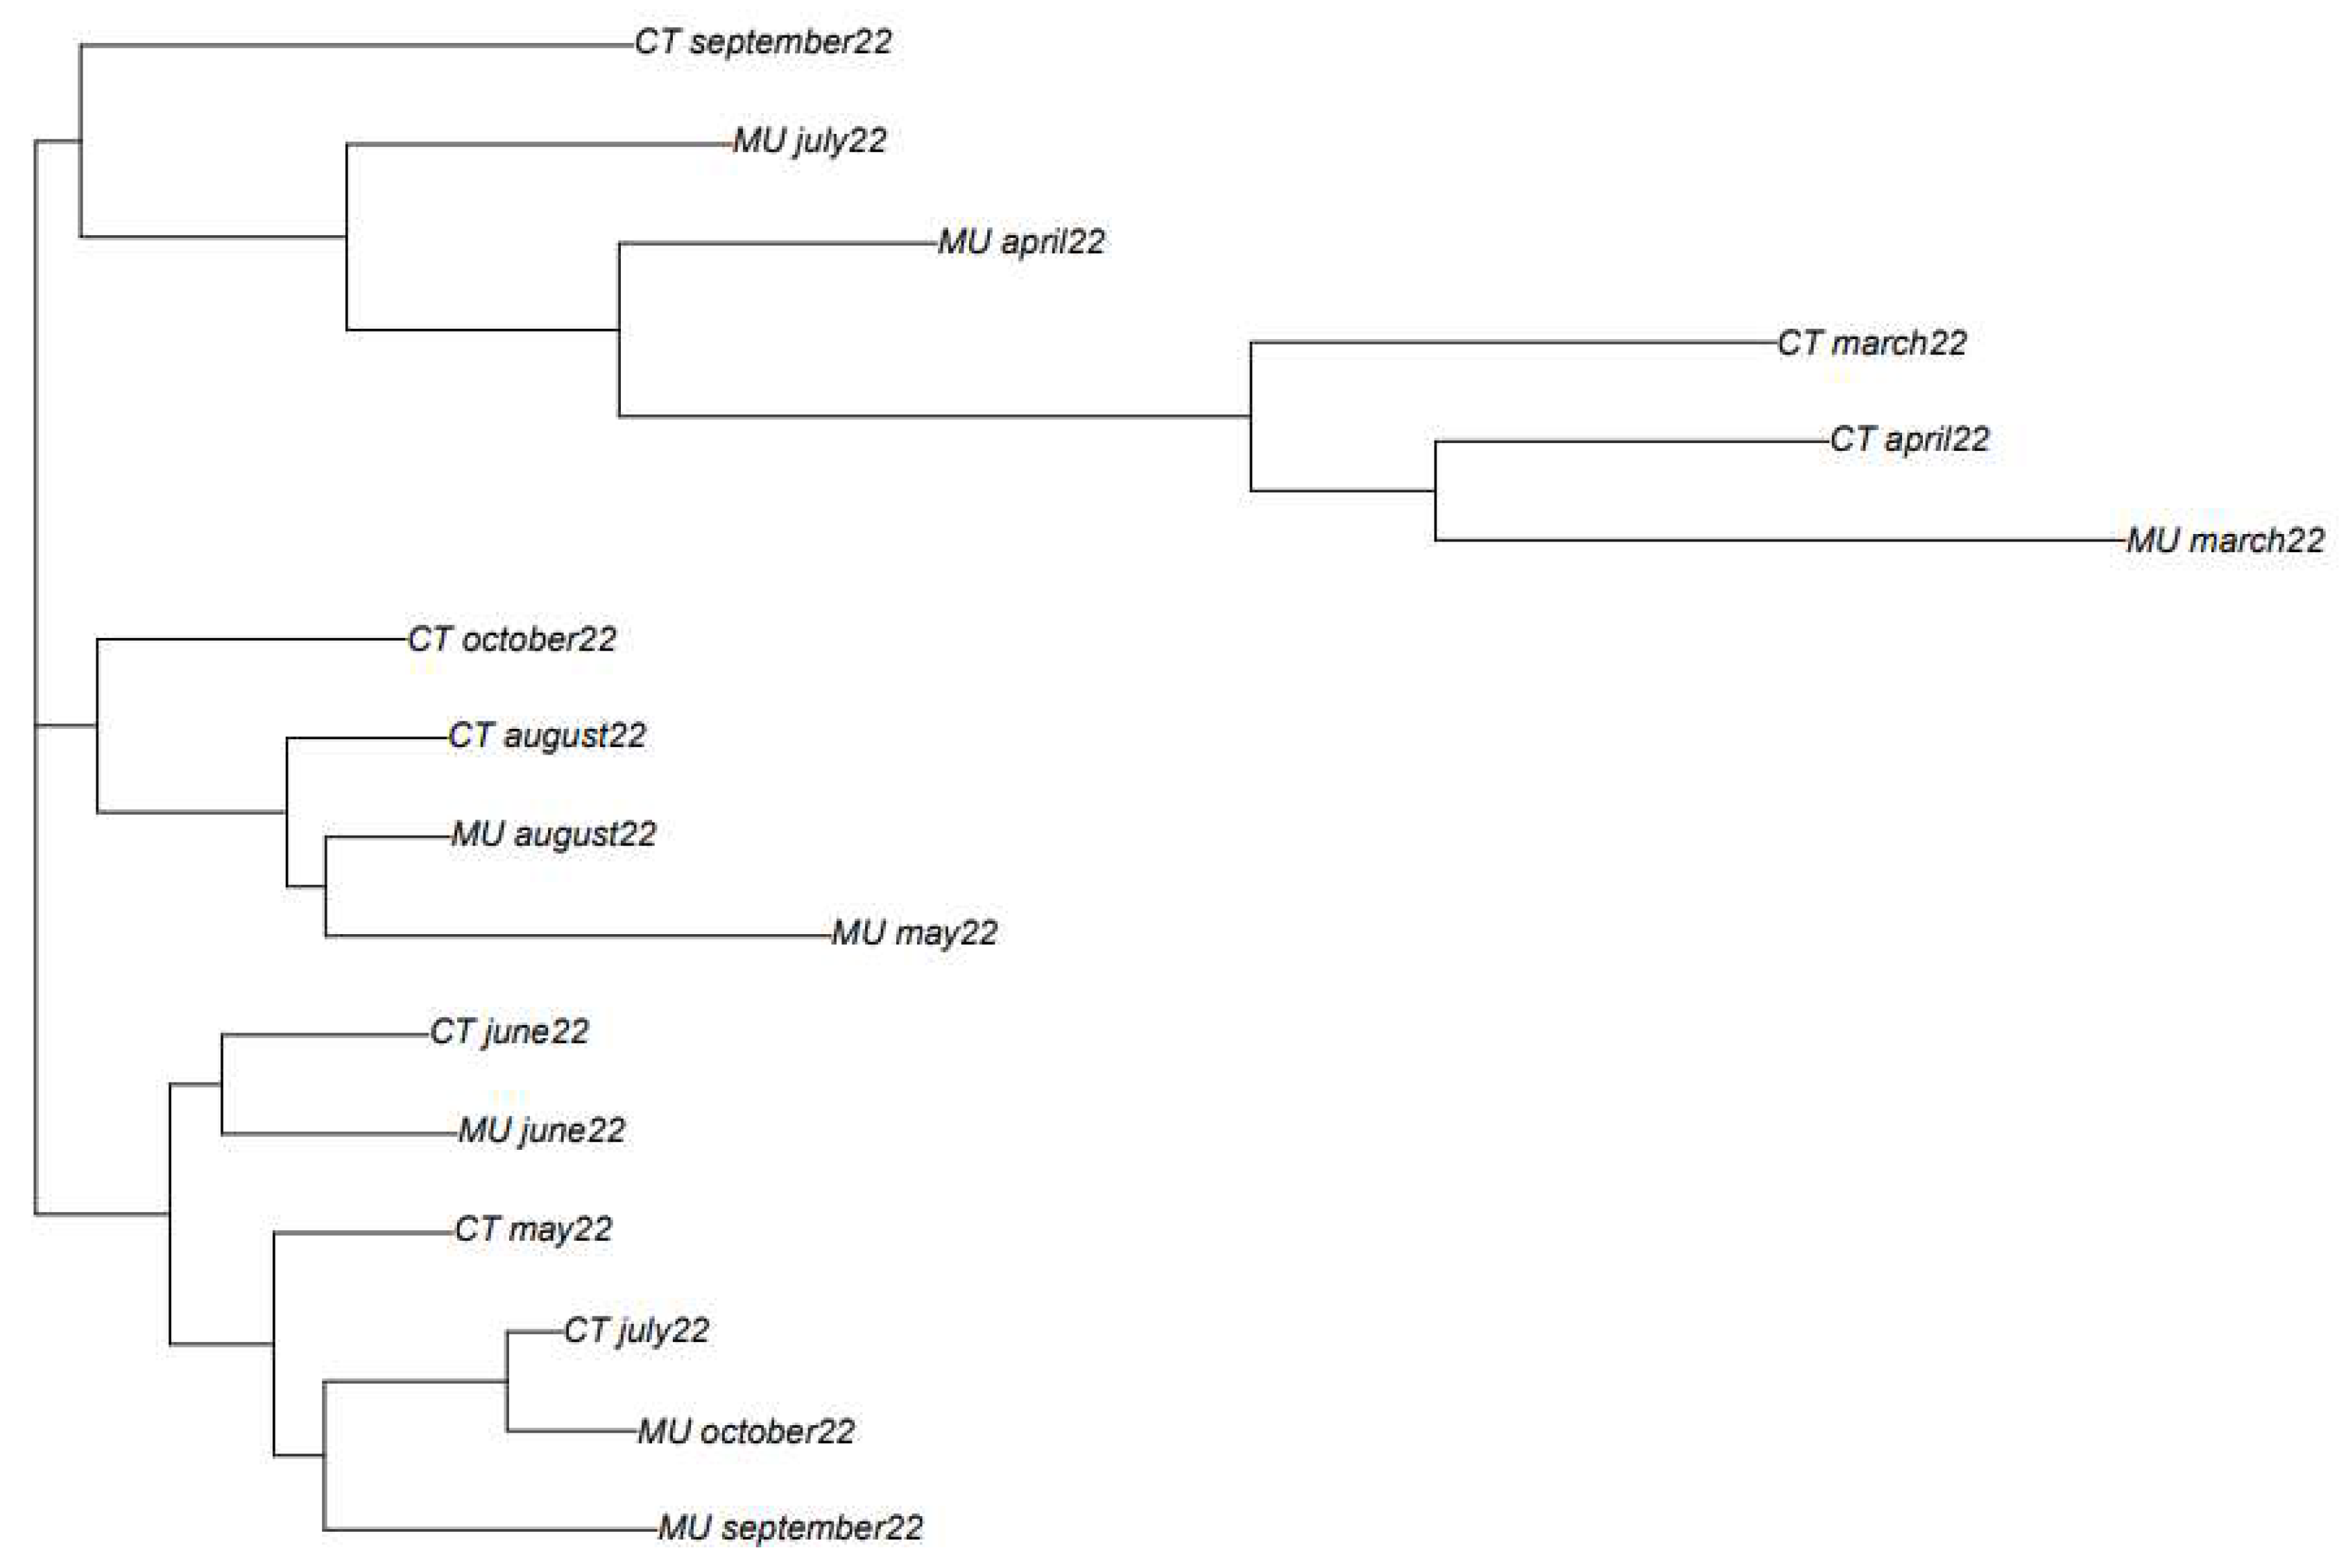
The classification obtained based on the phylogenetic analysis shows that in most of the cases, samples obtained in close sampling times, show a higher similarity than those samples more separated in time (
Figure 3). For instance, the samples obtained in March and April 2022 from Murcia and Cartagena are placed together in the phylogenetic tree. The same happens for the samples obtained from Cartagena in May, June, July, and August 2022. However, in September and October 2022, samples between Murcia and Cartagena showed different consensus sequence types. Based on the variant information obtained for these two locations at these two sampling times, it could be observed that in the case of the WWTP of Murcia the most abundant variant was BQ1.1 while in the case of Cartagena, the most abundant variant was BA.5, which could explain the differences observed in the consensus sequence types of the two locations.
3.4. Heat Map and Clustering based on the Mutations of the SARS-CoV-2 Spike Protein using Machine Learning Analysis
A second analysis based on machine learning analysis was made using the information obtained from the mutations found in the SARS-CoV-2 spike protein for each location and sampling times. Hierarchical Clustering (HC) has been defined as an efficient unsupervised approach to unlabeled data analysis (Li et al., 2022). Among the most common HC mechanism for grouping data at different scales by creating a dendrogram, Agglomerative Hierarchical Clustering (AHC) is the most adequate for the SARS-CoV-2 data (Li et al., 2022).
These data bring supplementary information on the similarities of the sequences that are circulating in a specific sample.
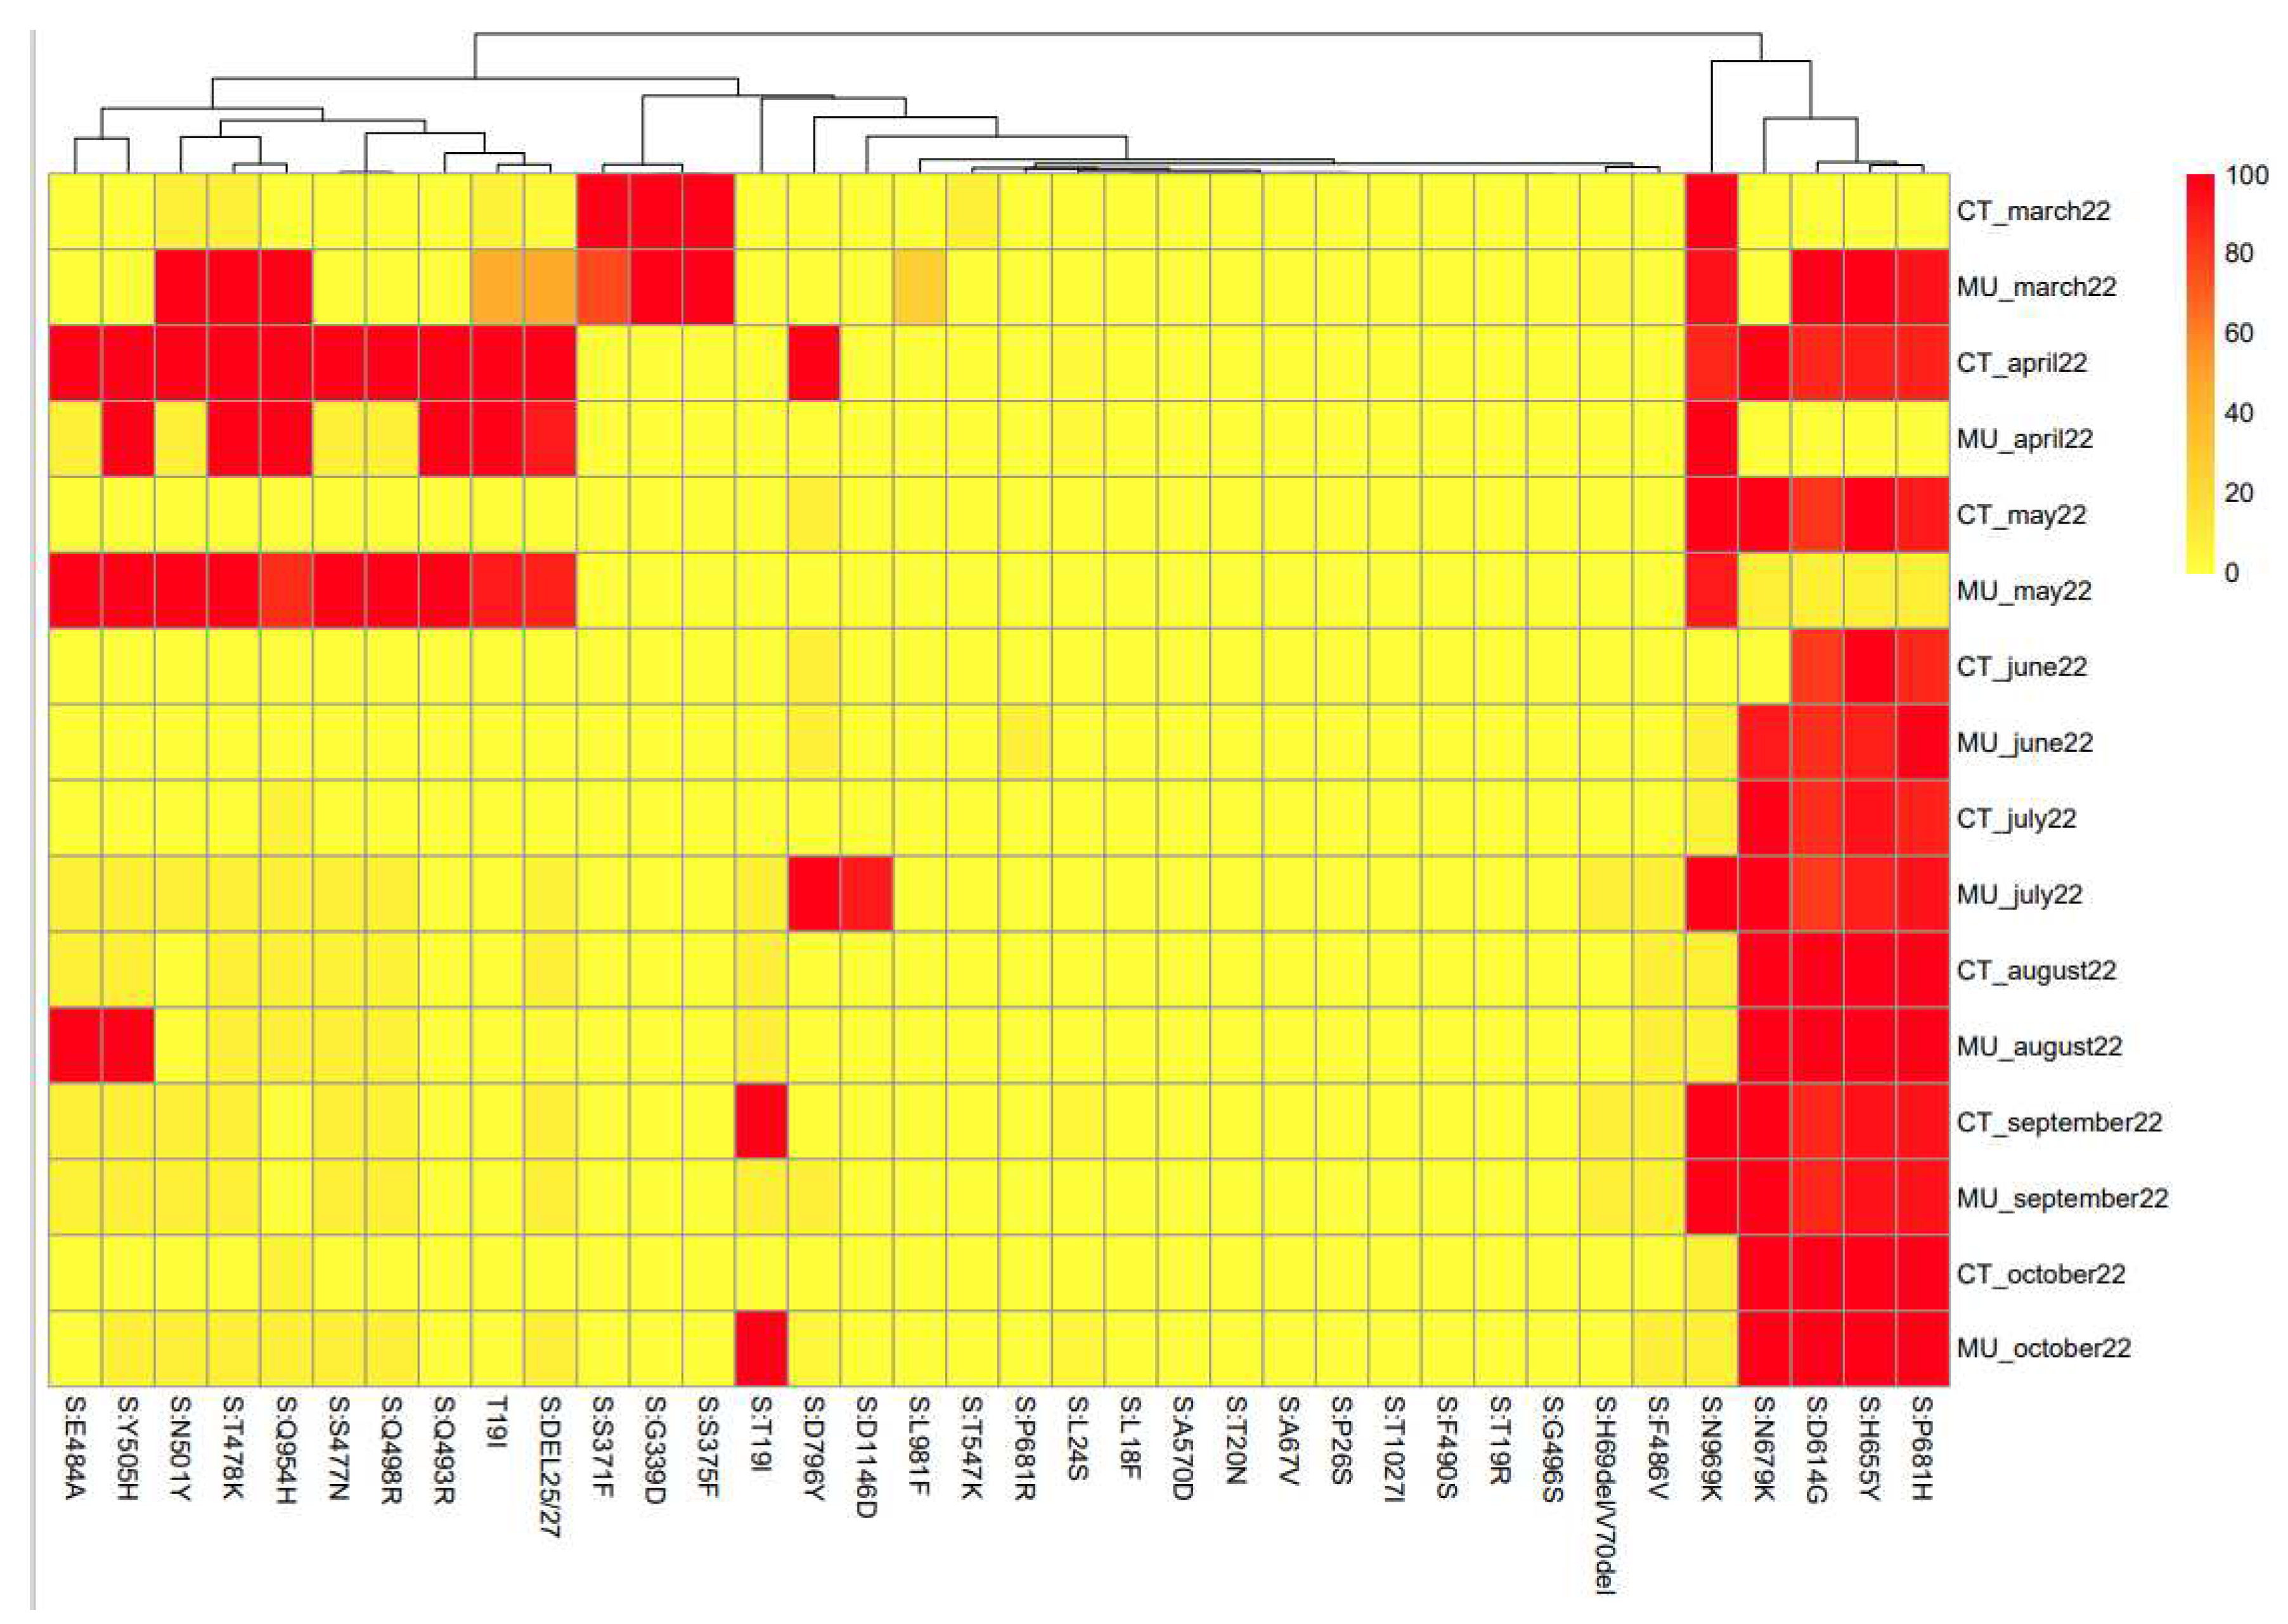
Figure 4 shows the heat map linked to the mutations of the spike protein found for each sample. The algorithms used for this approach did not take information for every single nucleotide but from groups of 8 nucleotides. Therefore, the heat map shows the similarities among samples based on the nucleotides they share (
Figure 4).
Based on the heat map,
Figure 5 shows the clustering of samples based on mutations in the spike protein of SARS-CoV-2. This information provides valuable information about the genetic diversity of the virus and the emergence and spread of new variants. The spike protein is the primary target of neutralizing antibodies and plays a critical role in viral entry into host cells (Jackson et al., 2022).
The information provided by the clustering is based on a different concept than that used for the phylogenetic analysis. The information obtained in the two analyses can be considered complementary, but since they are based on different data, direct comparison is not correct. However, some general correlations can be found between the two analyses. Based on
Figure 4, the samples obtained in March and April 2022 from Cartagena and Murcia show a high degree of similarity. Also, similar to that observed in the phylogenetic analysis, samples obtained in October 2022 in Murcia and Cartagena are very different, which corresponds well with the different variants that were circulating in the two locations.
The methods proposed in this study seem to be adequate to compare ANV as a preliminary evaluation of potential changes in the variants that are circulating in a given population at a specific time point.
Acknowledgments
This research was supported by the European Commission NextGenerationEU fund, through CSIC’s Global Health Platform (PTI Salud Global CSIC, the VATar COVID 19, and the COVI+D Program Region of Murcia (Fundación Séneca). IATA-CSIC is a Centre of Excellence Severo Ochoa (CEX2021-001189-S MCIN/AEI / 10.13039/ 501100011033). EC-F is recipient of a postdoctoral contract from the MICINN Call 2018 (PRE2018-083753). PT is holding a Ramón y Cajal contract from the Ministerio de Ciencia e Innovación.
References
- Attwood SW, Hill SC, Aanensen DM, Connor TR, Pybus OG. Phylogenetic and phylodynamic approaches to understanding and combating the early SARS-CoV-2 pandemic. Nat Rev Genet. 2022 Sep;23(9):547-562. Epub 2022 Apr 22. PMID: 35459859; PMCID: PMC9028907. [CrossRef]
- Bedford J, Enria D, Giesecke J, Heymann DL, Ihekweazu C, Kobinger G, Lane HC, Memish Z, Oh MD, Sall AA, Schuchat A, Ungchusak K, Wieler LH; WHO Strategic and Technical Advisory Group for Infectious Hazards. COVID-19: towards controlling of a pandemic. Lancet. 2020 Mar 28;395(10229):1015-1018. Epub 2020 Mar 17. PMID: 32197103; PMCID: PMC7270596. [CrossRef]
- Bull, R.A., Adikari, T.N., Ferguson, J.M. et al. Analytical validity of nanopore sequencing for rapid SARS-CoV-2 genome analysis. Nat Commun 11, 6272 (2020). [CrossRef]
- Carcereny A, Martínez-Velázquez A, Bosch A, Allende A, Truchado P, Cascales J, Romalde JL, Lois M, Polo D, Sánchez G, Pérez-Cataluña A, Díaz-Reolid A, Antón A, Gregori J, Garcia-Cehic D, Quer J, Palau M, Ruano CG, Pintó RM, Guix S. Monitoring Emergence of the SARS-CoV-2 B.1.1.7 Variant through the Spanish National SARS-CoV-2 Wastewater Surveillance System (VATar COVID-19). Environ Sci Technol. 2021 Sep 7;55(17):11756-11766. Epub 2021 Aug 16. PMID: 34397216; PMCID: PMC8404293. [CrossRef]
- Carcereny, A., A. Martínez-Velázquez, A. Bosch, R. M. Pintó, S. Guix. 2021b. Duplex RTqPCRs for detection and relative quantification of SARS-CoV-2 variants of concern (VOC). Protocol exchange 10.21203/rs.3.pex-1688/v1.
- Crits-Christoph, A. et al. Genome Sequencing of Sewage Detects Regionally Prevalent SARS-CoV-2 Variants. MBio 12, (2021).
- Dong R, He L, He RL and Yau SS-T (2019) A Novel Approach to Clustering Genome Sequences Using Inter-nucleotide Covariance. Front. Genet. 10:234. [CrossRef]
- EC, 2021. COMMISSION RECOMMENDATION of 17.3.2021 on a common approach to establish a systematic surveillance of SARS-CoV-2 and its variants in wastewaters in the EU. https://ec.europa.eu/environment/pdf/water/recommendation_covid19_monitoring_wastewaters.pdf.
- Else H (2020) How a torrent of COVID science changed research publishing in seven charts. Nature 588:553.
- Fall A, Eldesouki RE, Sachithanandham J, Morris CP, Norton JM, Gaston DC, Forman M, Abdullah O, Gallagher N, Li M, Swanson NJ, Pekosz A, Klein EY, Mostafa HH. The displacement of the SARS-CoV-2 variant Delta with Omicron: An investigation of hospital admissions and upper respiratory viral loads. EBioMedicine. 2022 May;79:104008. Epub 2022 Apr 20. PMID: 35460989; PMCID: PMC9020587. [CrossRef]
- Faleye TOC, Bowes DA, Driver EM, Adhikari S, Adams D, Varsani A, Halden RU, Scotch M. Wastewater-Based Epidemiology and Long-Read Sequencing to Identify Enterovirus Circulation in Three Municipalities in Maricopa County, Arizona, Southwest United States between June and October 2020. Viruses. 2021; 13(9):1803. [CrossRef]
- Jackson, C.B., Farzan, M., Chen, B. et al. Mechanisms of SARS-CoV-2 entry into cells. Nat Rev Mol Cell Biol 23, 3–20 (2022). [CrossRef]
- Ji, B., Y. Zhao, T. Wei, and P. Kang. 2021. Water science under the global epidemic of COVID-19: Bibliometric tracking on COVID-19 publication and further research needs. Journal of Environmental Chemical Engineering 9 (4):105357. [CrossRef]
- Kitajima M, Ahmed W, Bibby K, Carducci A, Gerba CP, Hamilton KA, Haramoto E, Rose JB. SARS-CoV-2 in wastewater: State of the knowledge and research needs. Sci Total Environ. 2020 Oct 15;739:139076. Epub 2020 Apr 30. PMID: 32758929; PMCID: PMC7191289. [CrossRef]
- L.-A. Casado-Aranda et al. Tourism research after the COVID-19 outbreak: Insights for more sustainable, local and smart cities. Sustainable Cities and Society 73 (2021) 103126. [CrossRef]
- La Rosa G., Brandtner D., Mancini P., Veneri C., Ferraro G.B., Bonadonna L., Lucentini L., Suffredini E. Key SARS-CoV-2 mutations of alpha, gamma, and eta variants detected in Urban Wastewaters in Italy by long-read amplicon sequencing based on nanopore technology. Water. 2021;13:2503 13. [CrossRef]
- Lee WL, Armas F, Guarneri F, Gu X, Formenti N, Wu F, Chandra F, Parisio G, Chen H, Xiao A, Romeo C, Scali F, Tonni M, Leifels M, Chua FJD, Kwok GW, Tay JY, Pasquali P, Thompson J, Alborali GL, Alm EJ. Rapid displacement of SARS-CoV-2 variant Delta by Omicron revealed by allele-specific PCR in wastewater. Water Res. 2022 Aug 1;221:118809. Epub 2022 Jul 2. PMID: 35841797; PMCID: PMC9250349. [CrossRef]
- Li T, Liu D, Yang Y, Guo J, Feng Y, Zhang X, Cheng S, Feng J. Phylogenetic supertree reveals detailed evolution of SARS-CoV-2. Sci Rep. 2020 Dec 22;10(1):22366. PMID: 33353955; PMCID: PMC7755913. [CrossRef]
- Li, T., Rezaeipanah, A., El Din, E.M.T. (2022). An ensemble agglomerative hierarchical clustering algorithm based on clusters clustering technique and the novel similarity measurement. Journal of King Saud University-Computer and Information Sciences 34 (6), 3828–3842.
- Carmelo Massimo Maida, Emanuele Amodio, Walter Mazzucco, Giuseppina La Rosa, Luca Lucentini, Elisabetta Suffredini, Mario Palermo, Gina Andolina, Francesca Rita Iaia, Fabrizio Merlo, Massimo Giuseppe Chiarelli, Angelo Siragusa, Francesco Vitale, Fabio Tramuto, Daniela Segreto, Pietro Schembri, Giuseppe Cuffari, Antonio Conti, Giovanni Casamassima, Andrea Polizzi, Mansueta Ferrara, Giuseppina Gullo, Angelo Lo Verde, Arianna Russo, Alessandra Casuccio, Claudio Costantino, Vincenzo Restivo, Palmira Immordino, Giorgio Graziano. Wastewater-based epidemiology for early warning of SARS-COV-2 circulation: A pilot study conducted in Sicily, Italy, International Journal of Hygiene and Environmental Health, Volume 242, 2022, 113948, ISSN 1438-4639. [CrossRef]
- Nemudryi, A. et al. Temporal Detection and Phylogenetic Assessment of SARS-CoV-2 in Municipal Wastewater. Cell Reports Med. 1, 100098 (2020).
- Pérez-Cataluña, A., Chiner-Oms, Á., Cuevas-Ferrando, E., Díaz-Reolid, A., Falcó, I., Randazzo, W., Girón-Guzmán, I., Allende, A., Bracho, M.A., Comas, I., Sánchez, G., 2022. Spatial and temporal distribution of SARS-CoV-2 diversity circulating in wastewater. Water Res. 211. [CrossRef]
- Pérez-Cataluña, A., Cuevas-Ferrando, E., Randazzo, W., Falcó, I., Allende, A., Sánchez, G., 2021. Comparing analytical methods to detect SARS-CoV-2 in wastewater. Sci. Total Environ. 758. [CrossRef]
- Puente, H., Randazzo, W., Falcó, I., Carvajal, A., Sánchez, G., 2020. Rapid Selective Detection of Potentially Infectious Porcine Epidemic Diarrhea Coronavirus Exposed to Heat Treatments Using Viability RT-qPCR. Front. Microbiol. 11, 1911. [CrossRef]
- Randazzo, W., Truchado, P., Cuevas-Ferrando, E., Simón, P., Allende, A., Sánchez, G. 2020. SARS-CoV-2 RNA in wastewater anticipated COVID-19 occurrence in a low prevalence area. Water Research, 181, 115942.
- Ruiz-Fresneda MA, Ruiz-Pérez R, Ruiz-Fresneda C, Jiménez-Contreras E. Differences in Global Scientific Production Between New mRNA and Conventional Vaccines Against COVID-19. Environ Sci Pollut Res Int. 2022 Aug;29(38):57054-57066. Epub 2022 Jun 22. PMID: 35731431; PMCID: PMC9213638. [CrossRef]
- Singh, D., Yi, S.V. On the origin and evolution of SARS-CoV-2. Exp Mol Med 53, 537–547 (2021). [CrossRef]
- Teng Li, Amin Rezaeipanah, ElSayed M. Tag El Din. An ensemble agglomerative hierarchical clustering algorithm based on clusters clustering technique and the novel similarity measurement, Journal of King Saud University - Computer and Information Sciences.Volume 34, Issue 6, Part B, 2022, Pages 3828-3842, ISSN 1319-1578, . [CrossRef]
- Troyano-Hernáez P, Reinosa R, Holguín Á. Evolution of SARS-CoV-2 in Spain during the First Two Years of the Pandemic: Circulating Variants, Amino Acid Conservation, and Genetic Variability in Structural, Non-Structural, and Accessory Proteins. Int J Mol Sci. 2022 Jun 7;23(12):6394. PMID: 35742840; PMCID: PMC9223475. [CrossRef]
- Vo, V., Harrington, A., Afzal, S., Papp, K., Chang, C-L., Baker, H, Aguilar, P., Buttery, E., Picker, M.A., Lockett, C., Gerrity, D., Kan, H-Y., Oh, E.C., 2023. Identification of a rare SARS-CoV-2 XL hybrid variant in wastewater and the subsequent discovery of two infected individuals in Nevada. Science of The Total Environment, 858, 160024. [CrossRef]
- Wilrich, C., Wilrich, P.T., 2009. Estimation of the pod function and the LOD of a qualitative microbiological measurement method. J. AOAC Int. 92, 1763–1772. [CrossRef]
- Xagoraraki, I., O’Brien, E. (2020). “Wastewater-based epidemiology for early detection of viral outbreaks,” in Women in water quality (Germany: Springer), 75–97.
- Sims, Gregory A.; Jun, S.R.; Wu, G.A.;Kim, S.H. (2009) Alignment-free genome comparison with feature frequency profiles (FFP) and optimal resolutions. Proc. Nat. Acad. Sci. Journal. 106, 8, 2677-2682.
|
Disclaimer/Publisher’s Note: The statements, opinions and data contained in all publications are solely those of the individual author(s) and contributor(s) and not of MDPI and/or the editor(s). MDPI and/or the editor(s) disclaim responsibility for any injury to people or property resulting from any ideas, methods, instructions or products referred to in the content. |
© 2023 by the authors. Licensee MDPI, Basel, Switzerland. This article is an open access article distributed under the terms and conditions of the Creative Commons Attribution (CC BY) license (http://creativecommons.org/licenses/by/4.0/).
