Preprint
Article

Influence of Ion Nitriding on Microstructure and Properties of Haynes 282 Nickel Alloy Specimens Produced using Additive Technique

Submitted:

05 May 2023

Posted:

06 May 2023

You are already at the latest version

A peer-reviewed article of this preprint also exists.

Abstract
The paper investigates the influence of ion nitriding on the microstructure, corrosion resistance, and tensile strength at elevated temperatures of Haynes 282 nickel superalloy specimens produced by the Direct Metal Laser Sintering-DMLS technique. Analysis of the specimens’ surface morphology revealed that the ion nitriding process significantly affects the physical and chemical phenomena occurring on the surface of the specimens. Phase composition and stress analysis showed that Haynes 282 nickel alloy specimens produced by the DMLS technique and a chromium nitride layer produced in the ion nitriding process have tensile stress. The layer is also characterized by high nanohardness compared to specimens produced using the classical method (wrought) and DMLS technique. The conducted corrosion resistance tests confirmed the positive effect of the nitrided layer on the corrosion resistance of Haynes 282 nickel alloy produced by the DMLS technique. The ion nitriding process did not significantly affect the elevated-temperature tensile strength of Haynes 282 nickel alloy specimens produced by the DMLS technique.
Keywords: 
Subject: 
Engineering  -   Mechanical Engineering

1. Introduction

Nickel-based superalloys are widely used in various industries, e.g. energy, aerospace, oil and gas processing [1,2,3,4,5]. Their versatility stems from both their mechanical properties and their resistance to high-temperature oxidation and electrochemical corrosion in many aqueous environments [6,7,8]. The passive oxide layer which spontaneously forms on the surface, as in the case of titanium alloys or alloy steels, significantly increases corrosion resistance compared to the substrate in the active state [9]. However, an oxide cathode layer makes the passive oxide layer susceptible to local corrosion in the presence of aggressive ions, such as chloride ions (Cl-), often found in many industrial environments [10]. In the case of nitrided layers produced on Ni-Cr alloy [11] exposed in chloride-free environments (H2SO4), the CrN+Cr2N layer is not susceptible to pitting corrosion. In addition, it has been shown that the best corrosion resistance is achieved by when phases are combined (CrN + Cr2N) rather than when a homogeneous phase Cr2N or phase π (Cr12.8Ni7.2N4.0) are used alone. It is assumed that the differentiated corrosion resistance of chromium nitrides is related to the different crystallographic structures of the CrN (fcc A1) and Cr2N (hcp A3) phases and the packing density of atoms in the unit cell. In the case of corrosion solutions with a mixture of aggressive ions (Cl- and SO4-2) [12], the durability of nitrided layers is additionally determined by the quality and degree of the substrate’s defectiveness, which is determined, among others, by the value of breakdown potential (Enp) and the intensity of local corrosion (e.g. pitting). In nitride layers formed on alloys rich in chromium atoms, it is also possible to have insignificant amounts of other phases (α-Cr, Cr2O3) that further reduce the corrosion resistance of the substrate. One of the newer nickel superalloys developed for use at high temperatures in aggressive environments is Haynes 282 nickel alloy [13,14]. This alloy is strengthened with the γ’ phase and is characterized by high strength properties and good weldability [15]. Good weldability is the result of a carefully defined aluminum and titanium content, which affects the volume fraction of the γ’ phase. Its high content significantly limits the technological properties of the produced materials, especially those obtained using additive techniques [16]. However, it should be emphasized that materials produced by additive techniques usually demonstrate anisotropic properties. They are mainly caused by crystallographic texture, the structure of smelting pools, the privileged distribution of certain phases and carbides, and the presence of asymmetrical defects [17]. Boswell et al. in their study [18] showed that the anisotropic effect could be effectively reduced by appropriate dissolution and ageing heat treatment, leading to recrystallization and local texture reduction. Applying high temperature to the building platform during the LPBD process has also been shown to be effective in reducing adverse anisotropy effects, such as grain boundary cracking, associated with accumulating γ’ and carbide precipitates [19].
Ion nitriding processes belong to modern thermo-chemical treatments enabling the production of protective diffusion layers with controlled phase composition and high-performance properties. Such materials include chromium nitride, characterized by high hardness, corrosion resistance and resistance to abrasive wear or oxidation. This material in diffusion layers or coatings is successfully produced on some steels [20,21,22]. However, there is much less information on the ion nitriding of nickel alloys, in particular, nickel alloys having the characteristics of a strongly defective anisotropic structure.
The study aims to investigate the influence of the anisotropic structure of Haynes 282 nickel alloy substrate on the microstructure of a chromium nitride layer formed by ion nitriding and its resistance to corrosion, hardness, Young’s modulus and mechanical properties at elevated temperatures.

2. Materials and Methods

2.1. Production of Haynes 282 Specimens by Additive Technique

Test specimens measuring 20x20x10 mm were produced from Haynes 282 (HY 282) nickel alloy powder using an EOS M100 printer working in Direct Metal Laser Sintering (DMLS) technology. The specimens were produced in a 5.0 purity argon atmosphere, with the platform heated to 80 °C. Each subsequent layer was scanned in a direction rotated by 67° relative to the previous layer. The specimen production process was carried out with the following parameters: energy density E-100 J/mm3, laser power P – 100 W, laser speed V – 800 mm/s, and distance between successive paths H – 0.05 mm.

2.2. Ion Nitriding Process

Before the nitriding process, the specimens were washed in an ultrasonic scrubber in ethyl alcohol, then dried and placed in a universal ion nitriding furnace on the cathode potential of PDT (Plasma/Ion Diffusion Treatment) processes. The ion nitriding process on the cathode potential was carried out in a mixture of gases (25% N2 + 75% H2) for 12 h at 570 °C and 3.5 hPa.

2.3. Microstructure

Microstructures were studied by means of light microscopy, scanning electron microscopy (SEM) as well as transmission electron microscopy (TEM). To reveal the general microstructure, particularly the melt pools, metallographic deposits of Haynes 282 produced by the additive technique was prepared. For comparison, specimen of Haynes 282 nickel alloy produced using the classical technology (cast and annealed/wrought) was also prepared. The specimens produced using the optimal process parameter were etched using Kalling’s No. 2 reagent. The revealed microstructure was examined and revealed microstructures were examined using a Zeiss Axio Scope light microscope. The microstructure of nitriding Haynes 282 produced by the additive technique was analyzed by light and transmission electron microscopy. The cross-section metallographic deposit was prepared. TEM studies were performed using a FEI Tecnai G2 F20 S-TWIN operated at 200 kV. Cross-sectional TEM specimen was prepared by mechanical polishing and subsequent Ar+ ion milling until electron transparency using the PIPS system from Gatan. The surface morphology of nickel superalloy specimens as-prepared and after corrosion resistance tests wasere also studied by means of the TM-1000 scanning electron microscope using backscattered electrons (BSE).

2.4. Nanohardness of the Manufactured Layers

Nanoindentation tests were conducted on Micromaterials’ Vantage Alpha using a Berkovich indenter. The determined load curves as a function of the indenter displacement were analyzed according to the Oliver-Pharr method to determine nanohardness, and included thermal drift analysis. The measurements were made along the cross-section of the produced layers with 1 mN load, 10 s loading time, 10 s unloading time and 5 s dwell period.

2.5. Corrosion Resistance Tests

Corrosion resistance tests of Haynes 282 nickel alloy (produced using classical technology and using 3D printing) (in the initial state and with a nitrided layer produced in the ion nitriding process), were performed using impedance (EIS) and potentiodynamic (LSV) methods by means of the AutoLab PGSTAT100 potentiostat in a non-deoxygenated solution of 0.1 M Na2SO4 + 0.1 M NaCl at room temperature. Before electrochemical testing, the specimens were exposed to a corrosion solution under electroless conditions for 5000s needed to stabilize the open system potential. Impedance tests (EIS) were carried out in a three-electrode system (test electrode – reference electrode (saturated calomel electrode SCE) – auxiliary electrode (platinum)) in the frequency range of 105 Hz – 10-3Hz, with a sinusoidal signal amplitude of 10 mV in potentiostatic mode at the open circuit potential (EOCP). Electrochemical studies were carried out using a Faraday cage. Impedance spectra were analyzed using Baukamp’s EQUIVCRT program. For the classic nickel superalloy, an electrical replacement circuit (EC) with one time constant R(RQ) was used, while the 3D printed material employed a replacement circuit with two-time constants R(RQ)(RQ). Two-time constants in the starting material are conditional on a heterogeneous substrate structure, typical for materials after laser processing, in which the paths of penetration of the substrate with a laser beam and familiar ’tears’ are observed. The production of a nitrided layer on a substrate using the 3D printing technique significantly modified the parameters and electrochemical nature of the substrate as a result of numerous nitride precipitates on the surface and some layer discontinuities as observed in microscopy studies. They were analyzed using replacement system R(Q[R(RQ)]), which is commonly used for materials susceptible to local corrosion. The resulting spectra are presented in the form of Bode and Nyquist graphs. Potentiodynamic tests were carried out in an identical three-electrode system up to a potential of 1500 mV. After anodic polarization, a return polarization (inverted curve) was performed to determine the presence of a possible hysteresis loop. Regardless of the polarization direction, the potential change was 0.2 mV/s. Surface topography studies were carried out using the ACCURION optical profilometer HALCYONICS_i4 Sensofar Metrology (SPAIN) using the SensoVIEW program.

2.6. Analysis of Phase Composition and Residual Stresses

The phase composition analysis was carried out using Rigaku’s Miniflex II X-ray diffractometer (JPN). Filtered X-rays of the Cukα1 λ = 0.154 nm tube in the Bragg-Brentano diffraction geometry were used. An angle value range of 2θ = 20 ÷ 100°, a radiation intensity measurement period of 2θ = 0.02° and a measurement time of t = 3s were assumed. The phase composition was determined using the diffraction database PDF (Powder Diffraction File), developed by ICDD (The International Centre for Diffraction Data). The identification of phase components consisted of adjusting the profile of the obtained diffractogram, i.e. the calculated distances between hkl planes (dhkl) for individual reflections and their intensity, to the data in the PDF database.
The self-stresses were determined for the marked points on the surface of the test sleeve. Proto and XRD Combo X-ray diffractometer and Proto Manufacturing (CAN) XRD Win 2.0 computer software were used. The test used a lamp with a manganese anode MnKα1 λ = 0.210 nm, a collimator diameter of 2 mm, an anode current of four mA, and an anode voltage of 20 kV. To calculate the self-stress values at a given measuring point, the sin2Ψ method [23] was used. This is a standard method involving the use of symmetrical Bragg-Brentano diffraction. This method uses a goniometer of the Ψ type, which makes it possible to obtain the proper inclinations of the diffraction vector by angles Ψ and in a plane perpendicular to the diffraction plane [24]. Natural stresses were determined for constant values of the angle Ψ in the range from 25 to -25°. Elastic deformations in the tested element were carried out for the diffraction line from the family of {311} planes at an angle of 2θ = 155.2. In the self-stress measurements, a Poisson’s coefficient value of ν = 0.319 and a Young’s modulus value of E = 217 GPa were assumed [25].

2.7. Static Tensile Test

The static tensile test was carried out at 750 °C on axially symmetrical specimens with a circular cross-section and a diameter of 6 mm. The length of the parallel part of the specimen was 36 mm, and the measuring base of the extensometer was 25 mm. The tensile test was performed using an electromechanical testing machine equipped with a force sensor at a measuring range of 50 kN. The control variable of the tensile test was the constant displacement of the testing machine traverse of 0.5 mm/min, which for a given specimen geometry gives an initial tensile speed of 3.3x10⁻⁴ s-1. For each of the materials, 2 specimens were subjected to a tensile test, and then the average values of the analyzed mechanical properties were determined.

3. Research Results and Discussion

3.1. Microstructure

Figure 1 shows the microstructure of Haynes 282 nickel alloy specimens in a cast and annealed state, and produced by DMLS in the XY plane. In the microstructure of the Haynes 282 nickel alloy in the cast and annealed state (Figure 1a), austenite grains, twins and carbides are visible. The microstructure of the Haynes 282 nickel alloy specimen produced by the additive technique comprises layers/welds arranged alternately corresponding to the laser beam’s scanning directions and the melted powder’s particle size (Figure 1b).
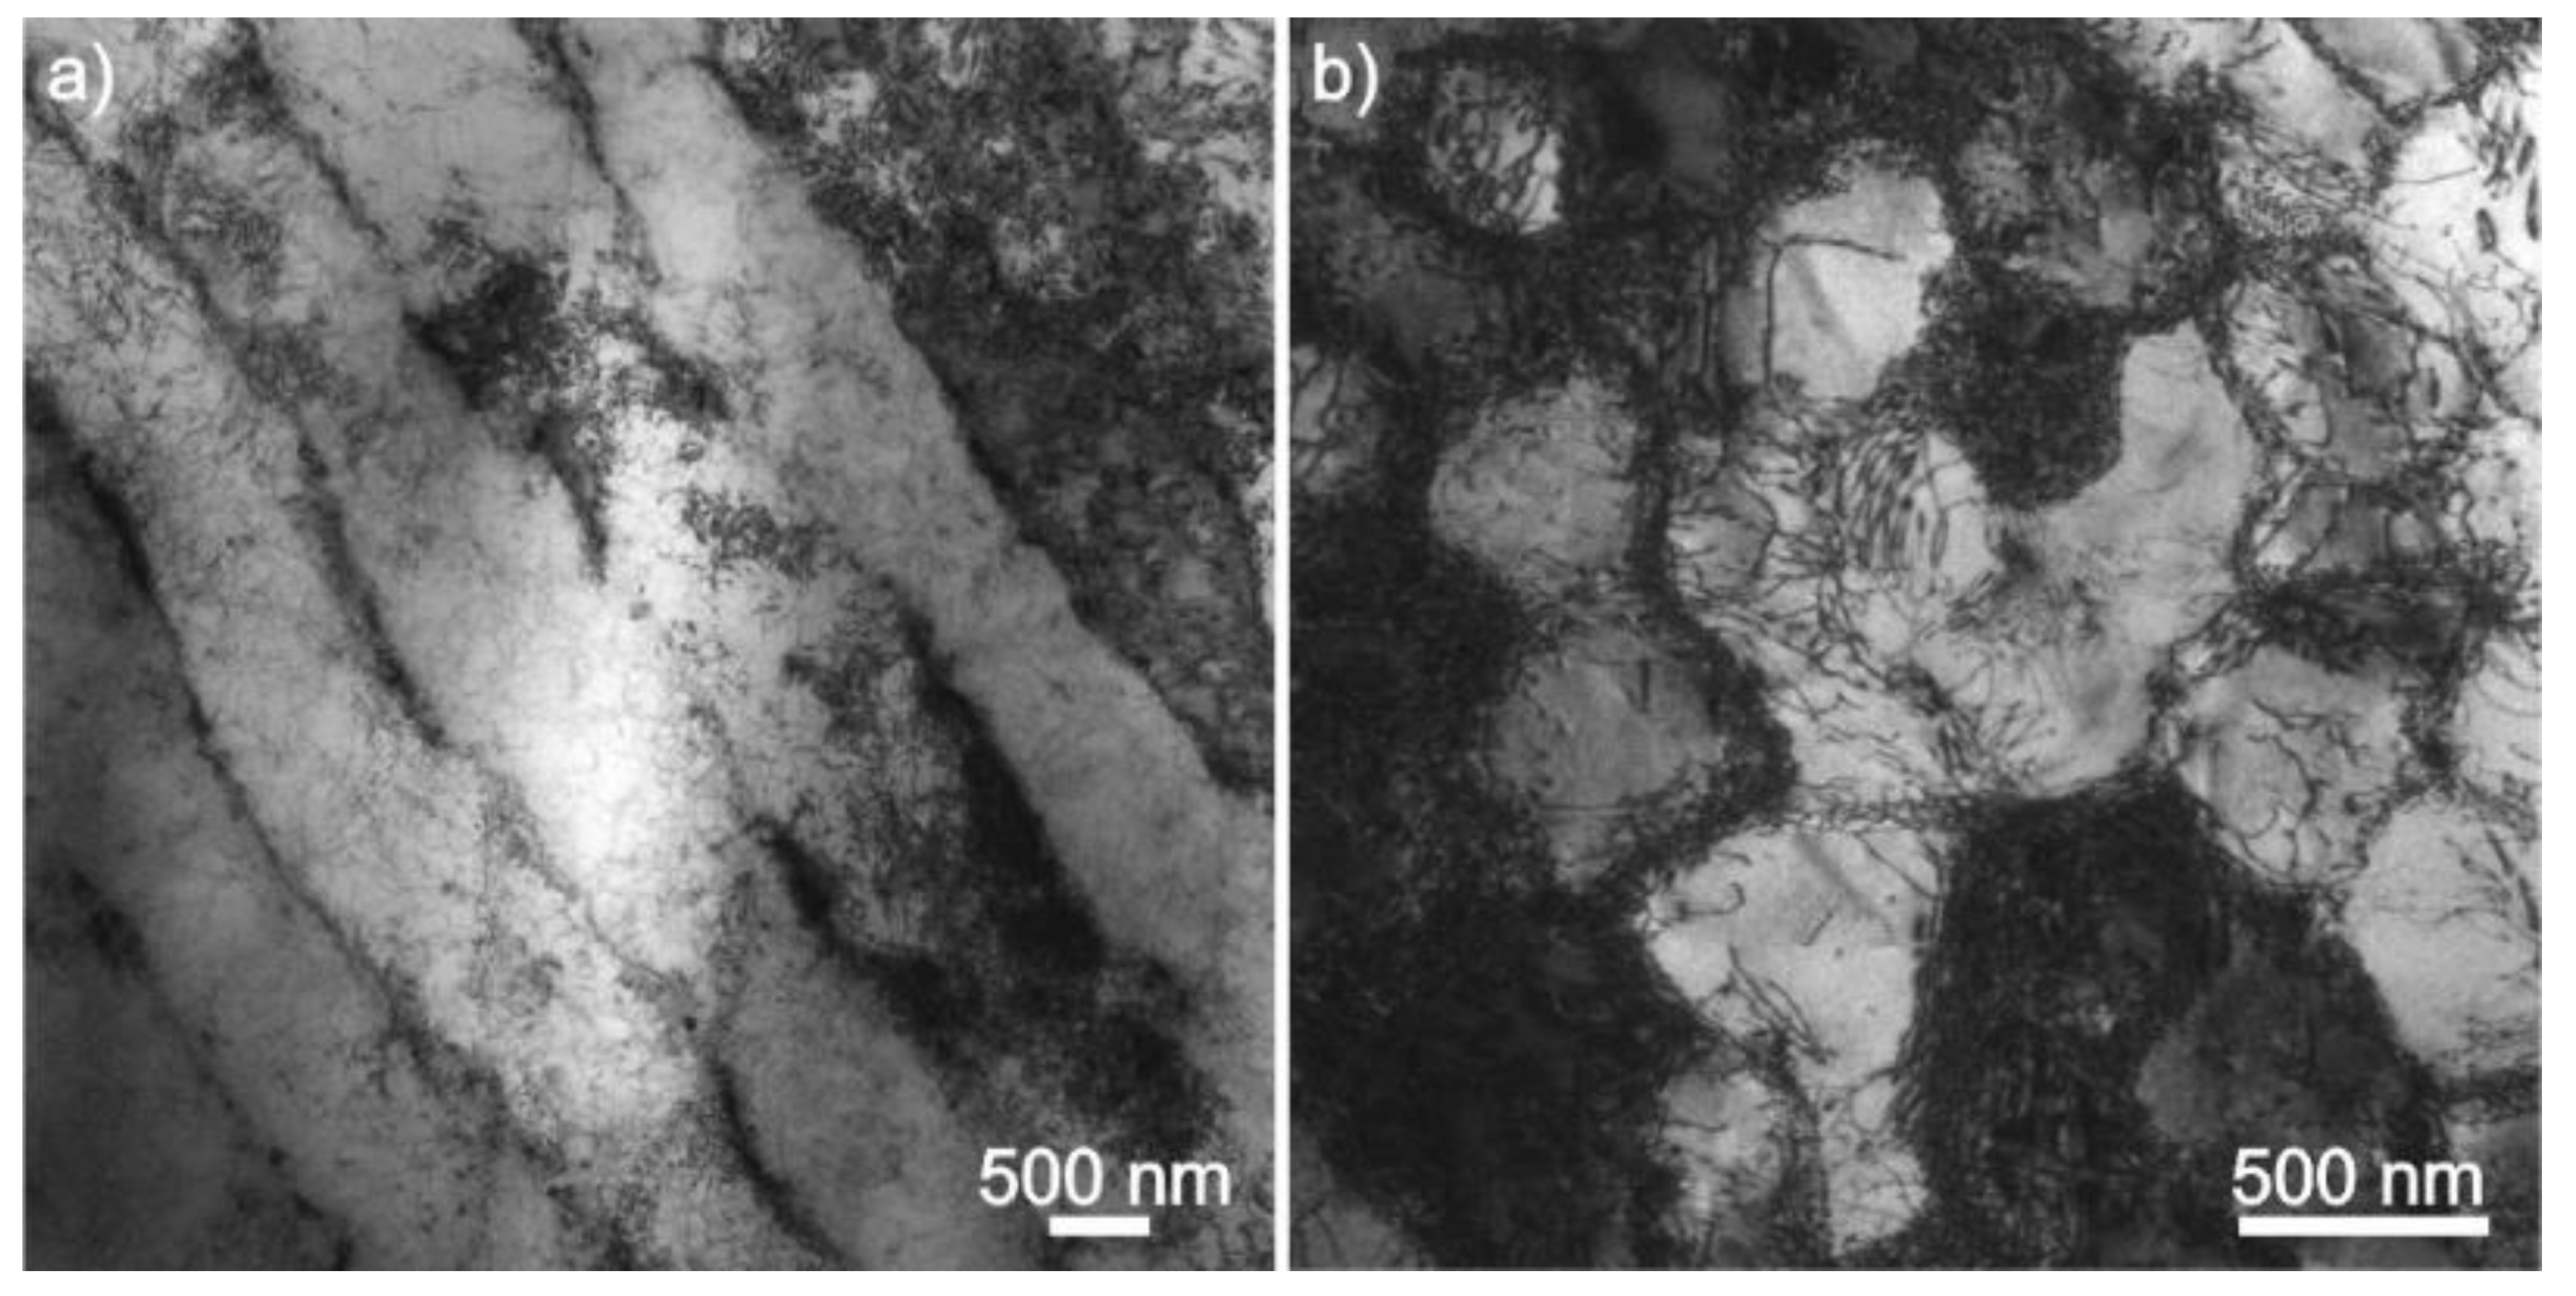
Figure 2 shows TEM micrographs of the Haynes 282 nickel alloy substrate prepared by the additive technique. One can see the high density of dislocations that form the regular cellular structure. The austenite grains consist of slightly misoriented sub-grains about the size of 500 – 1000 nm. The cells are of elongated shape (Figure 2a). The direction of elongation probably can be attributed to the laser beam’s scanning direction. In edge-on view, the cells adopt a hexagonal shape (Figure 2b). Such kind of dislocation structure was also observed in an additively manufactured austenitic steel [33].
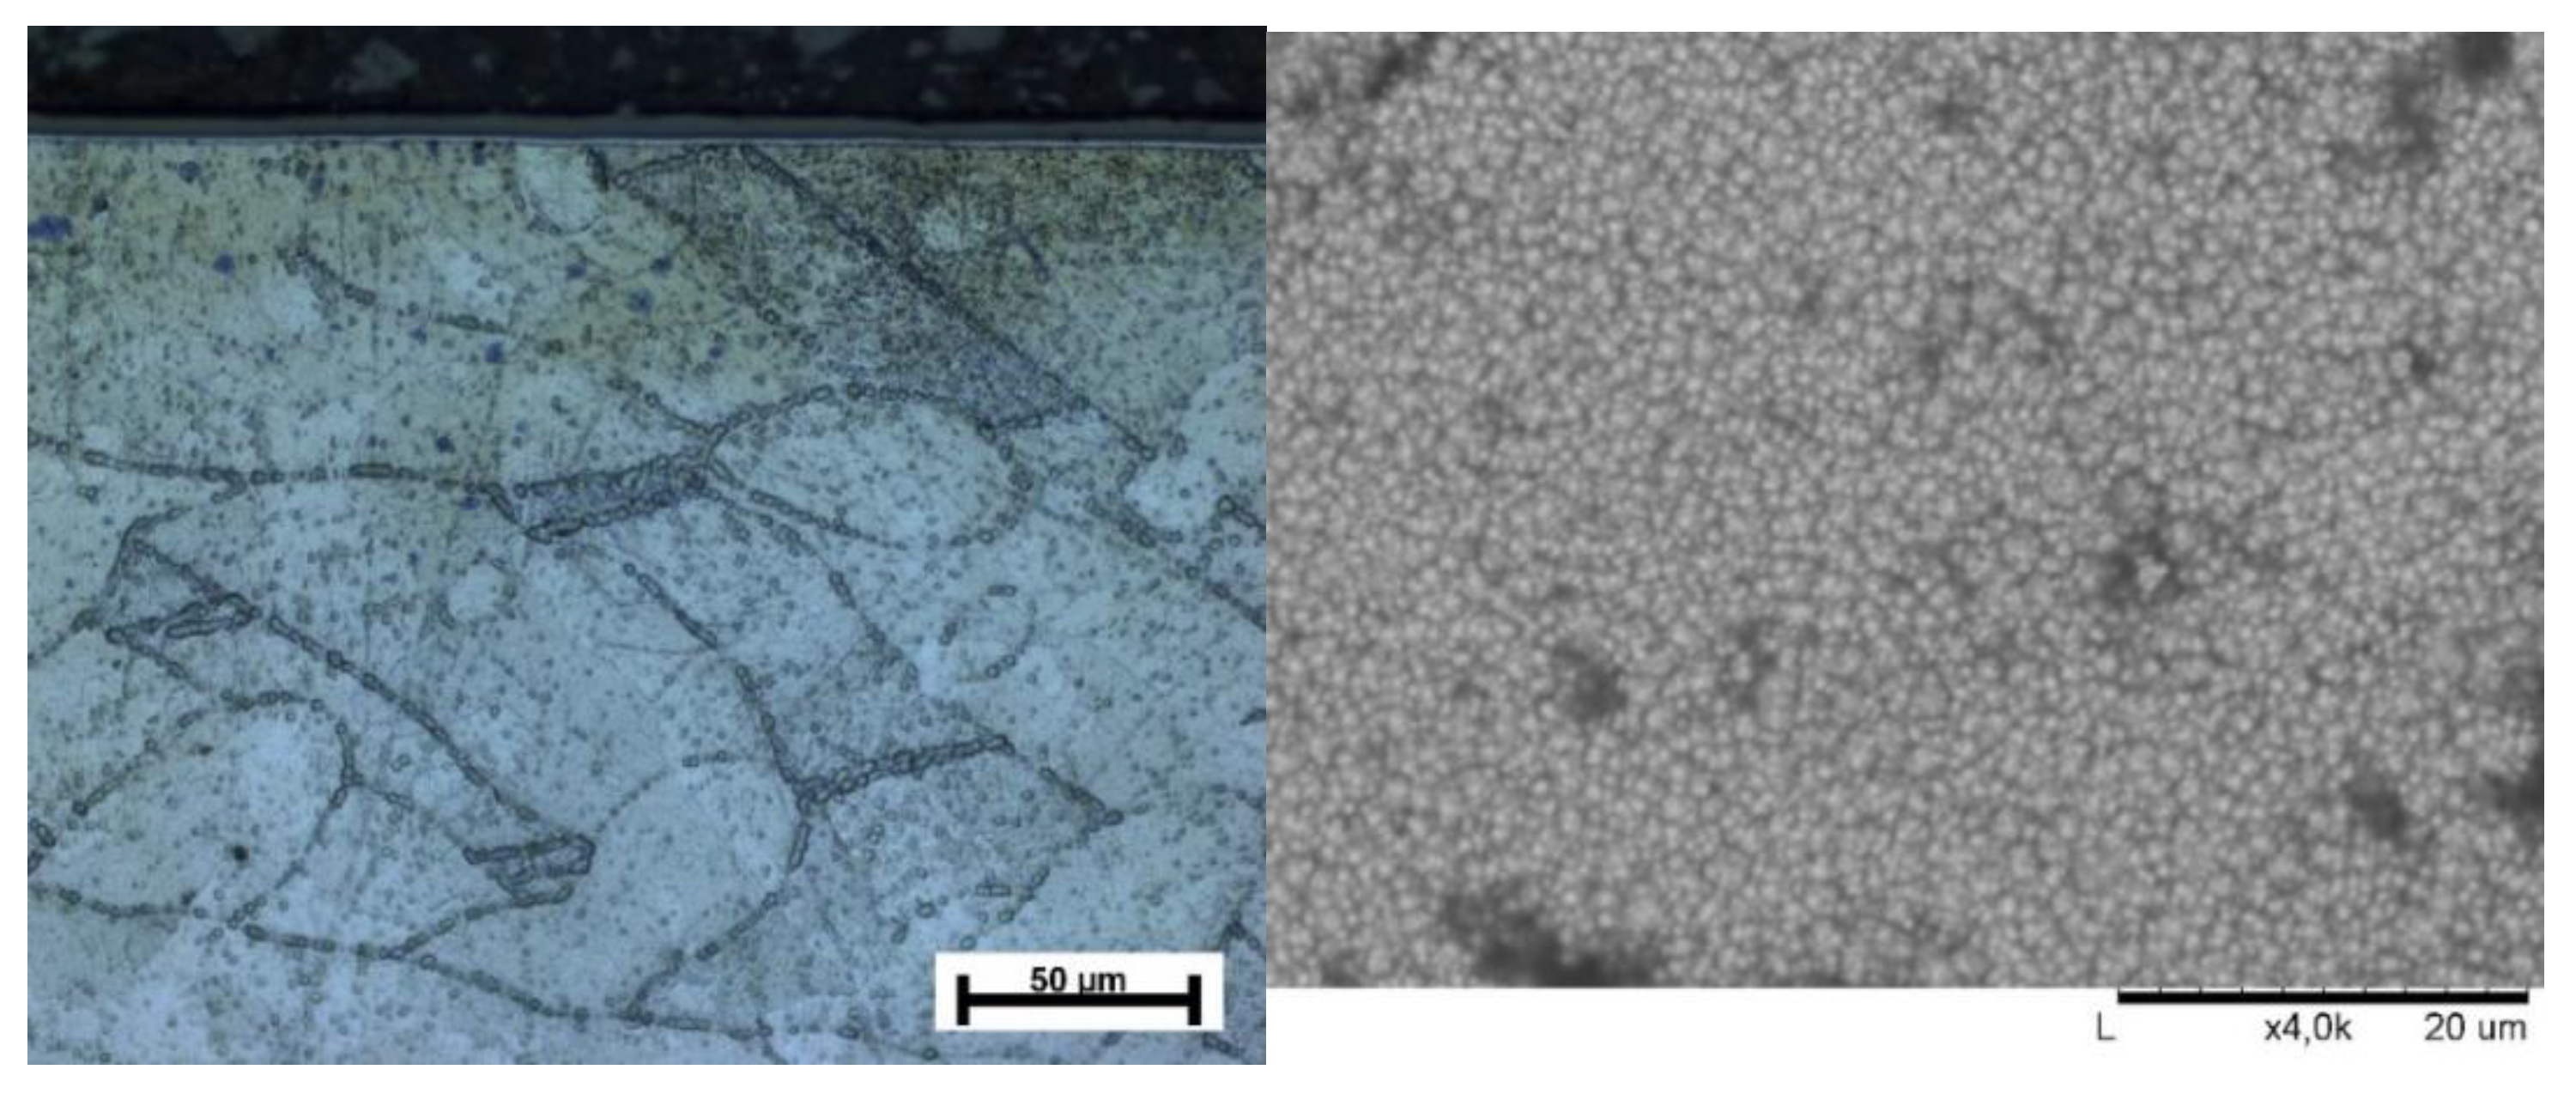
Figure 3 shows the cross-section and morphology of a layer produced in the ion nitriding process at a temperature of 570 °C in 12 h on a Haynes 282 nickel alloy substrate. Microscopic observations show that the thickness of the nitrided layer can be estimated at approx. 7 µm (Figure 3a). This layer is homogeneous and continuous over the entire specimen’s cross-section, adheres well to the substrate, and there are no visible voids at the boundary of the substrate layer. Fine particles are visible on the surface of the layers (Figure 3b), adhering well to the specimen’s surface.

3.2. Phase Analysis and Residual Stress

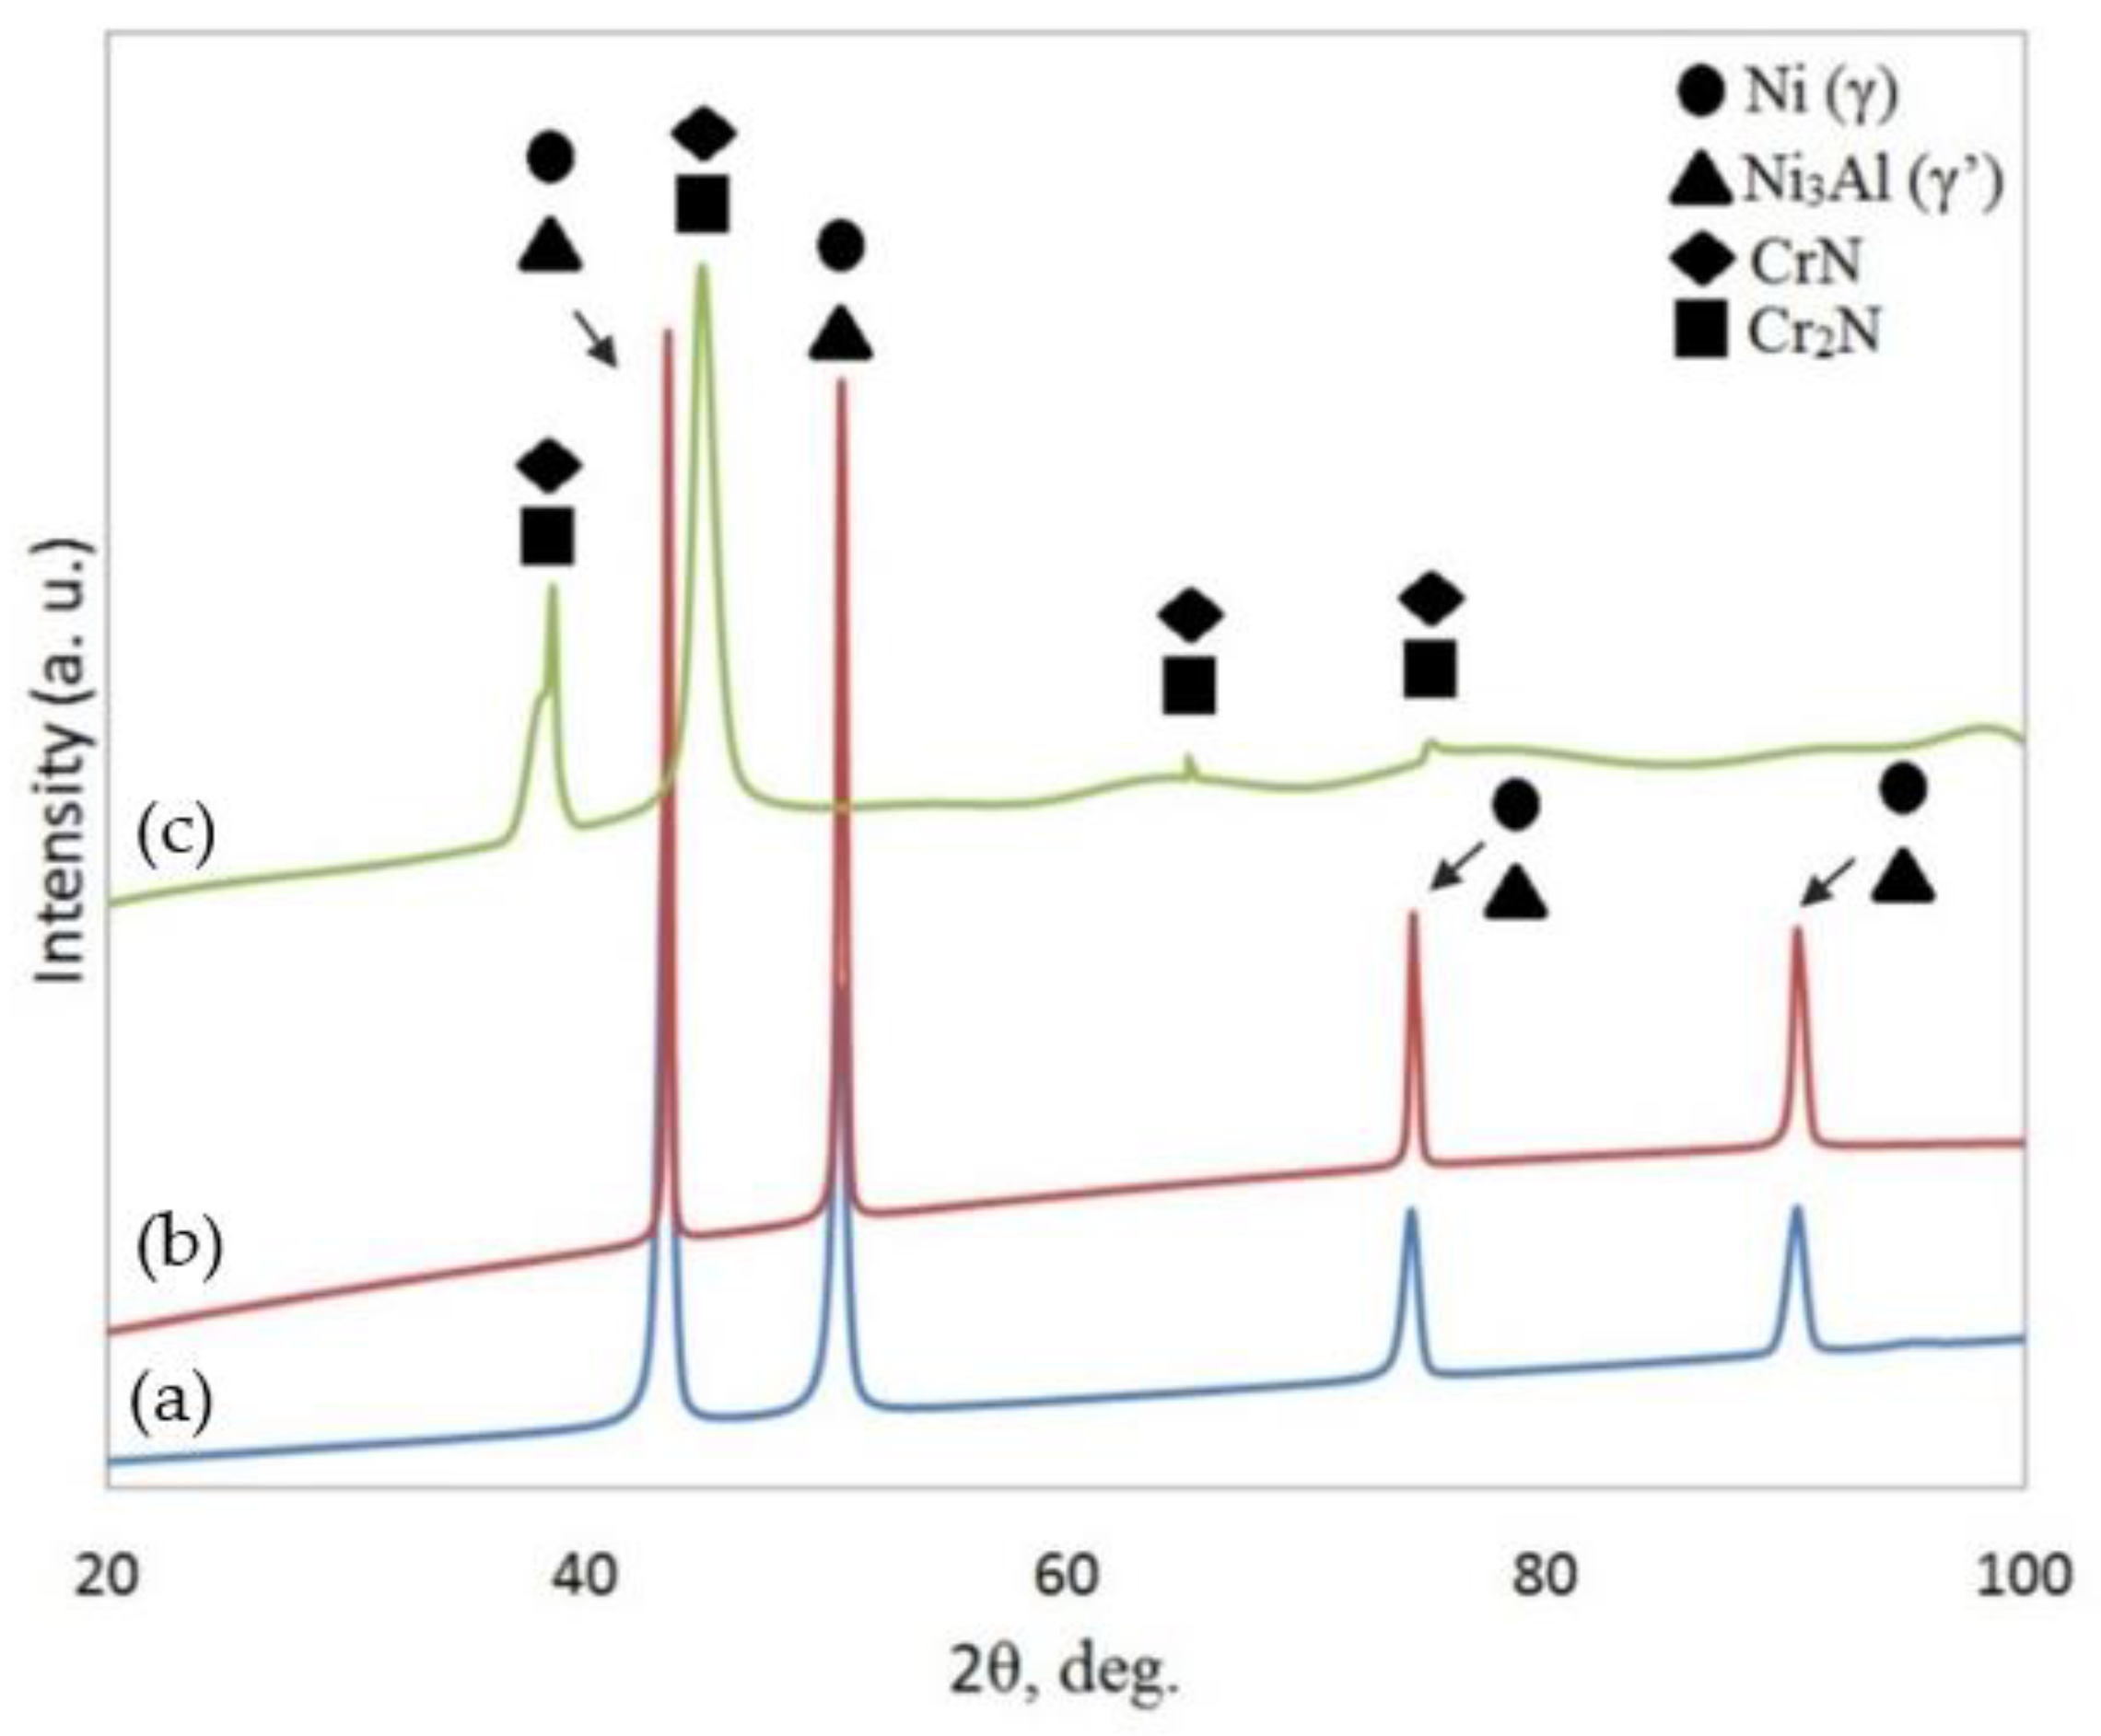
Analysis of the phase composition of Haynes 282 nickel alloy as delivered and specimens produced by 3D printing showed very similar lines on diffractograms and the occurrence of two phases: gamma matrix Niγ (PDF Card 01-077-9326) and the strengthening phase γ’ (PDF Card 04-004-2742) (Figure 4).
The ion nitriding process changed the phase composition on the surface of Haynes 282 nickel alloy specimens. Two additional phases were found: CrN (PDF Card 04-007-0676) and Cr2N (PDF Card 00-035-0803). The CrN phase crystallizes in the ortorhombic structure (Pnmm). The lattice parameters of the unit cell are a0 = 0.287, b0 = 0.297 and c0 = 0.4132 nm. In turn, the Cr2N phase crystallizes in the hexagonal structure (P31m), with the unit cell lattice parameters equal to a0 = 0.481nm and co = 0.448 nm.
Diffractogram patterns (Figure 4) obtained from the XRD analysis, containing both phases from the Haynes 282 alloy substrate (Niγ and γ’) and the phases of CrN and Cr2N after the ion nitriding process, are similar to those analyzed in studies [26,27].
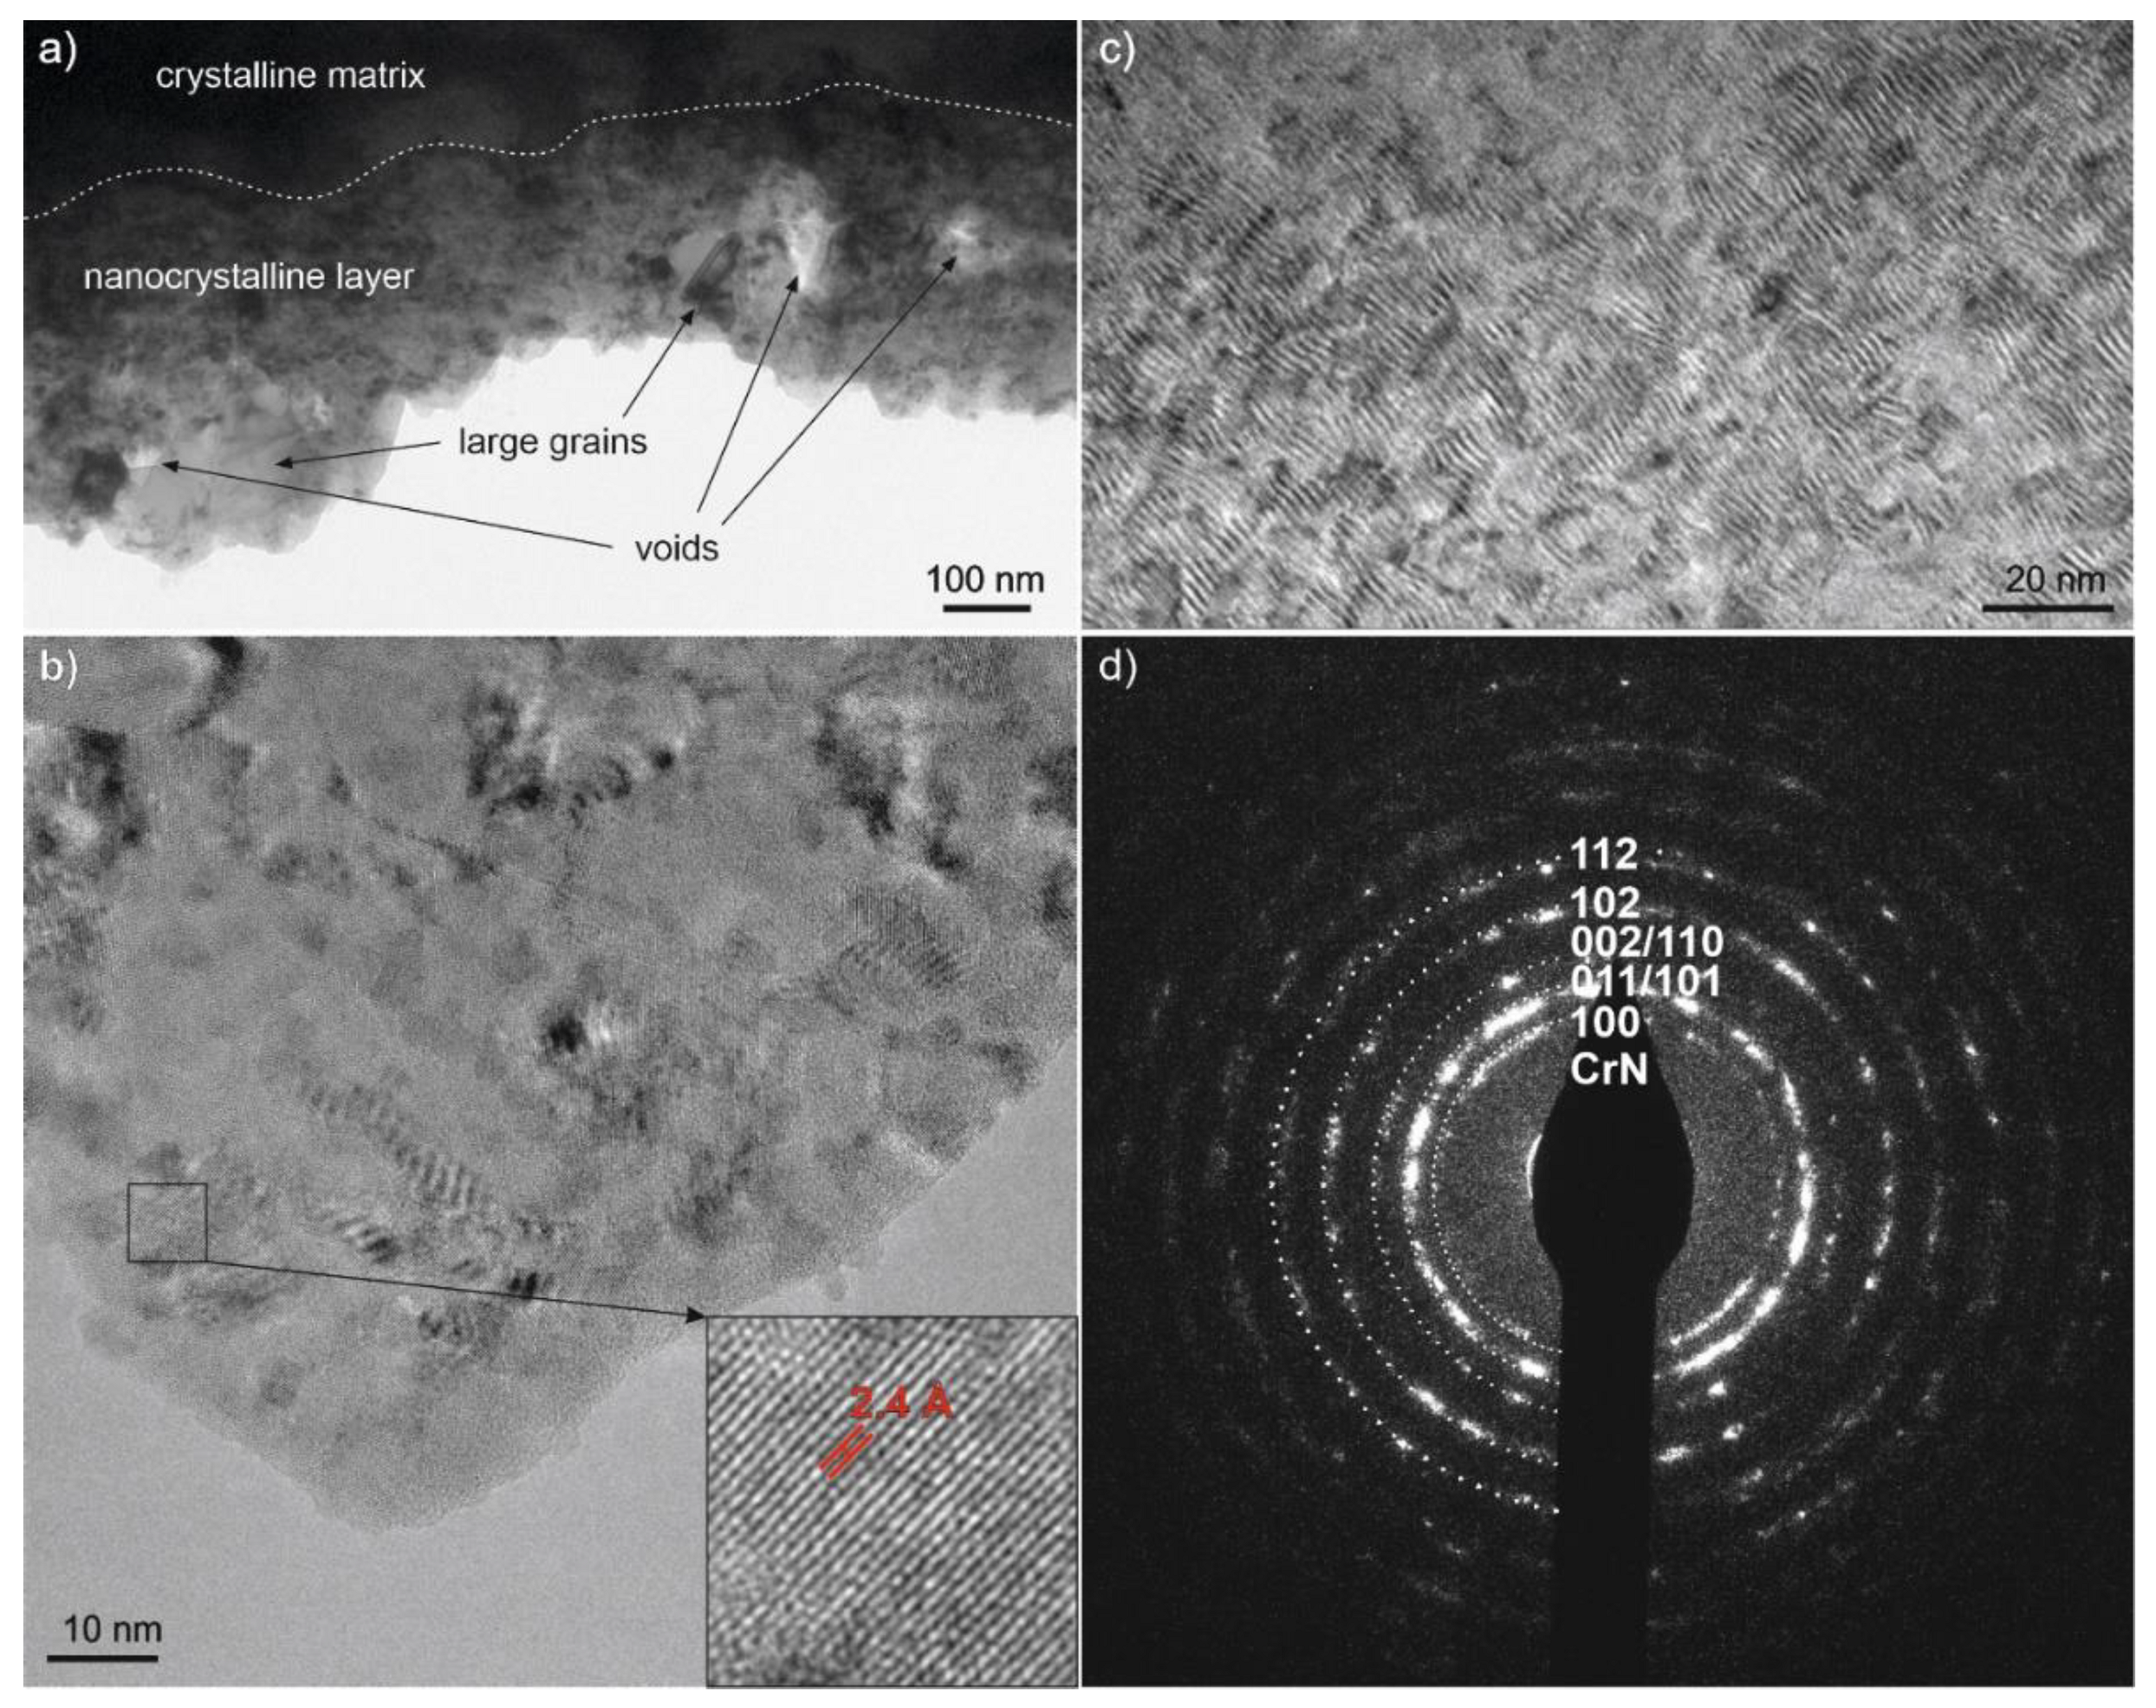
TEM studies of the nitiriding alloy (Figure 5) revealed a thin layer at the surface. The layer has irregular thickness of about 200 – 400 nm and consists of nano-sized grains (several nanometers) in an amorphous matrix with the presence of larger grains (tens to hundreds of nanometers) and voids (Figure 5a-b). Below the layer, a Moiré pattern is visible (Figure 5c) that indicates nanograins precipitated in the austenite matrix of the alloy. Interestingly, this region does not exhibit a high density of dislocations. It is extending to a depth of about 8 μm and then the cellular dislocation structure, like for the alloy substrate (Figure 2), was revealed. It corresponds to the layer thickness determined by light microscopy observations. Electron diffraction analysis (Figure 5d) indicates the formation of a CrN phase, but the presence of a Cr2N phase cannot be excluded due to similar interplanar distances.
Residual stress values were measured in the initial state, after 3D printing and after ion nitriding. In each case, a tensile stress state was found. The highest tensile stress value of +384 ÷ 40 MPa was found in the alloy in its initial state, while the 3D printed specimen showed a slightly lower value of + 152 ÷ 24 MPa. The lowest tensile stress value was found in the Haynes 282 alloy after ion nitriding and amounted to + 64 ÷ 45 MPa.
In the analyzed studies, the stresses found in the surface layer after fluorescent nitriding are either mostly compressive [28] or on the border of tensile and compressive [29]. However, B. Bouaouina et al. also obtained eigen-tensile stresses [30].

3.3. Nanohardness

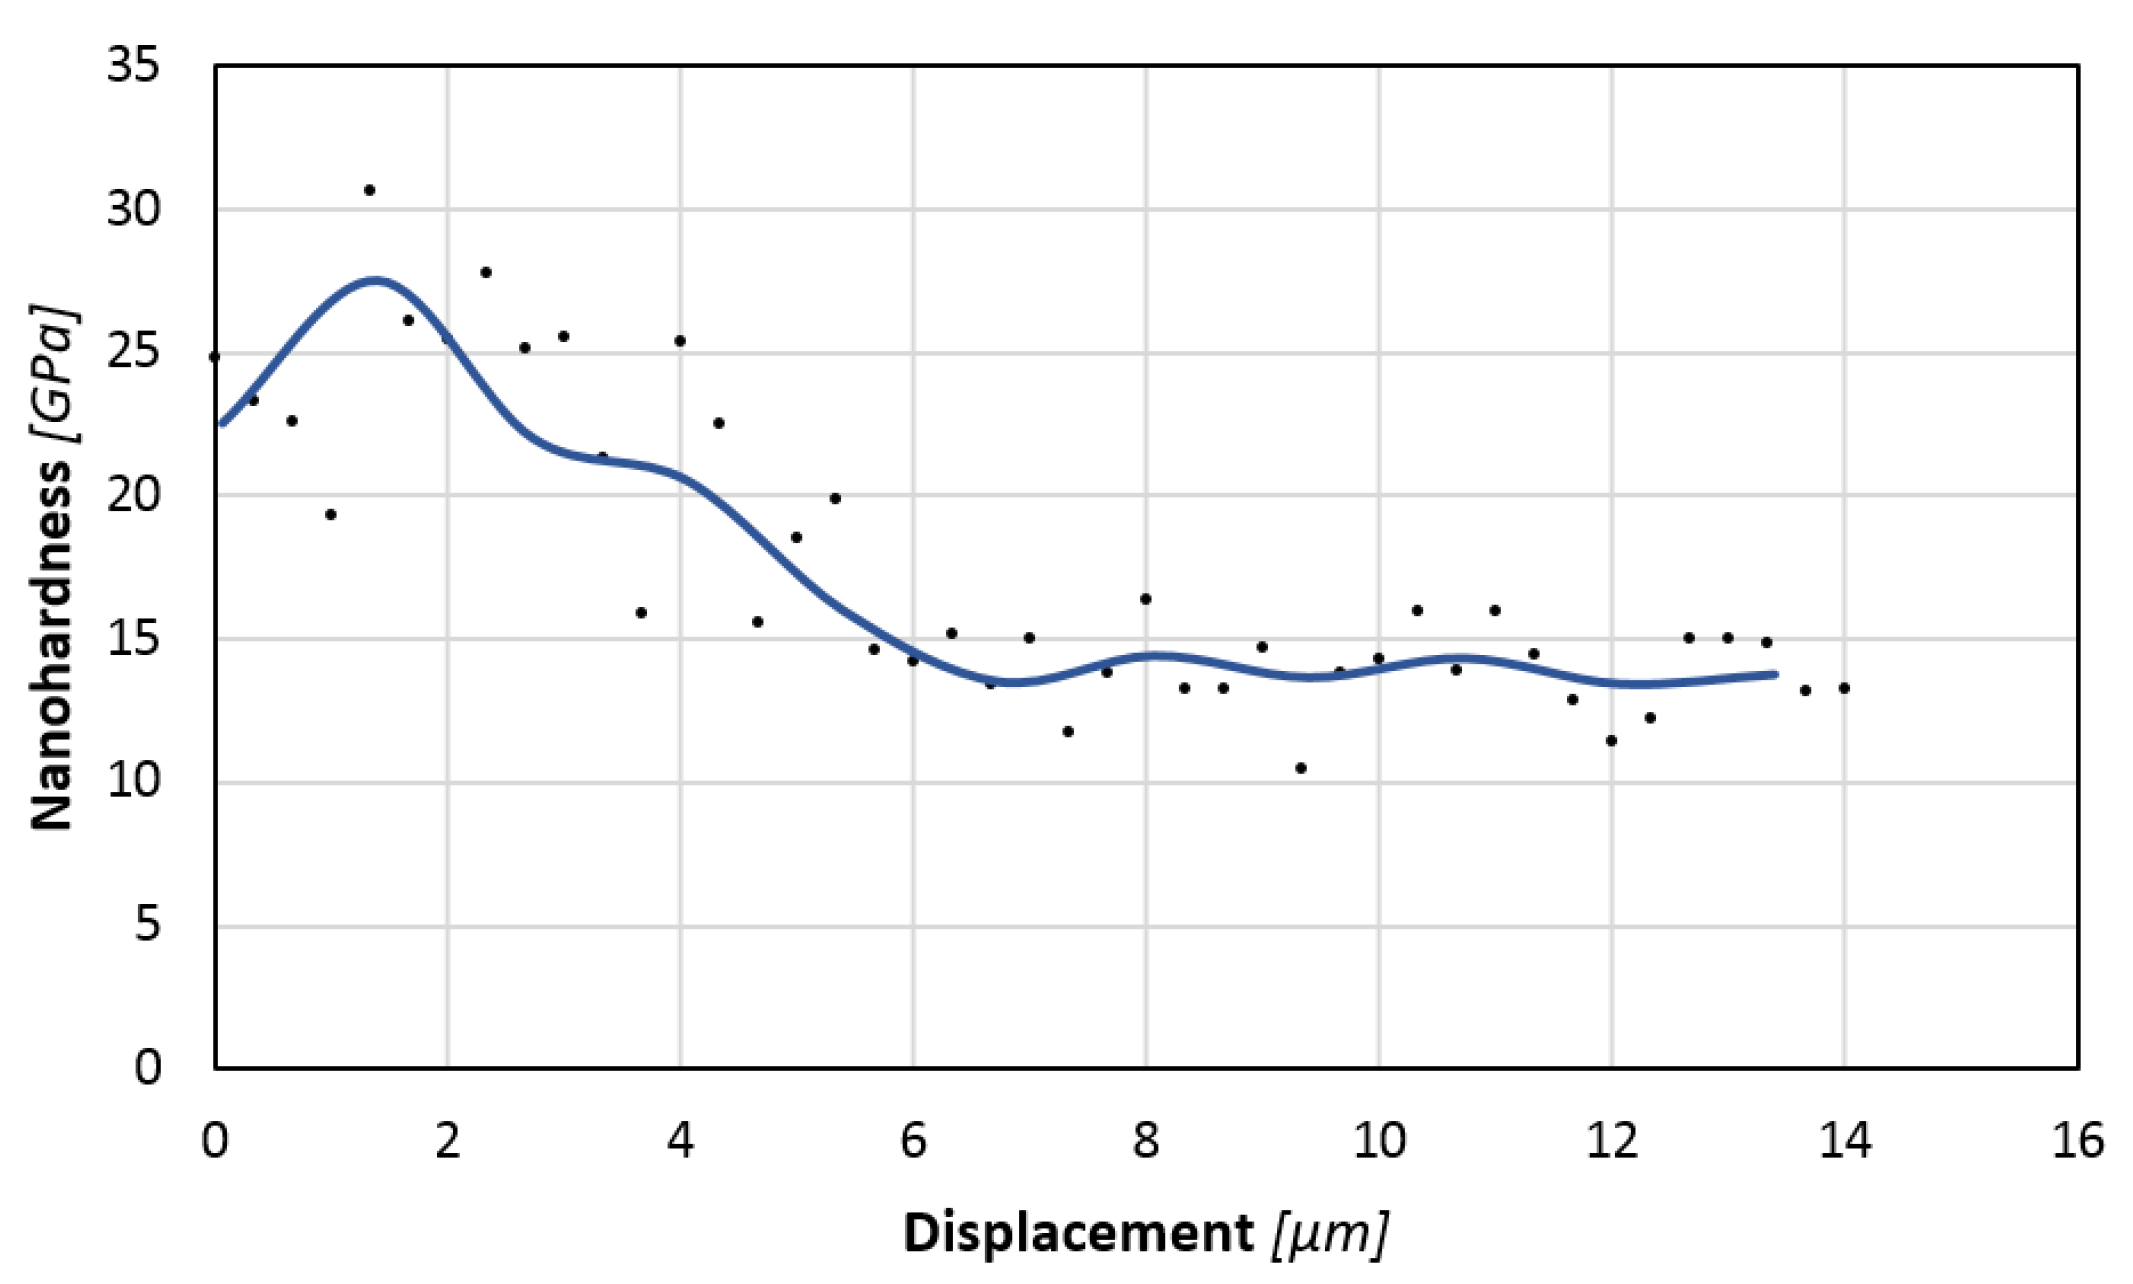
Nanohardness distribution analysis along the cross-section in the near-surface zone showed a strengthening of the material after ion nitriding to a depth of about 6 μm (Figure 6), which corresponds to the layer thickness determined based on microscopic observations (Figure 3). The hardness of the core is 13.5 ± 1.9 GPa. As it approaches the surface, it smoothly increases to a maximum value of about 27 GPa at a depth of about 1.4 μm, followed by a slight decrease associated with the morphology of the surface zone of the nitrided layer.

3.4. Corrosion Resistance

Figure 7 shows the impedance spectra obtained for specimens of Haynes 282 nickel alloy wrought, produced by DMLS, and produced by DMLS and coated with a CrN+Cr2N layer. The analysis of the spectra and data presented in Table 2 confirmed the positive effect of the nitrided layer on the corrosion resistance of Haynes 282 nickel alloy.
Increasing the value of charge transfer resistance through the double layer (resistance Rt) from 4.4 × 10⁵ Ωcm2 (Haynes 282-DMLS) to 7.4 × 10⁶ Ωcm2 for Haynes 282 alloy with CrN+Cr2N layer led to significant increases in the corrosion resistance. However, the presence of a dielectric layer with reduced resistance (8.6 × 10³ Ωcm2), despite the relatively high value of the parameter n = 0.89 (indicating its capacitive character), may imply local discontinuities facilitating degradation and initiation of pitting corrosion observed in potentiodynamic studies. It can be assumed that the structure of the specimens produced using the DMLS technique, in which few pores are observed, promotes the initiation of pitting corrosion in chloride solutions.
The data analysis in Table 2 and Table 4 indicates a significant development of the nitrided layer surface, thus increasing the active surface several times. This is indicated by the values of the parameter ’n’ of the double layer (n=0.66) and the parameter Sa (Sa=118nm) of the roughness profile. Both of these value indicate a significant share of diffusion factors determining the material’s corrosion resistance.
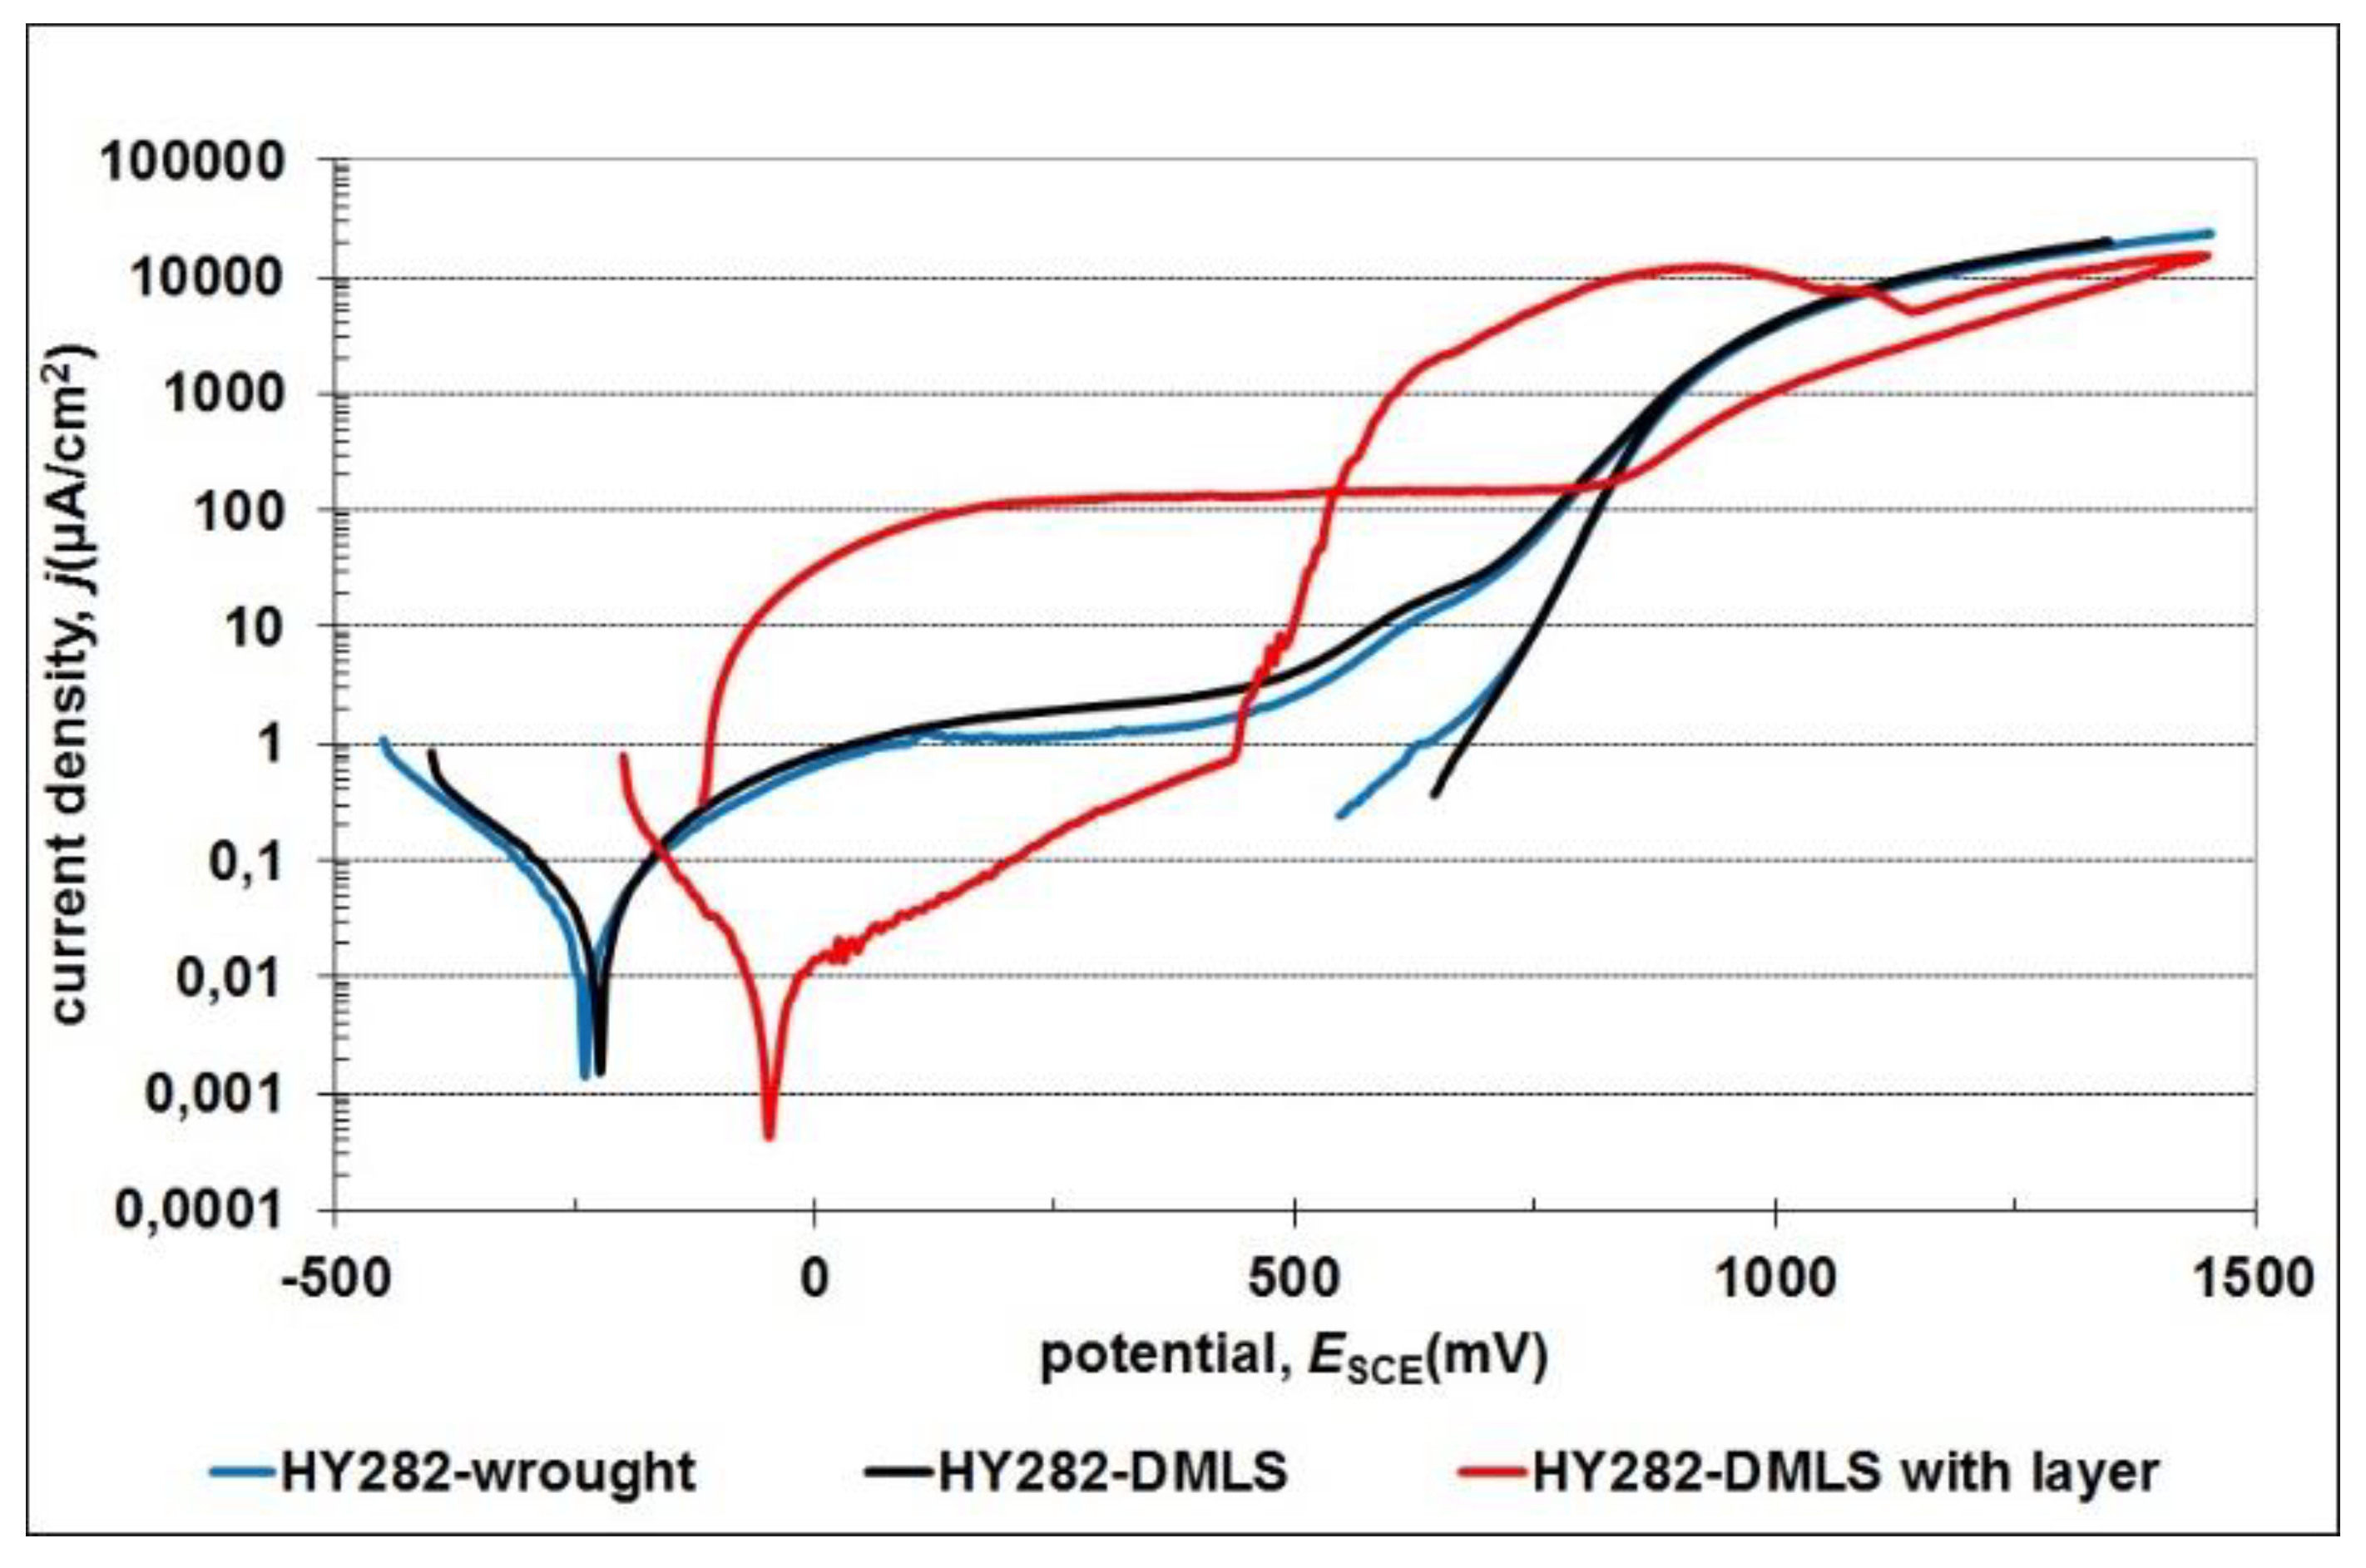
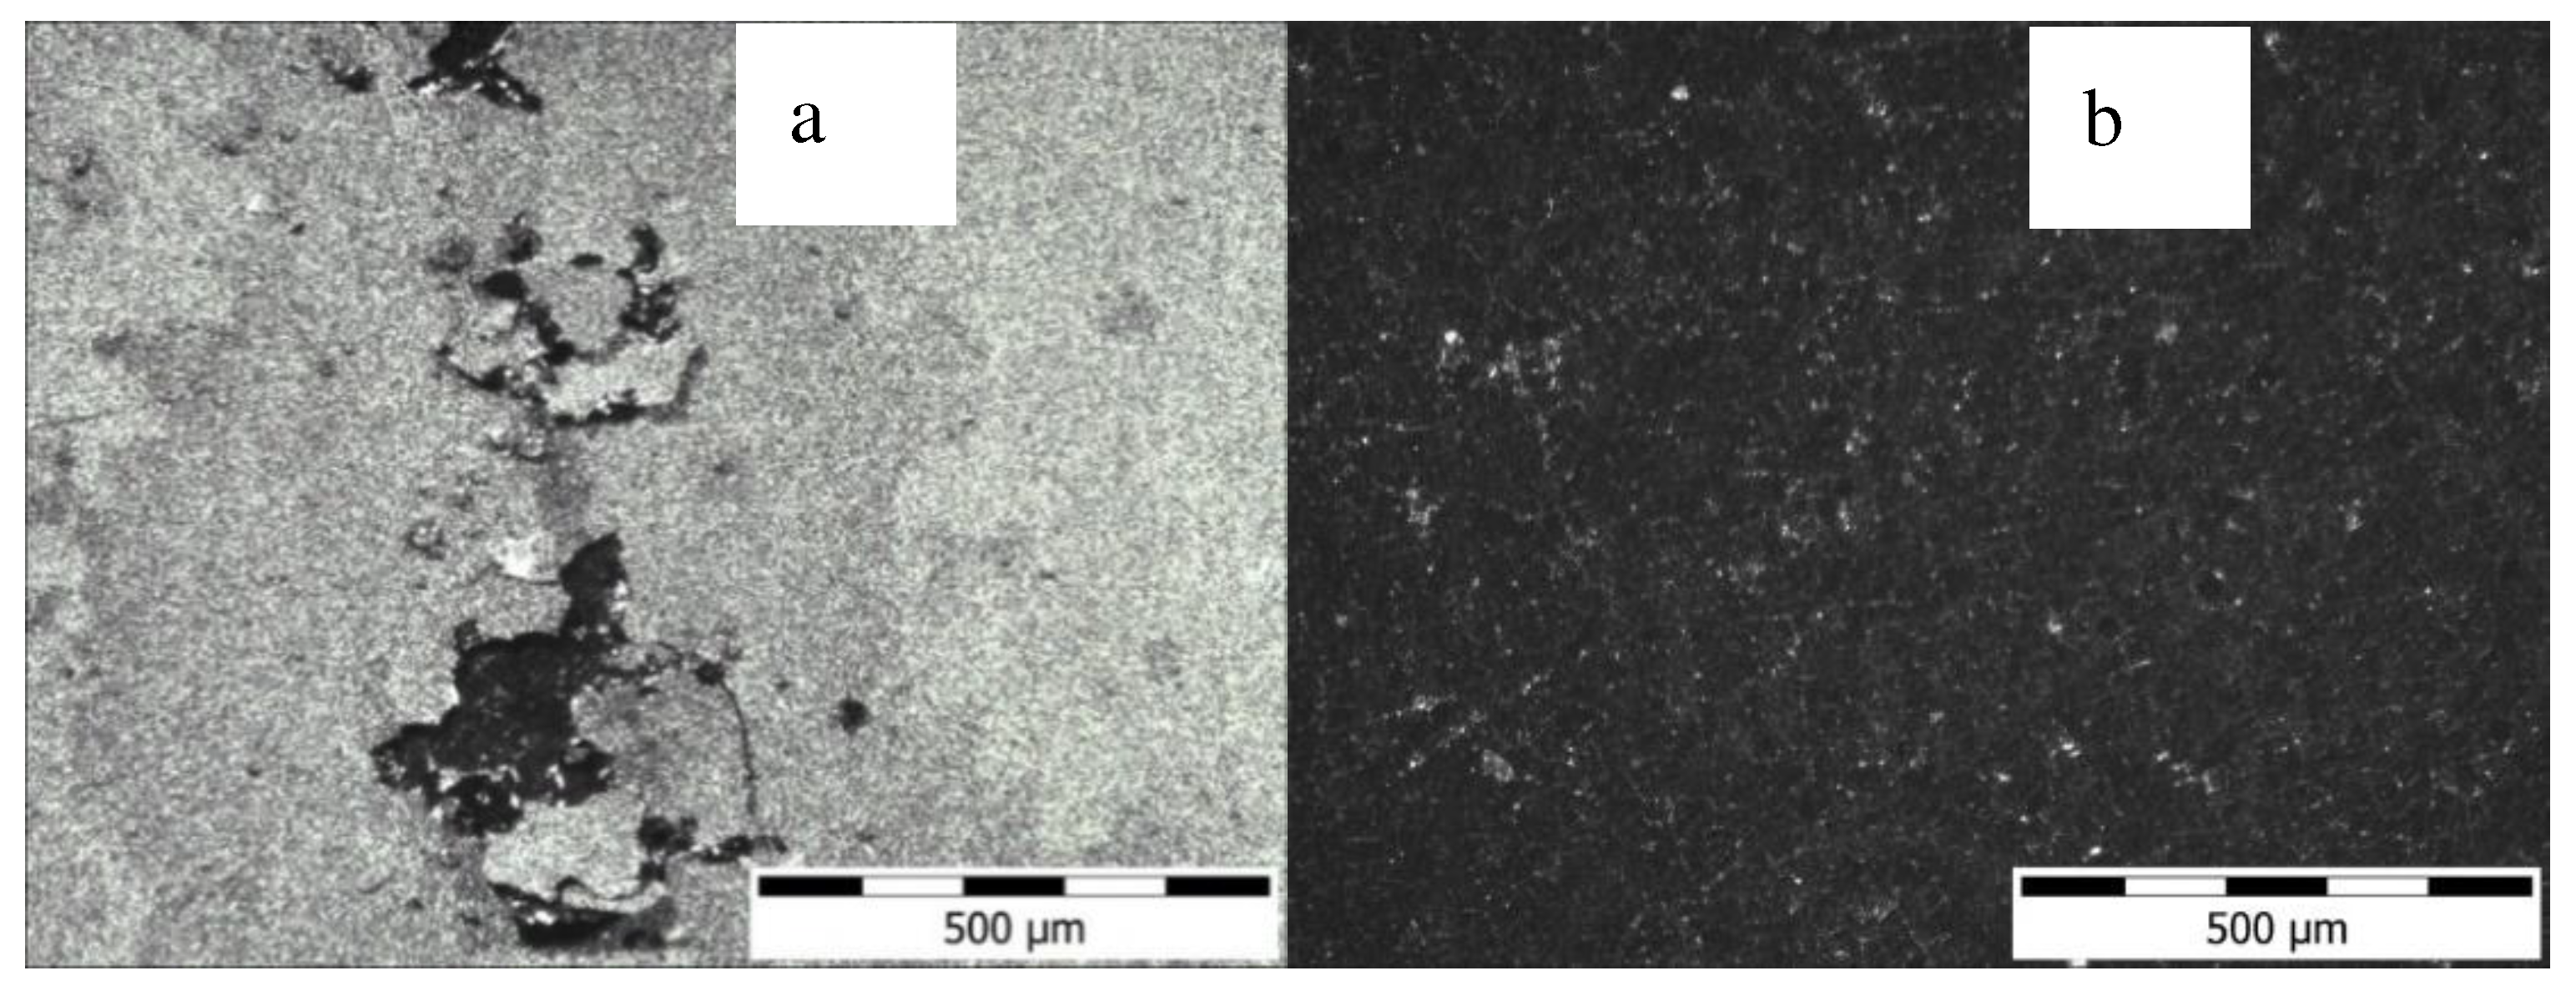
The potentiodynamic tests were correlated in Figure 8 and summarized in Table 3. It confirmed the positive effect of the ion nitriding process on the corrosion resistance of the Haynes 282 alloy specimens produced using the DMLS technique. This is reflected in the decrease of the density values of corrosion currents from 4.09 × 10⁻² μA/cm2 (Haynes-DMLS) to 8.89 × 10⁻³ μA/cm2 and an increase in the value of corrosion potentials. A leading shift in the value of corrosion potentials (∆E=200 mV) towards anodic indicates an increase in the nobility of the substrate and the presence of a cathodic surface layer. Its presence increases the corrosion resistance of Haynes 282 alloy but also sensitizes the specimens to pitting corrosion in chloride environments. In the case of a chromium nitride layer produced on a substrate produced using the DMLS technique, the observed constant increase in current density that accompanies the polarization intensity increase (up to approx. 400 mV) is typical for nitride layers produced on metallic substrates. This result is associated with the presence of nitrogen in the top layer. The presence of nitrogen and its susceptibility to oxidation facilitates the oxidation of the alloy during anodic polarization. Taguchi and Kurihara’s research has additionally shown that chromium loses its self-passivation capacity during nitriding [31]. An increase in the intensity of polarization results in the initiation of pitting corrosion (E, e.g. = 430 mV, Enp – puncture potential initiating pitting corrosion) and flaking of the nitrided layer (Figure 9A). A further increase in the intentionality of polarization (surf. 1200 mV) allows the start of another electrochemical process associated with releasing oxygen from the solution and the decomposition of water. The reverse polarization process showed the existence of a large hysteresis loop and the absence of regasification potential. This result indicates that the damaged nitrided layer does not undergo spontaneous repassivation and is completely degraded by its exfoliation. This result shows that the possible application of nitrided layers can be proposed for conditions that do not damage mechanical nitrided layers or for chloride-free environments.
In the case of starting materials (Haynes 282 alloy wrought and produced using DMLS), regardless of the structure, this alloy remains passive in a wide range of tested potentials. The data analysis in Table 2 indicates a slight decrease (by approximately 5%) in the corrosion resistance of the specimens produced by the DMLS technique compared to the wrought Haynes 282 alloy. In both the analyzed cases, the durability of passive layers and the current densities in the passive area have been compared. The observed increase in current density at approx. 500 mV is caused, by the hydration of nickel oxide (at approx. 500 mV) and change in the oxidation stage of chromium (at approx. 650 mV), i.e. the main alloying components of Haynes 282 nickel alloy. In the case of nickel, hydration of nickel oxide to hydroxide (from NiO to Ni(OH)2) occurs at a potential of about 500 mV [32] while a further increase in current density is caused by corrosion of passive chromium oxide Cr2O3 to the soluble form of CrO4-2. The formation of a thick layer of corrosion products and the achievement of a diffusion limit current by the system stabilizes the intensity of electrochemical processes. The return polarization shows the absence of a typical hysteresis loop, which shows that the observed increase in current density above 500 mV is associated with the trans-passive region, in which the intensity of processes is related to oxidation of the substrate and release of oxygen from the solution. The tight formed layer of oxide corrosion products is shown in Figure 9B. The created scale slows down the availability of electrolytes to the substrate and the resulting cathode reactions determine the intensity of corrosion processes. The results of the EIS test of Haynes 282 alloy with a formed corrosion layer confirm its capacitive character (n=0.93) with a high resistance (6.34 × 10⁶ Ωcm2) typical for oxide barrier layers.
Table 4. Surface roughness parameters of specimens [nm].
Sa SD Ra SD Rz SD
Haynes 282 wrought 12.78 ± 0.15 7.35 ± 0.62 76.14 ± 13.74
Haynes 282 DMLS 16.45 ± 0.24 6.39 ± 0.40 71.82 ± 10.63
Haynes 282 DMLS with CrN+Cr2N layer 118.93 ± 1.37 84.25 ± 5.26 1186.65 ± 263.02
Sa - average arithmetic deviation of the roughness surface from the median line; Ra - average arithmetic deviation of the roughness profile from the median line along the elementary length (2D tests); Rz – distance from the highest point of the roughness profile to its lowest point measured along the elementary length (2D tests); SD - standard deviation.

3.7. Static Tensile Test

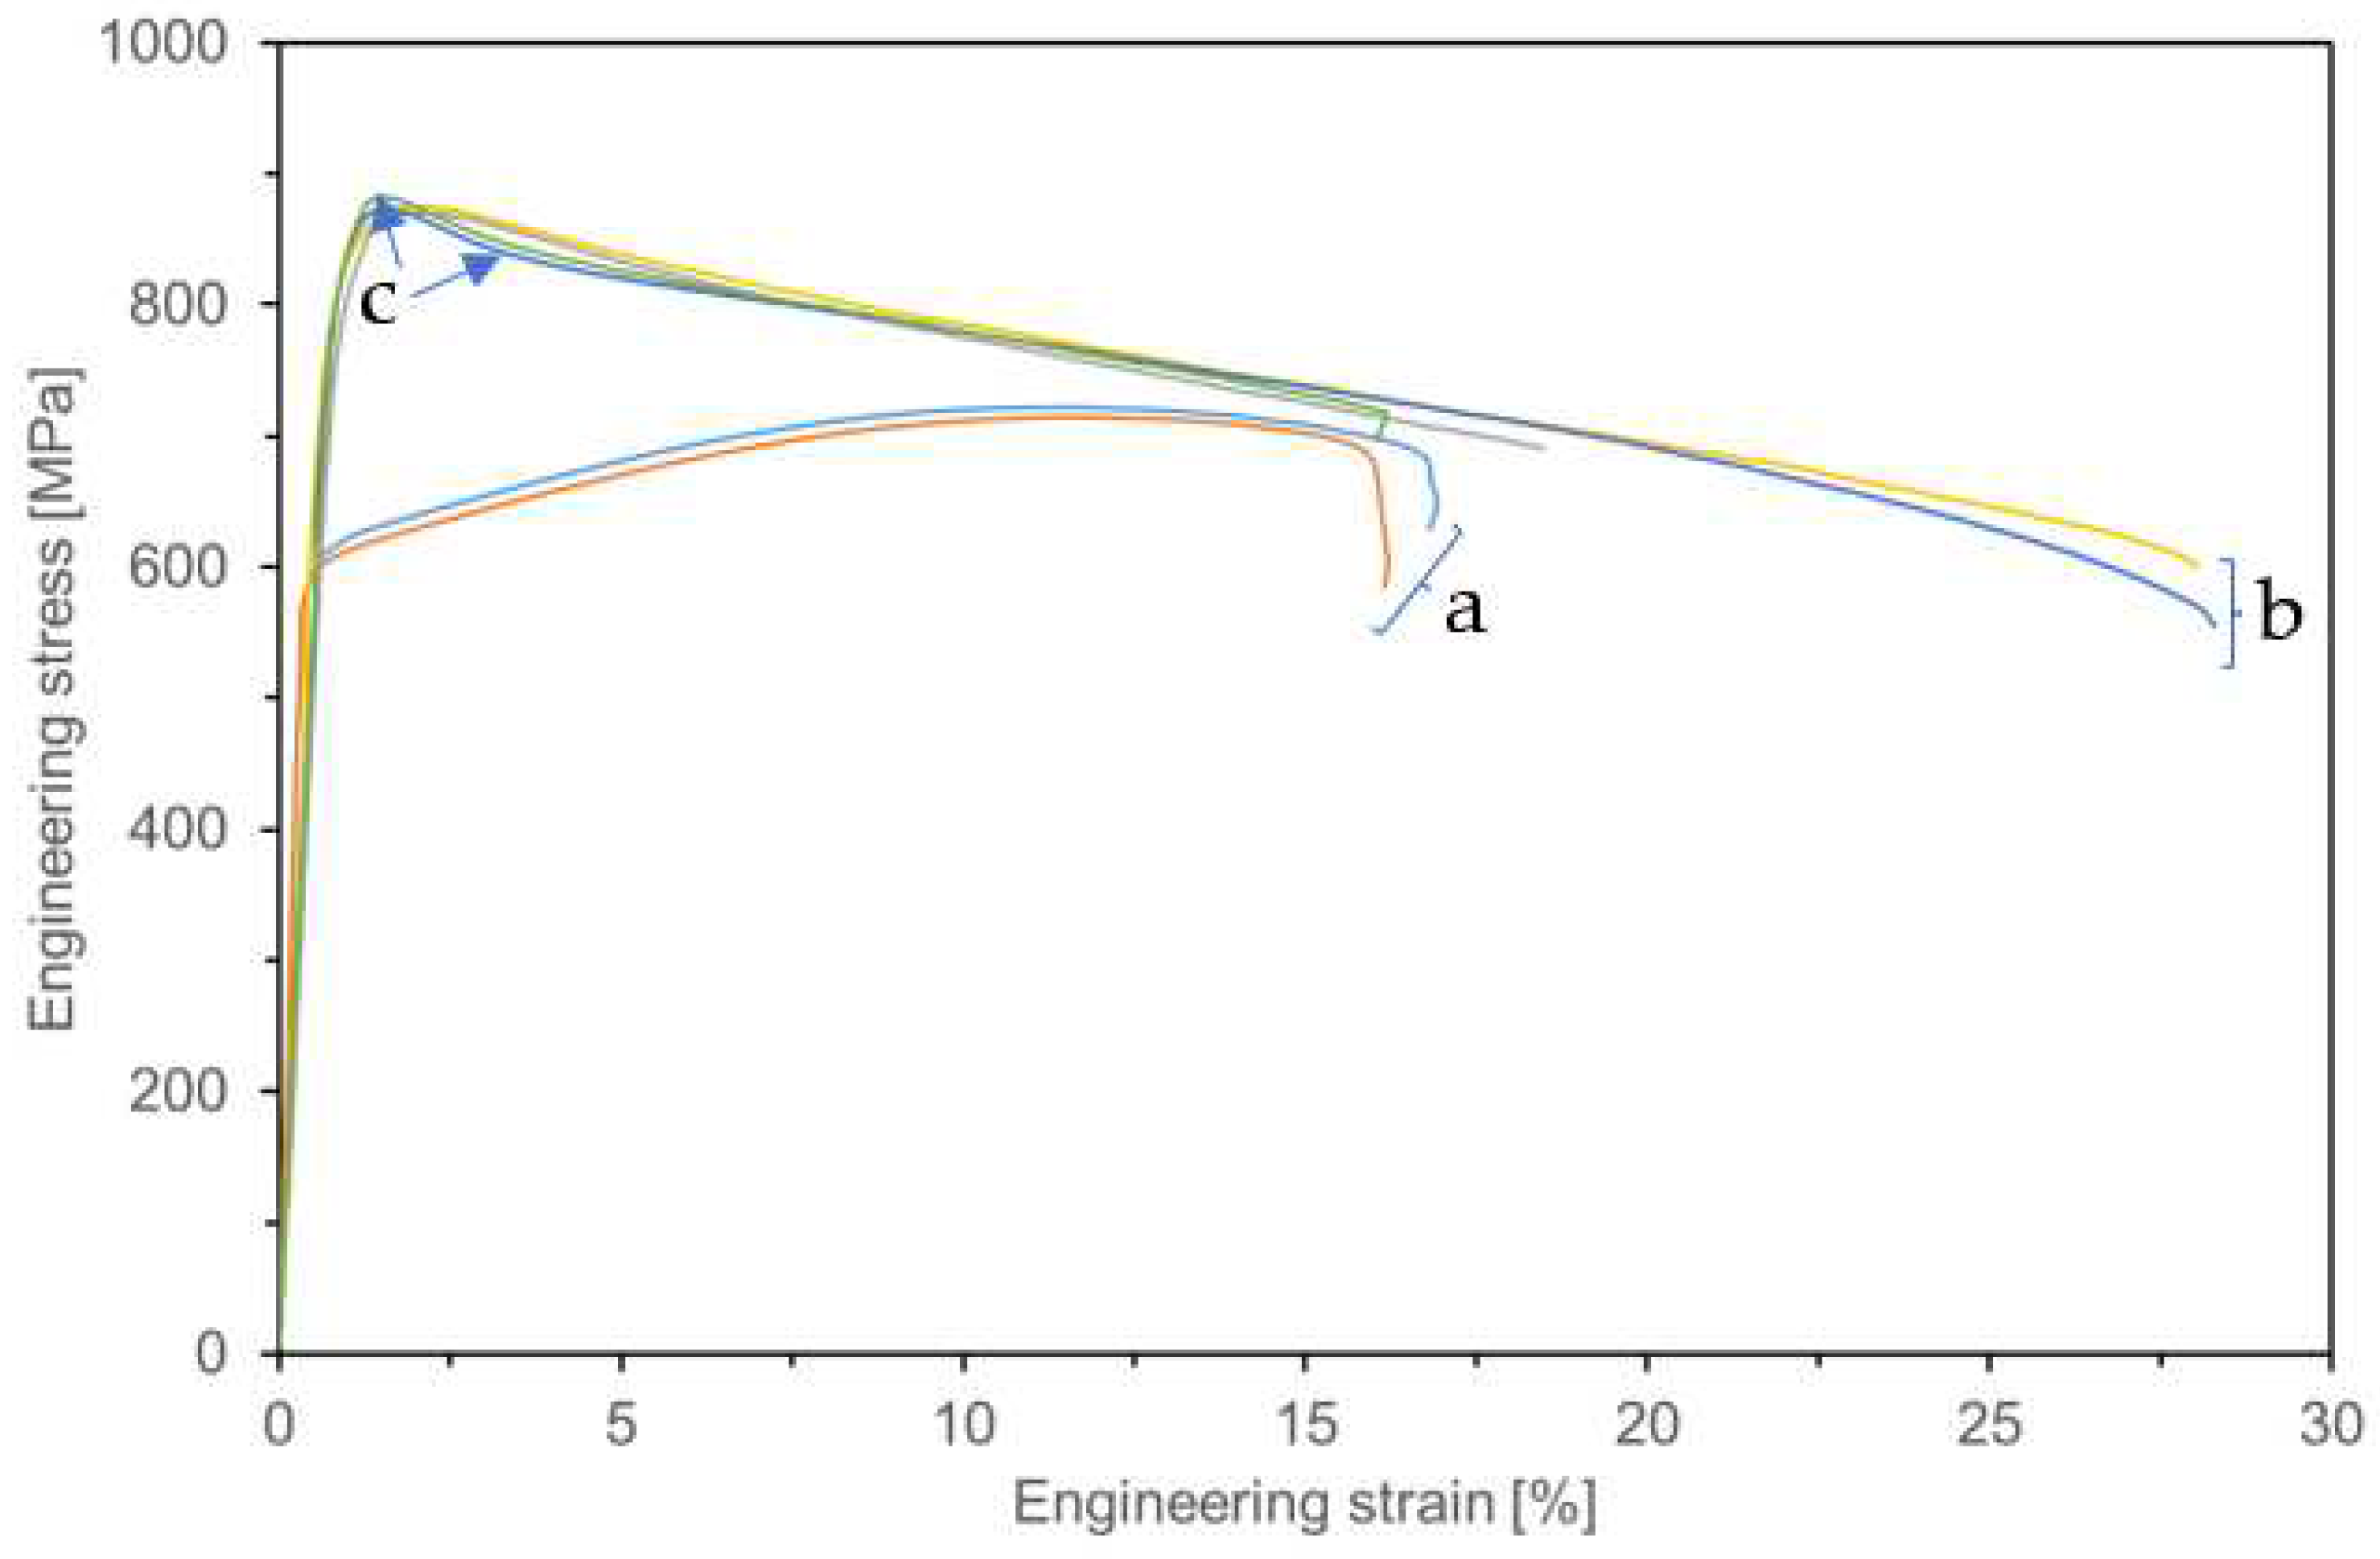
Based on the strength tests carried out in the form of a static tensile test (Figure 10), it can be concluded that specimens produced by the DMLS technique have comparable yield strength (YS0.2) as well as strength (UTS) with respect specimens covered with a chromium nitride layer. Simultaneously, the specimens produced by DMLS and specimens with a chromium nitride layer showed significantly higher values than those in the wrought state (Table 5). At a temperature 750 °C, the specimens produced using DMLS show a decrease in strength with small deformations after reaching (YS0.2).

4. Conclusions

Based on the research carried out, the following conclusions can be drawn:
1. Use of the DMLS technique on Haynes 282 nickel alloy powder makes it possible to produce specimens characterized by low porosity and a fine-crystalline anisotropic structure.
2. Ion nitriding conducted at 570 °C leads to the formation of a 7μm-thick continuous layer containing CrN+Cr2N phases on a substrate of Haynes 282 nickel alloy.
3. Tensile stress is found to occur in specimens produced by the DMLS technique and in specimens containing the CrN+Cr2N layer produced via ion nitriding.
4. The produced CrN+Cr2N layer demonstrates high corrosion resistance and comparable tensile strength to the substrate material (produced DMLS technique).

Author Contributions

Conceptualization, R.S. J.K., and J.K.; methodology, R.S. K.P.; formal analysis, A.K; investigation, R.S., J.K., K.G., K.P., J.M., and KK.; resources, K.K.; data curation, K.K.,K.P. and R.S.; writing—original draft preparation, R.S. and J.K.; writing—review and editing, J.K., A.K., J.M., and K.G.; visualization, A.K, K.K., J.M., and KG.; supervision, R.S. and J.K.; project administration, R.S.; funding acquisition, R.S.

Institutional Review Board Statement

Not applicable.

Informed Consent Statement

Not applicable.

Data Availability Statement

Data are available with the first author and can be shared with anyone upon reasonable request.

Acknowledgments

The research was funded by POB Technologie Materiałowe of Warsaw University of Technology in the framework of the Excellence Initiative: Research University (IDUB) programme.

Conflicts of Interest

The authors declare no conflict of interest.

References

  1. Di Gianfrancesco, A. Materials for Ultra-Supercritical and Advanced Ultra-Supercritical Power Plants; Elsevier BV: Amsterdam, NX, Netherlands, 2017; Available online: https://app.knovel.com/hotlink/pdf/id:kt0114KRUB/materials-ultra-supercritical/physical-metallurgyISBN 9780081005521.
  2. Kruger, K. L. , ; Di Gianfrancesco, A., Elsevier: Amsterdam, Netherlands, 2017, 511–545. https://doi.org/10.1016/b978-0-08-100552-1.00015-4.alloy. In Materials for Ultra-Supercritical and Advanced Ultra-Supercritical Power Plants, 1st ed.; Di Gianfrancesco, A., Elsevier: Amsterdam, Netherlands, 2017. [Google Scholar] [CrossRef]
  3. Tamarin, Y. . 2002. Protective Coatings for Turbine Blades - 2.1 Conditions of Turbine Blade Operation. ASM International. Available online: https://app.knovel.com/hotlink/pdf/id:kt010SPJL2/protective-coatings-turbine/conditions-turbine-blade.
  4. Ban, S.-D.; Shin, Y.-T.; Lee, S.R.; Lee, H.-W. Corrosion Resistance of Inconel 625 Overlay Welded Inside Pipes as a Function of Heat Treatment Temperature. Int. J. Electrochem. Sci. 2016, 11, 7764–7774. [Google Scholar] [CrossRef]
  5. Boswell, J.; Jones, J.; Barnard, N.; Clark, D.; Whittaker, M.; Lancaster, R. The effects of energy density and heat treatment on the microstructure and mechanical properties of laser additive manufactured Haynes 282. Mater. Des. 2021, 205. [Google Scholar] [CrossRef]
  6. Dudziak, T.; Boron, L.; Homa, M.; Nowak, R.; Horton, N.; Sheppard, R.; Purgert, R.M.; Siewiorek, A.; Sobczak, N.; Sobczak, J.J. The Influence of Fabrication Process on the Initial Stages of Steam Oxidation Performed on Haynes® 282® Alloy at 760 °C. J. Mater. Eng. Perform. 2016, 26, 239–249. [Google Scholar] [CrossRef]
  7. Ban, S.-D.; Shin, Y.-T.; Lee, S.R.; Lee, H.-W. Corrosion Resistance of Inconel 625 Overlay Welded Inside Pipes as a Function of Heat Treatment Temperature. Int. J. Electrochem. Sci. 2016, 11, 7764–7774. [Google Scholar] [CrossRef]
  8. Sitek, R.; Kwaśniak, P.; Sopicka-Lizer, M.; Borysiuk, J.; Kamiński, J.; Mizera, J.; Kurzydłowski, K. Experimental and ab-initio study of the Zr- and Cr-enriched aluminide layer produced on an IN 713C Inconel substrate by CVD; investigations of the layer morphology, structural stability, mechanical properties, and corrosion resistance. Intermetallics 2016, 74, 15–24. [Google Scholar] [CrossRef]
  9. Osoba, L.O.; Oladoye, A.M.; Ogbonna, V.E. Corrosion evaluation of superalloys Haynes 282 and Inconel 718 in Hydrochloric acid. J. Alloys Compd. 2019, 804, 376–384. [Google Scholar] [CrossRef]
  10. Klapper, H.S.; Zadorozne, N.S.; Rebak, R.B. Localized Corrosion Characteristics of Nickel Alloys: A Review. Acta Met. Sin. (English Lett. 2017, 30, 296–305. [Google Scholar] [CrossRef]
  11. Paulauskas, I.; Brady, M.; Meyer, H.; Buchanan, R.; Walker, L. Corrosion behavior of CrN, Cr2N and π phase surfaces on nitrided Ni–50Cr for proton exchange membrane fuel cell bipolar plates. Corros. Sci. 2006, 48, 3157–3171. [Google Scholar] [CrossRef]
  12. Bertrand, G.; Mahdjoub, H.; Meunier, C. A study of the corrosion behaviour and protective quality of sputtered chromium nitride coatings. Surf. Coatings Technol. 2000, 126, 199–209. [Google Scholar] [CrossRef]
  13. Materials Today Communications, 2021, 26, 102038114 Further work on detailed microstructure characterisation and strengthening mechanisms as well as tailored post-AM heat treat-ment is required to reveal the full potential of Haynes 282 by LPBF.
  14. Wang, L.; Mao, K.; Tortorelli, P.F.; Maziasz, P.J.; Thangirala, M.; Unocic, K.A.; Chen, X.F. Effect of heterogeneous microstructure on the tensile and creep performances of cast Haynes 282 alloy. Mater. Sci. Eng. A 2021, 828, 142099. [Google Scholar] [CrossRef]
  15. Rozman, K.A.; Kruzic, J.J.; Hawk, J.A. Fatigue Crack Growth Behavior of Nickel-base Superalloy Haynes 282 at 550-750 °C. J. Mater. Eng. Perform. 2015, 24, 2841–2846. [Google Scholar] [CrossRef]
  16. Pike, L. Development of a Fabricable Gamma Prime (γ ) Strengthened Superalloy. Superalloys. LOCATION OF CONFERENCE, COUNTRYDATE OF CONFERENCE;
  17. Sitek, R.; Puchlerska, S.; Nejman, I.; Majchrowicz, K.; Pakieła, Z.; Żaba, K.; Mizera, J. The Impact of Plastic Deformation on the Microstructure and Tensile Strength of Haynes 282 Nickel Superalloy Produced by DMLS and Casting. Materials 2022, 15, 7545. [Google Scholar] [CrossRef] [PubMed]
  18. Boswell, J.; Jones, J.; Barnard, N.; Clark, D.; Whittaker, M.; Lancaster, R. The effects of energy density and heat treatment on the microstructure and mechanical properties of laser additive manufactured Haynes 282. Mater. Des. 2021, 205. [Google Scholar] [CrossRef]
  19. Fernandez-Zelaia, P.; Kirka, M.M.; Dryepondt, S.N.; Gussev, M.N. Crystallographic texture control in electron beam additive manufacturing via conductive manipulation. Mater. Des. 2020, 195. [Google Scholar] [CrossRef]
  20. Teng, Y.; Guo, Y.-Y.; Zhang, M.; Yang, Y.-J.; Huang, Z.; Zhou, Y.-W.; Wu, F.-Y.; Liang, Y.-S. Effect of Cr/CrNx transition layer on mechanical properties of CrN coatings deposited on plasma nitrided austenitic stainless steel. Surf. Coatings Technol. 2019, 367, 100–107. [Google Scholar] [CrossRef]
  21. Zhang, M.; Li, M.-K.; Kim, K.H.; Pan, F. Structural and mechanical properties of compositionally gradient CrNx coatings prepared by arc ion plating. Appl. Surf. Sci. 2009, 255, 9200–9205. [Google Scholar] [CrossRef]
  22. Yetim, A.; Codur, M.; Yazici, M. Using of artificial neural network for the prediction of tribological properties of plasma nitrided 316L stainless steel. Mater. Lett. 2015, 158, 170–173. [Google Scholar] [CrossRef]
  23. Bonarski J., T. , „Pomiar i wykorzystanie teksturowo – napreżeniowej charakterystyki mikrostruktury w diagnosyce materiałów”. Kraków: Instytut Metalurgii i Inżynierii Materiałowej PAN; 2013 (in Polish).
  24. Skrzypek S., J. , „Nowe możliwości pomiaru makronaprężeń własnych materiałów przy zastosowaniu dyfrakcji promieniowania X w geometrii stałego kąta padania”, Kraków: Wydawnictwo AGH; 2002 (in Polish).
  25. Xu, X.-L.; Yu, Z.-W.; Cui, L.-Y. Microstructure and properties of plasma nitrided layers on Ni-based superalloy Ni-20Cr. Mater. Charact. 2019, 155, 109798. [Google Scholar] [CrossRef]
  26. Shen, H.; Wang, L.; Sun, J. Characteristics and properties of Cr N compound layer produced by plasma nitriding of Cr-electroplated of AISI 304 stainless steel. Surf. Coatings Technol. 2020, 385, 125450. [Google Scholar] [CrossRef]
  27. Akhter, R. , Zhou Z., Xie Z., Munroe P. Harmonizing mechanical responses of nanostructured CrN coatings via Ni additions, Appl. Surf. Sci. 2021, 538, 147987. [Google Scholar] [CrossRef]
  28. Gawroński, Z. , Residual stresses in the surface layer of SW7M steel after conventional and low pressure ’Nitrovac’79’ nitriding processes, Mech. Mech. Eng., 1999, 3, 27–34. [Google Scholar]
  29. Mendibide, C.; Steyer, P.; Esnouf, C.; Goudeau, P.; Thiaudière, D.; Gailhanou, M.; Fontaine, J. X-ray diffraction analysis of the residual stress state in PVD TiN/CrN multilayer coatings deposited on tool steel. Surf. Coatings Technol. 2005, 200, 165–169. [Google Scholar] [CrossRef]
  30. Bouaouina, B.; Besnard, A.; Abaidia, S.; Haid, F. Residual stress, mechanical and microstructure properties of multilayer Mo 2 N/CrN coating produced by R.F Magnetron discharge. Appl. Surf. Sci. 2017, 395, 117–121. [Google Scholar] [CrossRef]
  31. Taguchi, M.; Kurihara, J. Efect of surface nitriding on corrosion resistance of chromium in sulfuric acid solution, Materials Transactions. JIM 1991, 32, 1170–1176. [Google Scholar]
  32. Huang, L.-F.; Hutchison, M.J.; Santucci, R.J.; Scully, J.R.; Rondinelli, J.M. Improved Electrochemical Phase Diagrams from Theory and Experiment: The Ni–Water System and Its Complex Compounds. J. Phys. Chem. C 2017, 121, 9782–9789. [Google Scholar] [CrossRef]
  33. Bertsch, K.; de Bellefon, G.M.; Kuehl, B.; Thoma, D. Origin of dislocation structures in an additively manufactured austenitic stainless steel 316L. Acta Mater. 2020, 199, 19–33. [Google Scholar] [CrossRef]
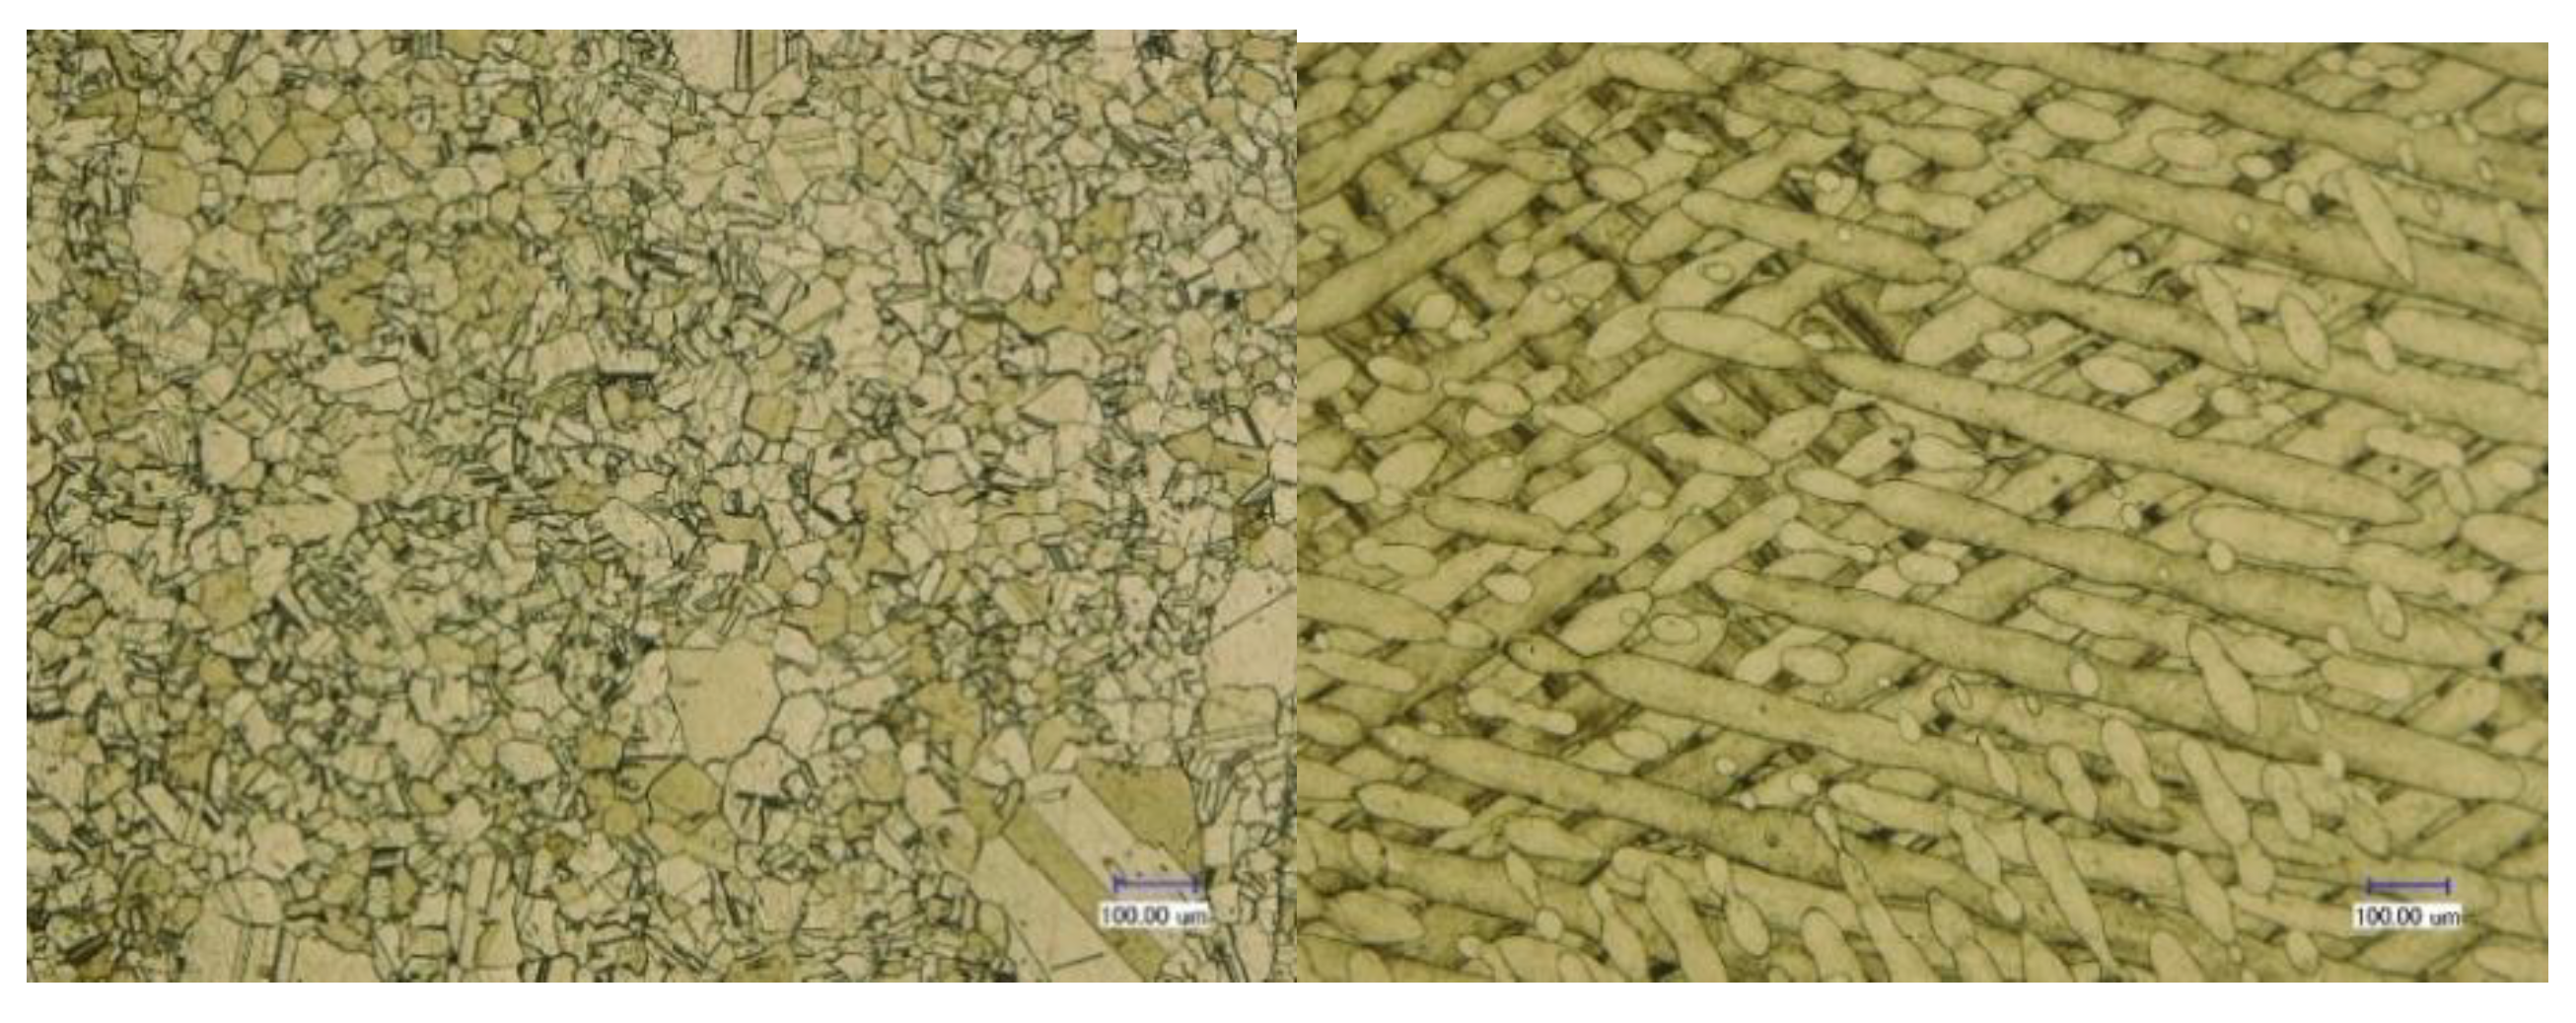
Figure 1. Microstructure of Haynes 282 nickel alloy specimen: wrought –(a), in-built (XY) plane using DMLS technique.
Preprints 72874 g001
Figure 2. TEM images of Haynes 282 substrate produced by the DMLS technique.
Preprints 72874 g002
Figure 3. Cross-section-a), and morphology (SEM)-b) of nitride layer on Haynes 282 nickel alloy produced by ion nitriding.
Preprints 72874 g003
Figure 4. Diffractogram pattern for specimens: Haynes 282 alloy wrought –(a), produced DMLS –(b), and DMLS with nitride layer –(c).
Preprints 72874 g004
Figure 5. TEM images of the nitriding Haynes 282 produced by the additive technique. a)-b) The nanocrystalline layer is present at the surface. c) The Moiré pattern is visible in the matrix below the layer. d) Electron diffraction pattern obtained in b) region.
Preprints 72874 g005
Figure 6. Nanohardness distribution in the cross-section of the layer.
Preprints 72874 g006
Figure 7. Impedance spectra obtained for Haynes 282 alloy specimens wrought, produced by DMLS, and by DMLS containing a nitride layer.
Preprints 72874 g007
Figure 8. Potentiodynamic curves obtained for the specimens: Haynes 282 alloy wrought, produced by DMLS, and by DMLS with a nitride layer.
Preprints 72874 g008
Figure 9. Surface topography of Haynes 282 alloy obtained by DMLS and coated with a chromium nitride layer (after potentiodynamic tests) - a), and oxide barrier layer -b).
Preprints 72874 g009
Figure 10. Examples of stress-strain curves for specimens: Haynes 282 nickel alloy (wrought) (a), HY282 DMLS (b) and HY282 DMLS with a CrN+Cr2N layer (c).
Preprints 72874 g010
Table 2. Characteristic electrochemical values of tested specimens (impedance tests).
Substitute arrangement Dielectric layer double layer
Haynes 282-wrought R(RQ) R(Ωcm2) 8.07 × 10⁵
Y0 CPE(Fcm-2*sn-1) 1.99 × 10⁻⁵
n 0.91
Haynes 282-DMLS R(RQ)(RQ) R(Ωcm2) 6.26 × 10⁴ 4.36 × 10⁵
Y0 CPE(Fcm-2*sn-1) 4.99 × 10⁻⁵ 3.87 × 10⁻⁵
n 0.86 0.88
Haynes 282 DMLS with layer R(Q[R(RQ)]) R(Ωcm2) 8.61 × 10³ 7.43 × 10⁶
Y0 CPE(Fcm-2*sn-1) 2.67 × 10⁻⁵ 1.03 × 10⁻⁵
n 0.89 0.66
R – resistance, Y0 CPE – capacity of constant phase element, n – coefficient of imperfections of constant phase element (CPE); an empirical constant ranging from 0 to 1. It is worth noting that when n = 1, the CPE behaves as a pure capacitor, while when n = 0, the CPE behaves as a pure resistor.
Table 3. Characteristic electrochemical values of the tested specimens.
Haynes 282 wrought Haynes 282 DMLS Haynes 282
DMLS with layer
Rp (kΩcm2) 809 637 2763
Icorr (µA/cm2) 3.88 × 10⁻² 4.09 × 10⁻² 0.89 × 10⁻²
Ecorr (mV) -240 -225 -45
Rp – polarization resistance; Icorr. – corrosion current density; Ecorr. – corrosion potential.
Table 5. Average mechanical properties of tested specimens.
Specimens YS0.2 [MPa] UTS [MPa] A [%]
Haynes 282 alloy (wrought) 600±4 719±4 15±1.5
Haynes 282 DMLS 808±3 873±4 22±6.4
Haynes 282 DMLS with a CrN+Cr2N layer 834±5 878±6 21±8.5
Disclaimer/Publisher’s Note: The statements, opinions and data contained in all publications are solely those of the individual author(s) and contributor(s) and not of MDPI and/or the editor(s). MDPI and/or the editor(s) disclaim responsibility for any injury to people or property resulting from any ideas, methods, instructions or products referred to in the content.
Copyright: This open access article is published under a Creative Commons CC BY 4.0 license, which permit the free download, distribution, and reuse, provided that the author and preprint are cited in any reuse.
Alerts
Prerpints.org logo

Preprints.org is a free preprint server supported by MDPI in Basel, Switzerland.

Subscribe

© 2025 MDPI (Basel, Switzerland) unless otherwise stated