Preprint
Article

Improving Sensitivity of Ferrous Particle Sensors with Permanent Magnet

Altmetrics

Downloads

103

Views

26

Comments

0

A peer-reviewed article of this preprint also exists.

This version is not peer-reviewed

Submitted:

05 May 2023

Posted:

08 May 2023

You are already at the latest version

Alerts
Abstract
This study aimed to improve sensitivity of ferrous particle sensors used in various mechanical systems such as wind power gearboxes to detect abnormalities by measuring the amount of ferrous wear particles generated by metal-to-metal contact. Existing sensors collect ferrous particles using a permanent magnet. However, its ability to detect abnormalities is limited because it only measures amounts of ferrous particles collected on the top of the sensor. To overcome this limitation, this study evaluated sensibility of an existing sensor using a multi-physics analysis method and improved it by changing the core shape inside the sensor. The detection ability of the improved sensor was analytically shown to be better than the existing sensor. This study highlights the use of analytical methods and multi-physics analysis for developing a ferrous particle sensor and presents a method to compare sensibility analytically. Results of the improved sensor are expected to enhance the ability to detect abnormalities in the lubrication system where ferrous wear particles are generated. This study will contribute to the development of more effective ferrous particle sensors, which can potentially improve the performance and reliability of mechanical systems.
Keywords: 
Subject: Engineering  -   Mechanical Engineering

1. Introduction

Machine condition monitoring is a field that aims to improve the reliability of machines by detecting faults or failures through the use of sensors and measuring devices. By collecting and analyzing data and information, machine condition monitoring can prevent machine failures and enhance the maintenance level of a mechanical system [1,2,3]. Machine condition monitoring with oil analysis has been applied in various industrial fields such as automobile, construction equipment and power plants. Among various methods for analyzing lubricants, on-line methods using lubricant oil sensors are preferred. The reason for this is because this method has advantages such as reduction in human error, prevention of major failure in initial state, and low maintenance cost without needing professional skills [3,4].
For over 50 years, the broadest definition of wear has been the loss of a material from a surface, the transfer of a material from one surface to another, or the movement of a material within a single surface [5]. A narrower definition of wear has been suggested as progressive loss of a substance from the operating surface of a body occurring as a result of relative motion at the surface [6]. It is more beneficial for tribologists to utilize a wider definition, given the range of engineering applications involved. A simple and effective definition of wear is damage to a solid surface caused by progressive material loss, usually due to relative motion between that surface and a substance or substances in contact with it [7,8]. The occurrence of wear is intricately connected to the condition, maintenance, and durability of machines. Therefore, it is crucial to determine types or amount of wear [9].
It is also essential to identify particles that arise from wear within lubrication systems. These particles usually contain ferrous, non-ferrous, and non-metal debris such as ceramic and polymers. To measure wear particles, wear particle sensors commonly utilize inductance and capacitance-based methods [10,11,12,13,14,15,16,17,18,19,20,21,22,23], acoustic methods based on ultrasonic transducers [24,25,26], optical methods [27,28,29,30], magnetic methods [31,32], and a method based on a combination of a permanent magnet and inductance [33]. Among them, ferrous particle sensors are widely used to diagnose machine condition because machines are made of iron as their main component. Figure 1 shows a schematic of ferrous particle sensor with permanent magnet. The sensor consists of two units, each containing a sensing coil with inductance and a permanent magnet to attract ferrous debris at the tip. This sensor is capable of distinguishing between fine and coarse debris. It can prevent abrasive wear and damage because of accumulation of ferrous particles of the permanent magnet [34]. Due to these advantages, its utilization is increasing among ferrous particle sensors.
While there have been many studies on the sensitivity of wear particle sensors during development, there are few studies on the sensibility of ferrous particle sensors [35,36,37,38,39]. Because of the cylindrical permanent magnet shape in the sensor, ferrous particles are collected not only at the tip of the sensor, but also at the side of the sensor. However, it is difficult to reflect the exact change in the amount of ferrous particles attached to the sensor. Therefore, a method for increasing the effect of collecting ferrous particles at the end of the sensor is needed. Moreover, it is more effective and essential to verify the performance of the sensor whose sensitivity has been improved through experiments. However, since a lot of cost and time are needed in the development process, it would be effective if performance improvement can be confirmed by a numerical analysis method. Therefore, this study proposed a new design to improve sensitivity of an existing sensor. A numerical analysis model was also suggested to verify performance and the improvement effect was shown.

2. Numerical Model and Analysis

Numerical analysis consisted largely of an analysis of the change in magnetic flux density due to the shape of the sensor’s core and an analysis evaluating the effect of collecting ferrous particles in the flow. Through improvement of the performance of the sensor, it is intended to numerically show whether the sensitivity is improved by improving the collection effect of the sensor in the flow. Because this sensor measures the amount of ferrous particles after attaching ferrous particles to the sensor with a permanent magnet, the collection effect of the sensor is important.

2.1. Analysis of Magnetic Flux Density for Changes in Sensor’s Internal Design Paramters

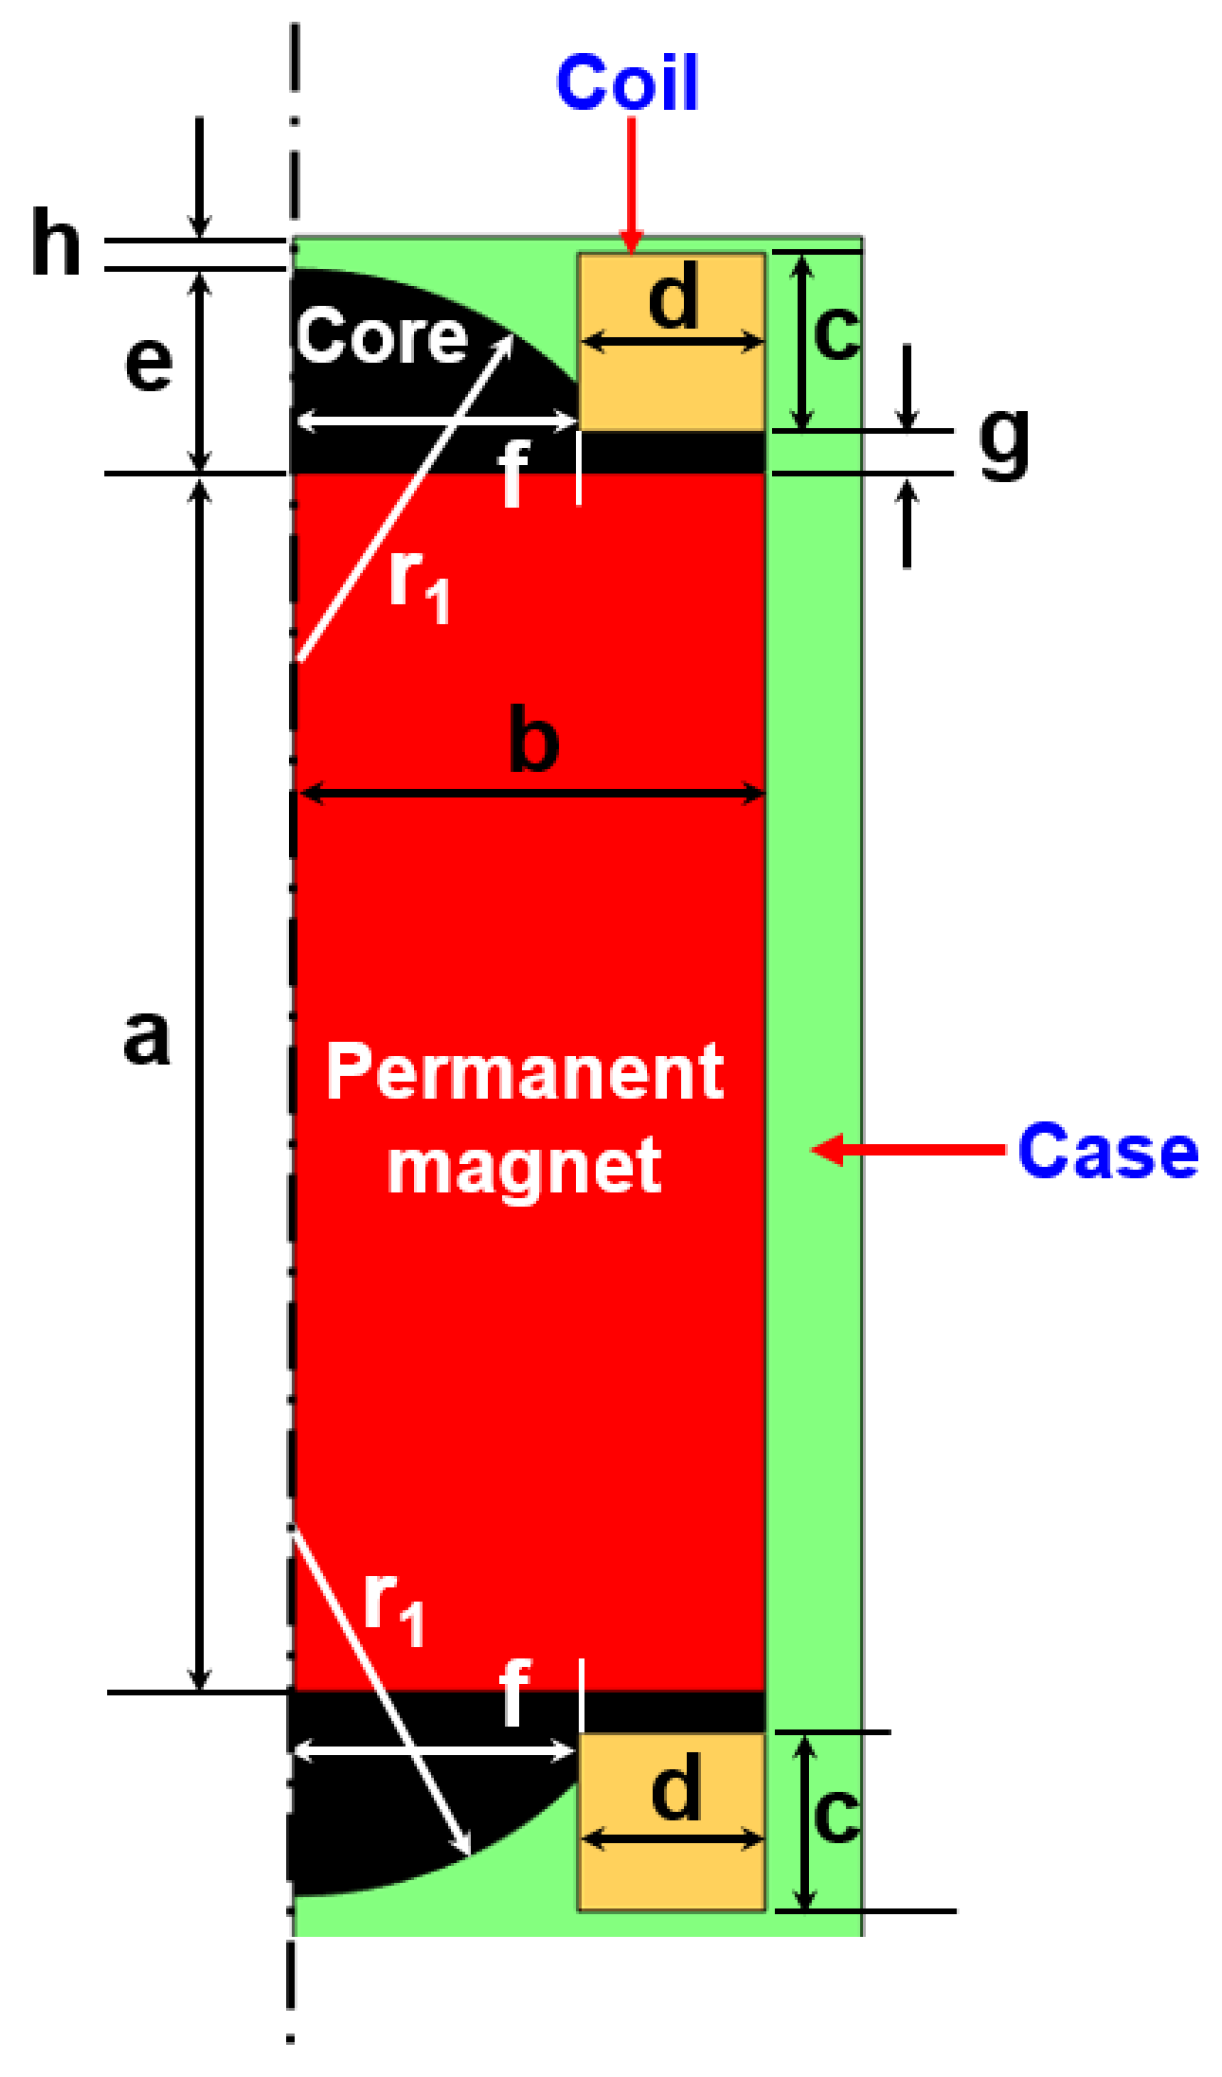
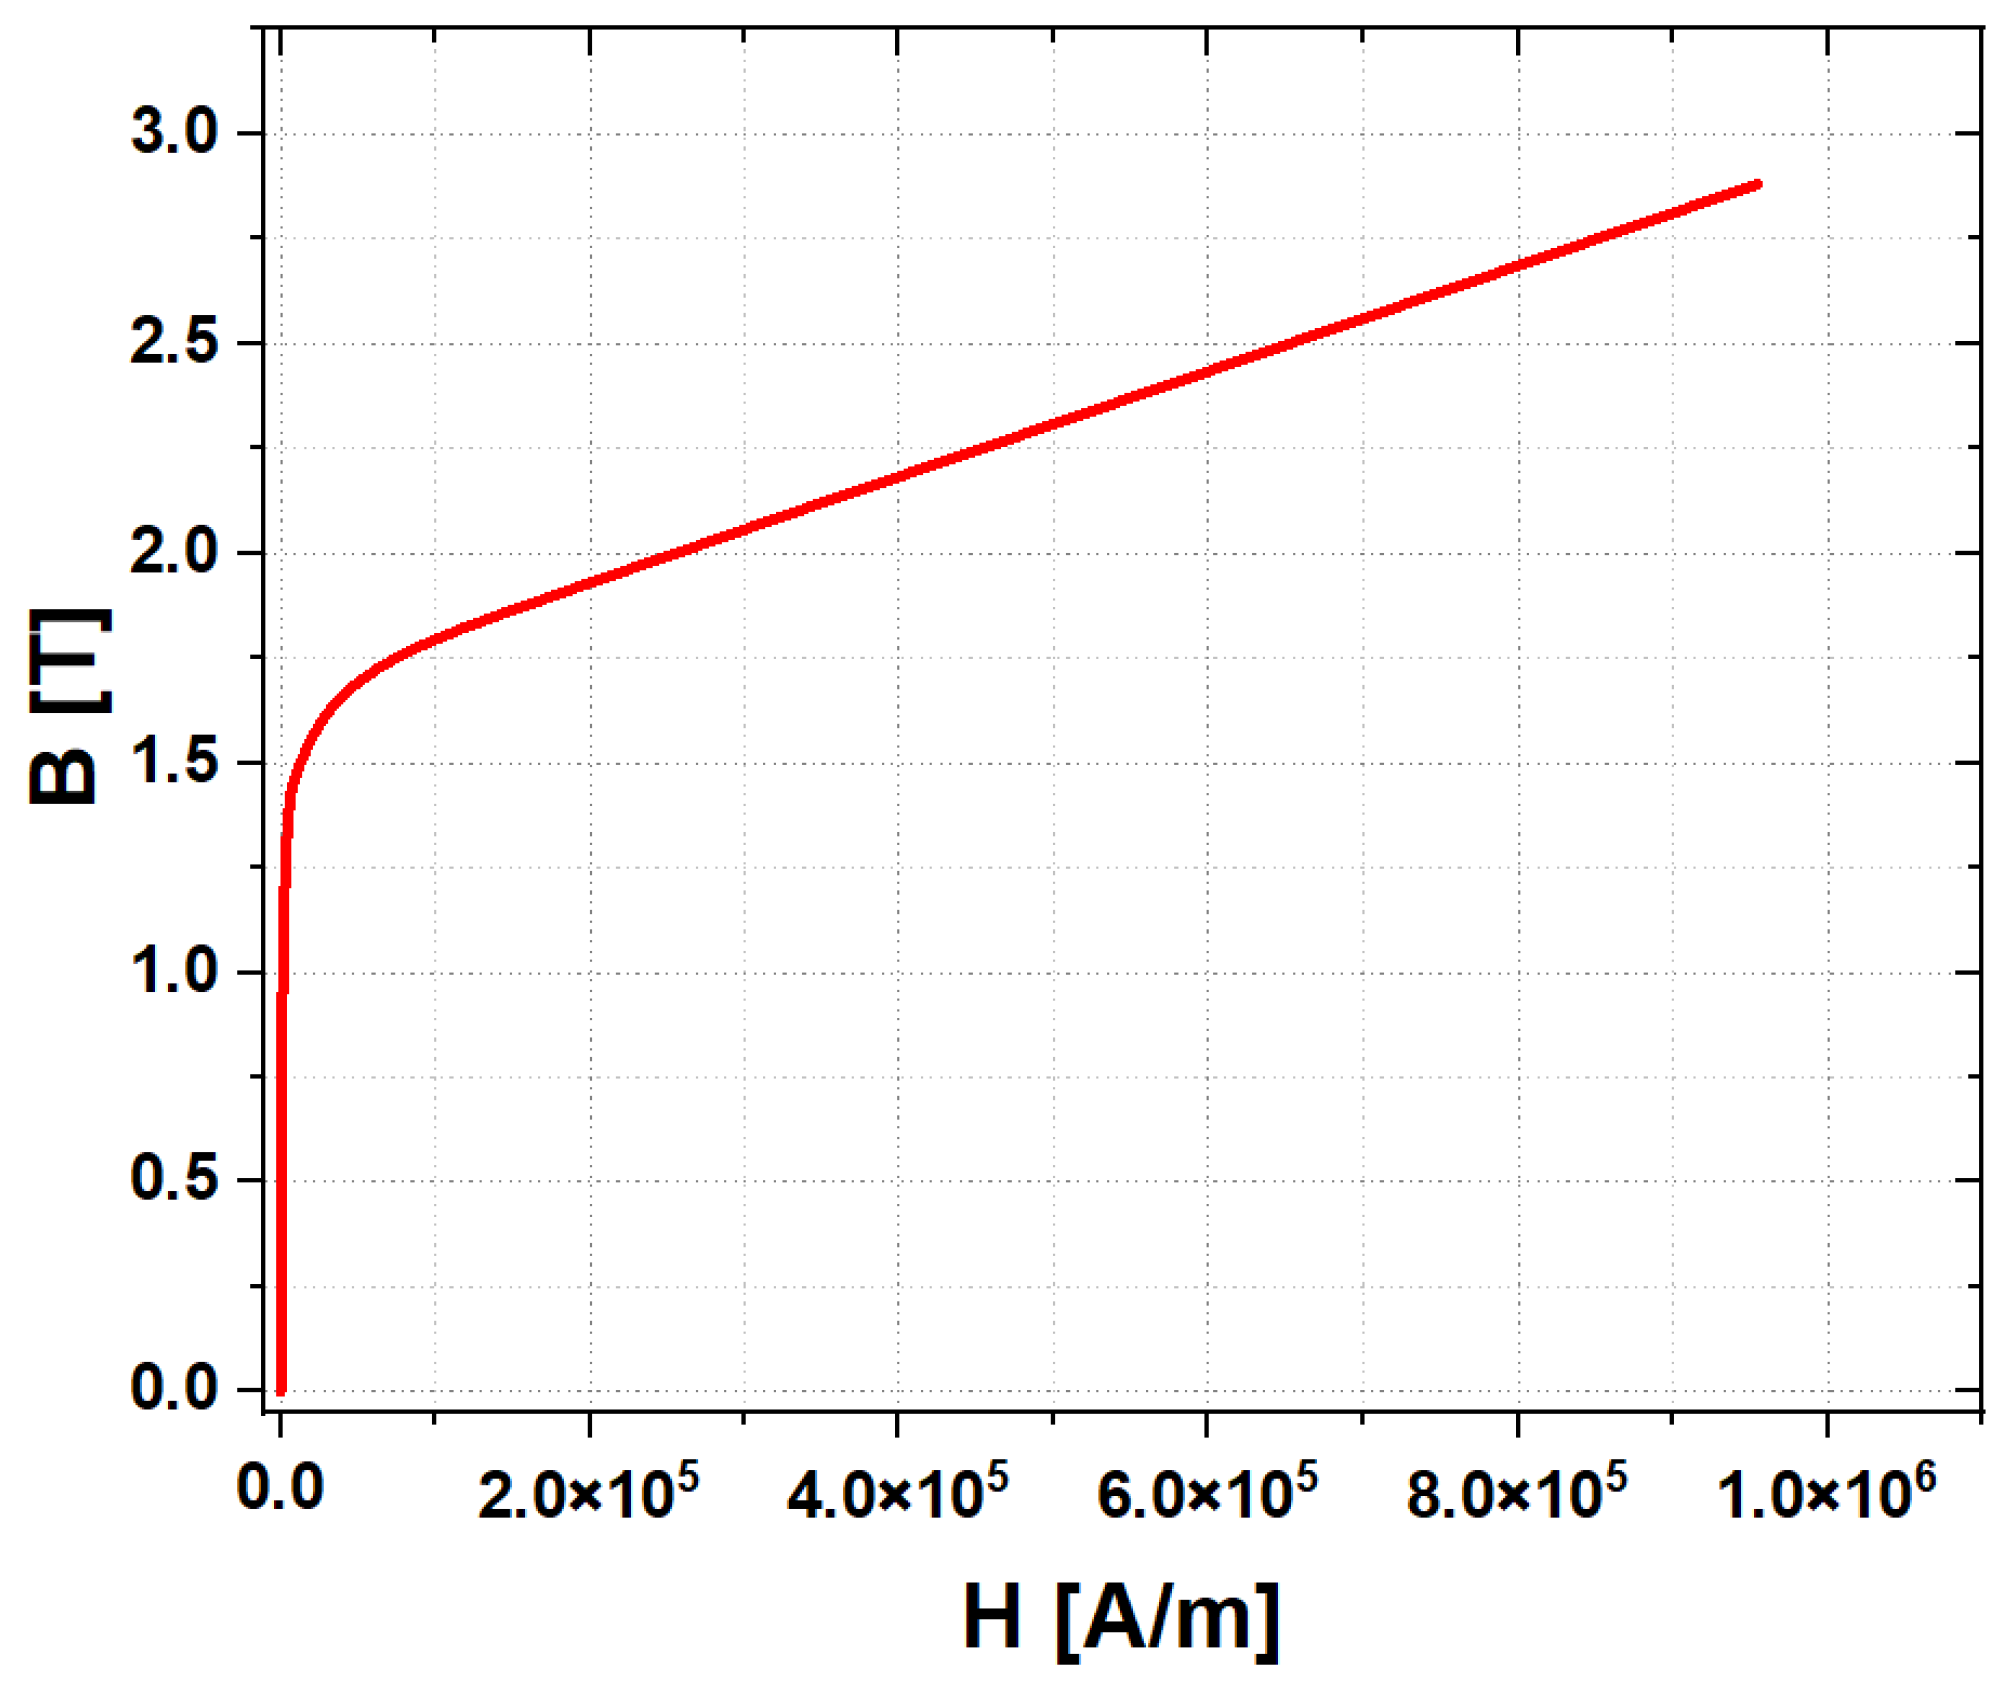
First of all, a numerical model was developed to analyze the performance of the existing ferrous particle sensor. Figure 2 shows the numerical model of the ferrous particle sensor with permanent magnetic. It is hard to obtain exact design parameters, including the sensor’s materials. Thus, primary design parameters were roughly estimated by dismantling the senor. These approximations were used in the analysis. Additionally, the magnetic core was made of low-carbon steel M-50. The magnetic flux density (B)- magnetic field intensity (H) curve was derived from data provided in the analysis program, as shown in Figure 3. The number of turns of the coil was 300 and the applied current was 0.1 A.
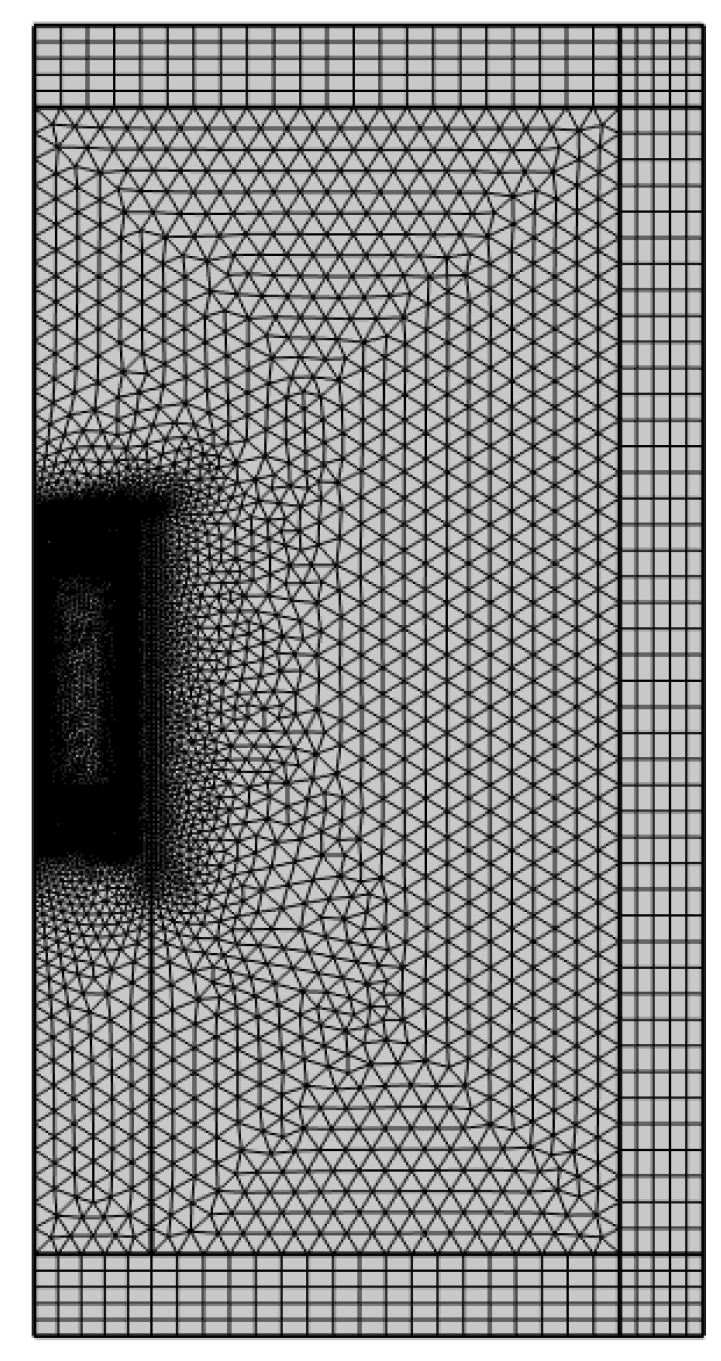
Figure 4 shows the mesh used in numerical model of the sensor. In the analysis, triangle and quad meshes were mixed. The total number of meshes was 11,605. Meshes were densely applied around the sensor to increase the accuracy of the analysis.
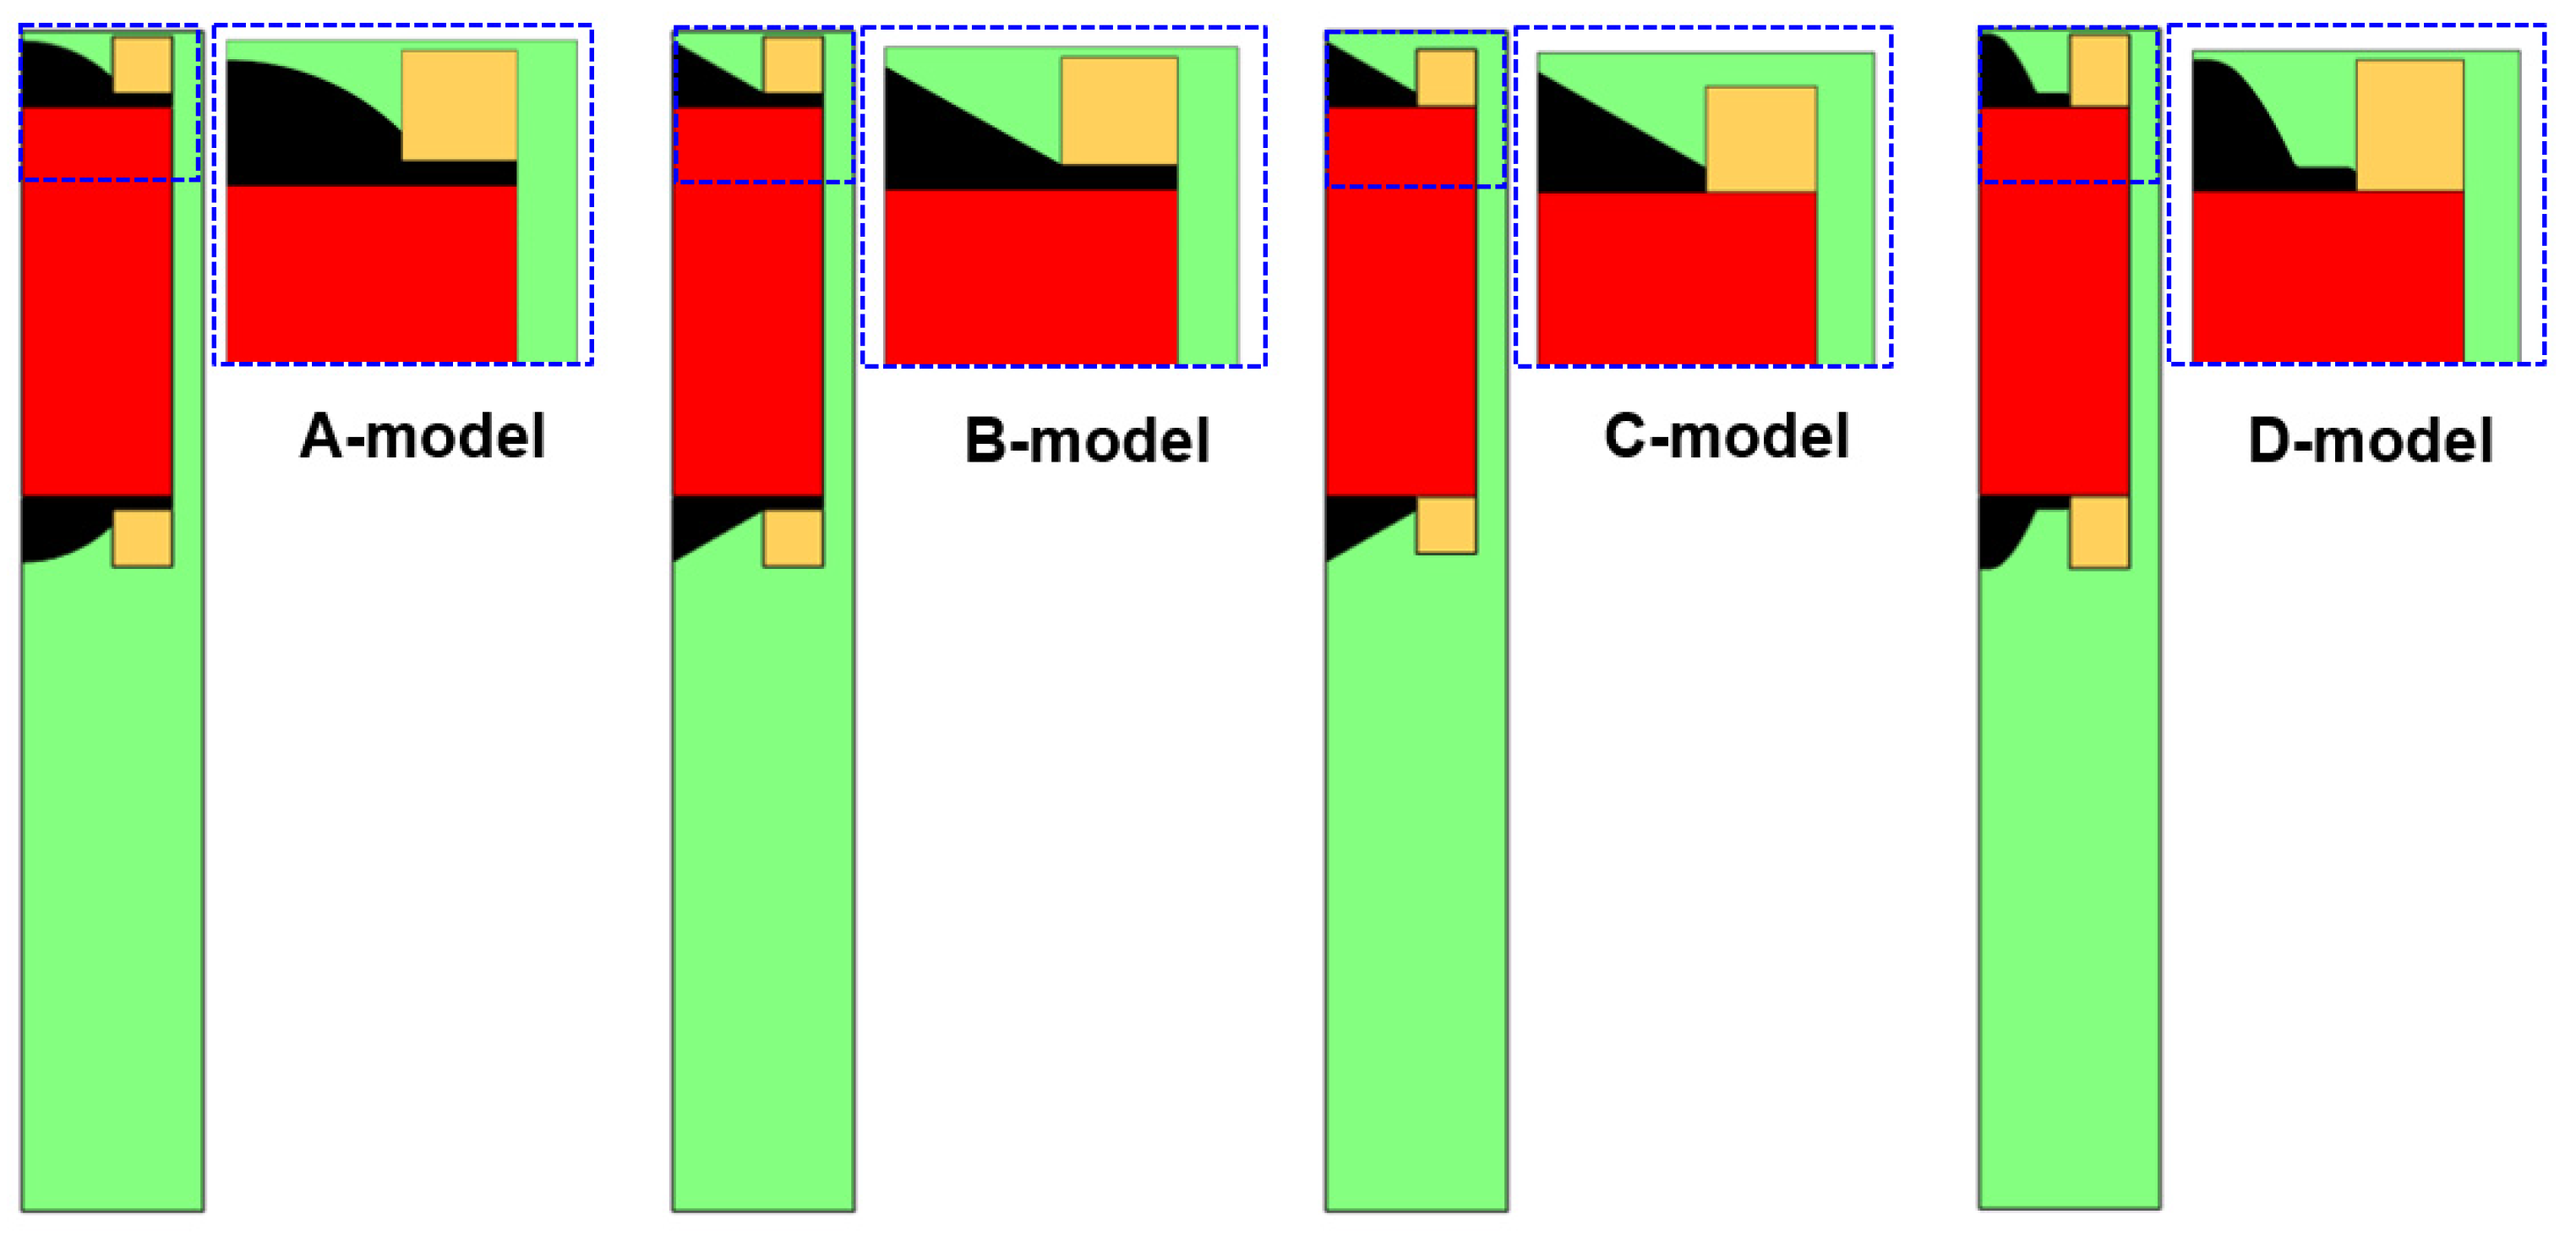
Figure 5 shows four sensor models in which the shape of the core onside the sensor is changed. A-model is similar to the existing sensor model. In B-model, the shape of the core was obliquely inclined to concentrate the magnet flux density in the center. In C-model, the magnetic flux density was reduced to the side of the sensor to focus the magnetic flux density on the upper part compared to the B-model. In D-model, the area of the core below the coil was removed and the shape was changed to further improve the magnetic flux density on the upper part of the sensor. Geometries for the four models of the sensor are shown in Table 1.
This study utilized a multi-physics analysis method. COMSOL 6.0, a commercial multi-physics software was used for numerical calculations. The sensor’s magnetic field was calculated based on Maxwell’s equations. Formulations used for calculating the magnetic field are shown in Equations (1) - (3):
× H = J
J = σ ( E + v × B ) + J e
B = × D
where H, J, B, and D are magnetic field intensity [A/m], current density [A/m2], magnetic flux density [T], and magnetic vector potential [A], respectively. The force on a charge σ [C] moving with velocity v [m/s] in the presence of an electric and magnetic field E [V/m], B, is called the Lorentz force and Je [A/m2] is an externally generated current density. In this program, the AC/DC module contains the electromagnetic field interface model, which calculates the magnetic flux of the ferrous particle sensor. For cases where currents and electromagnetic field vary slowly, the induced displacement current can be ignored. This assumption, referred to as the quasistatic approximation, is widely used in modeling low-frequencies electromagnetic where the dimensions of the structure is small compared to the wave length [41].
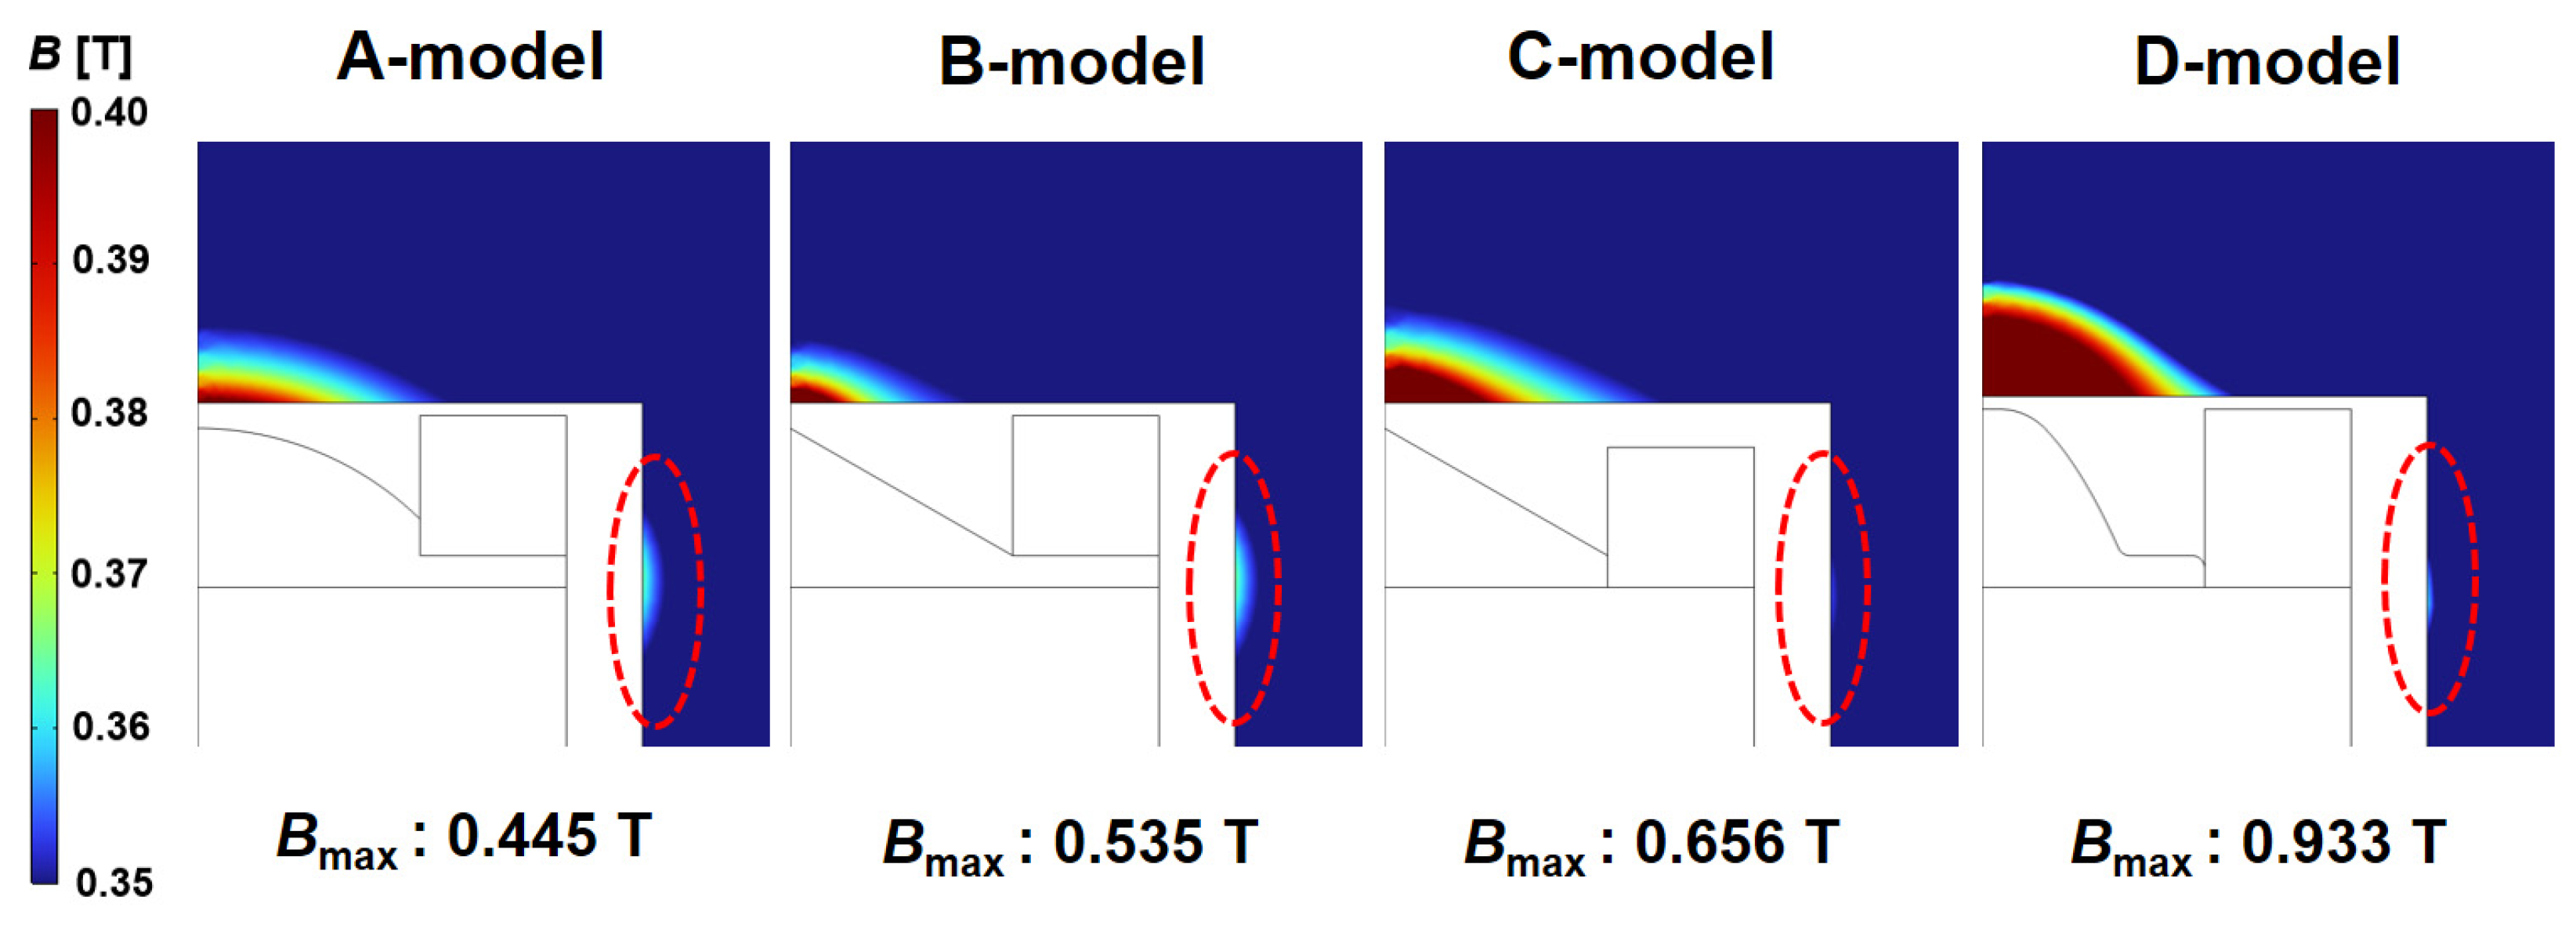
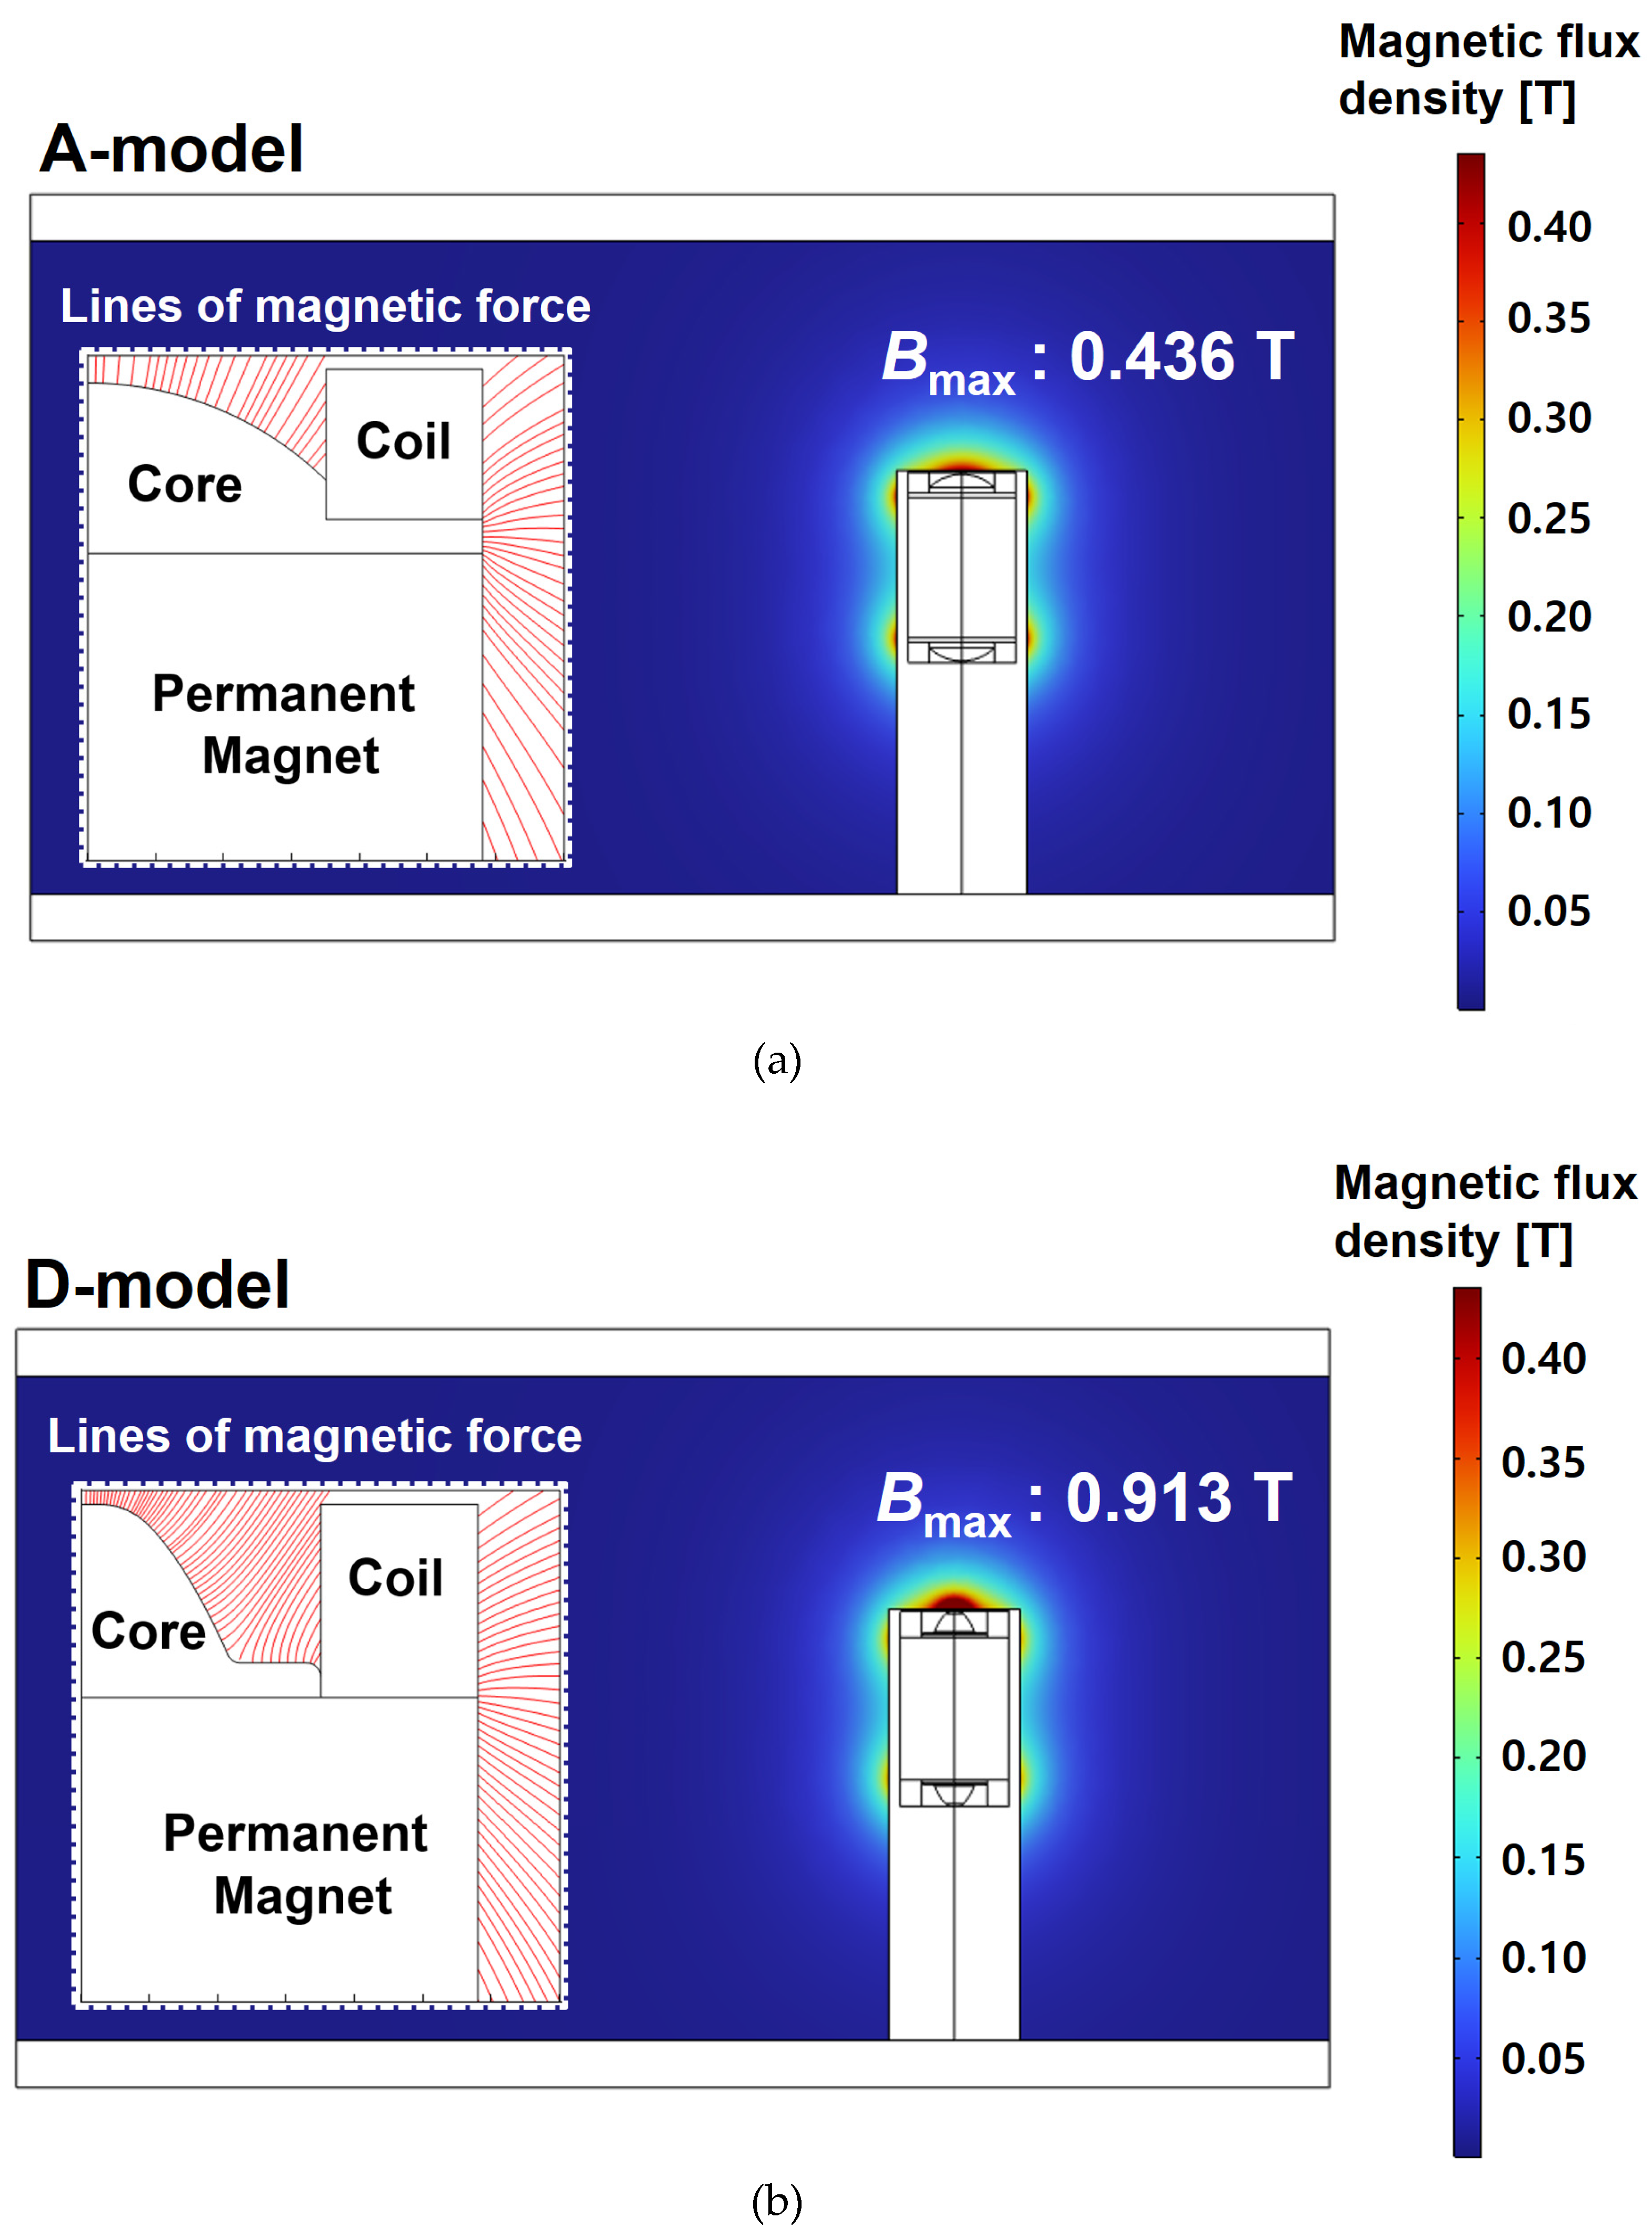
Magnetic flux density distributions for the four sensor models are shown in Figure 6. B-model had a higher maximum magnetic flux density than A-model. However, some magnetic flux density was generated at the side part (red dotted area) of the sensor. Thus, the sensitivity of the sensor was not greatly improved. Compared to B-model, C-model removed the area of the core below the coil. As a result, the magnetic flux density was concentrated in the upper part and less magnetic flux density was generated in the side part. Therefore, D-model improved the sensitivity of the sensor by changing the shape of core. The D-model increased the maximum magnetic flux density by about 210% compared to the conventional sensor type (A-model) and improved the sensitivity by lowering the magnetic flux density of the side part.

2.2. Evaluating Sensitivity of the Sensor in the Flow Field

In Section 2.1, magnetic flux density of the sensor was improved. Although it is essential to fabricate an actual sensor and conduct an experiment for evaluating the performance, a method for verifying whether the sensitivity of the sensor has been improved is suggested using a numerical method. Evaluating the sensitivity of the sensor numerically is economical in terms of cost and time. However, verification through experiments for test devices and lubrication systems is absolutely necessary. This study focused on how to evaluate sensitivity of the sensor with a numerical method. Among the four models of the sensor, only the A-model and D-model were evaluated for sensitivity numerically. This is because A-model is a case in which the existing sensor is described and D-model is a case in which the magnetic flux density of the sensor is greatly improved.
The numerical analysis employed Navier-Stokes equations, the electromagnetic field interface model, and particle tracing module. The AC/DC module contains the electromagnetic field interface model (equations (1)-(3)), which calculates the magnetic flux of the ferrous particle sensor. Navier-Stokes equations for rotating domains are shown below:
( ρ v ) = 0
ρ ( v ) v + 2 ρ Ω × v = [ p I + τ ] + F ρ ( Ω × ( Ω × r ) )
where, Ω, I, τ, and F mean angular velocity [1/s], identity matrix, shear stress [N/m2], volume force [N/m3], respectively.
The particle tracing module is utilized to compute individual particles’ paths by solving their equations of motion over time, which allows for evaluation of discrete trajectories:
d d t ( m p v 1 ) = F D + F e x t F D = 1 τ p m p ( v v 1 ) , F e x t = 2 π r p 3 μ o μ r K | H | 2 , τ p = ρ p d p 2 18 μ
where mp, v1, FD, and Fext are particle mass [kg], velocity vector of the particle [m/s], drag force [N], and magnetophoretic force [N], respectively. In addition, τp, dp, rp, ρp, μ, μ0, μr, and K mean particle velocity response time [s], particle diameter [m], particle radius [m], particle density [kg/m3], viscosity of fluid [Pa∙s], vacuum permeability [kg∙m∙s/A2], relative permeability, and nondimentional parameter, respectively.
The motion of particles in a fluid follows Newton’s second law, which states that the net force on an object is equal to the time derivative of its linear momentum in an inertial reference frame as shown in equation (6).
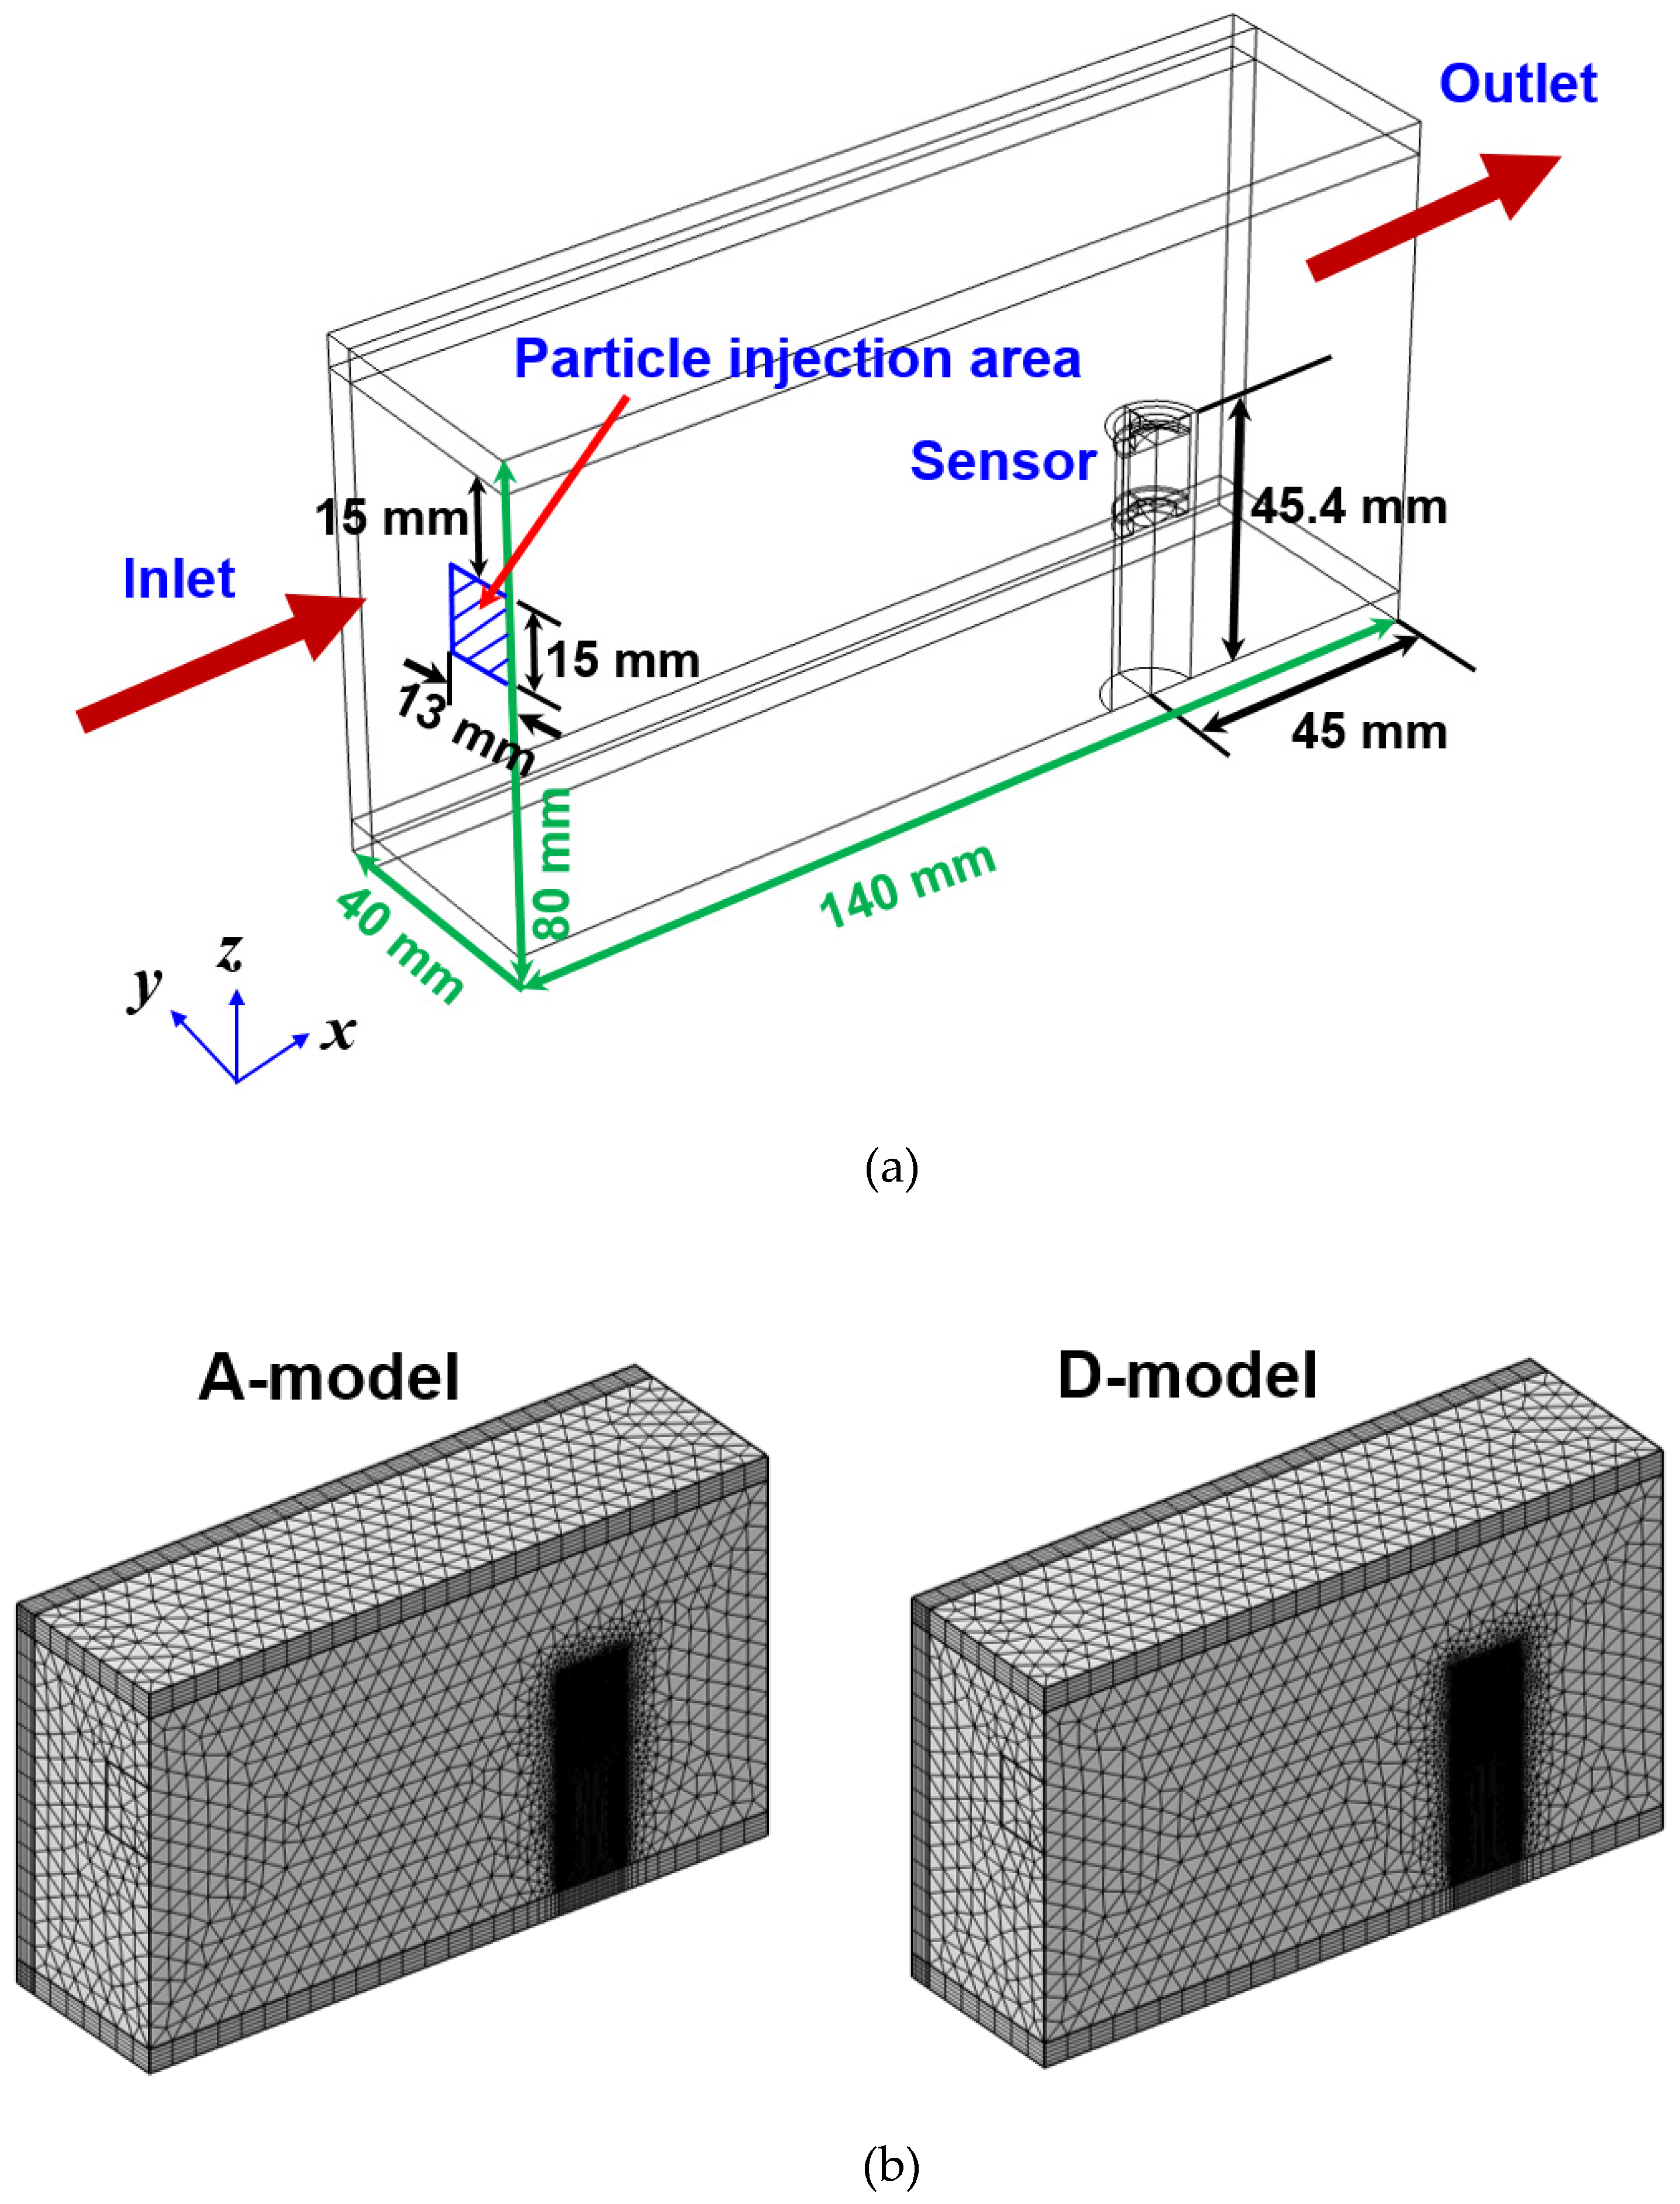
This analysis was conducted using a planar symmetric model as shown in Figure 7. Various meshes such as tetrahedral, pyramid, prism, and hexahedral were used. The total number of elements was 872,406 in A-model and 1,158,494 in D-model. Moreover, a dense mesh was applied to around the sensor to ensure analytical accuracy. The size of the flow channel was 140 mm (x) × 80 mm (y) × 80 mm (z). The flow was laminar. Working conditions for numerical calculations are shown in Table 4. Particles used in the analysis were spherical and the material was iron with a density of 8030 kg/m3. During the initial five seconds of calculation, 1,500 particles were injected from the particle injection area (blue shade area) at intervals of 0.5 seconds. The total number of injected particles was 15,000. The density and viscosity of the lubricant used in the analysis were 870 kg/m3 and 0.04 Pa∙s, respectively.
In this analysis, not only trajectories of the particles, but also the number of particles collected by the sensor were evaluated. The number of particles collected by the sensor was evaluated while the fluid velocity changed from 0.002 m/s to 0.1 m/s. That is, the collecting effect of the sensor with variation of the fluid velocity was evaluated. Since this sensor uses a permanent magnet to collect ferrous particles and then measures the amount of ferrous wear particles through a change in magnetic field, the sensor’s collecting effect is the most important factor of the sensor’s sensitivity. Therefore, the sensitivity of the sensor was evaluated by determining how many ferrous particles adhered to the sensor under several flow conditions.
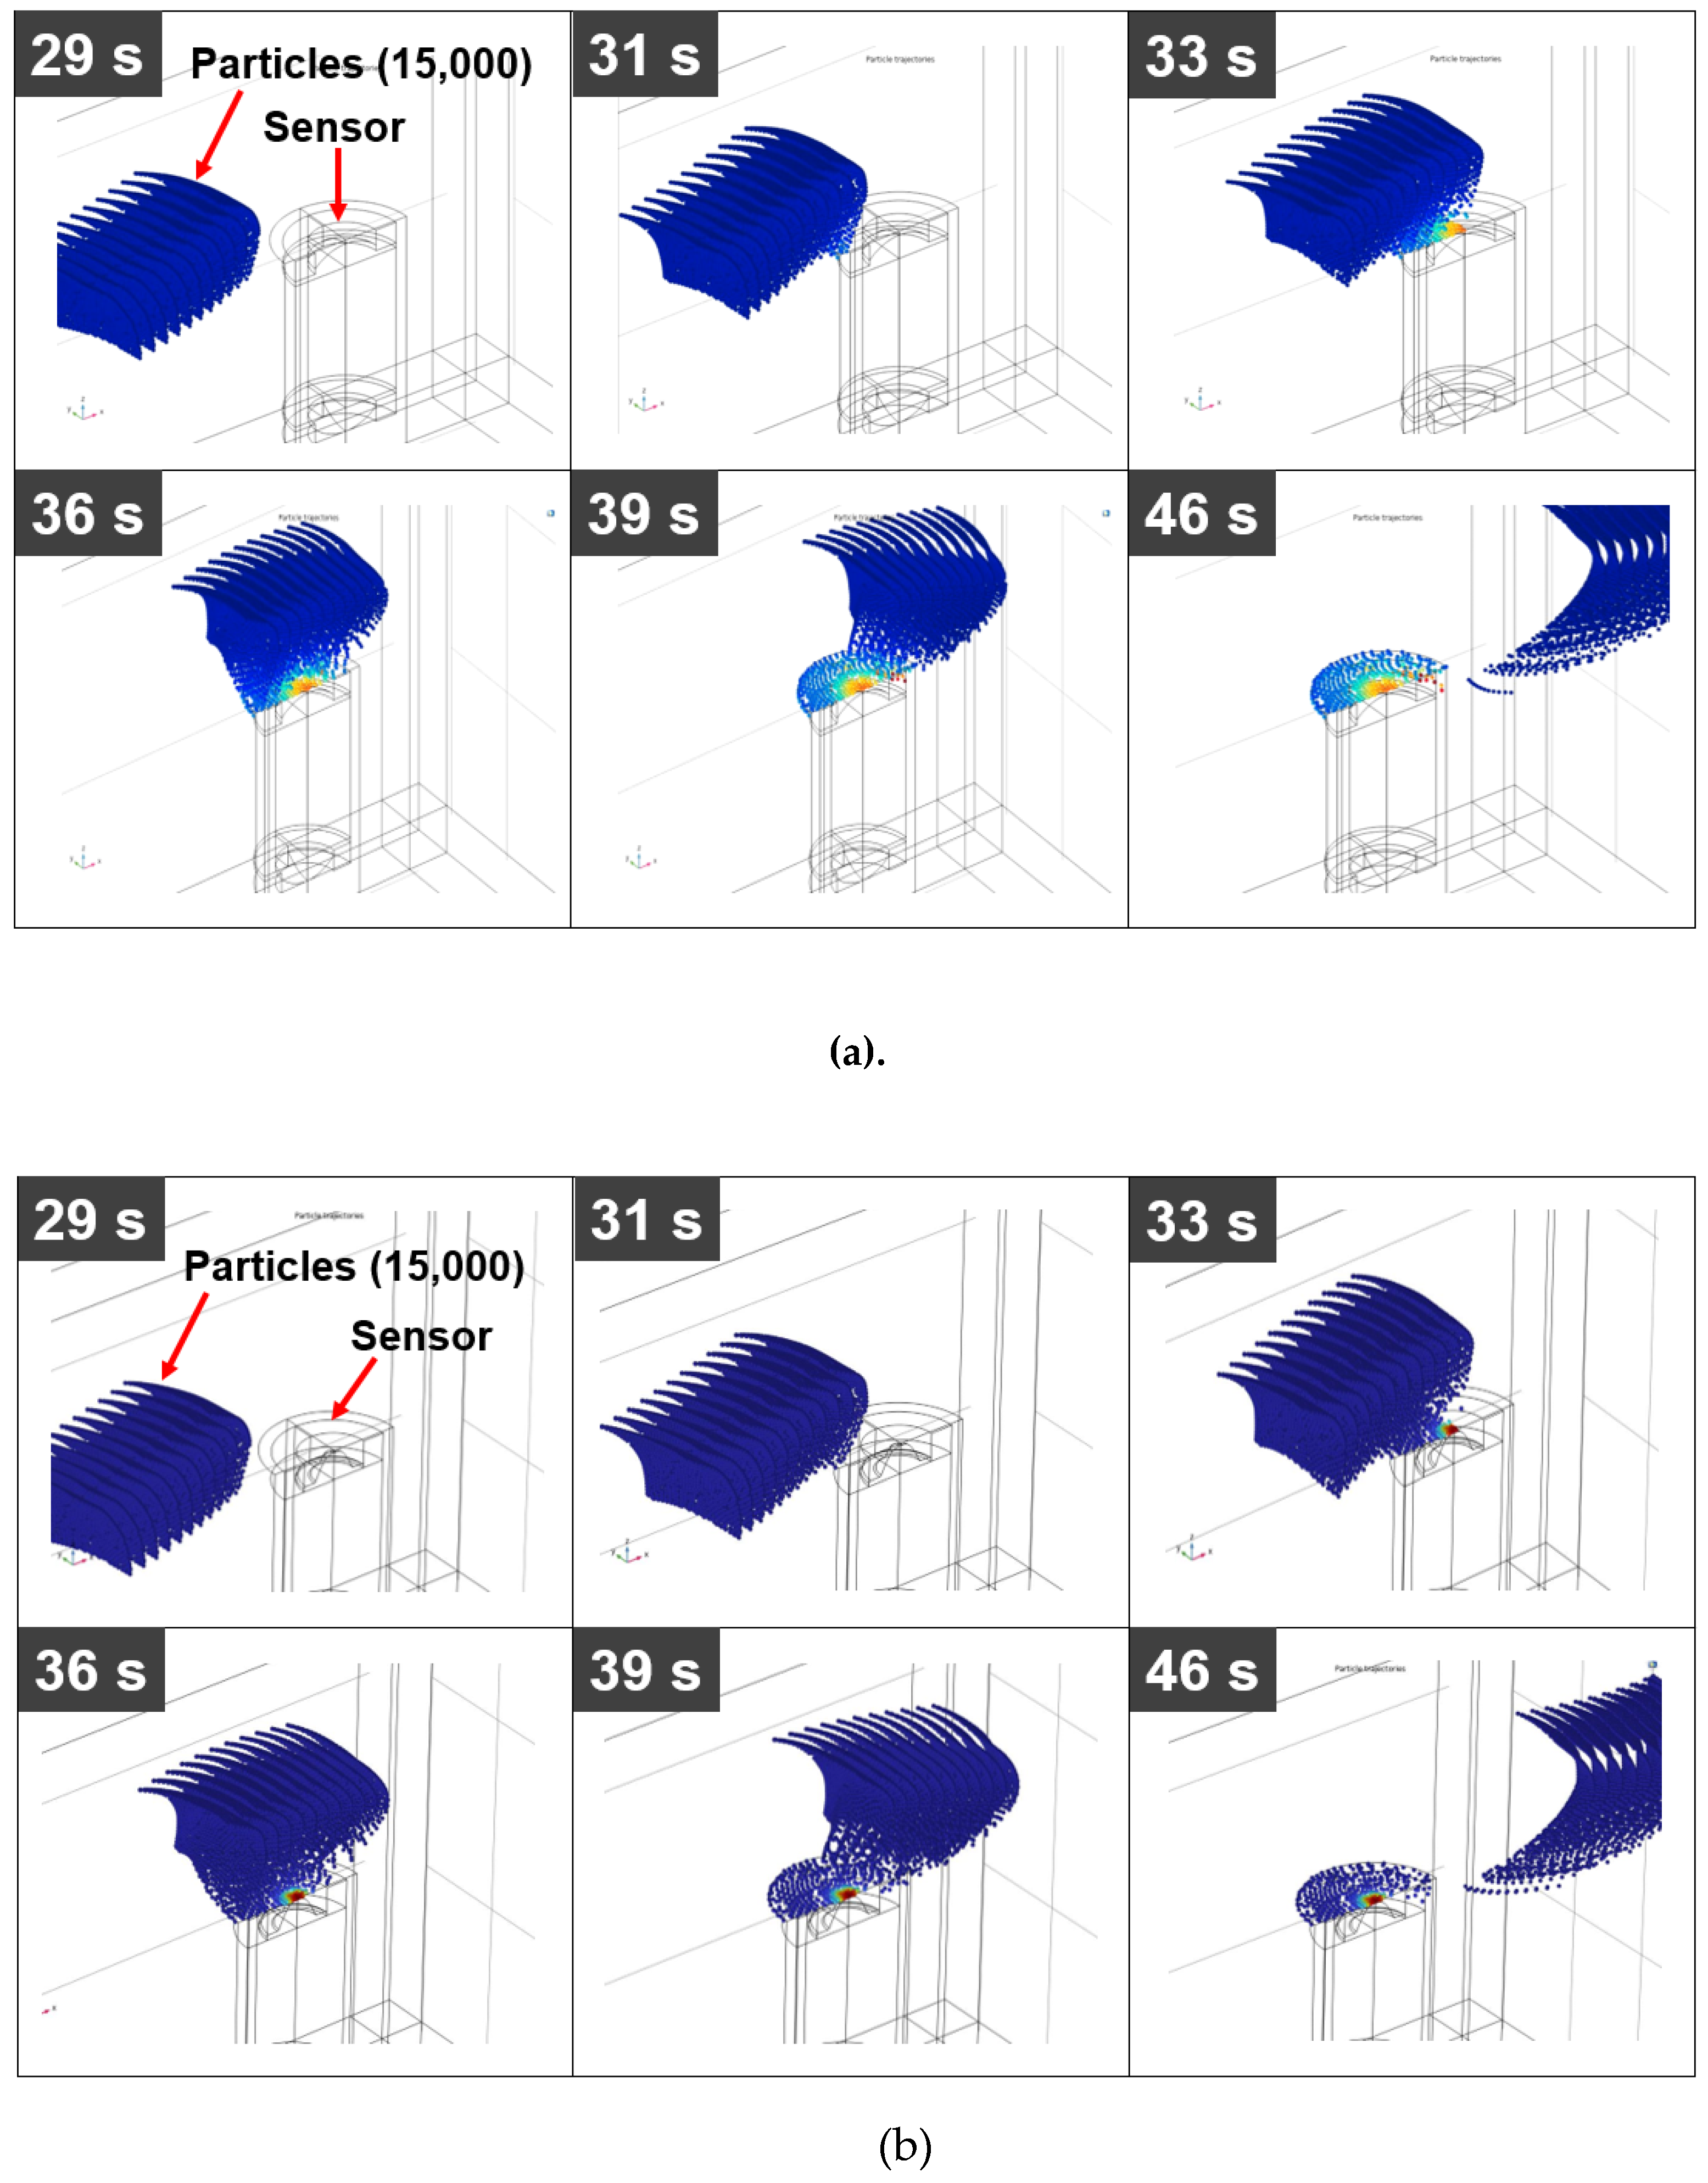
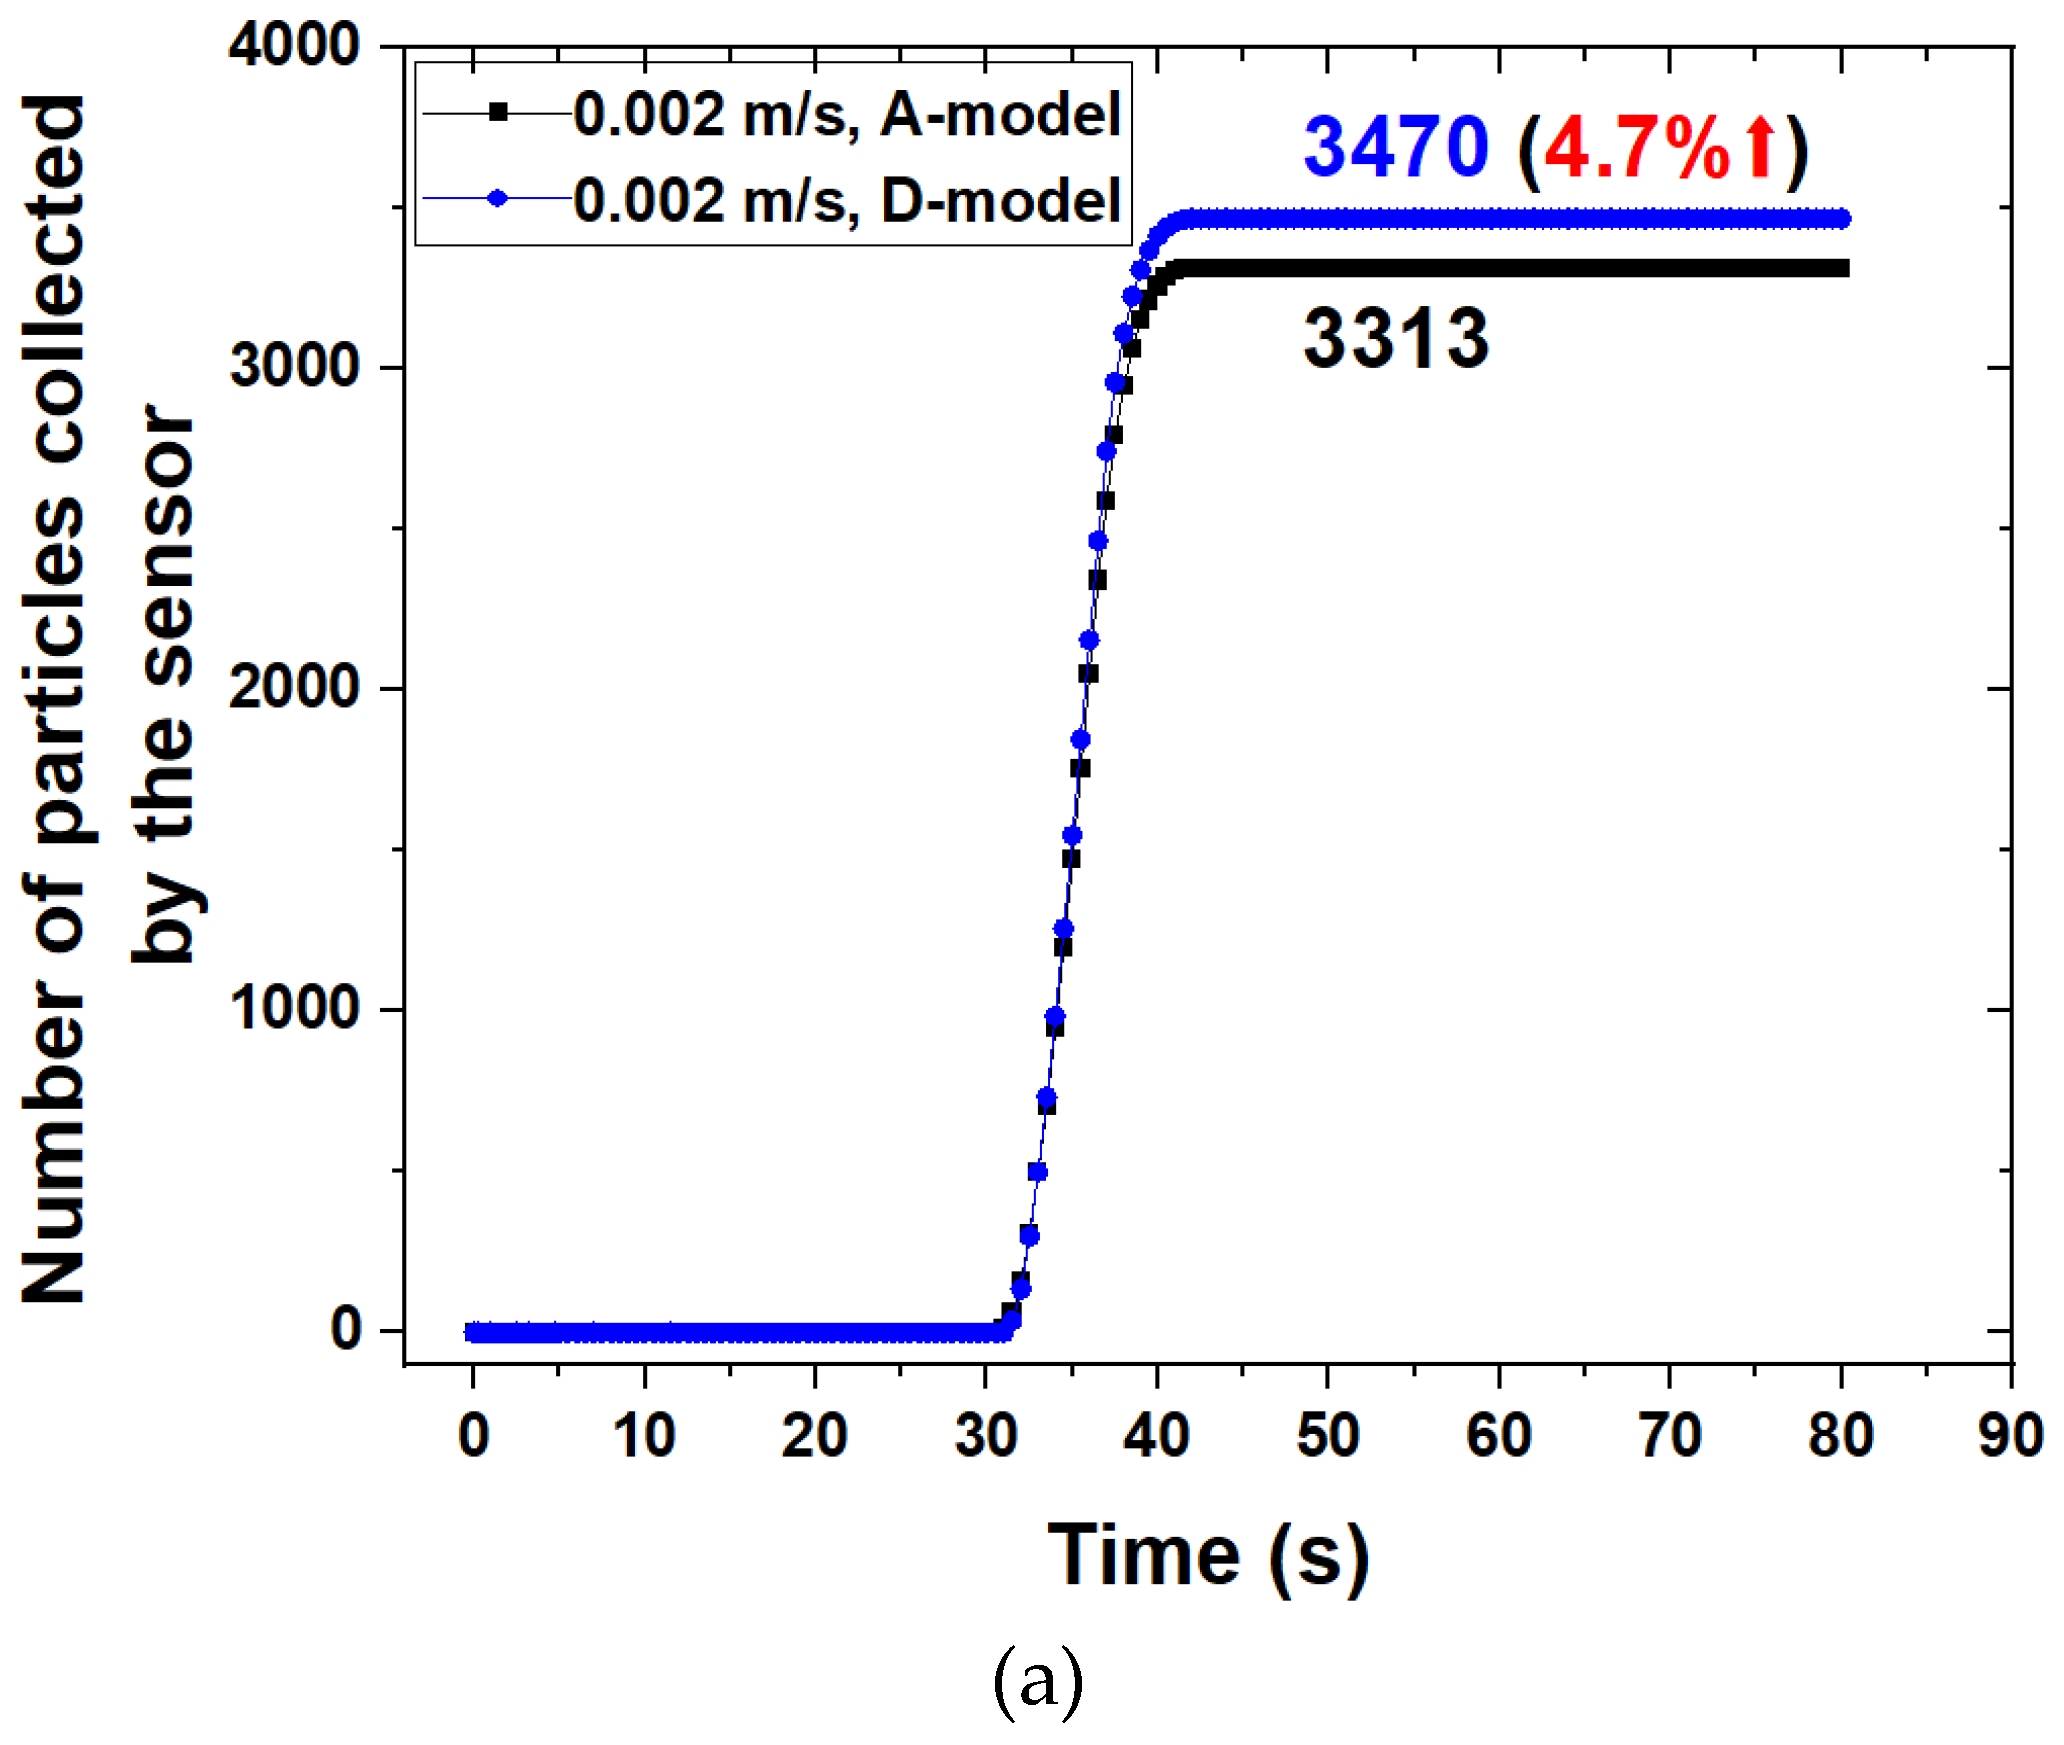
Figure 8 shows particle trajectories with time in A-model and D-model when the velocity of fluid is 0.002 m/s. A total of 15,000 ferrous particles flowed from inlet side to the outlet, and among them, some particles started to attach to the top of the sensor from about 30 seconds when A-model was applied. In the case of D-model, some particles began to adhere to the top of the sensor at a time similar to that of A-model. However, the number of particles attached to the sensor of the D-model was greater than that attached to the sensor of the A-model.
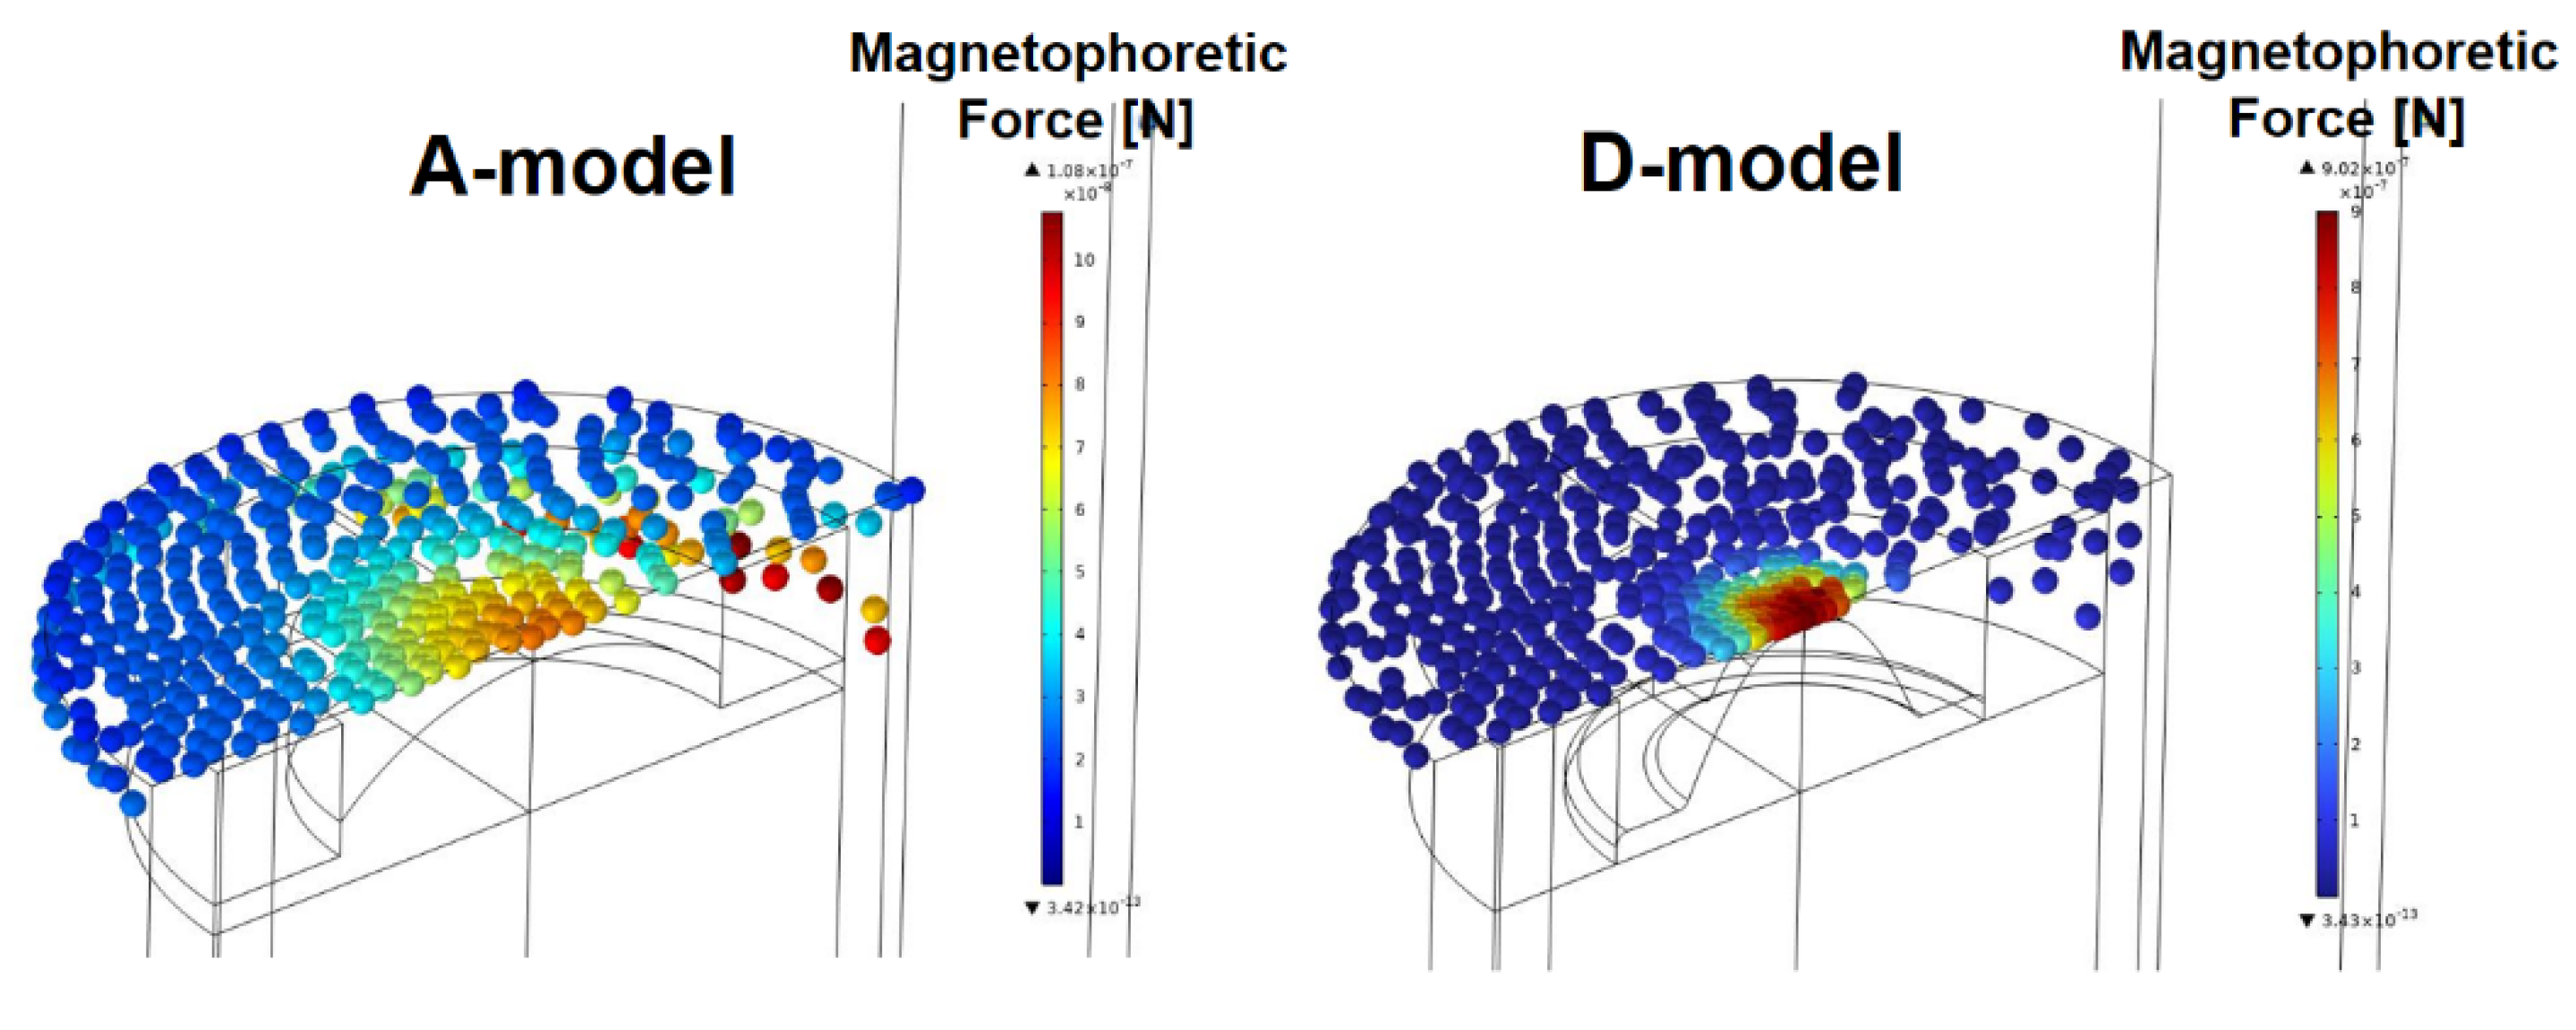
Figure 9 shows collected particles on the top of the sensor in A-model and D-model when the fluid velocity is 0.002 m/s. As shown in Figure 9, the sensitivity of the sensor was evaluated by the number of particles collected on the top of the sensor. In this Figure 9, the color of particles indicates the magnitude of the magnetophoretic force. Particles collected in the central part of the top surface of the sensor are subjected to a large magnetophoretic force.
Compared to the existing sensor model (A-model), the improved sensor (D-model) investigated how the particle collecting effect appeared according to the change of fluid velocity as shown in Figure 10. When the fluid velocity was 0.002 m/s, the number of particles attached to the sensor was 3313 in the A-model and 3470 in the D-model. That is, the case of D-model increased about 4.7% compared to the case of A-model in terms of the number of attached particles. When the fluid velocity increased to 0.02 m/s and 0.04 m/s, results of D-model increased about 9.2% and 44%, respectively, compared to those of A-model in terms of the number of attached particles. When the fluid velocity was 0.1 m/s, the D-model had 22 particles attached to the sensor, but the A-model had no particle attached to the sensor. It is difficult to attach particles to the sensor under conditions where the velocity of the fluid is higher. This is because the inertia force of the fluid increases as the velocity of the fluid increases. This result confirms that the sensor of the improved model shows a distinct improvement in sensitivity in a situation where the fluid velocity increases.
Figure 11 shows magnetic flux density and magnetic force lines around the sensor in a fluid field where the fluid velocity is 0.1 m/s. The maximum magnetic flux density of A-model was 0.436 T. However, the maximum magnetic flux density of D-model was 0.913 T, which was about 209 % higher than that of A-model. In addition, it can be seen that it is more advantage to collect particles in the sensor because it is formed toward the upper end of the core in the D-model than in the A-model through lines of magnetic force around the core of the sensor. Therefore, a method for evaluating the sensitivity of the ferrous particle sensor with permanent magnet using a numerical analysis based on multi-physics was proposed. Through this method, it was shown that the sensitivity of the design-changed model was improved in the flow field.

5. Conclusions

This study suggested a sensor model that could improve the sensitivity of an oil sensor by measuring amounts of ferrous particles in lubricating oil. It also presented a numerical model for evaluating the sensitivity of the sensor in a flow field for the first time. The ferrous particle sensor attaches ferrous particles to the sensor using a permanent magnet and measures the amount of attached ferrous particles. Moreover, it is widely used to diagnose condition of lubrication systems such as engines and gearboxes. Since the sensitivity of this sensor is predominantly affected by particles collected on the top pf the sensor, we tried to improve the sensitivity of the sensor by changing the shape of the core inside the sensor. Based on analysis results of several models that changed the shape of the core, an improved model that reduced the magnetic flux density on the side of the sensor and increased the magnetic flux density on the top pf the sensor was suggested. The maximum magnetic flux density of the improved model increased by about 210% compared to that of the existing model. A numerical method was suggested to evaluate the sensitivity of the sensor in the flow field. This numerical approach method is economical in terms of time and cost. Through sensitivity evaluation of the existing model and the proposed model under various fluid velocity conditions, it was confirmed that the proposed model improved sensitivity even in the flow field. However, a verification experiment must be performed for the test device in order to apply this sensor. Therefore, additional research related to this should be conducted in the near future.

Funding

Please add: This work funded by Korea Institute of Energy Technology Evaluation and Planning (KETEP) grant funded by the Korea government (MOTIE) (No.20214000000010).

Acknowledgments

This work was supported by the Korea Hydro & Nuclear Power Co. (2022). This work supported by Korea Institute of Energy Technology Evaluation and Planning (KETEP) grant funded by the Korea government (MOTIE) (No.20214000000010).

Conflicts of Interest

The authors declare no conflict of interest.

Nomenclature

a: Height of permanent magnet [mm]
B: Magnetic flux density [T]
b: Width of permanent magnet [mm]
c: Height of coil [mm]
D: Magnetic vector potential [A]
d: Width of coil [mm]
dp: Particle diameter [mm]
E: Magnetic field [V/m]
e: Height of core [mm]
F: Volume force [N/m3]
FD: Drag force [N]
Fext: Magnetophoretic force [N]
f: Length of the core from the central axis to the core [mm]
g: Thickness of the core under the coil [mm]
H: Magnetic field intensity [A/m]
h: Thickness of the case at the top of the core [mm]
I: Identity matrix
J: Current density [A/m2]
Je: Externally generated current density [A/m2]
K: Nondimensional parameter [1]
mp: Particle mass [kg]
p: Fluid pressure [Pa]
r: Position vector [m]
r1: Curvature radius in A-model [mm]
rp: Particle radius [m]
T: Unit of magnetic flux density [Wb/m2]
v: Velocity of fluid [m/s]
v1: Velocity factor of the particle [m/s]
ρ: Density of fluid [kg/m3]
ρp: Density of particle [kg/m3]
σ: Permittivity
τ: Shear stress [Pa]
τp: Mean particle velocity response time [s]
μ: Viscosity of fluid [Pa∙s]
μ0: Vacuum permeability [kg∙m∙s/A2]
μr: Relative permeability
Ω: Mean angular velocity [1/s]

References

  1. Kumar, M.; Mukherjee, P.S.; Misra, N. M. Advancement and current status of wear debris analysis for machine condition monitoring: a review. Ind. Lubr. Tribol. 2013, 65, 3–11. [Google Scholar] [CrossRef]
  2. Hong, S.H. Lit Literature review of machine condition monitoring with oil sensors – Types of Sensors and their functions. Tribol. Lubr. 2020, 36, 297–306. [Google Scholar] [CrossRef]
  3. Hong, S. H.; Jeon, H.G. Monitoring the conditions of hydraulic oil with integrated oil sensors in construction equipment. Lubricants 2022, 10, 278. [Google Scholar] [CrossRef]
  4. Hong, S.H. Machine Condition Diagnosis Based on Oil Analysis –Fundamental Course, 1st ed.; Hanteemedia: Seoul, Korea, 2021; pp. 94–96. [Google Scholar]
  5. Summer-Smith, D.; Neale, M.J. Failure patterns and failure analysis, The Tribology Handbook, 2nd ed.; London, United Kingdom, 1995; pp.89. [Google Scholar]
  6. Rajan, B.S. Cost Benefit Analysis of condition Monitoring in Batch Process Plants. Ph.D. thesis, University of Wales, England, 26th November 1997. [Google Scholar]
  7. Mowbray, J. Reliability-Centred Maintenance, 2nd ed.; Butterworth Heinemann: London, England, 1991; pp.22. [Google Scholar]
  8. Stachowiak, G.W. Wear – Materials, Mechanisms, and Practice, 1st ed.; Wiley: West Sussex, England, 2005; pp. 22–23. [Google Scholar]
  9. Fasihi, P.; Kendall, O.; Abrahams, R.; Mutton, P.; Qiu, C.; Schlafer, T.; Yan, W. Tribological properties of laser cladded alloys for repair of rail components. Materials 2022, 15, 7466. [Google Scholar] [CrossRef] [PubMed]
  10. Du, L.; Zhe, J.; Carletta, J.; Veillette, R.; Choy, F. Real-time monitoring of wear debris in lubricating oil using a microfluidic inductive coulter counting device. Microfluid Nanofluidics 2010, 9, 1241–1245. [Google Scholar] [CrossRef]
  11. Du, L.; Zhe, J. A high throughput inductive pulse sensor for online oil debris monitoring. Tribol. Int. 2011, 44, 175–179. [Google Scholar] [CrossRef]
  12. Du, L.; Zhe, J. Parallel sensing of metallic wear debris in lubricants using under-sampling data processing. Tribol. Int. 2012, 53, 28–34. [Google Scholar] [CrossRef]
  13. Du, L.; Zhu, X.; Han, Y.; Zhao, L.; Zhe, J. Improving sensitivity of an inductive pulse sensor for detection of metallic wear debris in lubricants using parallel LC resonance method. Meas. Sci. Technol. 2013, 24, 75106. [Google Scholar] [CrossRef]
  14. Wang, C.; Bai, C.; Yang, Z.; Zhang, H.; Li, W.; Wang, X.; Zheng, Y.; Ilerioluwa, L.; Sun, Y. Research on High Sensitivity Oil Debris Detection Sensor Using High Magnetic Permeability Material and Coil Mutual Inductance. Sensors 2022, 22, 1833. [Google Scholar] [CrossRef]
  15. Wang, Y.; Lin, T.; Wu, D.; Zhu, L.; Qing, X.; Xue, W. A new in situ coaxial capacitive sensor network for debris monitoring of lubricating oil. Sensors 2022, 22, 1777. [Google Scholar] [CrossRef]
  16. Liu, Z.; Wu, S.; Raihan, M.K.; Zhu, D.; Yu, K.; Wang, F.; Pan, X. The optimization of parallel resonance circuit for wear debris detection by adjusting Capacitance. Energies 2022, 15, 7318. [Google Scholar] [CrossRef]
  17. Wu, X.; Zhang, Y.; Li, N.; Qian, Z.; Liu, D.; Qian, Z.; Zhang, C. A new inductive debris sensor based on dual-excitation coils and dual-sensing coils for online debris monitoring. Sensors 2021, 21, 7556. [Google Scholar] [CrossRef] [PubMed]
  18. Zeng, L.; Zhang, H.; Wang, Q.; Zhang, X. Monitoring of non-ferrous wear debris in hydraulic oil by detecting the equivalent resistance of inductive sensors. Micromachines 2018, 9, 117. [Google Scholar] [CrossRef] [PubMed]
  19. Li, W.; Bai, C.; Wang, C.; Zhang, H.; Ilerioluwa, L.; Wang, X.; Yu, S.; Li, G. Design and research of inductive oil pollutant detection sensor based on high gradient magnetic field structure. Micromachines 2021, 12, 638. [Google Scholar] [CrossRef] [PubMed]
  20. Wu, S.; Liu, Z.; Yu, K.; Fan, Z.; Yuan, Z.; Sui, Z.; Yin, Y.; Pan, X. A novel multichannel inductive wear debris sensor based on time division multiplexing. IEEE Sens. J. 2021, 21, 11131–11139. [Google Scholar] [CrossRef]
  21. Hong, W.; Li, T.; Wang, S.; Zhou, Z. A general framework for aliasing corrections of inductive oil debris detection based on artificial neural networks. IEEE Sens. J. 2020, 20, 10724–10732. [Google Scholar] [CrossRef]
  22. Muthuvel, P.; George, B.; Ramadass, G.A. A highly sensitive in-line oil wear debris sensor based on passive wireless LC sensing. IEEE Sens. J. 2021, 21, 6888–6896. [Google Scholar] [CrossRef]
  23. Wu, X.; Liu, H.; Qian, Z.; Qian, Z.; Liu, D.; Li, K.; Wang, G. On the investigation of frequency characteristics of a novel inductive debris sensor. Micromachines 2023, 14, 669. [Google Scholar] [CrossRef]
  24. Du, L.; Zhe, J. An integrated ultrasonic-inductive pulse sensor for wear debris detection. Smart Mater. Struct. 2013, 22, 25003. [Google Scholar] [CrossRef]
  25. Xu, C.; Zhang, P.; Wang, H.; Li, Y.; Lv, C. Ultrasonic echo wave shape features extraction based on QPSO-matching pursuit for online wear debris discrimination. Mech. Syst. Signal Process. 2015, 60, 301–315. [Google Scholar] [CrossRef]
  26. Hamilton, A.; Cleary, A.; Quail, F. Development of a novel wear detection system for wind turbine gearboxes. IEEE Sens. J. 2014, 14, 465–473. [Google Scholar] [CrossRef]
  27. Wu, T.; Wu, H.; Du, Y.; Kwok, N.; Peng, Z. Imaged wear debris separation for on-line monitoring using gray level and integrated morphological features. Wear 2014, 316, 19–29. [Google Scholar] [CrossRef]
  28. Liu, Z.; Liu, Y.; Zuo, H.; Wang, H.; Chen, Z. An oil wear particles inline optical sensor based on motion characteristics for rotating machines condition monitoring. Machines 2022, 10, 727. [Google Scholar] [CrossRef]
  29. Jing, Y.; Zheng, H.; Lin, C.; Zheng, W.; Dong, K.; Li, X. Foreign object debris detection for optical imaging sensors based on random forest. Sensors 2022, 22, 2463. [Google Scholar] [CrossRef] [PubMed]
  30. Liu, M.; Wang, H.; Yi, H.; Xue, Y.; Wen, D.; Wang, F.; Shen, Y.; Pan, Y. Space debris detection and positioning technology based on multiple star trackers. Appl. Sci. 2022, 12, 3593. [Google Scholar] [CrossRef]
  31. Fan, B.; Liu, Y.; Zhang, P.; Wang, L.; Zhang, C.; Wang, J. A permanent magnet ferromagnetic wear debris sensor based on axisymmetric high-gradient magnetic field. Sensors 2022, 22, 8282. [Google Scholar] [CrossRef] [PubMed]
  32. Wang, F.; Liu, Z.; Ren, X.; Wu, S.; Meng, M.; Wang, Y.; Pan, X. A novel method for detecting ferromagnetic wear debris with high flow velocity. Sensors 2022, 22, 4912. [Google Scholar] [CrossRef] [PubMed]
  33. Jeon, H.G.; Kim, J.K.; Na, S.J.; Kim, M.S.; Hong, S.H. Application of condition monitoring for hydraulic oil using tuning fork sensor: A case on hydraulic system of earth moving machinery. Materials 2022, 15, 7657. [Google Scholar] [CrossRef]
  34. Hong, S. H.; Jeon, H.G. Assessment of condition diagnosis system for axles with ferrous particle sensor. Materials 2023, 16, 1426–16. [Google Scholar] [CrossRef]
  35. Ren, Y.; Li, W.; Zhao, G.; Feng, Z. Inductive debris sensor using one energizing coil with multiple sensing coils for sensitivity improvement and high throughput. Tribol. Int. 2018, 128, 96–103. [Google Scholar] [CrossRef]
  36. Xiao, H.; Wang, X.; Li, H.; Luo, J.; Fong, S. An Inductive debris sensor for large-diameter lubricating oil circuit based on a high-gradient magnetic field. Appl. Sci. 2019, 9, 1546. [Google Scholar] [CrossRef]
  37. Ma, L.; Zhang, H.; Qiao, W.; Han, X.; Zeng, L.; Shi, H. Oil metal debris detection sensor using ferrite core and flat channel for sensitivity improvement and high throughput. IEEE Sens. J. 2020, 20, 7303–7309. [Google Scholar] [CrossRef]
  38. Zeng, L.; Yu, Z.; Zhang, H.; Zhang, X.; Chen, H. A high sensitive multi-parameter micro sensor for detection of multi-contamination in hydraulic oil. Sens. Actuators A Phys. 2018, 282, 197–205. [Google Scholar] [CrossRef]
  39. Jia, R.; Ma, B.; Zheng, C.; Ba, X.; Wang, L.; Du, Q.; Wang, K. Compressive improvement of the sensitivity and detectability of a large-aperture electromagnetic wear particle detector. Sensors 2019, 19, 3162. [Google Scholar] [CrossRef]
  40. Ma, L.; Zhang, H.; Zheng, W.; Shi, H.; Wang, C.; Xie, Y. Investigation on the effect of debris position on the sensitivity of the inductive debris sensor. IEEE Sens. J. 2023, 23, 4438–4444. [Google Scholar] [CrossRef]
  41. COMSOL Manual, version 6.0, pp. 84. 2023.
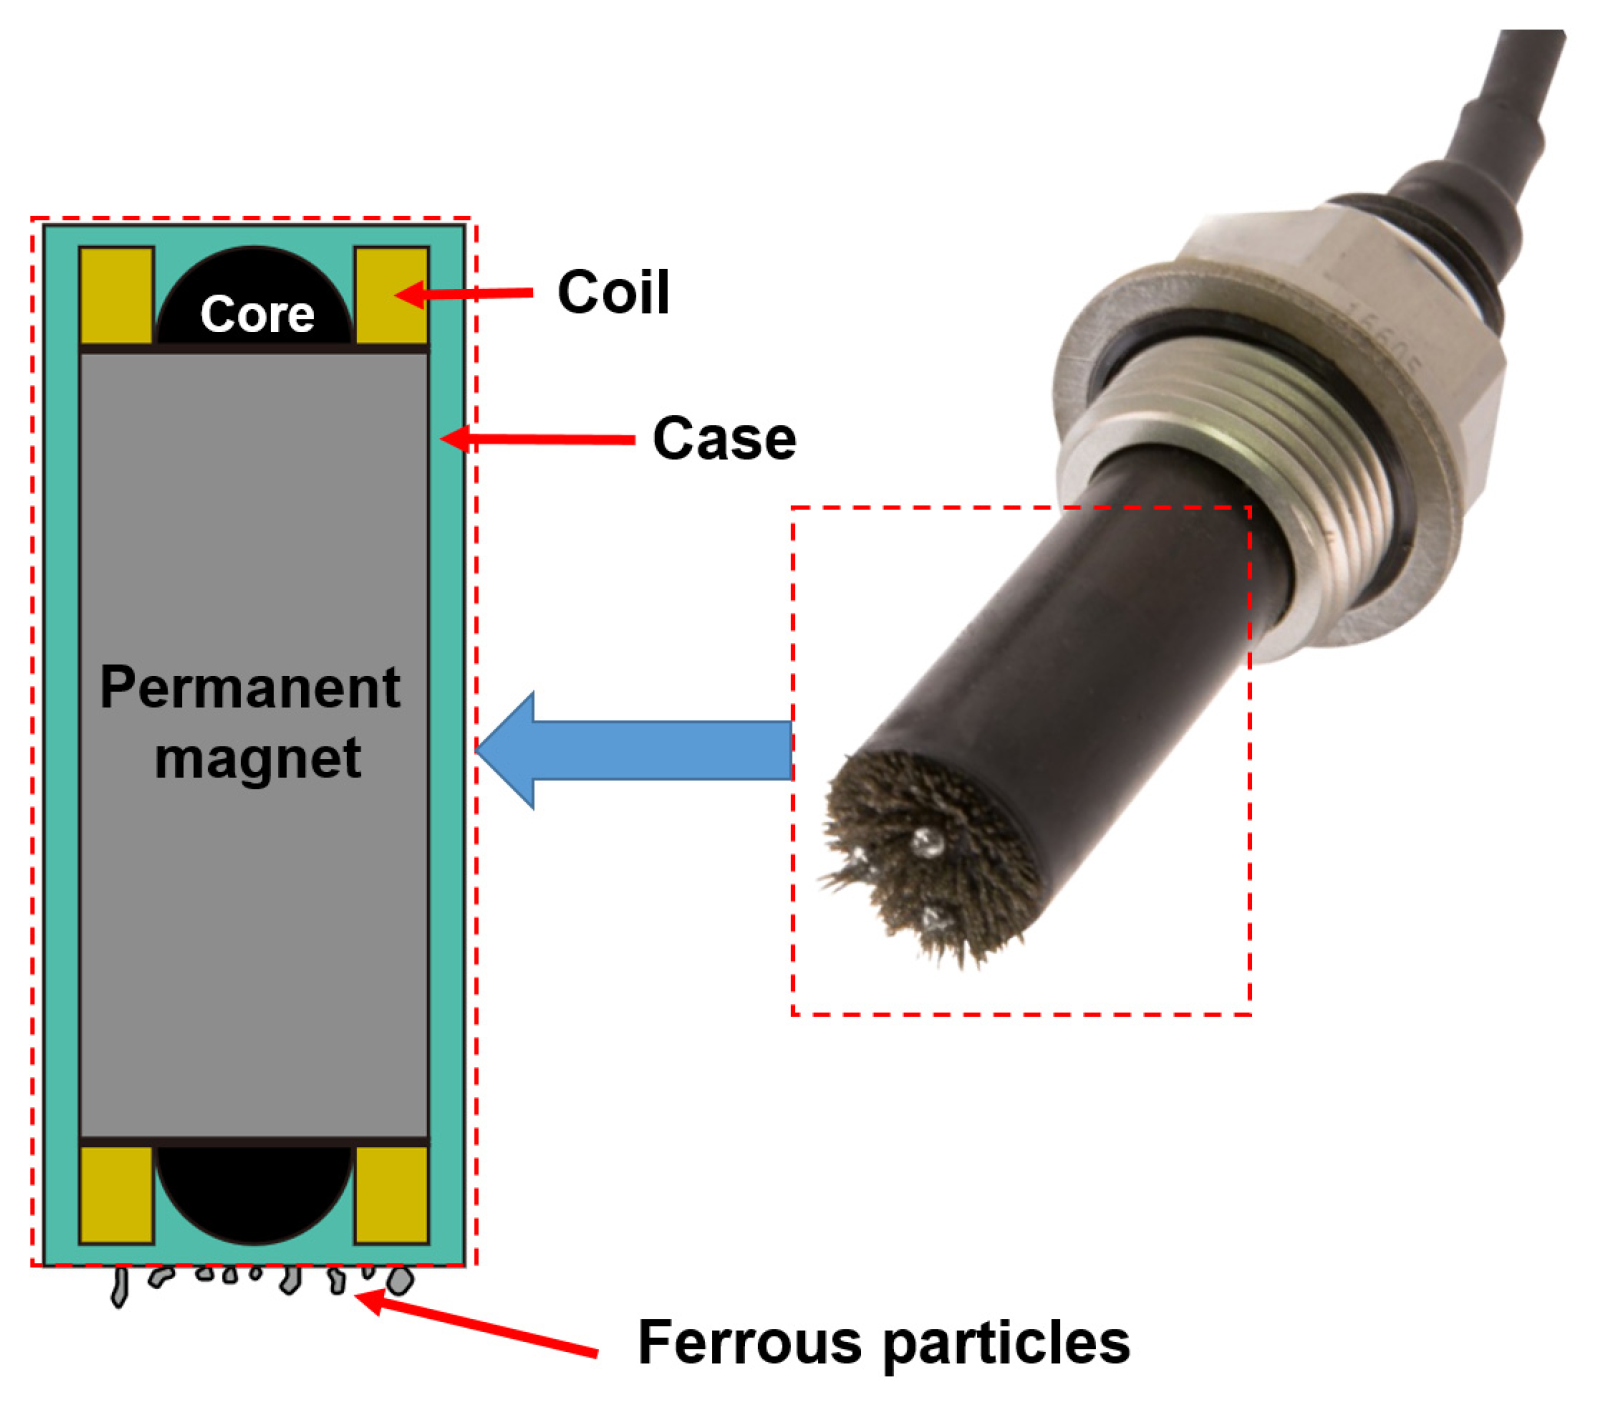
Figure 1. Schematic of ferrous particle sensor with permanent magnetic manufactured by Gill Sensors.
Preprints 72816 g001
Figure 2. Axisymmetric section of numerical model for the ferrous particle sensor.
Preprints 72816 g002
Figure 3. B-H curve of low-carbon steel M-50.
Preprints 72816 g003
Figure 4. Mesh in the numerical model.
Preprints 72816 g004
Figure 5. Four sensor models with transformed internal design geometry.
Preprints 72816 g005
Figure 6. Magnetic flux density distributions for four sensor models.
Preprints 72816 g006
Figure 7. Numerical model used for sensitivity evaluation of the sensor: (a) Control volume; (b) Meshes of A-model and D-model.
Preprints 72816 g007
Figure 8. Particle trajectories with time: (a) A-model, v = 0.002 m/s; (b) D-model, v = 0.002 m/s.
Preprints 72816 g008
Figure 9. Number of particles collected on the top of the sensor in A-model and D-model (v = 0.002 m/s).
Preprints 72816 g009
Figure 10. Number of particles collected by the sensor with variation of fluid velocity in A-model and D-model: (a) v = 0.002 m/s; (b) v = 0.02 m/s; (c) v = 0.04 m/s; (d) v = 0.1 m/s.
Preprints 72816 g010aPreprints 72816 g010b
Figure 11. Magnetic flux density and magnetic force lines in the flow field: (a) A-model; (b) D-model.
Preprints 72816 g011
Table 1. Geometries of four sensor models.
Model A-model B-model C-model D-model
a [mm] 15 15 15 15
b [mm] 5.8 5.8 5.8 5.8
c [mm] 2.2 2.2 2.2 2.8
d [mm] 2.3 2.3 2.3 2.3
e [mm] 2.5 2.5 2.5 2.8
f [mm] 3.5 3.5 3.5 3.5
g [mm] 0.5 0.5 0 0
h [mm] 0.4 0.4 0.4 0.2
r1 [mm] 5 - - -
Table 4. Working conditions for numerical calculations.
Items Condition Items Condition
Inlet
(velocity)
0.02 m/s Outlet Outflow
Number of particles 15,000 Particle diameter 10 μm
Shape of particle Sphere Material of particle Steel
Particle relative
permeability
1000 Particle density 8030 kg/m3
Density of lubricant 870 kg/m3 Absolute viscosity of lubricant 0.04 Pa∙s
Disclaimer/Publisher’s Note: The statements, opinions and data contained in all publications are solely those of the individual author(s) and contributor(s) and not of MDPI and/or the editor(s). MDPI and/or the editor(s) disclaim responsibility for any injury to people or property resulting from any ideas, methods, instructions or products referred to in the content.
Copyright: This open access article is published under a Creative Commons CC BY 4.0 license, which permit the free download, distribution, and reuse, provided that the author and preprint are cited in any reuse.
Prerpints.org logo

Preprints.org is a free preprint server supported by MDPI in Basel, Switzerland.

Subscribe

© 2024 MDPI (Basel, Switzerland) unless otherwise stated