1. Introduction
Nitrogen is an important and essential macronutrient for plant growth and development [1, 2], and is part of all building blocks of life, including nucleic acids, amino acids, proteins, lipids and metabolic products [3, 4]. Nitrogen fertilizer, as important input factor for crop production, has played an important role in increasing crop yield in recent decades [5, 6]. However, the cost of nitrogen fertilizer accounts for a large proportion of agricultural input [
7]. It has been reported that no more than 40% of the applied N is taken up by crops, and most of the applied N is retained in the soil and lost to the atmosphere, groundwater and rivers through volatilization, leaching, and surface runoff [
8]. The adverse side effects of nitrogen application has seriously damaged the environment [8-10]. Therefore, decreasing the nitrogen application and increasing nitrogen use efficiency (NUE) is necessary for agricultural sustainability [
11]. NUE comprises two components: nitrogen uptake efficiency (NUpE) and nitrogen utilization efficiency (NUtE) [
12]. Many studies have shown that there exists significant genetic difference in NUE and its two components [13-16]. NUE refers to dry matter produced by plants absorbed per unit mass of nitrogen and results from the coordination of carbon and nitrogen metabolism [
17]. Nitrogen metabolism includes N absorption [6, 18], mainly including nitrate (NO3
−) and ammonium (NH4
+) under different soil conditions [
6]; then, the absorbed nitrogen is assimilated through nitrate reductase (NR), nitrite reduction (NiR), glutamine synthetase (GS) and glutamine-2-oxoglutarate aminotransferase (GOGAT) cycle processes [
6]. The metabolic products are then converted into different nitrogen-containing compounds for carbon metabolism, including photosynthesis, phytohormones and fatty acid biosynthesis [19-21]. These processes can be controlled by numerous genes. Therefore, a better understanding of the underlying mechanism behind nitrogen uptake, transport, and assimilation would be helpful in providing a theoretical basis for improving NUE [
22].
Foxtail millet [
Setaria italica (L.) P. Beauv] is one of the oldest crops in the world [
23], and has high drought tolerance and resistance to infertility, and has been widely cultivated in Asia for food and fodder [24, 25]. It is now used as a model species for genomics and basic biological process due to its attractive qualities, including small diploid genome (2n = 18, ~ 420 Mb), short life cycle, prolific seed production, and C4 photosynthesis [24, 26]. It was reported that foxtail millet can perform root thickening to improve N uptake under low-nitrogen conditions [
27]. Transcription profiling by RNA-Seq is a successful and widely used approach to explore molecular aspects of nutrient stress [
22]. Several studies have reported that this method is widely used for investigating the mechanism of low N stress tolerance on wheat [
28], rice [
29], rapeseed [
22], barley [
30]. A previous study also explored potential regulatory factors and functional key genes in foxtail millet in response to low nitrogen [
31]. However, our previous study had shown that there existed significant genotypic variations among different foxtail millet varieties for NUE [
32]. The molecular mechanism controlling genotypic variations between different foxtail millet varieties with contrasting low-nitrogen tolerance are still unknown. Meanwhile, understanding physiological and molecular mechanism of foxtail millet in response to long-term low nitrogen stress should be close to actual production and provide a more meaningful theoretical basis. Therefore, two foxtail millet varieties—Jigu20 (JG20) and Jigu22 (JG22)—with contrasting NUE that were identified in our previous research were used to compare the differences between these two varieties in terms of physiological and transcriptomic changes in response to long-term nitrogen stress. Our results reveal the molecular mechanism of foxtail millet in response to chronic low nitrogen and identifies genes associated with high low nitrogen (LN) tolerance, which could assist in the genetic improvement of NUE in foxtail millet.
3. Discussion
Nitrogen, as a key nutrient element for plant growth and development, plays a vital role in agricultural production. A lot of studies have shown that large genotypic variation of NUE exists in different crops [13-15, 44]. Significant variation of NUE was also shown among different foxtail millet varieties in our previous research [32, 45]. Foxtail millet has high infertility tolerance, especially under low-nitrogen conditions, and is considered to be an environmentally friendly crop [
24]. Therefore, it is important to understand the underlying regulatory mechanism of NUE in foxtail millet. In the present study, two previously selected foxtail millet varieties with contrasting NUE were used to identify the physiological and molecular mechanisms when responding to long-term low-nitrogen conditions, with the aim of providing more practical and meaningful theories for improving the NUE of foxtail millet.
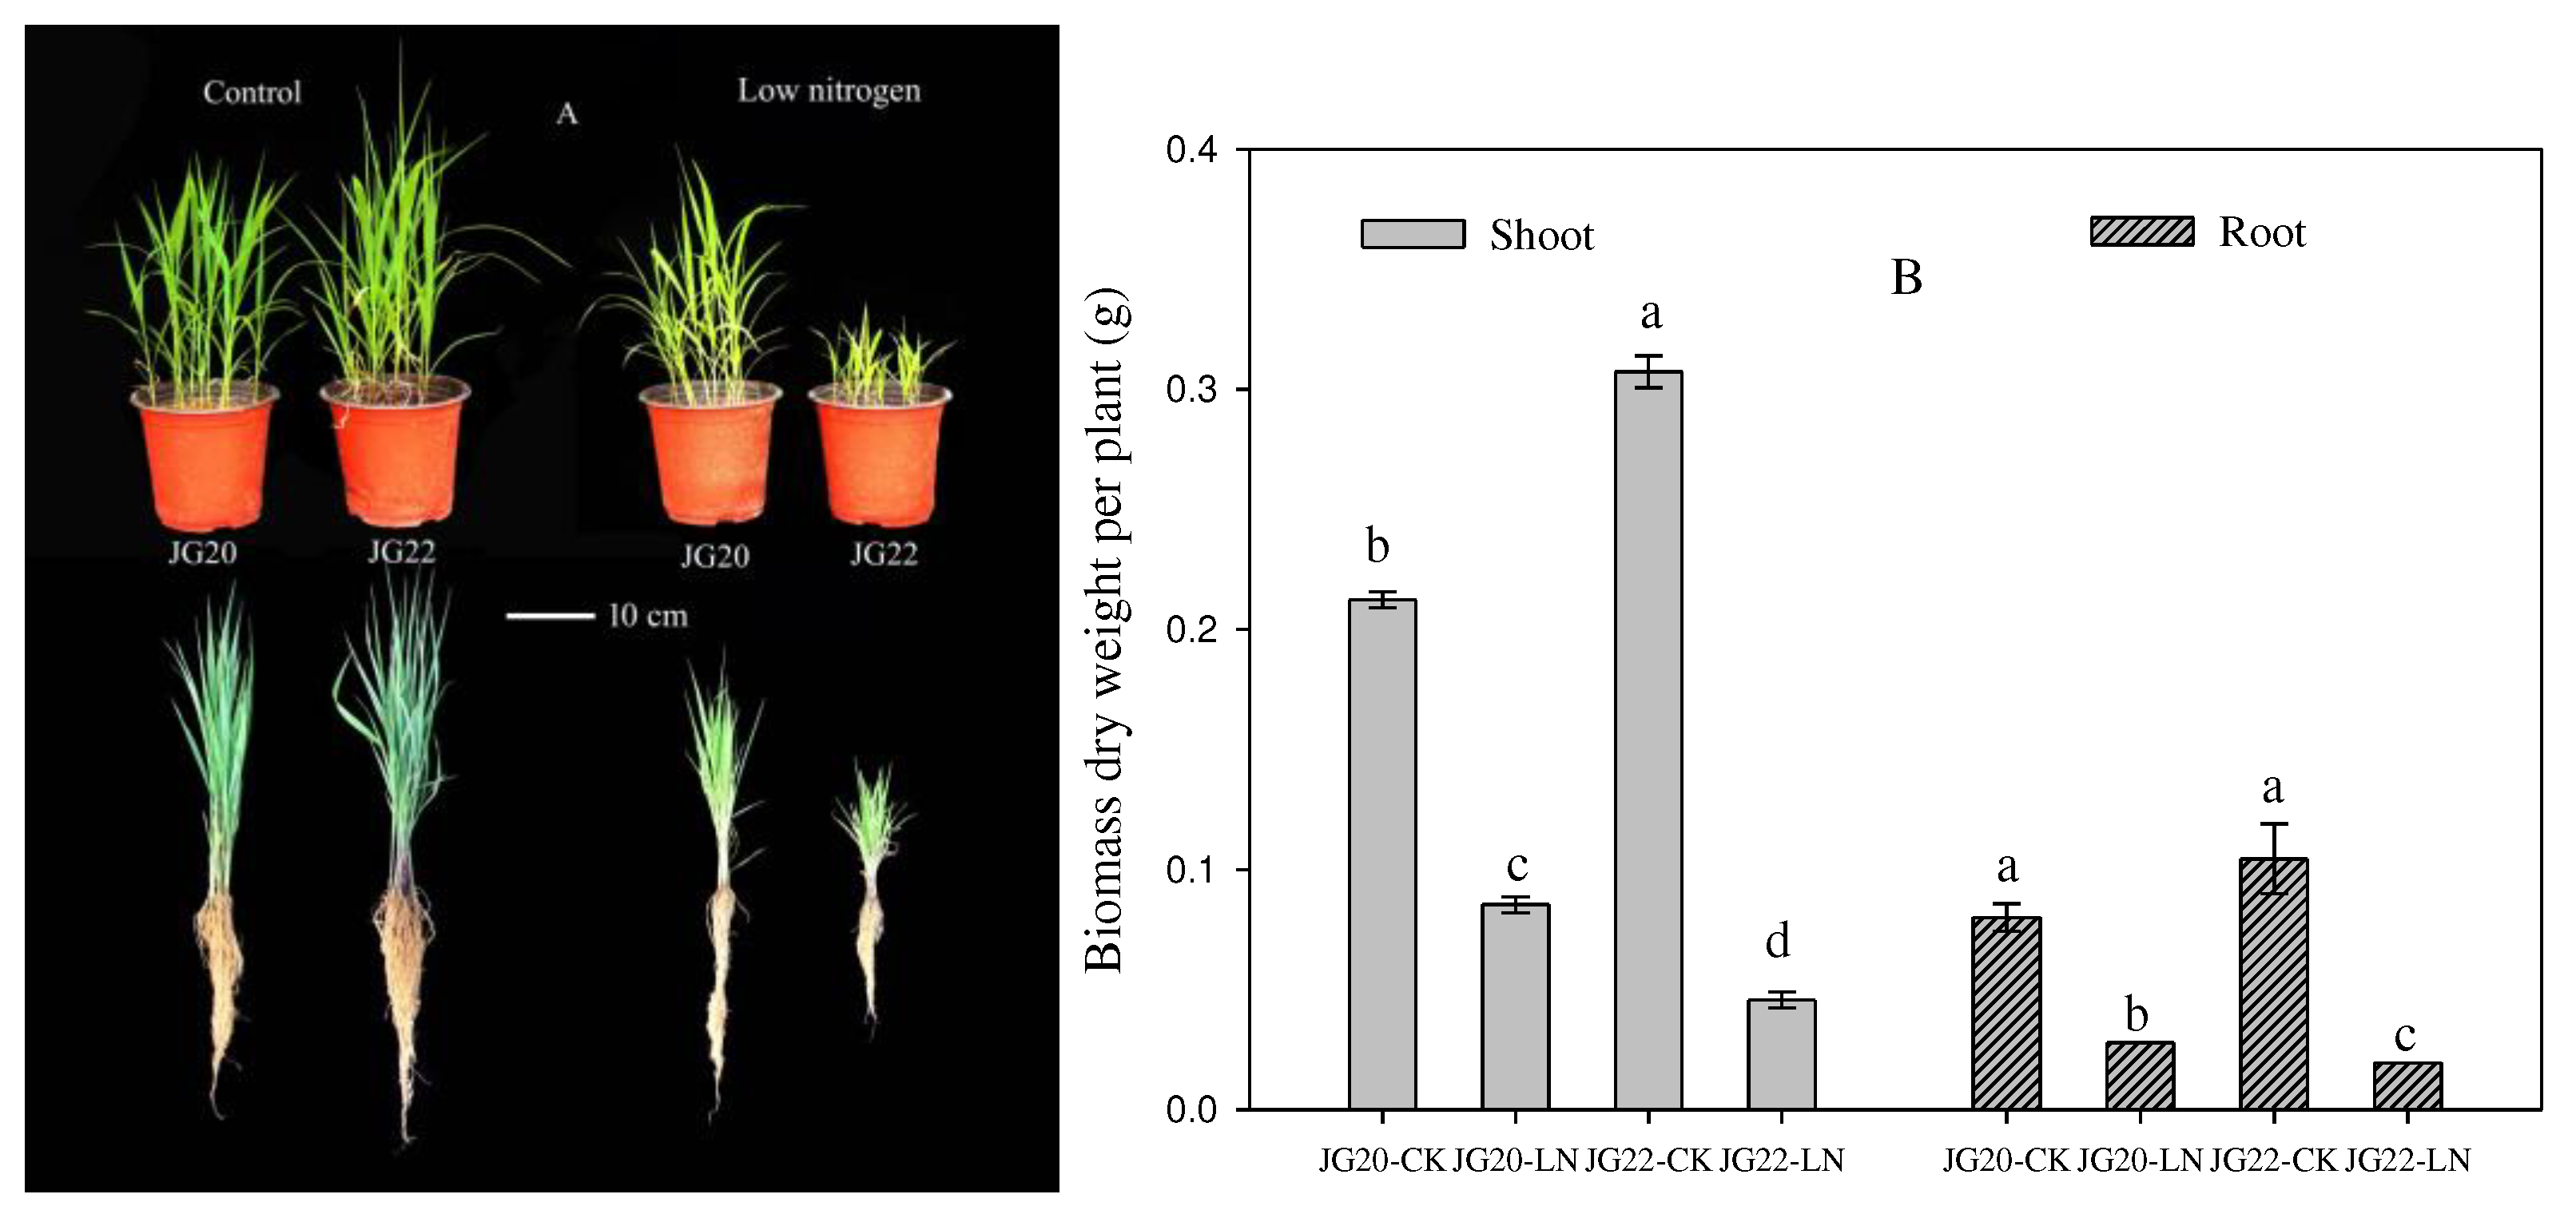
Consistent with studies in other crops inhibited by long-term LN [46-48], both the shoot and root growths of foxtail millet were restrained under long-term LN conditions in the present study (
Figure 1A,B), but this varied between varieties. The LN-tolerant variety JG20 had a superior shoot and root system compared to the LN-sensitive variety JG22 under long-term LN, indicating that JG20 had higher LN tolerance under long-term conditions. It has been reported that LN reduces foxtail millet growth, resulting in a considerably shorter root system and an increased root/shoot ratio [
27], which was verified in the LN-sensitive variety JG22 under LN conditions in the present study (
Figure 1A,
Supplementary Figure S1); however, the LN-tolerant variety JG20 had a longer root system and a decreased root/shoot ratio (
Figure 1A,
Supplementary Figure S1), indicating that the foxtail millet variety with higher nitrogen use had developed a longer root system as an obvious morphological response to N deficiency and increased the ratio of dry matter accumulation in the shoots under long-term LN.
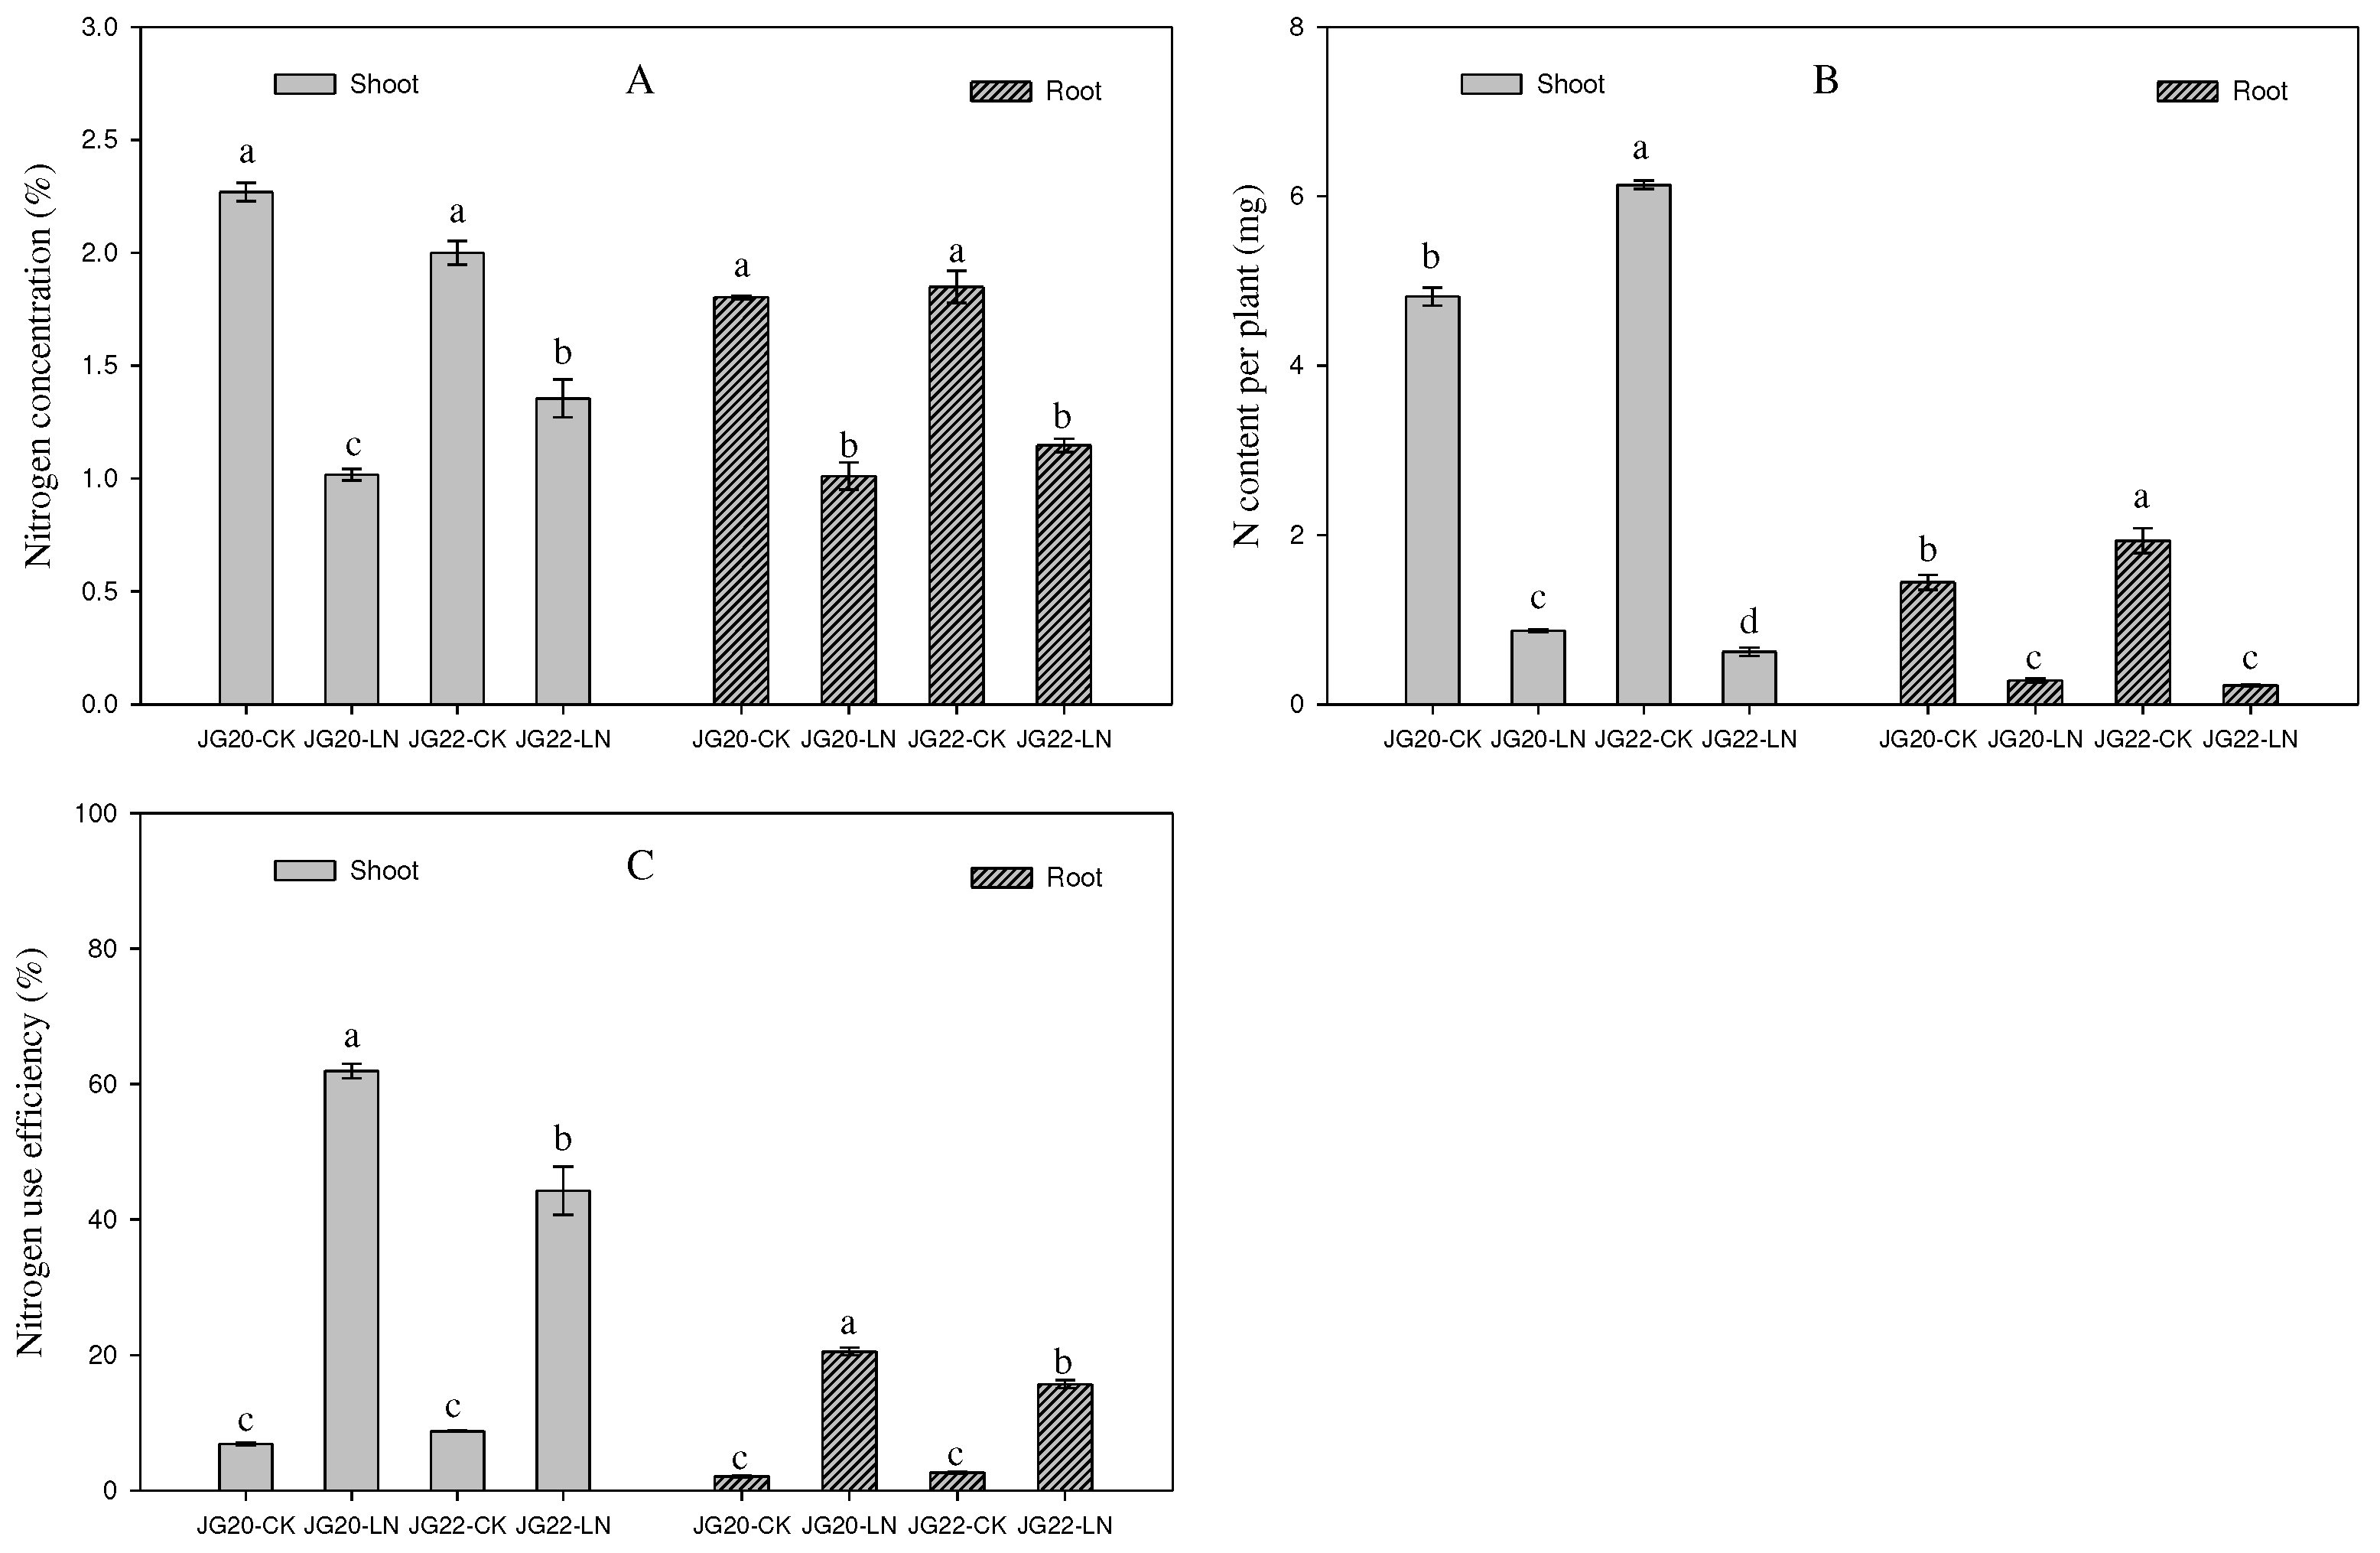
The N concentration and N content of two foxtail millet varieties were both significantly decreased in response to long-term low nitrogen (
Figure 2A,B), which was consistent with previous research. The N concentrations in the shoots and roots of the LN-sensitive variety JG22 was higher than in those of the LN-tolerant variety JG20 (
Figure 2A), while the N contents in the shoots and roots of the LN-sensitive variety JG22 were lower than in those of the LN-tolerant variety JG20 under LN conditions (
Figure 2B). This indicated that the LN-tolerant variety could use low N nitrogen concentrations to accumulate a large amount of dry matter in both shoots and roots, as is reflected in the high NPFP (
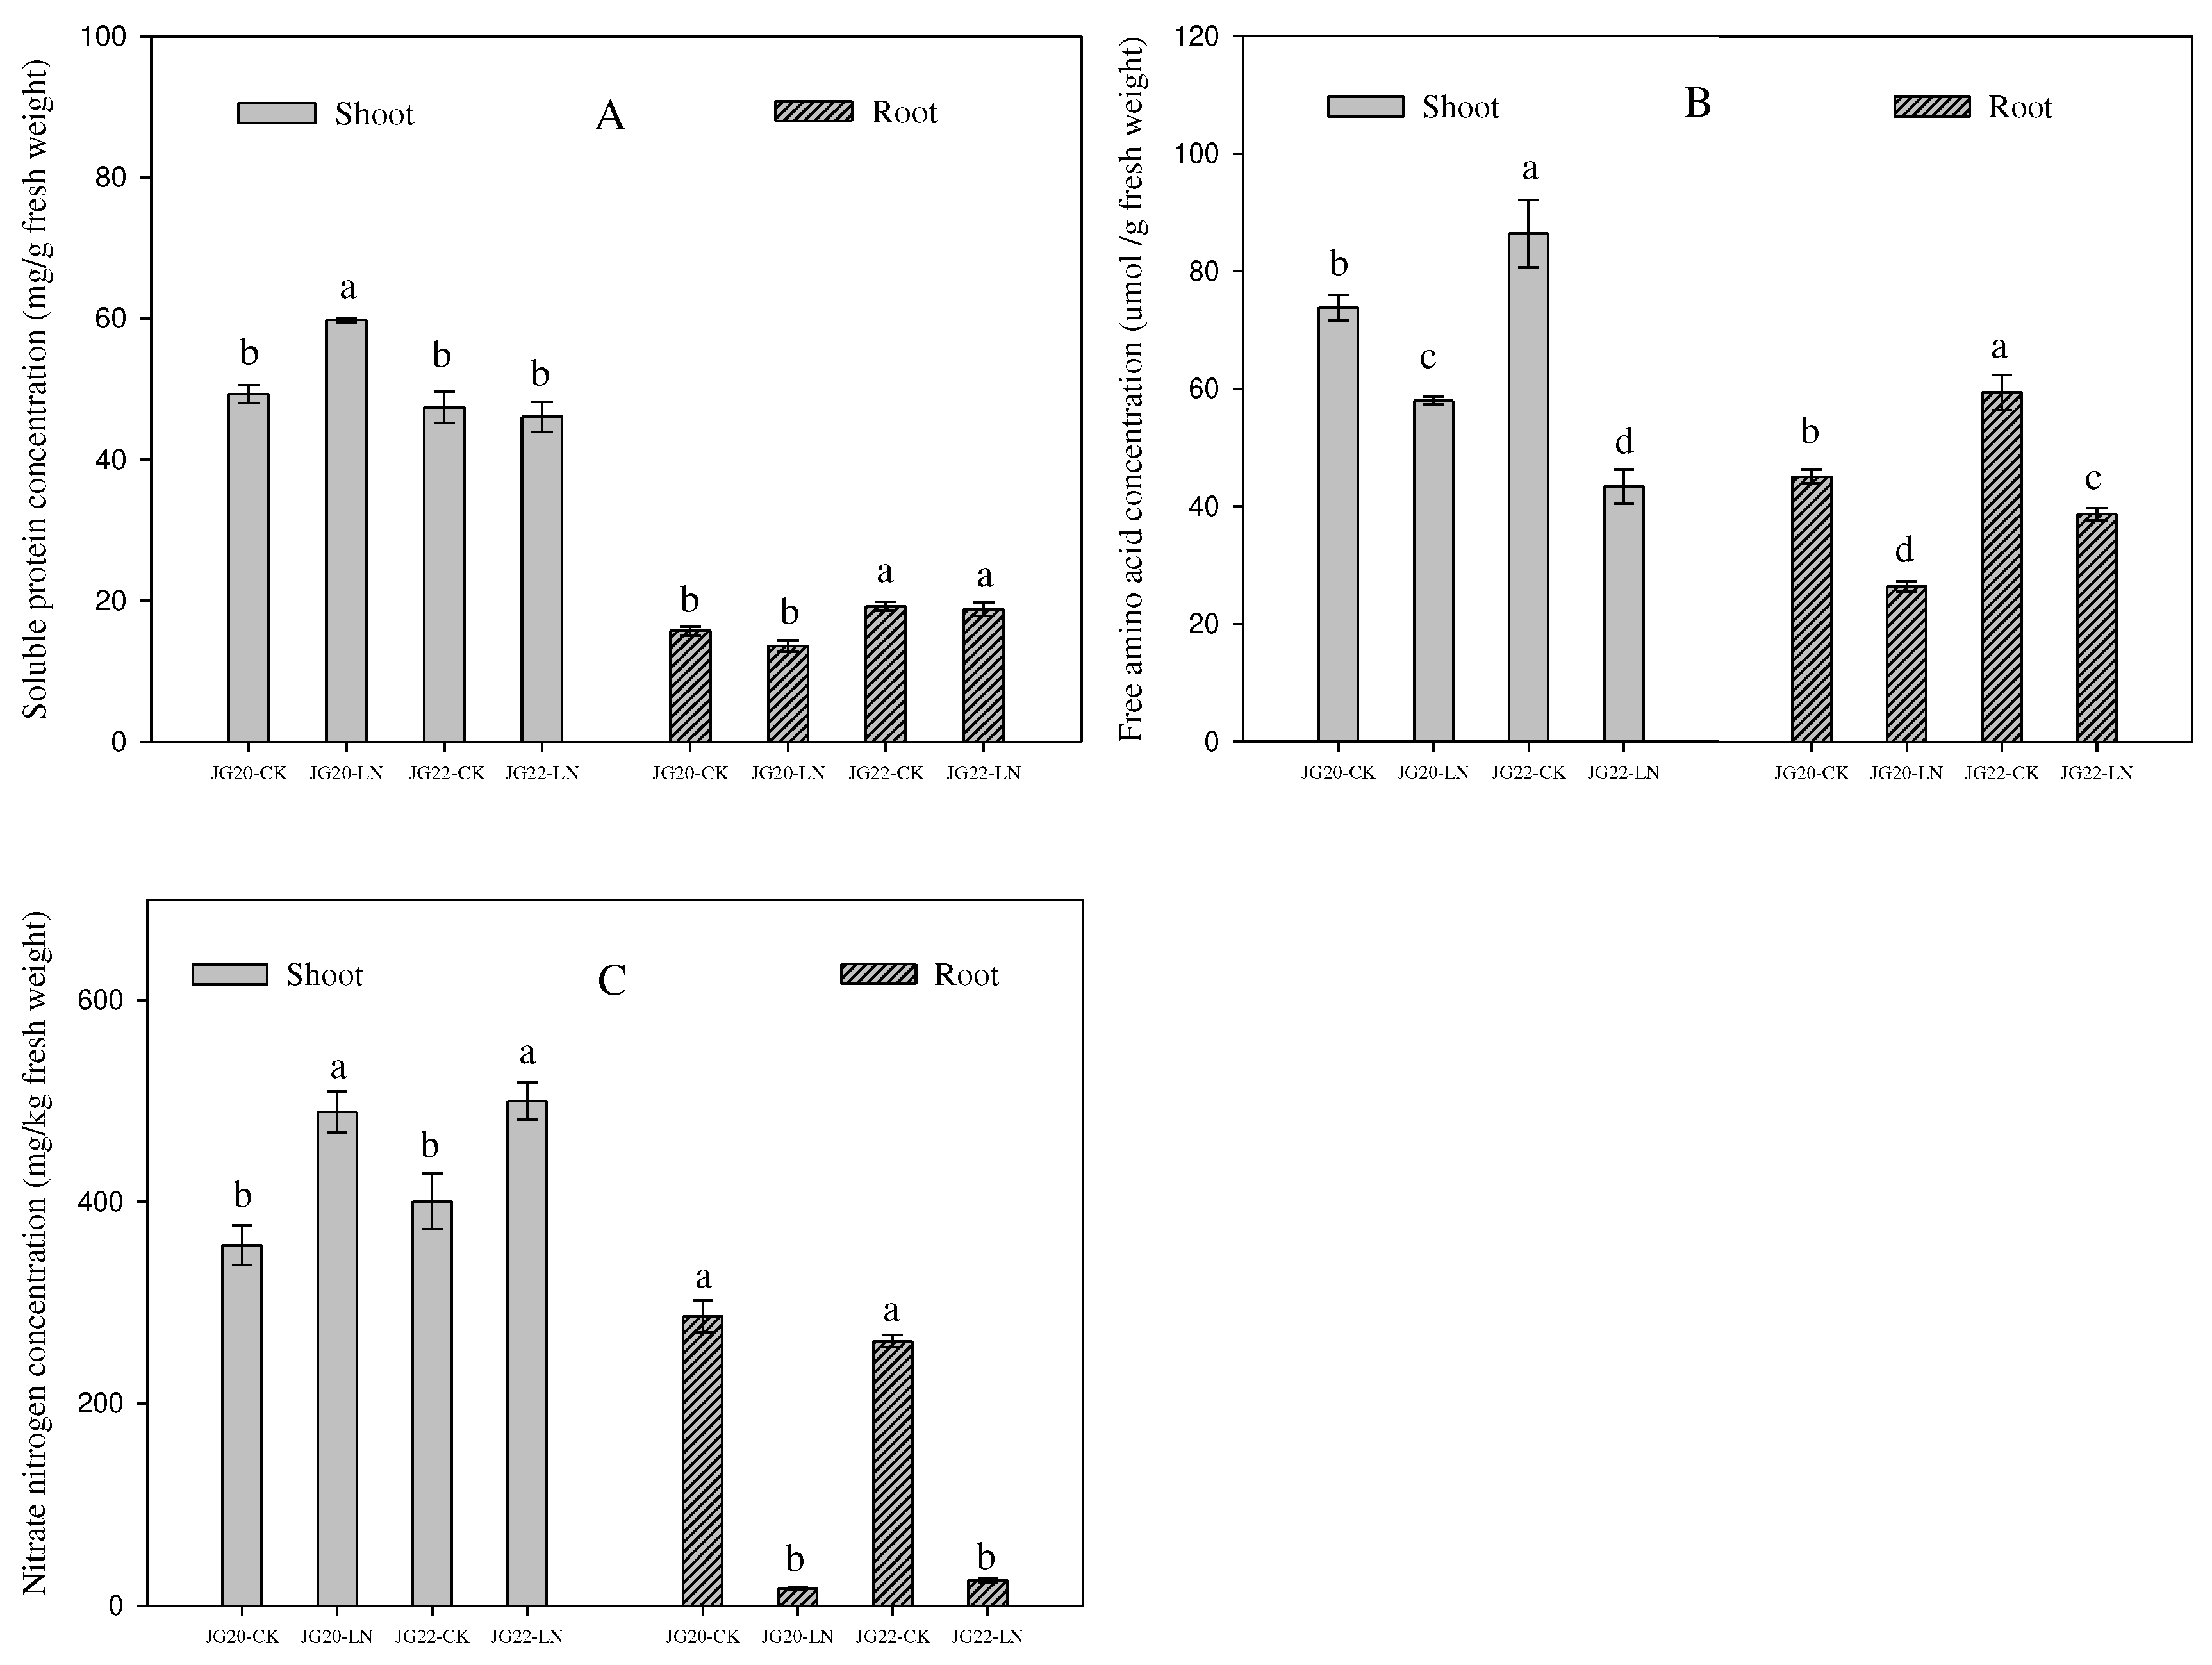
Figure 2C). As unexpected, the soluble protein of shoots and roots in the two varieties under LN conditions was equivalent to the control, and even the soluble protein of shoots in the LN-tolerant variety JG20 increased under LN conditions (
Figure 3A), which has also been found in early stages in maize ear and in foxtail millet root [27, 49]. This may indicate that foxtail millet could maintain normal soluble protein level to sustain various metabolic activities in response to LN, especially for the LN-tolerant variety. The free amino acid concentrations of the two varieties were both decreased in shoots and roots under LN (
Figure 3B), which was consistent with the previous findings in foxtail millet. The decrease of free amino acid can explain the equivalent soluble protein being synthesized by amino acid under LN condition. The LN-tolerant variety JG20 had higher free amino acid concentration in shoots, while it had lower free amino acid concentration in roots under LN conditions compared with control, indicating that the high-N-use foxtail millet variety can allocate more free amino acids to the shoot to ensure the N demand of photosynthetic apparatuses and other processes under low-nitrogen conditions, which was consistent, and was verified by the fact that the nitrate concentration as a nitrogen source was significantly increased in the shoots and decreased in the roots in both foxtail millet varieties in response to long-term low nitrogen (
Figure 3C).
Hormones play an important role in regulating plant development, growth, and adaptation to environmental stress [
50]. Auxin regulates cell division, elongation, and differentiation during plant development and growth, and is also important in N signaling [51, 52]. In the present study, the auxin concentration (IAA) and zeatin concentrations were significantly lower in the shoots and roots under LN (
Figure 4C,D), leading to smaller shoot and root systems under LN (
Figure 1A,B). This is consistent with findings in maize [
49] and in foxtail millet [
27]. ABA accumulation could be an essential hormonal regulatory mechanism for N limitation, and can restrain growth in foxtail millet [
27]. ABA concentration increased in the shoots of the LN-tolerant variety JG20 and decreased in the roots of both varieties (
Figure 4E). When comparing the two varieties, the LN-sensitive variety JG22 had higher ABA concentrations in both shoots and roots compared with the LN-tolerant variety JG20, which could explain why the LN-tolerant variety was able to develop well under LN conditions.
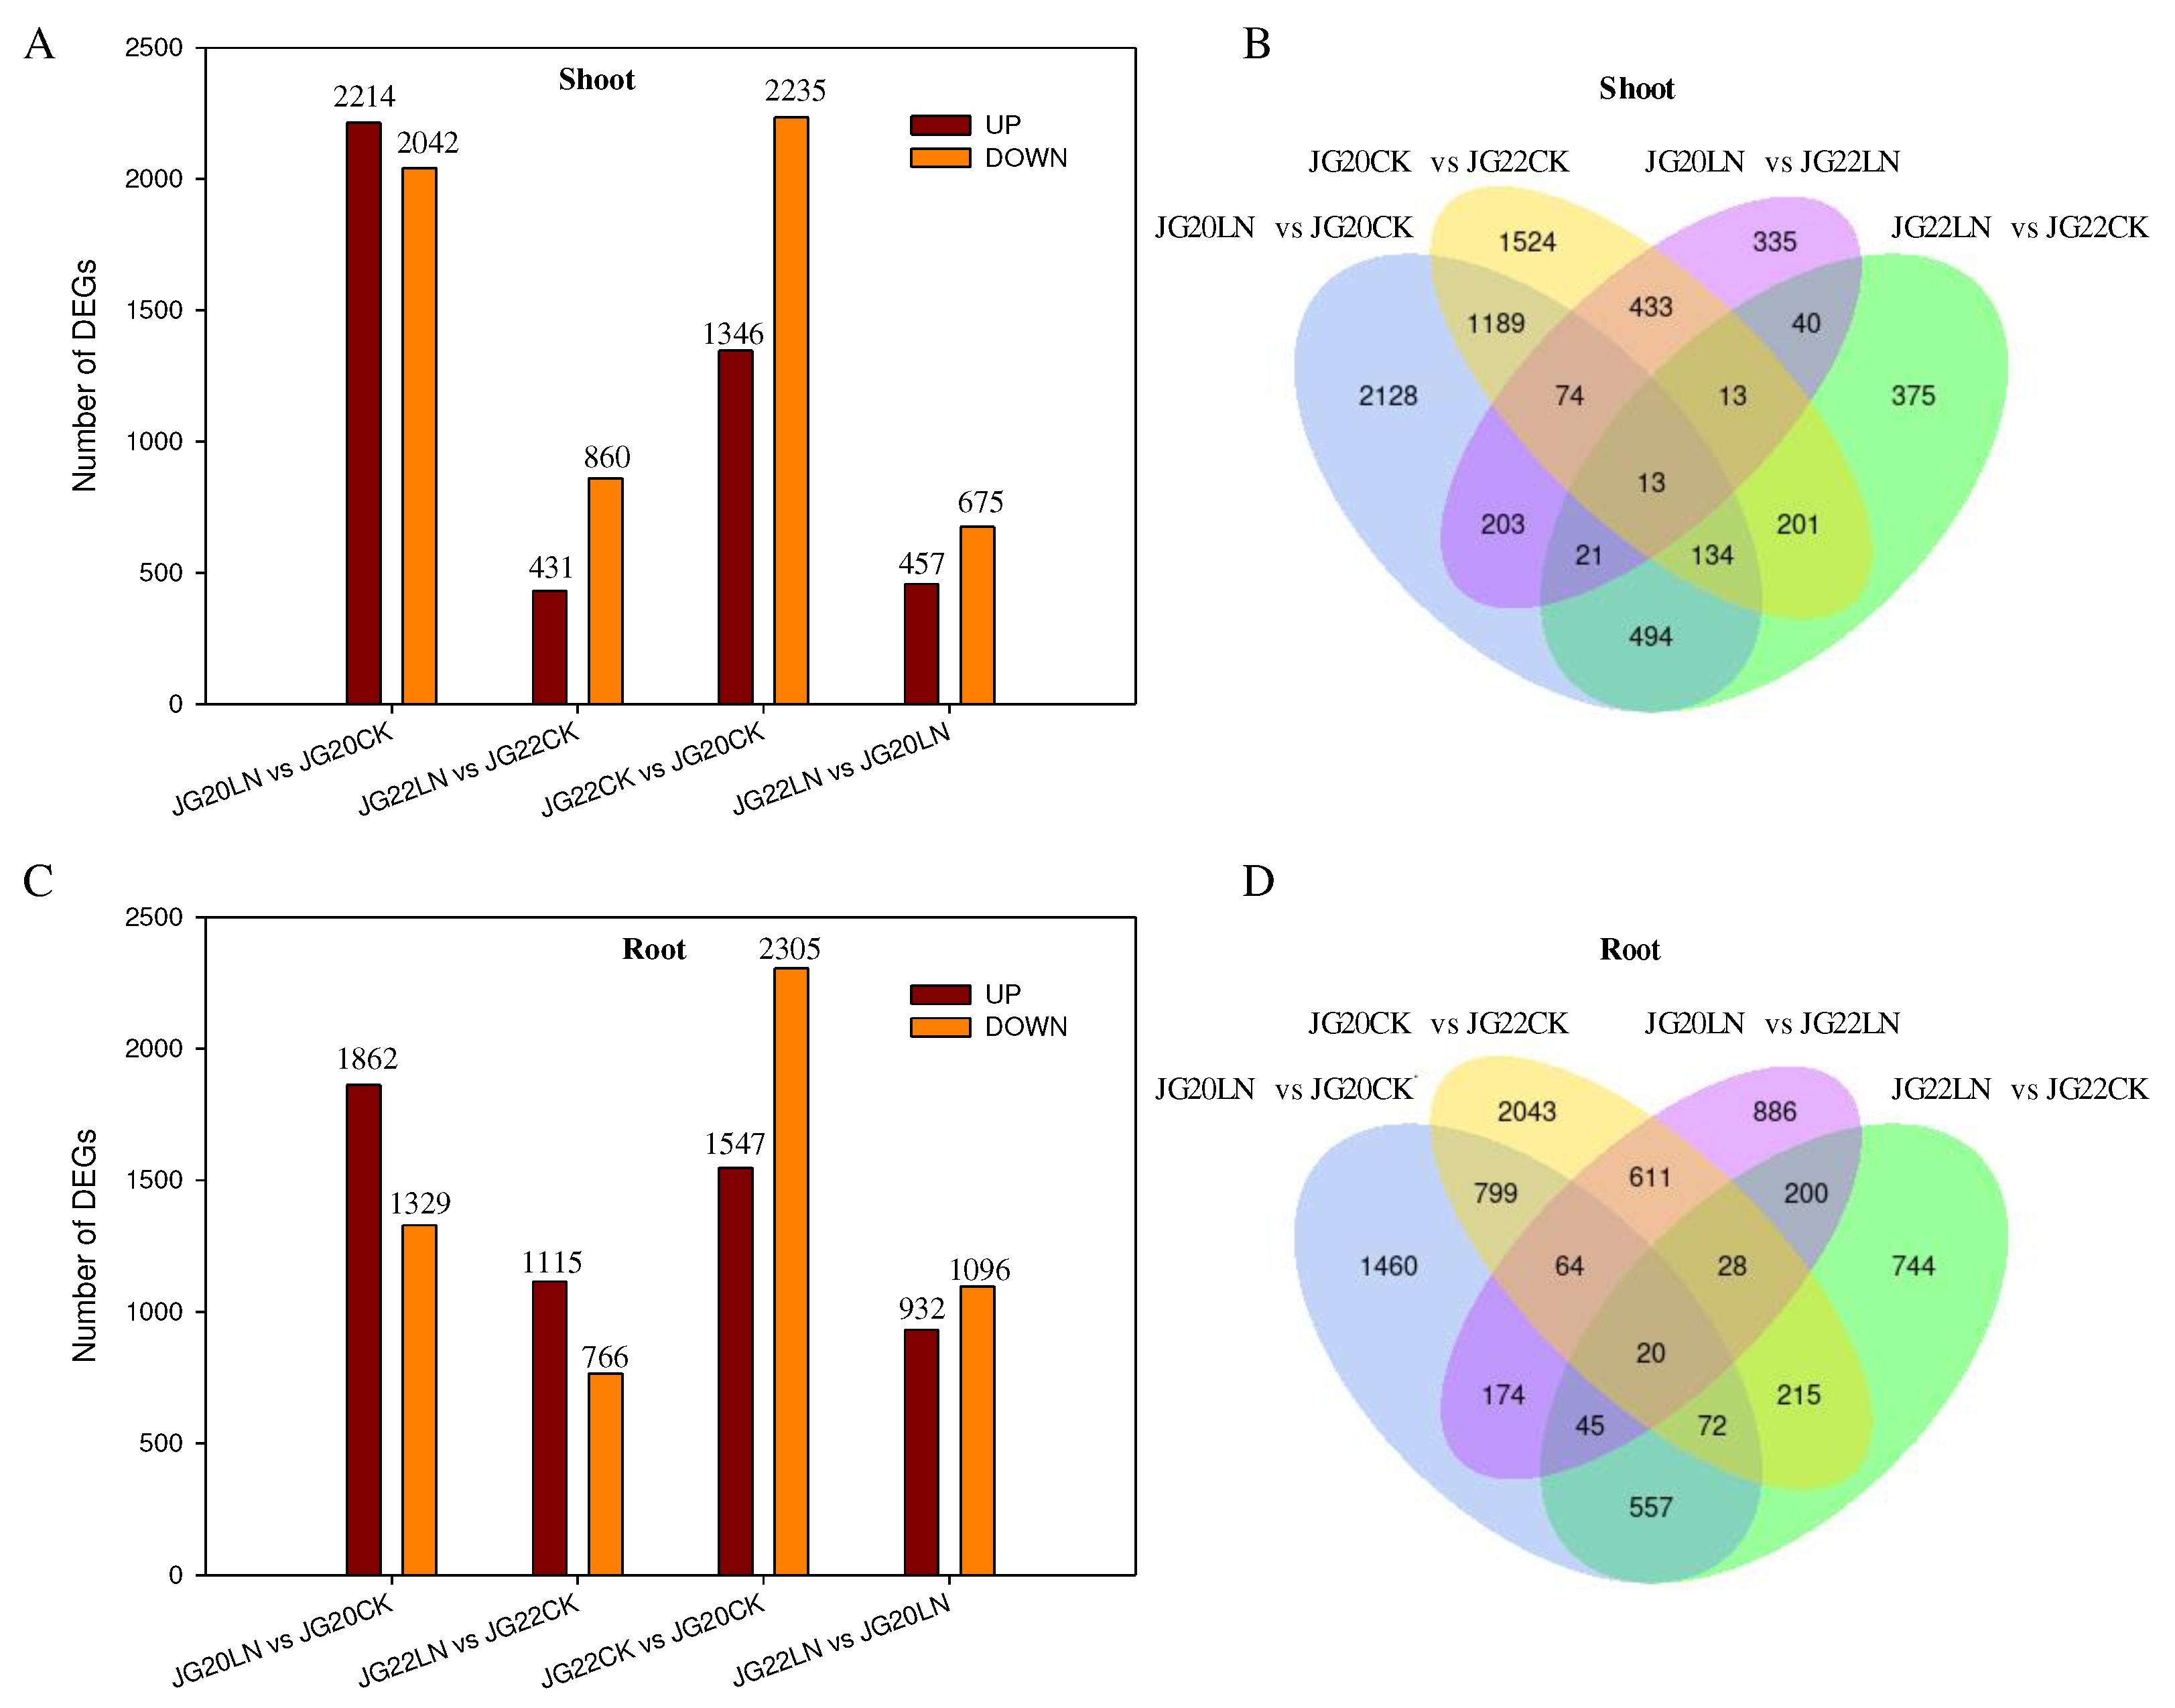
To advance our understanding of the molecular mechanisms responding to long-term LN in foxtail millet, we performed a comparative transcriptional analysis between the two varieties with contrasting NUE using RNA-Seq. More than 10,400 DEGs were identified that responded to LN for the two varieties. The analysis of expression patterns during long-term N-deficient conditions between the two varieties revealed an abundant diversity in gene expression, indicating that these stress-responsive genes may play functional roles in the N stress tolerance of foxtail millet. The LN-tolerant variety had a greater number of DEGs than the LN-sensitive variety in response to long-term LN, indicating that the LN-tolerant variety was able to activate more responding genes, thus having a relatively stronger ability to adapt to N deficiency than the LN-sensitive variety. Among these DEGs, only a small number of DEGs (515 DEGs in the shoots and 602 DEGs in the roots) were represented in both varieties, without considering the variance in genotype with respect to response to LN, which showed that there existed large differences in molecular genotypic variation in response to LN.
The interaction between the metabolisms of C and N determines plant growth and development [
53], and soluble sugars such as sucrose, glucose and fructose, which function as an energy source in plants, ply an important role in various physiological and biological processes, including growth, development and stress response [
54]. In this research, genes encoding several enzymes in the metabolism of starch, sucrose and glycolysis were significantly induced in response to LN in the two foxtail millet varieties. A large number of genes encoding soluble sugars such as beta-glucosidase, glucanotransferase, and sucrose-phosphatase were up-regulated in both the shoots and roots of the two varieties (
Supplementary Table S4), and the numbers of up-regulated genes in the shoots of the LN-tolerant variety JG20 were significantly higher than in the LN-sensitive variety JG22 (
Supplementary Table S4), which is consistent with the increased soluble sugar and sucrose concentration in the shoots of JG20 under LN (
Figure 4A,B). The ratio of up-regulated genes to total DEGs in the roots of JG22 was higher than that in the roots of JG20, which was verified by the higher soluble sugar and sucrose concentrations in the roots of JG22 compared with in JG20 (
Figure 4A,B). In shoot, downregulation of most DEGs under LN are detected, while TIM, PGK, PCK and ALDH are up-regulated in two varieties, especially in JG20 (
Figure 10C,
Supplementary Table S7). AEP, ATP-PFK, PDH-E2 and DLD are up-regulated under LN in roots of two varieties (
Figure 10C,
Supplementary Table S7). This indicated that enhancing the synthesis and accumulation of soluble sugars, and glycolysis metabolism in shoots under LN could be an important trait for high-nitrogen-use foxtail millet, and an important pathway for improving LN tolerance in foxtail millet.
A large number of studies have shown that the synthesis of plant hormones is tightly regulated in response to stresses [50, 55], and genes encoding hormones have been reported to be regulated by LN stress [
56]. Genes encoding indole-3-acetic acid synthesis and zeatin, such as indole-3-acetic acid-amido synthetase, auxin-responsive protein, and histidine-containing phosphotransfer protein, were down-regulated in both varieties in response to N deficiency (
Supplementary Table S6), which was consistent with the decrease in indole-3-acetic acid and zeatin concentration under LN (
Figure 4C,D). The ABA concentrations in both varieties were increased in response to LN (
Figure 4E), which could be explained by the up-regulated genes of abscisic acid receptor in foxtail millet in response to LN (
Supplementary Table S6).
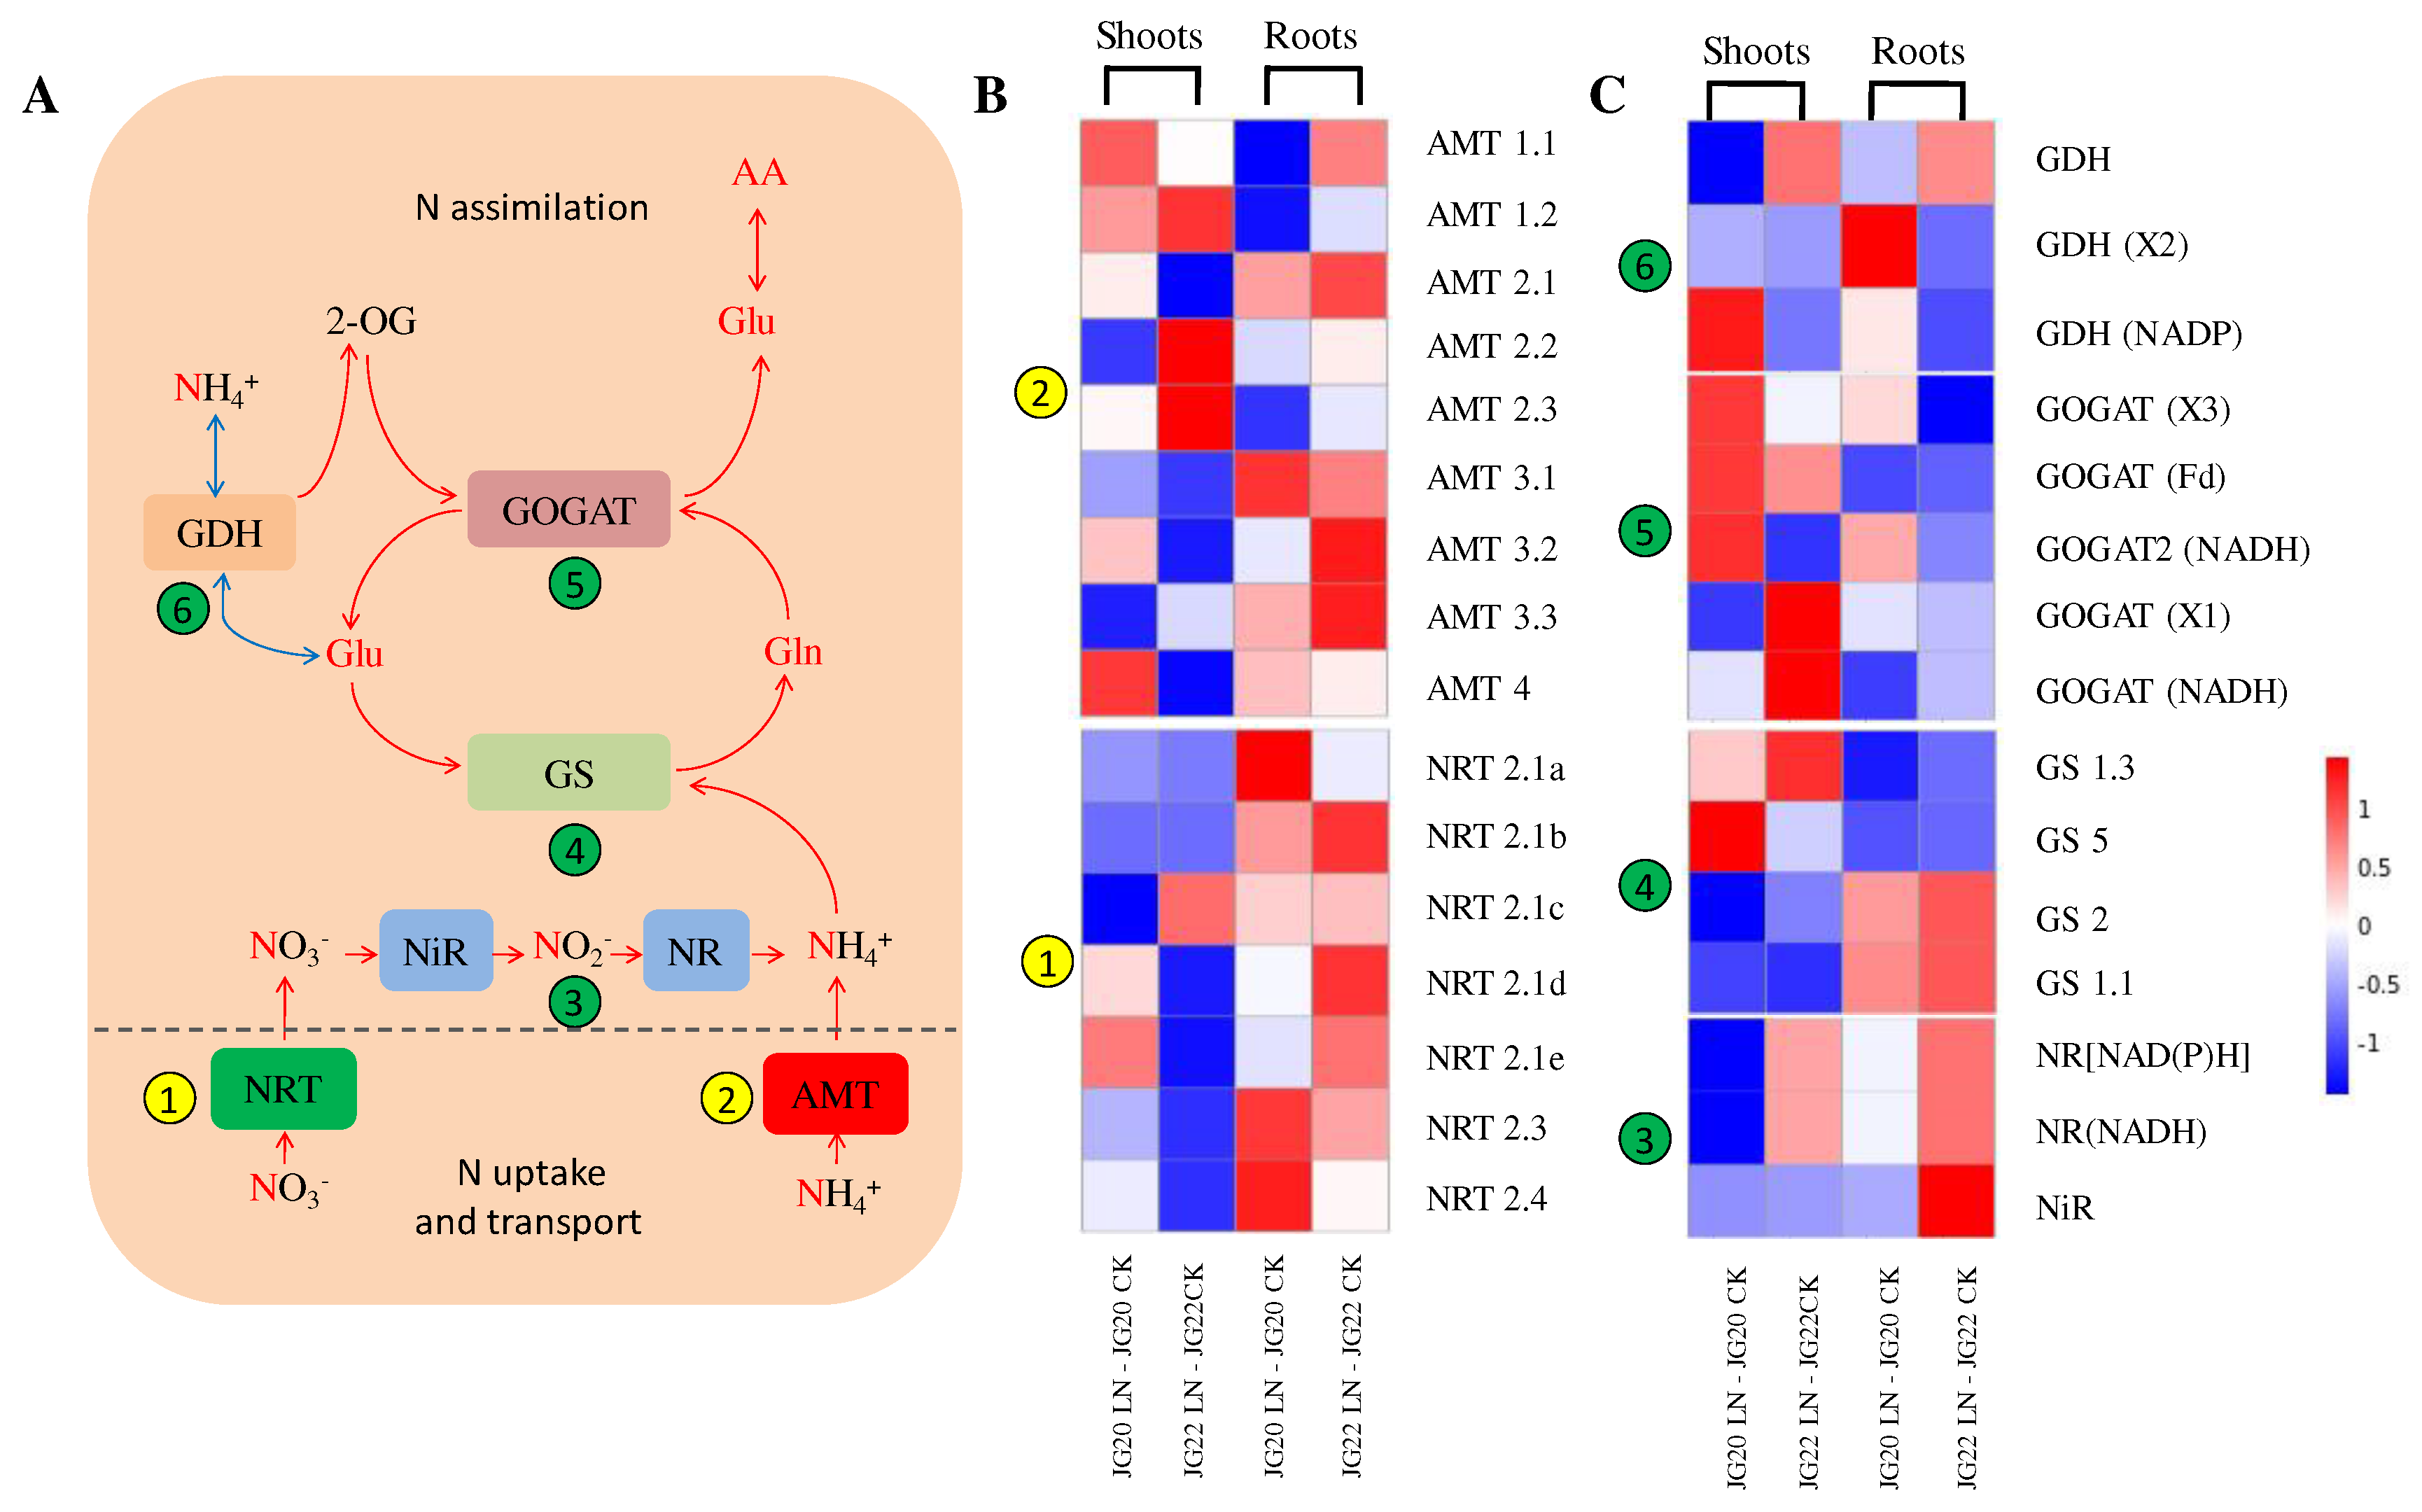
Nitrogen metabolism, comprising both N acquisition and transport, and N assimilation, was more directly affected by LN. Nitrate transporters and ammonium transporters are two important transport systems for nitrogen uptake [
57]. In the current research, high-affinity nitrate transporters genes NRT2.3 and NRT2.4 were only up-regulated in the shoots and roots of the LN-tolerant variety JG20 in response to long-term LN, and ammonium transporter gene AMT3.2 was only up-regulated in the shoots of the LN-tolerant variety JG20 under N deficiency, whereas that in the LN-sensitive variety JG22 was consistent or slightly decreased in response to low-nitrogen conditions (
Figure 9B). This indicated that high-affinity nitrate transporter genes NRT2.3 and NRT2.4, as well as ammonium transporter gene AMT3.2, may play important roles in high nitrogen transport in the LN-tolerant foxtail millet variety in response to N deficiency. The GS/GOGAT cycle, as the main pathway of nitrogen assimilation [58, 59], is considered to be an important potential maker for selecting high-NUE genotypes in wheat [
60]. In the present result, GS5, GOGAT (X3) and GOGAT2 (NADH) were significantly up-regulated in the shoots of JG20 in response to LN (
Figure 9C), which showed that these genes can play a vital role in nitrogen assimilation in LN-tolerant foxtail millet in response to LN. Glutamate dehydrogenase (GDH) can catalyze the exchange between NH4
+ and glutamate, and play a small role in nitrogen assimilation [11, 61] (
Figure 9A). The GDH genes in the shoots of the LN-tolerant variety JG20 was significantly down-regulated under LN, which is consistent with the findings in high-NUE wheat [
11]. This showed that nitrogen assimilation in the high-NUE genotype may be more dependent on the GS/GOGAT cycle.
TFs regulating the expression of other genes in metabolic pathways [
62] have been reported to be involved in the regulation of nitrogen metabolism [
22,
63]. It has been reported that MYB-like TFs play an important role in response to low-nitrogen stress in foxtail millet [
31]. In the present study, lots of TFs were involved in regulating metabolism in response to LN, and there existed differentially expressed patterns of TFs in both varieties (
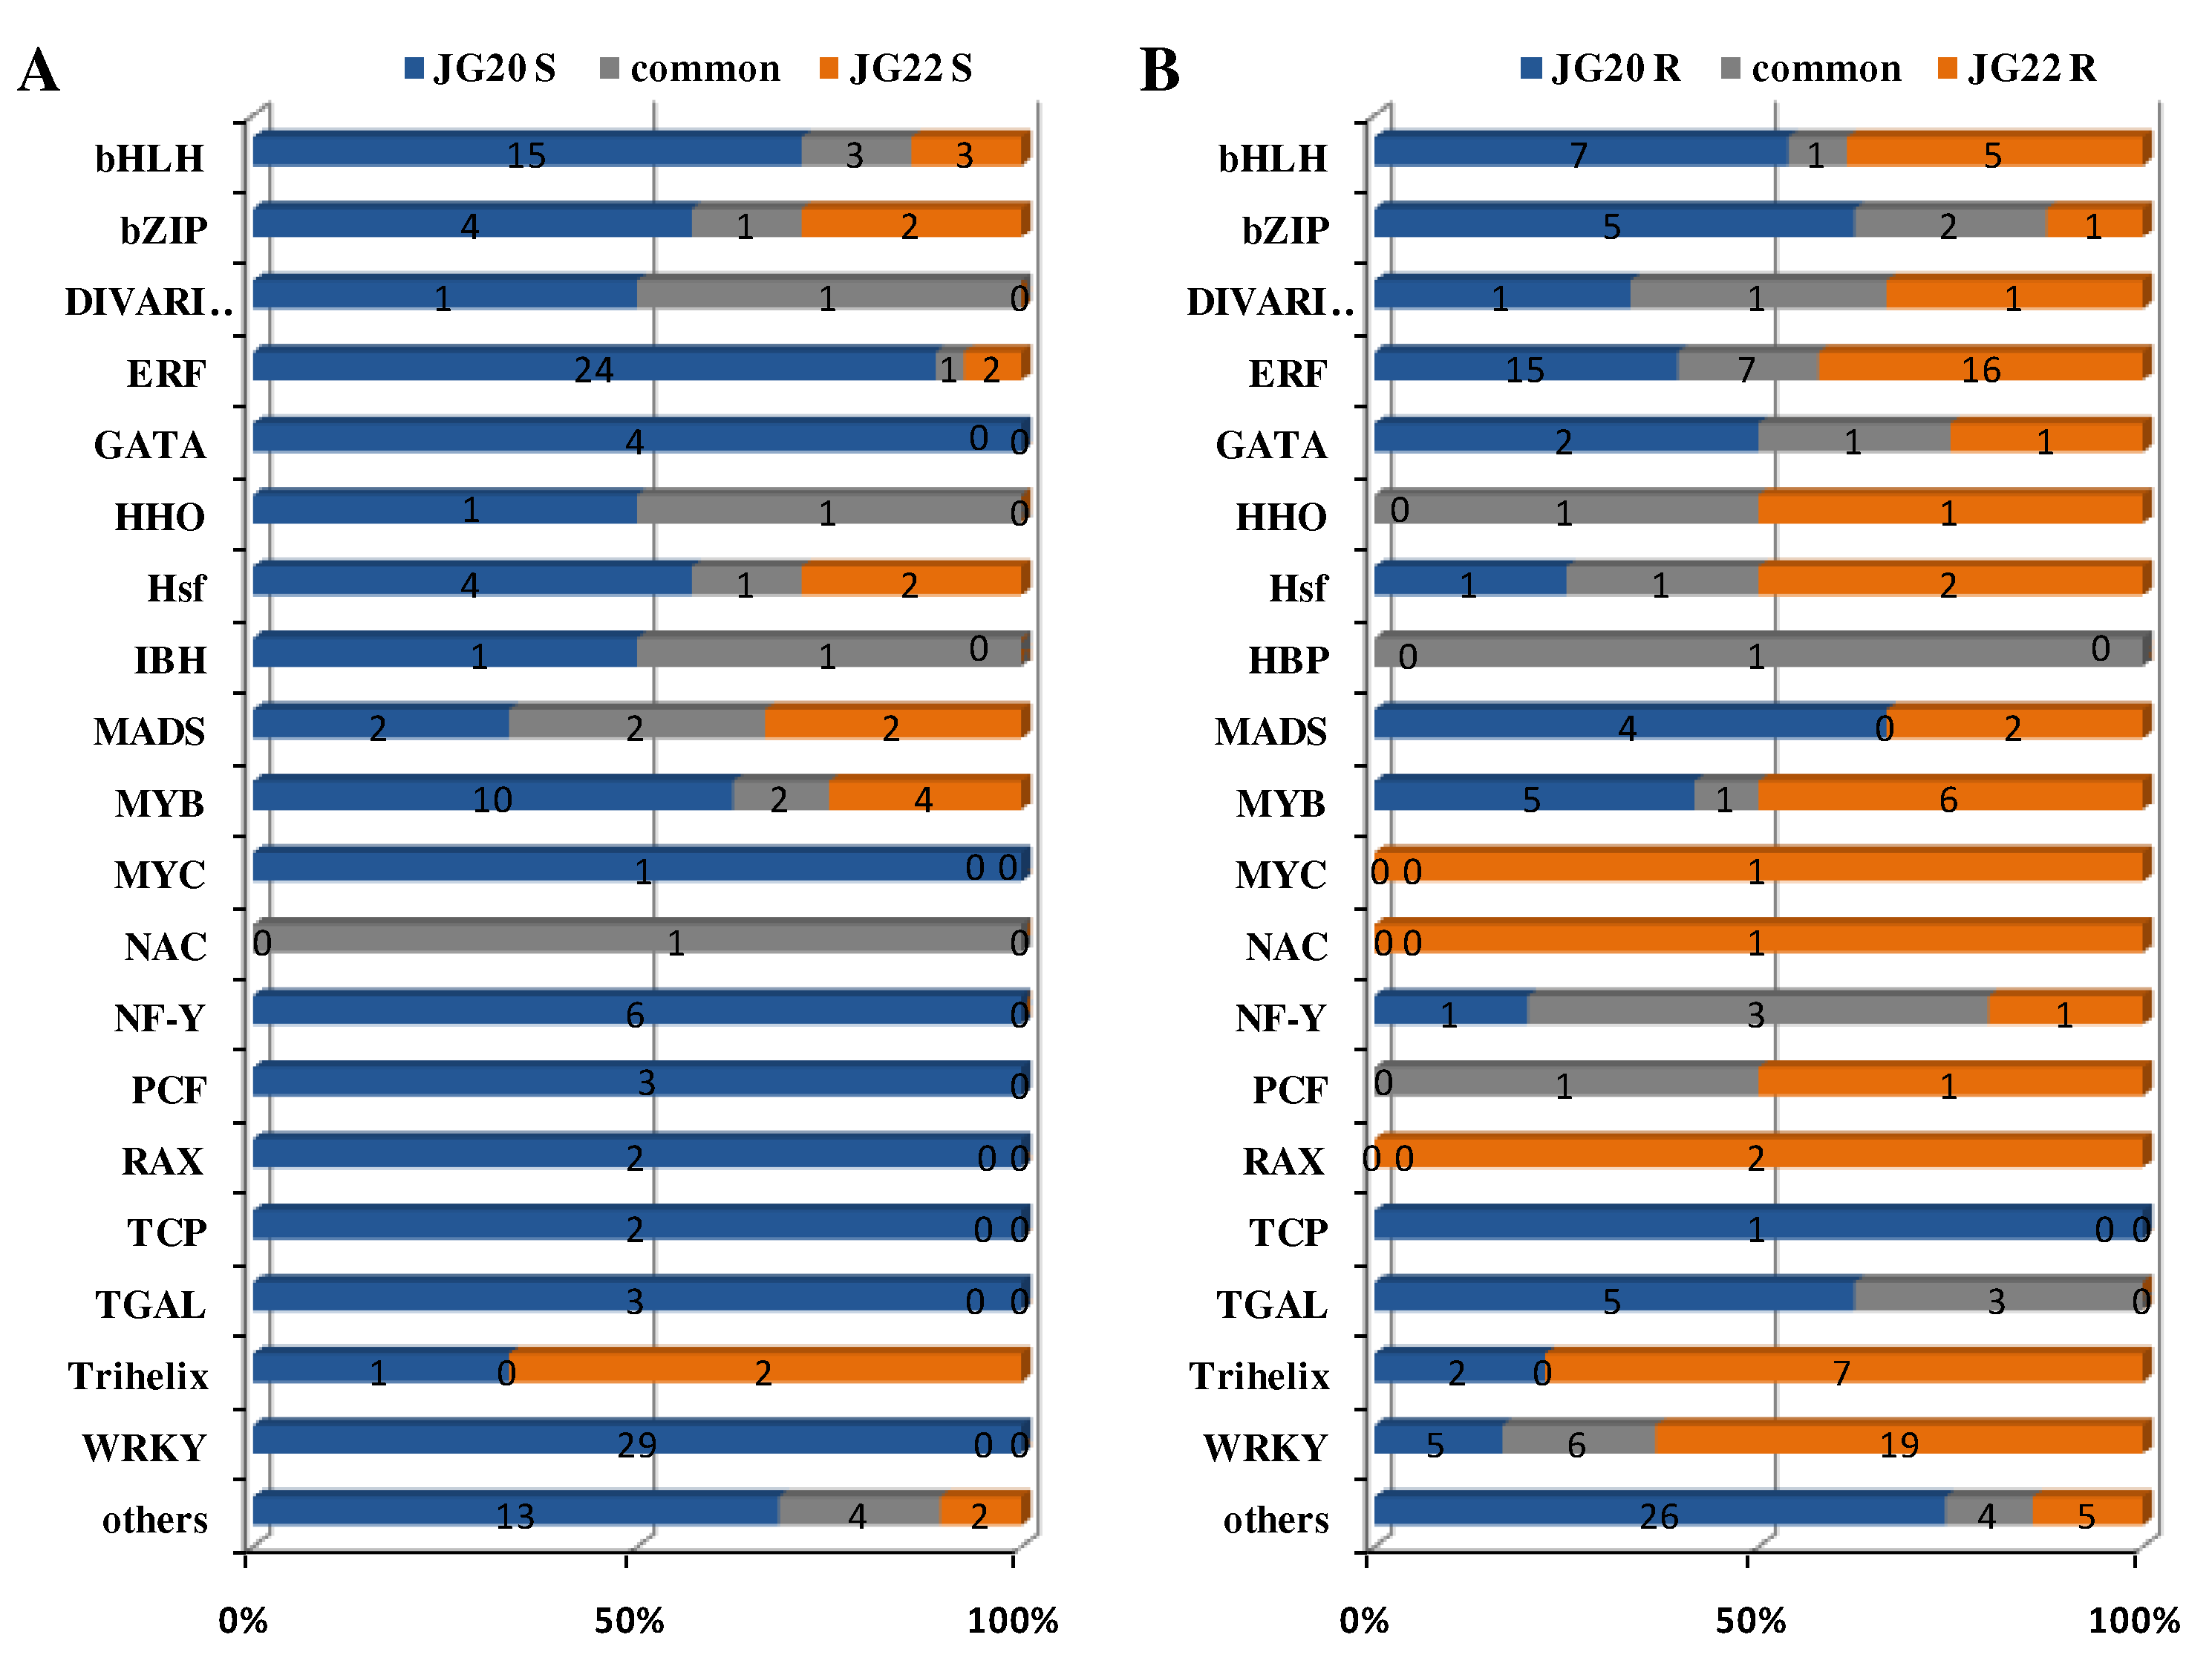
Figure 10A). TFs belonging to the WRKY (20.1%), ethylene-responsive transcription factor (EFR; 17.4%), bHLH (12.5%) and MYB (8.3%) families were the most abundant in the shoots of the LN-tolerant variety JG20, while those belonging to the MYB (16.2%), bHLH (16.2%) and MADS (10.8%) families were the top TFs in the shoots of the LN-sensitive variety JG22 (
Figure 10A,
Supplementary Table S3), which indicated that WRKY and EFR TFs may play vital roles in regulating the responses of foxtail millet to N deficiency for the LN-tolerant foxtail millet variety. bHLH (16.7%), MYB (11.1%) and MADS (11.1%) families in shoots and EFR (21.2%) and WRKY (23.8%) families in roots were the most commonly expressed TFs in both varieties, showing that these TFs play roles in roots that are independent of foxtail millet genotype.
Figure 1.
Effect of low nitrogen on phenotypic characteristics and biomass of two foxtail millet varieties with different low-nitrogen tolerance. JG20-CK, JG20 under control; JG20-LN, JG20 under low nitrogen; JG22-CK, JG22 under control; JG22-LN, JG22 under low nitrogen. (A) Phenotypic characteristics of JG20 and JG22 under control and low-nitrogen conditions; Bar = 10cm. (B) Biomass of shoots and roots of JG20 and JG22 under control and low-nitrogen conditions. Error bars represent standard error of three biological replicates; different lowercase letters indicate significance at the level of P<0.05 between different treatments and varieties inshoots and roots.
Figure 2.
Effect of low nitrogen on N concentration, N content, and N use efficiencyof two foxtail millet varieties with different low-nitrogen tolerances. JG20-CK, JG20 under control; JG20-LN, JG20 under low nitrogen; JG22-CK, JG22 under control; JG22-LN, JG22 under low nitrogen. (A) Nitrogen concentration of shoots and roots of JG20 and JG22 under control and low-nitrogen conditions. (B) Nitrogen content of shoots and roots of JG20 and JG22 under control and low-nitrogen conditions. (C) Nitrogen partial productivity of shoots and roots of JG20 and JG22 under control and low-nitrogen conditions. Error bars represent standard error of three biological replicates; different lowercase letters indicate significance at the level of P<0.05 between different treatments and varieties in shoots and roots.
Figure 3.
Effect of low nitrogen on soluble protein concentration, free amino acid concentration and nitrate nitrogen concentration of two foxtail millet varieties. JG20-CK, JG20 under control; JG20-LN, JG20 under low nitrogen; JG22-CK, JG22 under control; JG22-LN, JG22 under low nitrogen. (A) Soluble protein concentration of shoots and roots of JG20 and JG22 under control and low-nitrogen conditions. (B) Free amino acid concentration of shoots and roots of JG20 and JG22 under control and low-nitrogen conditions. (C) Nitrate nitrogen concentration of shoots and roots of JG20 and JG22 under control and low-nitrogen conditions. Error bars represented standard error of three biological replicates; different lowercase letters indicate significance at the level of P<0.05 between different treatments and varieties in shoots and roots.
Figure 4.
Effect of low nitrogen on soluble sugar concentration, sucrose concentration, indole-3-acetic acid concentration, zeatin concentration and abscisic acid concentration of two foxtail millet varieties with different low-nitrogen tolerance. JG20-CK, JG20 under control; JG20-LN, JG20 under low nitrogen; JG22-CK, JG22 under control; JG22-LN, JG22 under low nitrogen. (A) Soluble sugar concentration of shoots and roots of JG20 and JG22 under control and low-nitrogen conditions. (B) Sucrose concentration of shoots and roots of JG20 and JG22 under control and low-nitrogen conditions. (C) Indole-3-acetic acid concentration of shoots and roots of JG20 and JG22 under control and low-nitrogen conditions. (D) Zeatin concentration of shoots and roots of JG20 and JG22 under control and low-nitrogen conditions. (E) Abscisic acid concentration of shoots and roots of JG20 and JG22 under control and low-nitrogen conditions. Error bars represented standard error of three biological replicates; different lowercase letters indicate significance at the level of P<0.05 between different treatments and varieties in shoots and roots.
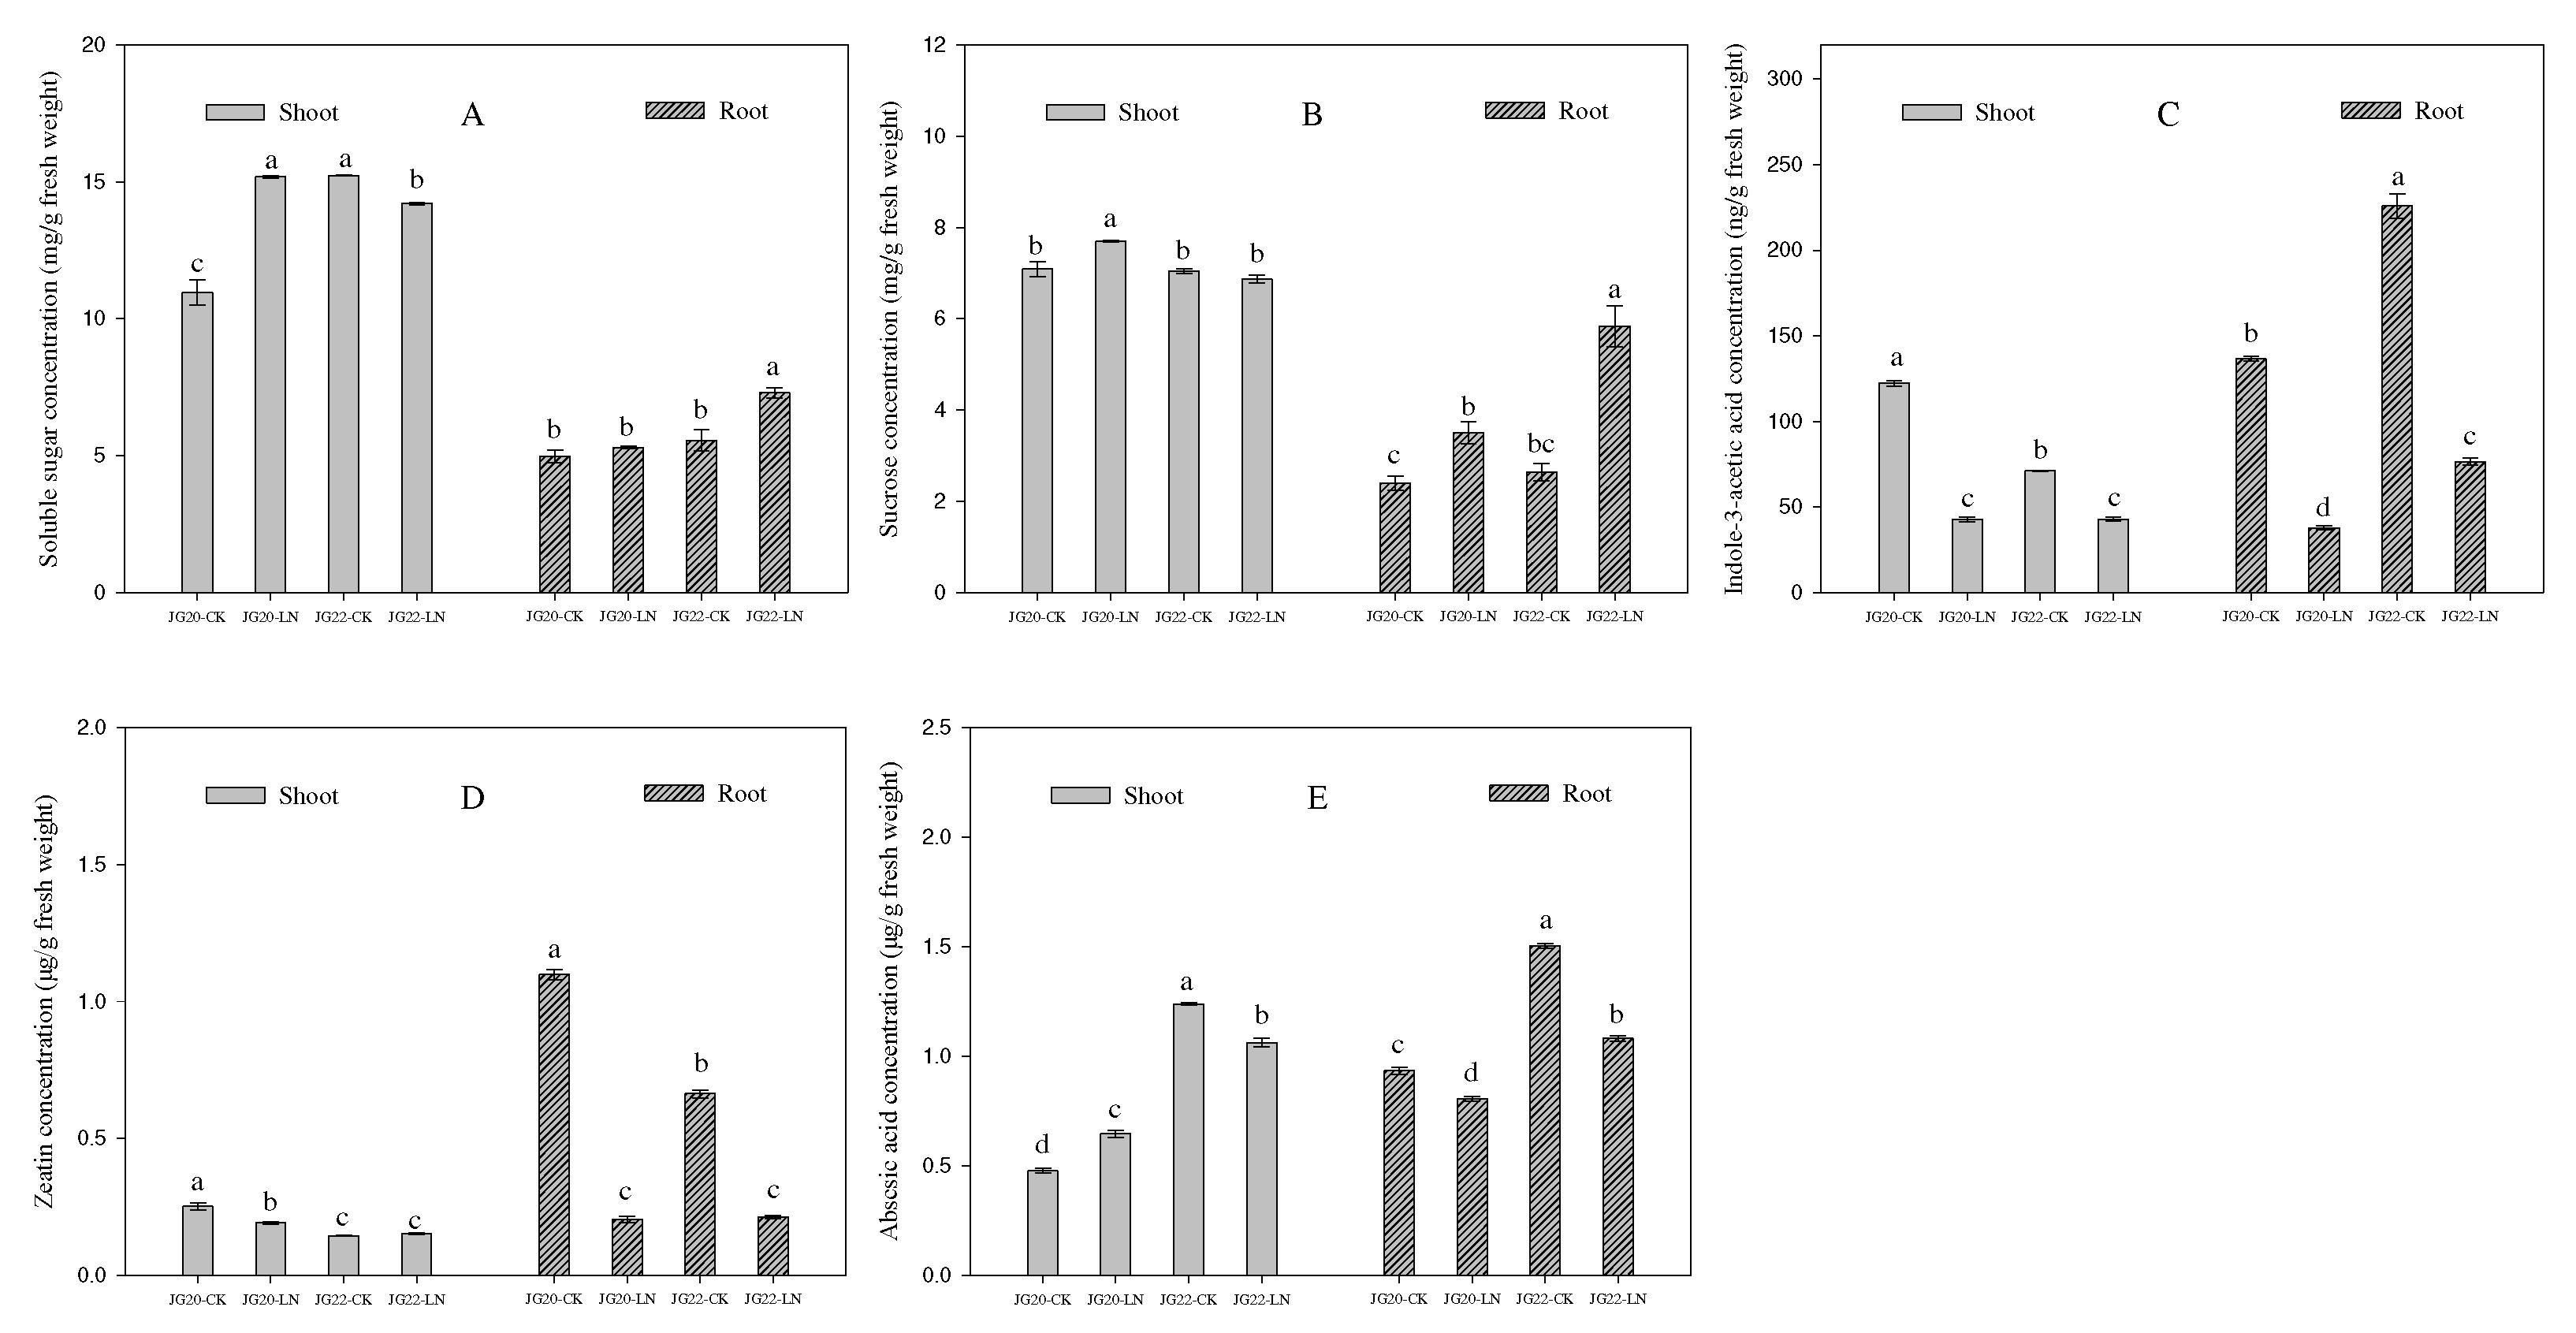
Figure 5.
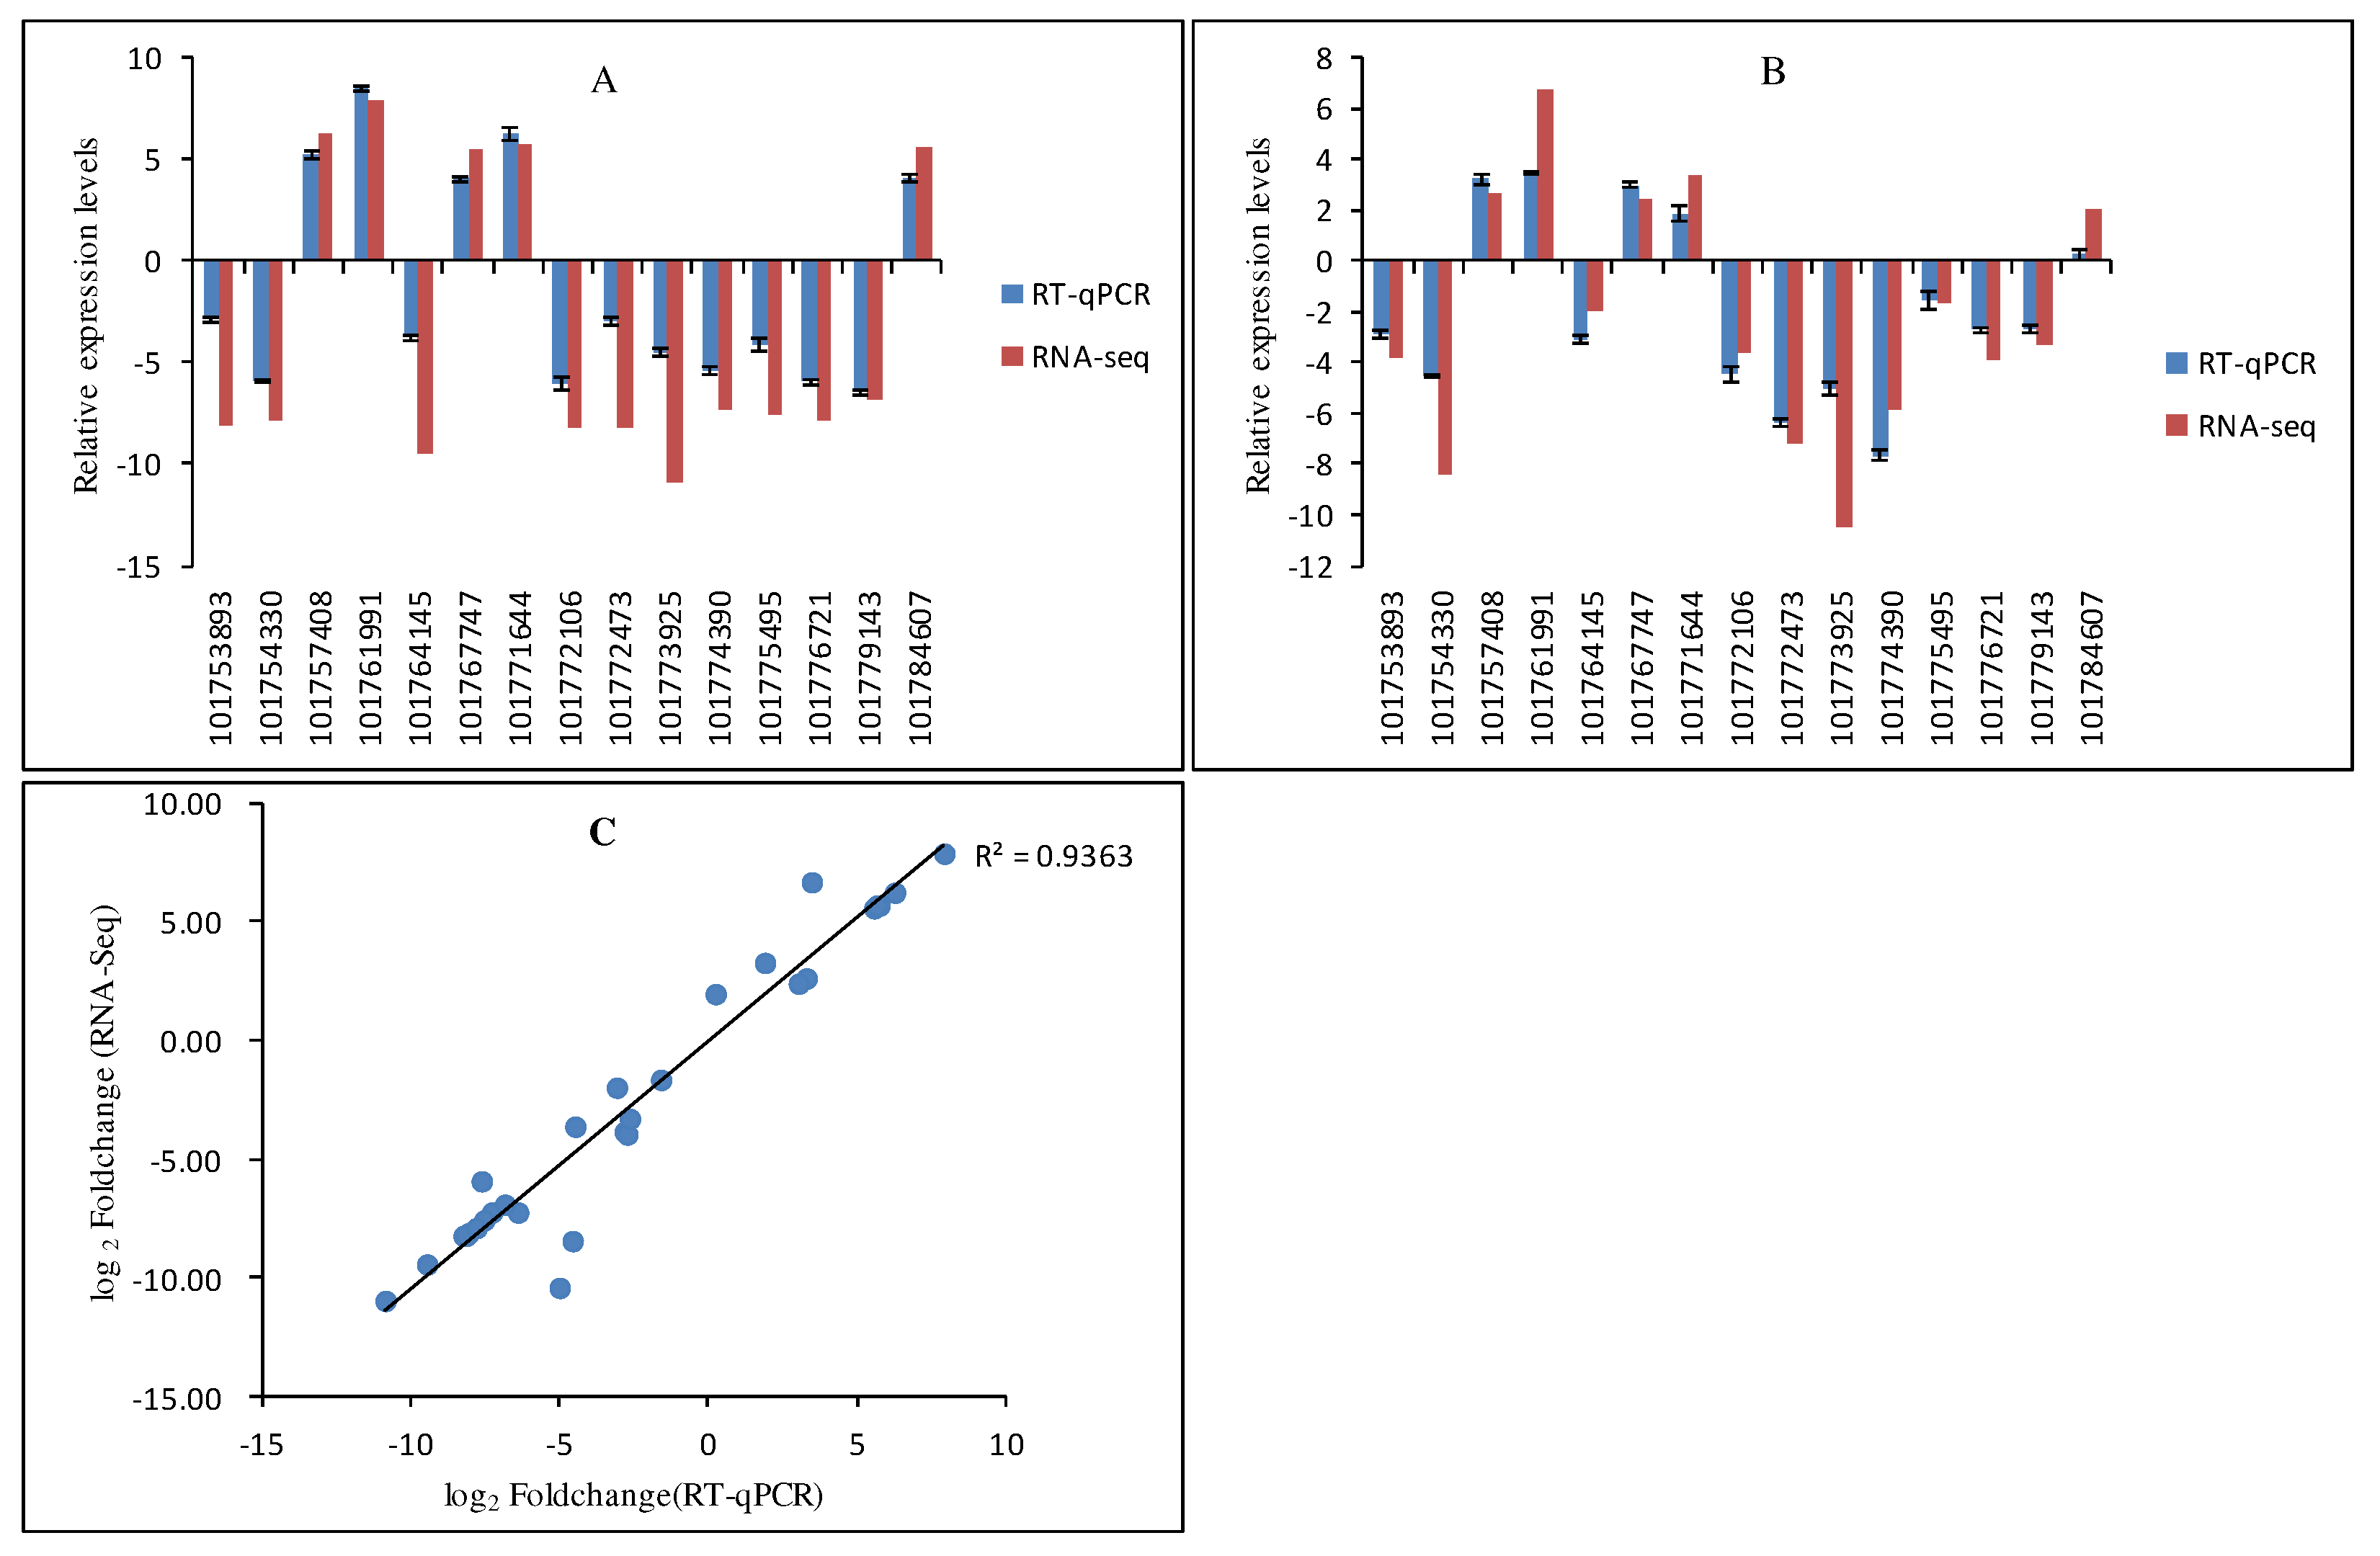
Comparison of the expression profiles of selected DEGs determined by RT-qPCR and RNA-Seq analyses. Expression levels of 15 DEGs in the low-nitrogen tolerant variety JG20 (A) and the low-nitrogen sensitive variety JG22 (B). Values are presented as log2 (fold-change). The X-axis represents gene ID, according to the NCBI database. (C) Scatter plots of the expression levels of 15 DEGs in control and low-nitrogen conditions. X and Y axes represent log2 (fold-change) determined by RAN-Seq and RT-qPCR, respectively (R2=0.936). Error bars represent the standard error of three biological replicates.
Figure 6.
Gene expression analyses of JG20 and JG22 subjected to low-nitrogen conditions. (A) The numbers of DEGs in shoots in different comparison groups. (B) Venn diagram of the numbers of DEGs in shoots in different comparisons among groups. (C) The numbers of DEGs in roots in different comparison groups. (D) Venn diagram of the numbers of DEGs in roots in different comparisons among groups. The threshold for differential expression was set at log2 fold-change > 1 and padj < 0.05.
Figure 7.
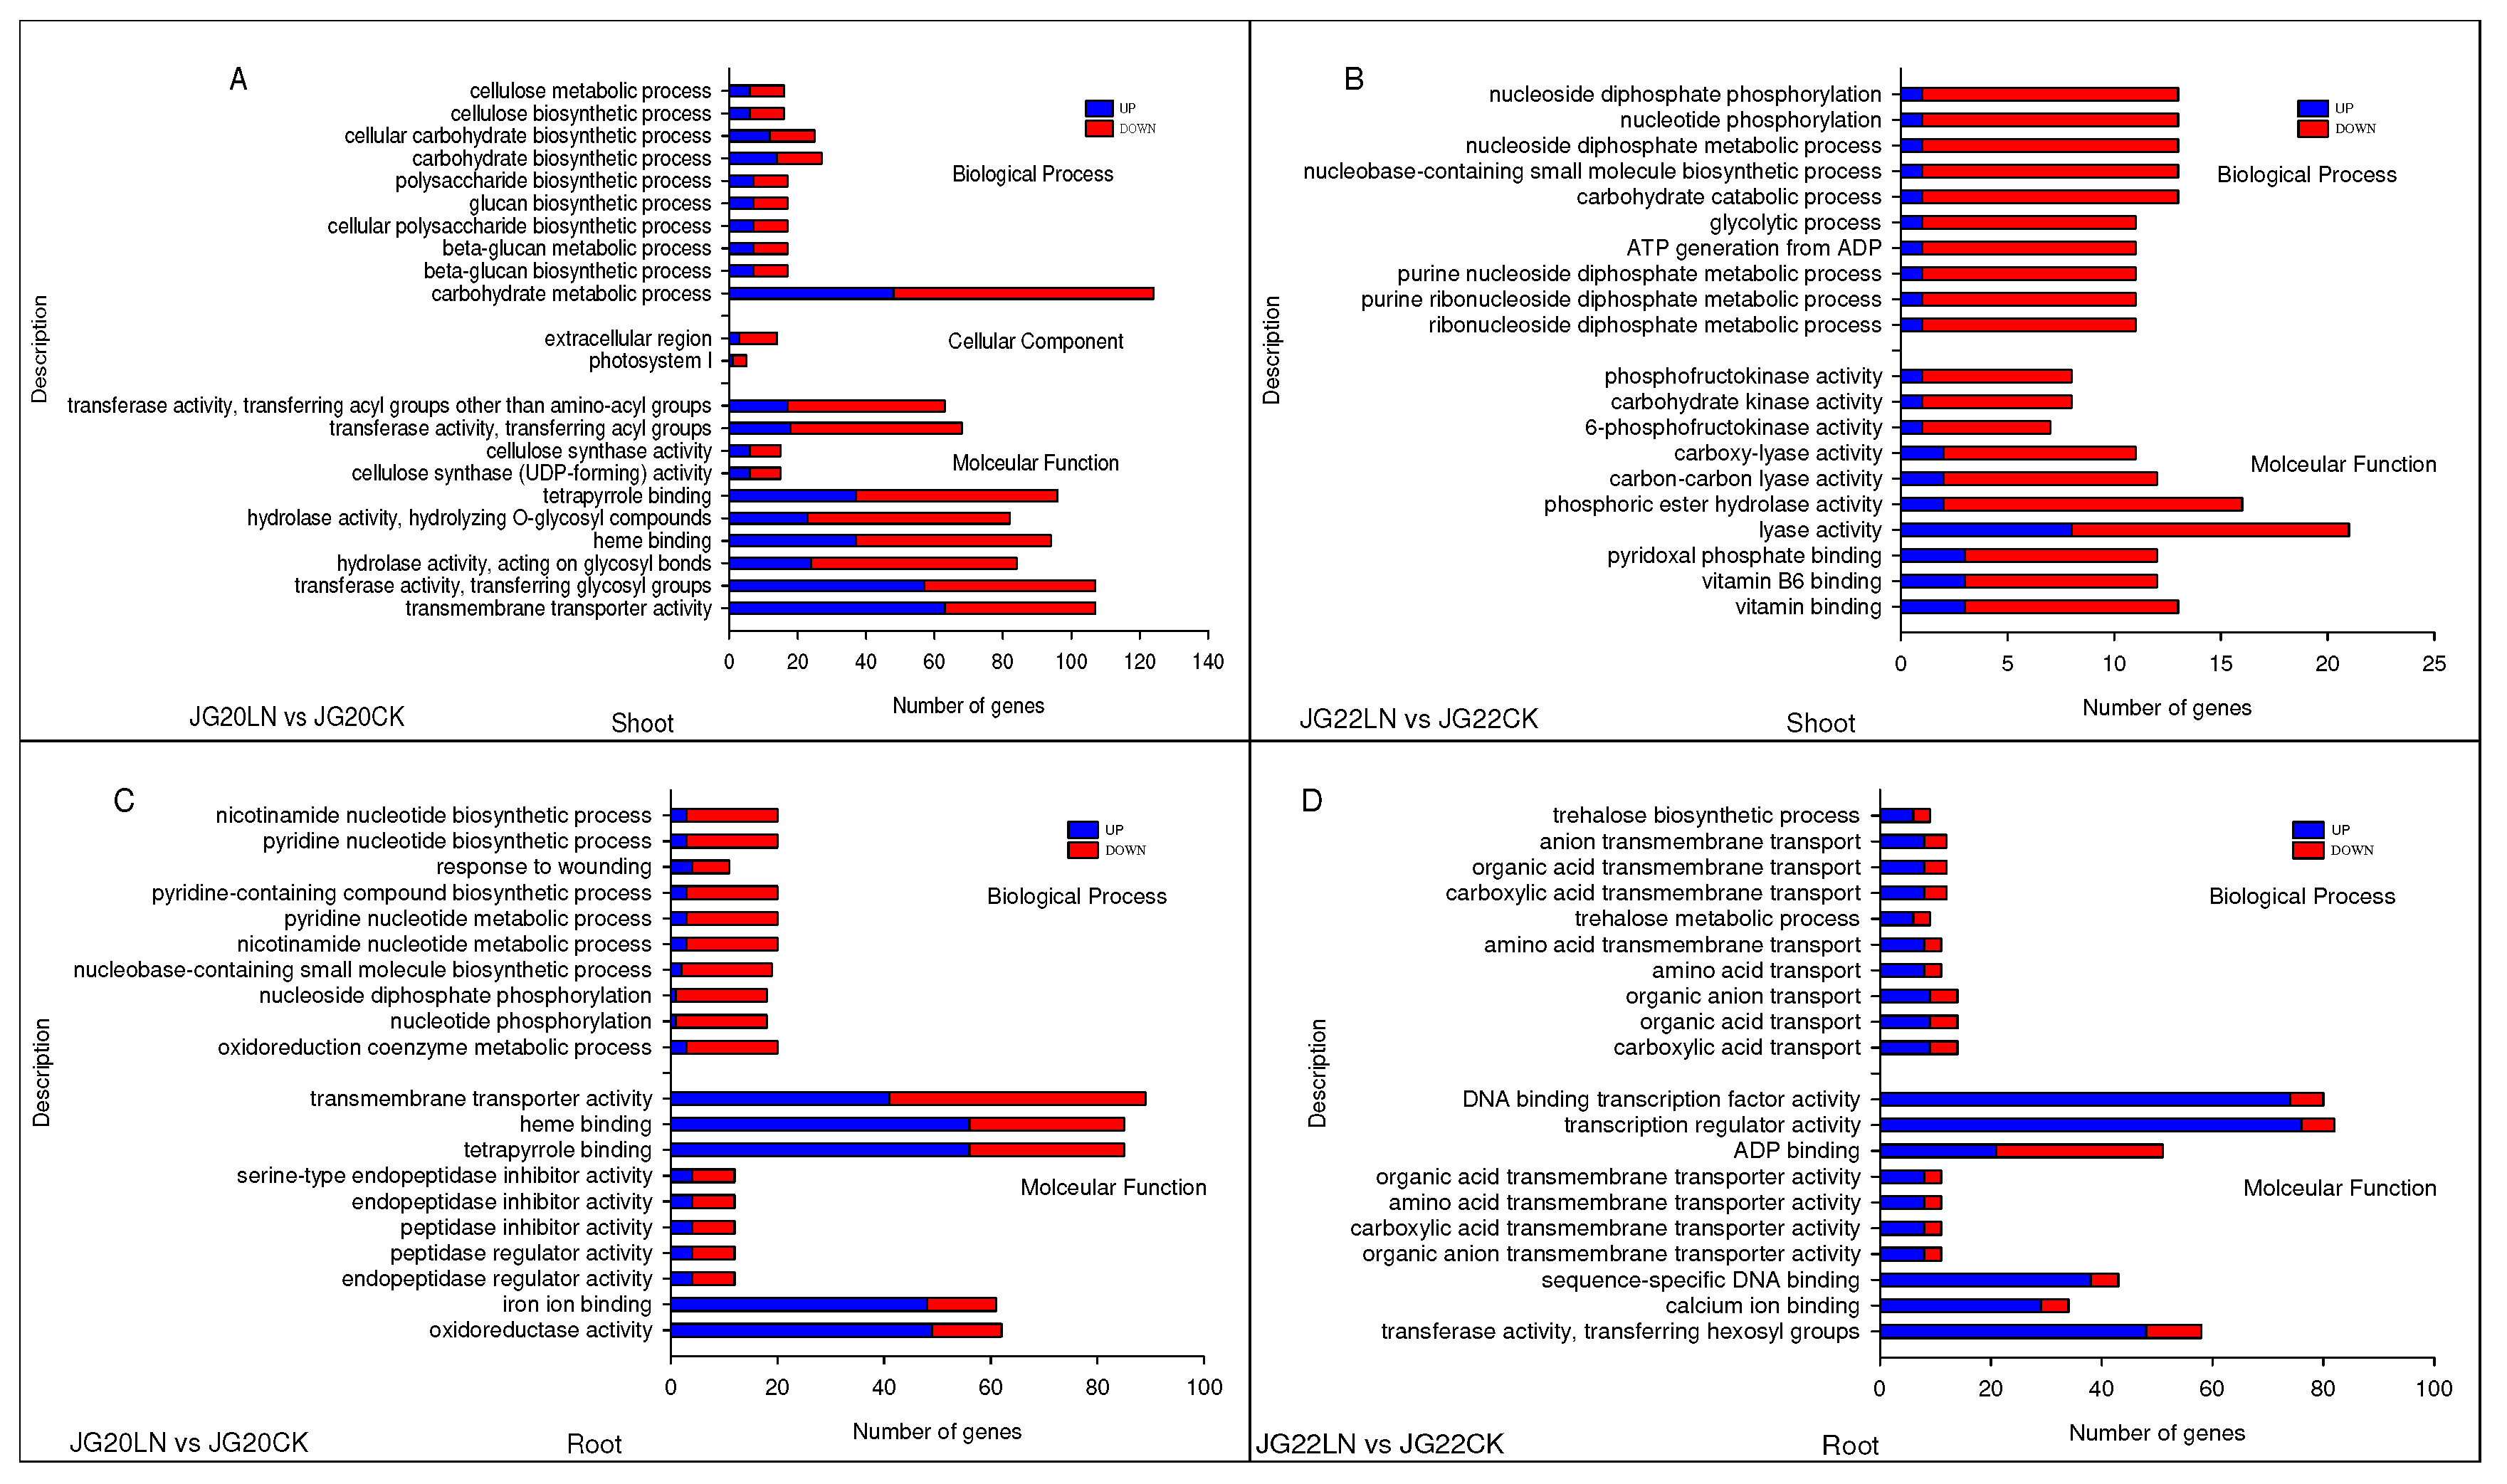
Gene ontology (GO) enrichment of DEGs in response to low nitrogen (LN) in LN-tolerant JG20 and LN-sensitive JG22 foxtail millet varieties. (A) GO enrichment of DEGs in the shoots between LN and CK in JG20. (B) GO enrichment of DEGs in the shoots between LN and CK in JG22. (C) GO enrichment of DEGs in roots between LN and CK in JG20. (D) GO enrichment of DEGs in roots between LN and CK in JG22. Blue columns indicate the numbers of up-regulated genes, while red columns indicate numbers of down-regulated genes. The threshold for differential expression was set at log2 fold-change > 1 and padj < 0.05.
Figure 8.
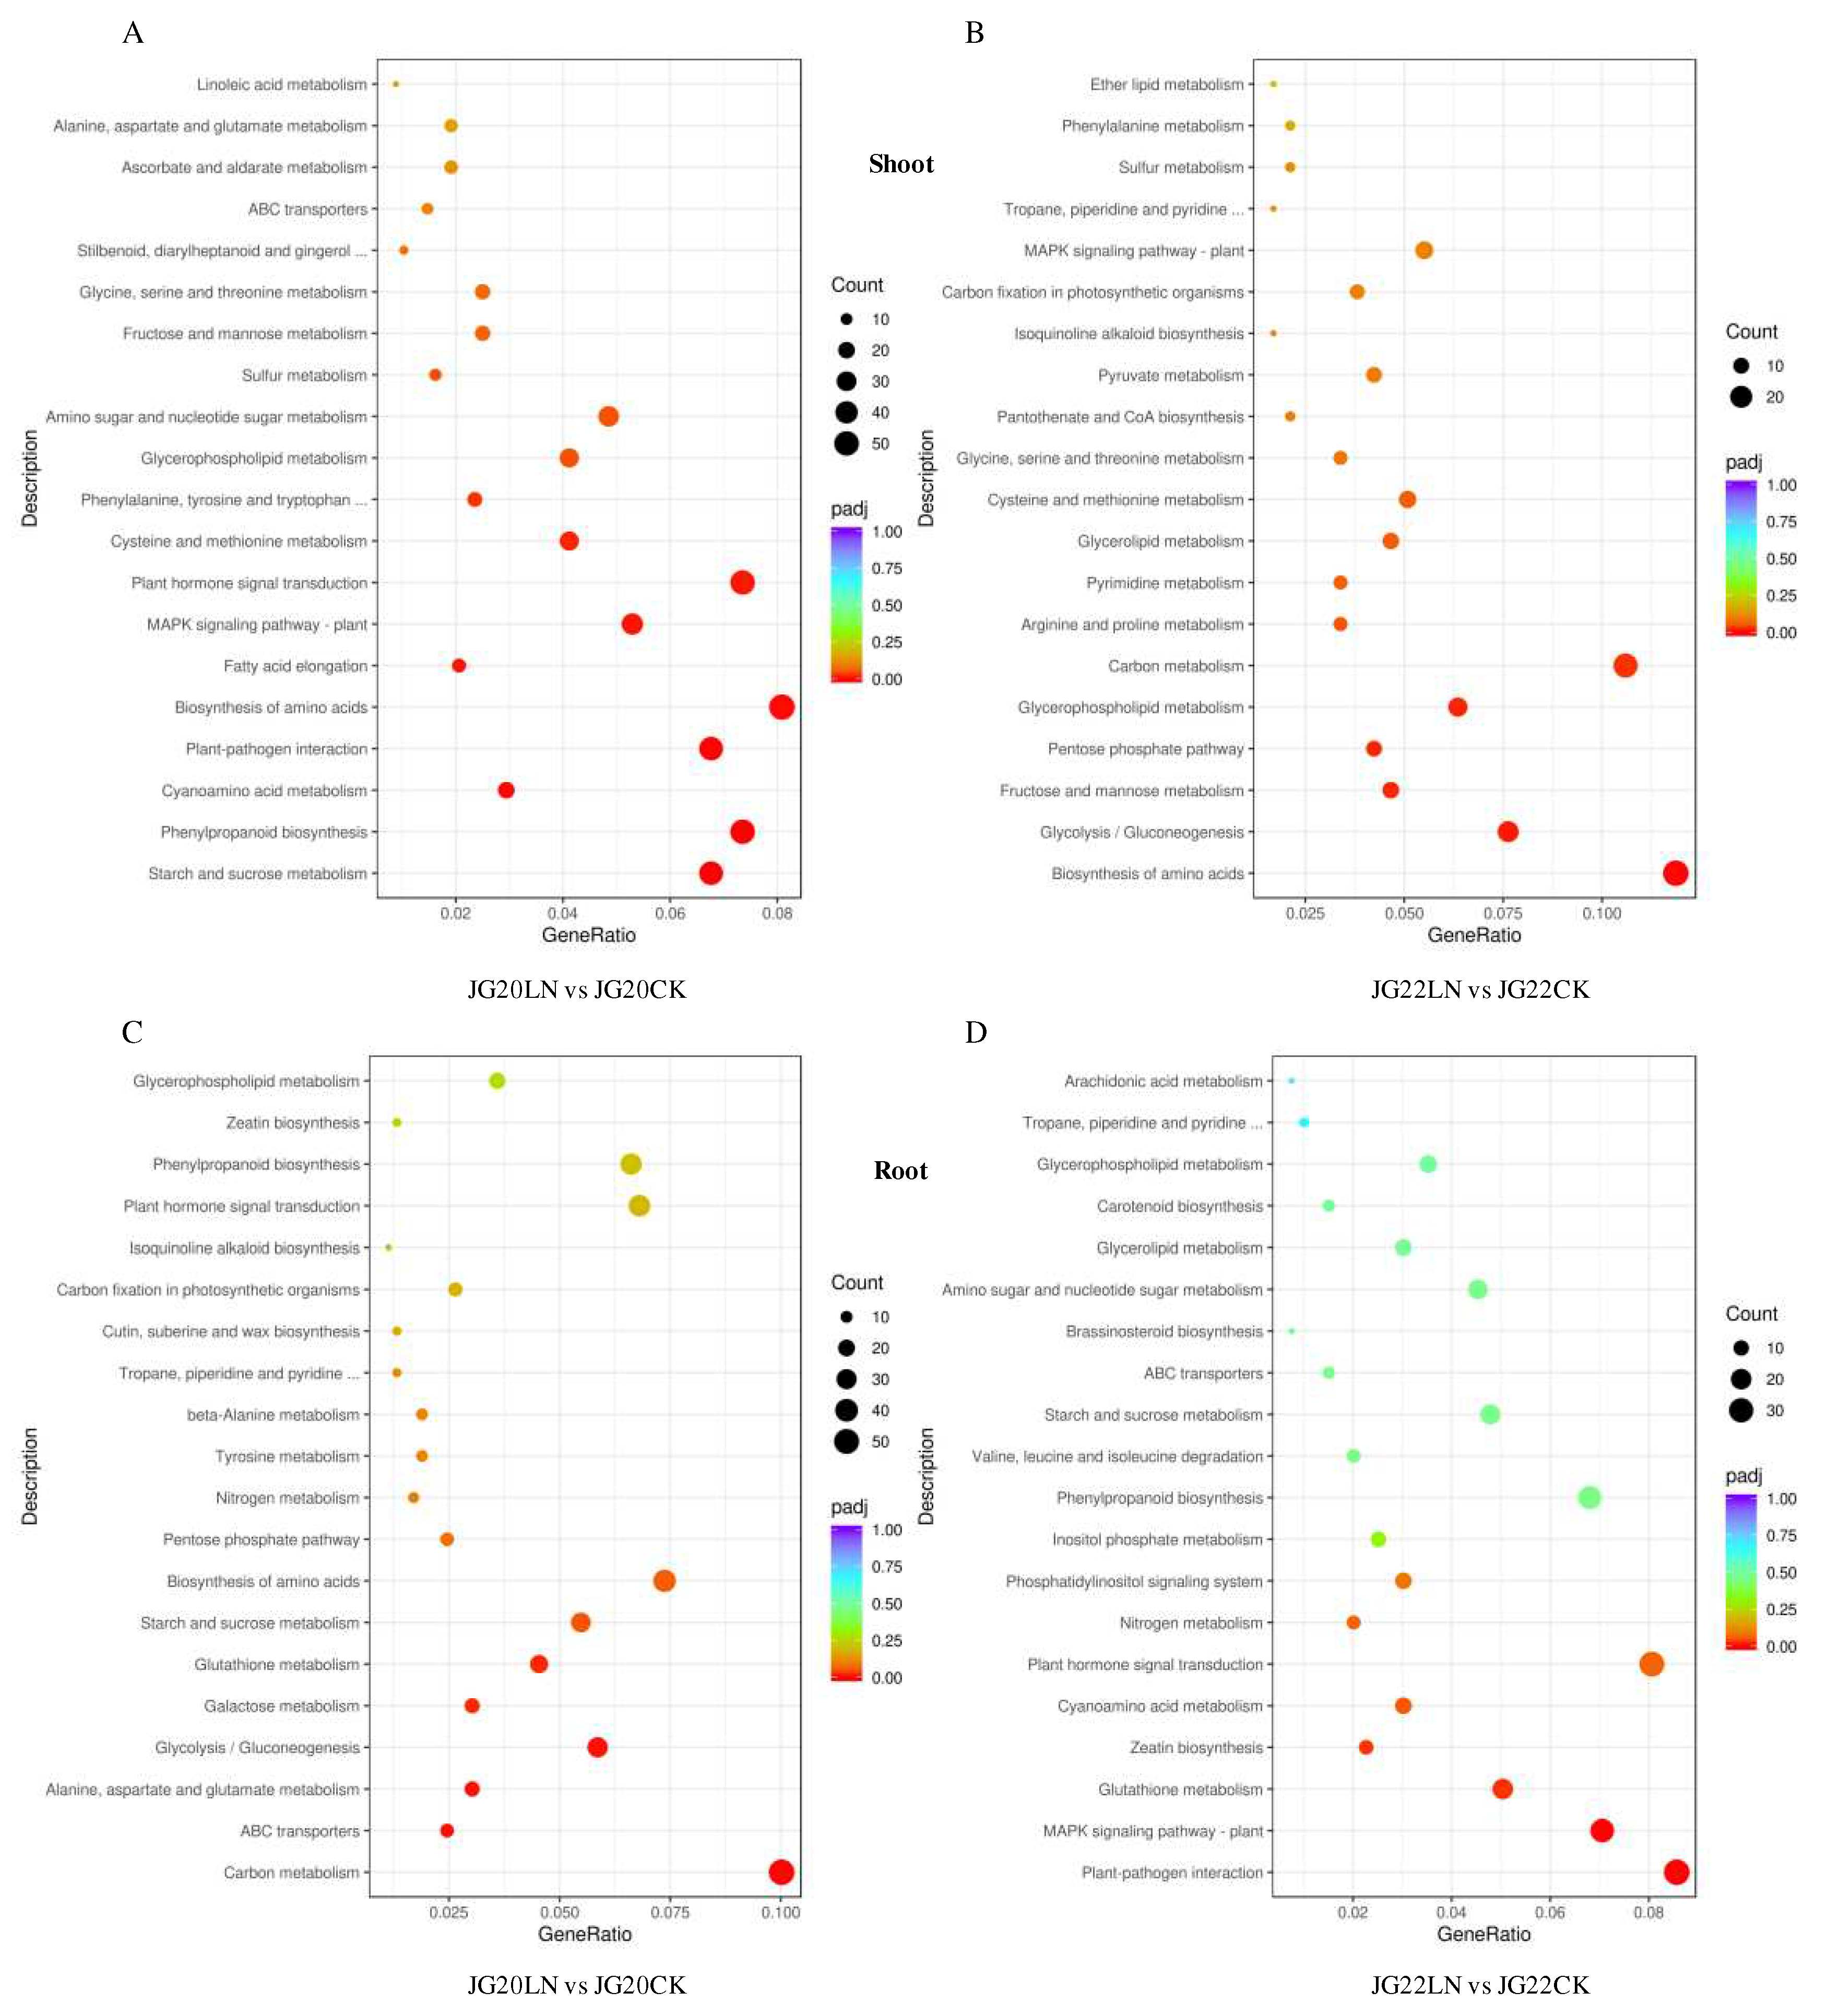
Scatter plots of top 20 KEGG pathways in two varieties in response to low nitrogen. (A) KEGG analysis of DEGs identified in the shoots of JG20 between CK and LN. (B) KEGG analysis of DEGs identified in the shoots of JG22 between CK and LN. (C) KEGG analysis of DEGs identified in the roots of JG22 between CK and low nitrogen LN. (D) KEGG analysis of DEGs identified in the roots of JG22 between CK and low nitrogen LN. Gene Ratio shows the ratio of the number of DEGs in a specific pathway to the total number of DEGs in KEGG. Pathways are listed along the y-axis. The circle area indicates the number of DEGs, and the circle color represents the ranges of the corrected P-values.
Figure 9.
Expression profiles of genes involved in nitrogen (N) source uptake, transport, and assimilation in the shoots and roots of two foxtail millet varieties in response to low nitrogen. (A) Outline of N uptake, transport, and assimilation. (B) Heatmap visualization of expression profiles of inorganic N source transporters (NRT and AMT) in N-starved foxtail millet shoots and roots. (C) Heatmap visualization of expression profiles of inorganic N source assimilation (NR, NiR, GS, GOGAT, and GDH) in N-starved foxtail millet shoots and roots. NRT (nitrate transporter); AMT (ammonium transporter); NR (nitrate reductase); NiR (nitrite reductase); GS (glutamine synthetase); GOGAT (glutamate synthetase); GDH (glutamate dehydrogenase); Glu, glutamate; Gln, glutamine; 2-OG, 2-oxoglutarate; AA, amino acid. The bar on the right side of the heatmap represents relative expression level of DEGs. The threshold for differential expression was set at log2 fold-change > 1 and padj < 0.05.
Figure 10.
Heatmap visualization of expression profiles of genes involved in photosynthesis (A), hormone signal transduction (B) and glycolysis (C) in two foxtail millet varieties in response to low nitrogen. Psa, chlorophyll apoprotein of photosystem I; Psb, chlorophyll apoprotein of photosystem II; b, ATP synthase subunit b; LHC, light-harvesting chlorophyll protein complex; Lhcb1, light-harvesting complex II chlorophyll b binding protein; AUX, Auxin; IAA, Indole-3-acetic acid; AFR, Auxin response factor; GH3, indole-3-acetic acid-amido synthetase GH3; SAUR, auxin-responsive protein SAUR; AHP, histidine-containing phosphotransfer protein; A-ARR/B-ARR, two-component response regulator ORR; TF, transcription factor; EBF, EIN3-binding F-box protein; EIN3, ethylene-insensitive protein 3; PYR/PYL, abscisic acid receptor; PP2C, probable protein phosphatase 2C; SnRK2, serine/threonine-protein kinase; ABF, G-box-binding factor; HXK, hexokinase; AEP, aldose 1-epimerase; GPI, glucose-6-phosphate isomerase; ATP-PFK, ATP-dependent 6-phosphofructokinase; FBA, fructose-bisphosphate aldolase; TIM, triosephosphate isomerase; PGK, phosphoglycerate kinase; PGMP, phosphoglycerate mutase-like protein; ENO, enolase; PCK, phosphoenolpyruvate carboxykinase; PK, pyruvate kinase; PDH-E1α, pyruvate dehydrogenase E1 component subunit alpha; PDC, pyruvate decarboxylase; PDH-E2, pyruvate dehydrogenase E2 component; DLD, dihydrolipoamide dehydrogenase; ALDH, aldehyde dehydrogenase. The threshold for differential expression was set at log2 fold-change > 1 and padj < 0.05.
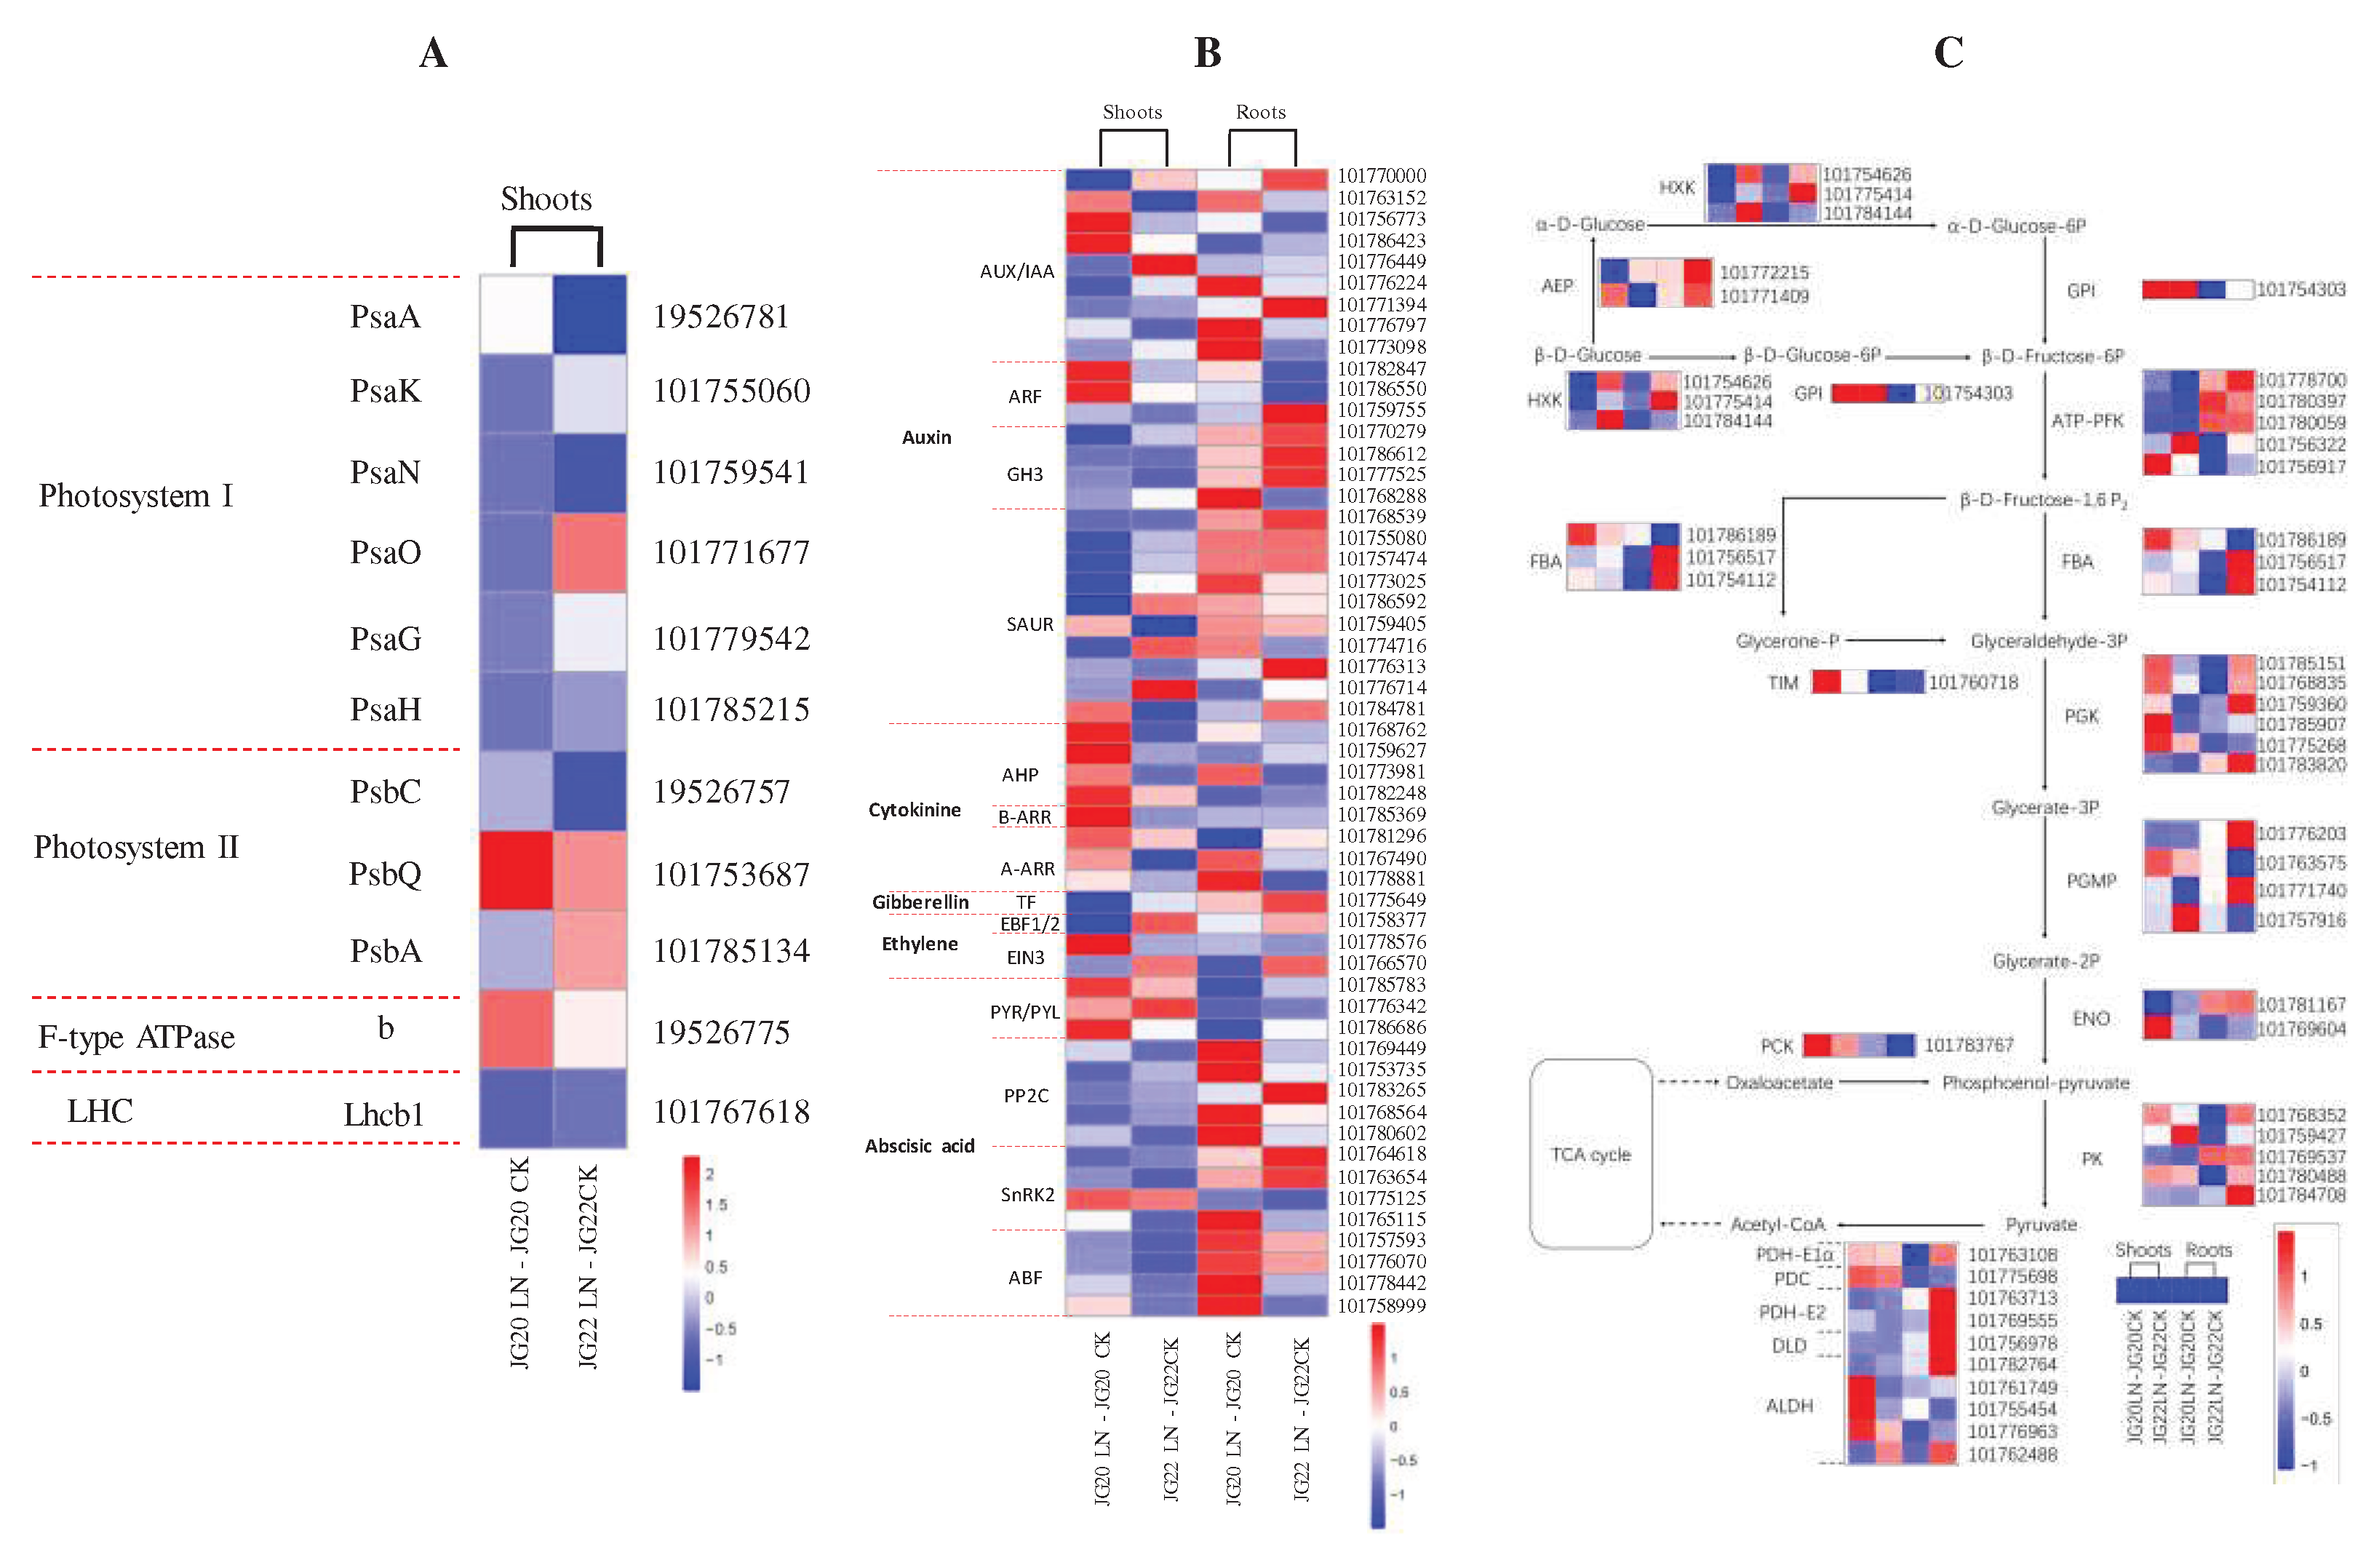
Figure 11.
Schematic representation of the main processes and important genes involved in low nitrogen response in two foxtail millet varieties with different nitrogen use efficiency. The color scale represents increased (red) or decreased (blue) fold-change expression of DEGs in samples exposed to low nitrogen. NRT, nitrate transporter; AMT, ammonium transporter; GS, glutamine synthetase; GOGAT, glutamate synthetase; AUX, Auxin; IAA, Indole-3-acetic acid; AFR, Auxin response factor; GH3, indole-3-acetic acid-amido synthetase GH3; SAUR, aux-in-responsive protein SAUR; AHP, histidine-containing phosphotransfer protein; A-ARR/B-ARR, two-component response regulator ORR; PYR/PYL, abscisic acid receptor; PP2C, probable pro-tein phosphatase 2C; SnRK2, serine/threonine-protein kinase; ABF, G-box-binding factor; Psb, chlorophyll apoprotein of photosystem II; b, ATP synthase subunit b; AEP, aldose 1-epimerase; GPI, glucose-6-phosphate isomerase; ATP-PFK, ATP-dependent 6-phosphofructokinase; FBA, fructose-bisphosphate aldolase; TIM, tri-osephosphate isomerase; PGK, phosphoglycerate kinase; PGMP, phosphoglycerate mutase-like protein; ENO, enolase; PCK, phosphoenolpyruvate carboxykinase; ALDH, aldehyde dehydrogenase. The threshold for differential expression was set at log2 fold-change > 1 and padj < 0.05.
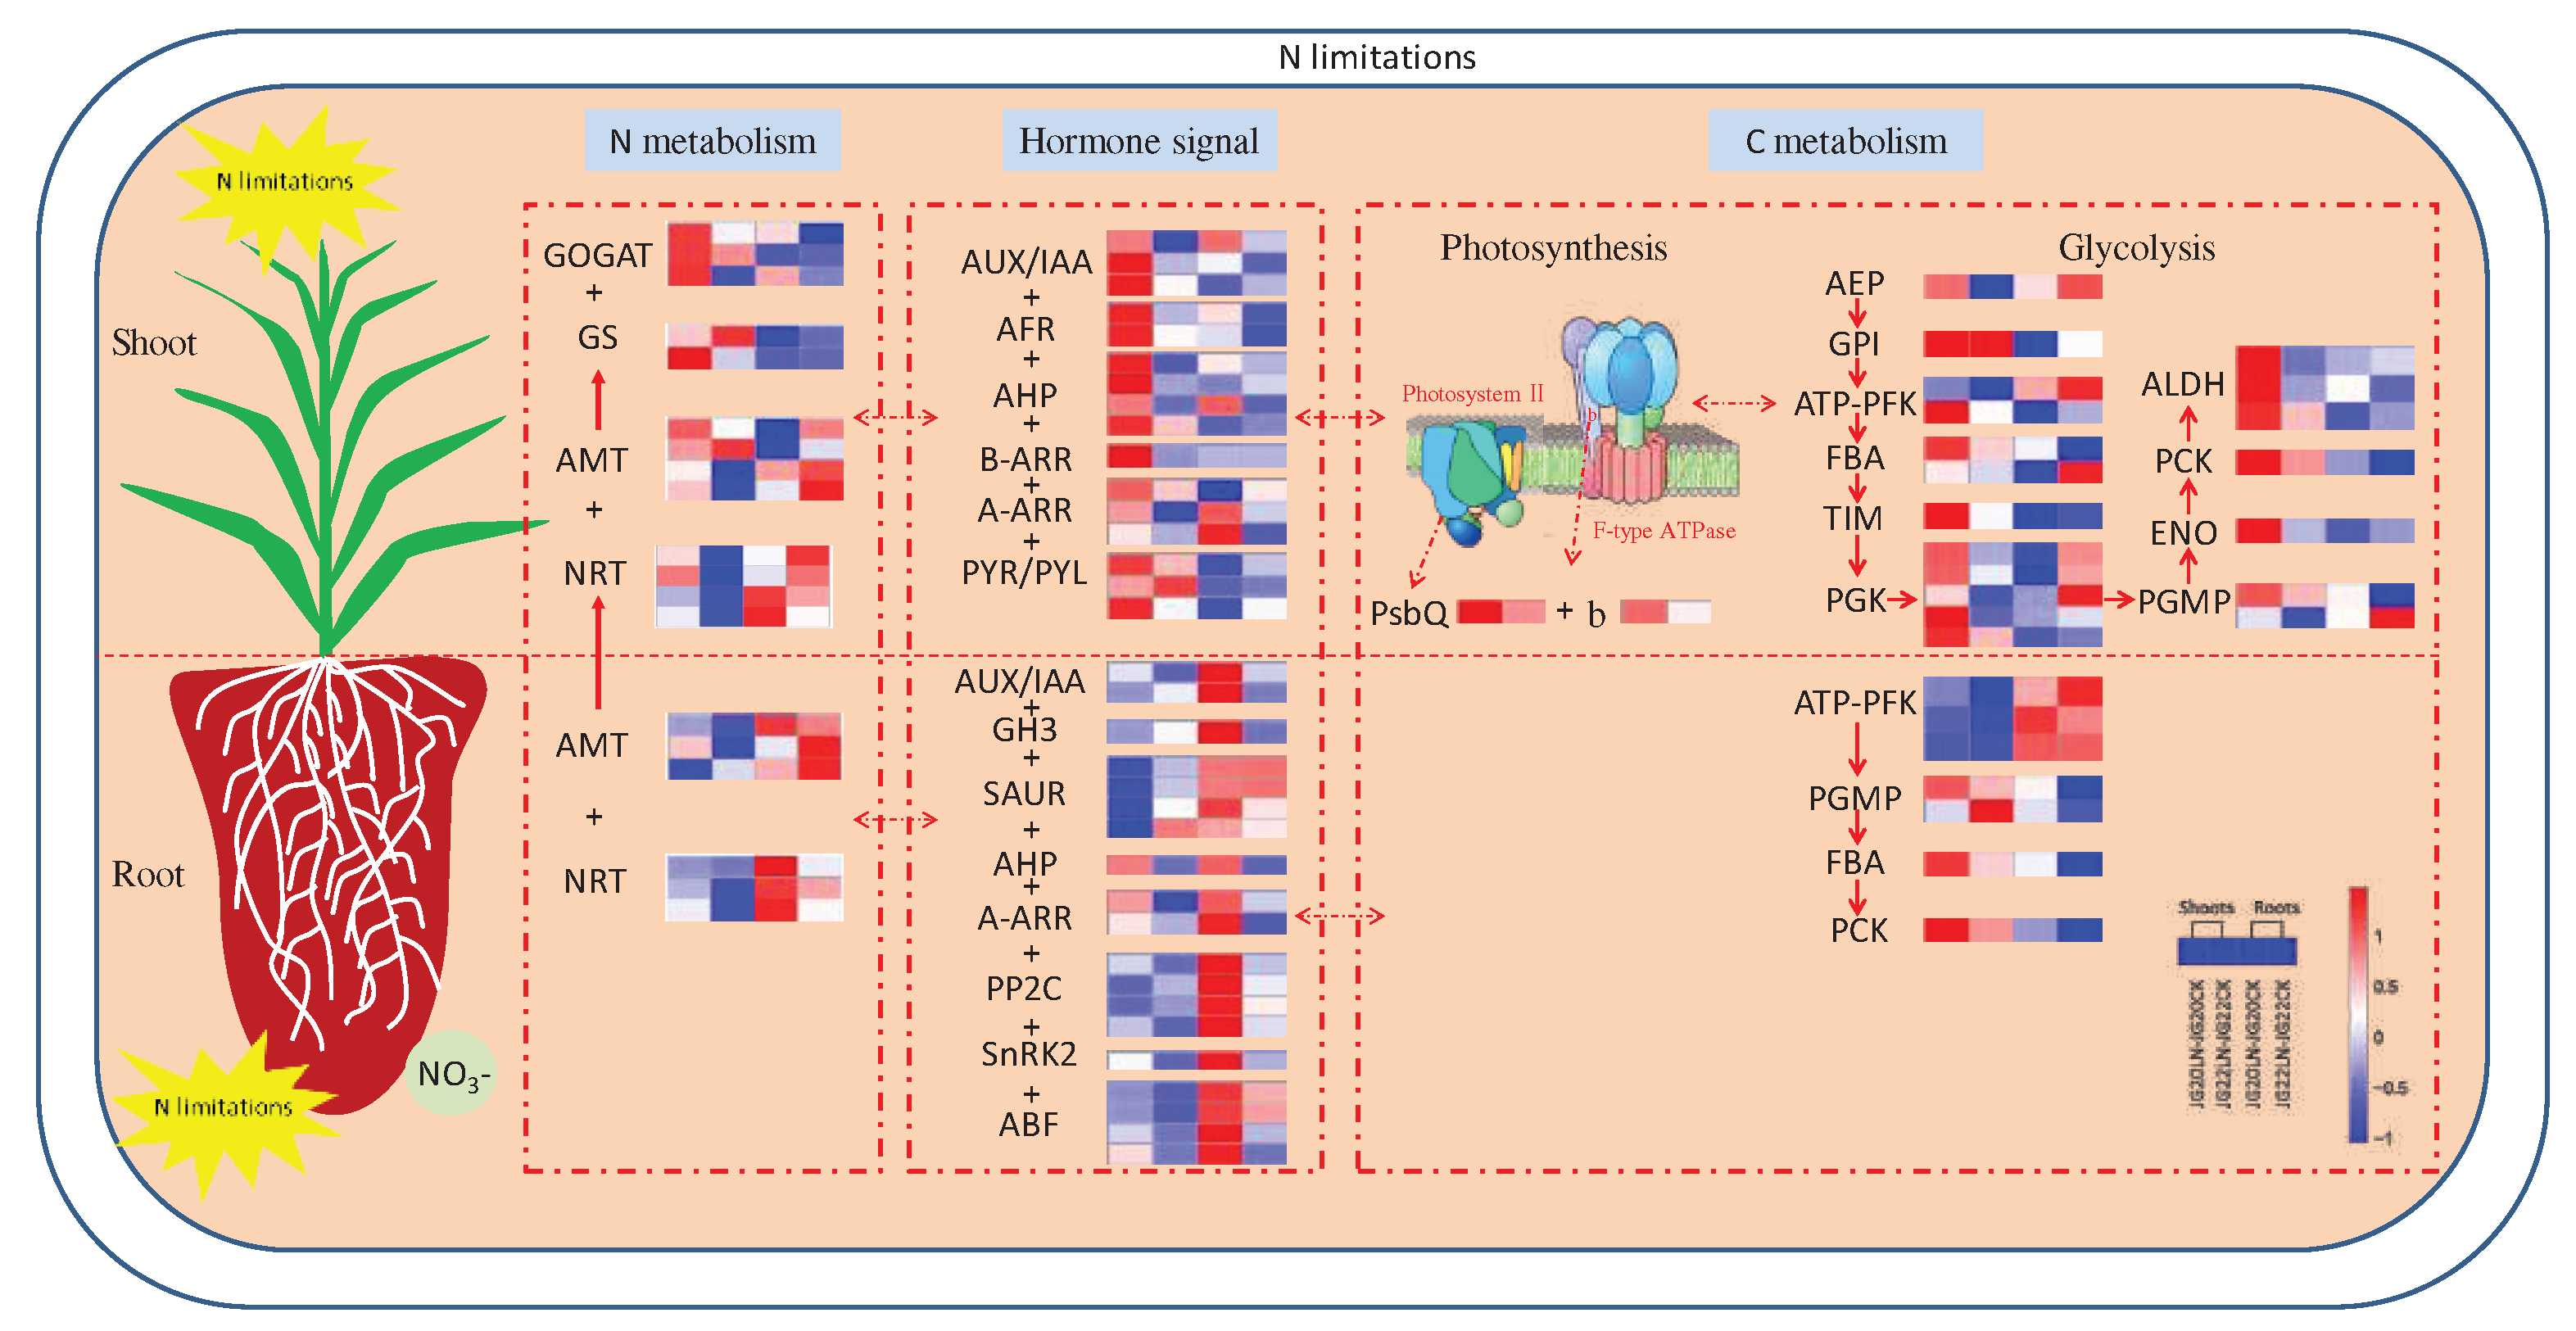
Table 1.
Quality statistics of read numbers of foxtail millet transcriptomics.
Table 1.
Quality statistics of read numbers of foxtail millet transcriptomics.
| Sample name |
Raw reads |
Clean reads |
Clean bases |
Error rate
(20%) |
Q20
(%) |
Q30
(%) |
GC content
(%) |
Total mapped |
Uniquely mapped |
Multiple mapped |
| SJG20-CK |
45434210 |
44021351 |
6.60G |
0.02 |
98.18 |
94.78 |
56.54 |
42466340(96.47%) |
40838306(92.77%) |
1628034(3.70%) |
| RJG20-CK |
46926017 |
44908641 |
6.73G |
0.02 |
98.32 |
95.10 |
53.21 |
38087242(84.81%) |
37391122(83.26) |
696119(1.55%) |
| SJG20-LN |
46568083 |
45266295 |
6.79G |
0.02 |
98.15 |
94.69 |
56.37 |
43654878(96.44%) |
42879943(94.73%) |
774935(1.71%) |
| RJG20-LN |
45728815 |
44559130 |
6.68G |
0.02 |
98.11 |
94.52 |
52.95 |
33272477(74.67%) |
32684085(73.35%) |
588392(1.32%) |
| SJG22-CK |
42193254 |
41110815 |
6.17G |
0.02 |
98.36 |
95.08 |
53.98 |
39846088(96.92%) |
38835094(94.46%) |
1010994(2.46%) |
| RJG22-CK |
43185923 |
42196855 |
6.33G |
0.02 |
98.33 |
94.95 |
50.22 |
30066139(71.25%) |
29460001(69.82%) |
606138(1.44%) |
| SJG22-LN |
44891345 |
43960698 |
6.59G |
0.02 |
98.13 |
94.55 |
54.73 |
42392060(96.43%) |
41541056(94.50%) |
851004(1.94%) |
| RJG22-LN |
43616102 |
42607394 |
6.39G |
0.02 |
98.24 |
94.77 |
52.21 |
31884267(74.83%) |
31199409(73.23%) |
684858(1.61%) |
