Submitted:
08 May 2023
Posted:
09 May 2023
You are already at the latest version
Abstract
Keywords:
1. Introduction
2. Materials and Methods
2.1. Plant Growth Conditions and Stress Treatments
2.2. Quantification of relative gene expression by using qRT-PCR
2.3. Subcellular localization of OsNAC050
2.3. Targeted Mutagenesis of OsNAC050
2.4. Quantitative Real-Time Polymerase Chain Reaction (qRT-PCR) Analysis
2.5. Physiological Measurements
2.6. Transcriptome analysis and data analysis
3. Results
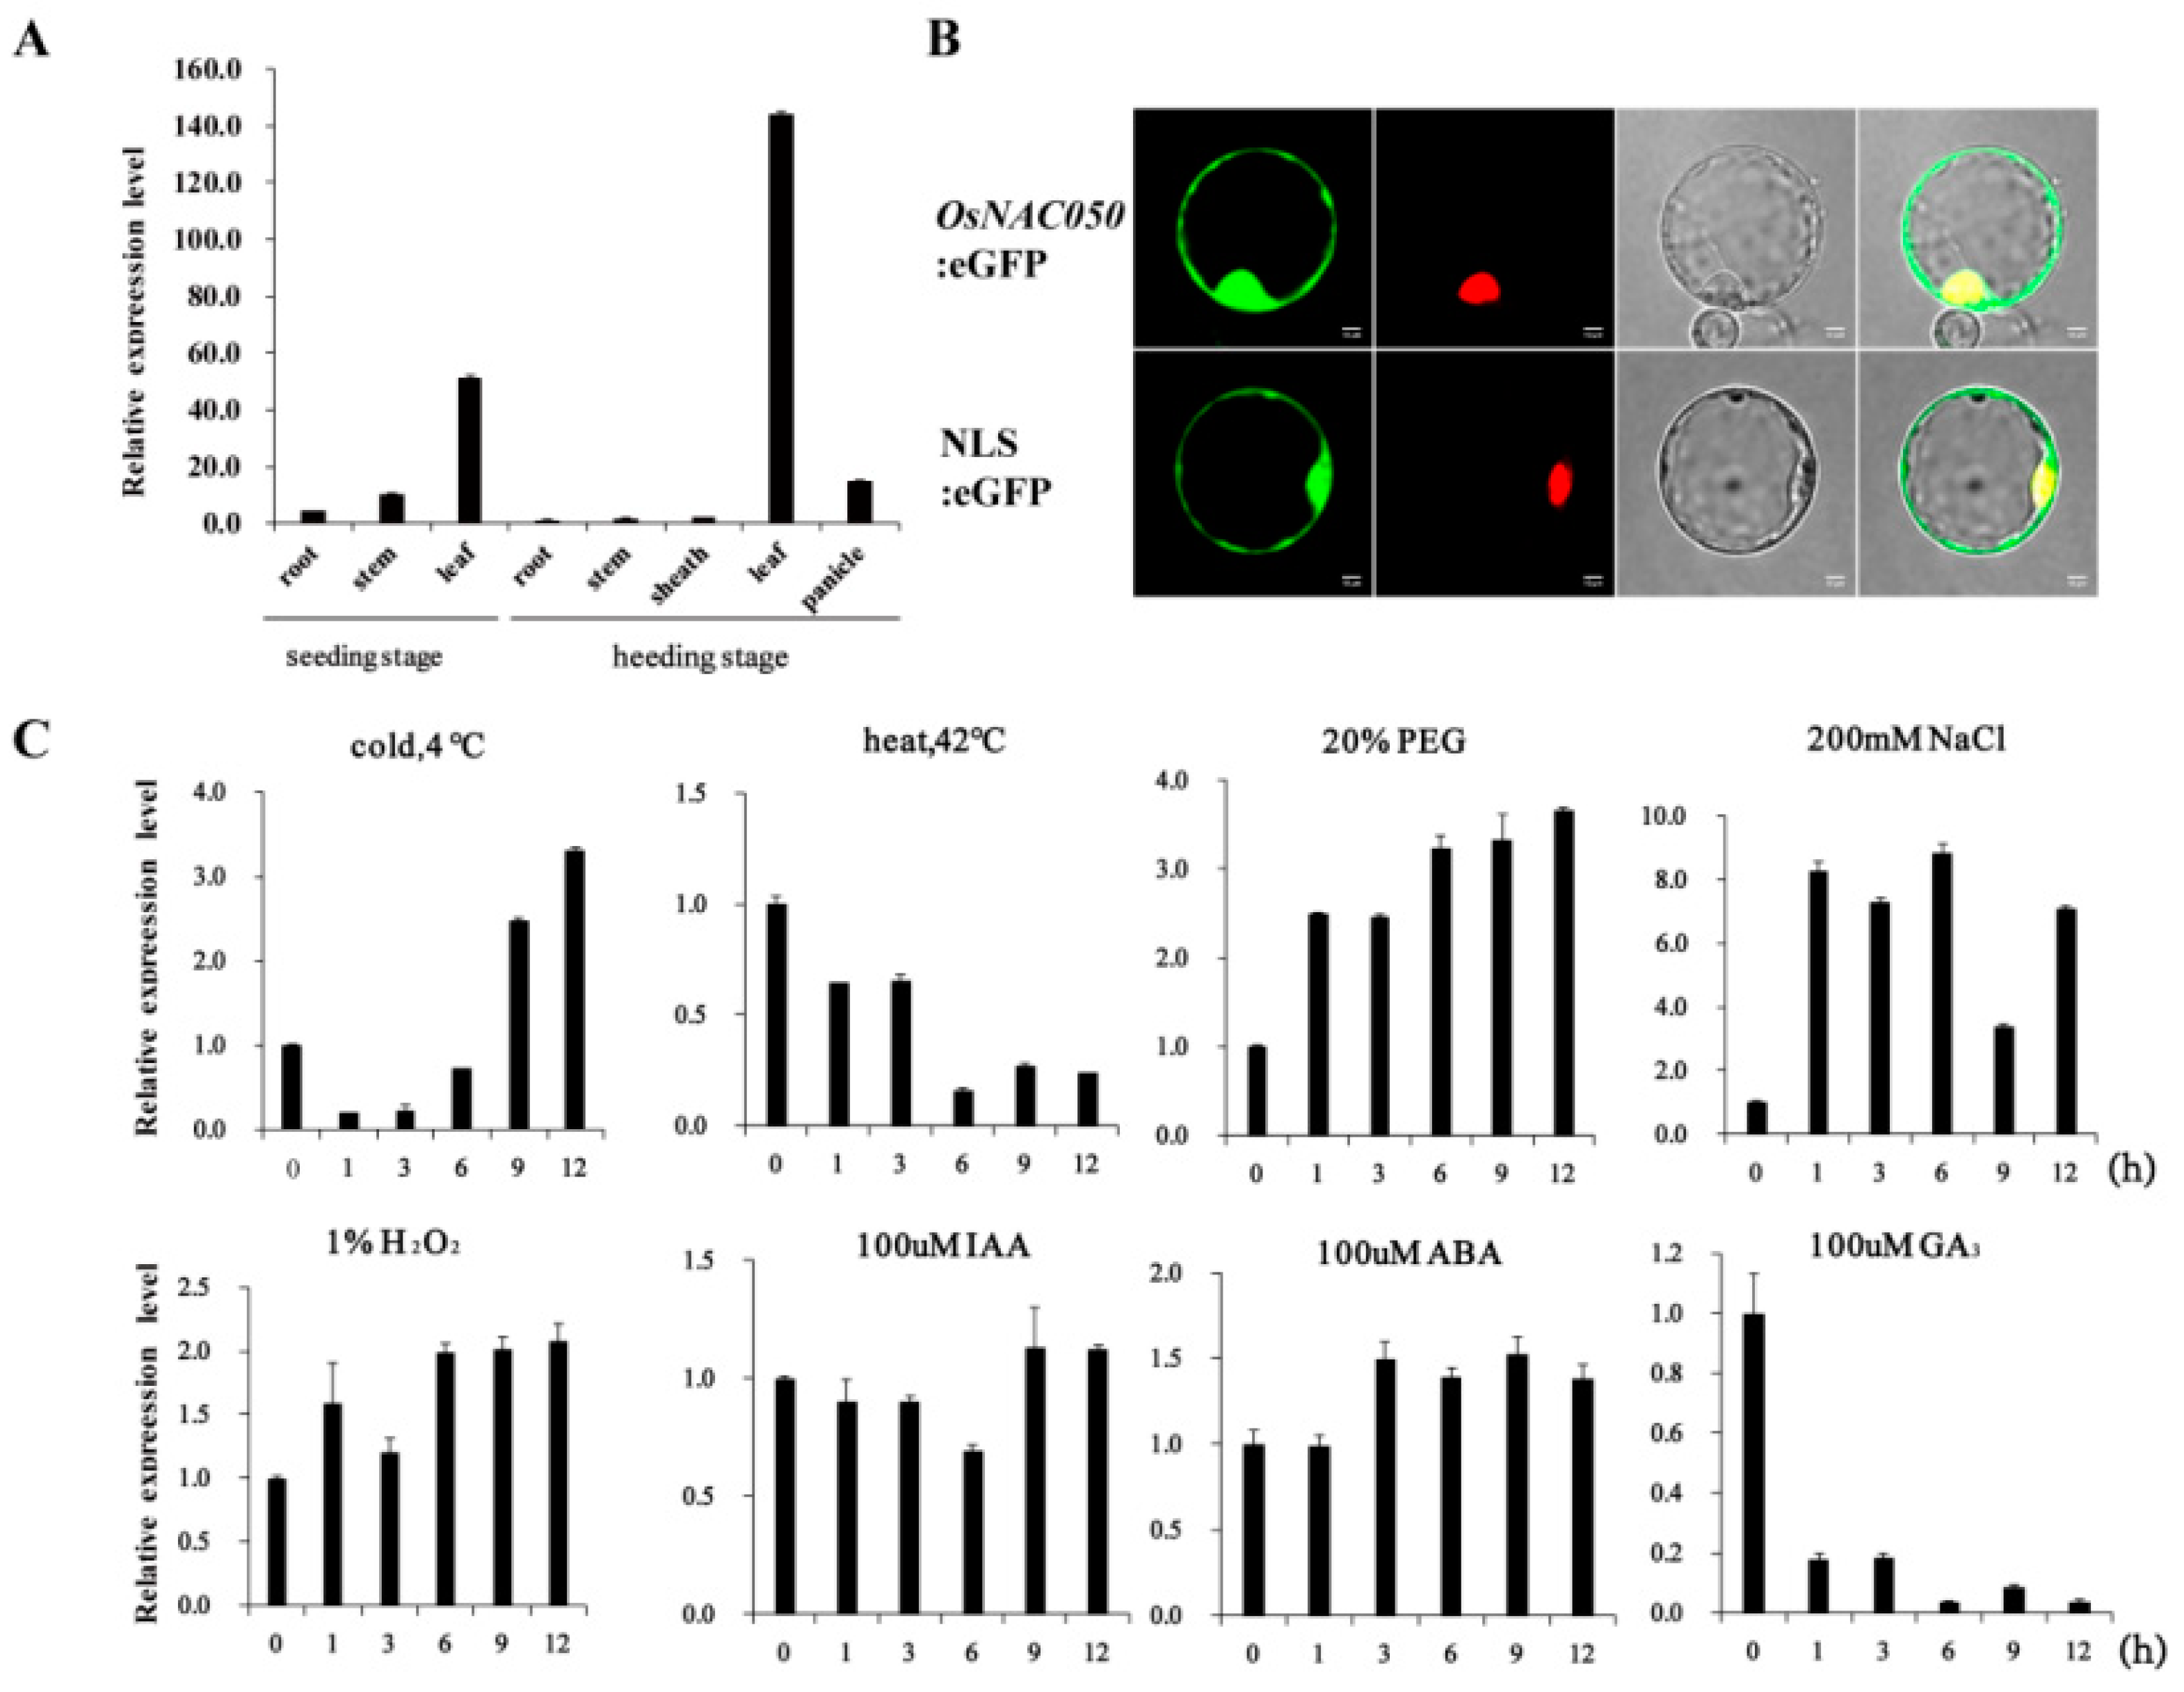
3.1. OsNAC050 is a cold-inducible transcription factor gene
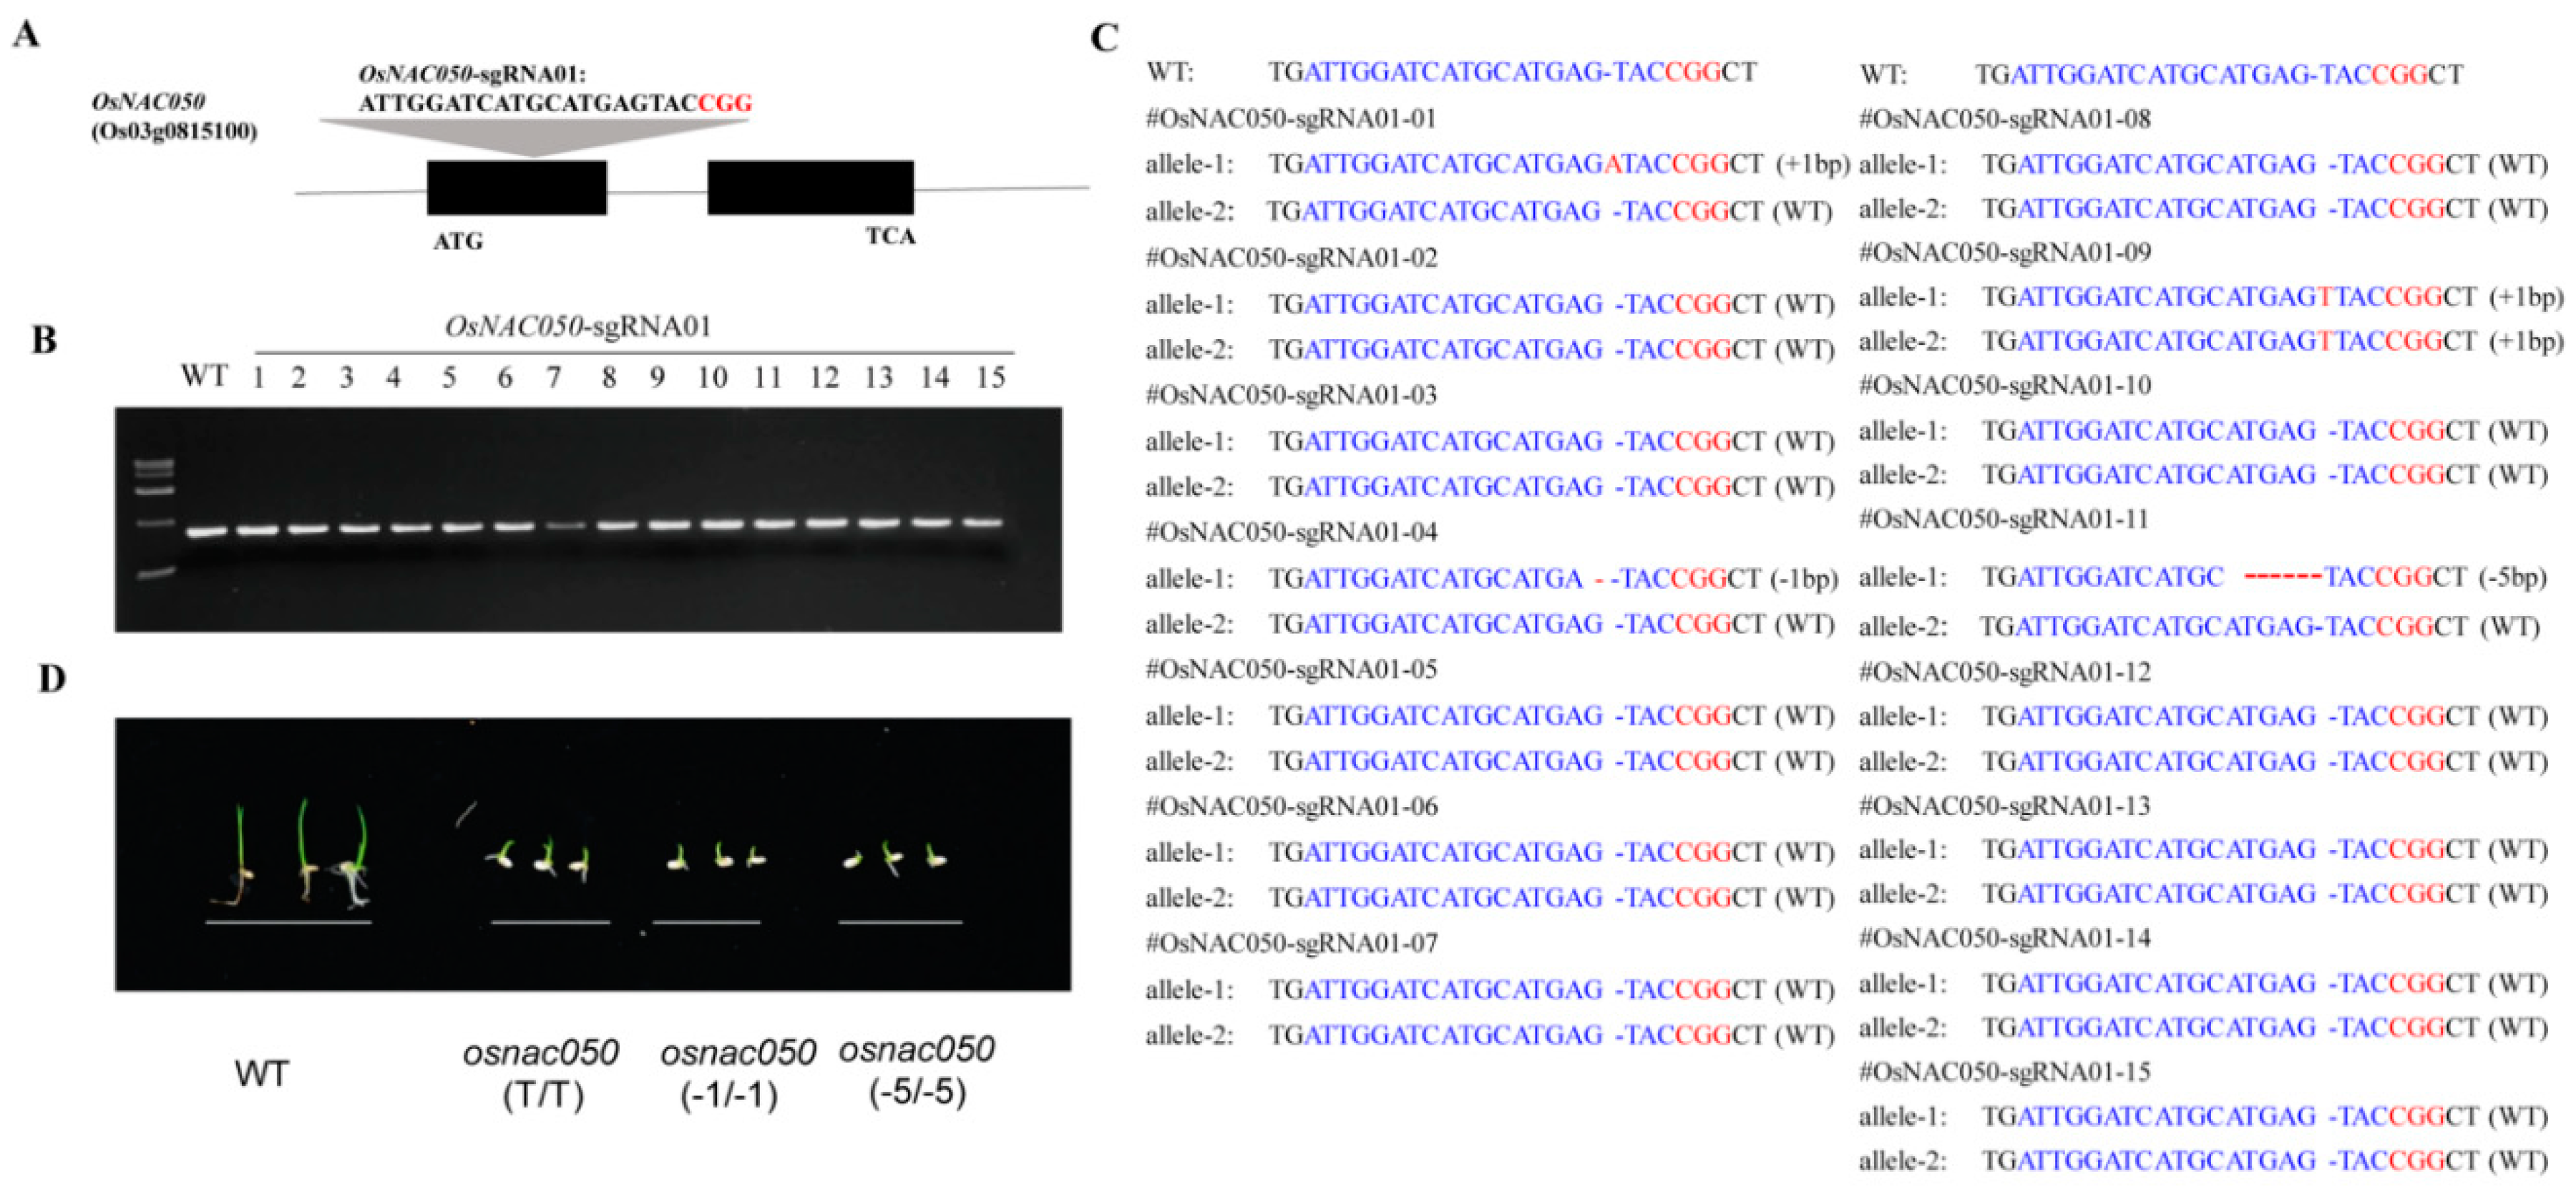
3.2. Targeted mutagenesis of OsNAC050
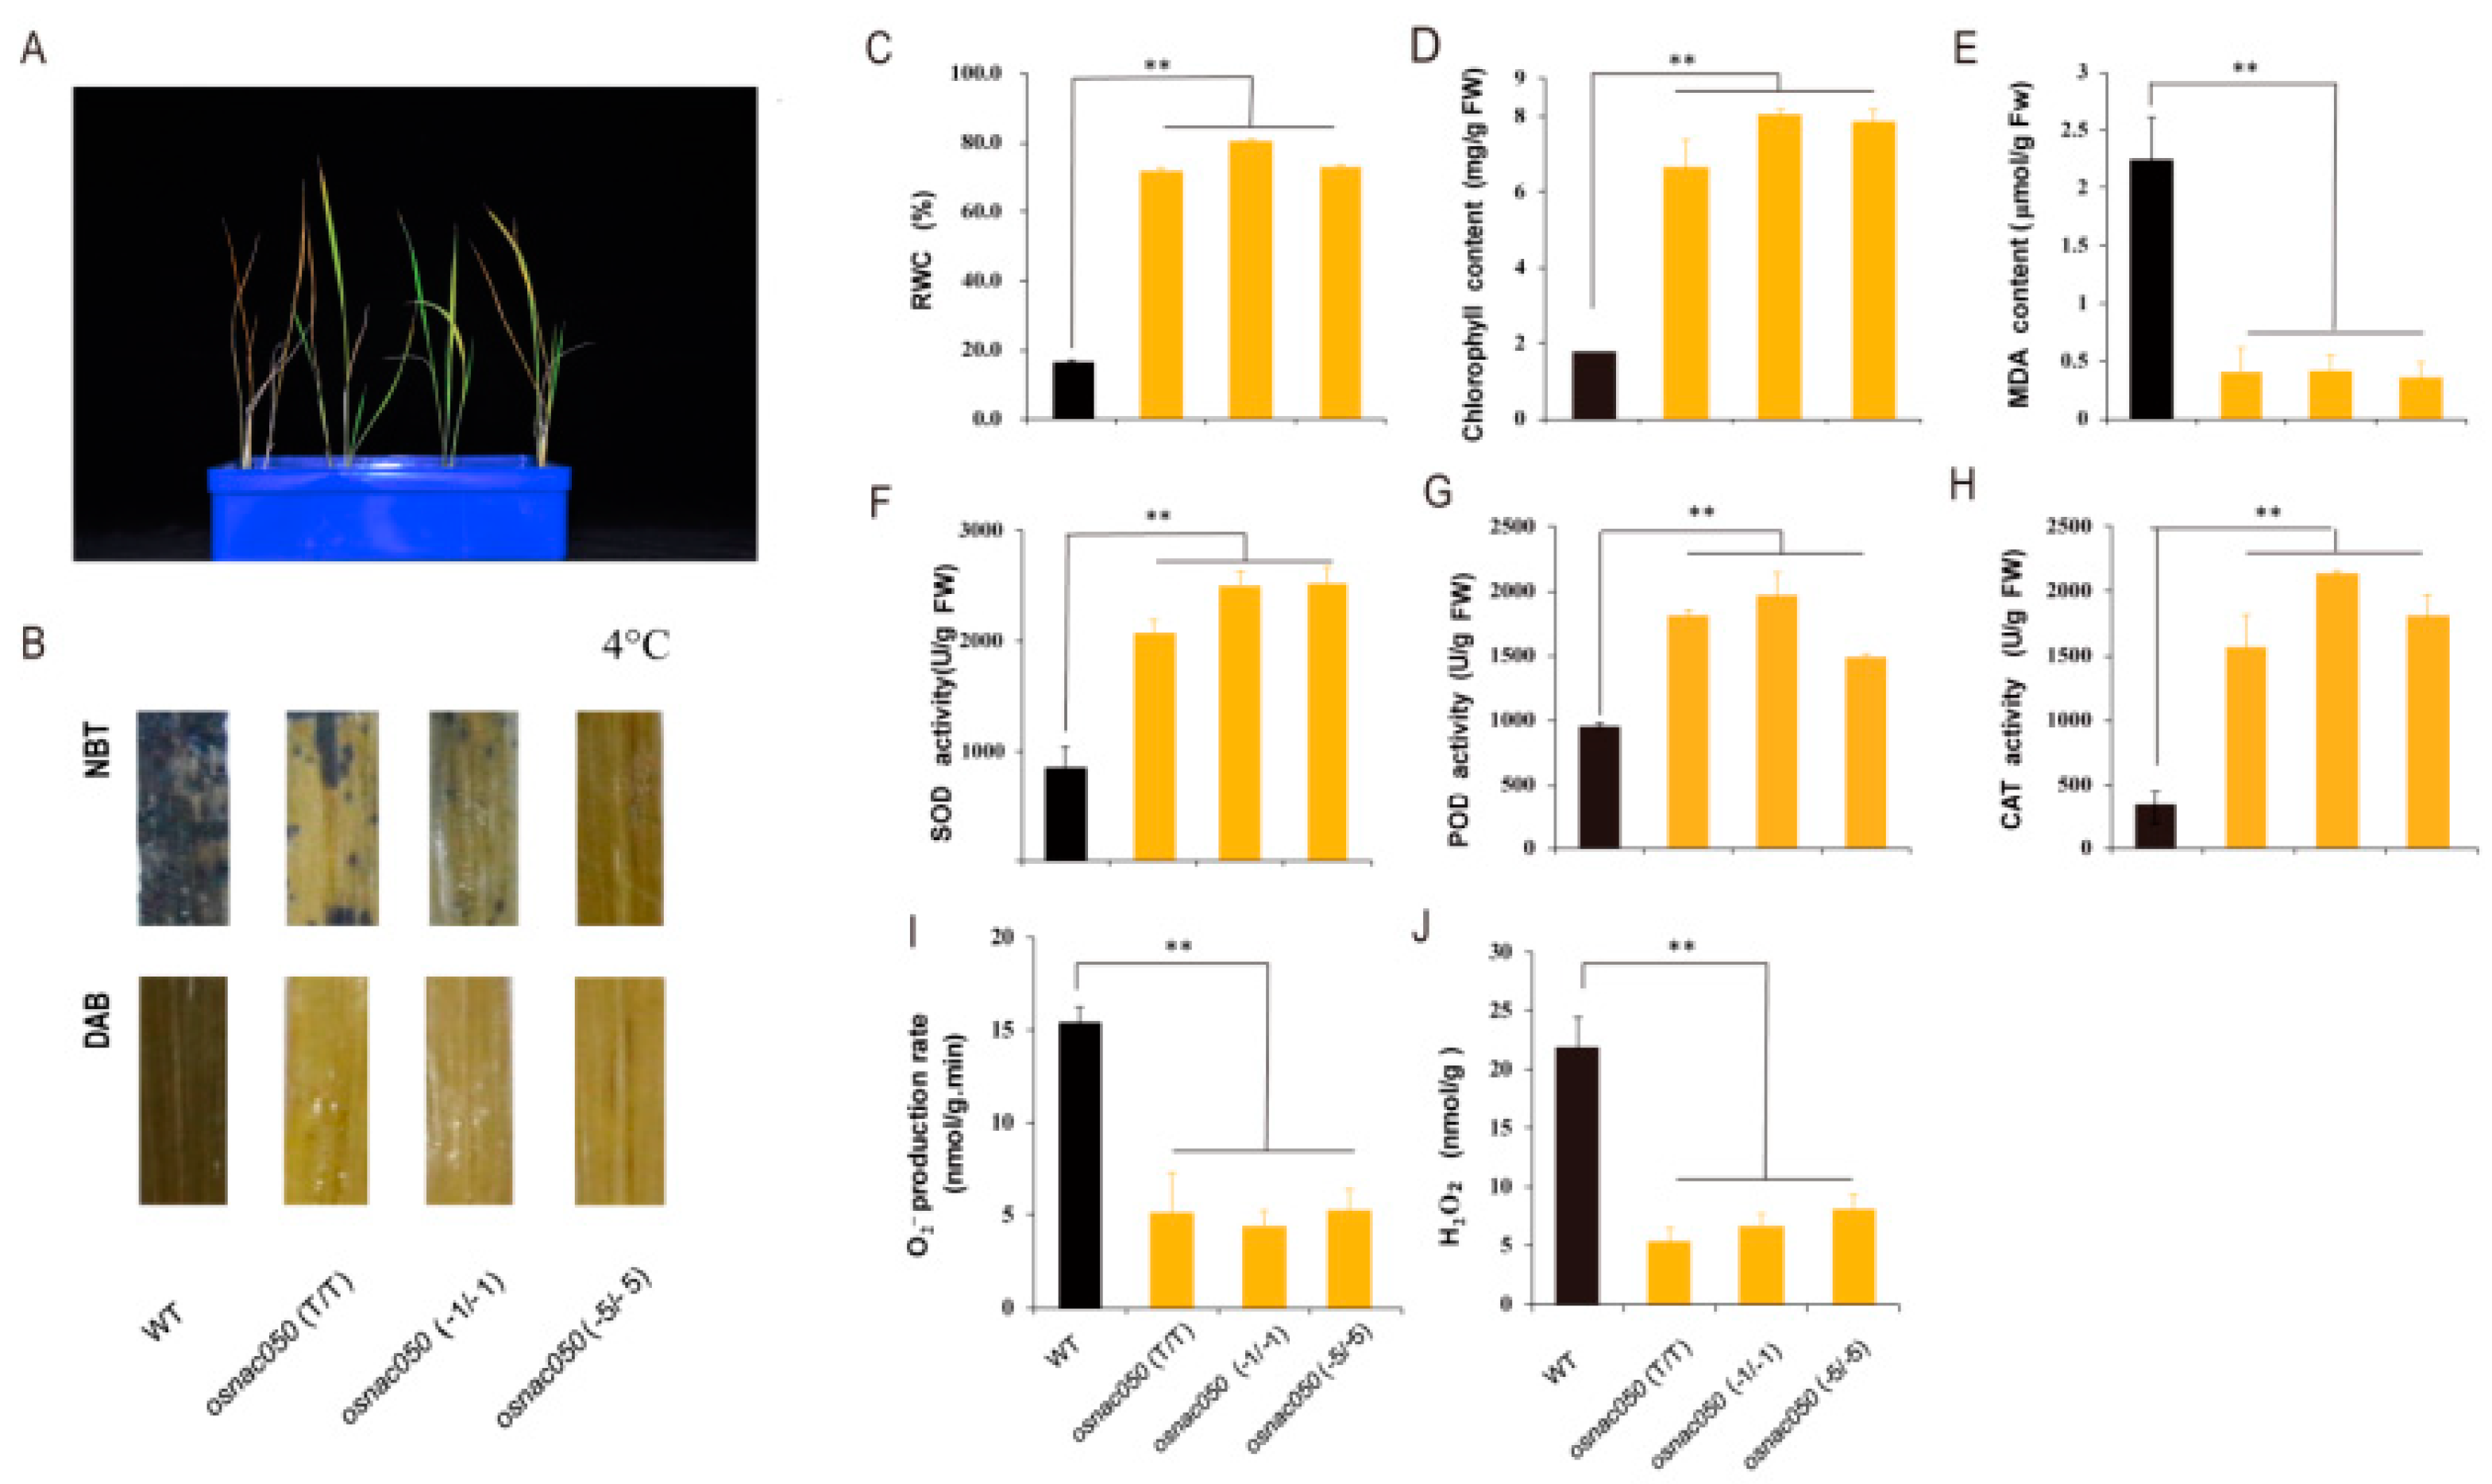
3.3. Loss of function of OsNAC050 increases cold tolerance in rice seedlings
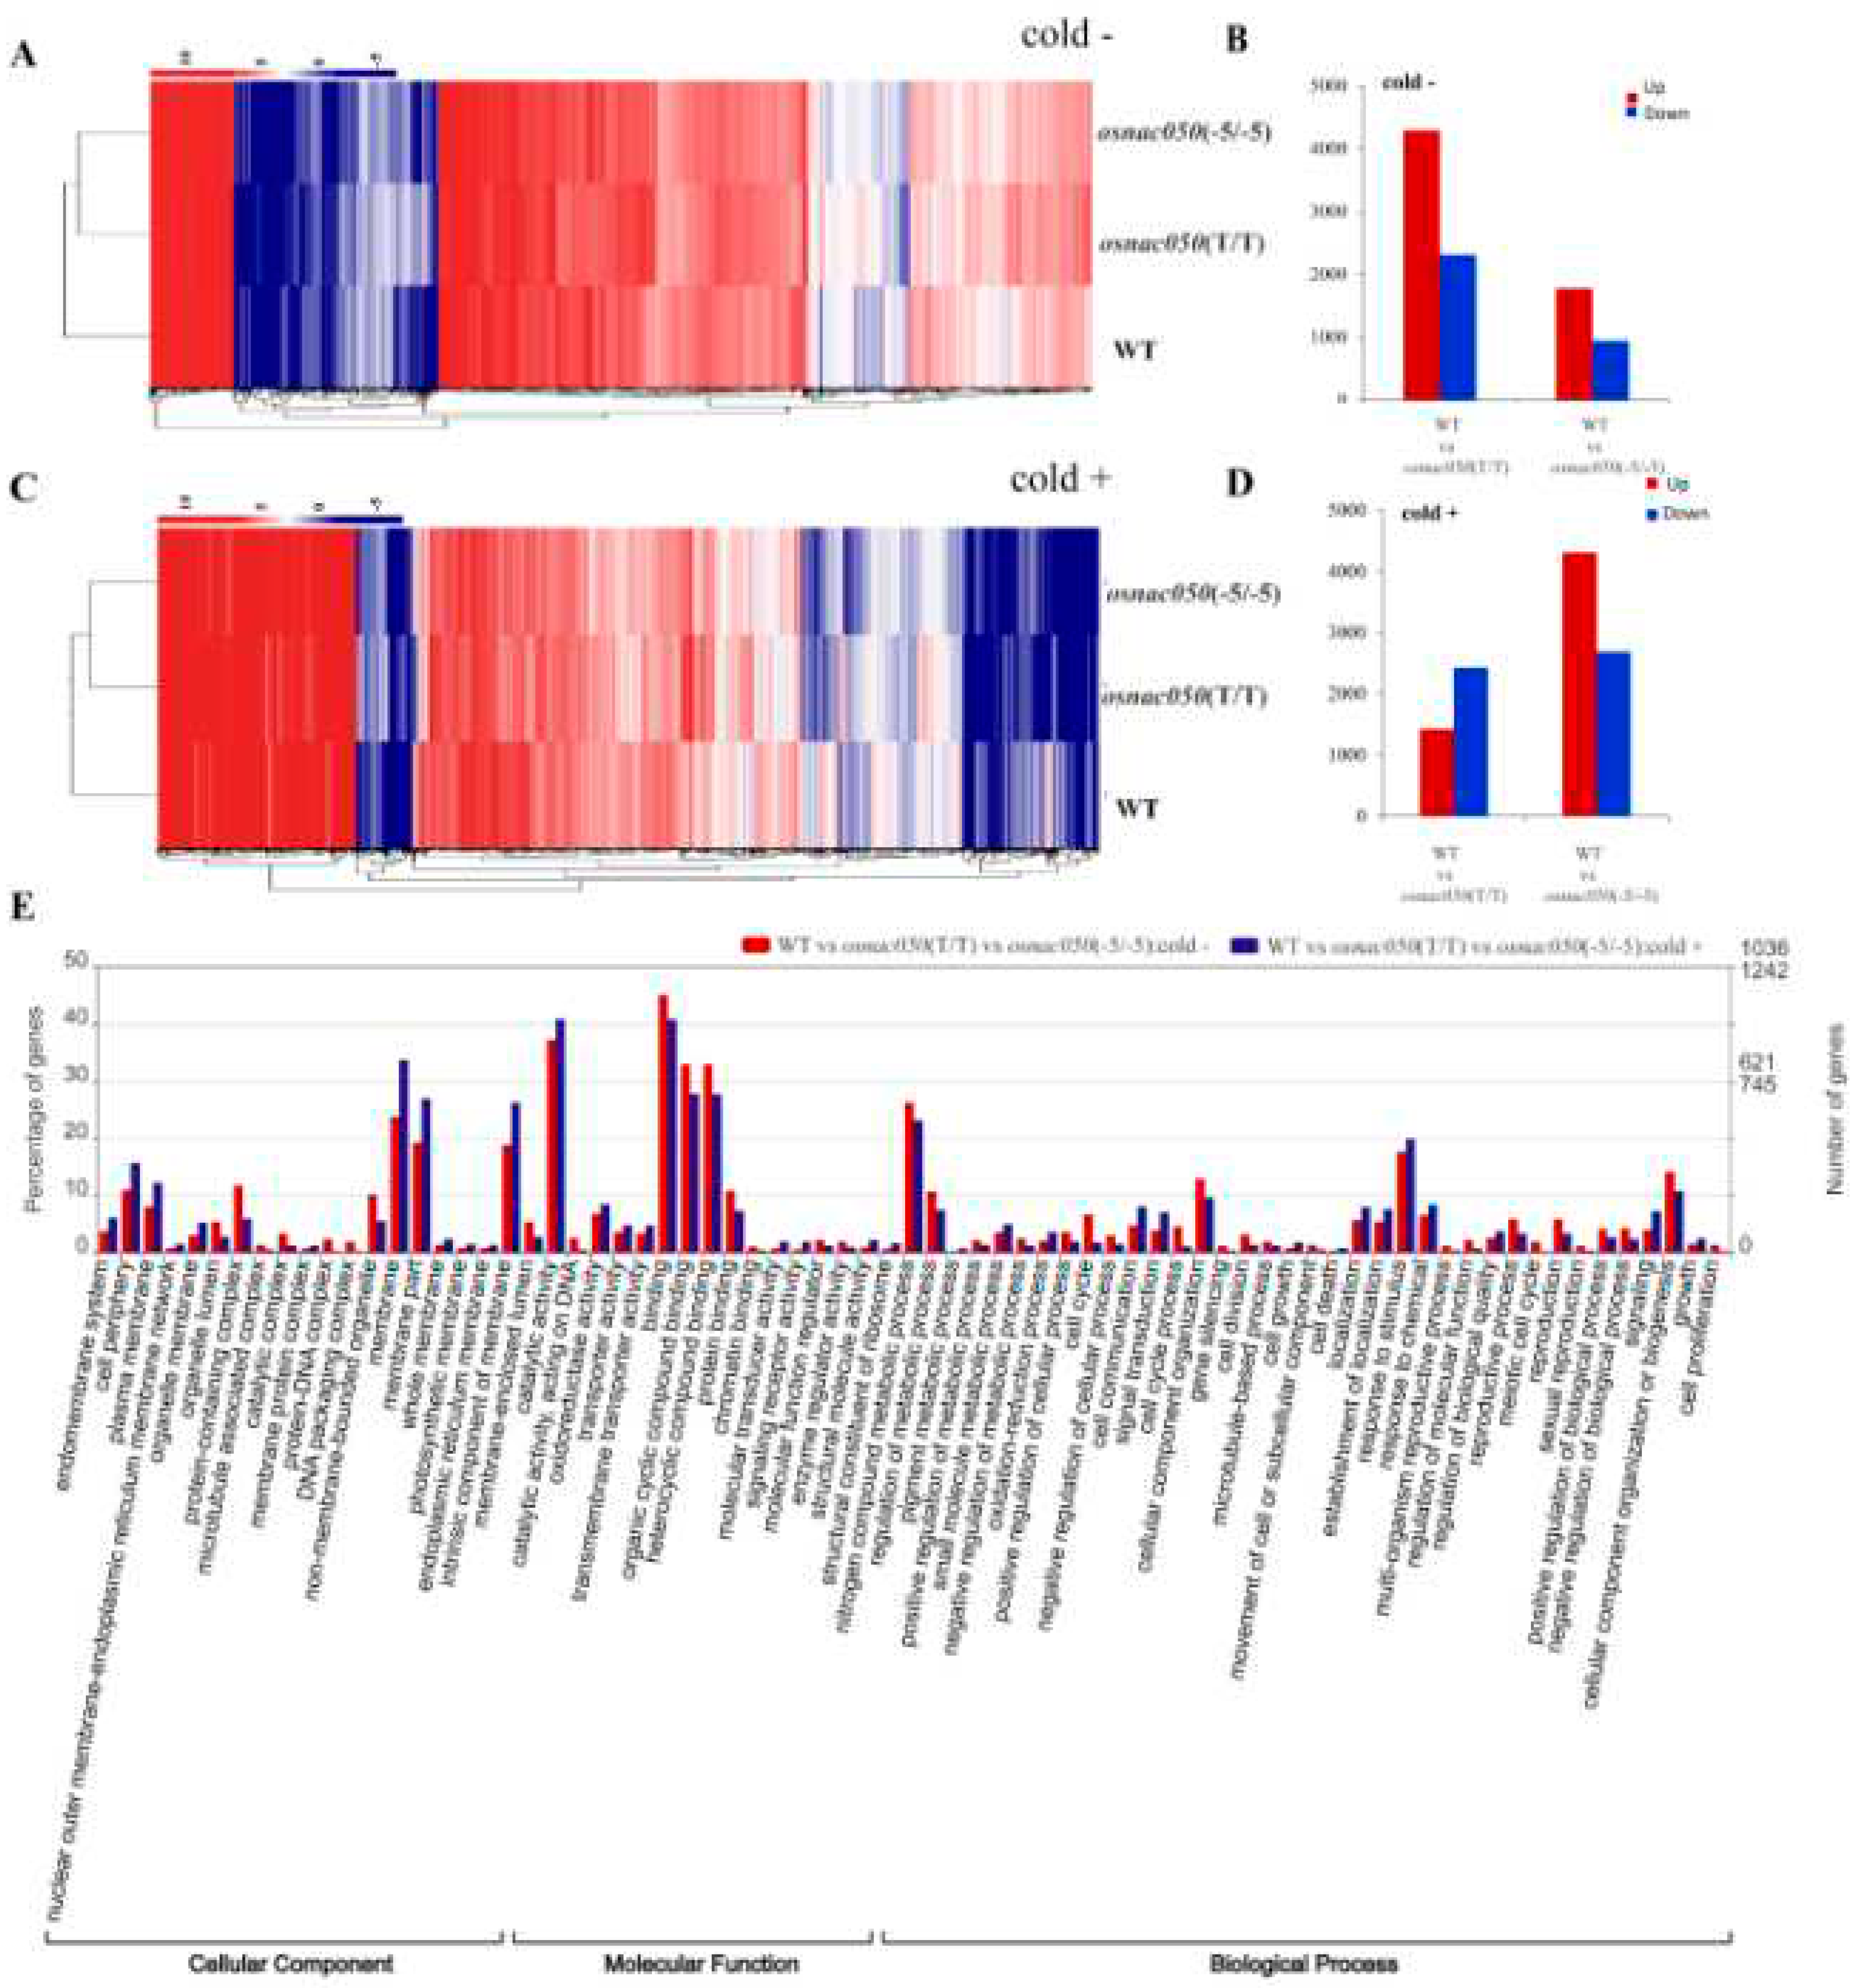
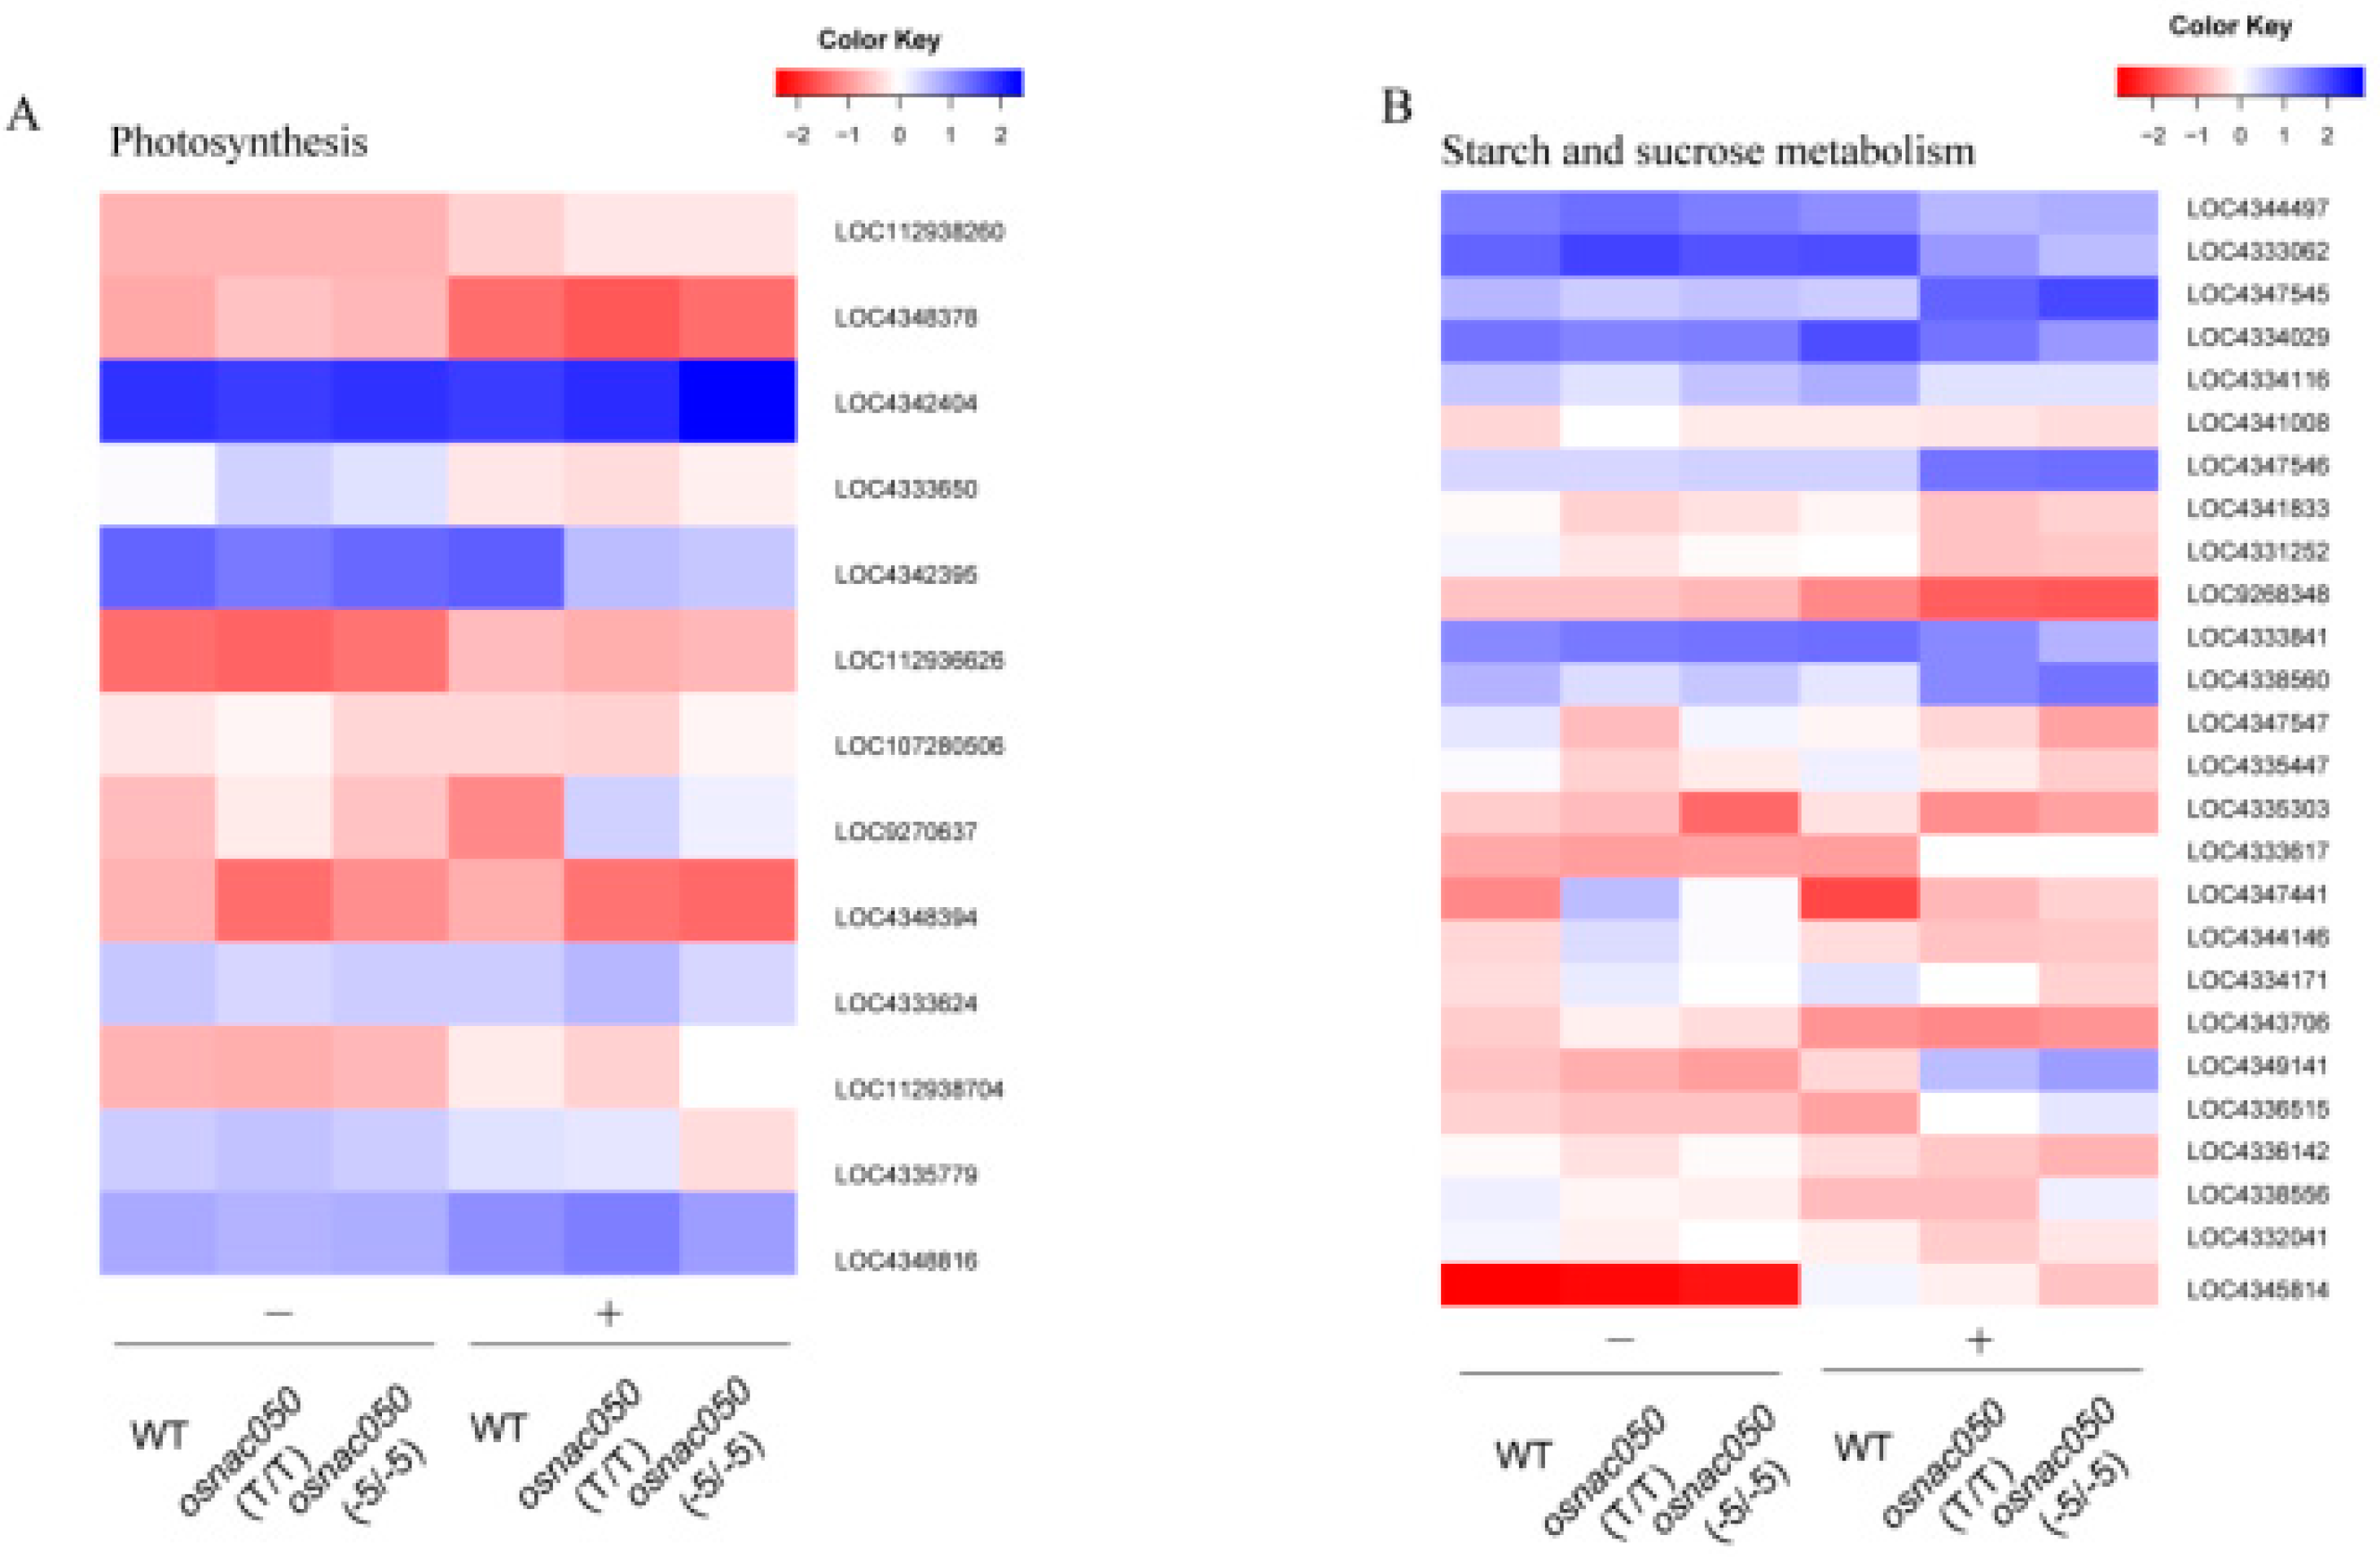
3.4. Knocking out OsNAC050 expression changed global gene expression in rice.
4. Discussion
5. Conclusions
Supplementary Materials
Funding
Data Availability Statement
References
- Apriyanto, A., J. Compart, V. Zimmermann, S. Alseekh, A. R. Fernie, and J. Fettke. 2022. 'Indication that starch and sucrose are biomarkers for oil yield in oil palm (Elaeis guineensis Jacq.)', Food Chem, 393: 133361. [CrossRef]
- Bao, G., C. Zhuo, C. Qian, T. Xiao, Z. Guo, and S. Lu. 2016. 'Co-expression of NCED and ALO improves vitamin C level and tolerance to drought and chilling in transgenic tobacco and stylo plants', Plant Biotechnol J, 14: 206-14. [CrossRef]
- Chen, K., Z. Shi, S. Zhang, Y. Wang, X. Xia, Y. Jiang, S. Gull, L. Chen, H. Guo, T. Wu, H. Zhang, J. Liu, and W. Kong. 2022. 'Methylation and expression of rice NLR genes after low temperature stress', Gene, 845: 146830. [CrossRef]
- Di, Q., Y. Li, S. Li, A. Shi, M. Zhou, H. Ren, Y. Yan, C. He, J. Wang, M. Sun, and X. Yu. 2022. 'Photosynthesis Mediated by RBOH-Dependent Signaling Is Essential for Cold Stress Memory', Antioxidants (Basel), 11. [CrossRef]
- El Mannai, Y., K. Akabane, K. Hiratsu, N. Satoh-Nagasawa, and H. Wabiko. 2017. 'The NAC Transcription Factor Gene OsY37 (ONAC011) Promotes Leaf Senescence and Accelerates Heading Time in Rice', Int J Mol Sci, 18. [CrossRef]
- Gai, Z., L. Liu, J. Zhang, J. Liu, and L. Cai. 2020. 'Effects of exogenous alpha-oxoglutarate on proline accumulation, ammonium assimilation and photosynthesis of soybean seedling (Glycine max(L.) Merr.) exposed to cold stress', Sci Rep, 10: 17017. [CrossRef]
- Gong, B., X. Li, K. M. VandenLangenberg, D. Wen, S. Sun, M. Wei, Y. Li, F. Yang, Q. Shi, and X. Wang. 2014. 'Overexpression of S-adenosyl-L-methionine synthetase increased tomato tolerance to alkali stress through polyamine metabolism', Plant Biotechnol J, 12: 694-708. [CrossRef]
- Guo, Z., L. Cai, C. Liu, Z. Chen, S. Guan, W. Ma, and G. Pan. 2022. 'Low-temperature stress affects reactive oxygen species, osmotic adjustment substances, and antioxidants in rice (Oryza sativa L.) at the reproductive stage', Sci Rep, 12: 6224.
- Huang, L., Y. Hong, H. Zhang, D. Li, and F. Song. 2016. 'Rice NAC transcription factor ONAC095 plays opposite roles in drought and cold stress tolerance', BMC Plant Biol, 16: 203. [CrossRef]
- Jiang, Z., Q. Chen, L. Chen, H. Yang, M. Zhu, Y. Ding, W. Li, Z. Liu, Y. Jiang, and G. Li. 2021. 'Efficiency of Sucrose to Starch Metabolism Is Related to the Initiation of Inferior Grain Filling in Large Panicle Rice', Front Plant Sci, 12: 732867. [CrossRef]
- Joo, J. Y., M. S. Kim, Y. G. Cho, A. R. Fernie, and J. Sung. 2022. 'Transcriptional Comparison of Genes Associated with Photosynthesis, Photorespiration, and Photo-Assimilate Allocation and Metabolic Profiling of Rice Species', Int J Mol Sci, 23.
- Kang, M., G. Liu, Y. Zeng, J. Zhou, J. Shi, L. Tang, L. Liu, W. Cao, Y. Zhu, and B. Liu. 2022. 'Extreme Low-Temperature Stress Affects Nutritional Quality of Amino Acids in Rice', Front Plant Sci, 13: 905348. [CrossRef]
- Li, F., H. Deng, Y. Wang, X. Li, X. Chen, L. Liu, and H. Zhang. 2021. 'Potato growth, photosynthesis, yield, and quality response to regulated deficit drip irrigation under film mulching in a cold and arid environment', Sci Rep, 11: 15888.
- Liu, G., X. Li, S. Jin, X. Liu, L. Zhu, Y. Nie, and X. Zhang. 2014. 'Overexpression of rice NAC gene SNAC1 improves drought and salt tolerance by enhancing root development and reducing transpiration rate in transgenic cotton', PLoS One, 9: e86895. [CrossRef]
- Liu, X. H., Y. S. Lyu, W. Yang, Z. T. Yang, S. J. Lu, and J. X. Liu. 2020. 'A membrane-associated NAC transcription factor OsNTL3 is involved in thermotolerance in rice', Plant Biotechnol J, 18: 1317-29. [CrossRef]
- Liu, X., W. Quan, and D. Bartels. 2022. 'Stress memory responses and seed priming correlate with drought tolerance in plants: an overview', Planta, 255: 45. [CrossRef]
- Liu, X., X. Zhang, R. Cao, G. Jiao, S. Hu, G. Shao, Z. Sheng, L. Xie, S. Tang, X. Wei, and P. Hu. 2021. 'CDE4 encodes a pentatricopeptide repeat protein involved in chloroplast RNA splicing and affects chloroplast development under low-temperature conditions in rice', J Integr Plant Biol, 63: 1724-39. [CrossRef]
- Lopez-Gonzalez, C., S. Juarez-Colunga, S. Trachsel, N. Marsch-Martinez, C. S. Gillmor, and A. Tiessen. 2022. 'Analysis of Global Gene Expression in Maize (Zea mays) Vegetative and Reproductive Tissues That Differ in Accumulation of Starch and Sucrose', Plants (Basel), 11. [CrossRef]
- Lu, G., L. Wang, L. Zhou, X. Su, H. Guo, and H. Cheng. 2022. 'Overexpression of AmCBF1 enhances drought and cold stress tolerance, and improves photosynthesis in transgenic cotton', PeerJ, 10: e13422.
- Mao, C., S. Lu, B. Lv, B. Zhang, J. Shen, J. He, L. Luo, D. Xi, X. Chen, and F. Ming. 2017. 'A Rice NAC Transcription Factor Promotes Leaf Senescence via ABA Biosynthesis', Plant Physiol, 174: 1747-63. [CrossRef]
- Mohamadi Esboei, M., A. Ebrahimi, M. R. Amerian, and H. Alipour. 2022. 'Melatonin confers fenugreek tolerance to salinity stress by stimulating the biosynthesis processes of enzymatic, non-enzymatic antioxidants, and diosgenin content', Front Plant Sci, 13: 890613.
- Nilholm, C., L. Manoharan, B. Roth, M. D'Amato, and B. Ohlsson. 2022. 'A starch- and sucrose-reduced dietary intervention in irritable bowel syndrome patients produced a shift in gut microbiota composition along with changes in phylum, genus, and amplicon sequence variant abundances, without affecting the micro-RNA levels', United European Gastroenterol J, 10: 363-75.
- Ramanjulu, S., and D. Bartels. 2002. 'Drought- and desiccation-induced modulation of gene expression in plants', Plant Cell Environ, 25: 141-51.
- Ren, Y., Z. Huang, H. Jiang, Z. Wang, F. Wu, Y. Xiong, and J. Yao. 2021. 'A heat stress responsive NAC transcription factor heterodimer plays key roles in rice grain filling', J Exp Bot, 72: 2947-64. [CrossRef]
- Roth, B., J. Myllyvainio, M. D'Amato, E. Larsson, and B. Ohlsson. 2022. 'A Starch- and Sucrose-Reduced Diet in Irritable Bowel Syndrome Leads to Lower Circulating Levels of PAI-1 and Visfatin: A Randomized Controlled Study', Nutrients, 14. [CrossRef]
- Shen, J., B. Lv, L. Luo, J. He, C. Mao, D. Xi, and F. Ming. 2017. 'The NAC-type transcription factor OsNAC2 regulates ABA-dependent genes and abiotic stress tolerance in rice', Sci Rep, 7: 40641. [CrossRef]
- Shi, W., Q. Ma, W. Yin, T. Liu, Y. Song, Y. Chen, L. Song, H. Sun, S. Hu, T. Liu, R. Jiang, D. Lv, B. Song, J. Wang, and X. Liu. 2022. 'The transcription factor StTINY3 enhances cold-induced sweetening resistance by coordinating starch resynthesis and sucrose hydrolysis in potato', J Exp Bot, 73: 4968-80. [CrossRef]
- Sun, Y., K. Song, M. Guo, H. Wu, X. Ji, L. Hou, X. Liu, and S. Lu. 2022. 'A NAC Transcription Factor from 'Sea Rice 86' Enhances Salt Tolerance by Promoting Hydrogen Sulfide Production in Rice Seedlings', Int J Mol Sci, 23. [CrossRef]
- Szechynska-Hebda, M., I. Wasek, G. Golebiowska-Pikania, E. Dubas, I. Zur, and M. Wedzony. 2015. 'Photosynthesis-dependent physiological and genetic crosstalk between cold acclimation and cold-induced resistance to fungal pathogens in triticale (Triticosecale Wittm.)', J Plant Physiol, 177: 30-43. [CrossRef]
- Takasaki, H., K. Maruyama, S. Kidokoro, Y. Ito, Y. Fujita, K. Shinozaki, K. Yamaguchi-Shinozaki, and K. Nakashima. 2010. 'The abiotic stress-responsive NAC-type transcription factor OsNAC5 regulates stress-inducible genes and stress tolerance in rice', Mol Genet Genomics, 284: 173-83. [CrossRef]
- Tang, X., X. Zheng, Y. Qi, D. Zhang, Y. Cheng, A. Tang, D. F. Voytas, and Y. Zhang. 2016. 'A Single Transcript CRISPR-Cas9 System for Efficient Genome Editing in Plants', Mol Plant, 9: 1088-91. [CrossRef]
- Toczewska, J., A. Zalewska, T. Konopka, and M. Maciejczyk. 2022. 'Enzymatic antioxidants activity in gingival crevicular fluid and saliva in advanced periodontitis', Oral Dis. [CrossRef]
- Wang, B., Z. Zhong, X. Wang, X. Han, D. Yu, C. Wang, W. Song, X. Zheng, C. Chen, and Y. Zhang. 2020. 'Knockout of the OsNAC006 Transcription Factor Causes Drought and Heat Sensitivity in Rice', Int J Mol Sci, 21. [CrossRef]
- Wang, W., J. Du, L. Chen, Y. Zeng, X. Tan, Q. Shi, X. Pan, Z. Wu, and Y. Zeng. 2021. 'Transcriptomic, proteomic, and physiological comparative analyses of flooding mitigation of the damage induced by low-temperature stress in direct seeded early indica rice at the seedling stage', BMC Genomics, 22: 176. [CrossRef]
- Wang, Z., J. Sun, X. Zu, J. Gong, H. Deng, R. Hang, X. Zhang, C. Liu, X. Deng, L. Luo, X. Wei, X. Song, and X. Cao. 2022. 'Pseudouridylation of chloroplast ribosomal RNA contributes to low temperature acclimation in rice', New Phytol. [CrossRef]
- Xie, F., H. Zhang, Z. Xiong, Y. Wu, and L. Ai. 2022. 'Effects and mechanism of sucrose on retrogradation, freeze-thaw stability, and texture of corn starch-tamarind seed polysaccharide complexes', J Food Sci, 87: 623-35.
- Xiong, H., L. Hua, I. Reyna-Llorens, Y. Shi, K. M. Chen, N. Smirnoff, J. Kromdijk, and J. M. Hibberd. 2021. 'Photosynthesis-independent production of reactive oxygen species in the rice bundle sheath during high light is mediated by NADPH oxidase', Proc Natl Acad Sci U S A, 118.
- Yamori, W., N. Sakata, Y. Suzuki, T. Shikanai, and A. Makino. 2011. 'Cyclic electron flow around photosystem I via chloroplast NAD(P)H dehydrogenase (NDH) complex performs a significant physiological role during photosynthesis and plant growth at low temperature in rice', Plant J, 68: 966-76. [CrossRef]
- Yang, Y., M. Jiang, J. Feng, C. Wu, W. Shan, J. Kuang, J. Chen, Z. Hu, and W. Lu. 2021. 'Transcriptome analysis of low-temperature-affected ripening revealed MYB transcription factors-mediated regulatory network in banana fruit', Food Res Int, 148: 110616. [CrossRef]
- Yarra, R., and W. Wei. 2021. 'The NAC-type transcription factor GmNAC20 improves cold, salinity tolerance, and lateral root formation in transgenic rice plants', Funct Integr Genomics, 21: 473-87.
- Yoo, S. D., Y. H. Cho, and J. Sheen. 2007. 'Arabidopsis mesophyll protoplasts: a versatile cell system for transient gene expression analysis', Nat Protoc, 2: 1565-72. [CrossRef]
- Yu, J., S. Xu, X. Liu, T. Li, D. Zhang, N. Teng, and Z. Wu. 2022. 'Starch Degradation and Sucrose Accumulation of Lily Bulbs after Cold Storage', Int J Mol Sci, 23. [CrossRef]
- Yu, Z., H. Liu, S. Mao, J. Zhang, J. Zhang, E. Yu, and L. Qu. 2022. 'Low-Temperature Thermal Desorption Effectively Mitigates Accumulation of Total Mercury and Methylmercury in Rice (Oryza sativa L.)', Bull Environ Contam Toxicol. [CrossRef]
- Zhang, J., Y. Sun, Z. Zhou, Y. Zhang, Y. Yang, X. Zan, X. Li, J. Wan, X. Gao, R. Chen, Z. Huang, L. Li, and Z. Xu. 2022. 'OsSCL30 overexpression reduces the tolerance of rice seedlings to low temperature, drought and salt', Sci Rep, 12: 8385.
- Zhang, X., Y. Long, X. Chen, B. Zhang, Y. Xin, L. Li, S. Cao, F. Liu, Z. Wang, H. Huang, D. Zhou, and J. Xia. 2021. 'A NAC transcription factor OsNAC3 positively regulates ABA response and salt tolerance in rice', BMC Plant Biol, 21: 546. [CrossRef]
- Zhao, F., T. Zhao, L. Deng, D. Lv, X. Zhang, X. Pan, J. Xu, and G. Long. 2017. 'Visualizing the Essential Role of Complete Virion Assembly Machinery in Efficient Hepatitis C Virus Cell-to-Cell Transmission by a Viral Infection-Activated Split-Intein-Mediated Reporter System', J Virol, 91. [CrossRef]
- Zhong, Z., Y. Zhang, Q. You, X. Tang, Q. Ren, S. Liu, L. Yang, Y. Wang, X. Liu, B. Liu, T. Zhang, X. Zheng, Y. Le, Y. Zhang, and Y. Qi. 2018. 'Plant Genome Editing Using FnCpf1 and LbCpf1 Nucleases at Redefined and Altered PAM Sites', Mol Plant, 11: 999-1002. [CrossRef]
Disclaimer/Publisher’s Note: The statements, opinions and data contained in all publications are solely those of the individual author(s) and contributor(s) and not of MDPI and/or the editor(s). MDPI and/or the editor(s) disclaim responsibility for any injury to people or property resulting from any ideas, methods, instructions or products referred to in the content. |
© 2023 by the authors. Licensee MDPI, Basel, Switzerland. This article is an open access article distributed under the terms and conditions of the Creative Commons Attribution (CC BY) license (http://creativecommons.org/licenses/by/4.0/).


