Preprint
Article

Evaluation of Implant Stability Measurements According to Implant Placement Site and Duration in Elderly Patients: A Prospective Multi-Center Clinical Study

Altmetrics

Downloads

200

Views

68

Comments

0

Submitted:

07 May 2023

Posted:

09 May 2023

You are already at the latest version

Alerts
Abstract
As medical care aiming to maintain the quality of life for elderly patients is increases, implant treatment for elderly patients is increasing worldwide. Therefore, we aimed to investigate implant stability and the reliability of different measuring devices according to implant placement site and duration in patients aged over 65 years. The study evaluated 60 implants in 60 patients aged ≥ 65 years. The implant placement sites were divided into six evenly distributed sections (n=10) i.e., maxillary right- posterior, A; maxillary anterior, B; maxillary left-posterior, C; mandibular right-posterior, D; mandibular anterior, E; mandibular left-posterior, F. Participants visited the hospital seven times: preoperatively, 1V; implant surgery, 2V; stitch removal, 3V; 1-month follow-up, 4V; 2-months follow-up, 5V; before final-restoration delivery, 6V; and after final-restoration delivery, 7V. The implant stability was evaluated with the Osstell Mentor (ISQ), Periotest M (PTV), and Anycheck (IST). The mean values of ISQ, PTV, and IST were analyzed (α=.05). ISQ, PTV, and IST results of 5V and 6V were significantly higher than those of 2V (P<.05). The lowest ISQ results occurred in E location at 5V and 6V (P<.05). In all mandibular locations, IST results of 7V were significantly higher than those of 2V, 3V, 4V, and 5V (P<.05). ISQ results were negatively correlated with PTV and positively correlated with IST, and PTV was negatively correlated with IST. By considering various factors that affect implant stability, the appropriate implant load application time was determined. This could help increase the implant success rate in elderly patients. And as a diagnostic device for implant stability for evaluation of osseointegration in elderly patients, Anycheck was also able to prove its relative reliability compared to Osstell ISQ Mentor and Periotest M.
Keywords: 
Subject: Medicine and Pharmacology  -   Dentistry and Oral Surgery

1. Introduction

Osseointegration of implants and alveolar bone is essential for implants to withstand masticatory pressure and function [1,2,3]. Osseointegration of implants is defined as close contact, with no intervening soft tissue, between the titanium surface of the implant and the alveolar bone [2]. Osseointegration classically occurs after 3 to 6 months with machined or turned titanium implant surfaces, but it may occur more rapidly with enhanced surfaces [3]. Furthermore, variables affecting implant osseointegration include the volume and density of the alveolar bone, the type of implant surface, patient age, and whether bone grafts were carried out [3,4].
Recently, due to developments in implant surfaces, a procedure that allows application of a functional load faster than the traditional osseointegration period has been introduced in many studies. In South Korea, where an aging society is progressing and implant treatment is available through insurance for patients over 65 years of age, implant placement is frequently performed, even in elderly patients over the age of 80 years. Since the differentiation rate of osteoblasts decreases with increasing age, older patients should be given a longer period for osseointegration [1,2,3,4]. In addition, clinical data on the implant osseointegration period according to the volume and density of the alveolar bone, and whether bone is transplanted, are also needed. It is of utmost importance to quantify implant stability at various time points and to determine establish the timing of loading [3,4].
Therefore, the measurement of implant stability is even more necessary now, and two types of widely used non-invasive diagnostic methods have been developed and examined: resonance frequency analysis (RFA) and damping capacity analysis (DCA) [5]. In RFA, a method used by the Osstell ISQ Mentor (Osstell, Göteborg, Sweden), the stiffness of the implant-bone interface is outputted from the resonance frequency that is the response to oscillations applied to the implant-bone system [6]. One DCA system device, Periotest M (Siemens AG, Bensheim, Germany) has been utilized to assess the mobility of natural teeth and is maintained to have the potential to reliably evaluate the stability of the implant-bone interface [7,8]. Recently, the new DCA system device, Anycheck (Neobiotech, Seoul, Korea) has been released; it is a measuring device that uses percussion, and has improved accuracy and reduced patient discomfort by reducing the intensity of the percussion [9]. This system evaluates the duration of contact between a impacting rod and a healing abutment. It strikes the healing abutment 6 times over 2 seconds and converts the duration into implant stability test (IST) values [9]. This system strikes a healing abutment by less force than Periotest M does and has the function that allows it to stop automatically that stability is low to protect the implant [9]. However, little is known about the factors affecting the IST values or the reliability of the device.
Multiple previous studies have reported on the correlation between RFA and DCA device results indicating the stability of the same implant. An in vitro study presented the strong correlation between the results from RFA and DCA devices [9,10,11]. However, in vivo studies presented the relatively lower correlation between the results from RFA and DCA devices [12,13]. The different results under experimental and clinical conditions suggest that there are clinical factors which affect the reliability of implant stability measuring devices. In the experimental condition implant stability can be examined without any obstacles and the device can be positioned in relation to the implant in an ideal way. Clinically, examination of the stability of the implant in the oral cavity may have access difficulties due to the cheek, tongue, and contralateral teeth. These obstacles may unfavorably influence the factors needed for accurate measurement of implant stability, including exact contact between implant and device, the angle of the device to the implant, and the angle of the device against gravity. In addition, in the clinical condition, the accessibility and angle of the device is influenced by the location of the implant in the oral cavity (anterior/ posterior, left/ right, and mandible/ maxilla).
Therefore, reliable implant stability measurement is required to evaluate the degree of osseointegration according to the implant placement site. However, there are few prospective clinical studies evaluating implant stability, and measuring device reliability, according to the implant placement site and post-implantation duration in older patients. Therefore, the aim of this in vivo study was to evaluate implant stability, and the reliability of different measuring devices, according to the implant placement site in the oral cavity and the duration of implantation in patients over 65 years. Additionally, one RFA device (Osstell), and two DCA devices (Periotest and Anycheck) were used to examine implants located in the maxillary right posterior, maxillary anterior, maxillary left posterior, mandibular right posterior, mandibular anterior, and mandibular left posterior positions.
The null hypotheses were that 1) the implant placement site and duration of implantation in the oral cavity does not affect implant stability and measuring device reliability in patients over 65 years, and 2) a correlation of 1 is shown by the three measuring devices.

2. Materials and Methods

2.1. Study design

This study was performed with 60 patients: 30 men and 30 women aged 65 and over needing implant treatment at Korea University Guro Hospital and Dankook University Dental Hospital from 2020 to 2022. This prospective study was registered at the public clinical trials database before the commencement of the study (Clinical research information service of National Research Institute of Health in Republic of Korea, KCT0005721). Clinical trials were conducted at two dental centers following approval by the local medical ethics boards (2020GR0580 and DKUDH 2020-11-001), and the methods were conducted according to the relevant guidelines. If implant placement failed or if a participant withdrew their consent, they were considered dropouts. The sample size calculation was based on previous studies comparing implant stability diagnostic devices, and the result (correlation coefficiency = 0.777) was used as the standard [14]. Using a sample number calculation program (G power ver 3.1; Heinrich-Heine-Universität, Düsseldorf, Germany), the sample size calculation was based on the results of a paired t-test (α=.05, β=.8, two-tailed).

2.2. Patient selection

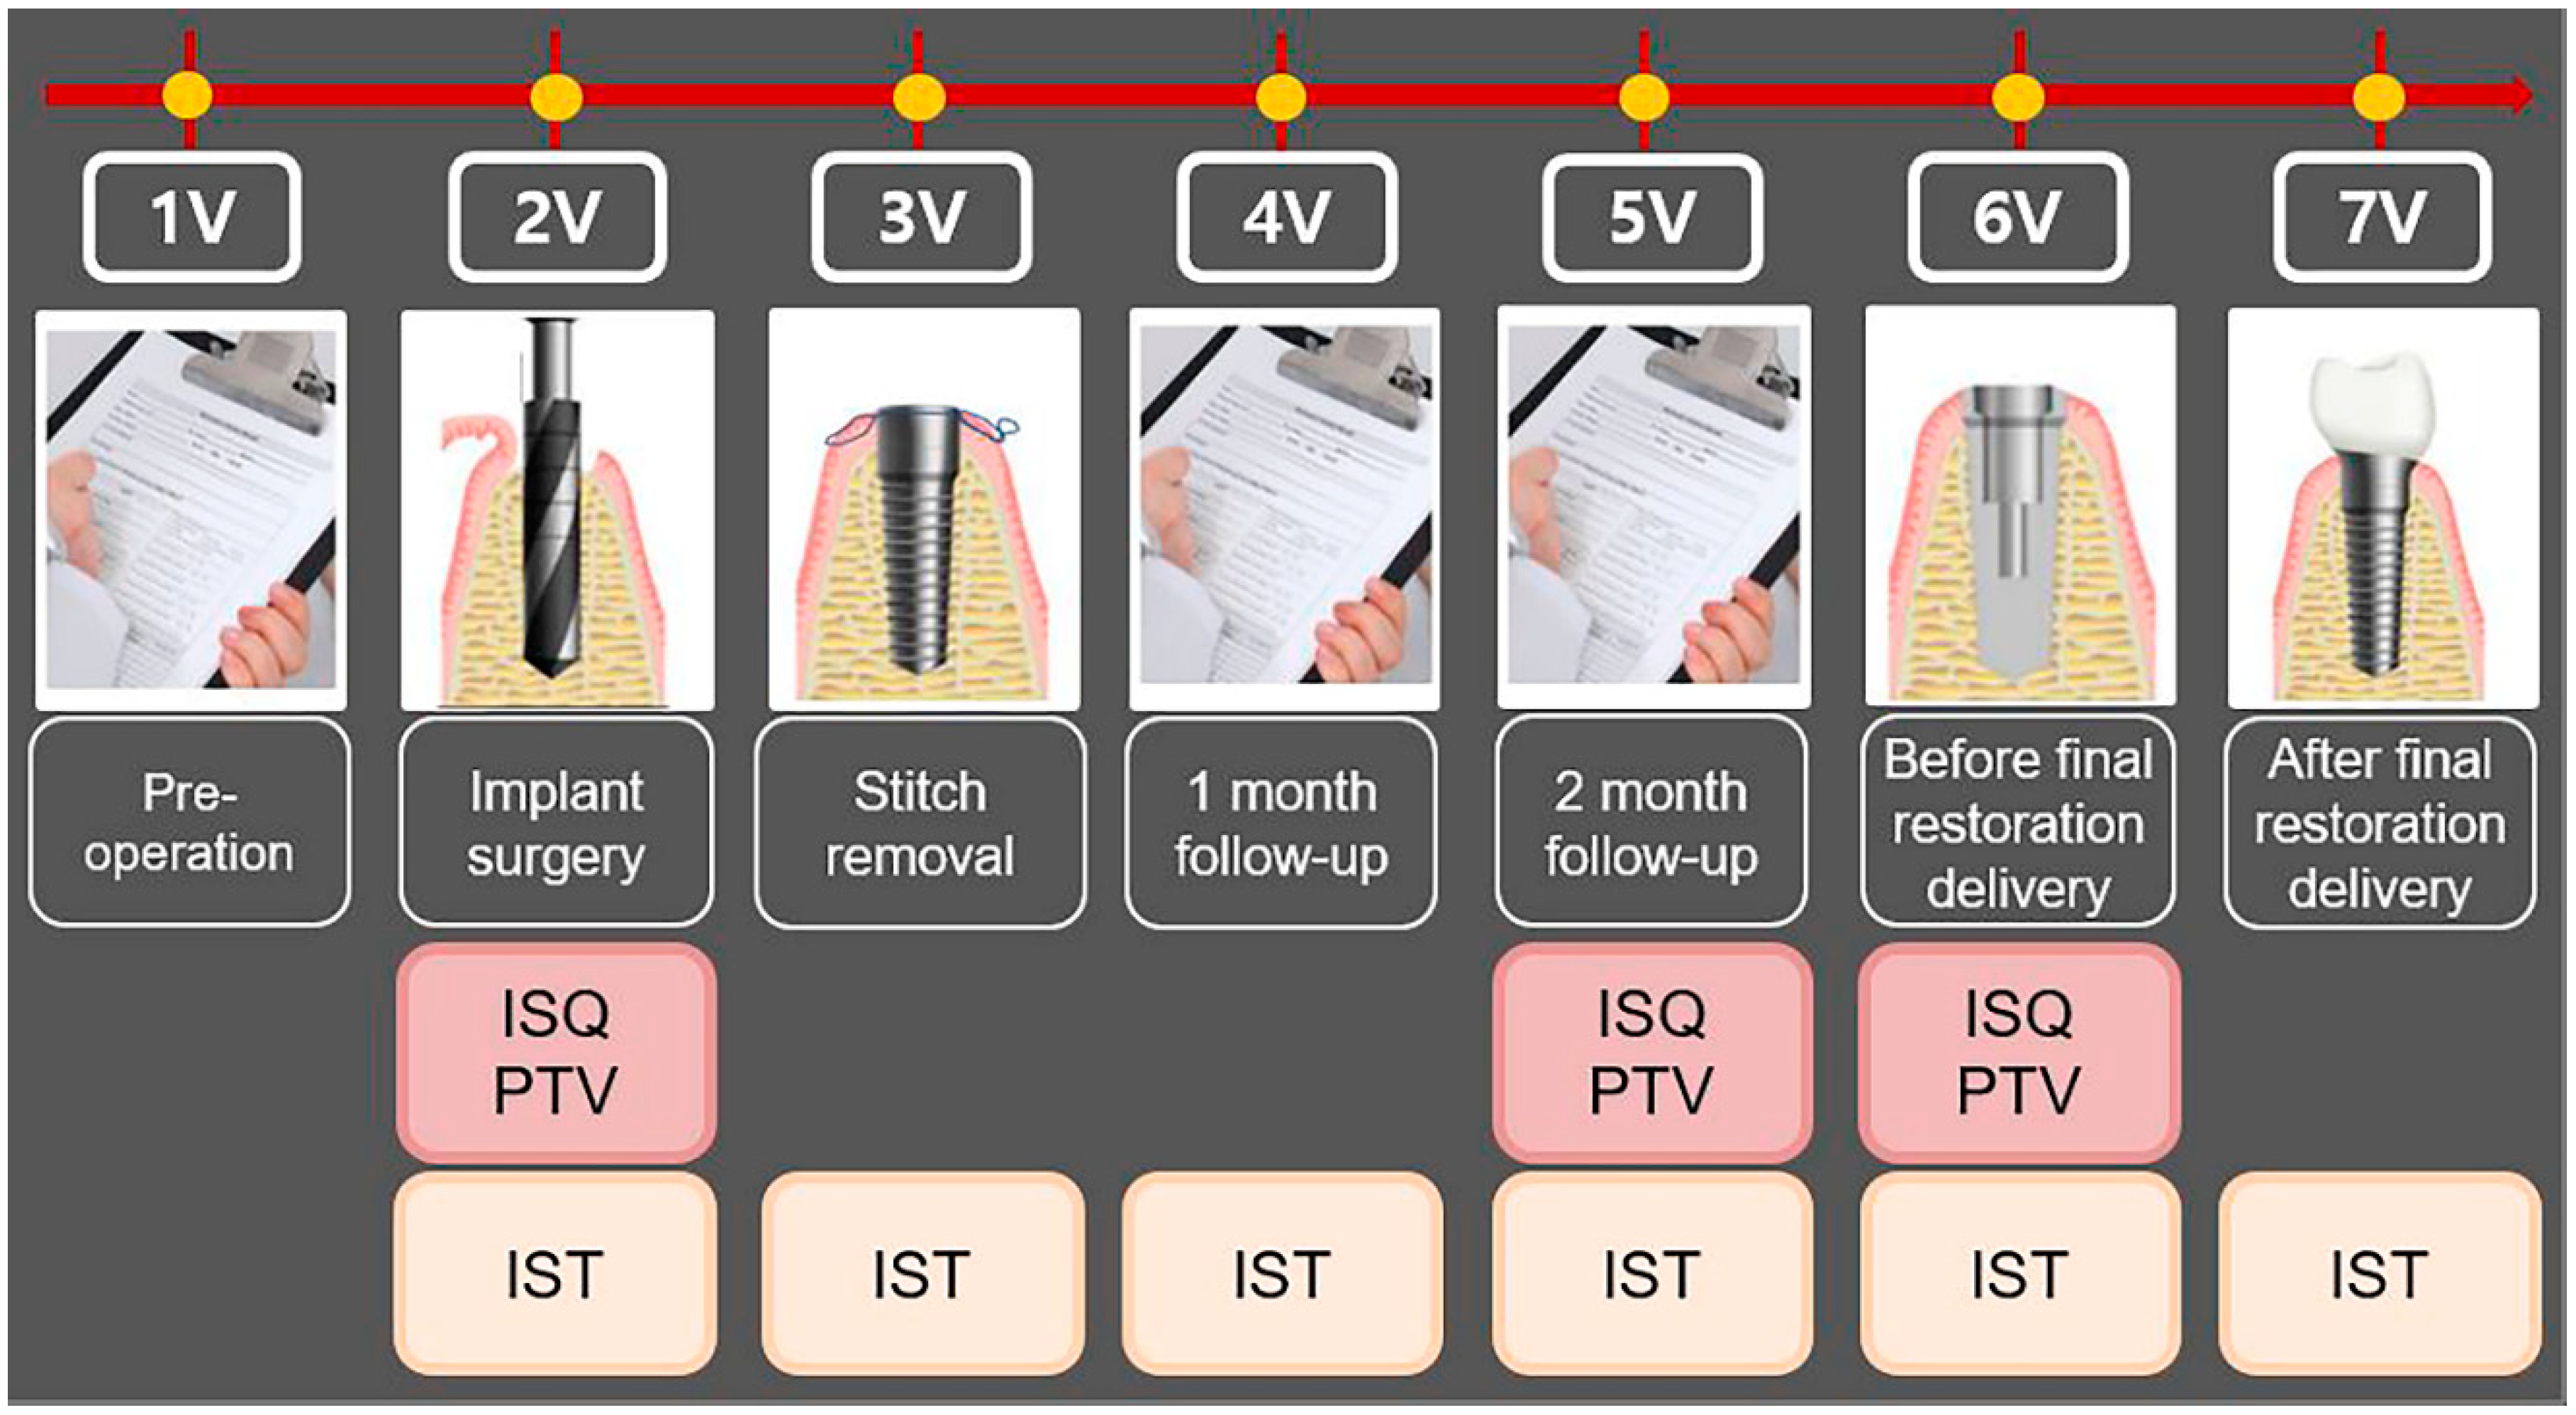
All patients had read, understood and signed the written informed consent form at least 7 days before implant surgery. Once written consent was obtained, clinical staff verified that the participant satisfied several inclusion and exclusion criteria for participation (Table 1). Participants visited the hospital seven times, including a preoperative visit (1V), implant surgery (2V), stitch removal (3V), 1-month follow-up (4V), 2-month follow-up (5V), before final restoration delivery (3- to 4-month follow-up) (6V), and after final restoration delivery (3- to 4-month follow-up) (7V). At 2V, 5V, and 6V, implant stability was evaluated with the Osstell ISQ Mentor and Periotest M, and at 2V, 3V, 4V, 5V, 6V, and 7V, stability was evaluated with the Anycheck. The study process is shown in Table 2 and Figure 1.
Table 1. The list of inclusion and exclusion criteria for participation in this study.
Criteria Lists
Inclusion 1) Those requiring implant placement
2) The anatomical conditions under which non-submerged implant
placement was favorable at stage I surgery
3) Those who agreed to participate in the clinical study and signed
the consent form for the clinical study.
Exclusion 1) The heavy smokers (> 10 cigarettes/day)
2) The presence of bone defects requiring bone augmentation
3) Those requiring implant placement following implant failure
4) Those uncontrolling medical condition
5) Those confirming or suspecting psychological problems
Table 2. Summary of the study process.
Visit Observation period Observation and clinical examination items
1V Pre-operative Obtaining written informed consent, evaluating the suitability of the research participant, allocating the participant identification code, and
taking the dental CBCT
2V Implant surgery Measurement of implant stability by all the devices
3V Stitch removal Measurement of implant stability by Anycheck
4V 1- month follow-up Measurement of implant stability by Anycheck
5V 2-months follow-up Measurement of implant stability by all the devices
6V Before final restoration delivery
(3- to 4-month follow-up)
Measurement of implant stability by all the devices
7V After final restoration delivery
(3- to 4-month follow-up)
Measurement of implant stability by Anycheck
1V, first visit; 2V, second visit; 3V, third visit; 4V, fourth visit; 5V, fifth visit; 6V, sixth visit; 7V, seventh visit.
Figure 1. Flowchart of the study process.. 1V, first visit; 2V, second visit; 3V, third visit; 4V, fourth visit; 5V, fifth visit; 6V, sixth visit; 7V, seventh visit. ISQ, implant stability quotient; PTV, Periotest value; IST, implant stability tester value.
Preprints 72969 g001

2.3. Surgical procedure

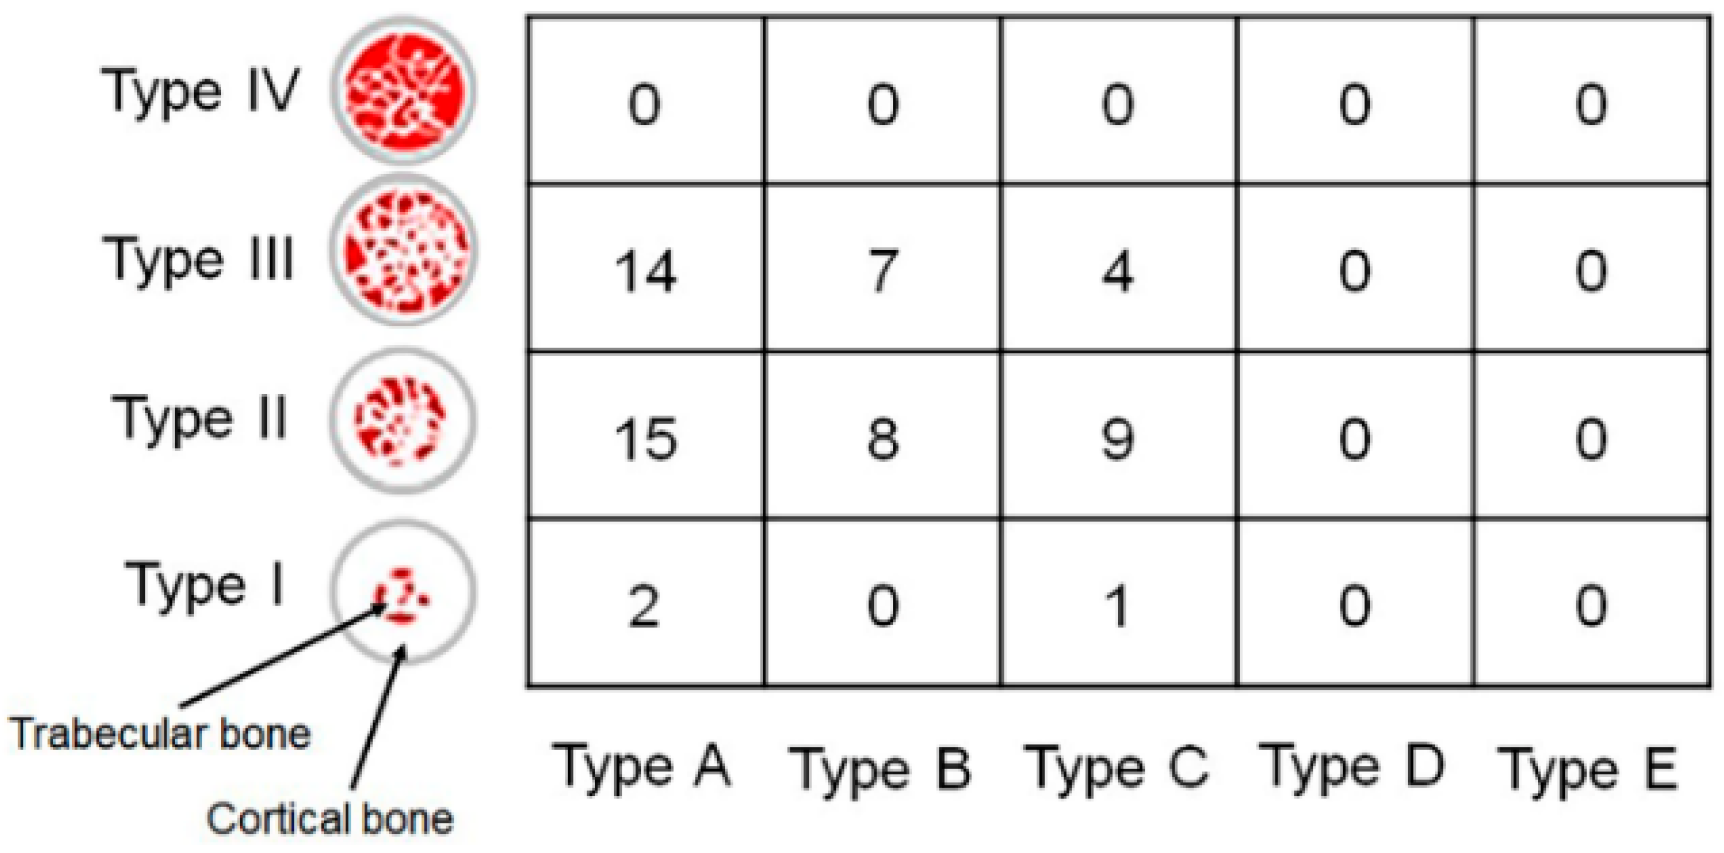
The implants were evenly distributed in the oral cavity (Table 3). The implants were placed in the maxillary right posterior (A), maxillary anterior (B), maxillary left posterior (C), mandibular right posterior (D), mandibular anterior (E), and mandibular left posterior (F) positions. An appropriate implant was selected and placed by evaluating bone quality and quantity after dental cone-beam computed tomography (CBCT) and fabricating a stent for implantation at the appropriate site for each patient. A bone-level tapered implant (CMI IS-II, Neobiotech, Seoul, Korea) with the sandblasted, large grit, acid-etched surface, and internal hex connection was used in the present study. The characteristics of the implants used in this study are presented in Table 4. To evaluate implant stability following the determined timetable, all the implants were placed in the non-submerged state. All the implants were placed without implementing any bone augmentation procedure. The drilling process followed the manufacturer’s instruction to drill the site first with a point Lindemann drill, followed by surgical drills. To achieve similar insertion torque values (ITV) of 30 Ncm between implants, a well-trained researcher carefully drilled each implant bed at a regular depth and angle in each hospital. All the implants were placed only with the handpiece of the implant engine (iCTmortor, WH-1, Dentium, Seoul, Korea). CBCT was used immediately after surgery to evaluate the bone quality around the implant [15]. The bone quality types are characterised according to Lekholm and Zarb classification (Figure 2).
Table 3. Implant placement locations.
Location of implant placement Abbreviation Number
Maxillary right posterior A 10 (Male: 5, Female: 5)
Maxillary anterior B 10 (Male: 5, Female: 5)
Maxillary left posterior C 10 (Male: 5, Female: 5)
Mandibular right posterior D 10 (Male: 5, Female: 5)
Mandibular anterior E 10 (Male: 5, Female: 5)
Mandibular left posterior F 10 (Male: 5, Female: 5)
Table 4. The characteristics of the implants used in this study.
Characteristics Size (mm) Number
Length 8.5 21
10.0 35
11.5 4
Diameter 3.5 3
4.0 20
4.5 17
5.0 20
Figure 2. The bone quality around the implant analyzed by cone-beam computed tomography according to Lekholm and Zarb classification. Type I, the entire bone is composed of very thick cortical bone; Type II, thick layer of cortical bone surrounds a core of dense trabecular bone; Type III, thin layer of cortical bone surrounds a core of trabecular bone of good strength; and Type IV, very thin layer of cortical bone with low density trabecular bone of poor strength. Type A, most of the alveolar ridge is present; Type B, moderate residual ridge resorption has occurred; Type C, advanced residual ridge resorption has occurred, and only basal bone remains; Type D, some resorption of basal bone has started; Type E, extreme resorption of the basal bone has taken place.
Preprints 72969 g002

2.4. Measurement of implant stability

A well-trained, right-handed researcher measured the implant stability in each hospital. To prevent the fixation force of the implant from changing during the process of installing and releasing the healing abutment, implant stability was evaluated with the Osstell ISQ Mentor first. For measurement with the Osstell ISQ Mentor, the smart peg was connected manually to the implant fixture. All the devices were used in accordance with the manufacturer’s instructions. The manufacturer of the Osstell ISQ Mentor recommends that the device tip be held close (2-4 mm) to the top of the smart peg without touching it and at approximately 45º to the smart peg top. Since the accuracy of the measurement may be improved if the same implant is measured repeatedly in succession, the implants in each area were measured in turns. After the measurements with the Osstell ISQ Mentor, healing abutments (Neobiotech, Seoul, Korea) were connected to the implant with 30 Ncm torque, using a torque ratchet, by selecting a height that could expose about 2 mm from the gingival level. After healing abutment connection, implant stability was measured with Anycheck and Periotest M. The percussion of Periotest M was done perpendicularly to the longitudinal axis of the abutment, holding the handpiece parallel to the floor. An angulation of more than 11 degrees from the horizontal plane is registered by the device as an error [15]. The start button was kept on top, and the rod and the healing abutment surface were required to maintain a distance of 0.6-2.0 mm. The metal rod of Anycheck and the long axis of the implant were put perpendicular to each other, similar to that of Periotest M. The tip of the tapping rod was in slight contact with the healing abutment. The device maintains the contact angle between 0 and 30 degrees. For standardization of measurement after the prosthesis was installed, the IST of the prosthesis was measured at a position 5 mm in the long axis direction from the terminal upper line of the fixture analog in the working model using digimatic vernier calipers (Mitutoyo Co., Kanagawa, Japan). All device results were measured in the buccal (or labial) direction and were recorded by one examiner in each hospital. Anycheck strikes a healing abutment six times over 3 seconds, while Periotest M is accelerated toward the implant-tooth 16 times in 4 seconds. Osstell ISQ Mentor, Periotest M, and Anycheck measurements were conducted three times for inserted fixtures.

2.5. Statistical analysis

This study was performed to evaluate the accuracy and reliability of IST based on the ISQ and PTV values that have proven accuracy for differences between groups according to the post-implantation duration and the location of the implant. All the data were evaluated using SPSS Statistics for Windows v25.0 (IBM SPSS Inc., Chicago, IL, USA). One-sample KolmogorovSmirnov tests were performed to analyze the normality of the collected data and, based on this result of the test, statistical analysis was performed. One-way analysis of variance (ANOVA) tests were used to compare differences between the groups according to the implantation location, followed by Tukey’s post-hoc comparisons. Based on the stability evaluation value at the time of implant placement, the increase in stability until final prosthesis insertion was repeatedly measured, and the mean and standard deviation calculations were based on each implant and analyzed by paired sample t-tests (α=.05). Pearson’s correlation test was used to evaluate the correlations between ISQ and PTV, between ISQ and IST, and between PTV and IST. A two-way ANOVA was performed to compare the correlations among the location of the implants in the oral cavity (anterior/posterior, left/right, mandibular/maxillary). A Tukey’s honest significant difference test was performed as the post hoc test, with the significance level set at 95% (α=.05).

3. Results

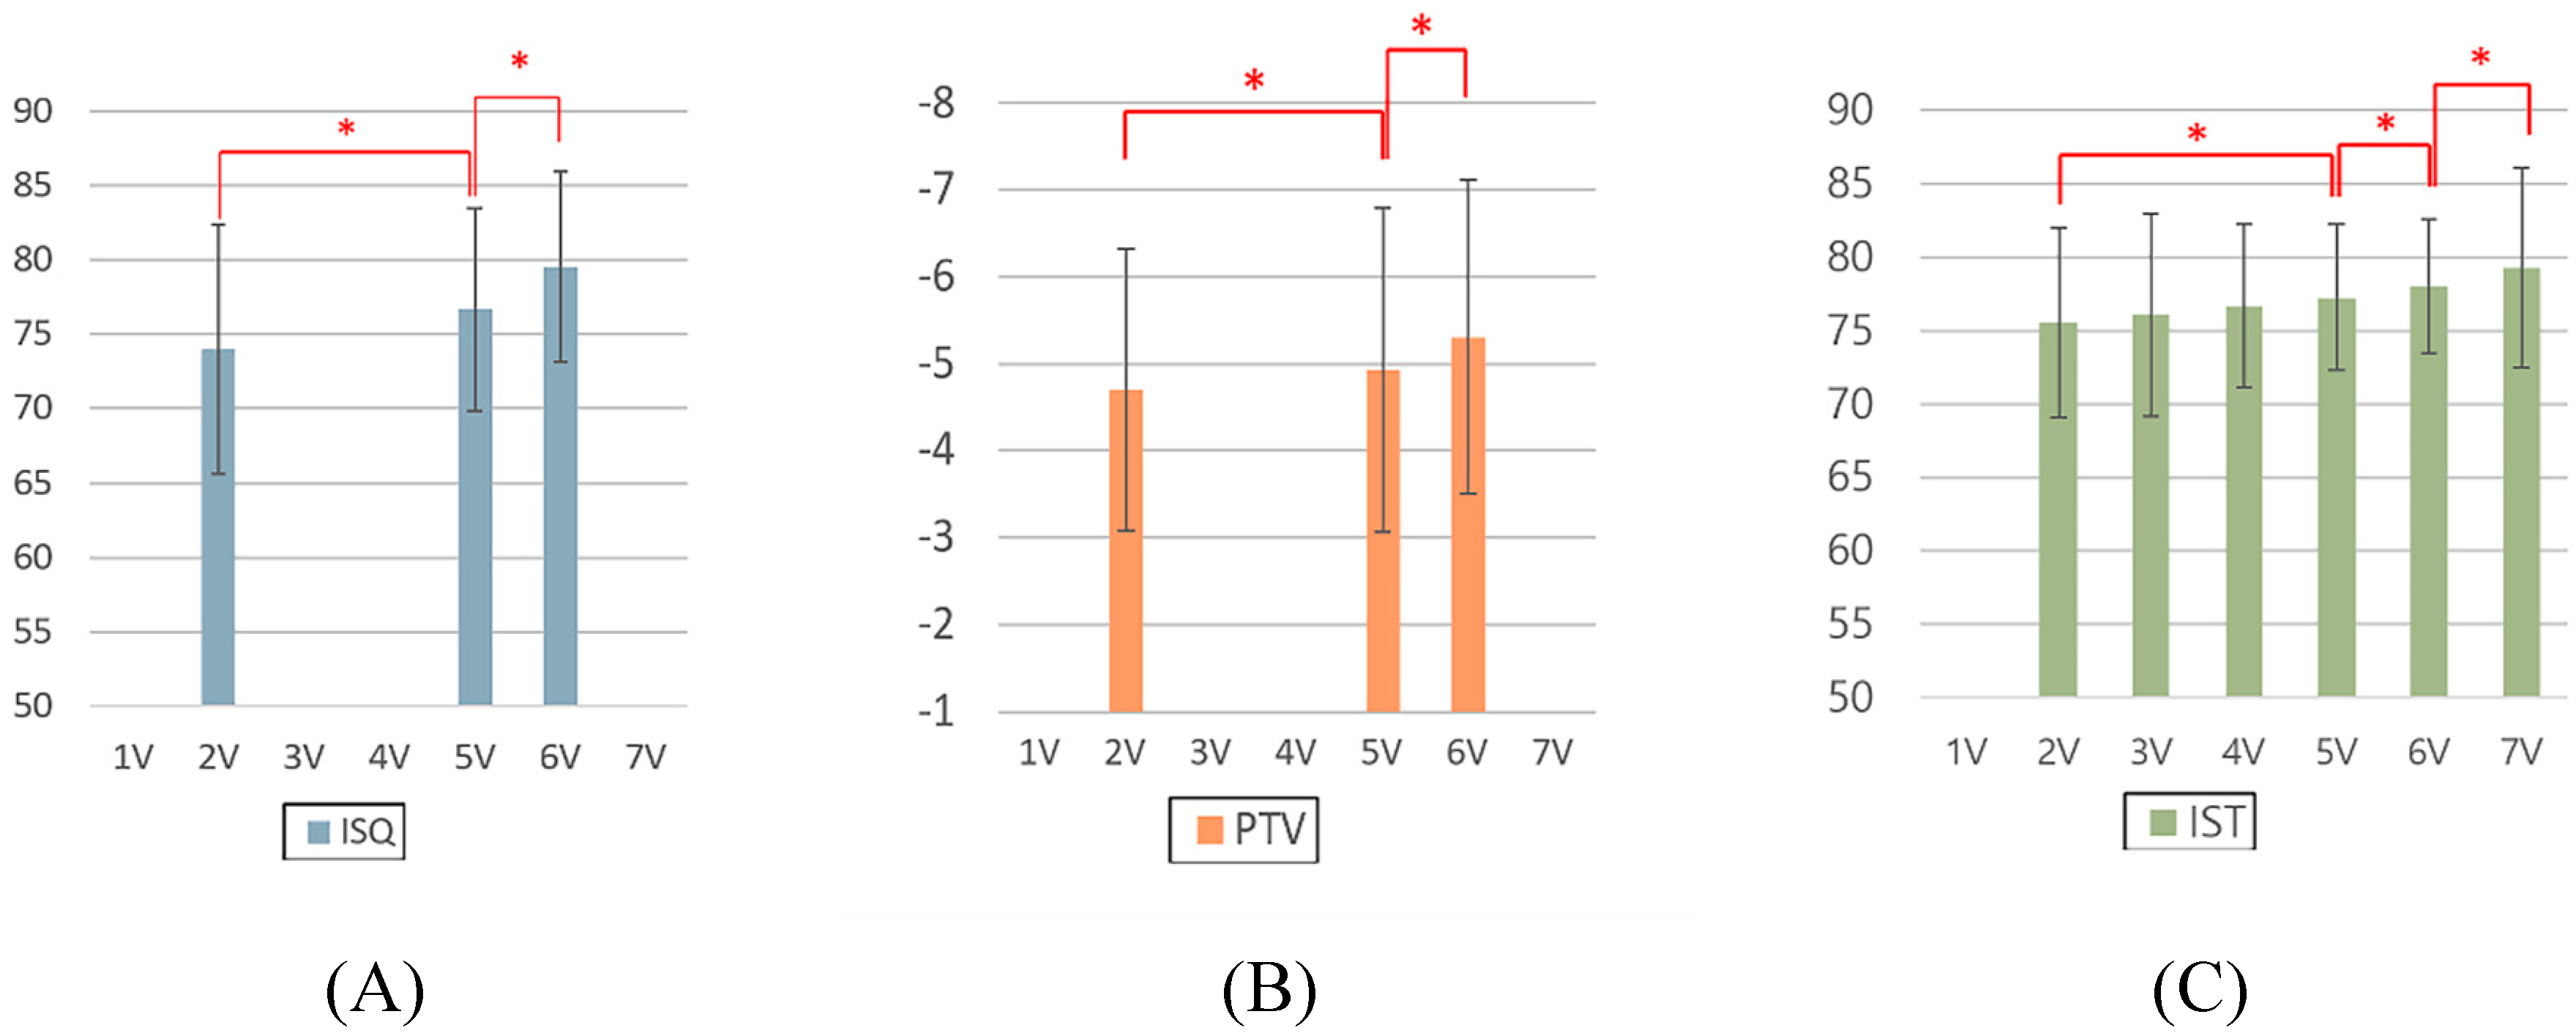
Implant stability measurement was performed using various devices. Mean values and standard deviations of ISQ, PTV, and IST among the groups, according to post-implantation duration, are shown in Figure 3. For all the ISQ, PTV, and IST results, the implant stability results at the 2-month follow-up and before the final restoration delivery were significantly higher than those at the time of implant surgery. The significant differences in ISQ, PTV, and IST among the groups, according to post-implantation duration, are shown in Supplementary Table 1. Paired sample t-tests were performed to ascertain whether there were differences according to post-implantation duration (Supplementary Table 1). For the ISQ, there were statistically significant differences between the second and fifth visits, second and sixth visits, and fifth and sixth visits (P<.05). For the PTV, there were statistically significant differences between the second and fifth visits, second and sixth visits, and the fifth and sixth visits (P<.05). For the IST, there were significant differences at all points except those between the second and third visits, second and fourth visits, third and fourth visits, and fourth and fifth visits (P<.05).
Figure 3. Analysis of implant stability measurements made with different devices according to the duration. A) ISQ, B) PTV, and C) IST. ISQ, implant stability quotient; PTV, Periotest value; IST, implant stability tester value. 1V, first visit; 2V, second visit; 3V, third visit; 4V, fourth visit; 5V, fifth visit; 6V, sixth visit; 7V, seventh visit.
Preprints 72969 g003
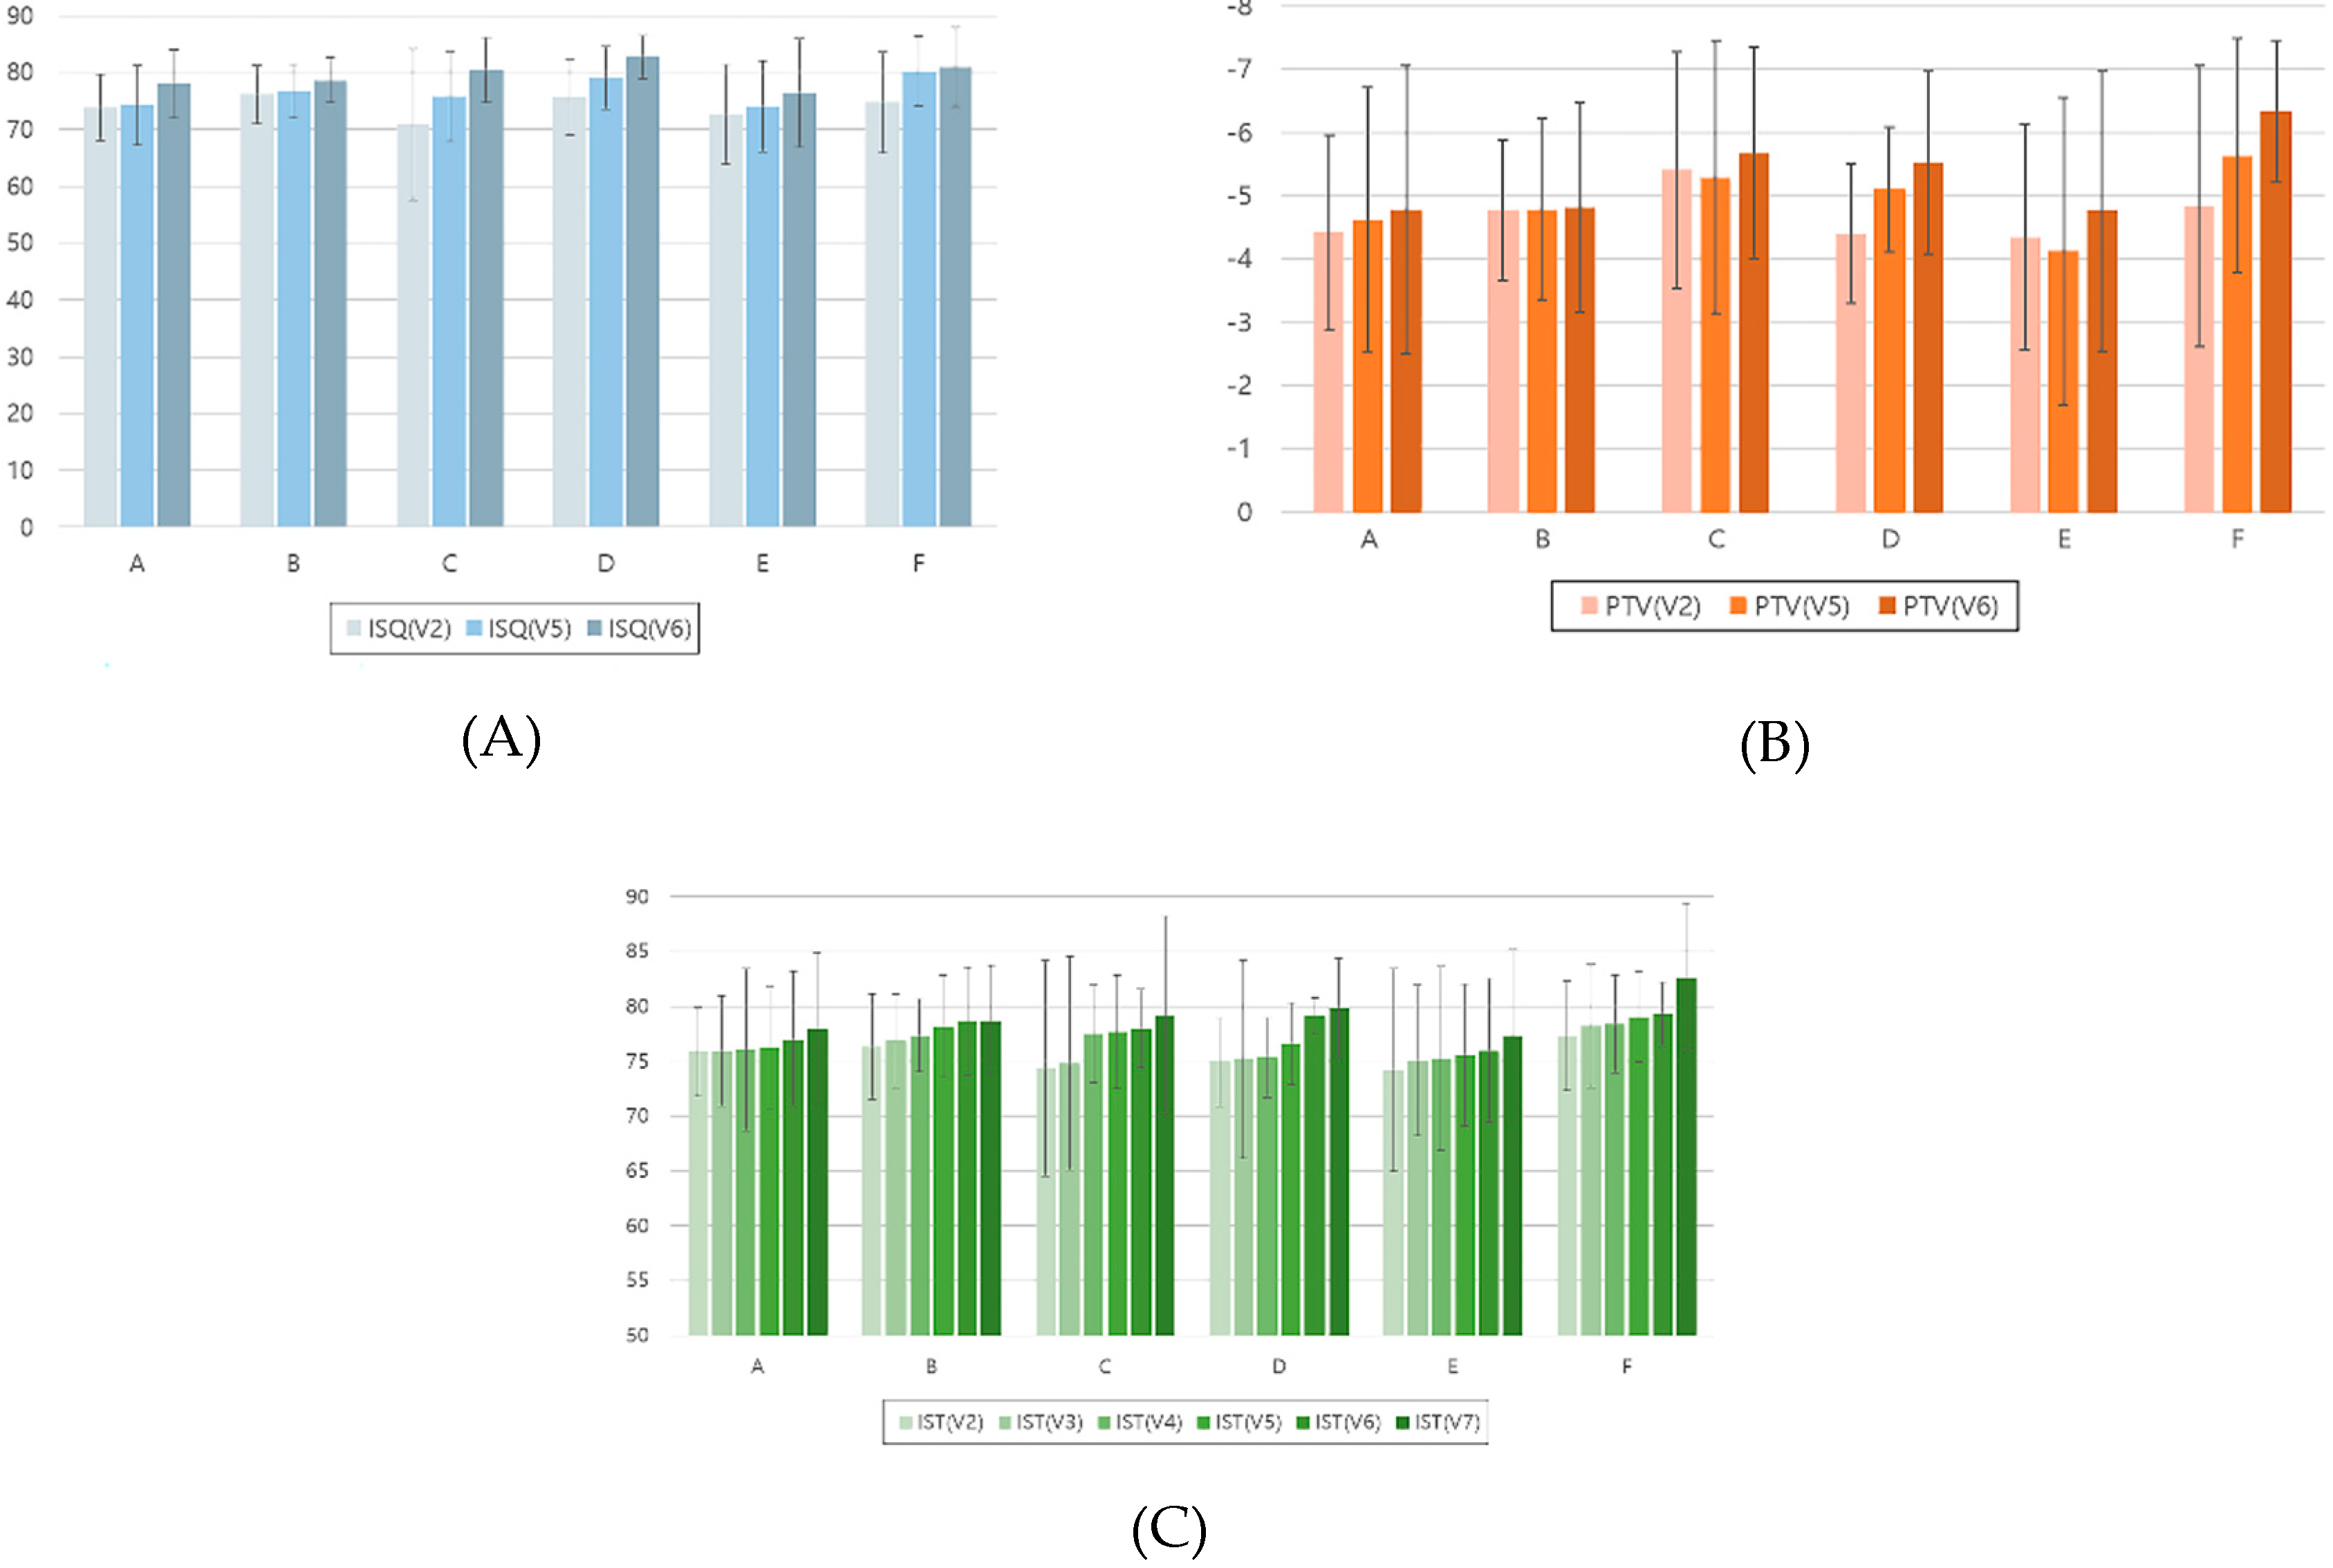
Mean values and standard deviations of implant stability measurements made with different devices according to dental implant placement site and duration are shown in Figure 4. For the ISQ, there were statistically significant differences according to the post-implantation duration for each location of the inserted implants between the second and fifth visits, second and sixth visits, and sixth visits and the fifth visit (Supplementary Table 2).
Figure 4. Analysis of implant stability measurements made with different devices according to dental implant placement site and duration. A) ISQ, B) PTV, and C) IST. ISQ, implant stability quotient; PTV, Periotest value; IST, implant stability tester value. A, maxillary right posterior; B, maxillary anterior; C, Maxillary left posterior; D, mandibular right posterior; E, mandibular anterior; F, mandibular left posterior. 1V, first visit; 2V, second visit; 3V, third visit; 4V, fourth visit; 5V, fifth visit; 6V, sixth visit; 7V, seventh visit.
Preprints 72969 g004
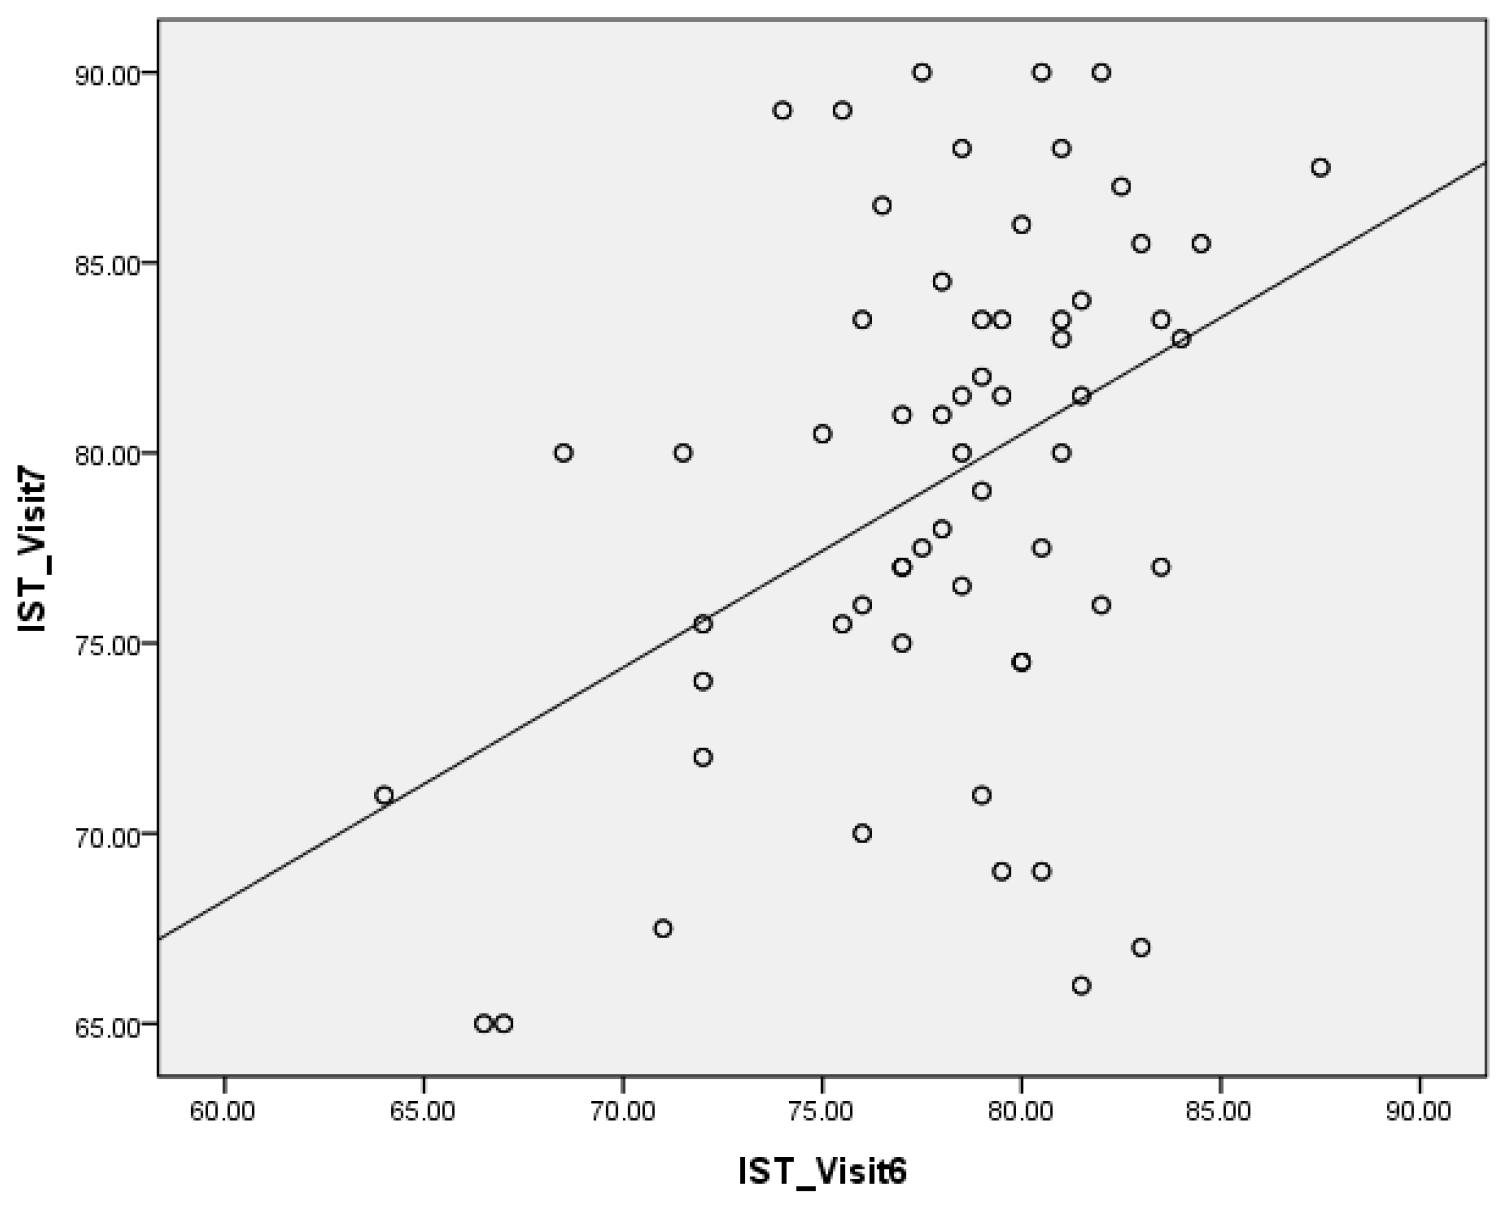
The result of Pearson’s correlation between the mean ISQ, mean PTV, and mean IST results are presented in Table 5. Correlation coefficients (r) are evaluated as: very strong (0.80 ≤ r ≤ 1.00), strong (0.60 ≤ r ≤ 0.79), moderate (0.40 ≤ r ≤ 0.59), weak (0.20 ≤ r ≤ 0.39), very weak (0.00 < r ≤ 0.19), and no correlation (r = 0) for both positive and negative values [16,17]. At the second visit, the r between the ISQ and PTV result was -0.208, verifying the weak negative correlation (P=.049). The r between the ISQ and IST result was 0.567, verifying the moderate positive correlation (P<.001). Additionally, the r between the PTV and IST result was -0.490, verifying the moderate negative correlation (P<.001). At the fifth visit, the r between the ISQ and PTV result was -0.298, verifying the weak negative correlation (P=.001). The r between the ISQ and IST result was 0.367, verifying the weak positive correlation (P=.003). Additionally, the r between the PTV and IST result was -0.701, verifying the strong negative correlation (P<.001). At the sixth visit, the r between the ISQ and PTV result was -0.252, verifying the weak negative correlation (P=.005). The r between the ISQ and IST result was 0.503, verifying the moderate positive correlation (P<.001). Additionally, the r between the PTV and IST result was -0.479, demonstrating the moderate negative correlation (P<.001). The result of Pearson’s correlation between the sixth visit and seventh visit IST values are shown in Figure 5. The r between the values measured in the healing abutment states and the values measured in the prosthesis delivered states was 0.414, demonstrating a moderate positive correlation (P <.001).
Table 5. Results of Pearson’s correlation between the mean ISQ, PTV, and IST values.
Value 2V 5V 6V
Correlation coefficient Size of Correlation P-value Correlation coefficient Size of Correlation P-value Correlation coefficient Size of Correlation P-value
ISQ-PTV -.208 weak .049* -.298 weak .001* -.252 weak .005*
ISQ-IST .567 moderate <.001* .367 weak .003* .503 moderate <.001*
PTV-IST -.490 moderate <.001* -.701 strong <.001* -.479 moderate <.001*
ISQ, implant stability quotient; PTV, Periotest value; IST, implant stability tester value. 1V, first visit; 2V, second visit; 3V, third visit; 4V, fourth visit; 5V, fifth visit; 6V, sixth visit; 7V, seventh visit. * denotes a significant difference, with P<.05.
Figure 5. The results of Pearson’s correlation between the mean sixth and seventh visit values of IST.
Preprints 72969 g005
The results of all groups for the implant stability values between the locations of implants and the positions of arch in Osstell ISQ Mentor, Periotest M and Anycheck are showed in Supplementary Table 3. The ISQ results showed statistically significant differences at the fifth (P=.016) and sixth visits (P=.042). In the PTV results, there were no significant differences in the correlations between the locations of the implants at all the visits (P>.05). In the IST results, there was a statistically significant difference only at the sixth visit (P=.044) in the correlations between the locations of implants.
The results of all groups for IST results between different locations and implant materials in Anycheck are presented in Supplementary Table 4. There was no significant difference in the correlations between the values measured in the healing abutment states and the values measured in the prosthesis delivered states (P>.05).

4. Discussion

In the present study, the accuracy of implant stability measurement devices were evaluated under clinical conditions affecting the reliability of the devices. In addition to the results from the devices, the valid impacts and the angle formed by the handpiece with the horizontal plane were measured to analyze the reasons for inaccurate results. The results showed that the implant placement site and the post-implantation duration in the oral cavity affected implant stability and the reliability of the measuring devices in patients over 65 years of age.
Devices for evaluating implant stability are either RFA or DCA and each device has distinct characteristics depending on their operating principles. A DCA device is convenient for measurement without an additional process if a healing abutment is installed; more factors during measuring should be controlled to derive accurate results compared to RFA devices [18]. According to previous studies, the PTV is influenced by the length of the fixture and the healing abutment, the position and direction of percussion, and the angle of the handpiece [19,20].
Between the DCA devices, Periotest M was significantly affected by the position of artificial bone model impact error, while Anycheck showed consistently low impact error in this study. The results showed that Anycheck was able to provide a relatively stable measurement under unfavorable access conditions. Anycheck measured while in contact with the implant, the device does not move minutely during measurement, and it is possible to measure stably at the desired position. However, Periotest M is unstable because it is measured at a certain distance from the implant. Faulkner et al. reported that Periotest M was very sensitive to the angulation of the handpiece and to the position at that the Periotest M impacted the abutment [21]. A small change in the angle of the handpiece from 90 degrees to the abutment may cause a PTV difference between 2.5 and 4.0 as the rod hits an inconsistent point of abutment [22,23]. In addition, the variation in PTV was approximately 1.5 or 1 to 2 PTV depending on the height of the striking point per millimeter [21,22].
Some studies have investigated conflicting results for both RFA and DCA systems. Lee et al. investigated the strong correlation (0.981) between the ISQ and IST in an in vitro study [9], while a systematic review showed a weak correlation (-0.294) between the ISQ and PTV [11]. Additionally, the correlating ISQ and PTV readings of the buccal surface during implant installation were moderately negatively statistically significantly correlated (-0.466) between the two types of device for all 80 patients in the randomized clinical trial by Andreotti et al [10]. In this study, there were weak negative statistically significant correlations: -0.208 at 2V, -0.298 at 5V, and -0.252 at 6V, between ISQ and PTV. There were moderate positive statistically significant correlations: 0.567 at 2V, 0.367 at 5V, and 0.503 at 6V, between ISQ and IST. The results of this study are similar to the reported correlations in previous studies [10,11]. A factor that can affect the results is when using the DCA device clinically, the examiner is limited by patient cooperation, space, and access, unlike the laboratory study, that standardized models for measurement permit certain conditions. Thus, in vivo analyses have additional sources of error, that could result in reduced accuracy of measurement. The results presented the weak or moderate statistically significant correlation between the three measuring devices.
Several studies have presented the strong correlation between ISQ and PTV, while others have presented no correlation [24,25,26,27]. Because of the discrepancies, standardized implant stability values have not yet been proved and analyses have been performed by other analytic methods, such as the measurement of insertion torque and radiographic and clinical examinations. There were moderate to high negative statistically significant correlations: -0.490 at 2V, -0.701 at 5V, and -0.479 at 6V, between PTV and IST. There was a moderate positive statistically significant correlation coefficient of 0.414 between the 6V and 7V, in IST (P<.001).
Some studies have investigated that both the Osstell ISQ and Periotest devices could reliably evaluate the stability of implant [6,25,28]. Lachmann et al. maintained that both the Osstell ISQ and Periotest presented acceptable reliability in expecting the implant stability in an in vitro study [6]. Also Pang et al. reported the strong correlation between the ISQ and PTV post-surgery and 2 months later [25]. An animal study showed the strong correlation between ISQ and PTV [27]. Additionally, some studies demonstrated that although both the Osstell ISQ and Periotest devices were useful for analyzing the stability of implant, the Osstell ISQ was more accurate than the Periotest systems, presenting high reliability [29,30]. However, some studies have found conflicting results for both the Osstell ISQ and Periotest systems [10,27]. Considering the controversy, both the Osstell ISQ and Periotest were evaluated with the Anycheck in this study [27].
There are well known inconveniences and limitations of the Osstell ISQ and Periotest systems. The Osstell ISQ is the non-invasive system that could evaluate implant stability, based on the structural analysis principle [31]. This system could be fairly reliable when the bone-implant interface is rigid and the implants have achieved osseointegration. However, when the implant-bone interface is doubtful or is not rigid, the ISQ results tend to change [32,33]. Additionally, use of the Osstell ISQ is needed removal of the upper fixture component, and the smart-peg connection, when evaluating implant stability and this could cause limitations and inconvenience. Long-term study on Periotest have presented that it could objectively measure implant stability.34,35 However, some studies have reported that the devices lack sensitivity [36,37]. This is because the Periotest, schemed for natural dentition, evaluates the wide dynamic range. However, the range used for evaluating implant stability is limited [26]. Other studies have showed that the even narrower range of -4 to -2 or -4 to +2 is required for clinically osseointegrated implants [38,39]. Moreover, PTV was unable to identify implants with borderline stability or those in the process of osseointegration [40]. PTVs have also been criticized for vulnerability to operator variables and lack of resolution [41,42]. The IST results were consistent with ISQ results. Additionally, the IST results range from 1 to 99. Usage of the Anycheck does not need unscrewing of the healing abutment and the procedure is therefore easier than that of the Osstell ISQ.
This clinical study investigated the reliability of each device by comparing RFA and DCA devices with different measurement principles. The results presented the effect of the implant placement site and the post-implantation duration in elderly patients on the reliability of each measuring device. In addition, an attempt was made to accurately obtain the angle the handpiece would make with the ground and the number of effective strokes when measuring stability with Anycheck.
However, the limitation of this in vivo study was that the reliability of Anycheck was based on the correlations with the other systems and the agreement rate of each device was not evaluated in this study. Additionally, the design of the study could not compare the systems with the implant osseointegration and further large-scale in vivo studies are needed for clinical use. Additional studies are also needed to ascertain the reliability of the Anycheck system through analysis of the patient’s face shape, mouth size, and 3D structure of the oral cavity. In addition, the factors that may affect the measured values, such as soft tissue, bone quality, bone density, patient opening, and saliva, cannot be excluded during clinical use. Therefore, further in vivo studies are required to estimate the accuracy and accessibility of the devices in clinical use.

5. Conclusions

Within the limitations of our study, by considering various factors that affect implant stability, the appropriate implant load application time was determined. This could help increase the implant success rate in elderly patients. And as a diagnostic device for implant stability for evaluation of osseointegration in elderly patients, Anycheck was also able to prove its relative reliability compared to Osstell ISQ Mentor and Periotest M.
  • For all the ISQ, PTV, and IST results, the implant stability results at the 2-month follow-up and before the final restoration delivery were significantly higher than those ​​at the time of implant surgery.
  • The lowest ISQ results occurred in the mandibular anterior location at the 2-month follow-up and before the final restoration delivery.
  • In all the mandibular locations, the IST results ​​after final restoration delivery were significantly higher than those ​​at implant surgery, stitch removal, 1-month follow-up, and 2-month follow-up.
  • At implant surgery, 2-month follow-up, and before final restoration delivery, the ISQ results were negatively correlated with the PTV results and positively correlated with the IST results, and the PTV results were negatively correlated with the IST results.
  • The IST results in the healing abutment states and those in the prosthesis delivered states were positively correlated.

Supplementary Materials

The following supporting information can be downloaded at the website of this paper posted on Preprints.org

References

  1. Lages, F.S.; Douglas-de Oliveira, D.W.; Costa, F.O. Relationship between implant stability measurements obtained by insertion torque and resonance frequency analysis: a systematic review. Clin. Implant. Dent. Relat. Res. 2018, 20, 26–33. [Google Scholar] [CrossRef] [PubMed]
  2. Meredith, N. Assessment of implant stability as a prognostic determinant. Int. J. Prosthodont. 1998, 11, 491–501. [Google Scholar] [PubMed]
  3. Rodrigo, D.; Aracil, L.; Martin, C.; Sanz, M. Diagnosis of implant stability and its impact on implant survival: a prospective case series study. Clin. Oral. Implants. Res. 2010, 21, 255–261. [Google Scholar] [CrossRef] [PubMed]
  4. Atsumi, M.; Park, S.H.; Wang, H.L. Methods used to assess implant stability: current status. Int. J. Oral. Maxillofac. Implants. 2007, 22, 743–754. [Google Scholar] [PubMed]
  5. Lachmann, S.; Laval, J.Y.; Axmann, D.; Weber, H. Influence of implant geometry on primary insertion stability and simulated peri-implant bone loss: an in vitro study using resonance frequency analysis and damping capacity assessment. Int. J. Oral. Maxillofac. Implants. 2011, 26, 347–355. [Google Scholar] [PubMed]
  6. Lachmann, S.; Laval, J.Y.; Jäger, B.; Axmann, D.; Gomez-Roman, G.; Groton, M.; Weber, H. Resonance frequency analysis and damping capacity assessment. Part 2: Peri-implant bone loss follow-up. An in vitro study with the Periotest and Osstell instruments. Clin. Oral. Implants. Res. 2006, 17, 80–84. [Google Scholar] [CrossRef]
  7. Meredith, N.; Alleyne, D.; Cawley, P. Quantitative determination of the stability of the implant-tissue interface using resonance frequency analysis. Clin. Oral. Implants. Res. 1996, 7, 261–267. [Google Scholar] [CrossRef]
  8. Winkler, S.; Morris, H.F.; Spray, J.R. Stability of implants and natural teeth as determined by the Periotest over 60 months of function. J. Oral. Implantol. 2001, 27, 198–203. [Google Scholar] [CrossRef]
  9. Lee, D.H.; Shin, Y.H.; Park, J.H.; Shim, J.S.; Shin, S.W.; Lee, J.Y. The reliability of Anycheck device related to healing abutment diameter. J. Adv. Prosthodont. 2020, 12, 83–88. [Google Scholar] [CrossRef]
  10. Andreotti, A.M.; Goiato, M.C., Nobrega, A.S.; da Silva, E.V.F.; Filho, H.G.; Pellizzer, E.P.; dos Santos, D.M. Relationship between implant stability measurements obtained by two different devices: a systematic review. J. Periodontol. 2017, 88, 281–288. [CrossRef]
  11. Krafft, T.; Winter, W.; Wichmann, M.; Karl, M. In vitro validation of a novel diagnostic device for intraoperative determination of alveolar bone quality. Int. J. Oral. Maxillofac. Implants. 2012, 27, 318–328. [Google Scholar] [PubMed]
  12. AAl, M.A.; El Far, M.; Sheta, N.M.; Fayyad, A.; Desouky, E.E.; Nabi, N.A.; Ibrahim, M. Correlation of implant stability between two noninvasive methods using submerged and nonsubmerged healing protocols: a randomized clinical trial. J. Oral. Implantol. 2020, 46, 571–579. [Google Scholar] [CrossRef] [PubMed]
  13. Sennerby, L.; Meredith, N. Implant stability measurements using resonance frequency analysis: biological and biomechanical aspects and clinical implications. Periodontol. 2000. 2008, 47, 51–66. [Google Scholar] [CrossRef] [PubMed]
  14. Oh, J.S.; Kim, S.G. Clinical study of the relationship between implant stability measurements using Periotest and Osstell mentor and bone quality assessment. Oral. Surg. Oral. Med. Oral. Pathol. Oral. Radiol. 2012, 113, e35–e40. [Google Scholar] [CrossRef] [PubMed]
  15. Lekholm, U.; Zarb, G.A. Patient selection and preparation. Branemark, P.I., Zarb, G.A., Albrektsson, T., editors. Tissue integrated prostheses: osseointegration in clinical dentistry. Chicago: Quintessence.; 1985. pp.199–209.
  16. Banjanin, M.K.; Stojčić, M.; Danilović, D.; Ćurguz, Z.; Vasiljević, M.; Puzić, G. Classification and prediction of sustainable quality of experience of telecommunication service users using machine learning models. Sustainability. 2022, 14, 17053. [Google Scholar] [CrossRef]
  17. Meghanathan, N. Assortativity analysis of real-world network graphs based on Centrality metrics. Comput. Inf. Sci. 2016, 9, 7. [Google Scholar] [CrossRef]
  18. Aparicio, C.; Lang, N.P.; Rangert, B. Validity and clinical significance of biomechanical testing of implant/bone interface. Clin. Oral. Implants. Res. 2006, 17, 2–7. [Google Scholar] [CrossRef]
  19. Huang, H.M.; Chiu, C.L.; Yeh, C.Y.; Lee, S.Y. Factors influencing the resonance frequency of dental implants. J. Oral. Maxillofac. Surg. 2003, 61, 1184–1188. [Google Scholar] [CrossRef]
  20. Sim, C.P.; Lang, N.P. Factors Influencing Resonance Frequency Analysis Assessed by Osstell mentor during implant tissue integration: I. Instrument positioning, bone structure, implant length. Clin. Oral. Implants. Res. 2010, 21, 598–604. [Google Scholar] [CrossRef]
  21. Faulkner, M.G.; Giannitsios, D.; Lipsett, A.W.; Wolfaardt, J.F. The use and abuse of the Periotest for 2-piece implant/abutment systems. Int. J. Oral. Maxillofac. Implants. 2001, 16, 486–494. [Google Scholar]
  22. Derhami, K.; Wolfaardt, J.F.; Faulkner, G.; Grace, M. Assessment of the periotest device in baseline mobility measurements of craniofacial implants. Int. J. Oral. Maxillofac. Implants. 1995, 10, 221–229. [Google Scholar] [PubMed]
  23. Park, Y.H.; Leesungbok, R.; Lee, S.W.; Paek, J.; Lee, J.Y. Differences in percussion-type measurements of implant stability according to height of healing abutments and measurement angle. J. Korean. Acad. Prosthodont. 2018, 56, 278–286. [Google Scholar] [CrossRef]
  24. Truhlar, R.S.; Morris, H.F.; Ochi, S. Stability of the bone-implant complex. Results of longitudinal testing to 60 months with the Periotest device on endosseous dental implants. Ann. Periodontol. 2000, 5, 42–55. [Google Scholar] [CrossRef] [PubMed]
  25. Pang, K.M.; Lee, J.W.; Lee, J.Y.; Lee, J.B.; Kim, S.M.; Kim, M.J.; Lee, J.H. Clinical outcomes of magnesium-incorporated oxidised implants: a randomised double-blind clinical trial. Clin. Oral. Implants. Res. 2014, 25, 616–621. [Google Scholar] [CrossRef] [PubMed]
  26. Cehreli, M.C.; Karasoy, D.; Akca, K.; Eckert, S.E. Meta-analysis of methods used to assess implant stability. Int. J. Oral. Maxillofac. Implants. 2009, 24, 1015–1032. [Google Scholar] [PubMed]
  27. Oh, J.S.; Kim, S.G., Lim, S.C.; Ong, J.L. A comparative study of two noninvasive techniques to evaluate implant stability: periotest and Osstell Mentor. Oral. Surg. Oral. Med. Oral. Pathol. Oral. Rad. Endod. 2009, 107, 513–518. [CrossRef] [PubMed]
  28. Devlin, H.; Horner, K.; Ledgerton, D. A comparison of maxillary and mandibular bone mineral densities. J. Prosthet. Dent. 1998, 79, 323–327. [Google Scholar] [CrossRef]
  29. Herrero-Climent, M.; Santos-García, R.; Jaramillo-Santos, R.; Romero-Ruiz, M.M.; Fernández-Palacin, A.; Lázaro-Calvo, P.; Bullón, P.; Ríos-Santos, J.V. Assessment of Osstell ISQ’s reliability for implant stability measurement: a cross-sectional clinical study. Med. Oral. Patol. Oral. Cir. Bucal. 2013, 18, e877–e882. [Google Scholar] [CrossRef]
  30. Winter, W.; Möhrle, S.; Holst, S.; Karl, M. Parameters of implant stability measurements based on resonance frequency and damping capacity: a comparative finite element analysis. Int. J. Oral. Maxillofac. Implants. 2010, 25, 532–539. [Google Scholar]
  31. Sekiguhi, J. An attempt to measure viscoelasticity of human facial skin by impact hammer method. J. Kanagawa. Odontol. Soc. 1992, 26, 387–411. [Google Scholar]
  32. Friberg, B.; Sennerby, L.; Linden, B.; Gröndahl, K.; Lekholm, U. Stability measurements of one-stage Brånemark implants during healing in mandibles. A clinical resonance frequency analysis study. Int. J. Oral. Maxillofac. Surg. 1999, 28, 266–272. [Google Scholar] [CrossRef] [PubMed]
  33. Nedir, R.; Bischof, M.; Szmukler-Moncler, S.; Bernard, J.P.; Samson, J. Predicting osseointegration by means of implant primary stability. Clin. Oral. Implants. Res. 2004, 15, 520–528. [Google Scholar] [CrossRef] [PubMed]
  34. Morris, H.F.; Winkler, S.; Ochi, S. The ankylos endosseous dental implant: assessment of stability up to 18 months with the Periotest. J. Oral. Implantol. 2000, 26, 291–299. [Google Scholar] [CrossRef] [PubMed]
  35. Walker, L.; Morris, H.F.; Ochi, S. Periotest values of dental implants in the first 2 years after second-stage surgery: DICRG interim Report No. 8. Dental implant clinical Research Group. Implant. Dent. 1997, 6, 207–212. [Google Scholar] [CrossRef] [PubMed]
  36. Meredith, N.; Friberg, B.; Sennerby, L.; Aparicio, C. Relationship between contact time measurements and PTV values when using the Periotest to measure implant stability. Int. J. Prosthodont. 1998, 11, 269–275. [Google Scholar]
  37. van Steenberghe, D.; Tricio, J.; Naert, I.; Nys, M. Damping characteristics of bone-to-implant interfaces. A clinical study with the Periotest device. Clin. Oral. Implants. Res. 1995, 6, 31–39. [Google Scholar] [CrossRef]
  38. Morris, H.F.; Ochi, S.; Crum, P.; Orenstein, I.; Plezia, R. Bone density: its influence on implant stability after uncovering. J. Oral. Implantol. 2003, 29, 263–269. [Google Scholar] [CrossRef]
  39. Teerlinck, J.; Quirynen, M.; Darius, P.; van Steenberghe, D. Periotest: an objective clinical diagnosis of bone apposition toward implants. Int. J. Oral. Maxillofac. Implants. 1991, 6, 55–61. [Google Scholar]
  40. Hürzeler, M.B.; Quiñones, C.R.; Schüpbach, P.; Vlassis, J.M.; Strub, J.R.; Caffesse, R.G. Influence of the suprastructure on the peri-implant tissues in beagle dogs. Clin. Oral. Implants. Res. 1995, 6, 139–148. [Google Scholar] [CrossRef]
  41. Salvi, G.E.; Lang, N.P. Diagnostic parameters for monitoring peri-implant conditions. Int. J. Oral. Maxillofac. Implants. 2004, 19, 116–127. [Google Scholar]
  42. Sennerby, L.; Meredith, N. Resonance frequency analysis: measuring implant stability and osseointegration. Compend. Contin. Educ. Dent. 1998, 19, 493–498. [Google Scholar] [PubMed]
Disclaimer/Publisher’s Note: The statements, opinions and data contained in all publications are solely those of the individual author(s) and contributor(s) and not of MDPI and/or the editor(s). MDPI and/or the editor(s) disclaim responsibility for any injury to people or property resulting from any ideas, methods, instructions or products referred to in the content.
Copyright: This open access article is published under a Creative Commons CC BY 4.0 license, which permit the free download, distribution, and reuse, provided that the author and preprint are cited in any reuse.
Prerpints.org logo

Preprints.org is a free preprint server supported by MDPI in Basel, Switzerland.

Subscribe

© 2024 MDPI (Basel, Switzerland) unless otherwise stated