Submitted:
08 May 2023
Posted:
09 May 2023
You are already at the latest version
Abstract
Keywords:
1. Introduction
2. Materials and Methods
3. Results and Discussion
3.1. ThermoCalcTM Scheil Solidification
3.2. SEM/EDS Solidification Trends
3.3. DSC Thermal Analysis
3.4. ICP-OES Data
4. Conclusions
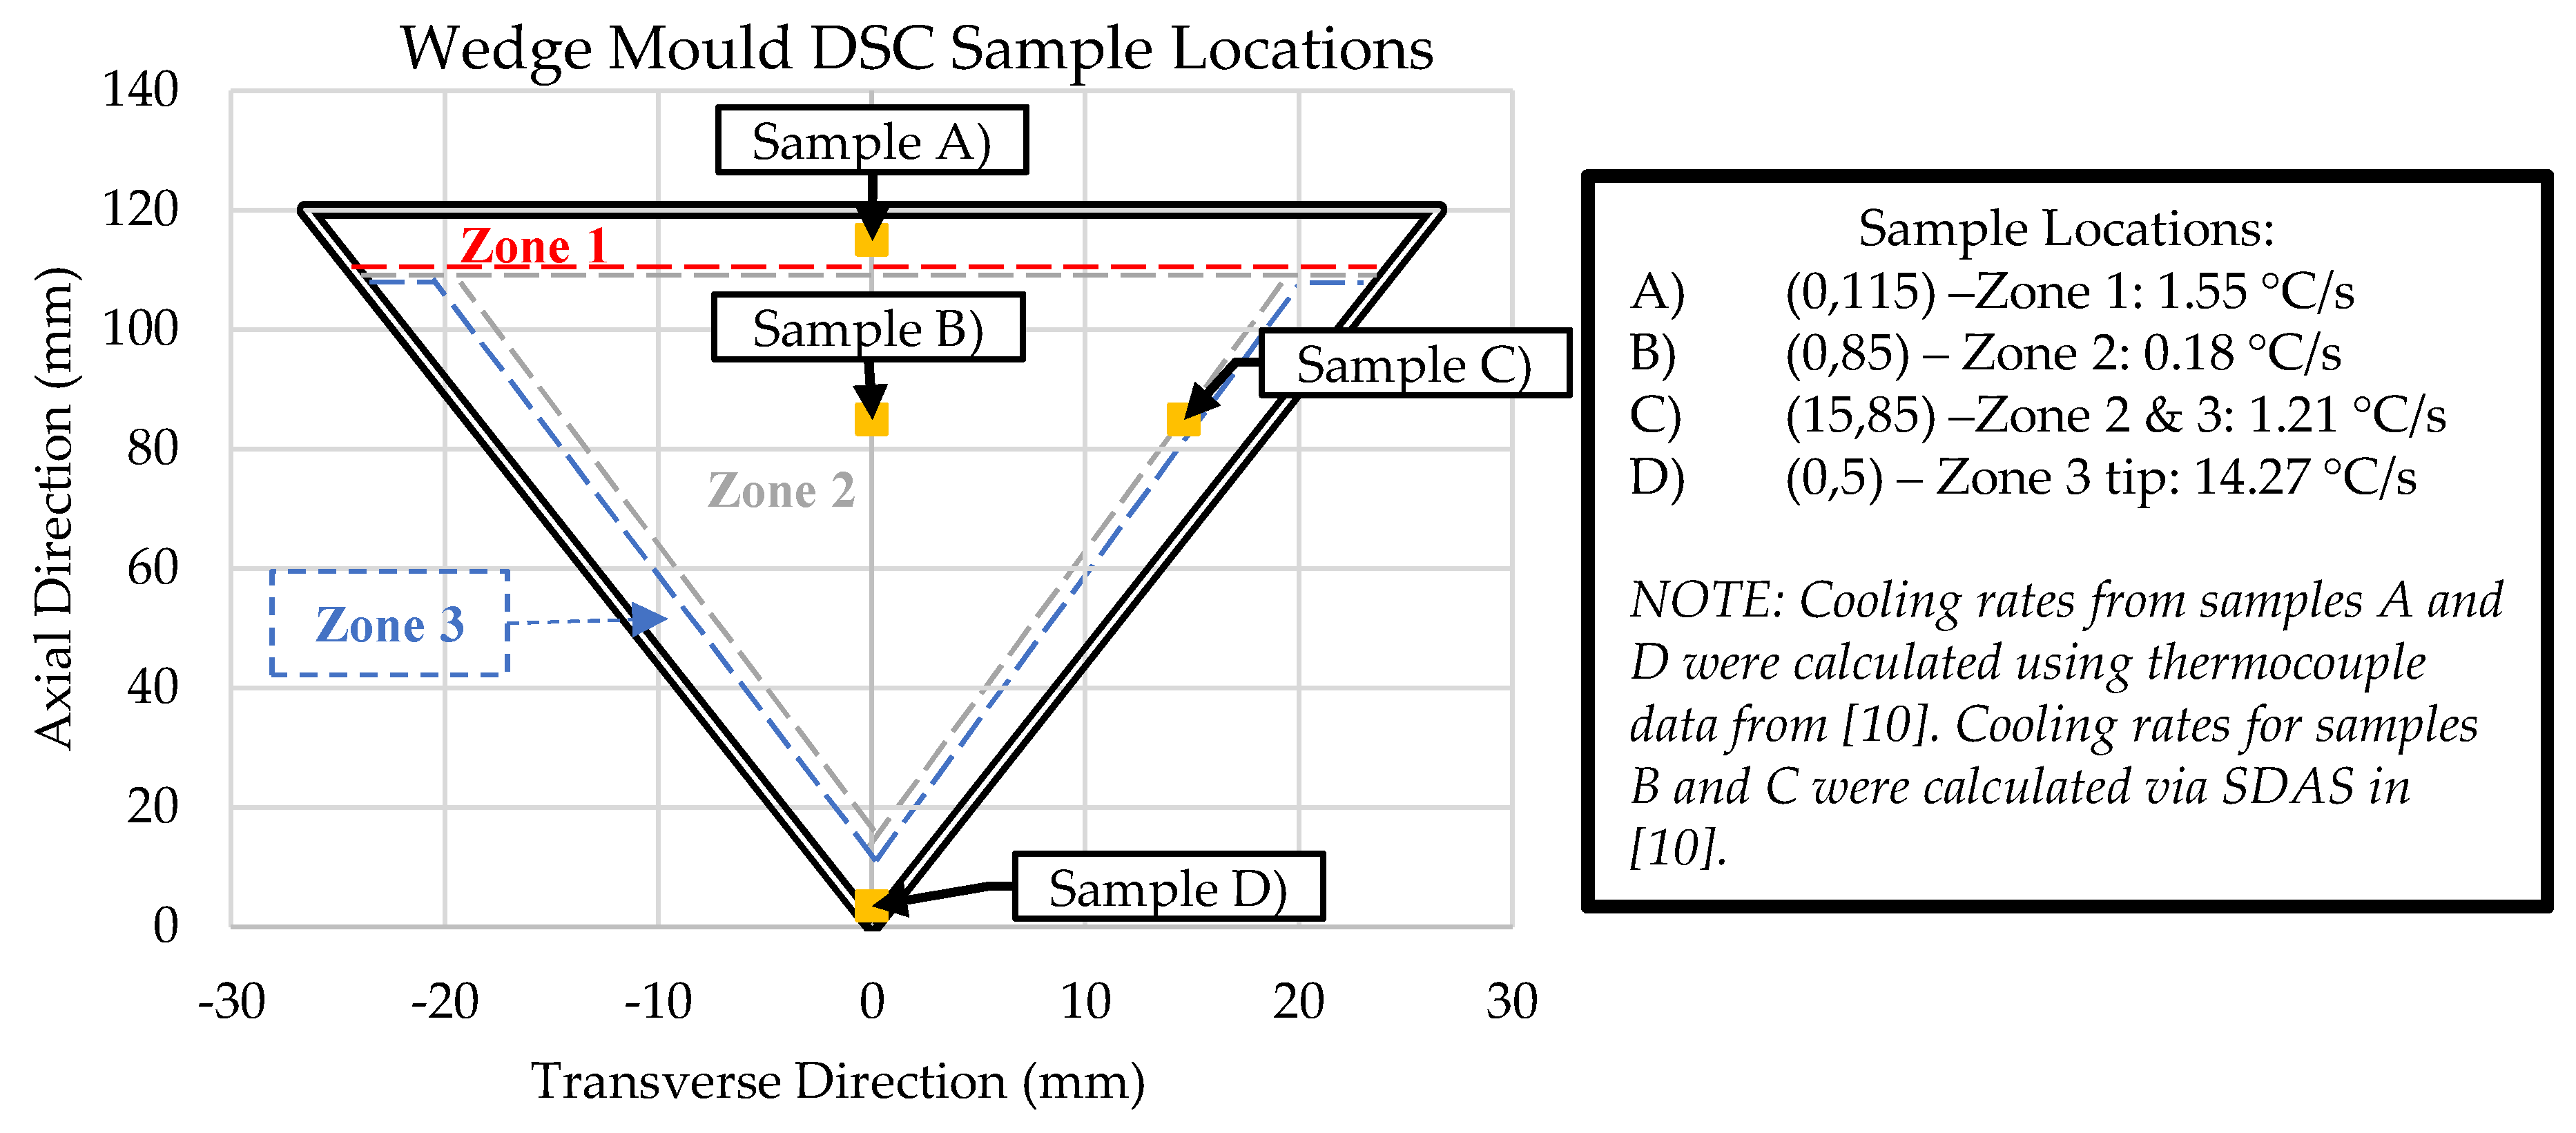
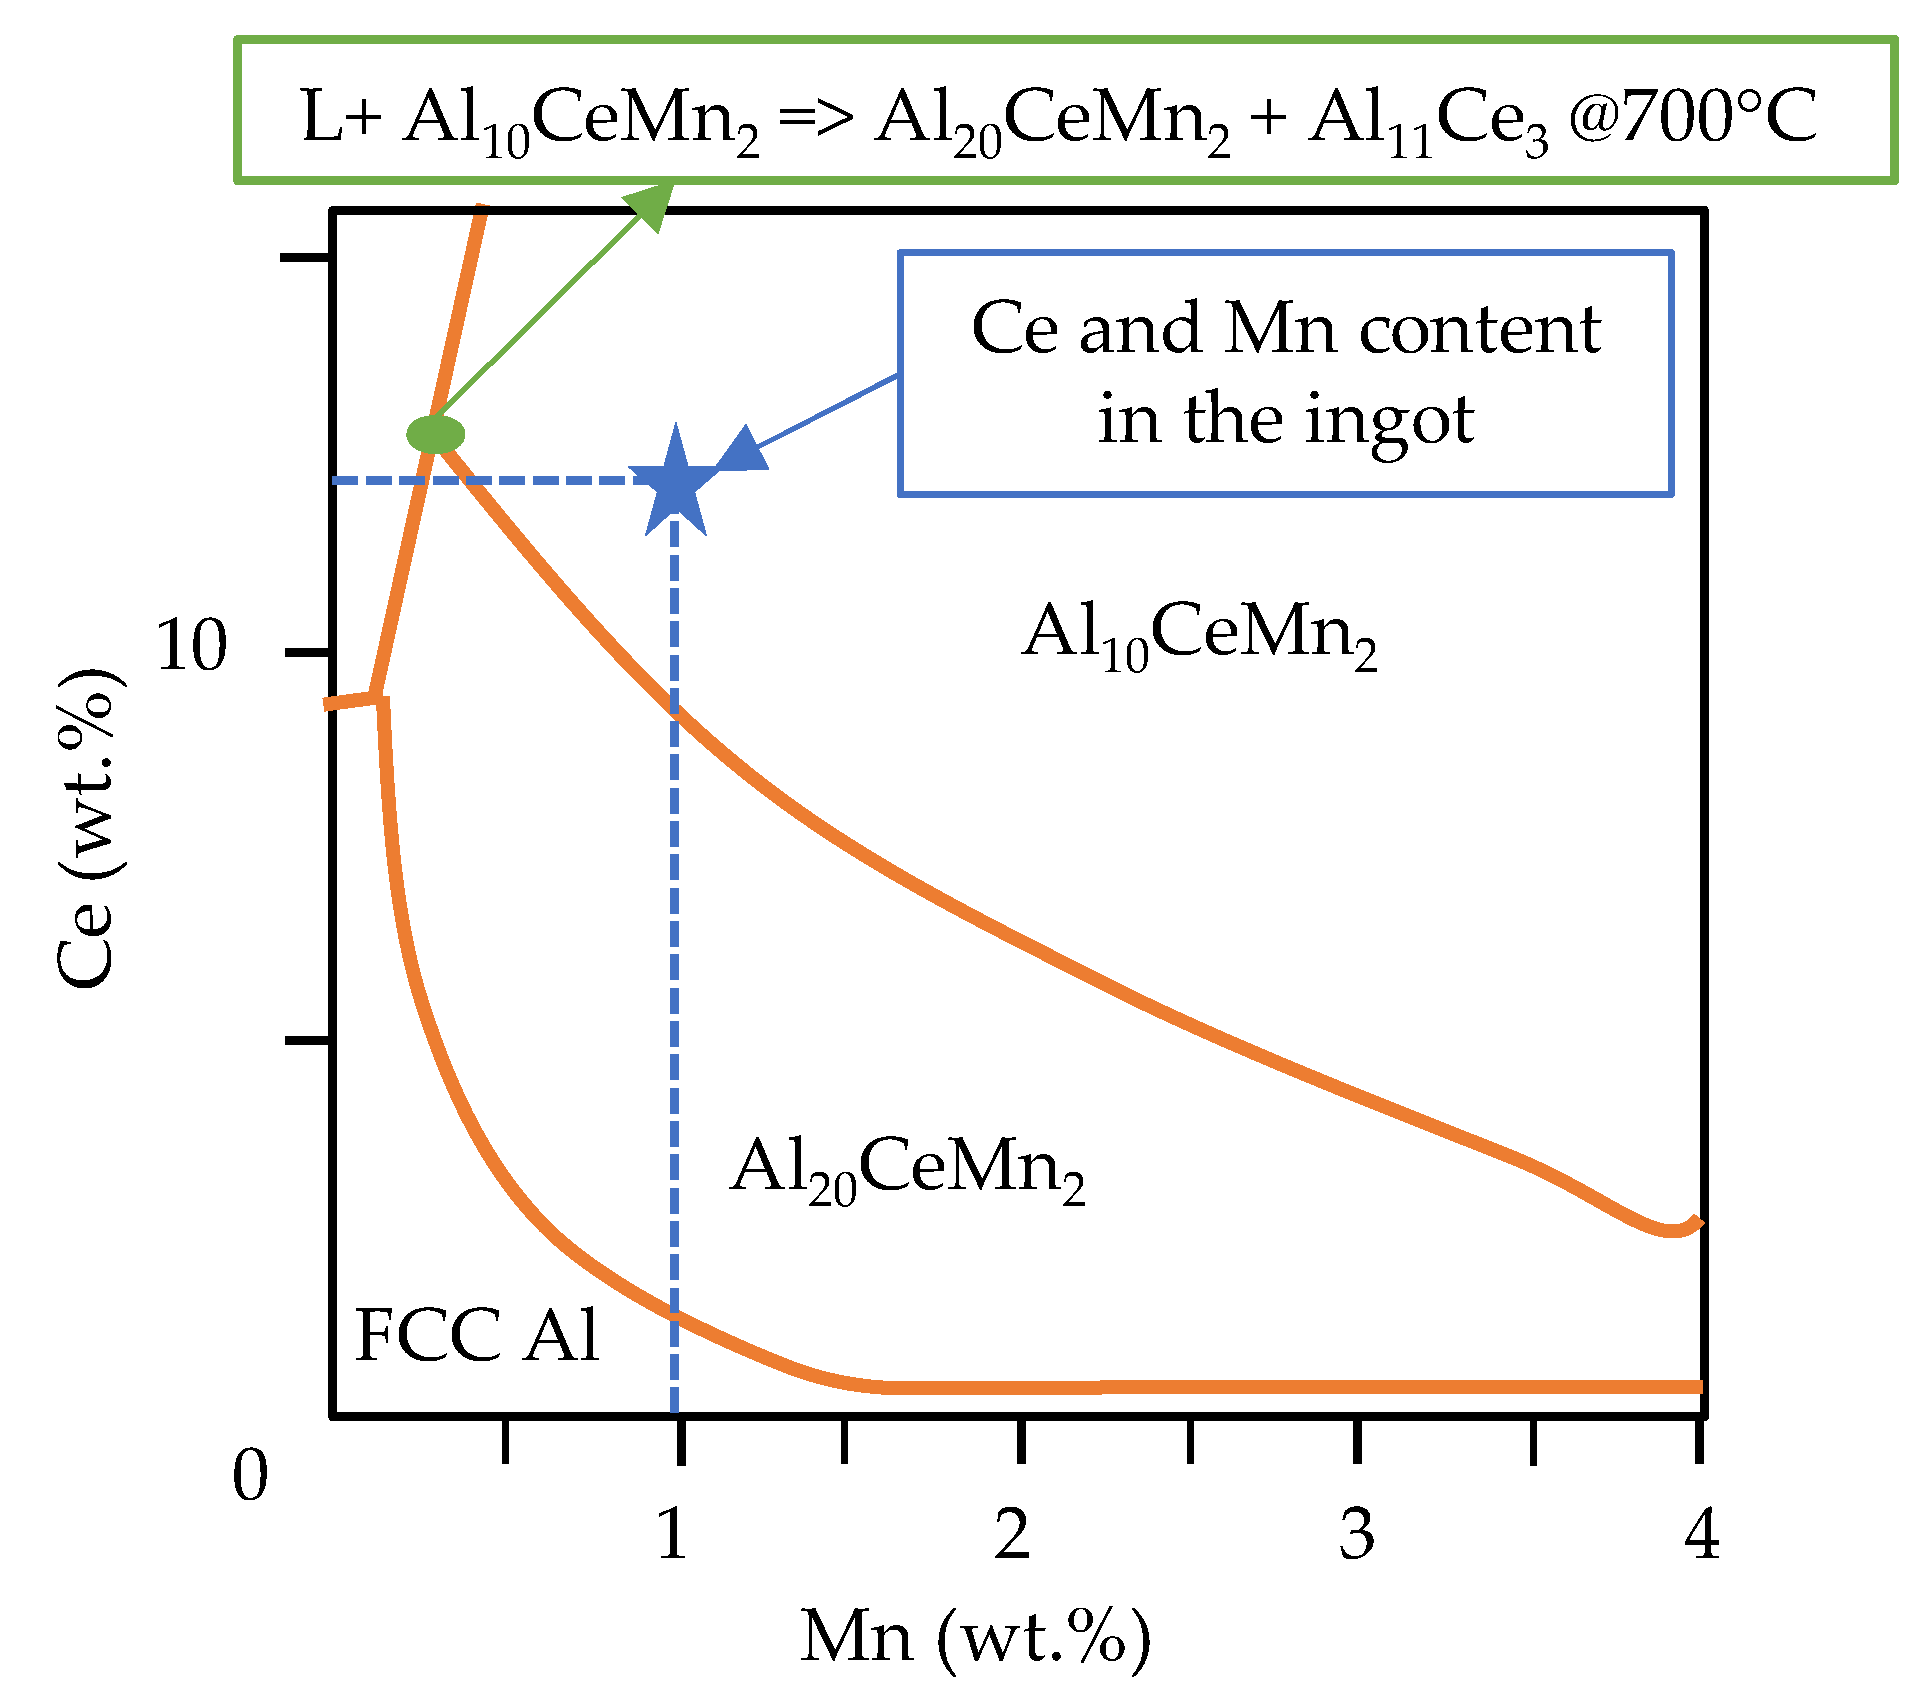
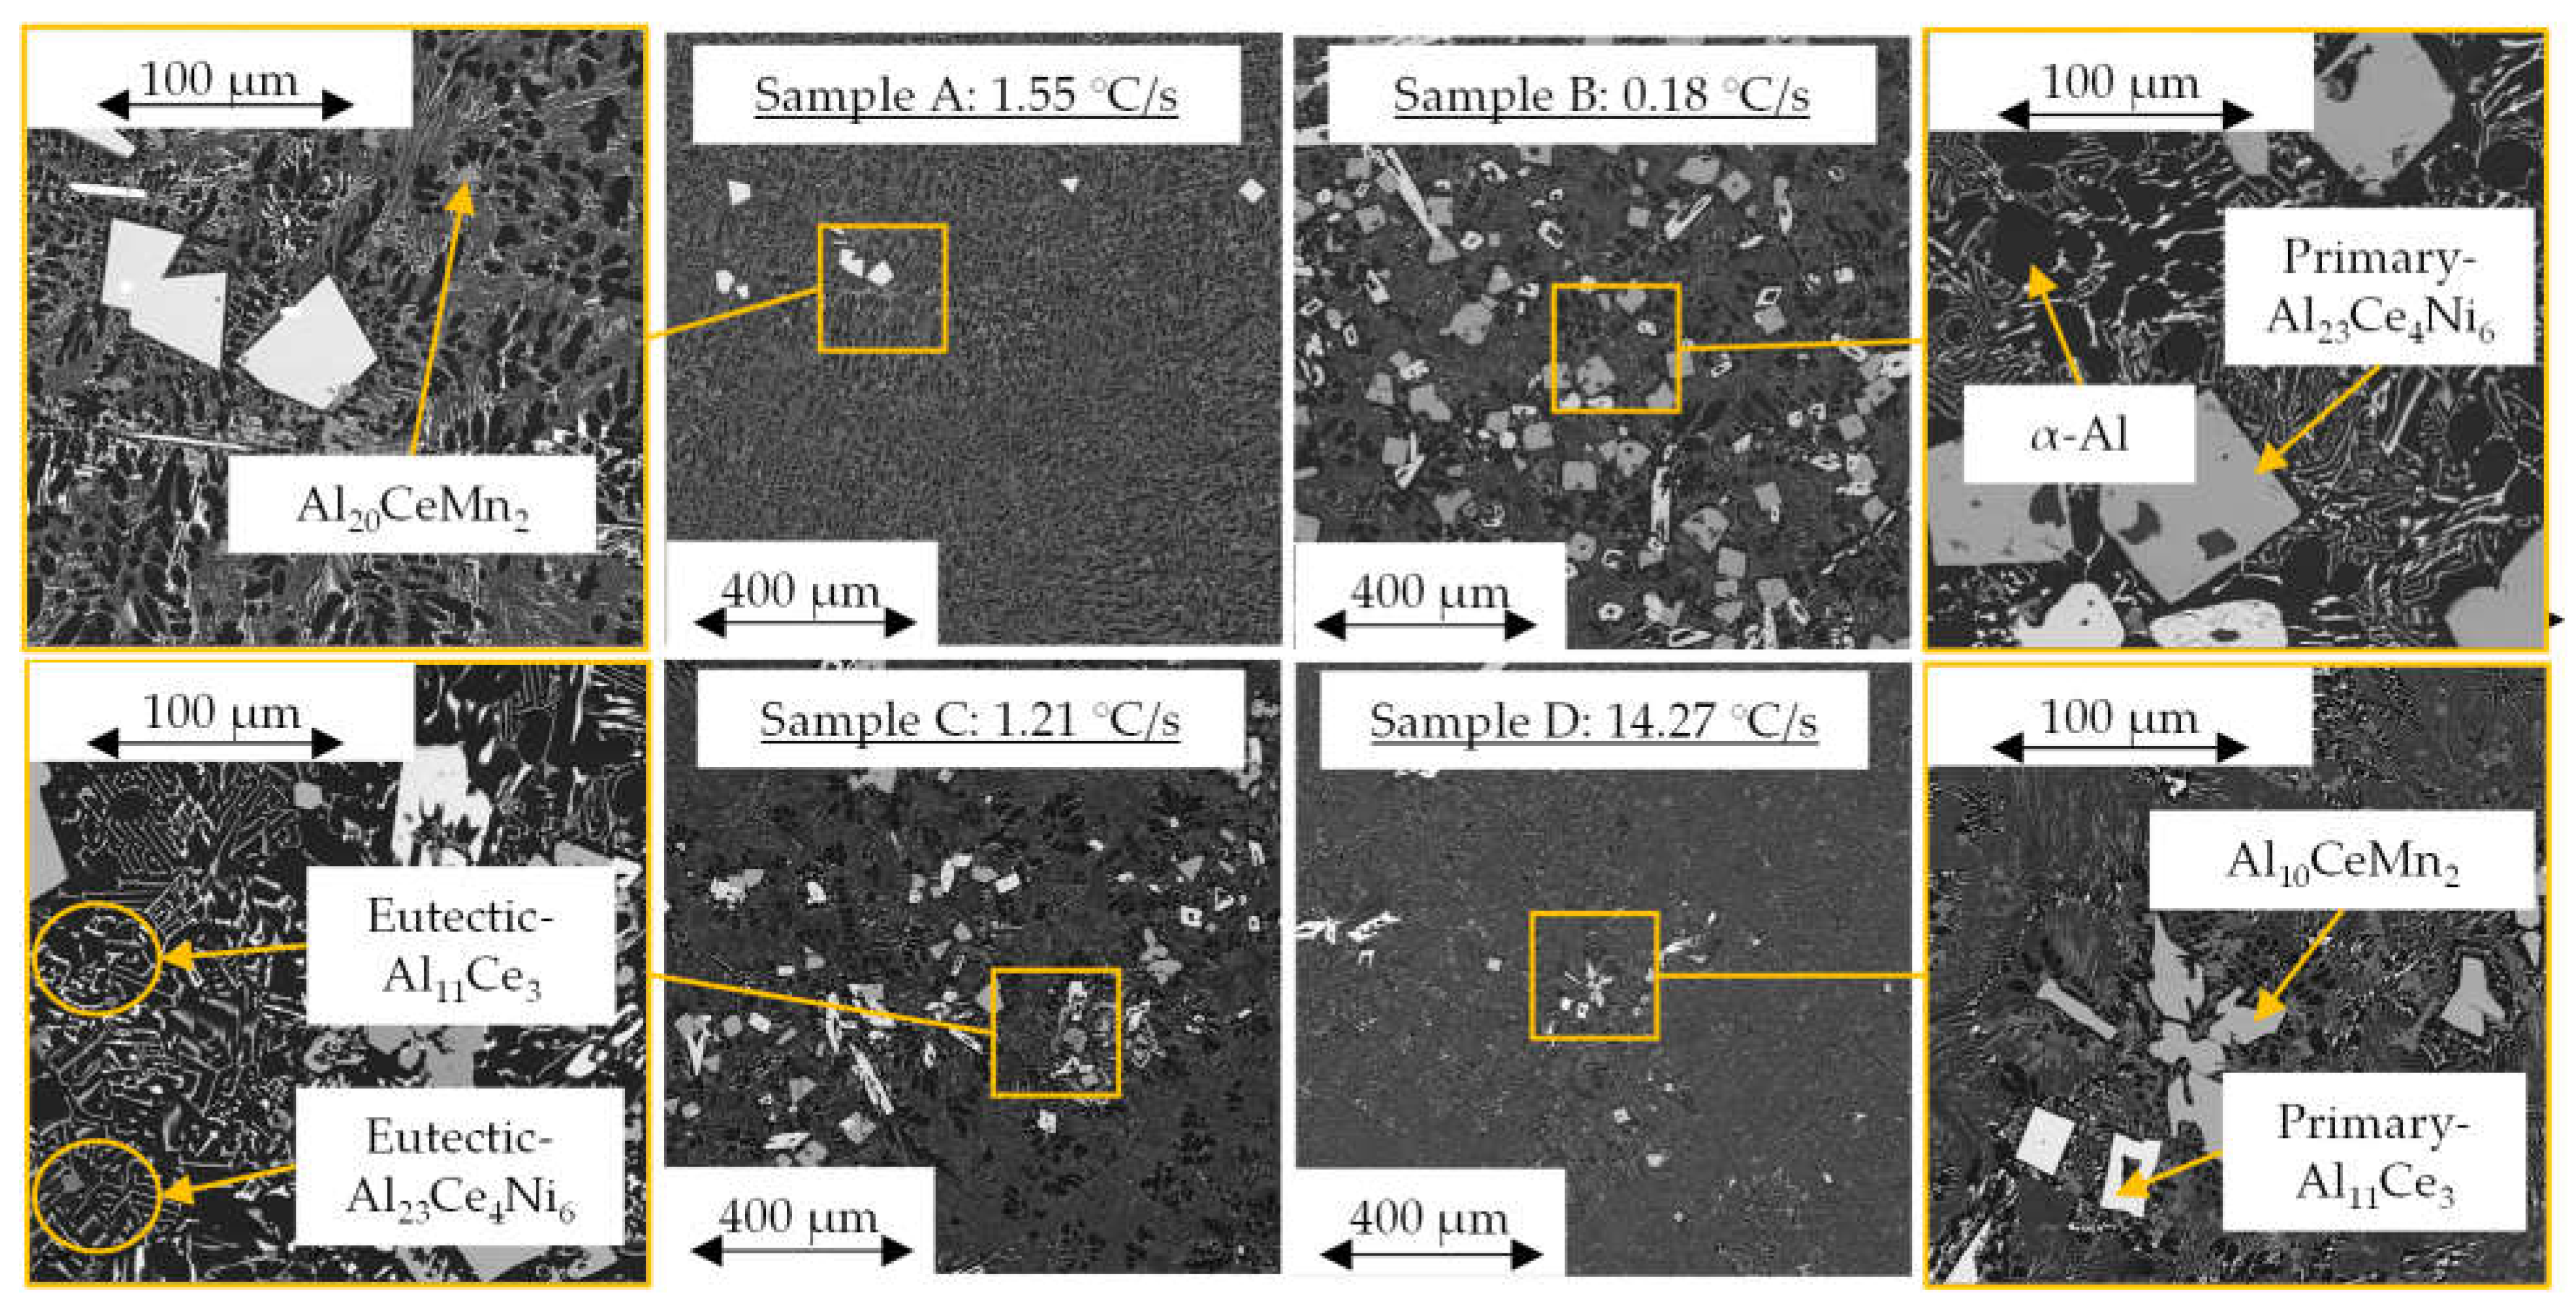
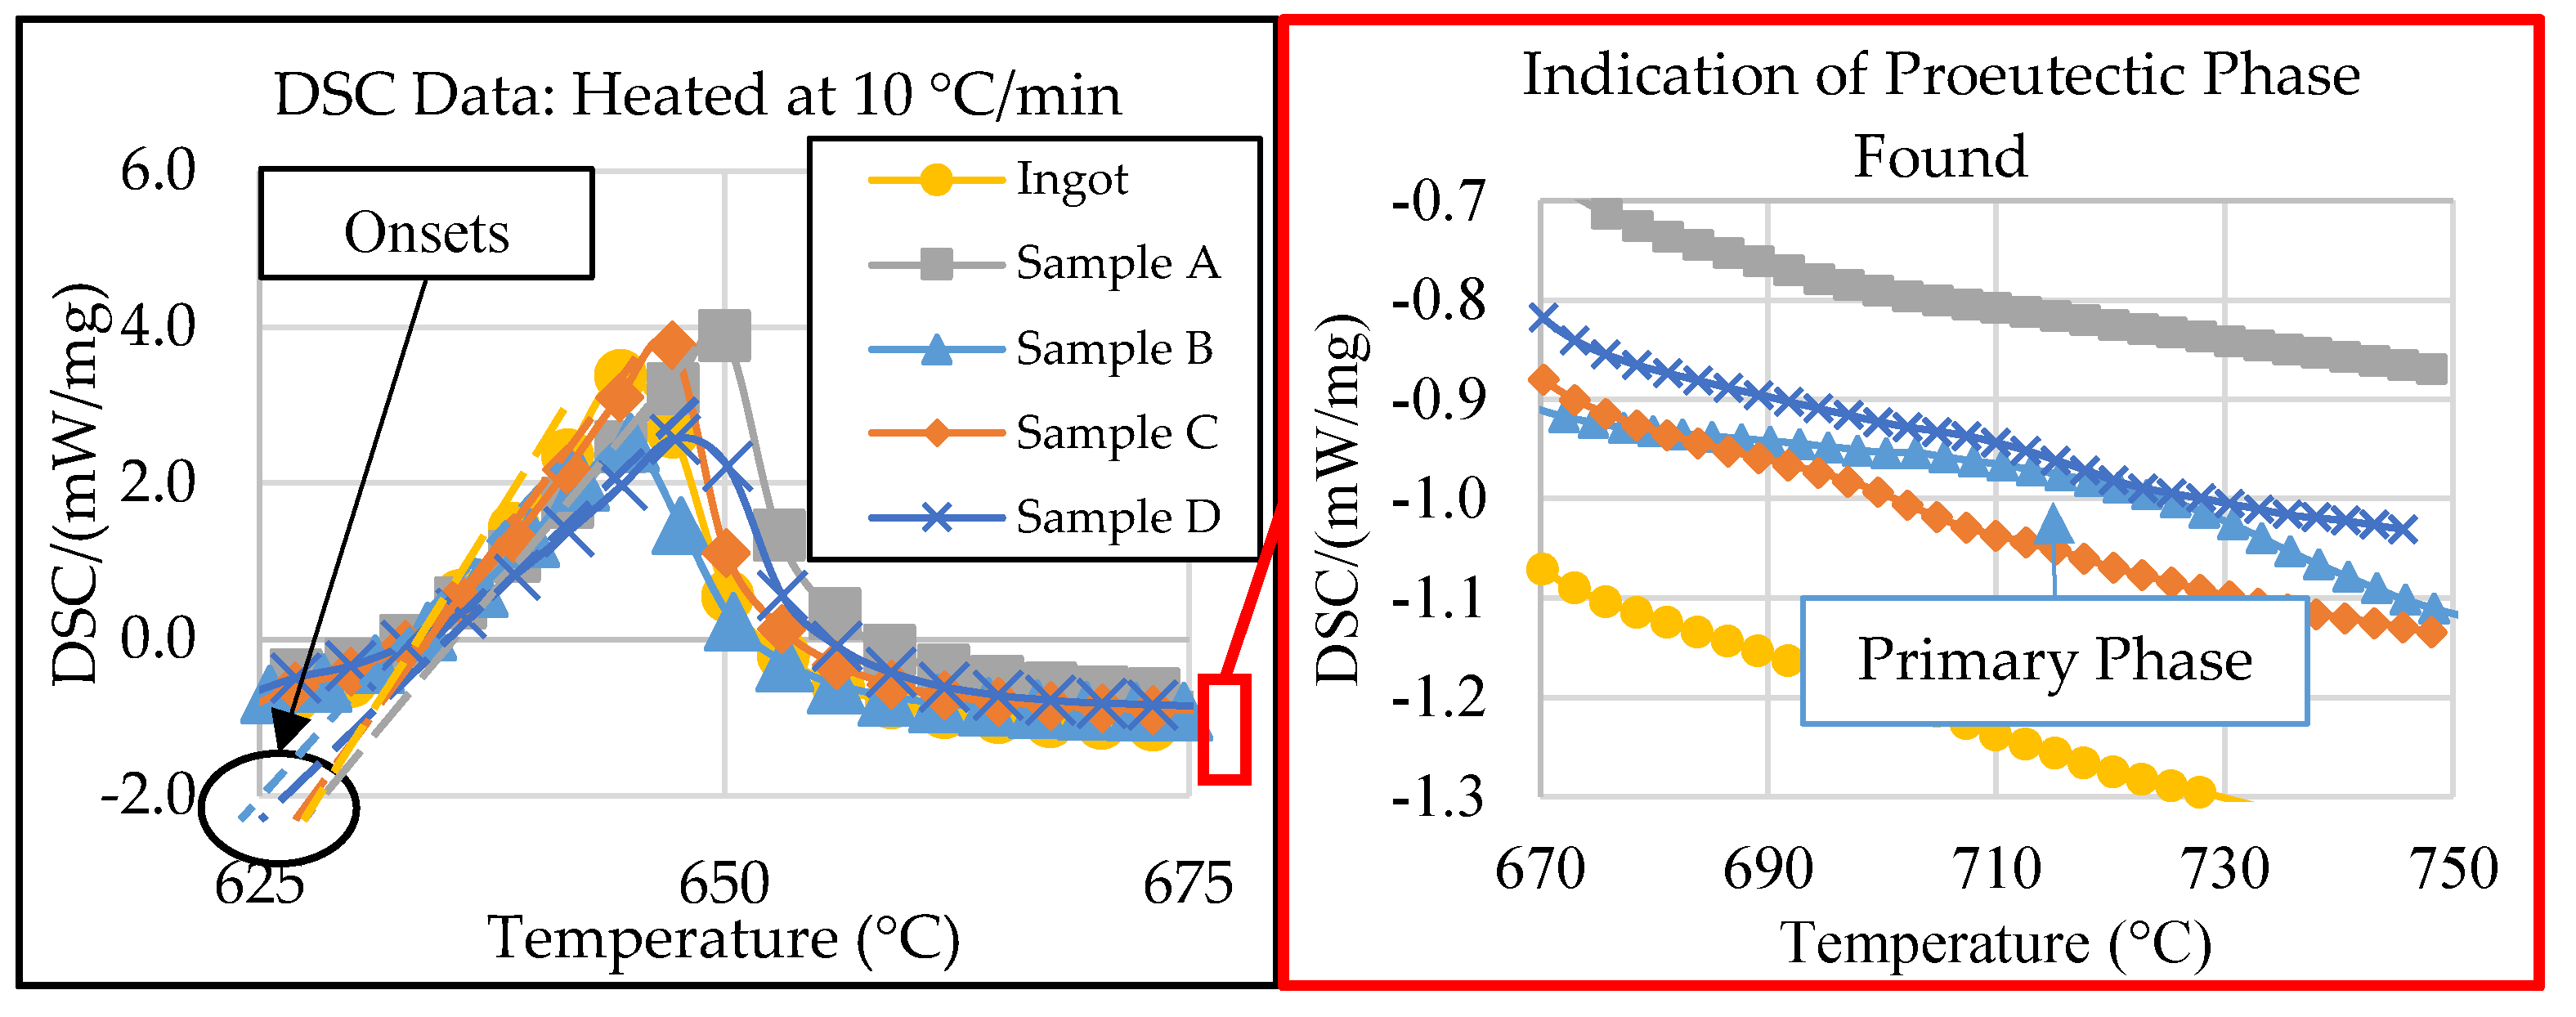
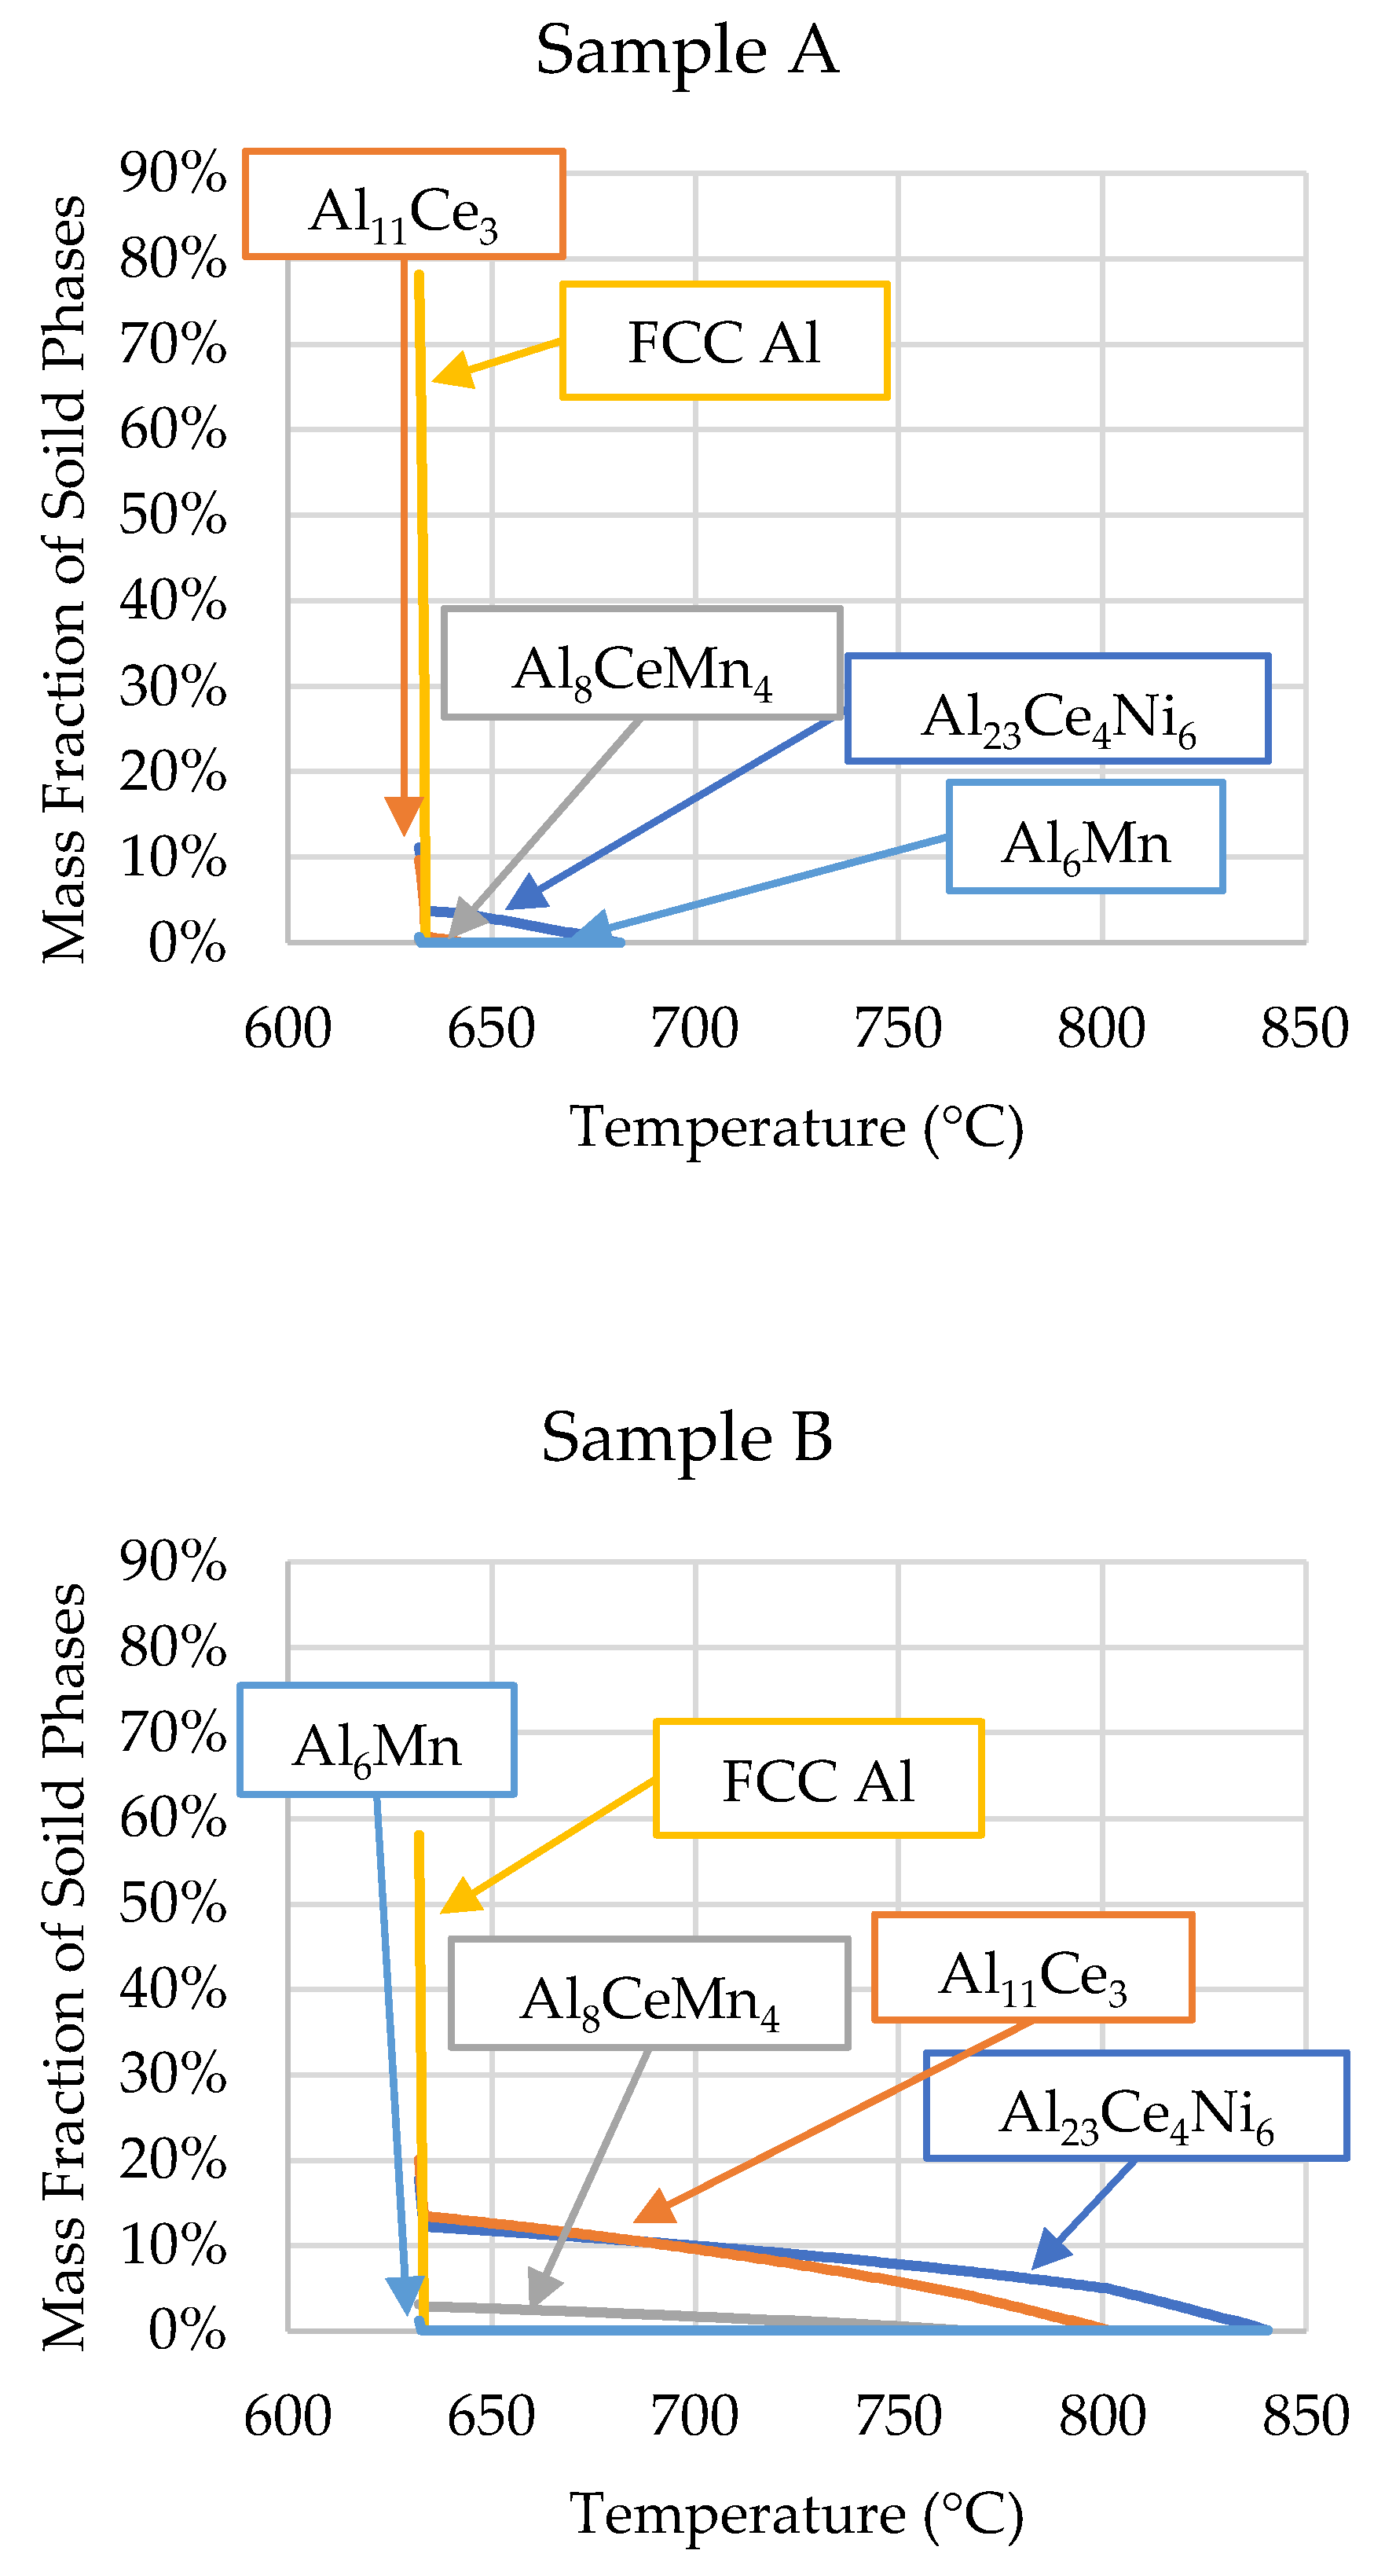
- Cooling rate and directional solidification drastically affect the formation of the ternary Al-Ce-Mn phases. Cooling rates above 1.21 °C/s do not allow the Al10CeMn2 phase to transition to Al20CeMn2 + Al11Ce3 at 700 °C. Therefore, the Al-Ce-Ni-Mn alloy can have its mechanical properties tailored based on which Al-Ce-Mn ternary phase benefits specific applications.
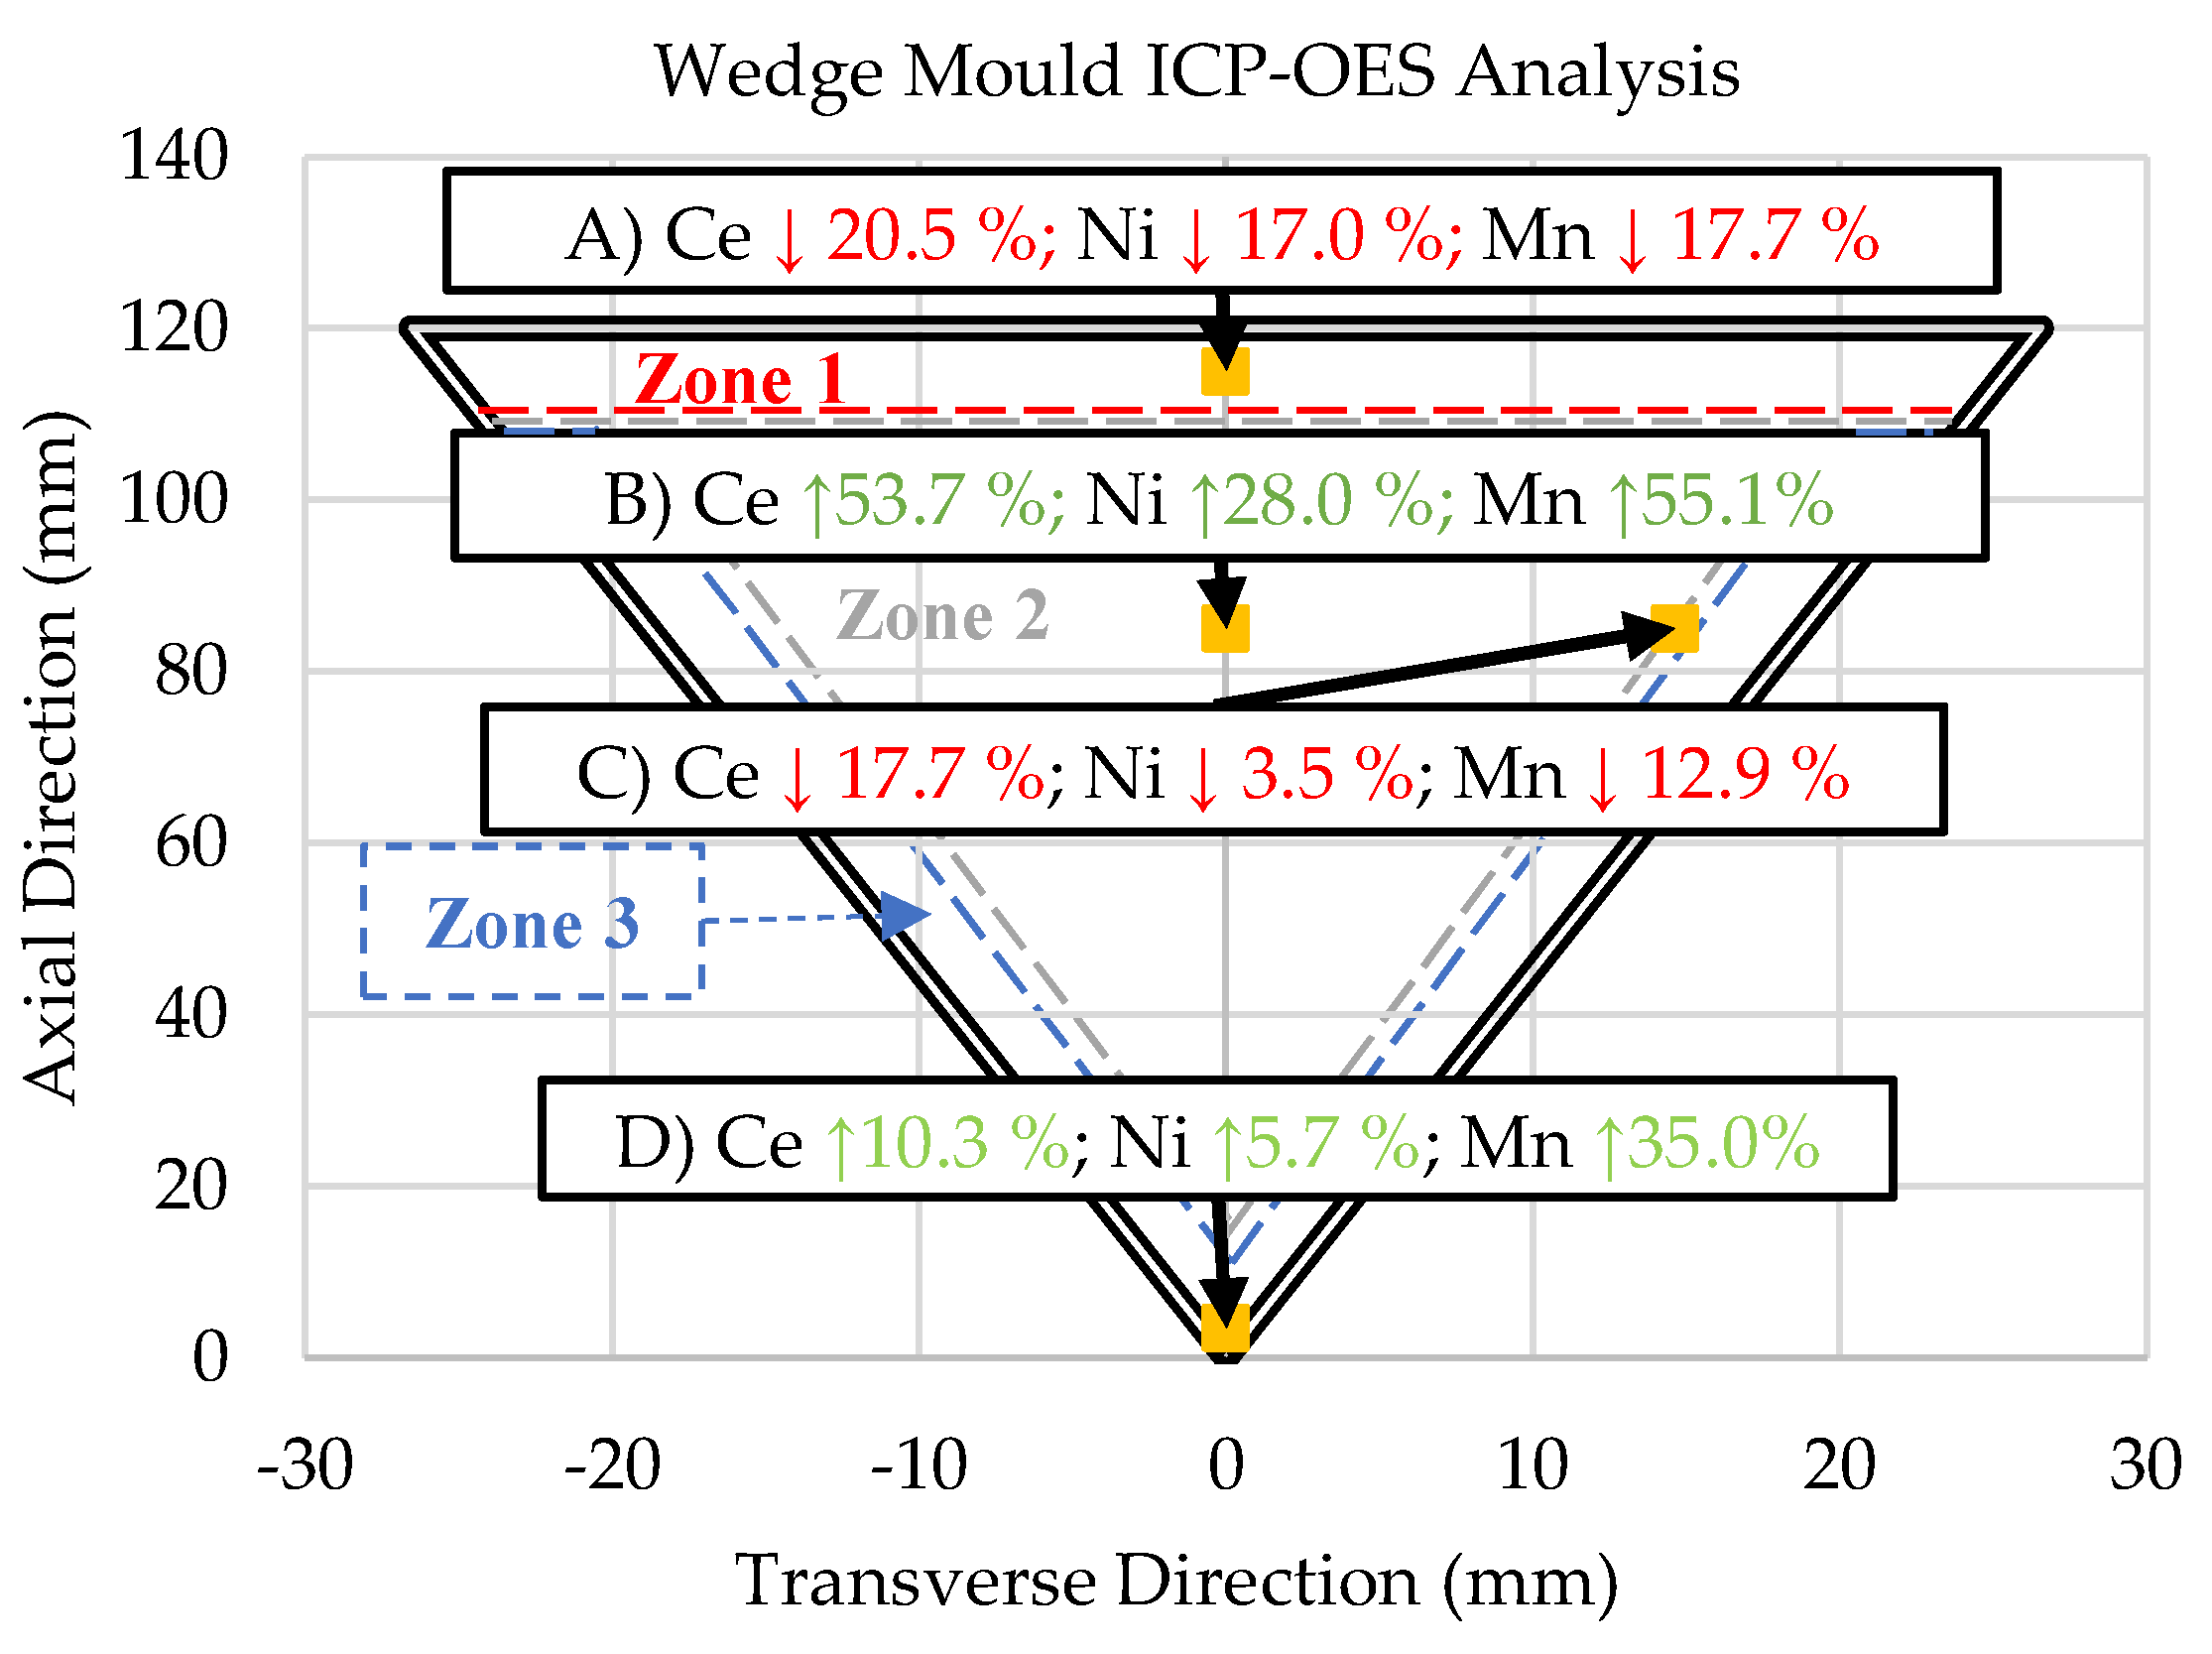
- Induced directional solidification also significantly impacts the consistency of composition throughout the final cast product. The solidification sequence must be considered when casting these novel alloys as rapidly solidified areas will lead to hypereutectic compositions in the slower cooled regions of the casting, as is evident by the ICP-OES results in this study. A hypereutectic composition and large solidification range lead to significant primary blocky Al23Ce4Ni6 and Al11Ce3 phases, which may be desirable or undesirable, depending on the application.
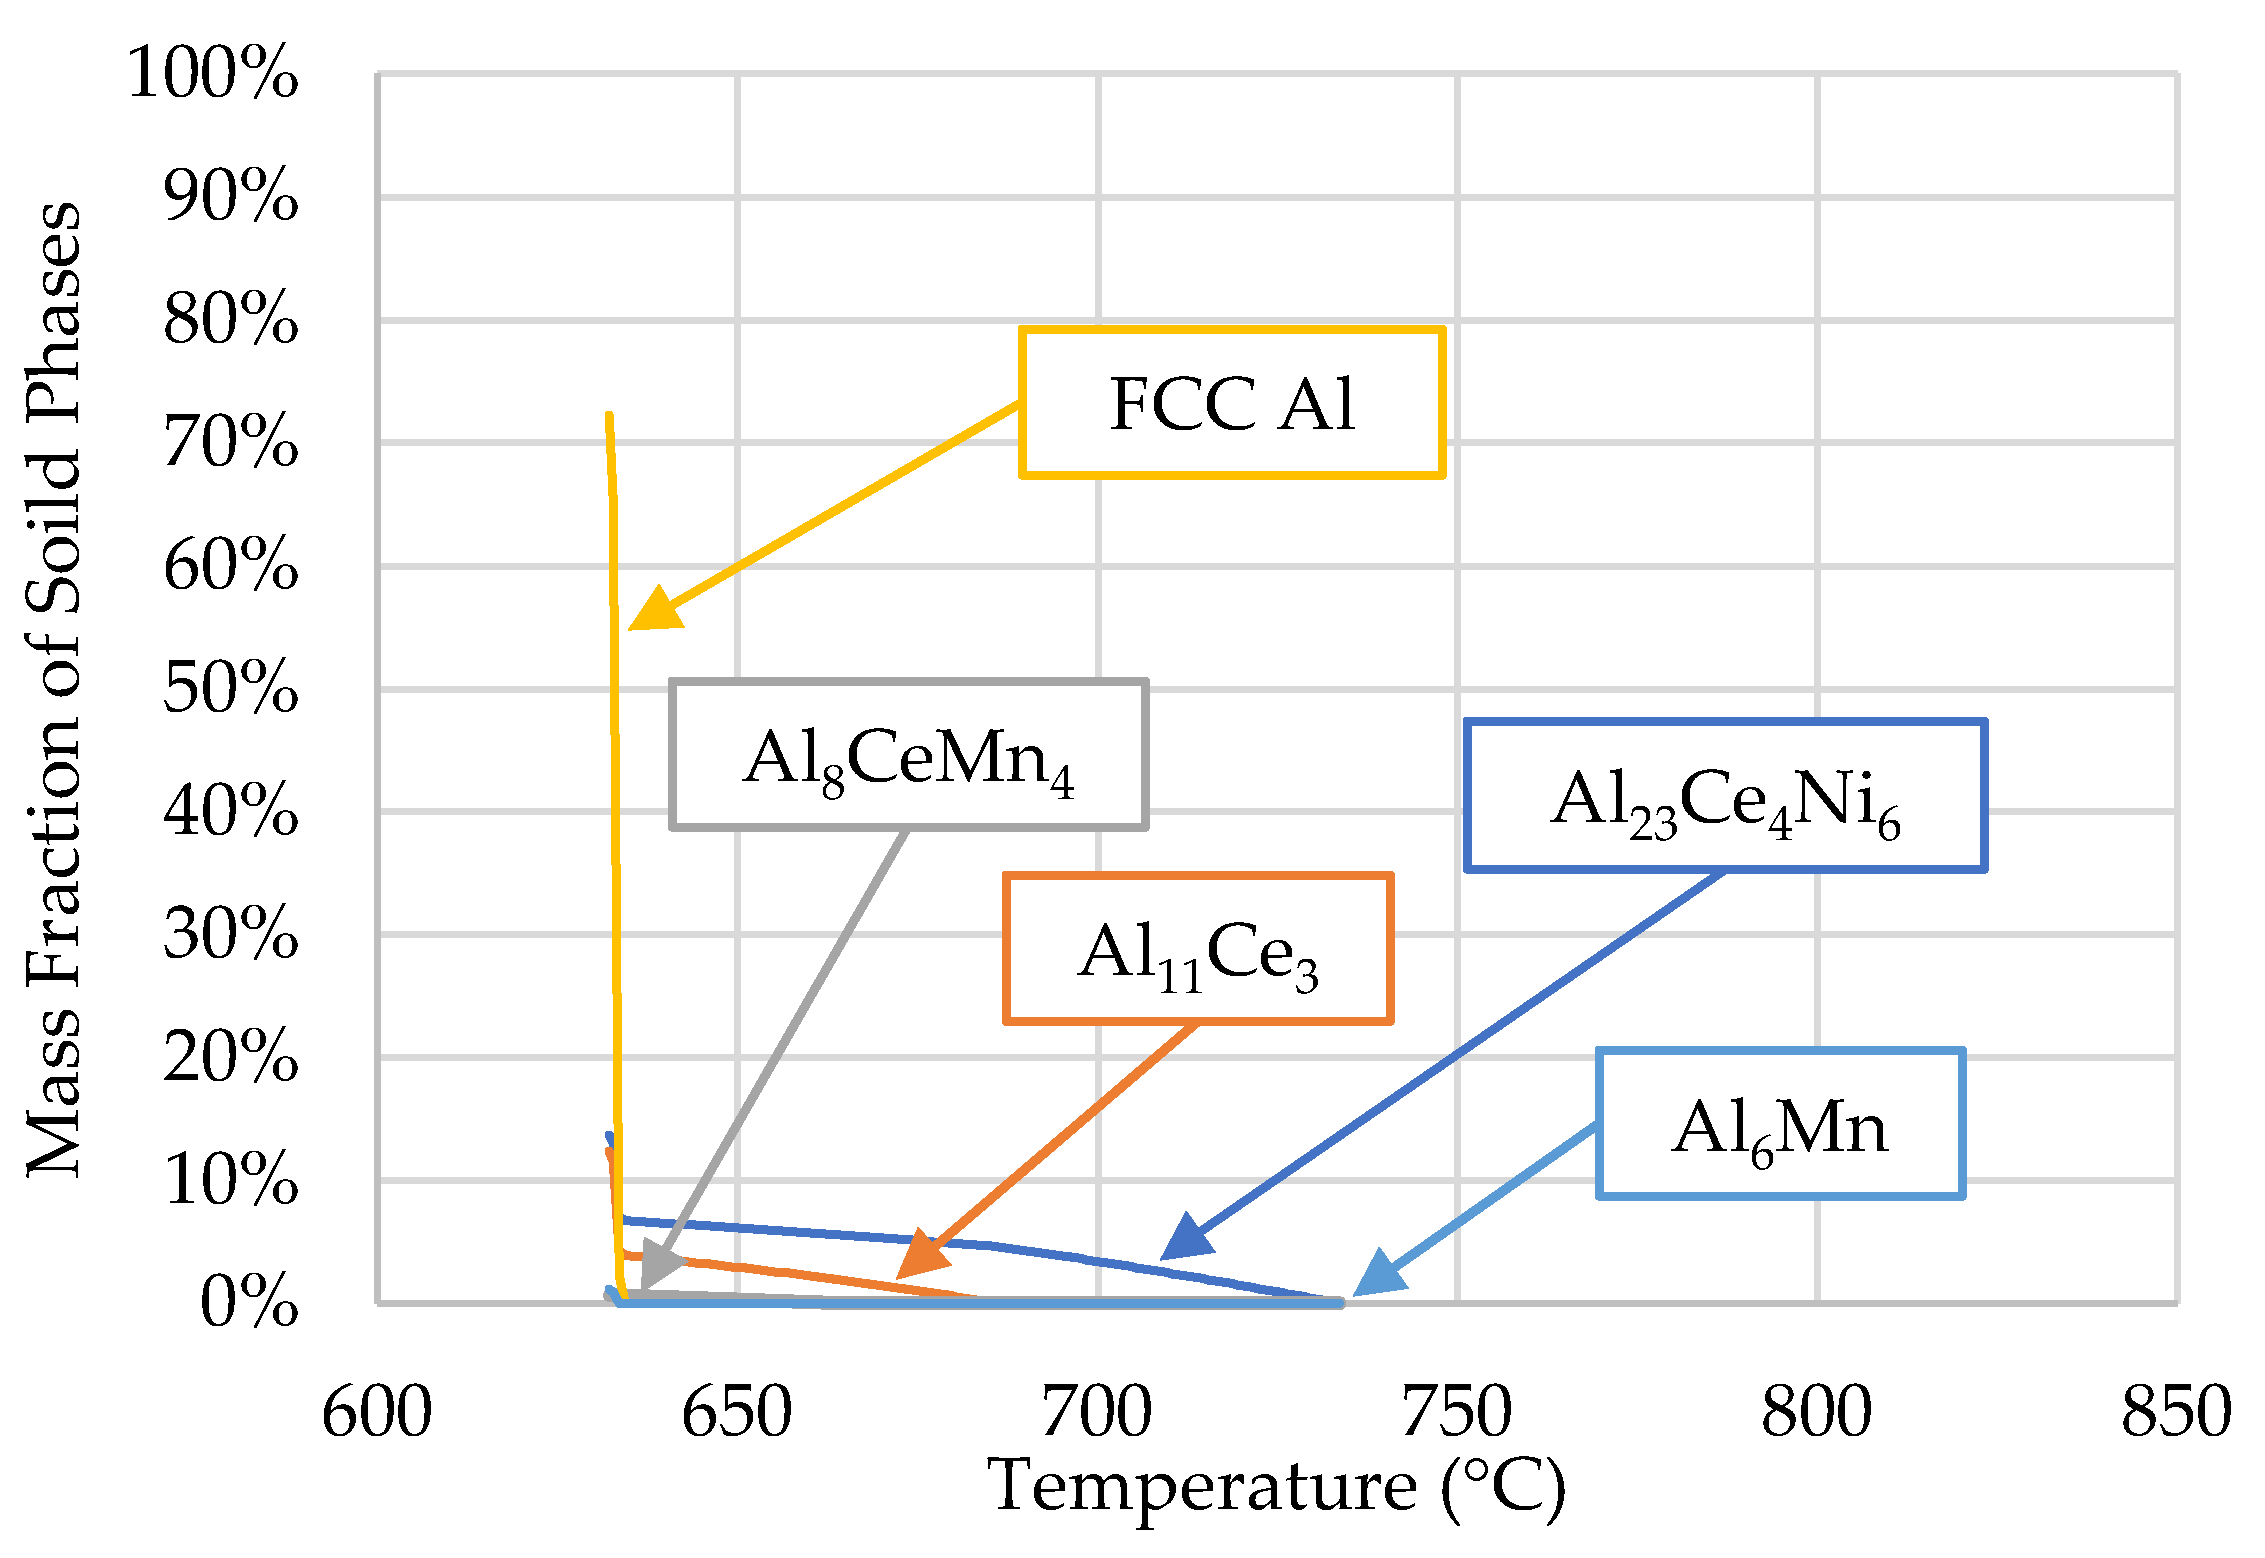
- The Al23Ce4Ni6 phase has a notably higher (~2.6 at. %) Mn solubility than predicted by the ThermoCalcTM software. The same goes for the solubility of Ni in Al10CeMn2 (3.33 at. %) and Al20CeMn2 (0.32 at. %).
Author Contributions
Funding
Data Availability Statement
Acknowledgments
References
- Castro-Alvarez, A.; Gil, Y.; Llanos, L.; Aravena, D. High performance single-molecule magnets, Orbach or Raman relaxation suppression. Inorg. Chem. Front. 2020, 7, 2478–2486. [Google Scholar] [CrossRef]
- Goll, D.; Kronmüller, H. High-performance permanent magnets. Naturwissenschaften 2000, 87, 423–438. [Google Scholar] [CrossRef] [PubMed]
- Hirosawa, S.; Nishino, M.; Miyashita, S. Perspectives for high-performance permanent magnets: Applications, coercivity, and new materials. Adv. Nat. Sci. Nanosci. Nanotechnol. 2017, 8. [Google Scholar] [CrossRef]
- U. S. G. Survey. Mineral commodity summaries. Available online: https://www.usgs.gov/centers/nmic/mineral-commodity-summaries (accessed 15 Jan. 2023).
- Sims, Z.C.; et al. How cerium and lanthanum as coproducts promote stable rare earth production and new alloys. J. Sustain. Metall. 2022, 1225–1234. [Google Scholar] [CrossRef] [PubMed]
- Belov, N.A.; Naumova, E.A.; Eskin, D.G. Casting alloys of the Al-Ce-Ni system: Microstructural approach to alloy design. Mater. Sci. Eng. A 1999, 271, 134–142. [Google Scholar] [CrossRef]
- Stroh, J.; Sediako, D.; Weiss, D. Development of cerium-reinforced specialty aluminum alloy with application of X-ray and neutron diffraction. Int. J. Met. 2021, 15, 29–39. [Google Scholar] [CrossRef]
- Aghaie, E.; Stroh, J.; Sediako, D.; Rashidi, A.; Milani, A.S. Improving the mechanical properties of the B319 aluminum alloy by addition of cerium. Mater. Sci. Eng. A 2020, 793, 1–9. [Google Scholar] [CrossRef]
- Kozakevich, J.R.; Stroh, J.; Sediako, D.; Weiss, D.; Loukus, A.; Vogel, S.C. Elevated temperature creep and tensile performance of extruded Mg-10Ce alloy. J. Mater. Eng. Perform. 2022, 32, 2758–2765. [Google Scholar] [CrossRef]
- Kozakevich, J.R.; Stroh, J.; Mallouhi, V.; Sediako, D.; Weiss, D. Interplay between cooling rate, microstructure, and mechanical properties of an Al-Ce-Ni-Mn alloy. Light Met. 2022, 83–89. [Google Scholar] [CrossRef]
- Fodran, E.J. Microstructural evolution and thermal stability of Al-Ce-Ni ternary eutectic. Doctor in Philosophy, The University of Florida, Gainesville, August 2002. [Google Scholar]
- Weiss, D. Improved high-temperature aluminum alloys containing cerium. J. Mater. Eng. Perform. 2019, 28, 1903–1908. [Google Scholar] [CrossRef]
- Czerwinski, F. Thermal stability of aluminum–cerium binary alloys containing the Al–Al11Ce3 eutectic. Mater. Sci. Eng. A 2021, 809, 1–11. [Google Scholar] [CrossRef]
- Kozakevich, J.R. Development and characterization of a novel near-eutectic Al-Ce alloy with additions of Ni and Mn for elevated temperature applications in the automotive industry. Master’s Thesis, The University of British Columbia, Kelowna, December 2022. [Google Scholar]
- Stroh, J. Development of orecipitation-strengthened aluminum alloys and manufacturing processes for next generation automotive powertrains. Doctor in Philosophy, The University of British Columbia, Kelwona, April 2021. [Google Scholar]
- Sims, Z.C.; et al. High performance aluminum-cerium alloys for high-temperature applications. Mater. Horizons 2017, 4, 1070–1078. [Google Scholar] [CrossRef]
- Stroh, J.; Sediako, D.; Weiss, D.; Peterson, V.K. In situ neutron diffraction solidification analyses of rare earth reinforced hypoeutectic and hypereutectic aluminum-silicon alloys. Light Metals 2020, 174–178. [Google Scholar] [CrossRef]
- Aniolek, M.; Smith, T.; Czerwinski, F. Combining differential scanning calorimetry and cooling- heating curve thermal analysis to study the melting and solidification behavior of al-ce binary alloys. Metals (Basel) 2021, 11, 1–17. [Google Scholar] [CrossRef]
- Czerwinski, F.; Amirkhiz, B.S. On the Al-Al11Ce3 eutectic transformation in aluminum-cerium binary alloys. Materials (Basel). 2020, 13. [Google Scholar] [CrossRef] [PubMed]
- Czerwinski, F. A search for the eutectic system of high-temperature cast aluminum alloys. Mater. Sci. Technol. (United Kingdom) 2021, 37, 683–692. [Google Scholar] [CrossRef]
- Sims, Z.C.; et al. Cerium-based, intermetallic-strengthened aluminum casting alloy: high-volume co-product development. J. Miner. Met. Mater. Soc. 2016, 68, 1940–1947. [Google Scholar] [CrossRef]
- Czerwinski, F. Thermal stability of aluminum alloys. Materials (Basel). 2020, 13, 1–49. [Google Scholar] [CrossRef]
- Weiss, D.; Rios, O.; Sims, Z.C.; Mccall, S.; Ott, R. Casting characteristics of high cerium content aluminum alloys. Light Metals 2017, 205–211. [Google Scholar]
- Nguyen, R.T.; et al. Anticipating impacts of introducing aluminum-cerium alloys into the United States automotive market. Resour. Conserv. Recycl. 2019, 144, 340–349. [Google Scholar] [CrossRef]
- Salonitis, K.; Jolly, M.; Pagone, E.; Papanikolaou, M. Life-cycle and energy assessment of automotive component manufacturing: The dilemma between aluminum and cast iron. Energies 2019, 12. [Google Scholar] [CrossRef]
- Kozakevich, J.R.; Stroh, J.; Sediako, D.; Weiss, D. DSC thermal analysis of a near eutectic Al-Ce alloy with additions of Ni and Mn. COM Light Met. (in press).
- ASTM (2017) Standard Guide for Preparation of Metallographic Specimens. ASTM International. [CrossRef]
- Vandersluis, E.; Ravindran, R. Comparison of measurement methods for secondary dendrite arm spacing Metallogr. Microstruct. Anal. 2017, 6, 89–94. [Google Scholar] [CrossRef]
- Zhang, H.; Zhang, C.; Zhang, L.; Zhai, F.; Tian, J. Effect of Cu on the microstructure and the property of Al-Ce-Ni-Cu amorphous nano-composite materials. Adv. Mater. Res. 2013, 624, 248–251. [Google Scholar] [CrossRef]
- Haghdadi, H.; Phillion, A.B.; Maijer, D.M. Microstructure characterization and thermal analysis of aluminum alloy B206 during solidification. Metall. Mater. Trans. A Phys. Metall. Mater. Sci. 2015, 46, 2073–2081. [Google Scholar] [CrossRef]
- Boettinger, W.J.; Kattner, U.R.; Moon, K.W.; Perepezko, J.H. DTA and heat-flux DSC measurements of alloy melting and freezing. In Methods for Phase Diagram Determination; Zhao, J.C., Ed.; Elsevier Ltd., 2007; pp. 151–221. [Google Scholar] [CrossRef]
- ASTM (2015) E794 − 06; Standard test method for melting and crystallization temperatures by thermal. ASTM International, 2015. [CrossRef]
- Gout, D.; Benbow, E.; Gourdon, O.; Miller, G.J. Crystallographic, electronic and magnetic studies of Ce4Ni 6Al23: A new ternary intermetallic compound in the cerium-nickel-aluminum phase diagram. J. Solid State Chem. 2003, 174, 471–481. [Google Scholar] [CrossRef]
- Yang, Y.; et al. Primary solidification of ternary compounds in Al-rich Al–Ce–Mn alloys. J. Alloys Compd. 2020, 844. [Google Scholar] [CrossRef]
- Coury, F.G.; Kiminami, C.S.; Botta, W.J.; Bolfarini, C.; Kaufman, M.J. Design and production of Al-Mn-Ce alloys with tailored properties. Mater. Des. 2016, 110, 436–448. [Google Scholar] [CrossRef]
- Gordillo, M. A.; Cernatescu, I.; Aindow, T.T.; Watson, T.J.; Aindow, M. Phase stability in a powder-processed Al-Mn-Ce alloy. J. Mater. Sci. 2014, 49, 3742–3754. [Google Scholar] [CrossRef]
- Liu, X.J.; Ohnuma, J.; Kainuma, R.; Ishida, K. Thermodynamic assessment of the Aluminum-Manganese (Al-Mn) binary phase diagram. J. Phase Equilibria 1999, 20, 45–56. [Google Scholar] [CrossRef]
- Mondolfo, L.F. Al–Mn Aluminum–Manganese system. In Aluminum Alloys: Structures and Properties; Butterworth-Heinemann, 1976; pp. 324–329. [Google Scholar] [CrossRef]
- Mondolfo, L.F. Al–Ce–Mn Aluminum–Cerium–Manganese system. In Aluminum Alloys: Structures and Properties; Butterworth-Heinemann, 1976; pp. 470–471. [Google Scholar] [CrossRef]
- Okamoto, H. Al-Ce (Aluminum-Cerium). J. Phase Equilibria Diffus. 2011, 32, 392–393. [Google Scholar] [CrossRef]
- Tang, C.; Du, Y.; Zhou, H. The phase equilibria of the Al-Ce-Ni system at 500 °C. J. Alloys Compd. 2009, 470, 222–227. [Google Scholar] [CrossRef]
- Tang, C.; et al. Experimental investigation of the Al-Ce-Ni system at 800 °C. Intermetallics 2008, 16, 432–439. [Google Scholar] [CrossRef]
- Raghavan, V. Al-Ce-Ni (Aluminum-Cerium-Nickel). J. Phase Equilibria Diffus. 2009, 30, 265–267. [Google Scholar] [CrossRef]
- Tang, C.; et al. Correlation between thermodynamics and glass forming ability in the Al-Ce-Ni system. Intermetallics 2010, 18, 900–906. [Google Scholar] [CrossRef]
| Al | Ce | Ni | Mn | Fe |
|---|---|---|---|---|
| Bal. | 12.37 +/- 1.72 |
3.26 +/- 0.13 |
0.94 +/- 0.04 |
0.12 +/- 0.03 |
| Phase Identification | Element in phase (at. %) | ||||
|---|---|---|---|---|---|
| Al | Ce | Ni | Mn | Fe | |
| Matrix (α-Al) | 99.77 +/- 0.21 |
- | - | 0.23 +/- 0.21 |
- |
| Al11Ce3 - Primary | 79.61 +/- 1.37 |
20.36 +/- 1.36 |
- | - | - |
| Al11Ce3 - Eutectic | 93.43 +/- 1.42 |
6.41 +/- 1.53 |
0.16 +/- 0.37 |
- | - |
| Al23Ce4Ni6 - Primary | 73.37 +/- 0.57 |
8.19 +/- 0.11 |
15.77 +/- 0.34 |
2.56 +/- 0.06 |
0.01 +/- 0.05 |
| Al23Ce4Ni6 - Eutectic | 89.09 +/- 3.14 |
3.25 +/- 0.99 |
6.57 +/- 1.93 |
1.10 +/- 0.24 |
- |
| Al10CeMn2 | 79.02 +/- 0.83 |
7.47 +/- 0.33 |
3.33 +/- 0.20 |
10.17 +/- 0.45 |
- |
| Al20CeMn2 | 87.99 +/- 1.00 |
4.20 +/- 0.27 |
0.32 +/- 0.35 |
7.50 +/- 0.77 |
- |
| Al | Ce | Ni | Mn | Fe | |
|---|---|---|---|---|---|
|
Ingot (Reference) |
Bal. | 12.374 +/- 1.722 | 3.263 +/- 0.129 | 0.937 +/- 0.041 | 0.119 +/- 0.032 |
| A) 1.55 °C/s | Bal. | 9.842 +/- 0.185 (-20.5%) |
2.707 +/- 0.027 (-17.0%) |
0.771 +/- 0.016 (-17.7%) |
0.0917 +/- 0.002 (-22.8%) |
| B) 0.18 °C/s | Bal. | 19.024 +/- 0.712 (+53.7%) |
4.175 +/- 0.192 (+28.0%) |
1.452 +/- 0.017 (+55.1%) |
0.157 +/- 0.002 (+32.0%) |
| C) 1.21 °C/s | Bal. | 10.183 +/- 0.128 (-17.7%) |
3.150 +/- 0.032 (-3.5%) |
0.816 +/- 0.012 (-12.9%) |
0.087 +/- 0.001 (-26.6%) |
| D) 14.27 °C/s | Bal. | 13.652 +/- 0.104 (+10.3%) |
3.450 +/- 0.028 (+5.7%) |
1.264 +/- 0.015 (+35.0%) |
0.157 +/- 0.001 (+32.2%) |
| Liquidus (°C) | Solidus (°C) | |||
|---|---|---|---|---|
| DSC | ThermoCalcTM | DSC | ThermoCalcTM | |
| Ingot | 662 | 734 | 632 | 632 |
| Sample A | 655 | 682 | 633 | 632 |
| Sample B | - | 841 | 627 | 632 |
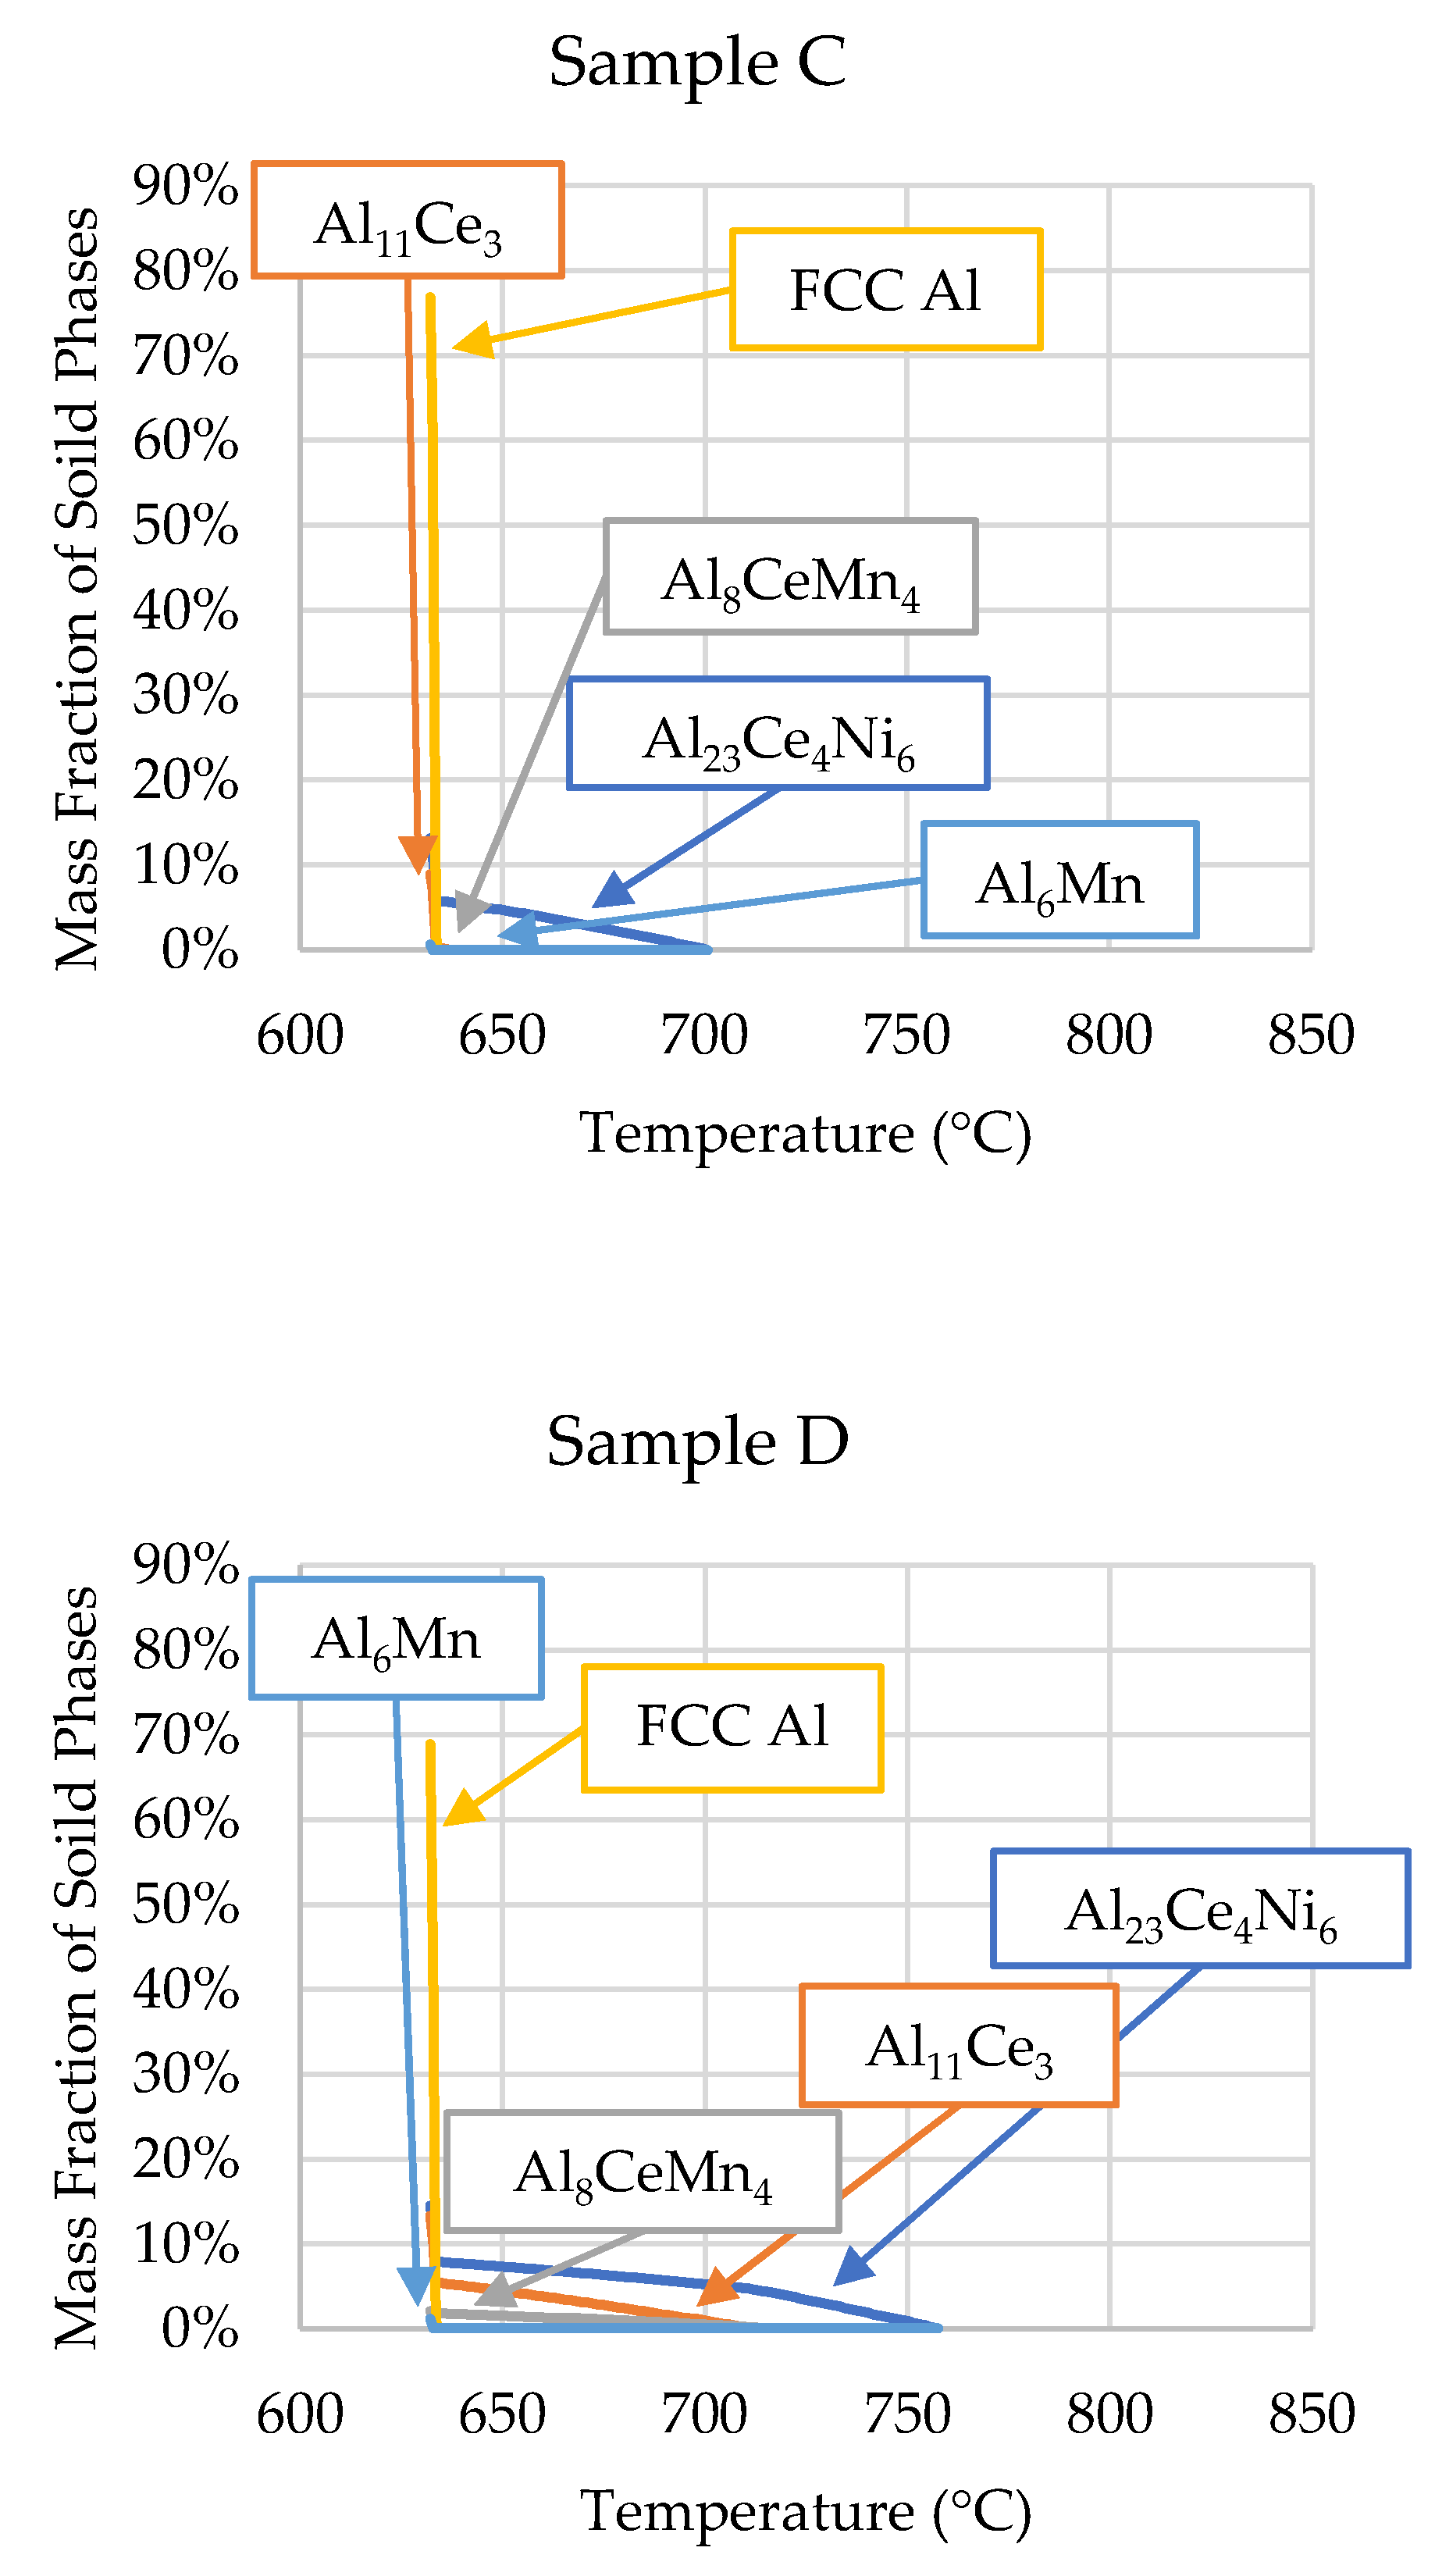
| Sample C | 700 | 701 | 632 | 632 |
| Sample D | - | 758 | 629 | 632 |
Disclaimer/Publisher’s Note: The statements, opinions and data contained in all publications are solely those of the individual author(s) and contributor(s) and not of MDPI and/or the editor(s). MDPI and/or the editor(s) disclaim responsibility for any injury to people or property resulting from any ideas, methods, instructions or products referred to in the content. |
© 2023 by the authors. Licensee MDPI, Basel, Switzerland. This article is an open access article distributed under the terms and conditions of the Creative Commons Attribution (CC BY) license (http://creativecommons.org/licenses/by/4.0/).


