Submitted:
05 May 2023
Posted:
09 May 2023
You are already at the latest version
Abstract
Keywords:
1. Introduction
2. Materials and Methods
2.1. Clinical isolates - Setting
2.2. Ethics approval
2.3. Microbiological methods - Antimicrobial susceptibility testing
2.4. DNA extraction and whole genome sequencing
2.5. Assembly assessment and genome annotation
2.6. MLST and detection of antimicrobial resistance genes and plasmids
2.7. Genomic comparison – Core genome single-nucleotide polymorphism (cgSNP)-based phylogenetic analysis
3. Results
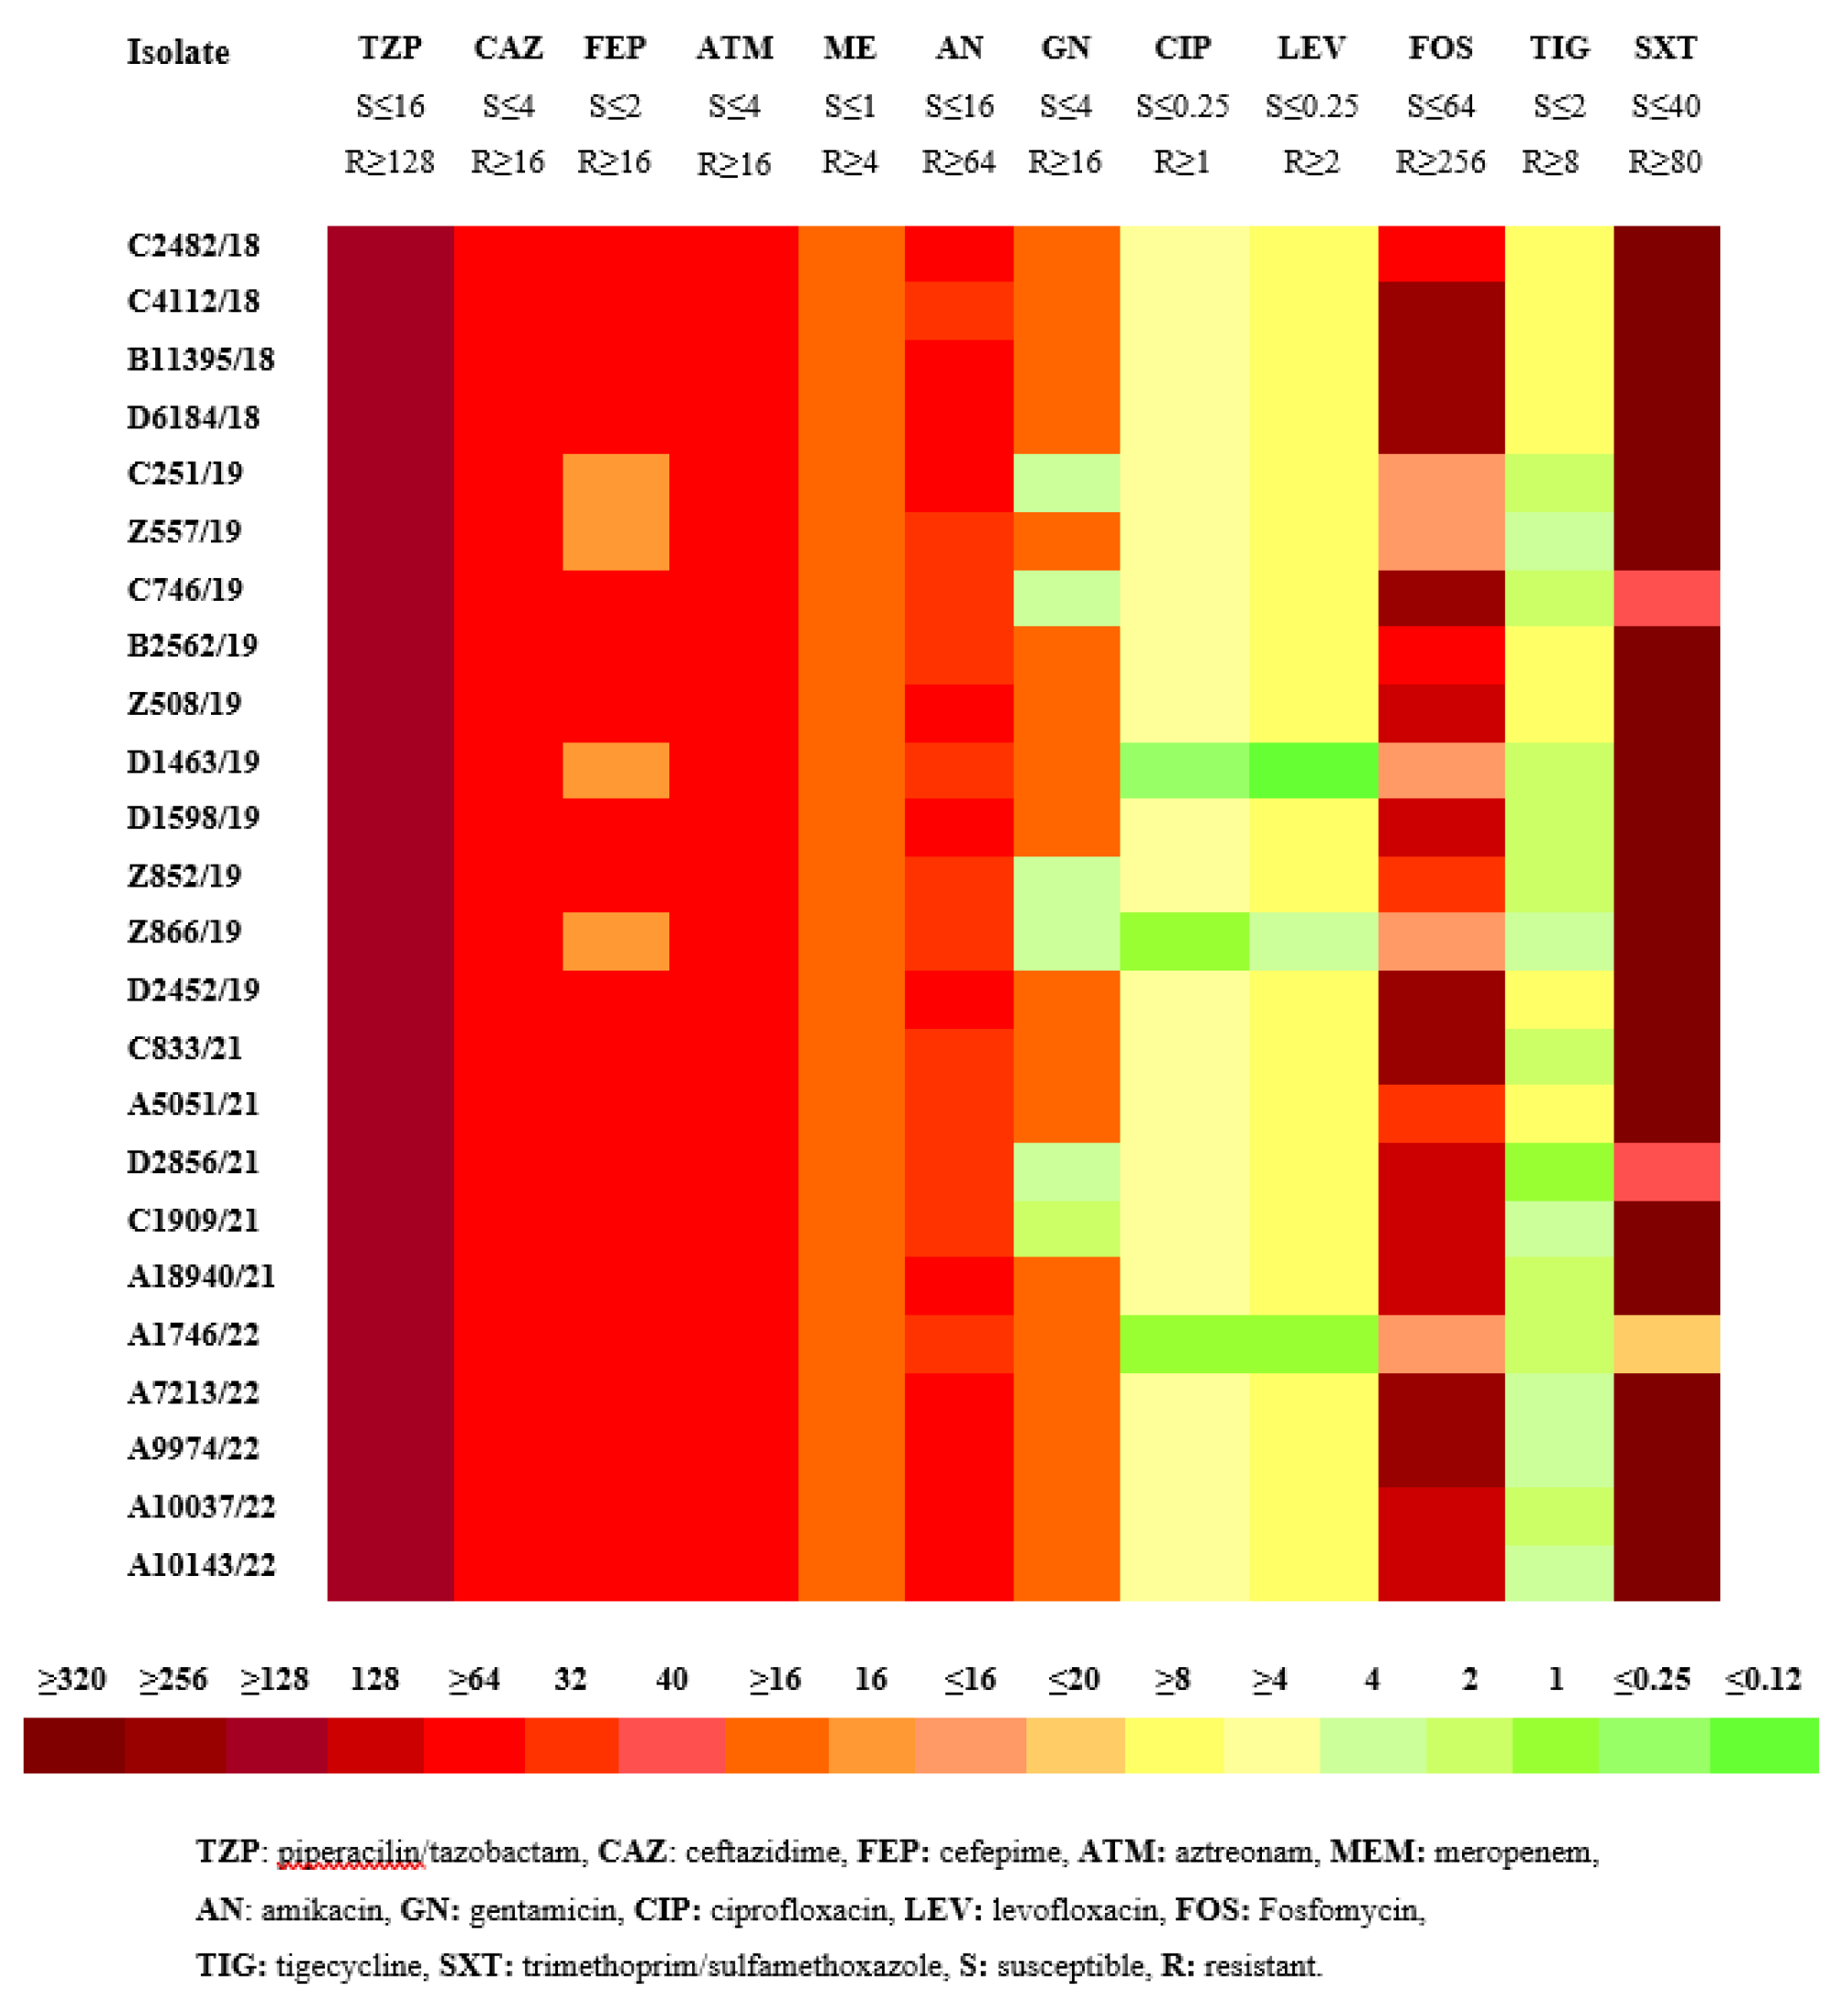
3.1. Antimicrobial susceptibility testing
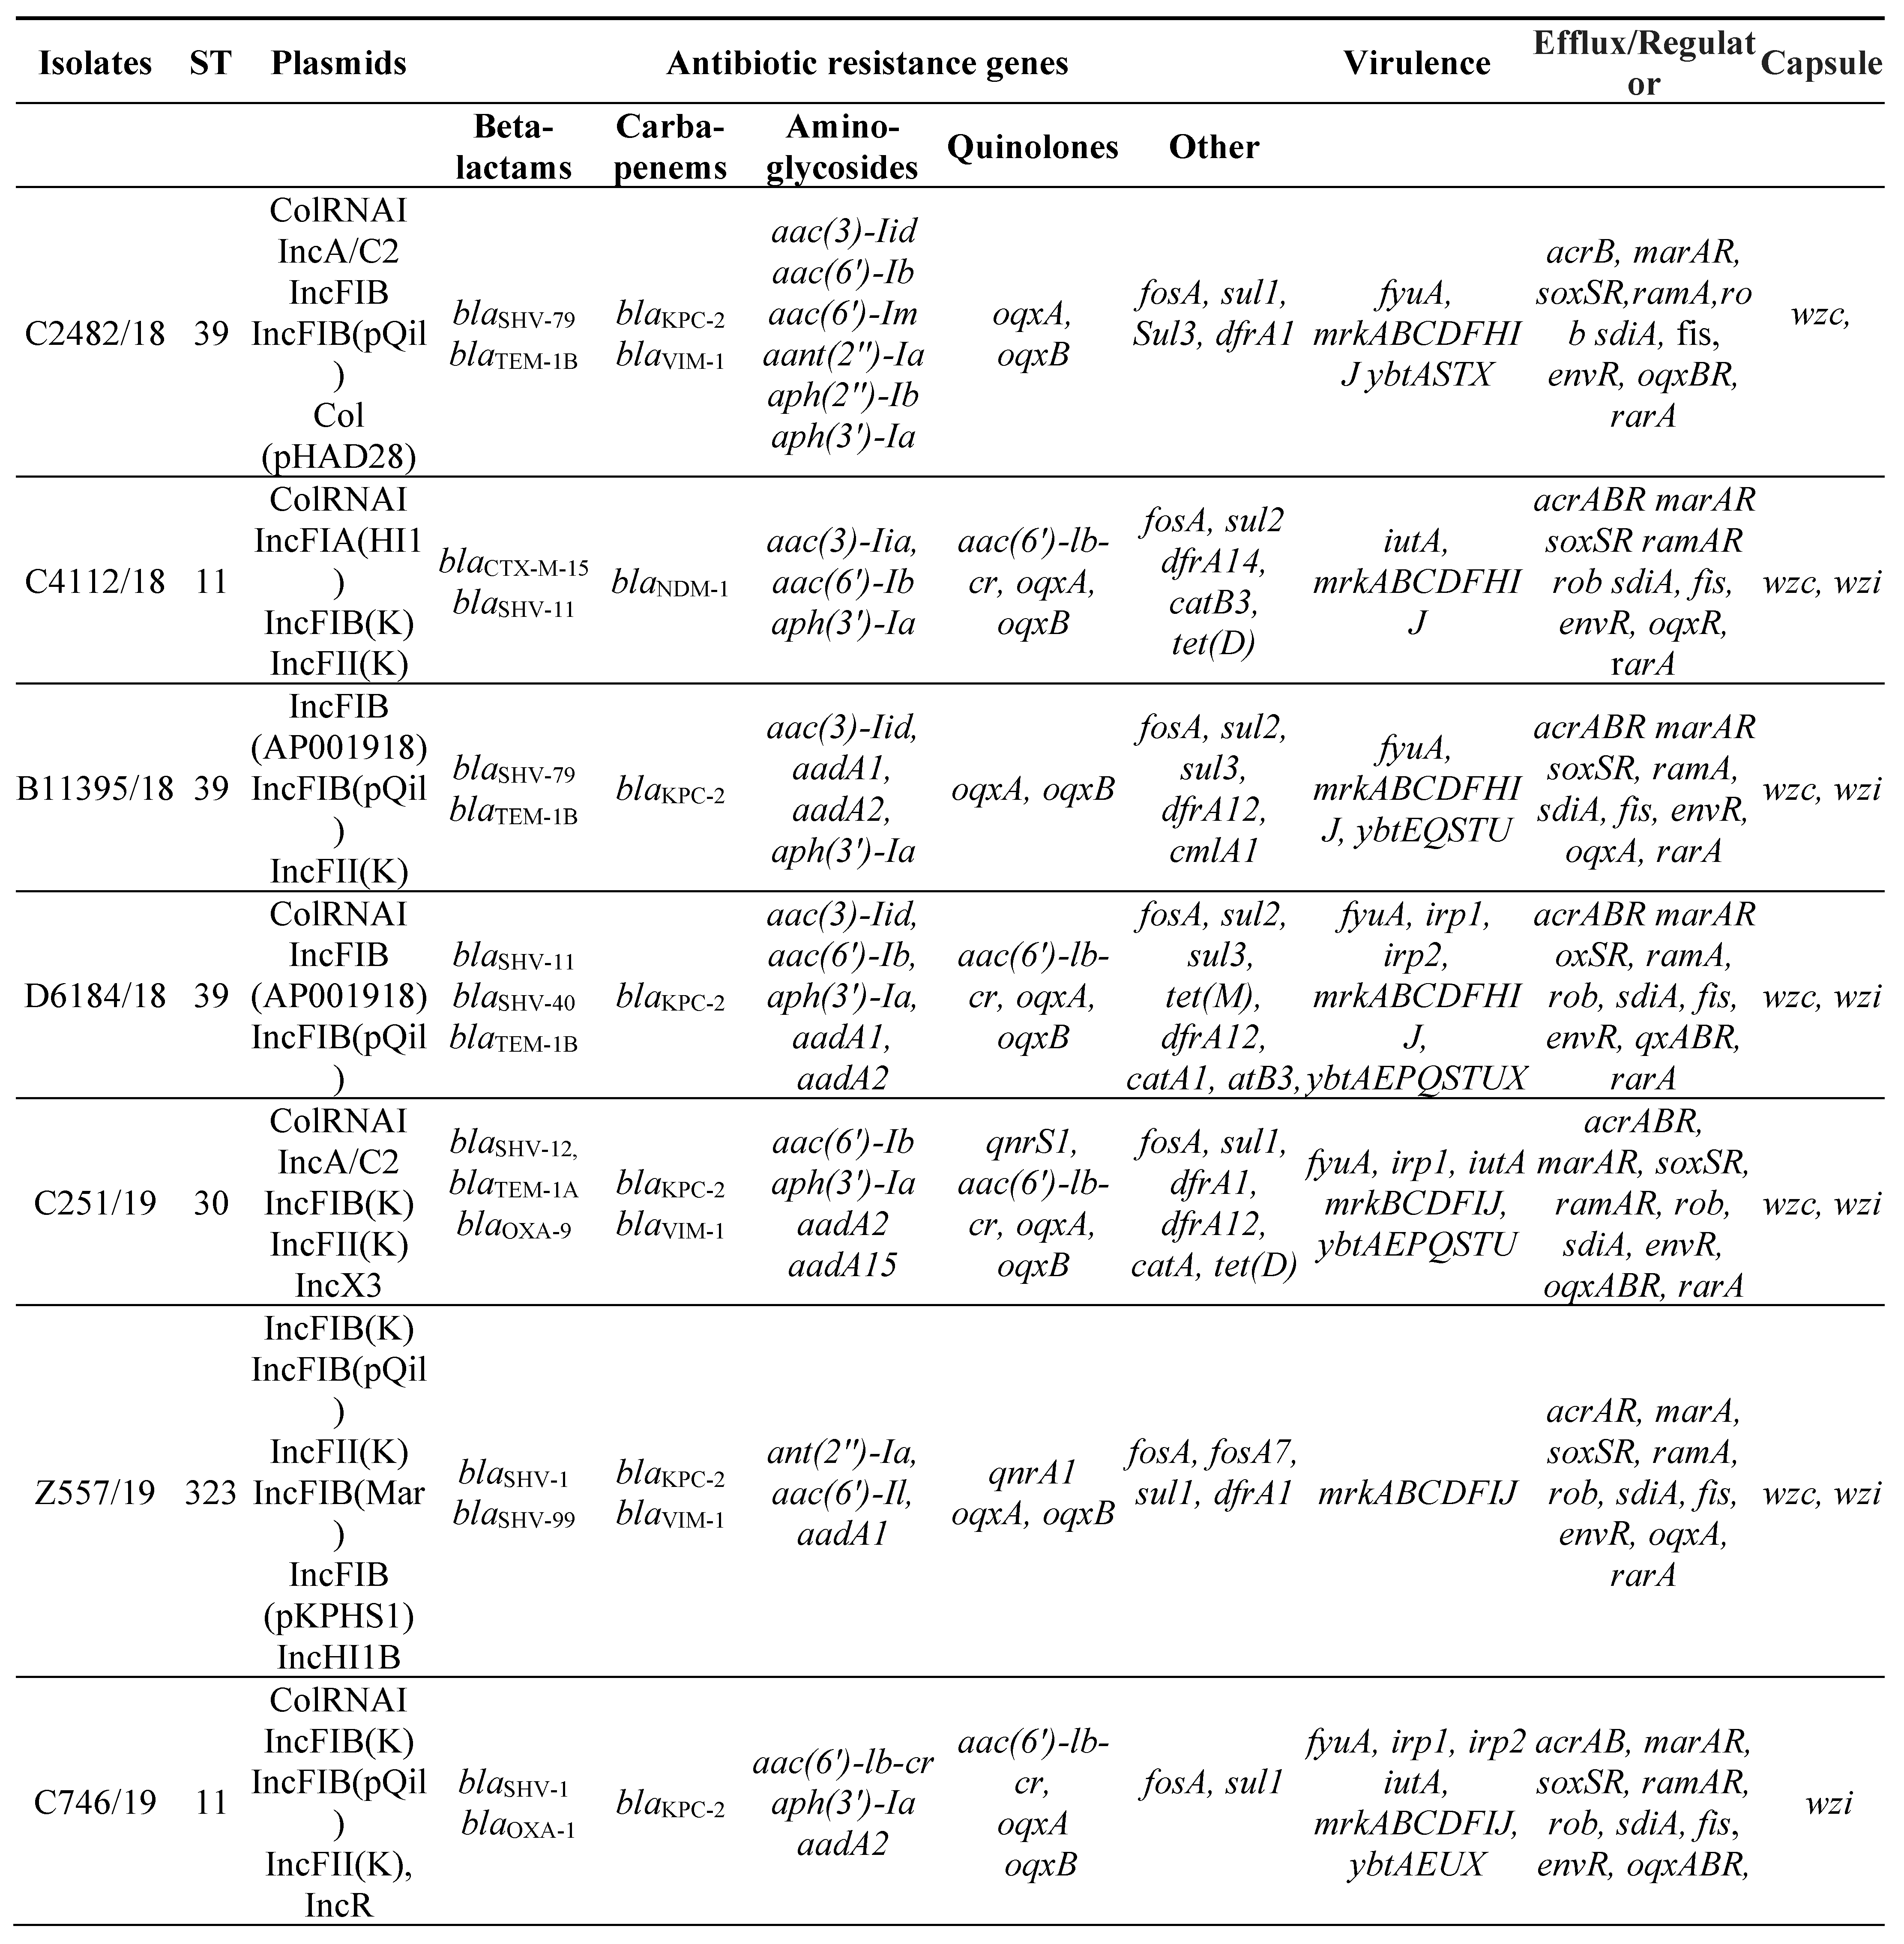
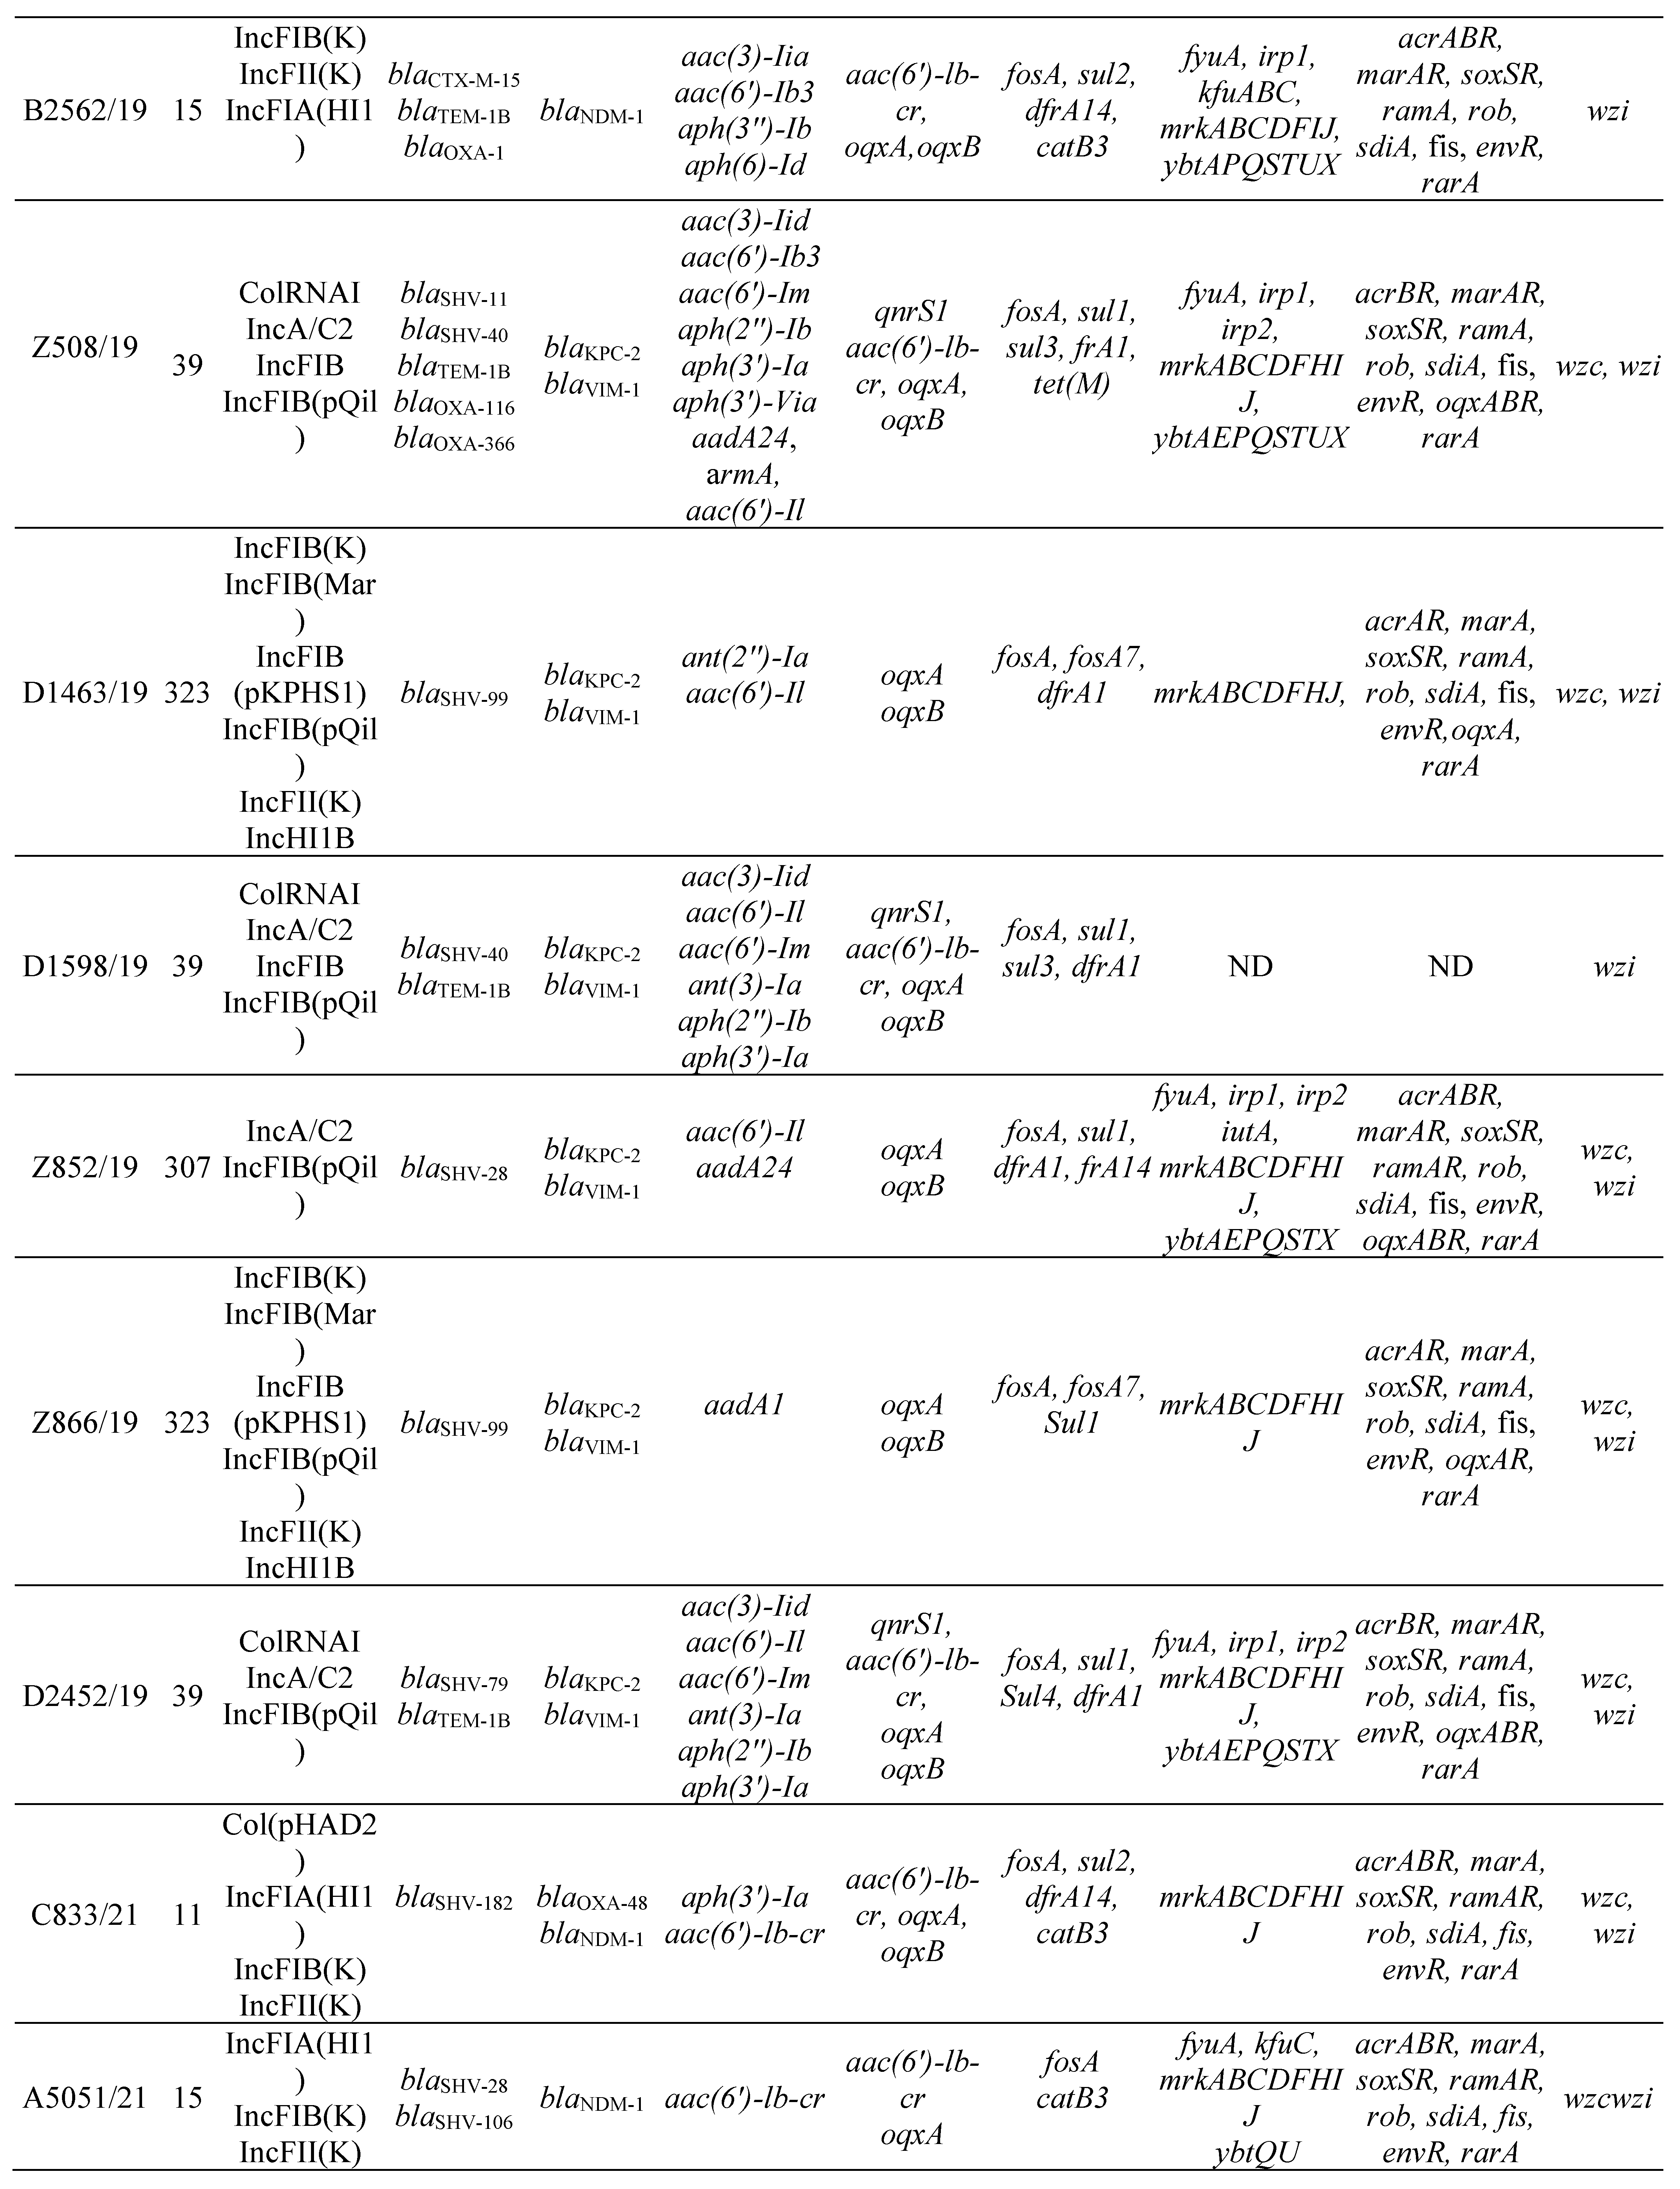
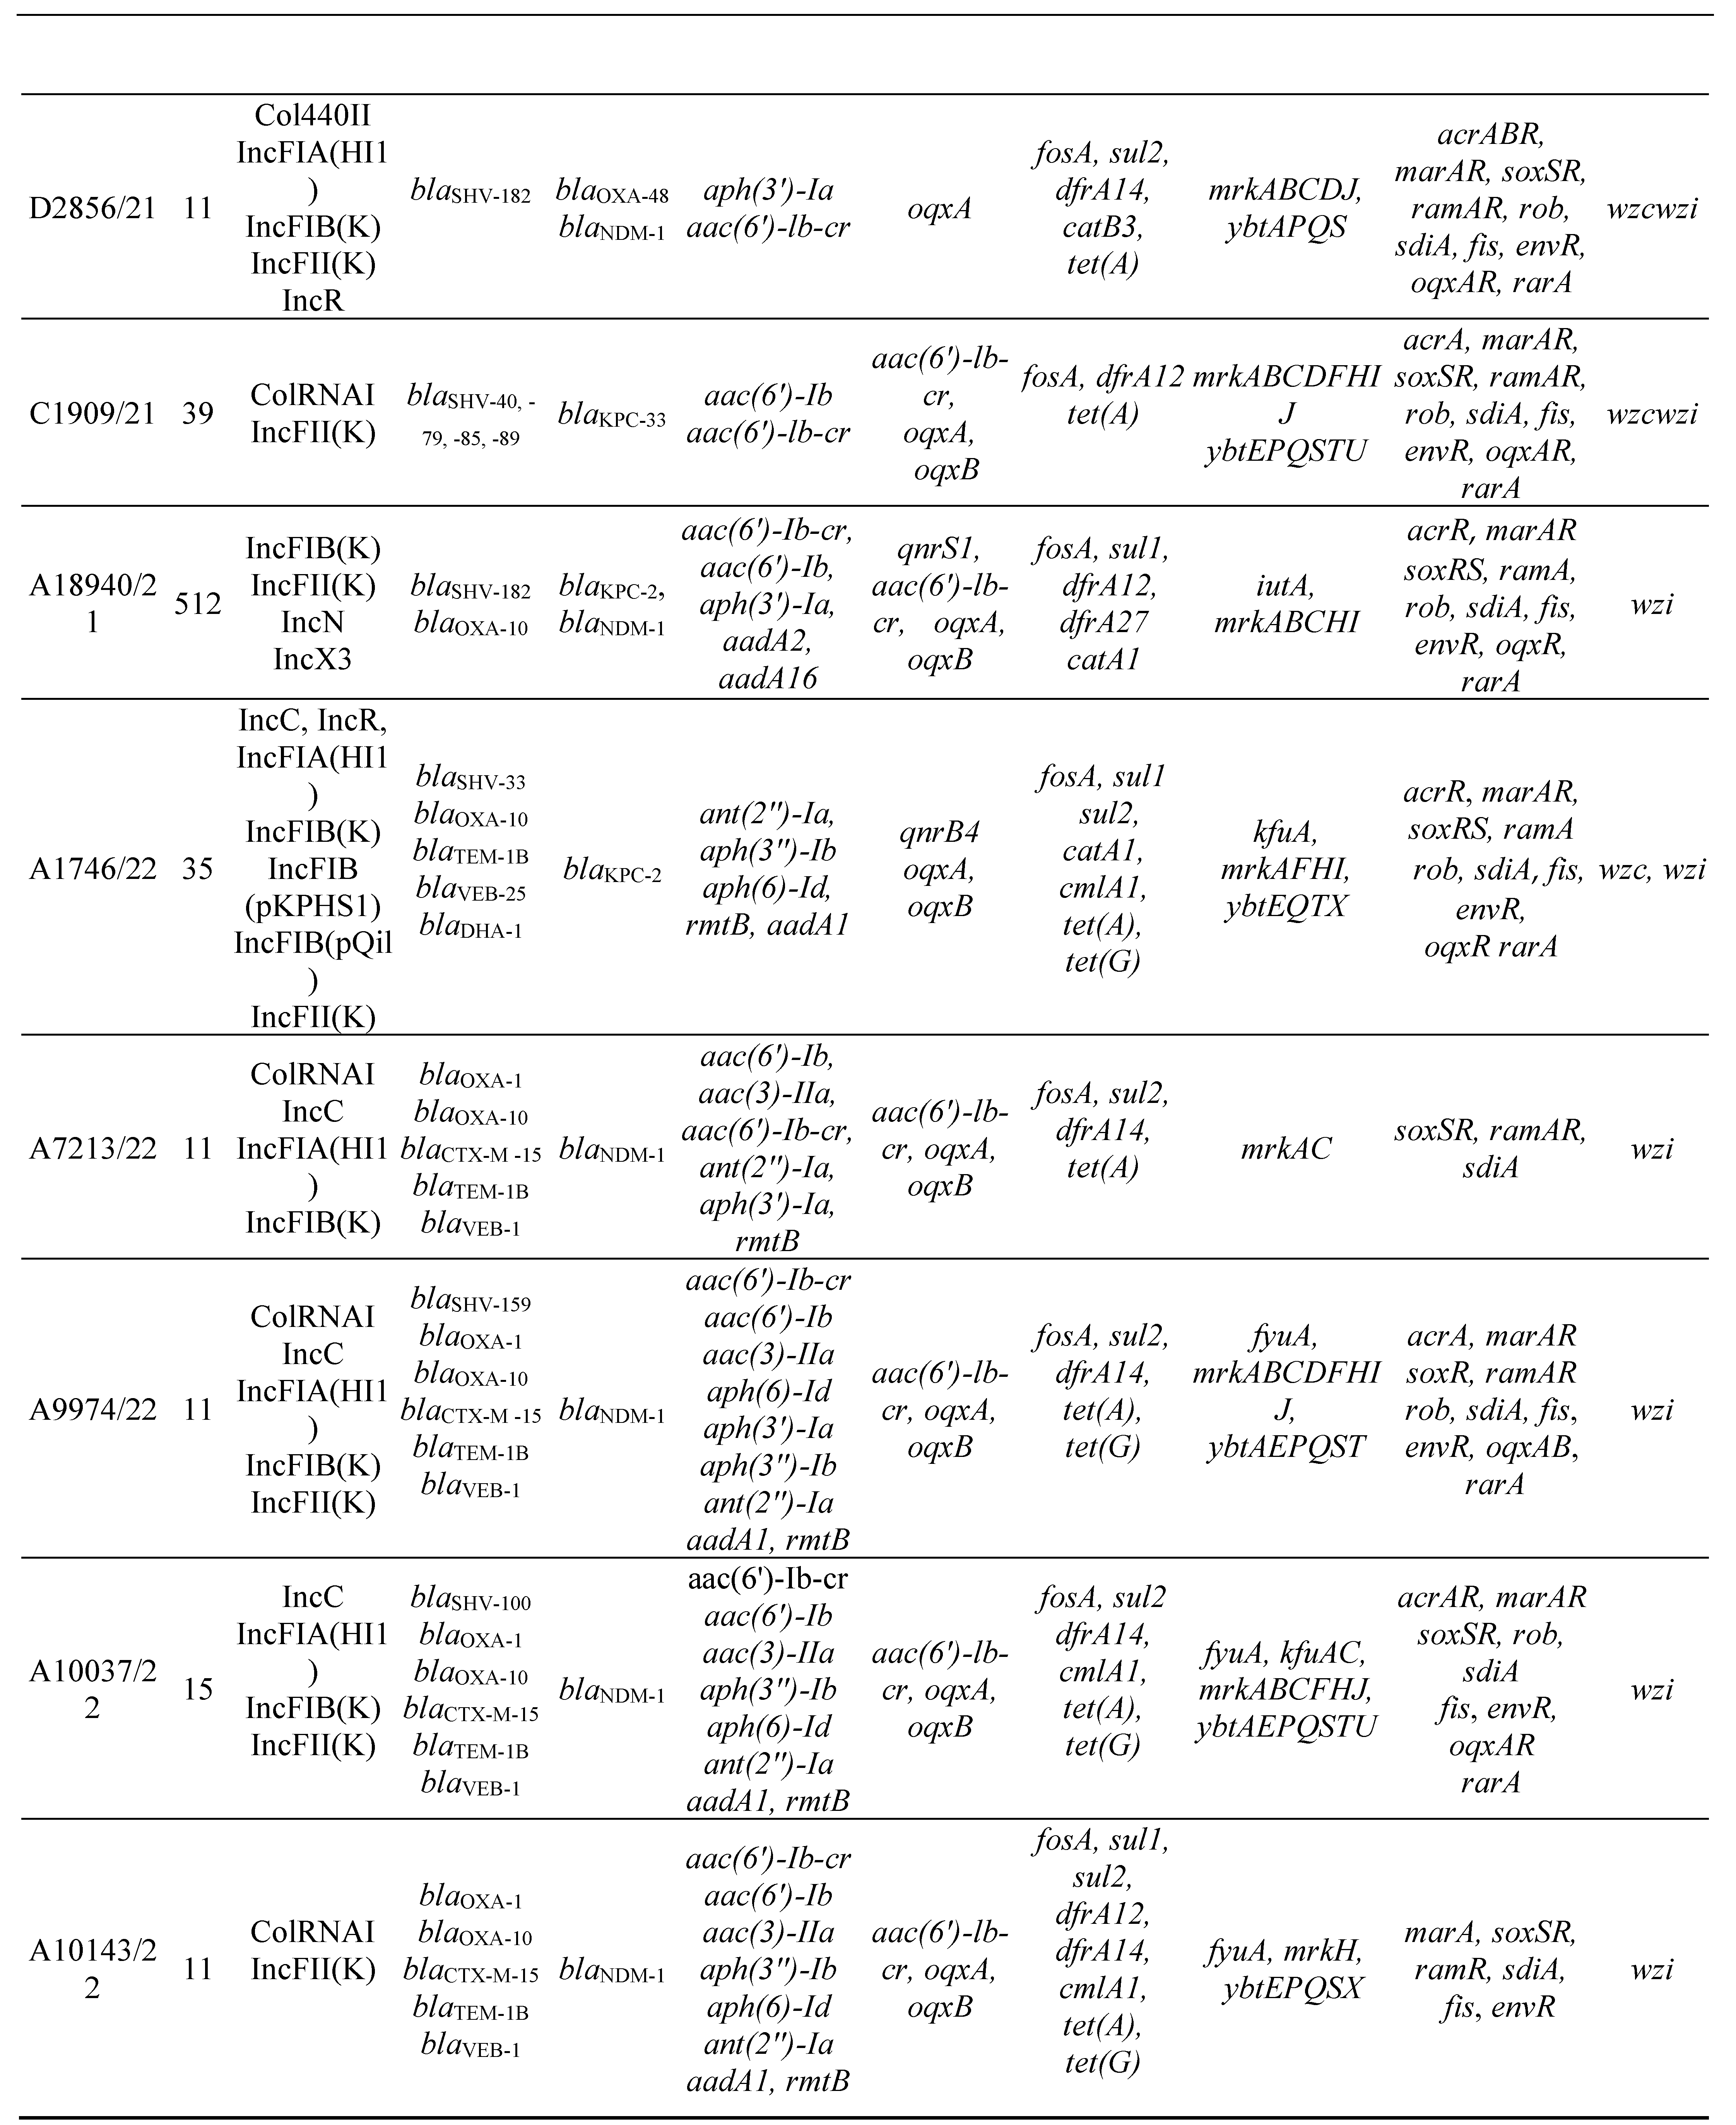
3.2. MLST, antimicrobial resistance genes, plasmids
3.3. Virulence factors and Efflux and Regulator Systems
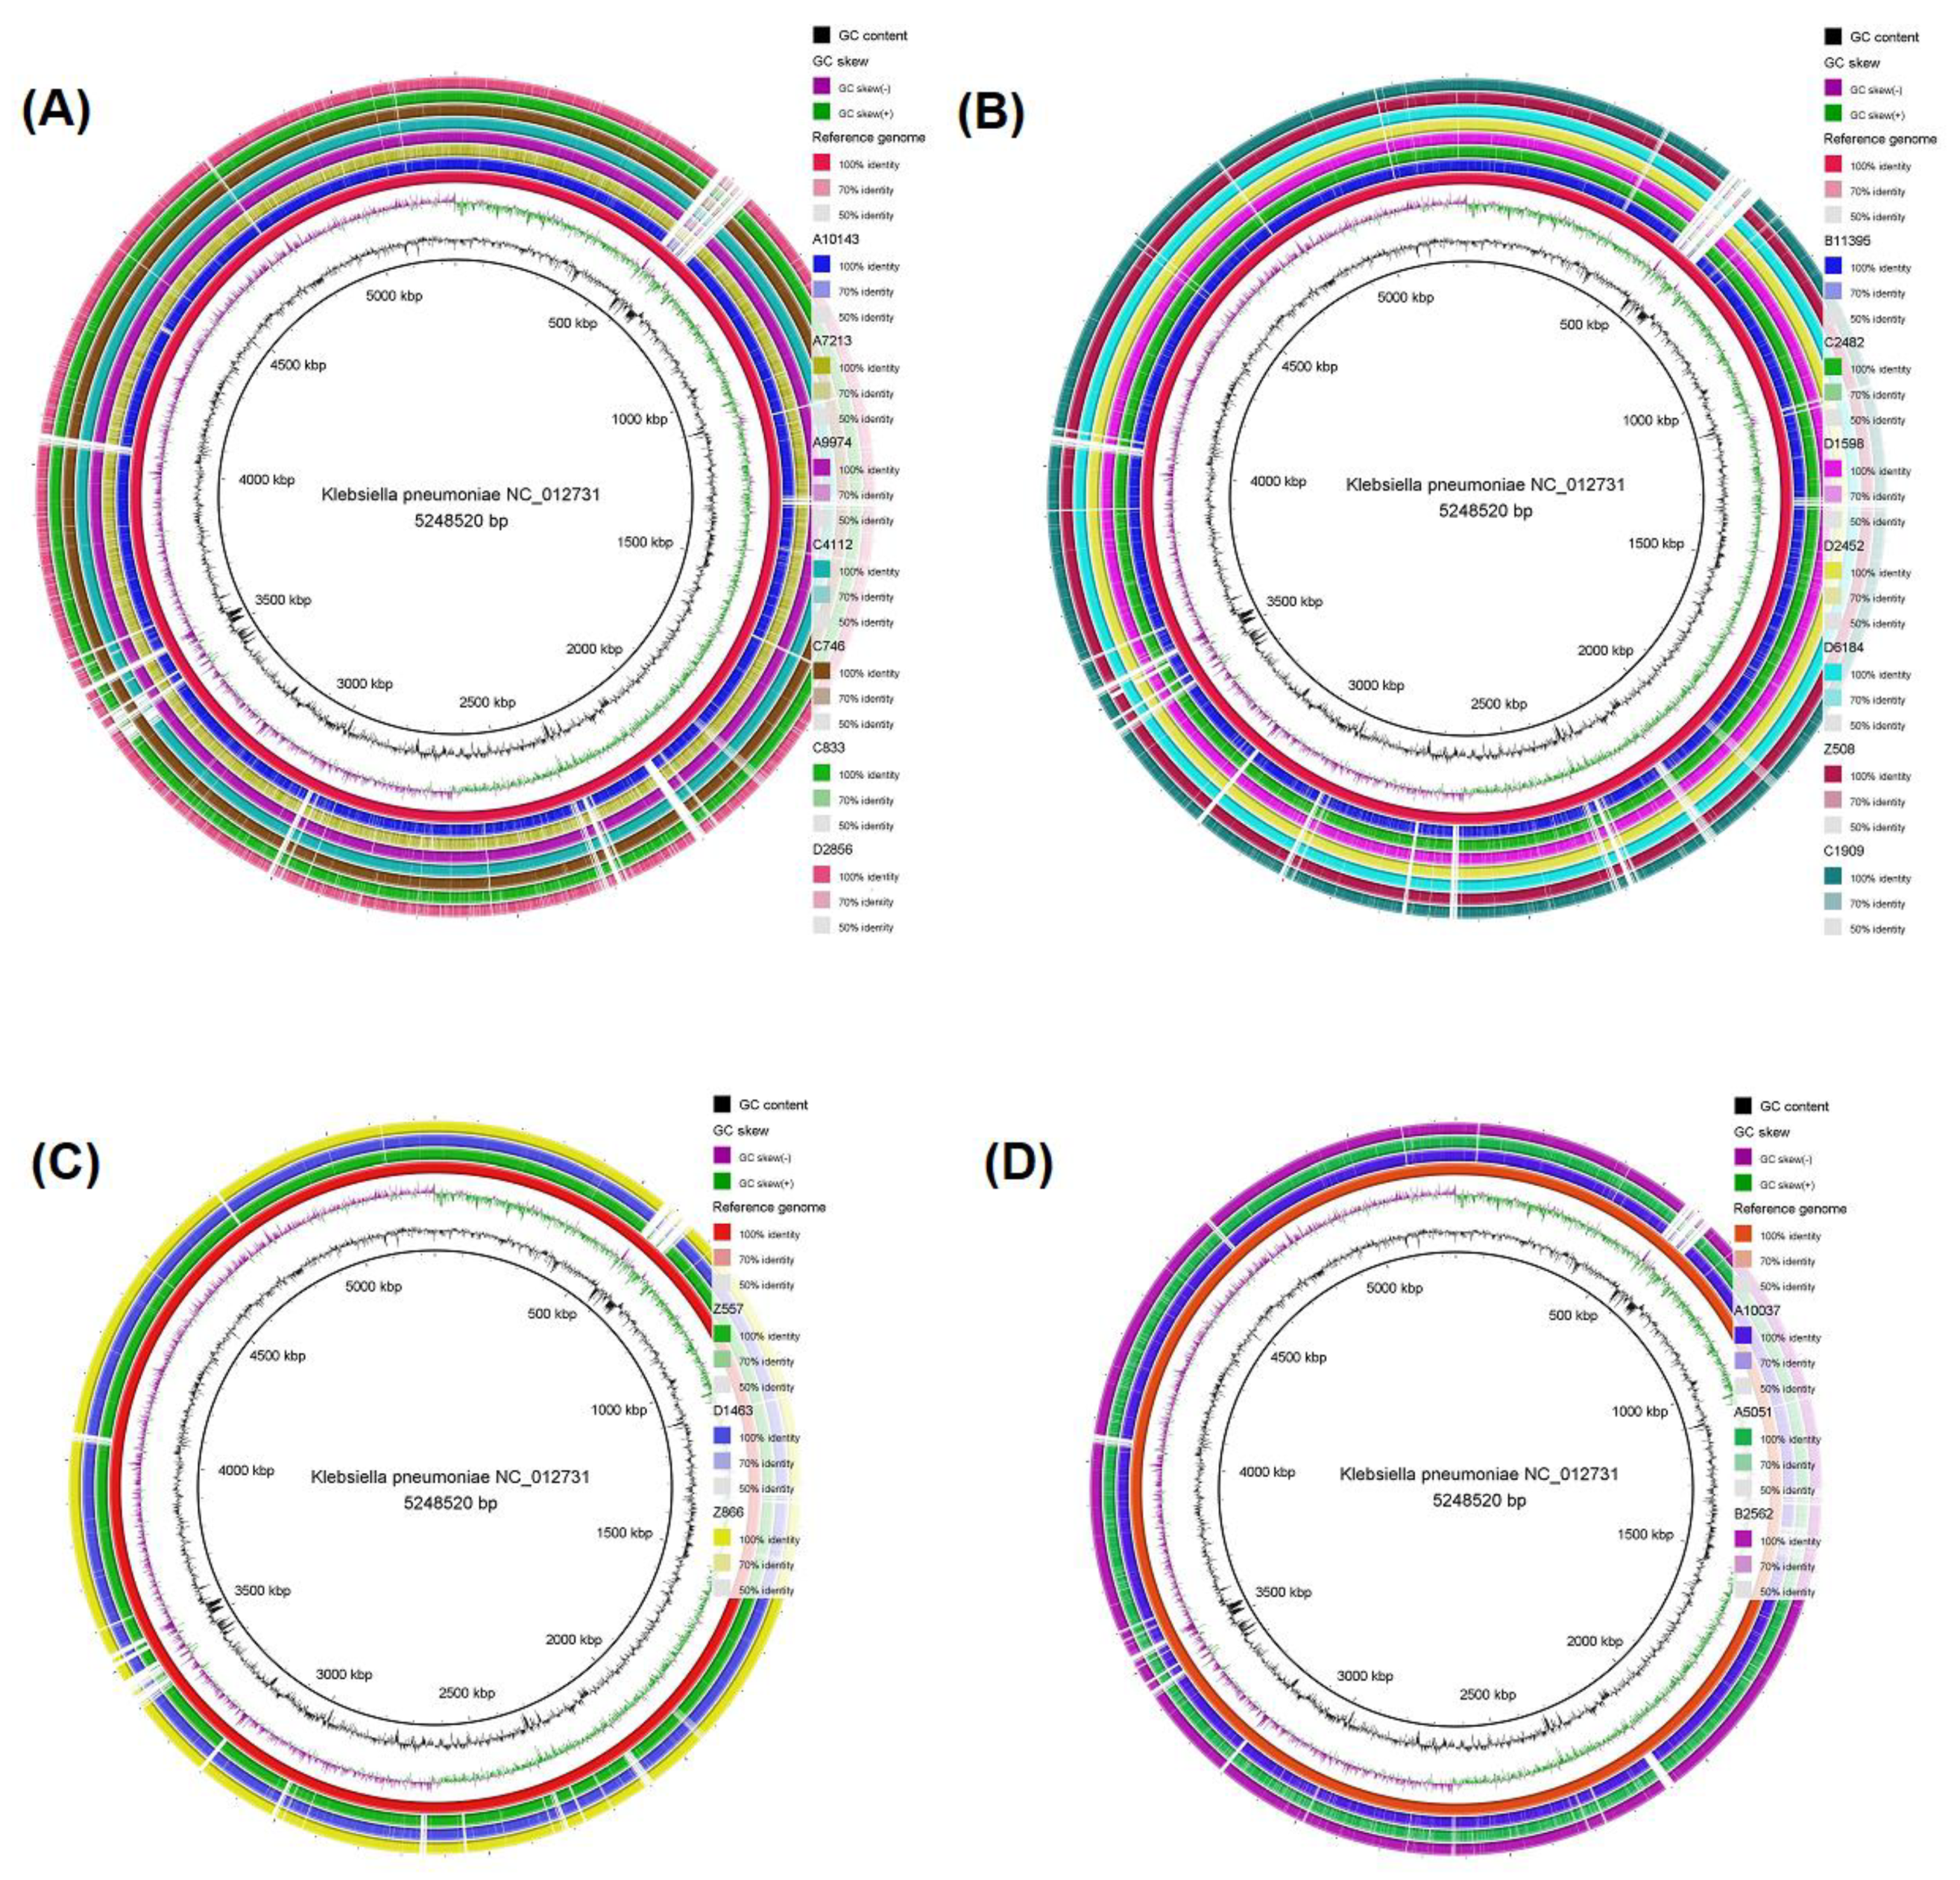
3.4. Genomic comparison among CRKP strains
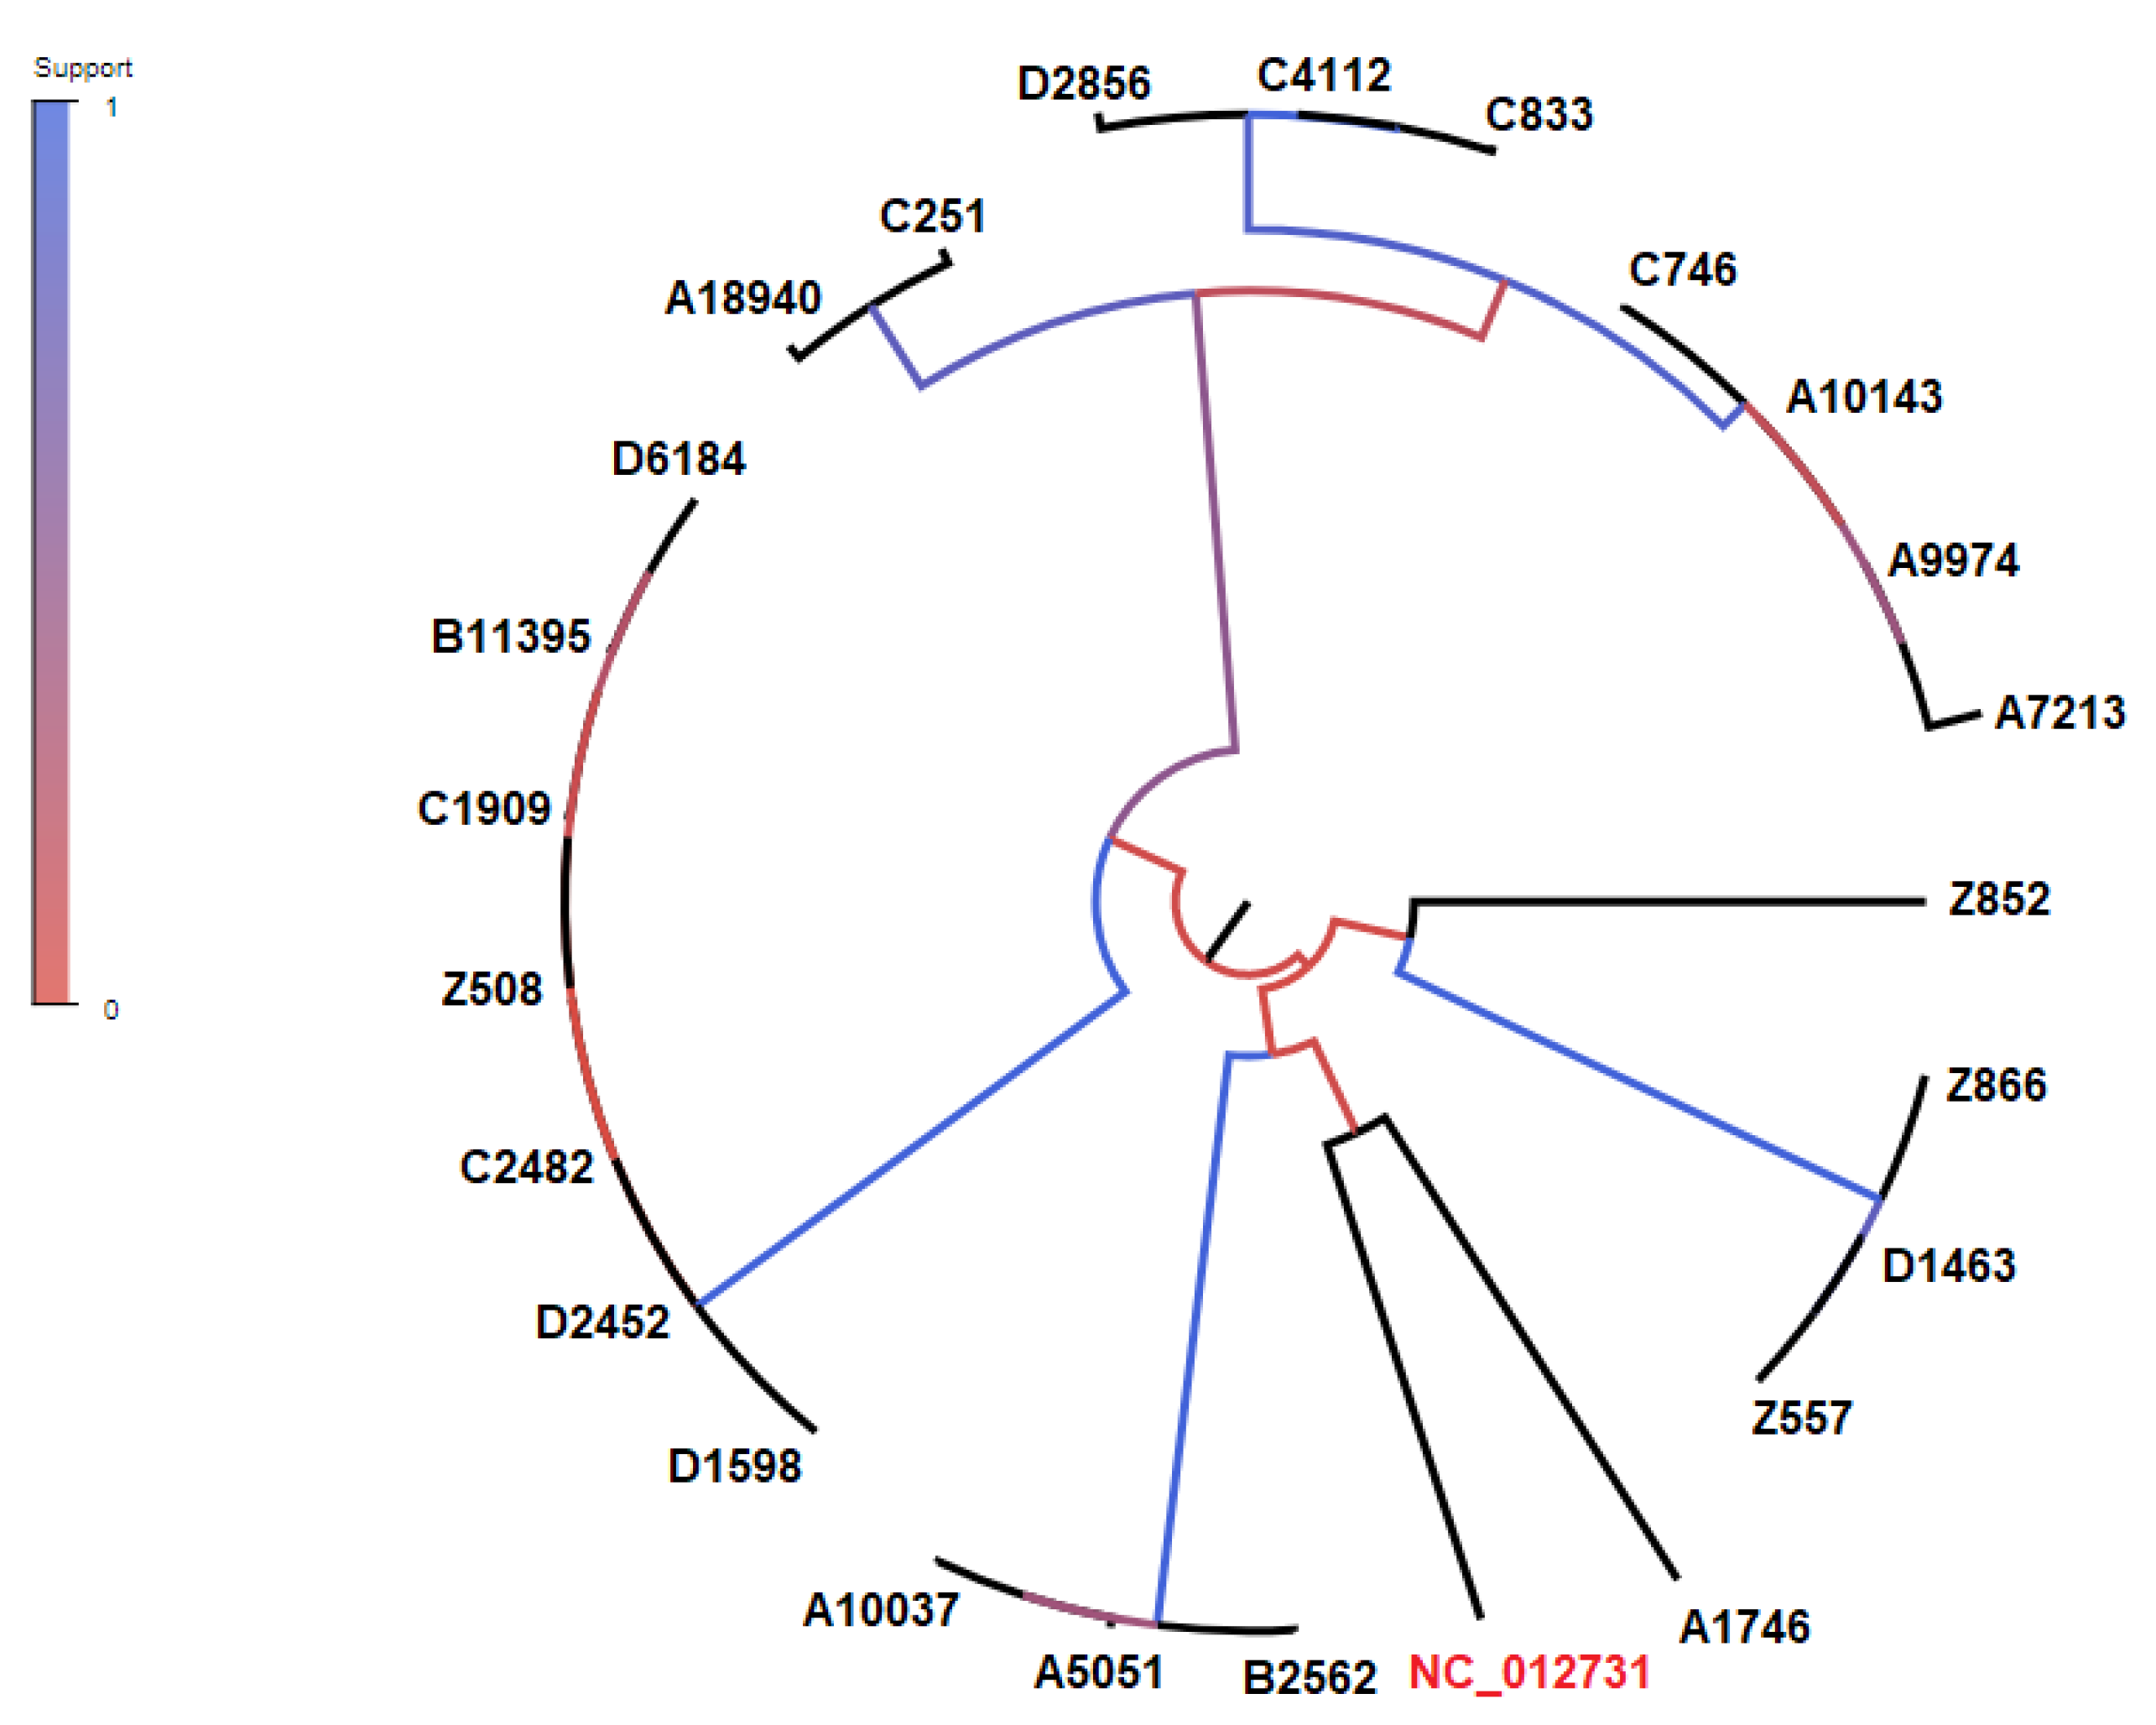
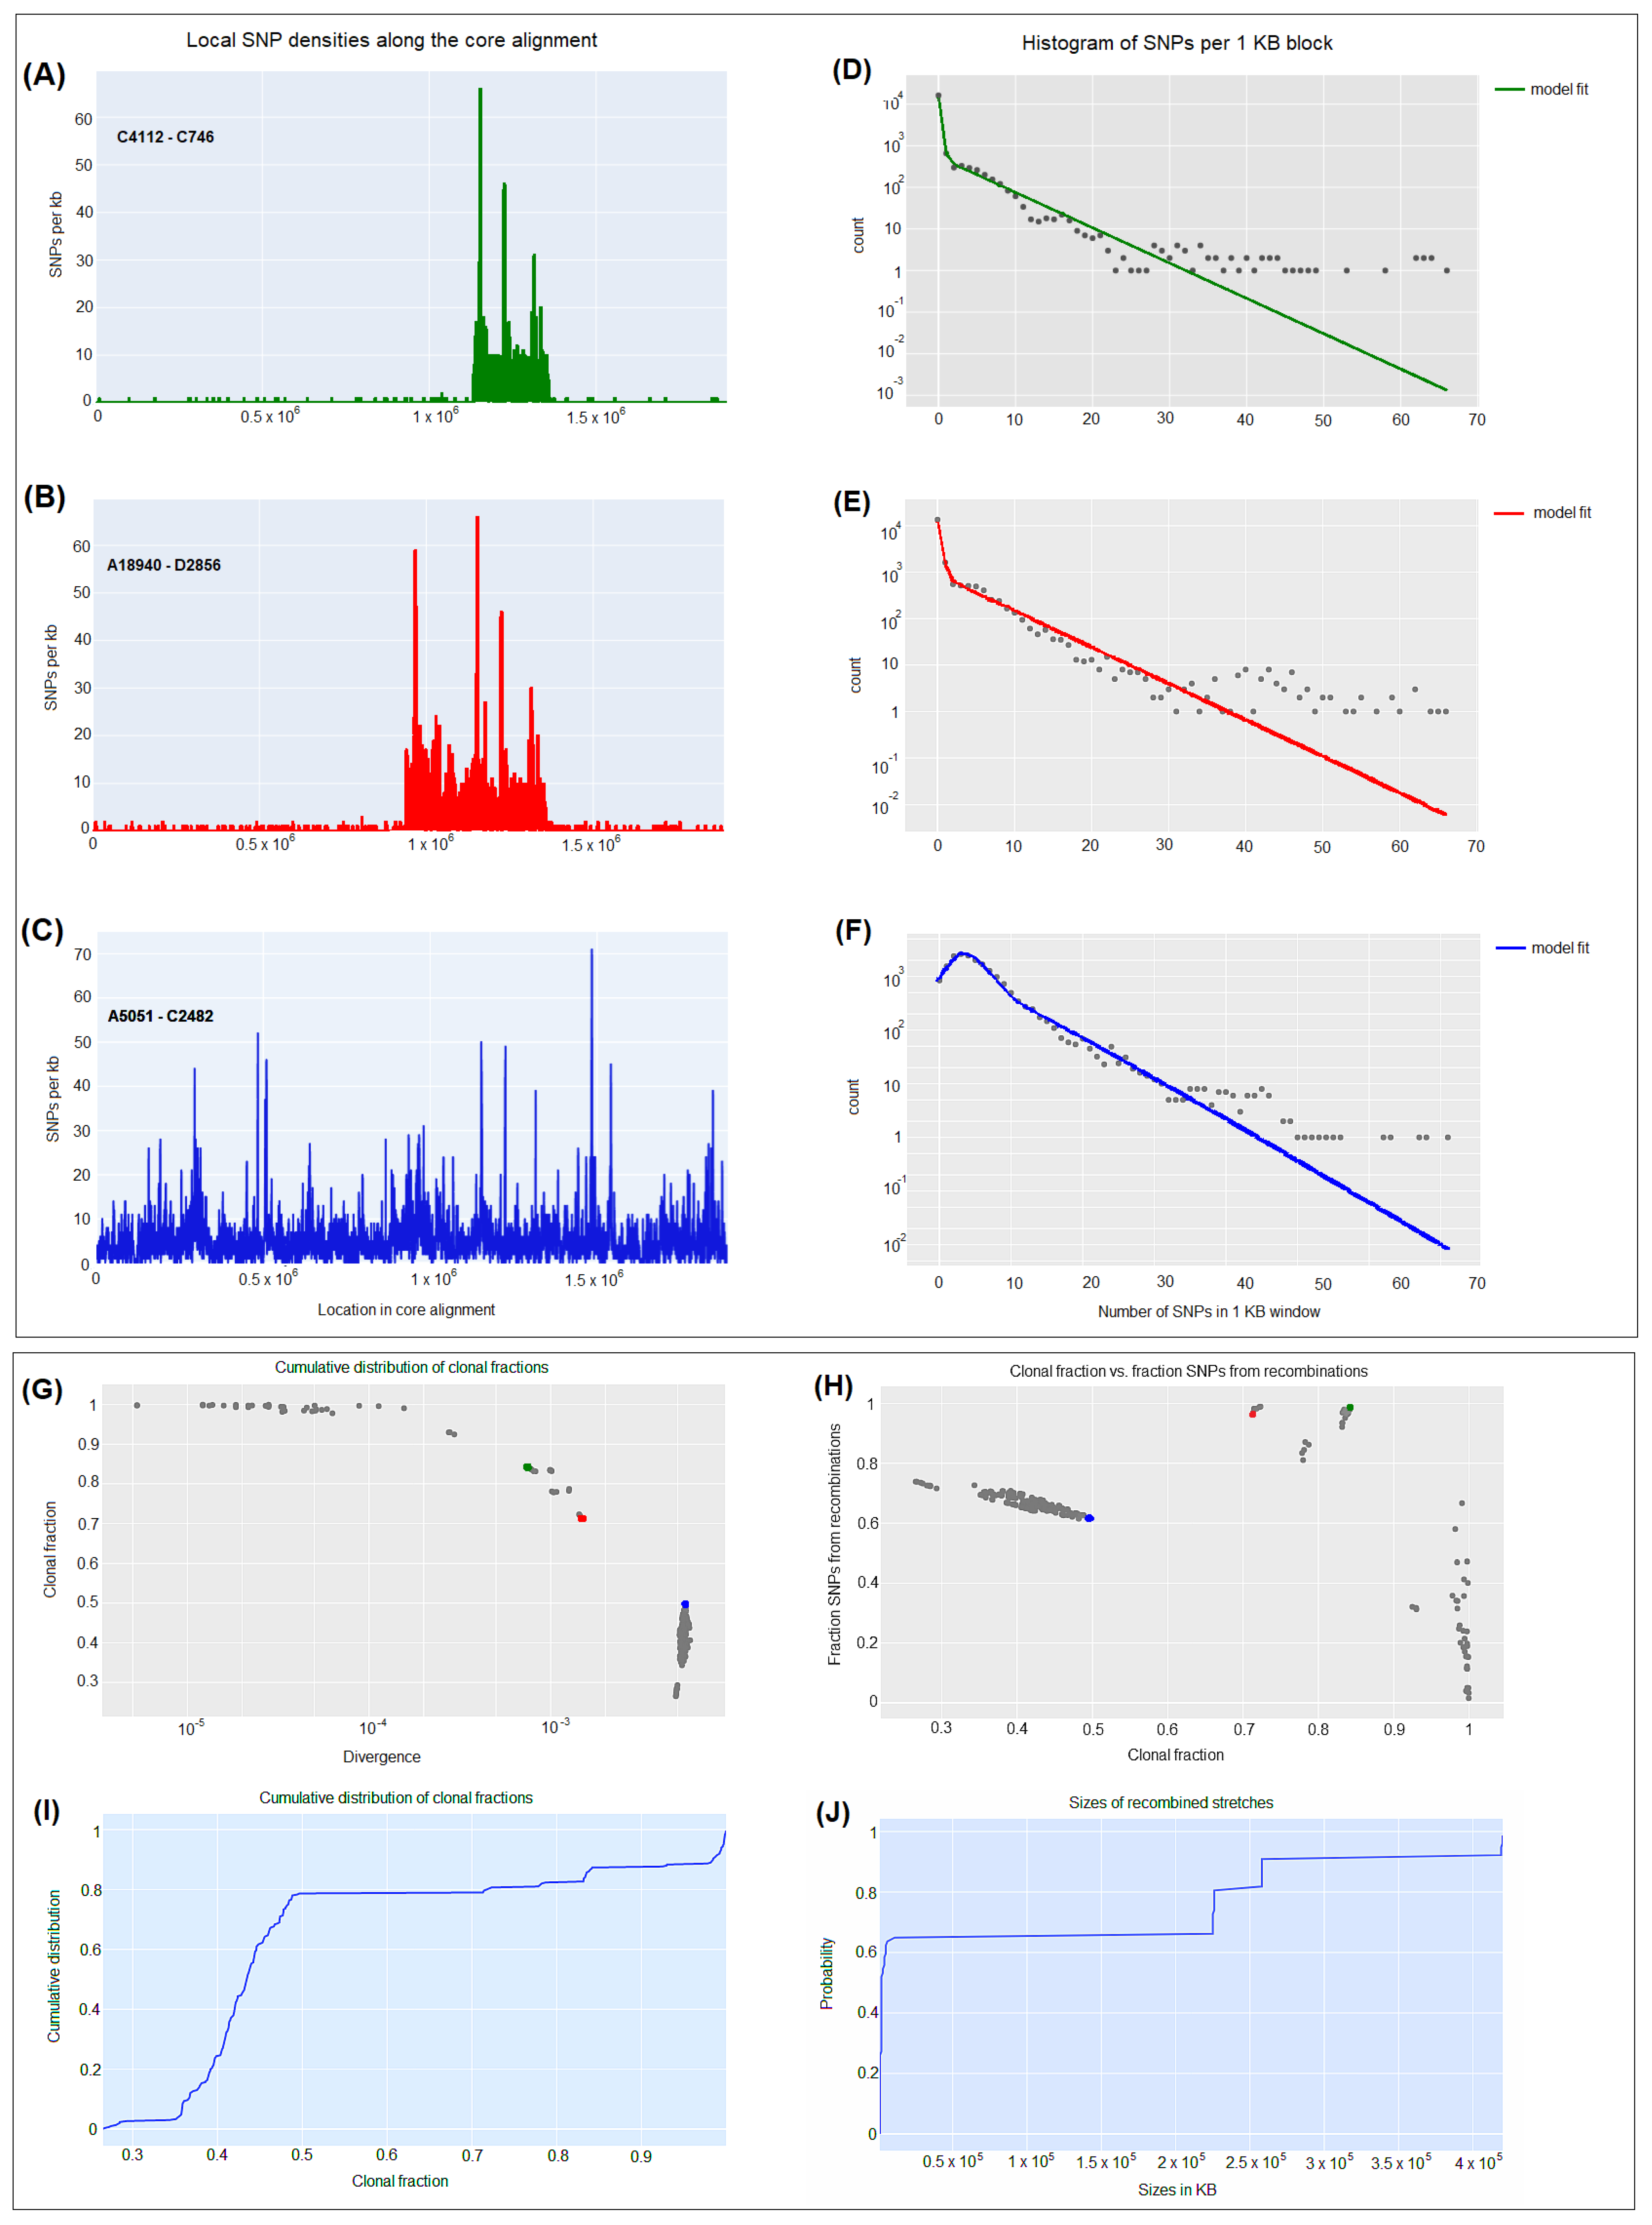
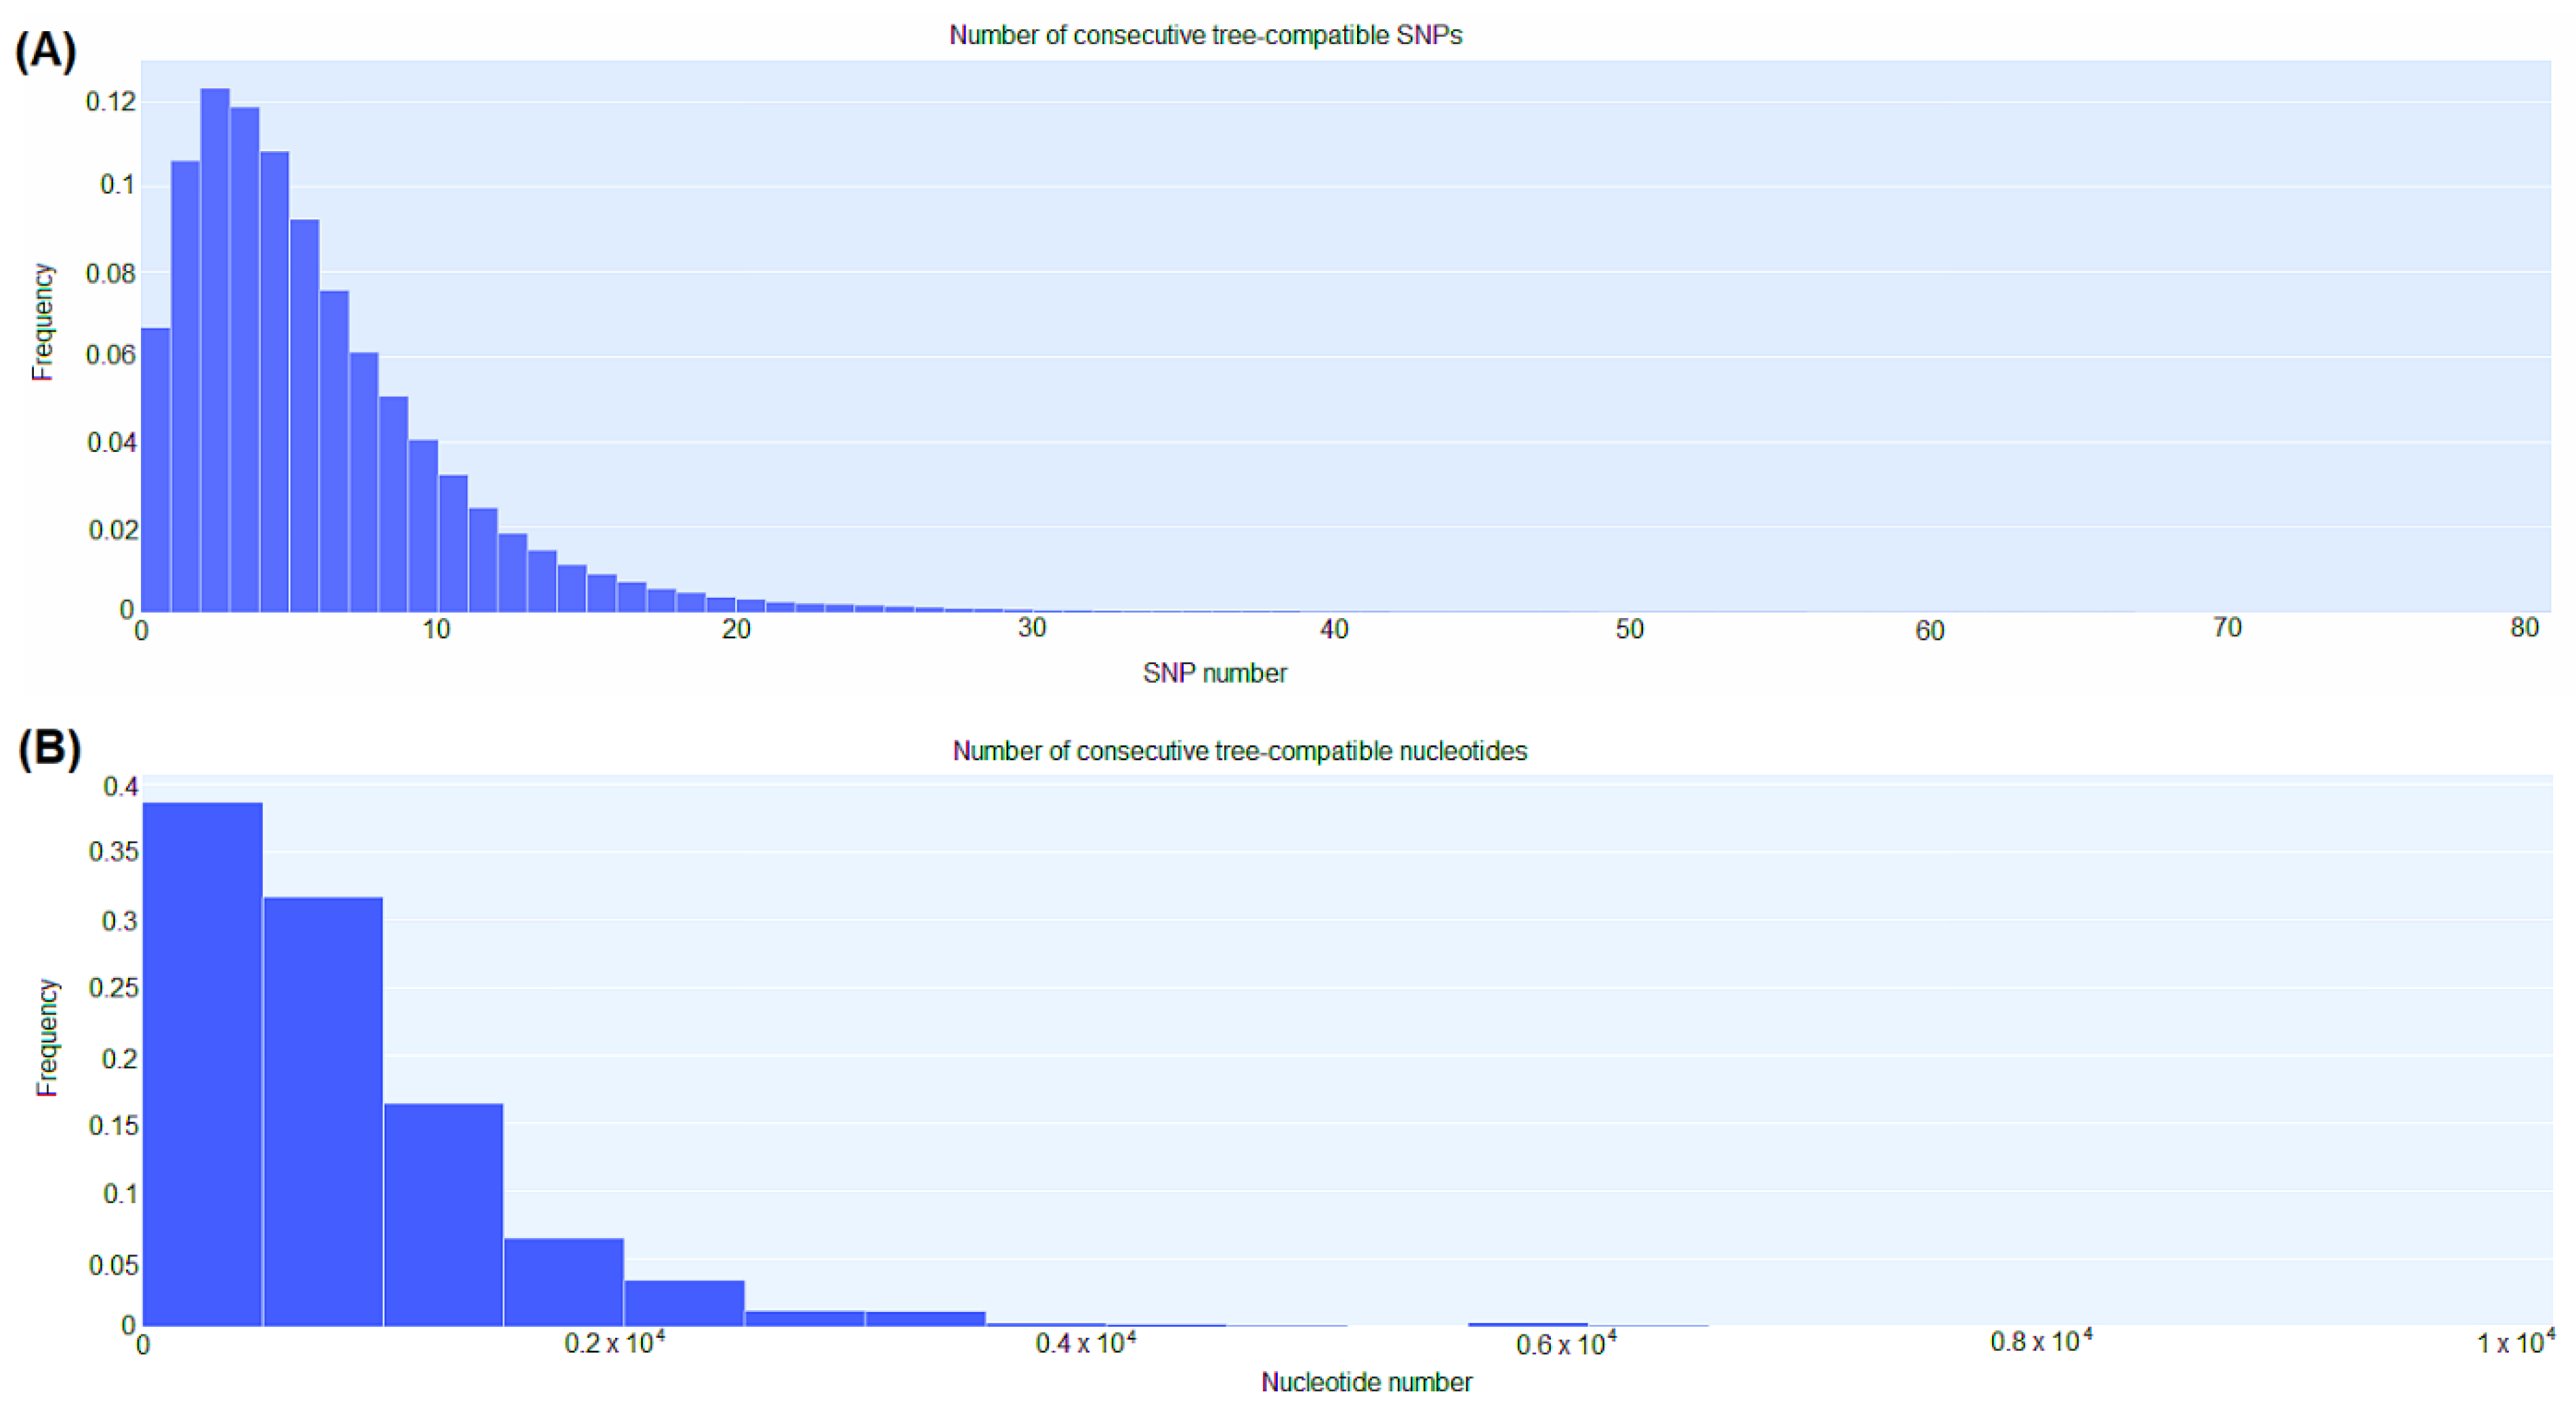
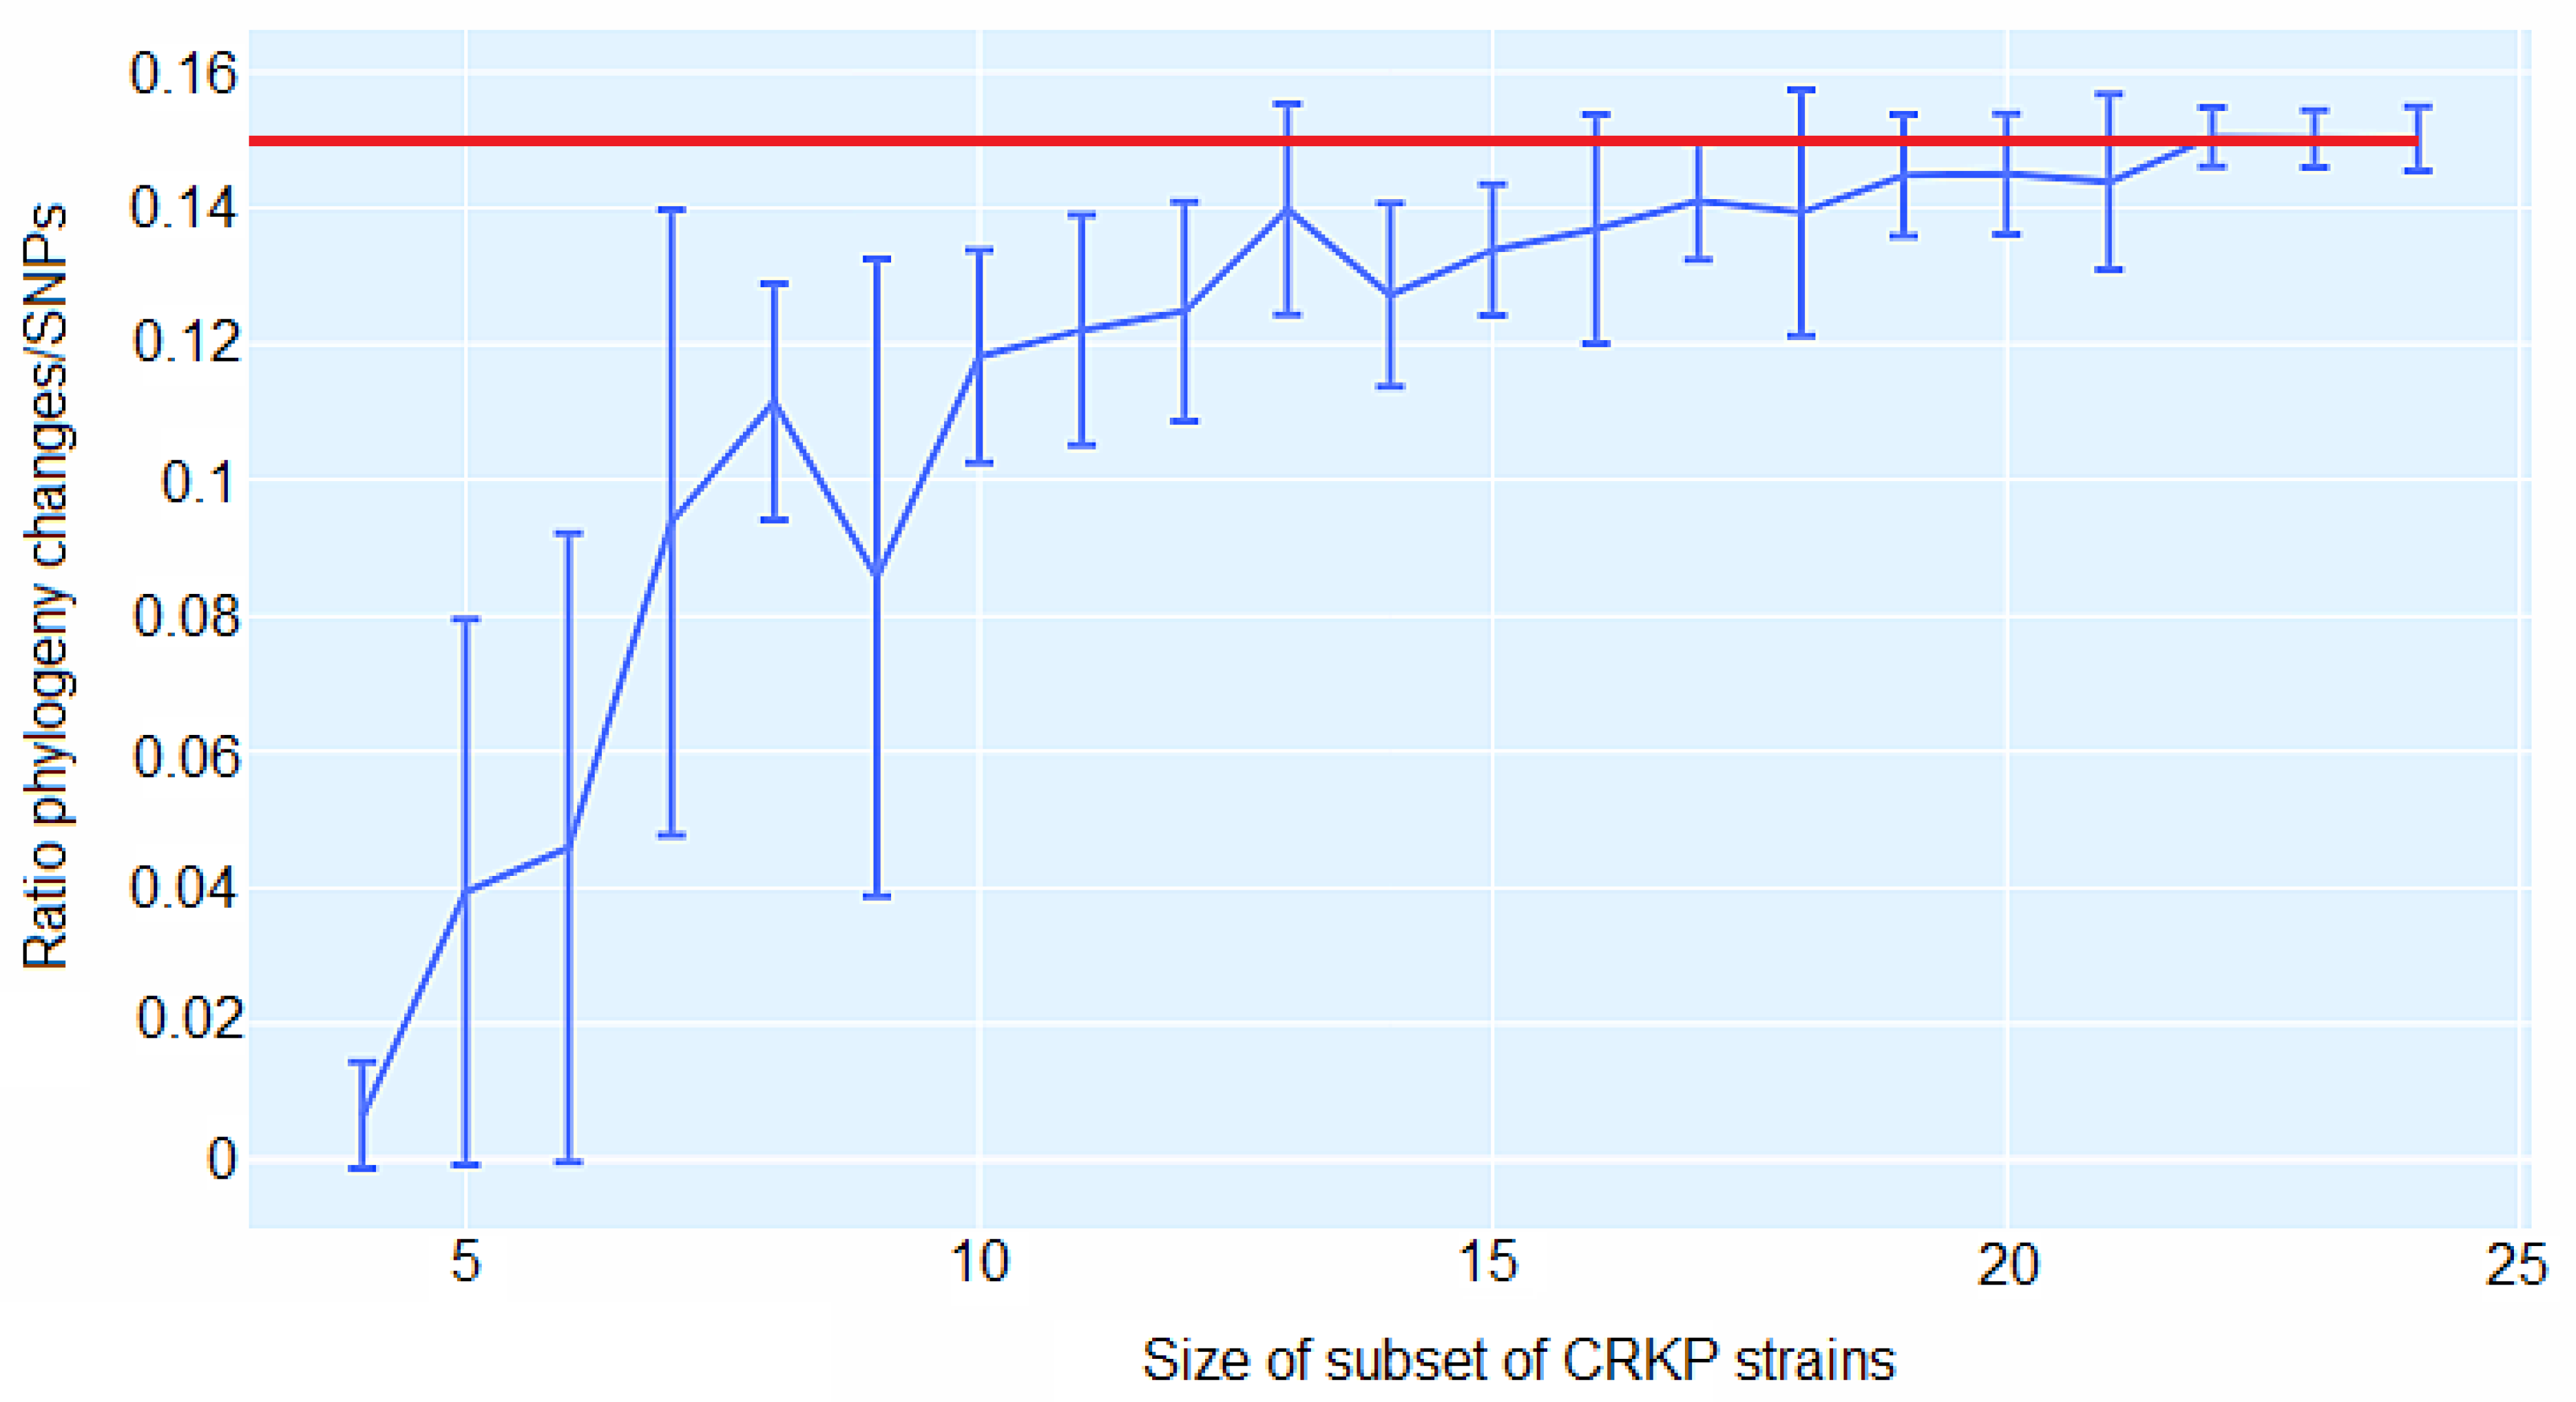
3.5. CgSNP-based phylogenetic analysis
4. Discussion
Author Contributions
Funding
Institutional Review Board Statement
Data Availability Statement
Acknowledgments
Conflicts of Interest
References
- Juan CH, Fang SY, Chou CH, Tsai TY, Lin YT. Clinical characteristics of patients with pneumonia caused by Klebsiella pneumoniae in Taiwan and prevalence of antimicrobial-resistant and hypervirulent strains: a retrospective study. Antimicrob Resist Infect Control 2020; 9: 4.
- Martin RM, Bachman MA. Colonization, Infection, and the Accessory Genome of Klebsiella pneumoniae. Front Cell Infect Microbiol 2018; 8: 4.
- Shao C, Wang W, Liu S, Zhang Z, Jiang M, Zhang F. Molecular Epidemiology and Drug Resistant Mechanism of Carbapenem-Resistant Klebsiella pneumoniae in Elderly Patients With Lower Respiratory Tract Infection. Front Public Health 2021; 9: 669173.
- Gupta A, Bhatti S, Leytin A, Epelbaum O. Novel complication of an emerging disease: Invasive Klebsiella pneumoniae liver abscess syndrome as a cause of acute respiratory distress syndrome. Clin Pract 2018; 8: 1021.
- Ferri M, Ranucci E, Romagnoli P, Giaccone V. Antimicrobial resistance: A global emerging threat to public health systems. Crit Rev Food Sci Nutr 2017; 57: 2857-2876.
- Nelson K, Hemarajata P, Sun D, Rubio-Aparicio D, Tsivkovski R, Yang S et al. Resistance to Ceftazidime-Avibactam Is Due to Transposition of KPC in a Porin-Deficient Strain of Klebsiella pneumoniae with Increased Efflux Activity. Antimicrob Agents Chemother 2017; 61.
- Wang B, Pan F, Wang C, Zhao W, Sun Y, Zhang T et al. Molecular epidemiology of Carbapenem-resistant Klebsiella pneumoniae in a paediatric hospital in China. Int J Infect Dis 2020; 93: 311-319.
- Galani I, Karaiskos I, Angelidis E, Papoutsaki V, Galani L, Souli M et al. Emergence of ceftazidime-avibactam resistance through distinct genomic adaptations in KPC-2-producing Klebsiella pneumoniae of sequence type 39 during treatment. Eur J Clin Microbiol Infect Dis 2021; 40: 219-224.
- Galani I, Nafplioti K, Adamou P, Karaiskos I, Giamarellou H, Souli M et al. Nationwide epidemiology of carbapenem resistant Klebsiella pneumoniae isolates from Greek hospitals, with regards to plazomicin and aminoglycoside resistance. BMC Infect Dis 2019; 19: 167.
- Karampatakis T, Tsergouli K, Politi L, Diamantopoulou G, Iosifidis E, Antachopoulos C et al. Molecular Epidemiology of Endemic Carbapenem-Resistant Gram-Negative Bacteria in an Intensive Care Unit. Microb Drug Resist 2019; 25: 712-716.
- Zarras C, Pappa S, Zarras K, Karampatakis T, Vagdatli E, Mouloudi E et al. Changes in molecular epidemiology of carbapenem-resistant Klebsiella pneumoniae in the intensive care units of a Greek hospital, 2018-2021. Acta Microbiol Immunol Hung 2022.
- Karampatakis T, Antachopoulos C, Iosifidis E, Tsakris A, Roilides E. Molecular epidemiology of carbapenem-resistant Klebsiella pneumoniae in Greece. Future Microbiol 2016; 11: 809-823.
- Protonotariou E, Meletis G, Pilalas D, Mantzana P, Tychala A, Kotzamanidis C et al. Polyclonal Endemicity of Carbapenemase-Producing Klebsiella pneumoniae in ICUs of a Greek Tertiary Care Hospital. Antibiotics (Basel) 2022; 11.
- Surveillance atlas of infectious diseases.Available from: https://atlas.Ecdc.Europa.Eu/public/index.Aspx. 2020.
- Hatrongjit R, Kerdsin A, Akeda Y, Hamada S. Detection of plasmid-mediated colistin-resistant and carbapenem-resistant genes by multiplex PCR. MethodsX 2018; 5: 532-536.
- Mari-Almirall M, Ferrando N, Fernandez MJ, Cosgaya C, Vines J, Rubio E et al. Clonal Spread and Intra- and Inter-Species Plasmid Dissemination Associated With Klebsiella pneumoniae Carbapenemase-Producing Enterobacterales During a Hospital Outbreak in Barcelona, Spain. Front Microbiol 2021; 12: 781127.
- Yanat B, Rodriguez-Martinez JM, Touati A. Plasmid-mediated quinolone resistance in Enterobacteriaceae: a systematic review with a focus on Mediterranean countries. Eur J Clin Microbiol Infect Dis 2017; 36: 421-435.
- Bosch T, Lutgens SPM, Hermans MHA, Wever PC, Schneeberger PM, Renders NHM et al. Outbreak of NDM-1-Producing Klebsiella pneumoniae in a Dutch Hospital, with Interspecies Transfer of the Resistance Plasmid and Unexpected Occurrence in Unrelated Health Care Centers. J Clin Microbiol 2017; 55: 2380-2390.
- Silva DDC, Rampelotto RF, Lorenzoni VV, Santos SOD, Damer J, Horner M et al. Phenotypic methods for screening carbapenem-resistant Enterobacteriaceae and assessment of their antimicrobial susceptibility profile. Rev Soc Bras Med Trop 2017; 50: 173-178.
- Paczosa MK, Mecsas J. Klebsiella pneumoniae: Going on the Offense with a Strong Defense. Microbiol Mol Biol Rev 2016; 80: 629-661.
- Brhelova E, Antonova M, Pardy F, Kocmanova I, Mayer J, Racil Z et al. Investigation of next-generation sequencing data of Klebsiella pneumoniae using web-based tools. J Med Microbiol 2017; 66: 1673-1683.
- Enany S, Zakeer S, Diab AA, Bakry U, Sayed AA. Whole genome sequencing of Klebsiella pneumoniae clinical isolates sequence type 627 isolated from Egyptian patients. PLoS One 2022; 17: e0265884.
- Performance Standards for Antimicrobial Susceptibility Testing, 32nd Edition,CLSI standard M02. Clinical and Laboratory Standards Institute, Wayne, PA. 2020.
- Administration. USFaD. FDA approves new antibacterial drug Avycaz. FDA news release; U.S. FDA, Silver Spring26 February 2015.
- Tsakris A, Pournaras S, Woodford N, Palepou MF, Babini GS, Douboyas J et al. Outbreak of infections caused by Pseudomonas aeruginosa producing VIM-1 carbapenemase in Greece. J Clin Microbiol 2000; 38: 1290-1292.
- Geneious Prime 2021.2.1 https://www.geneious.com.
- Alikhan NF, Petty NK, Ben Zakour NL, Beatson SA. BLAST Ring Image Generator (BRIG): simple prokaryote genome comparisons. BMC Genomics 2011; 12: 402.
- Wu KM, Li LH, Yan JJ, Tsao N, Liao TL, Tsai HC et al. Genome sequencing and comparative analysis of Klebsiella pneumoniae NTUH-K2044, a strain causing liver abscess and meningitis. J Bacteriol 2009; 191: 4492-4501.
- Larsen MV, Cosentino S, Rasmussen S, Friis C, Hasman H, Marvig RL et al. Multilocus sequence typing of total-genome-sequenced bacteria. J Clin Microbiol 2012; 50: 1355-1361.
- Carattoli A, Zankari E, Garcia-Fernandez A, Voldby Larsen M, Lund O, Villa L et al. In silico detection and typing of plasmids using PlasmidFinder and plasmid multilocus sequence typing. Antimicrob Agents Chemother 2014; 58: 3895-3903.
- Zankari E, Hasman H, Cosentino S, Vestergaard M, Rasmussen S, Lund O et al. Identification of acquired antimicrobial resistance genes. J Antimicrob Chemother 2012; 67: 2640-2644.
- Jia B, Raphenya AR, Alcock B, Waglechner N, Guo P, Tsang KK et al. CARD 2017: expansion and model-centric curation of the comprehensive antibiotic resistance database. Nucleic Acids Res 2017; 45: D566-D573.
- Bertels F, Silander OK, Pachkov M, Rainey PB, van Nimwegen E. Automated reconstruction of whole-genome phylogenies from short-sequence reads. Mol Biol Evol 2014; 31: 1077-1088.
- Guindon S, Dufayard JF, Lefort V, Anisimova M, Hordijk W, Gascuel O. New algorithms and methods to estimate maximum-likelihood phylogenies: assessing the performance of PhyML 3.0. Syst Biol 2010; 59: 307-321.
- Dixit PD, Pang TY, Studier FW, Maslov S. Recombinant transfer in the basic genome of Escherichia coli. Proc Natl Acad Sci U S A 2015; 112: 9070-9075.
- Sakoparnig T, Field C, van Nimwegen E. Whole genome phylogenies reflect the distributions of recombination rates for many bacterial species. Elife 2021; 10.
- Zhang R, Liu L, Zhou H, Chan EW, Li J, Fang Y et al. Nationwide Surveillance of Clinical Carbapenem-resistant Enterobacteriaceae (CRE) Strains in China. EBioMedicine 2017; 19: 98-106.
- Voulgari E, Gartzonika C, Vrioni G, Politi L, Priavali E, Levidiotou-Stefanou S et al. The Balkan region: NDM-1-producing Klebsiella pneumoniae ST11 clonal strain causing outbreaks in Greece. J Antimicrob Chemother 2014; 69: 2091-2097.
- Protonotariou E, Meletis G, Chatzopoulou F, Malousi A, Chatzidimitriou D, Skoura L. Emergence of Klebsiella pneumoniae ST11 co-producing NDM-1 and OXA-48 carbapenemases in Greece. J Glob Antimicrob Resist 2019; 19: 81-82.
- Berglund B, Hoang NTB, Lundberg L, Le NK, Tarnberg M, Nilsson M et al. Clonal spread of carbapenem-resistant Klebsiella pneumoniae among patients at admission and discharge at a Vietnamese neonatal intensive care unit. Antimicrob Resist Infect Control 2021; 10: 162.
- Liu H, Wilksch J, Li B, Du J, Cao J, Zhang X et al. Emergence of ST39 and ST656 extensively drug-resistant Klebsiella pneumoniae isolates in Wenzhou, China. Indian J Med Microbiol 2017; 35: 145-146.
- Cabanel N, Rosinski-Chupin I, Chiarelli A, Botin T, Tato M, Canton R et al. Evolution of VIM-1-Producing Klebsiella pneumoniae Isolates from a Hospital Outbreak Reveals the Genetic Bases of the Loss of the Urease-Positive Identification Character. mSystems 2021; 6: e0024421.
- Karampatakis T, Zarras C, Pappa S, Vagdatli E, Iosifidis E, Roilides E et al. Emergence of ST39 carbapenem-resistant Klebsiella pneumoniae producing VIM-1 and KPC-2. Microb Pathog 2022; 162: 105373.
- Giakkoupi P, Papagiannitsis CC, Miriagou V, Pappa O, Polemis M, Tryfinopoulou K et al. An update of the evolving epidemic of blaKPC-2-carrying Klebsiella pneumoniae in Greece (2009-10). J Antimicrob Chemother 2011; 66: 1510-1513.
- Piekarska K, Zacharczuk K, Wolkowicz T, Wolaniuk N, Rzeczkowska M, Gierczynski R. Emergence of Enterobacteriaceae co-producing CTX-M-15, ArmA and PMQR in Poland. Adv Clin Exp Med 2019; 28: 249-254.
- Galani I, Karaiskos I, Souli M, Papoutsaki V, Galani L, Gkoufa A et al. Outbreak of KPC-2-producing Klebsiella pneumoniae endowed with ceftazidime-avibactam resistance mediated through a VEB-1-mutant (VEB-25), Greece, September to October 2019. Euro surveillance : bulletin Europeen sur les maladies transmissibles = European communicable disease bulletin 2020; 25.
- Voulgari E, Kotsakis SD, Giannopoulou P, Perivolioti E, Tzouvelekis LS, Miriagou V. Detection in two hospitals of transferable ceftazidime-avibactam resistance in Klebsiella pneumoniae due to a novel VEB beta-lactamase variant with a Lys234Arg substitution, Greece, 2019. Euro surveillance : bulletin Europeen sur les maladies transmissibles = European communicable disease bulletin 2020; 25.
- Livermore DM, Struelens M, Amorim J, Baquero F, Bille J, Canton R et al. Multicentre evaluation of the VITEK 2 Advanced Expert System for interpretive reading of antimicrobial resistance tests. J Antimicrob Chemother 2002; 49: 289-300.
- Garcia-Fulgueiras V, Magallanes C, Reyes V, Cayota C, Galiana A, Vieytes M et al. In Vivo High Plasticity of Multi-Drug Resistant ST258 Klebsiella pneumoniae. Microb Drug Resist 2021; 27: 1126-1130.
- Albarri O, AlMatar M, Ocal MM, Koksal F. Overexpression of Efflux Pumps AcrAB and OqxAB Contributes to Ciprofloxacin Resistance in Clinical Isolates of K. pneumonia. Curr Protein Pept Sci 2022; 23: 356-368.
- Diez-Aguilar M, Canton R. New microbiological aspects of fosfomycin. Rev Esp Quimioter 2019; 32 Suppl 1: 8-18.
- Sugita K, Aoki K, Komori K, Nagasawa T, Ishii Y, Iwata S et al. Molecular Analysis of bla(KPC-2)-Harboring Plasmids: Tn4401a Interplasmid Transposition and Tn4401a-Carrying ColRNAI Plasmid Mobilization from Klebsiella pneumoniae to Citrobacter europaeus and Morganella morganii in a Single Patient. mSphere 2021; 6: e0085021.
- Di Martino P, Cafferini N, Joly B, Darfeuille-Michaud A. Klebsiella pneumoniae type 3 pili facilitate adherence and biofilm formation on abiotic surfaces. Res Microbiol 2003; 154: 9-16.
- Lam MMC, Wick RR, Wyres KL, Gorrie CL, Judd LM, Jenney AWJ et al. Genetic diversity, mobilisation and spread of the yersiniabactin-encoding mobile element ICEKp in Klebsiella pneumoniae populations. Microb Genom 2018; 4.
- Zhu J, Wang T, Chen L, Du H. Virulence Factors in Hypervirulent Klebsiella pneumoniae. Front Microbiol 2021; 12: 642484.
- Di Pilato V, Henrici De Angelis L, Aiezza N, Baccani I, Niccolai C, Parisio EM et al. Resistome and virulome accretion in an NDM-1-producing ST147 sublineage of Klebsiella pneumoniae associated with an outbreak in Tuscany, Italy: a genotypic and phenotypic characterisation. Lancet Microbe 2022; 3: e224-e234.
- Miro E, Rossen JWA, Chlebowicz MA, Harmsen D, Brisse S, Passet V et al. Core/Whole Genome Multilocus Sequence Typing and Core Genome SNP-Based Typing of OXA-48-Producing Klebsiella pneumoniae Clinical Isolates From Spain. Front Microbiol 2019; 10: 2961.
- Snitkin ES, Zelazny AM, Thomas PJ, Stock F, Group NCSP, Henderson DK et al. Tracking a hospital outbreak of carbapenem-resistant Klebsiella pneumoniae with whole-genome sequencing. Sci Transl Med 2012; 4: 148ra116.
- Marsh JW, Krauland MG, Nelson JS, Schlackman JL, Brooks AM, Pasculle AW et al. Genomic Epidemiology of an Endoscope-Associated Outbreak of Klebsiella pneumoniae Carbapenemase (KPC)-Producing K. pneumoniae. PLoS One 2015; 10: e0144310.
- Onori R, Gaiarsa S, Comandatore F, Pongolini S, Brisse S, Colombo A et al. Tracking Nosocomial Klebsiella pneumoniae Infections and Outbreaks by Whole-Genome Analysis: Small-Scale Italian Scenario within a Single Hospital. J Clin Microbiol 2015; 53: 2861-2868.
- Arnold BJ, Gutmann MU, Grad YH, Sheppard SK, Corander J, Lipsitch M et al. Weak Epistasis May Drive Adaptation in Recombining Bacteria. Genetics 2018; 208: 1247-1260.
- Dallman T, Ashton P, Schafer U, Jironkin A, Painset A, Shaaban S et al. SnapperDB: a database solution for routine sequencing analysis of bacterial isolates. Bioinformatics 2018; 34: 3028-3029.
| Strain | Date of isolation | Sex | Age (years) |
Ward | Biological sample | Infection / Colonization |
|---|---|---|---|---|---|---|
| C2482/18 | 9/6/2018 | F | 8 | PICU | Rectal swab | Colonization |
| C4112/18 | 7/9/2018 | F | 56 | ICU | Rectal swab | Colonization |
| B11395/18 | 24/10/2018 | F | 1 | PICU | Urine | Infection |
| D6184/18 | 19/11/2018 | F | 8 | PICU | Bronchial aspirate | Infection |
| C251/19 | 17/1/2019 | F | 17 | PICU | Rectal swab | Colonization |
| Z557/19 | 30/1/2019 | M | 57 | ICU | Rectal swab | Colonization |
| C746/19 | 7/2/2019 | M | 73 | ICU | Rectal swab | Colonization |
| B2562/19 | 4/3/2019 | M | 79 | ICU | Urine | Infection |
| Z508/19 | 20/3/2019 | F | 60 | ICU | Rectal swab | Colonization |
| D1463/19 | 22/3/2019 | M | 55 | ICU | Bronchial aspirate | Infection |
| D1598/19 | 1/4/2019 | M | 40 | ICU | Bronchial aspirate | Infection |
| Z852/19 | 12/4/2019 | M | 3 | PICU | Rectal swab | Colonization |
| Z866/19 | 15/4/2019 | M | 49 | ICU | Rectal swab | Colonization |
| D2452/19 | 24/5/2019 | M | 73 | ICU | Bronchial aspirate | Infection |
| C833/21 | 31/3/2021 | F | 57 | ICU | Wound | Infection |
| A5051/21 | 25/4/2021 | F | 69 | ICU | Blood | Infection |
| D2856/21 | 7/7/2021 | F | 54 | ICU | Bronchial aspirate | Infection |
| C1909/21 | 8/7/2021 | M | 85 | ICU | Wound | Infection |
| A18940/21 | 24/12/2021 | F | 58 | ICU | Blood | Infection |
| A1746/22 | 25/2/2022 | M | 0.25 | PICU | Blood | Infection |
| A7213/22 | 3/5/2022 | F | 30 | ICU | Blood | Infection |
| A9974/22 | 16/6/2022 | F | 67 | ICU | Blood | Infection |
| A10037/22 | 16/6/2022 | F | 53 | ICU | Blood | Infection |
| A10143/22 | 19/6/2022 | M | 88 | ICU | Blood | Infection |
Disclaimer/Publisher’s Note: The statements, opinions and data contained in all publications are solely those of the individual author(s) and contributor(s) and not of MDPI and/or the editor(s). MDPI and/or the editor(s) disclaim responsibility for any injury to people or property resulting from any ideas, methods, instructions or products referred to in the content. |
© 2023 by the authors. Licensee MDPI, Basel, Switzerland. This article is an open access article distributed under the terms and conditions of the Creative Commons Attribution (CC BY) license (http://creativecommons.org/licenses/by/4.0/).


