Submitted:
04 May 2023
Posted:
09 May 2023
You are already at the latest version
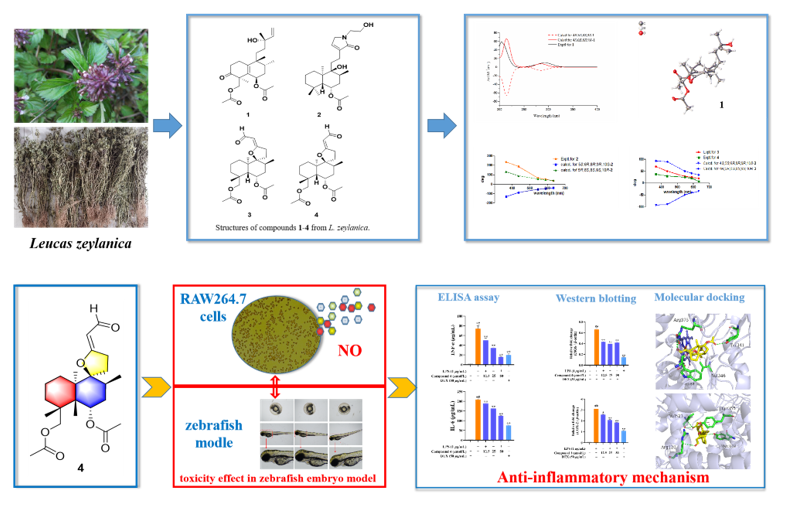
Abstract
Keywords:
1. Introduction
2. Results and Discussion
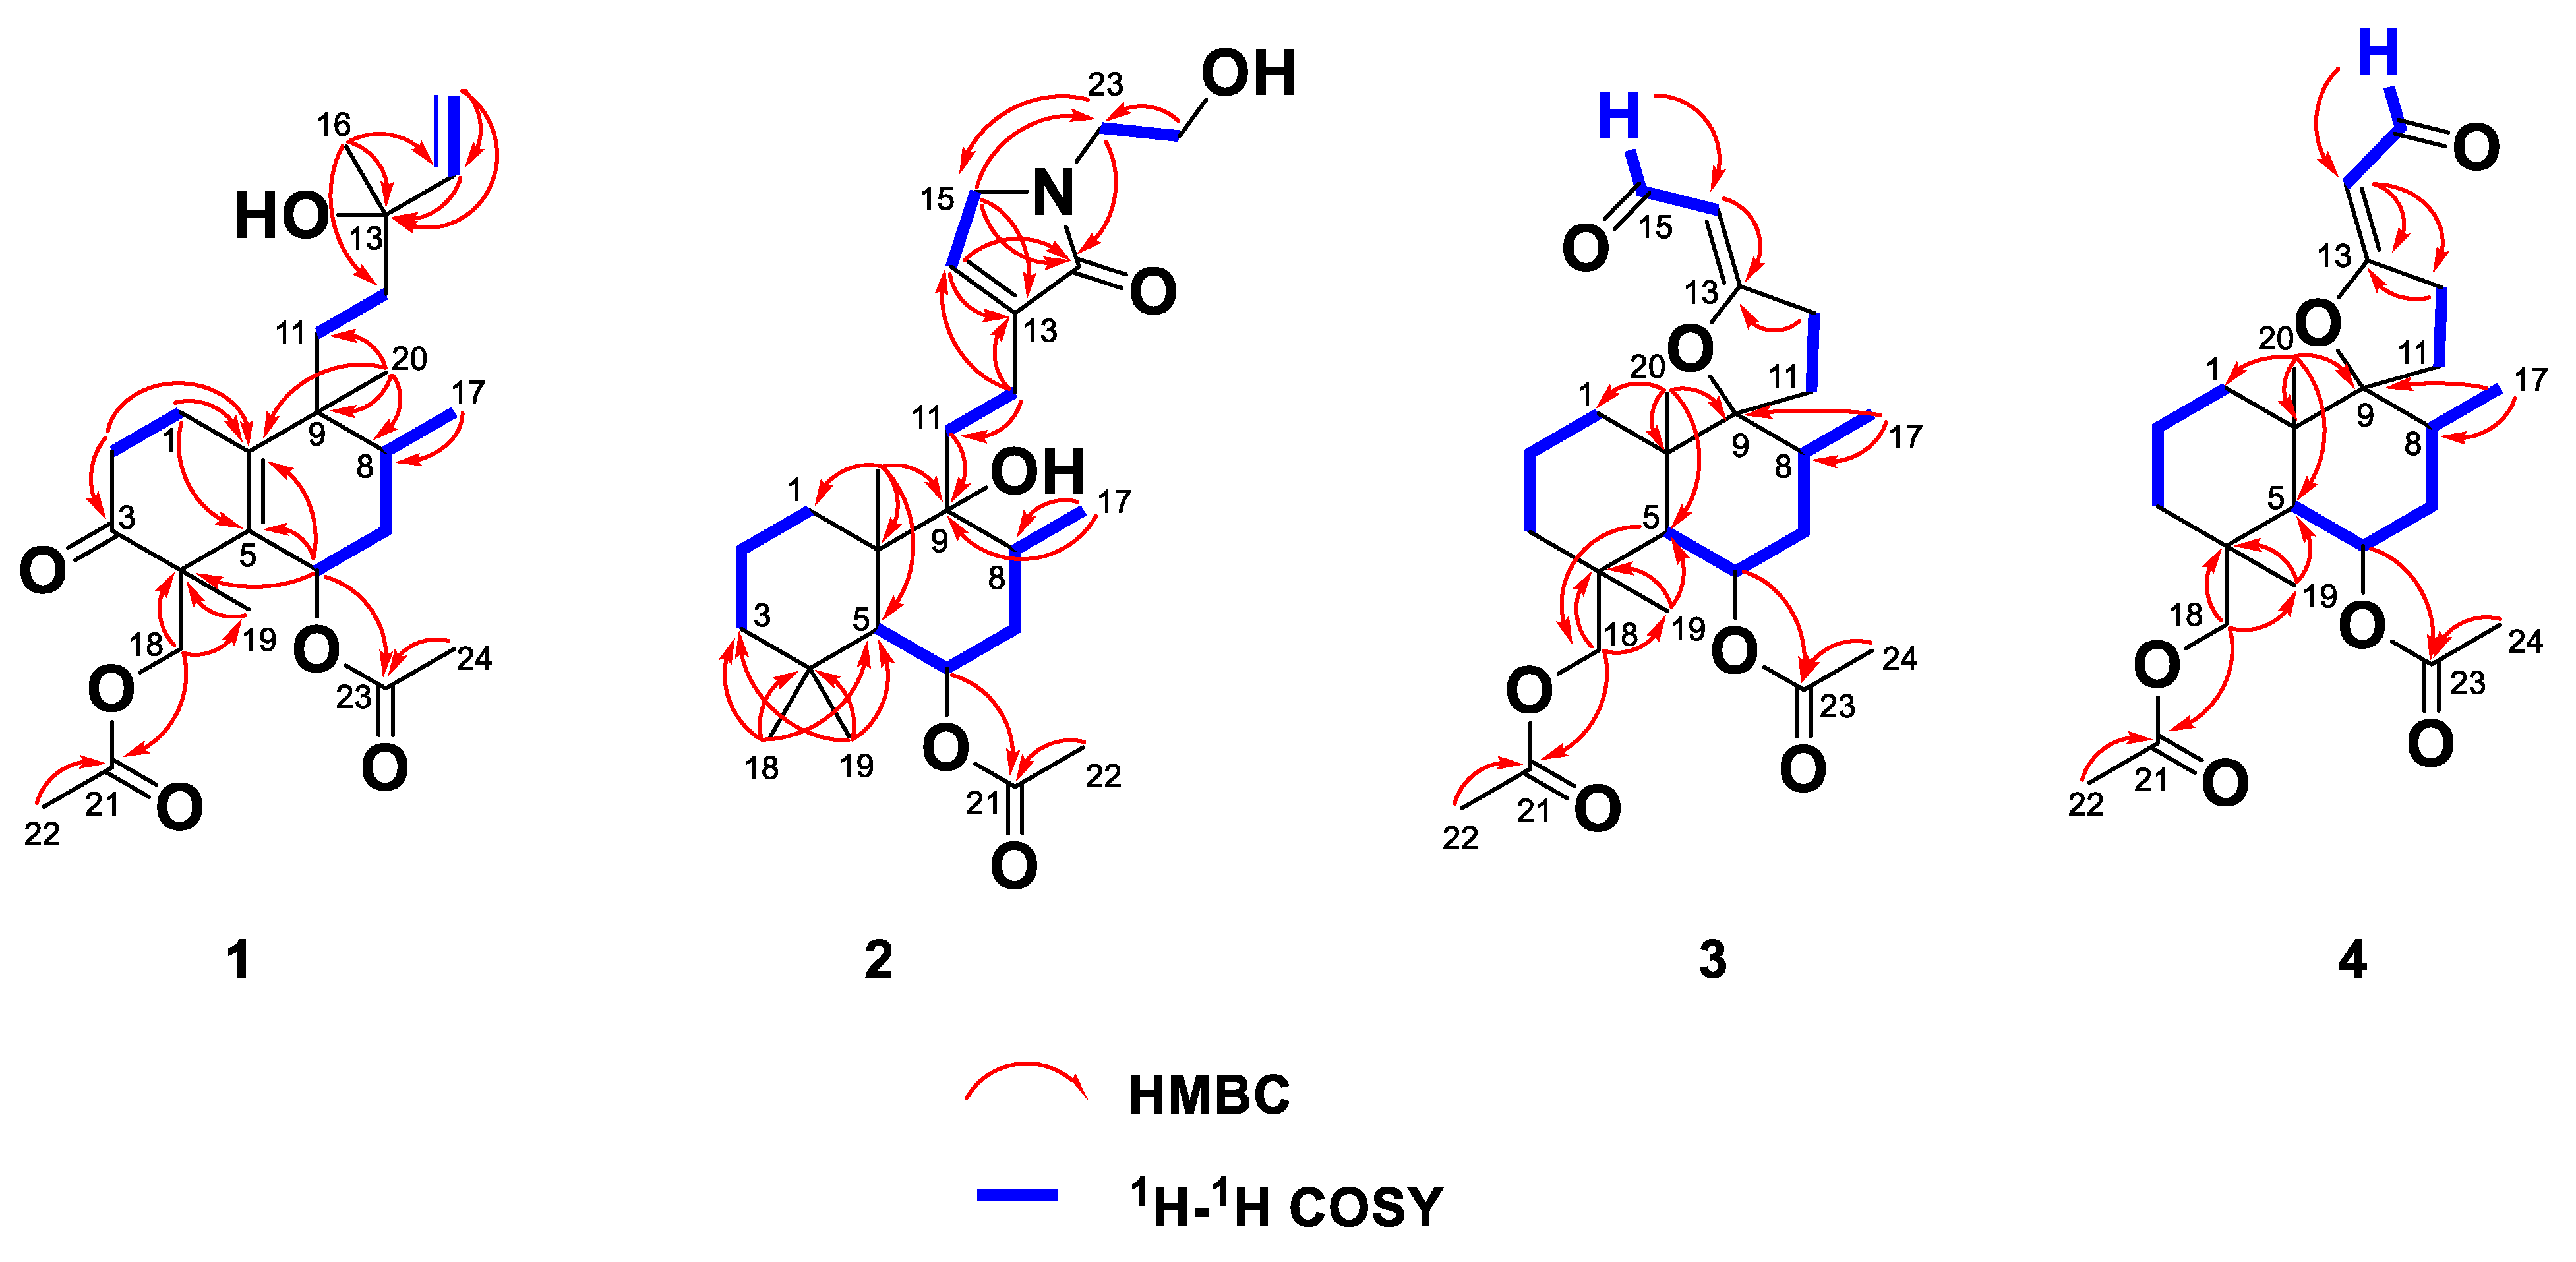
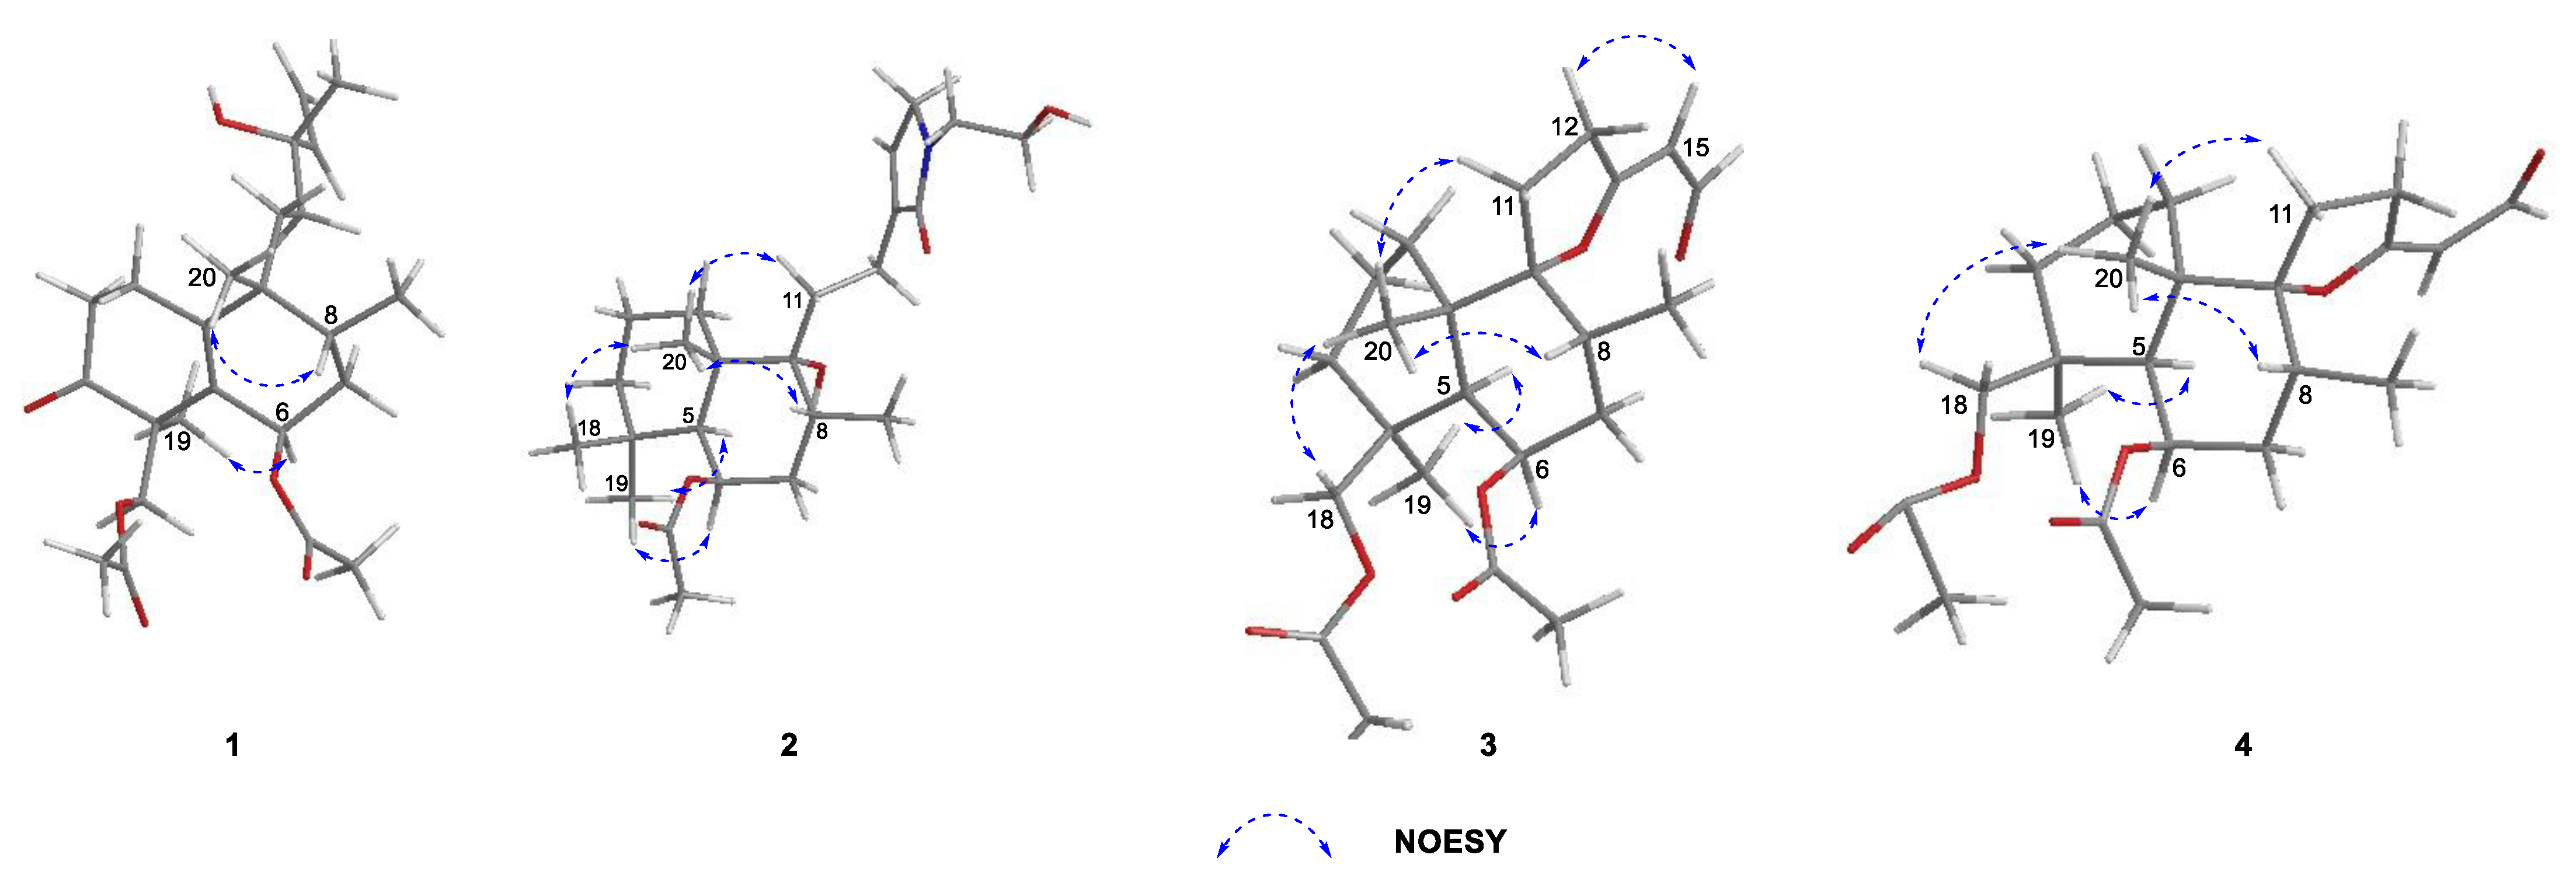
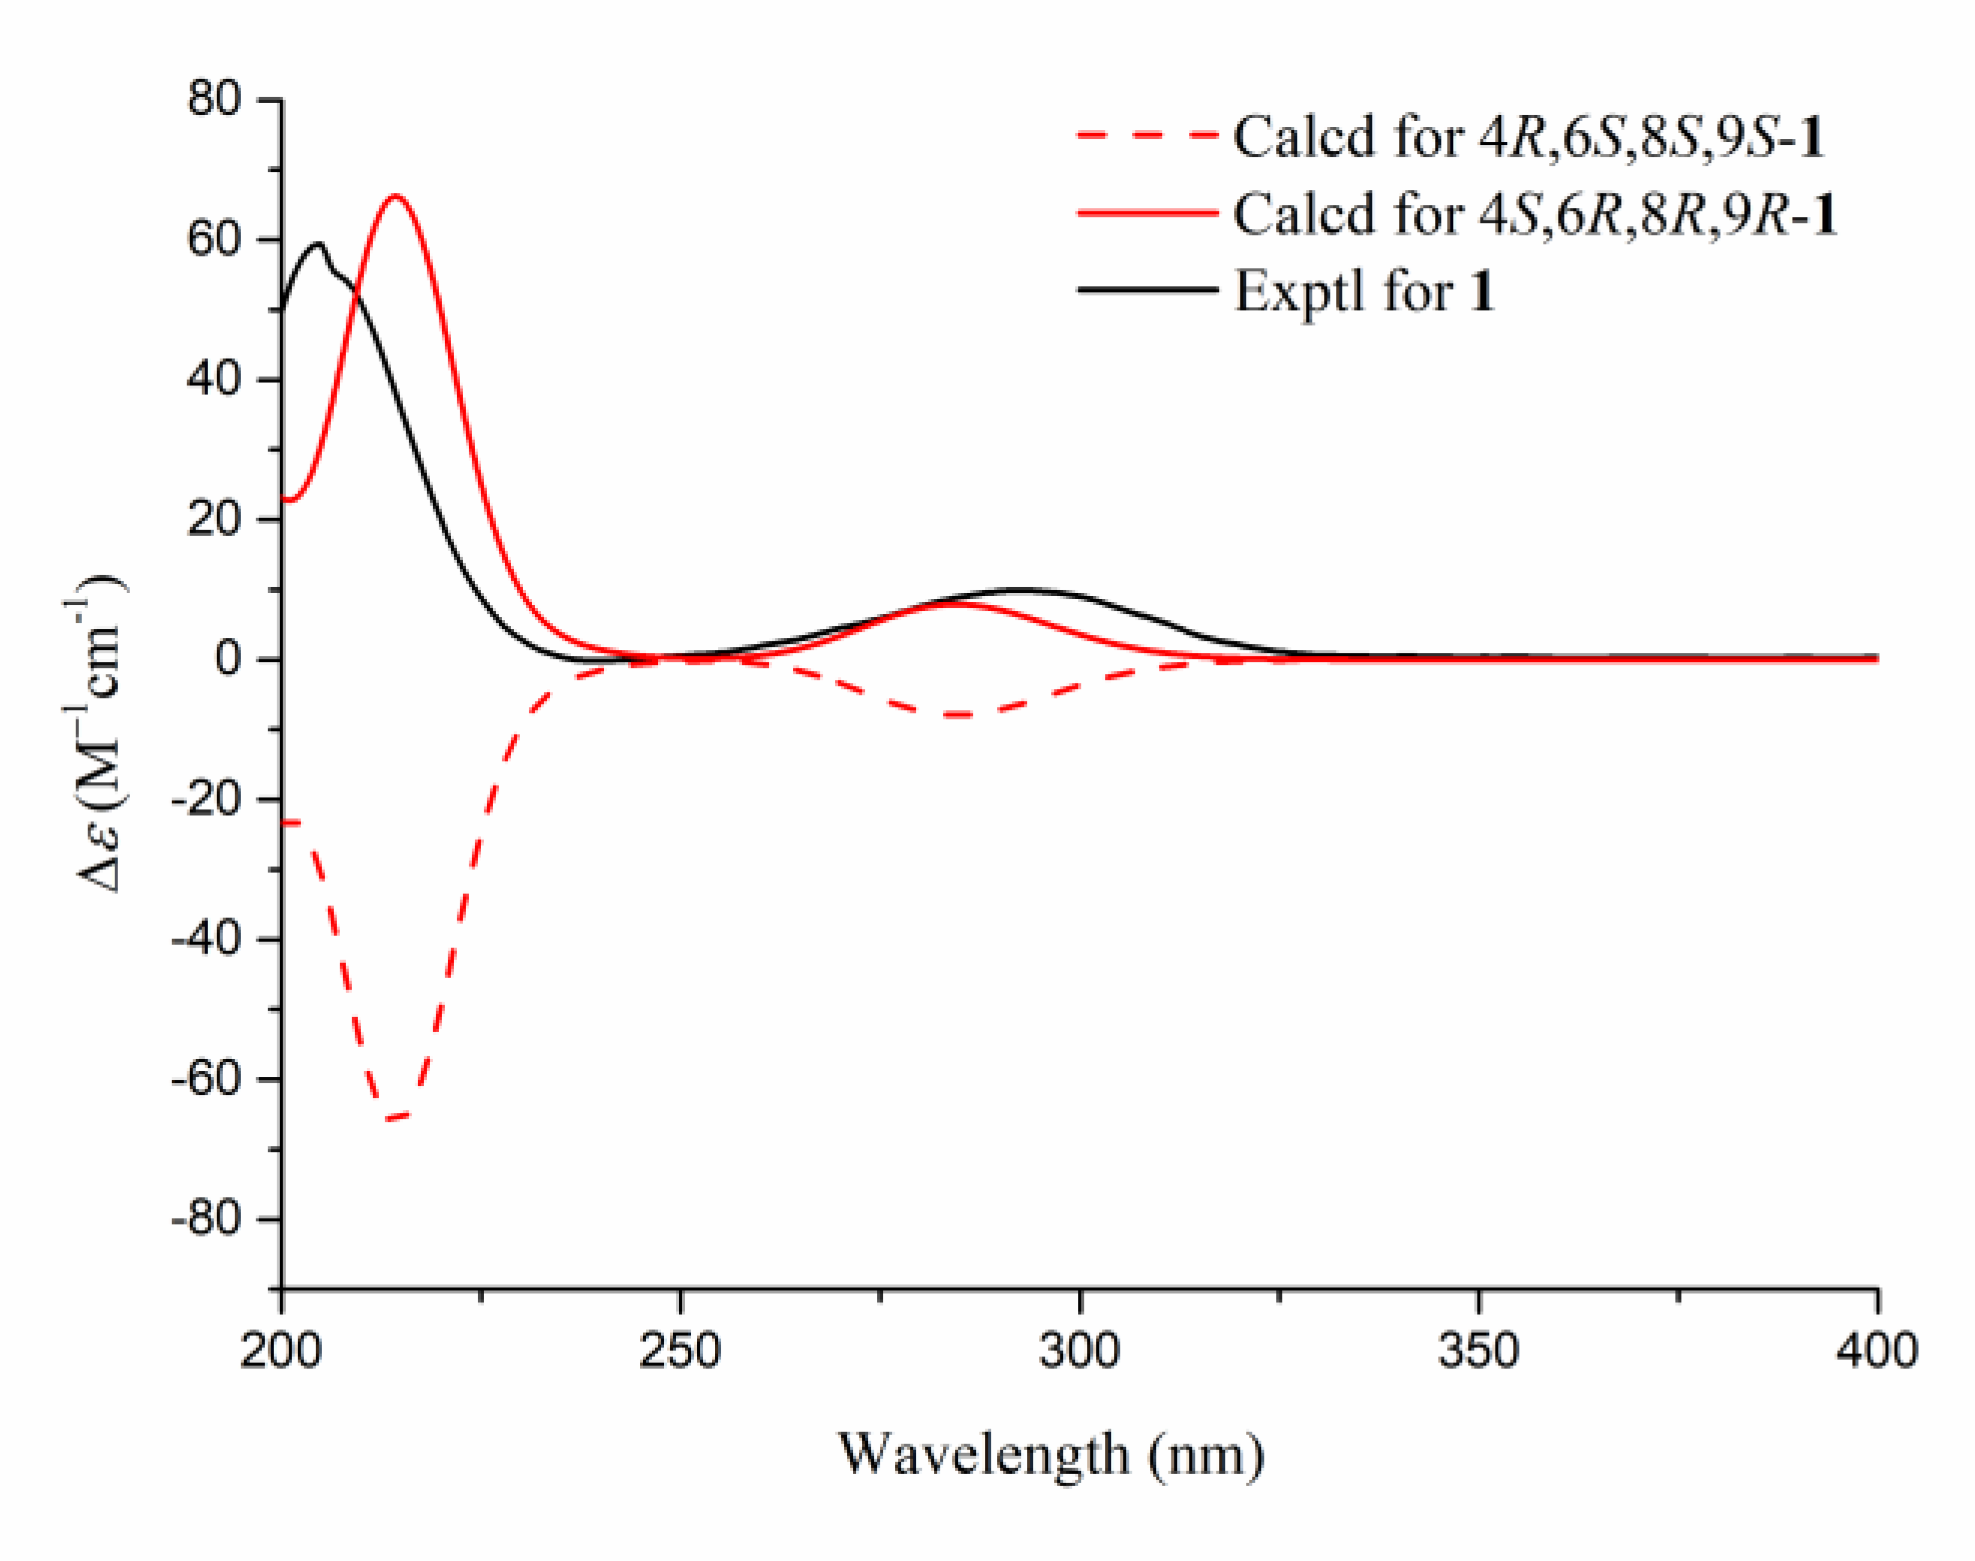
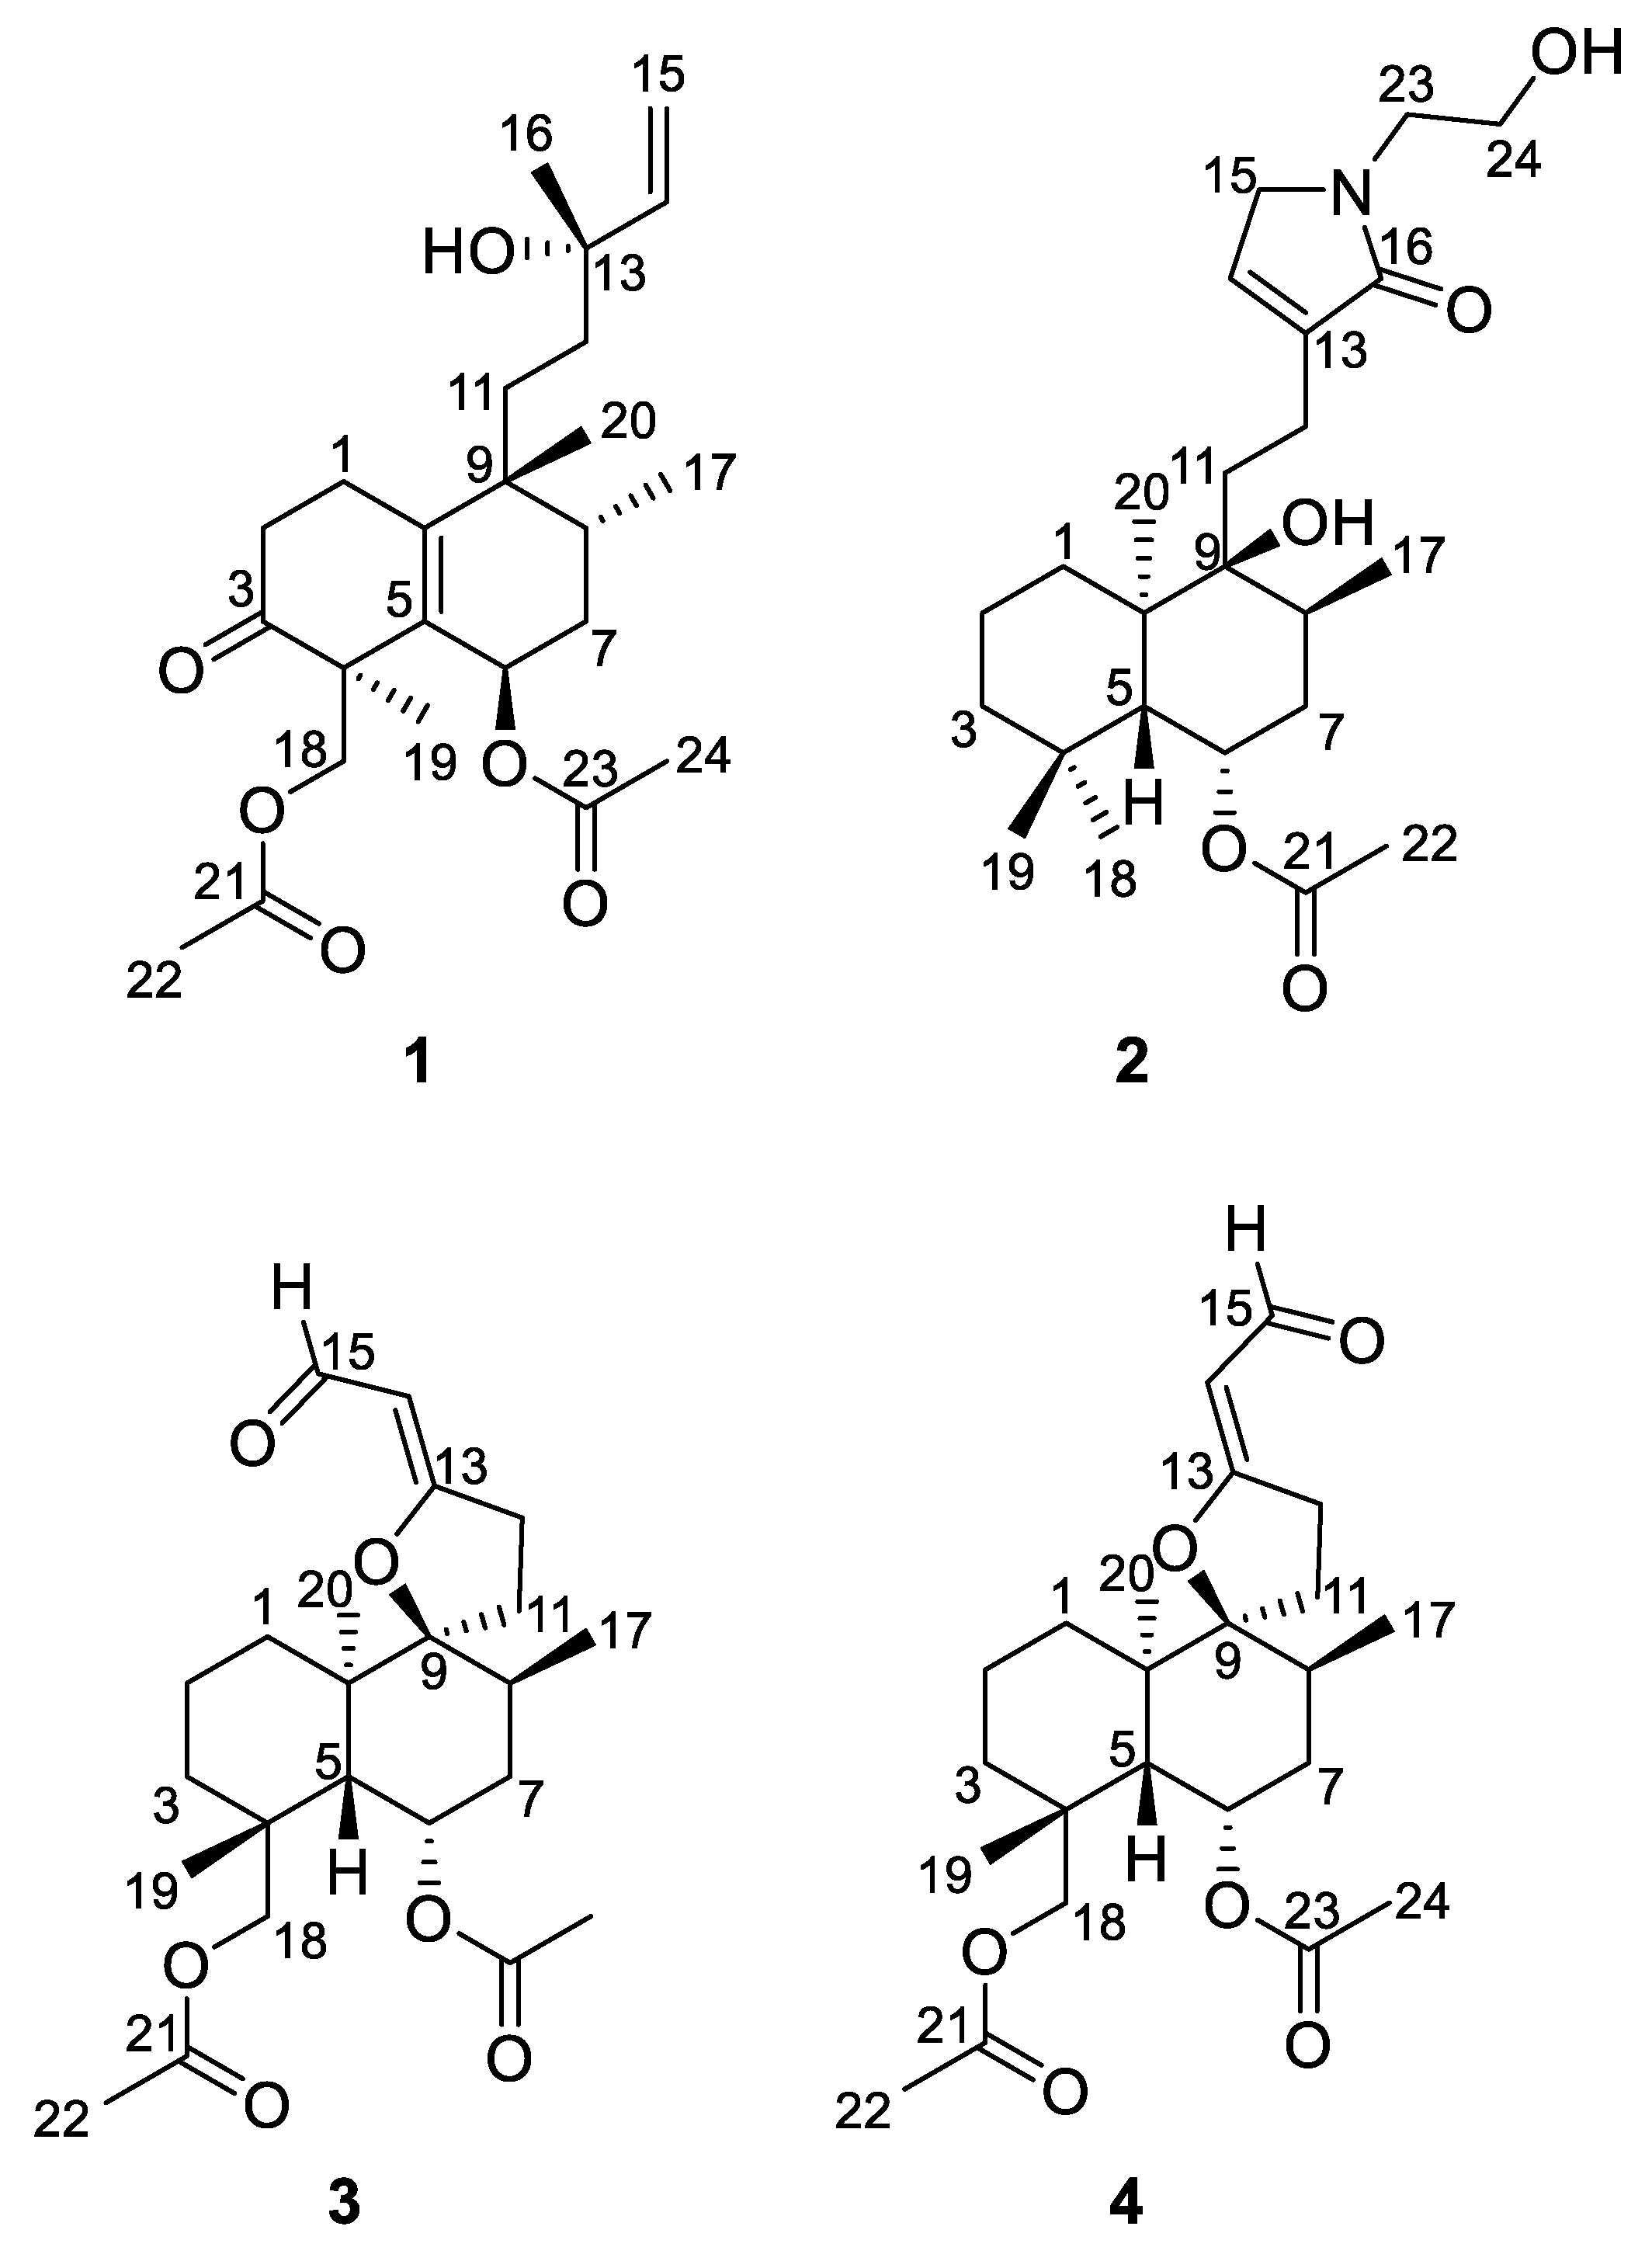
2.1. Elucidation of the Chemical Structures of zeylleucapenoids A-D (1-4).
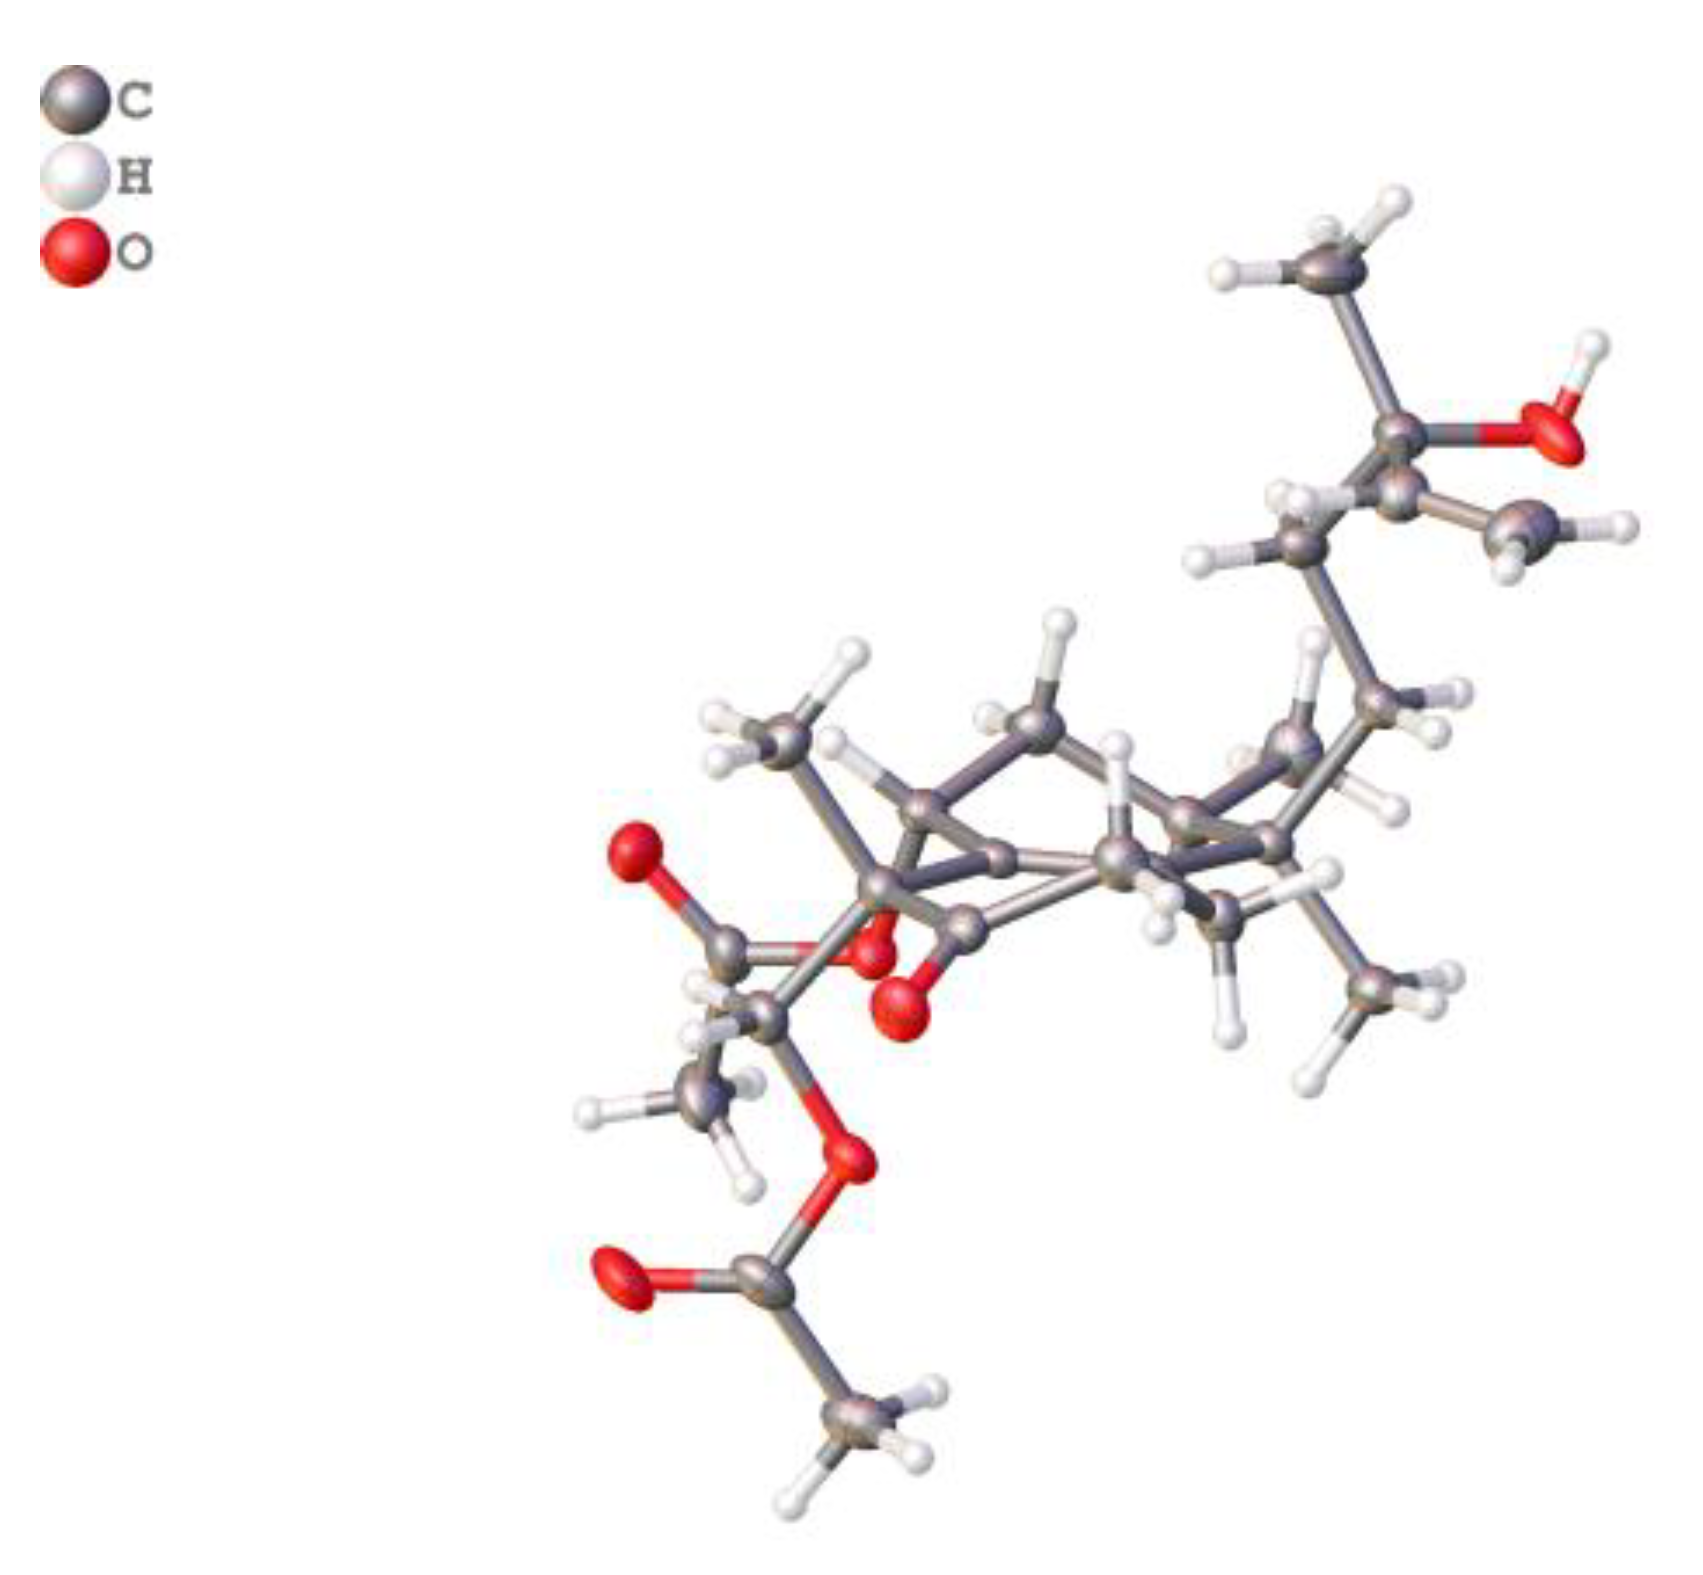
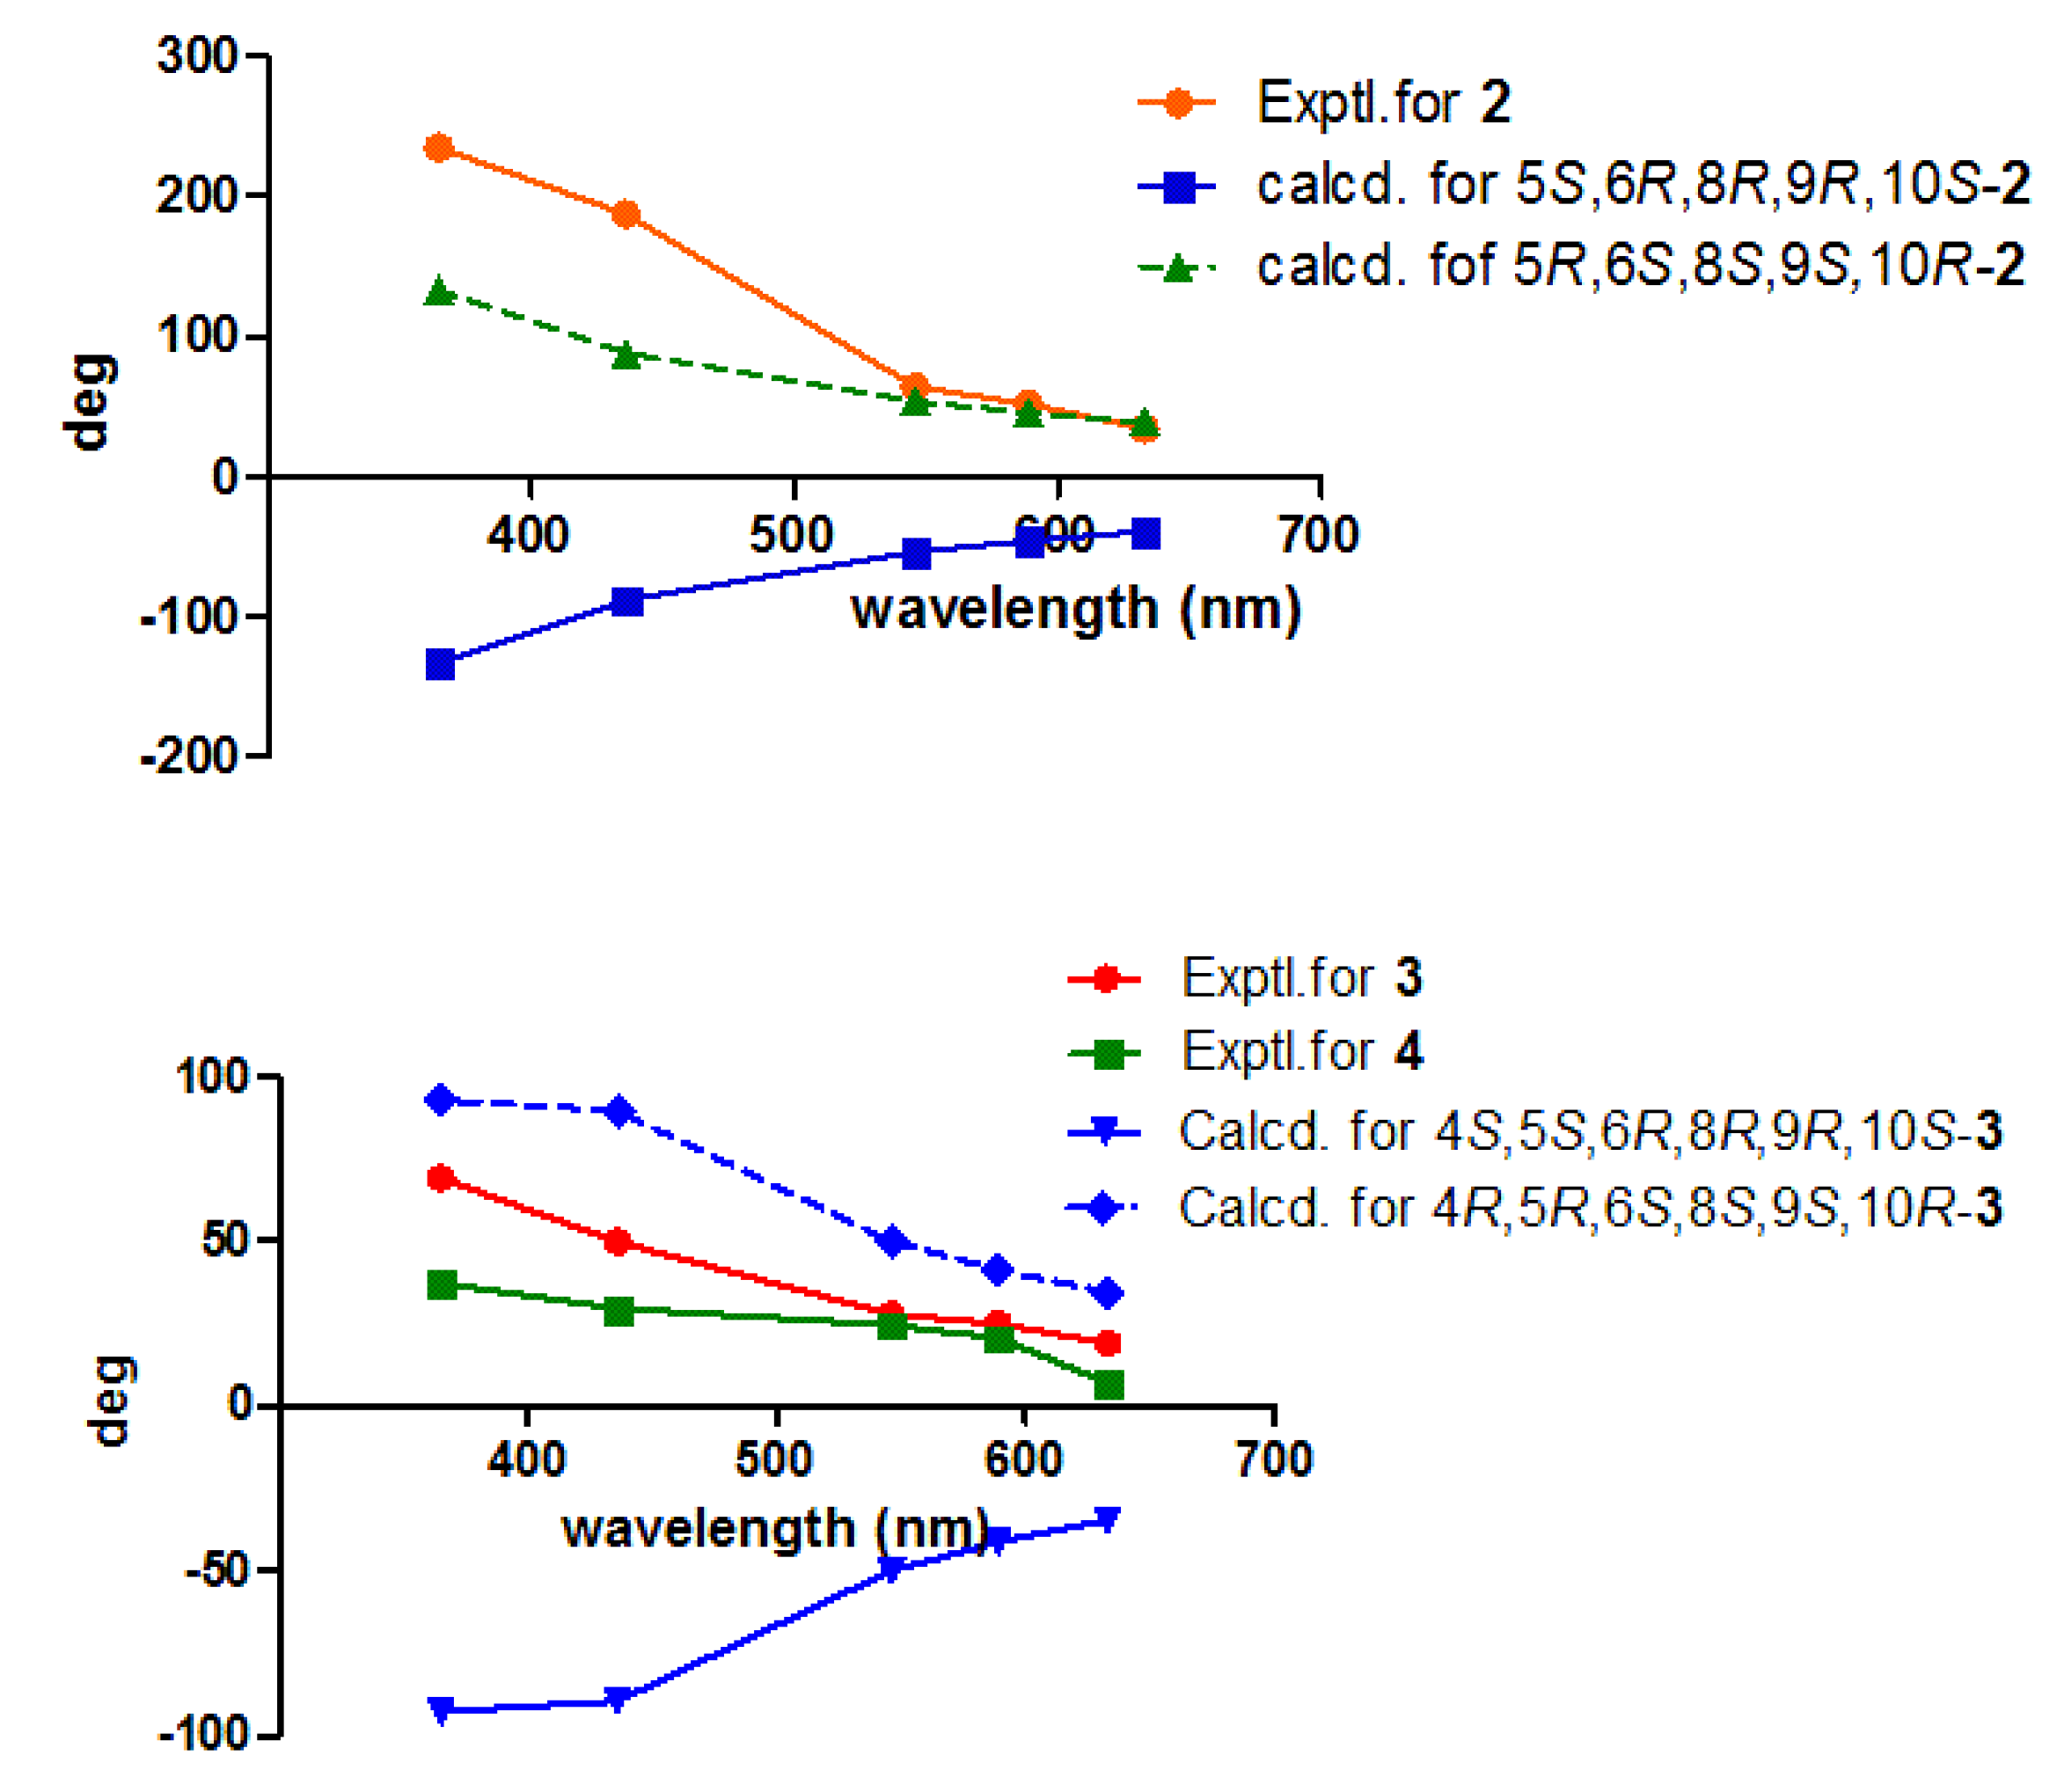
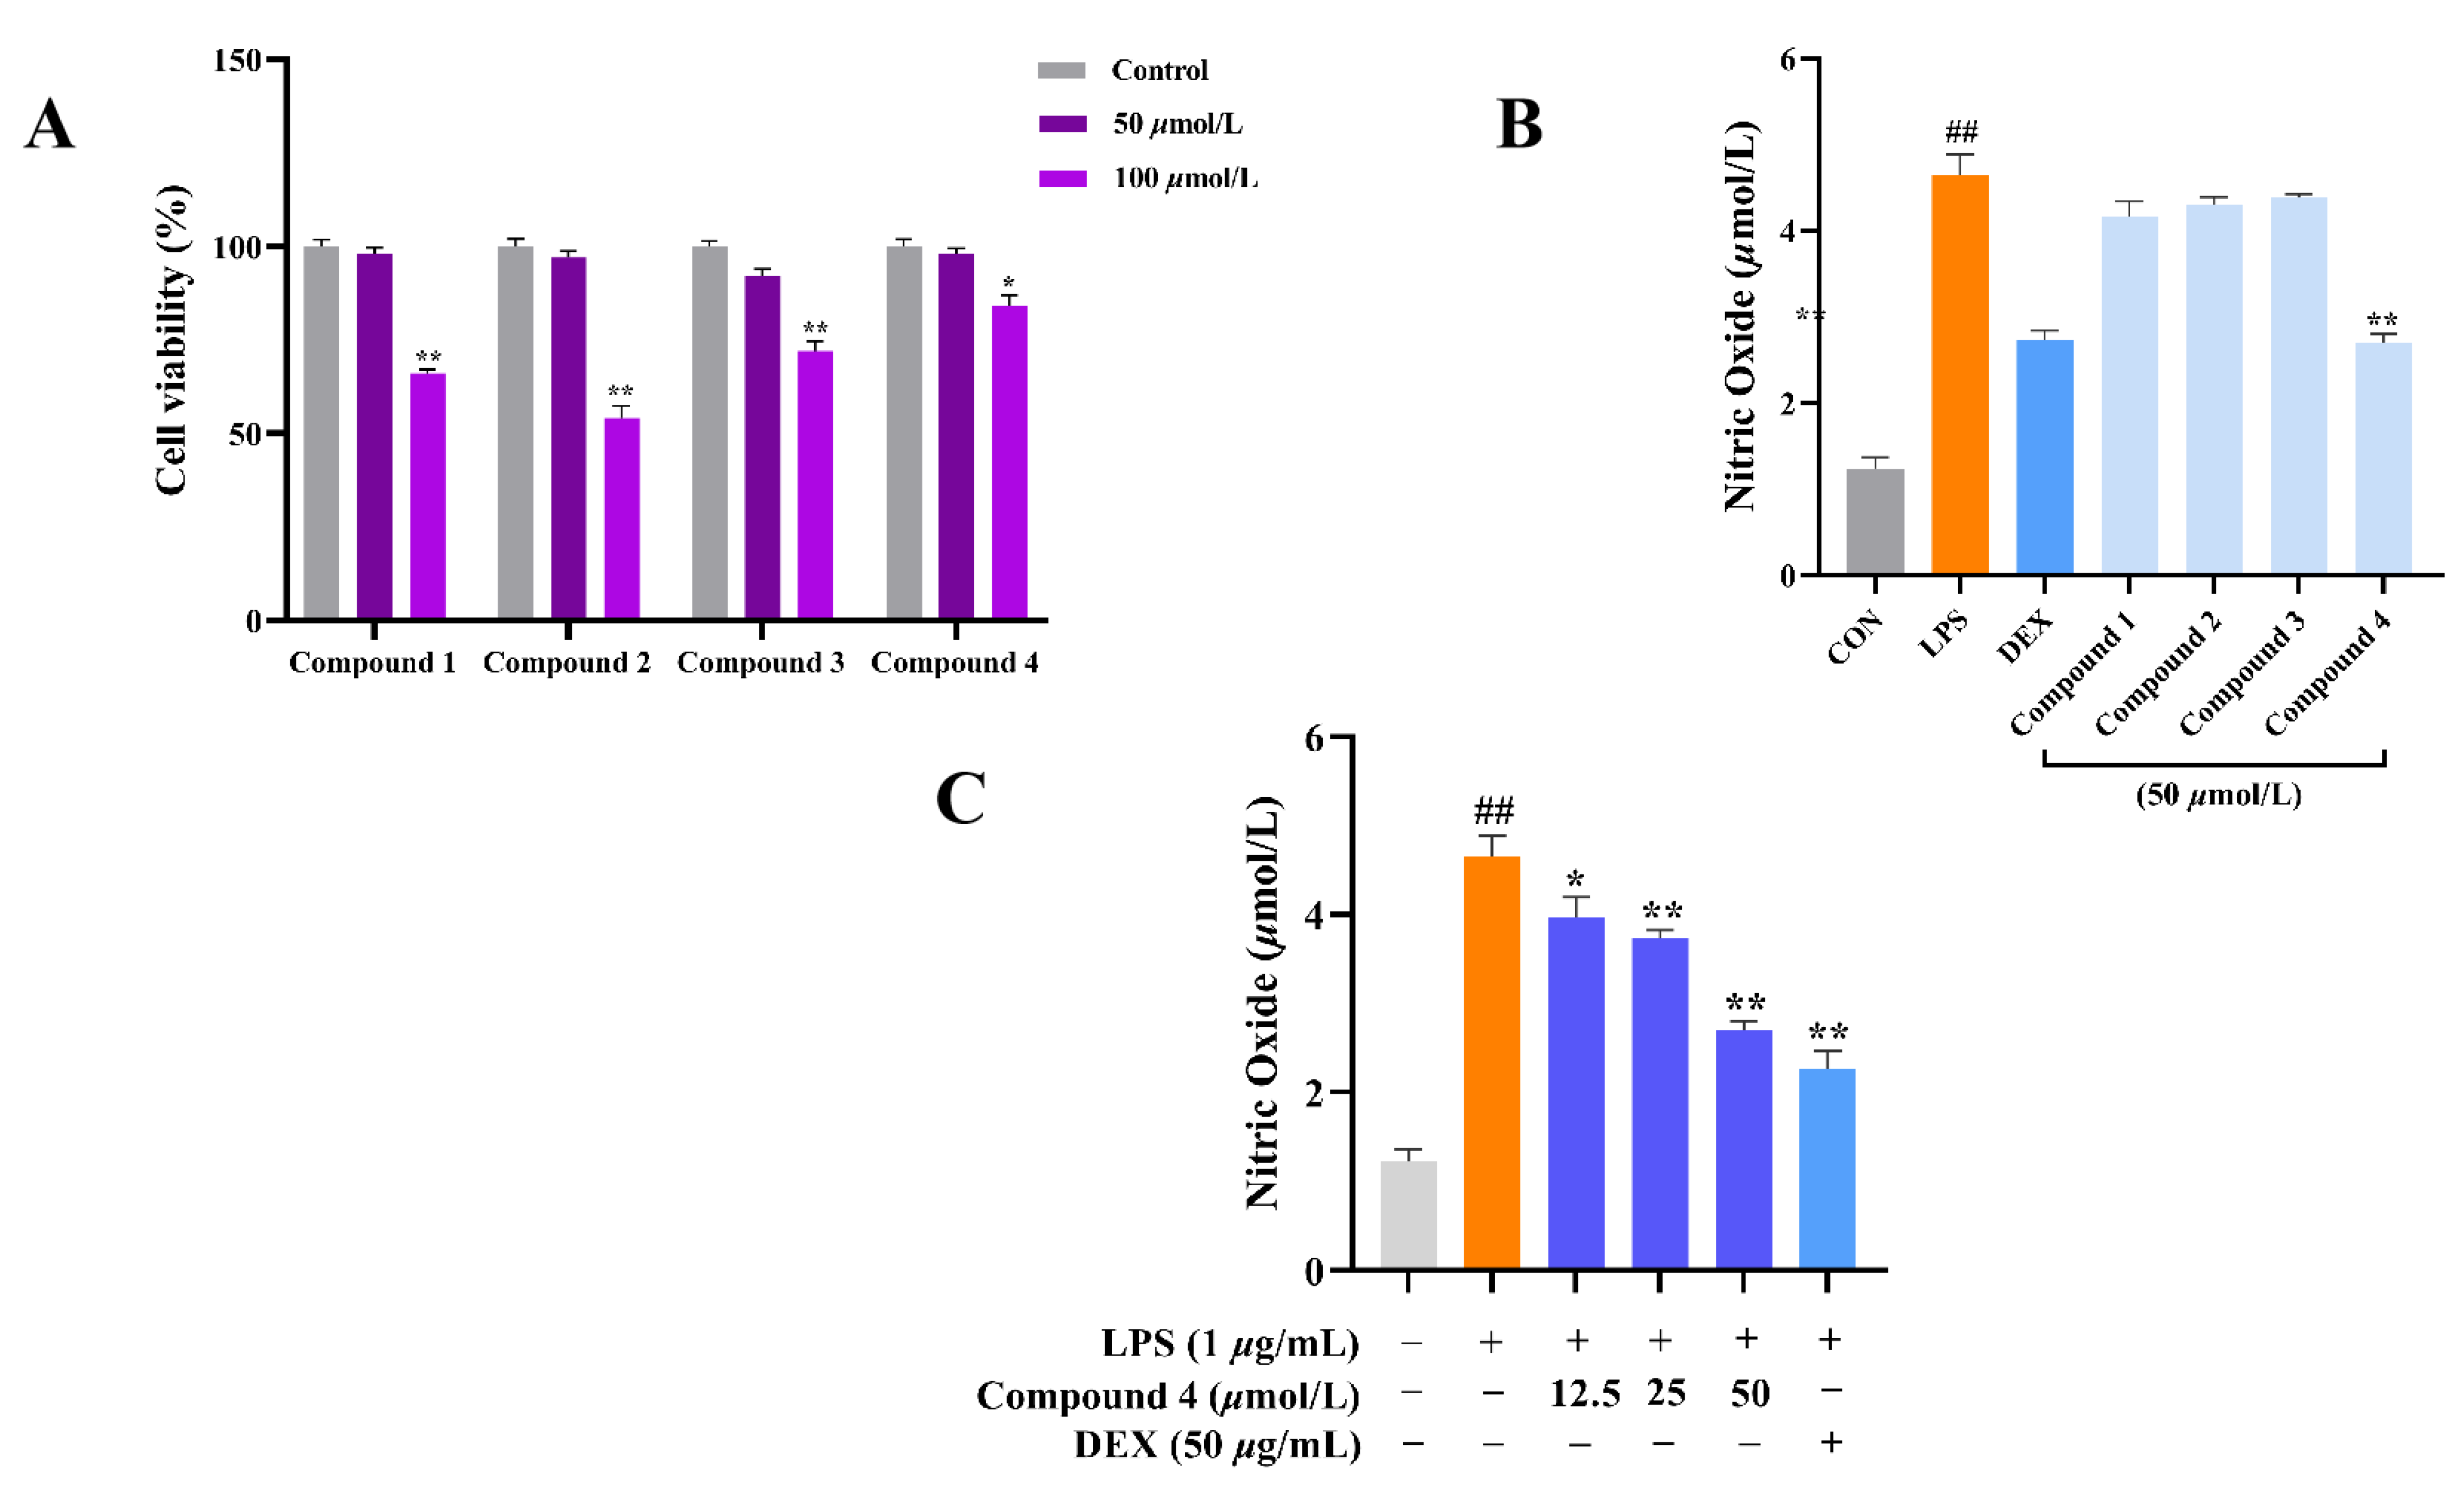
2.2. Anti-Inflammatory Activity
2.3. Predicted Binding Modes of Compound 4 and both iNOS and COX-2 Using Molecular Docking Analysis
3. Materials and Methods
3.1. General experimental procedures
3.2. Plant material
3.3. Extraction and Isolation:
3.3.1. Zeylleucapenoid A (1):
3.3.2. Zeylleucapenoid B (2):
3.3.3. Zeylleucapenoid C (3):
3.3.4. Zeylleucapenoid D (4):
3.4. X-ray crystallographic analysis
3.5. Anti-Inflammatory Activity:
3.5.1. NO measurement
3.5.2. The MTT assay
3.5.3. Zebrafish maintenance
3.5.4. Toxic effects in zebrafish
3.5.5. ELISA assay
3.5.6. Western Blot Analysis
3.5.7. Molecular docking studies
4. Conclusions
Supplementary Materials
Author Contributions
Funding
Institutional Review Board Statement
Informed Consent Statement
Data Availability Statement
Conflflicts of Interest
Sample Availability
References
- Hunter, P. The inflammation theory of disease. Embo Rep. 2012, 13, 968–970. [Google Scholar] [CrossRef] [PubMed]
- Zeinali, M.; Rezaee, S.A.; Hosseinzadeh, H. An overview on immunoregulatory and anti-inflammatory properties of chrysin and flavonoids substances. Biomed. Pharmacother. 2017, 92, 998–1009. [Google Scholar] [CrossRef]
- Hanson, J.R.; Nichols, T.; Mukhrish, Y.; Bagley, M.C. Diterpenoids of terrestrial origin. Nat. Prod. Rep. 2019, 36, 1499–1512. [Google Scholar] [CrossRef] [PubMed]
- Wang, X.; Yu, H.; Zhang, Y.; Lu, X.; Wang, B.; Liu, X. Bioactive Pimarane-Type Diterpenes from Marine Organisms. Chem. Biodivers. 2017, 15. [Google Scholar] [CrossRef] [PubMed]
- Xu, Y.; Tang, P.; Zhu, M.; Wang, Y.; Sun, D.; Li, H.; Chen, L. Diterpenoids from the genus Euphorbia: Structure and biological activity (2013–2019). Phytochemistry 2021, 190, 112846. [Google Scholar] [CrossRef] [PubMed]
- Zhan, Z.J. , Li, S. , Chu, W., Yin, S. Euphorbia diterpenoids: isolation, structure, bioactivity, biosynthesis, and synthesis (2013-2021). Nat. Prod. Rep. 2022, 39, 2132–2174. [Google Scholar]
- Naidoo, Y.; Dladla, T.; Dewir, Y.H.; Gangaram, S.; Naidoo, C.M.; Rihan, H.Z. The Micromorphology and Histochemistry of Foliar Mixed Indumentum of Leucas lavandulaefolia (Lamiaceae). Plants 2021, 10, 1767. [Google Scholar] [CrossRef] [PubMed]
- Shurpali, R.R.K.K. , Sarkar, V. G.P.D., Joshi, S.P. Antimycobacterial labdane diterpenes from Leucas stelligera. J. Nat. Prod. 2013, 76, 1836–1841. [Google Scholar]
- Zhang, X.P. , Zhang, C. Y., Chen, C.Y., Yu, L., Liu, J. Leucasinoside: A new abietane diterpenoid glycoside from Leucas zeylanica. Rec. Nat. Prod. 2016, 10, 645–648. [Google Scholar]
- Shahdat, H. , Mijanur, R. , Nusrat, F., Mozammel, H., Jahirul, I. Leucas zeylanica (L.) R. Br. protects ethanol and hydrogen peroxide-induced oxidative stress on hepatic tissue of rats. International Current Pharmaceutical Journal, 2013, 2, 148–151. [Google Scholar]
- Nidhal, N.; Zhou, X.-M.; Chen, G.; Zhang, B.; Han, C.; Song, X. Chemical constituents of Leucas zeylanica and their chemotaxonomic significance. Biochem. Syst. Ecol. 2020, 89, 104006. [Google Scholar] [CrossRef]
- Sadhu, S.K. , Okuyama, E. , Fujimoto, H., Ishibashi, M. Diterpenes from Leucas aspera inhibiting prostaglandin-induced contractions. J. Nat. Prod. 2006, 69, 988–994. [Google Scholar] [PubMed]
- Li, S.-H.; Zhang, H.-J.; Qiu, S.-X.; Niu, X.-M.; Santarsiero, B.D.; Mesecar, A.D.; Fong, H.H.; Farnsworth, N.R.; Sun, H.-D. Vitexlactam A, a novel labdane diterpene lactam from the fruits of Vitex agnus-castus. Tetrahedron Lett. 2002, 43, 5131–5134. [Google Scholar] [CrossRef]
- Tilg, H.; Moschen, A.R. Adipocytokines: Mediators linking adipose tissue, inflammation and immunity. Nat. Rev. Immunol. 2006, 6, 772–783. [Google Scholar] [CrossRef] [PubMed]
- Wang, S.-K.; Chen, T.-X.; Wang, W.; Xu, L.-L.; Zhang, Y.-Q.; Jin, Z.; Liu, Y.-B.; Tang, Y.-Z. Aesculetin exhibited anti-inflammatory activities through inhibiting NF-кB and MAPKs pathway in vitro and in vivo. J. Ethnopharmacol. 2022, 296, 115489. [Google Scholar] [CrossRef] [PubMed]
- Guo, H.; Wu, Q.; Chen, D.; Jiang, M.; Chen, B.; Lu, Y.; Li, J.; Liu, L.; Chen, S. Absolute configuration of polypropionate derivatives: Decempyrones A–J and their MptpA inhibition and anti-inflammatory activities. Bioorganic Chem. 2021, 115, 105156. [Google Scholar] [CrossRef] [PubMed]
- Zhou, X.; Cao, C.Y.; Wan, A.T.-Y.; Yue, G.G.-L.; Kwok, F.H.-F.; Fung, K.-P.; Sun, H.; Lau, C.B.-S.; Puno, P.-T.; Tsui, S.K.-W. Functional roles of eriocalyxin B in zebrafish revealed by transcriptome analysis. Mol. Omics 2018, 14, 156–169. [Google Scholar] [CrossRef] [PubMed]
- Haneen, A. , Noor, A. H., Chandrabose, K., Elangovan, M., Alexander, W., Frederick, E.W., Temesgen, S., Piyush, T., Charies, R.A., Amit. K.T. HM015k, a novel silybin derivative, multi-targets metastatic ovarian cancer cells and is safe in zebrafish toxicity studies. Front. Pharmacol. 2017, 8, 498–515. [Google Scholar]
- Liu, Y. , Zhang, X. , Zhang, J.P., Zhang, J.P., Hu, C.Q. Construction of a quantitative structure activity relationship (QSAR) model to predict the absorption of cephalosporins in zebrafifish for toxicity study. Front. Pharmacol. 2019, 10, 1–10. [Google Scholar]
- Chen, J.; Li, D.-L.; Xie, L.-N.; Ma, Y.-R.; Wu, P.-P.; Li, C.; Liu, W.-F.; Zhang, K.; Zhou, R.-P.; Xu, X.-T.; et al. Synergistic anti-inflammatory effects of silibinin and thymol combination on LPS-induced RAW264.7 cells by inhibition of NF-κB and MAPK activation. Phytomedicine 2020, 78, 153309. [Google Scholar] [CrossRef]
- Zhen, D.; Xuan, T.-Q.; Hu, B.; Bai, X.; Fu, D.-N.; Wang, Y.; Wu, Y.; Yang, J.; Ma, Q. Pteryxin attenuates LPS-induced inflammatory responses and inhibits NLRP3 inflammasome activation in RAW264.7 cells. J. Ethnopharmacol. 2021, 284, 114753. [Google Scholar] [CrossRef] [PubMed]
- Huang, X.; Wang, M.; Wang, C.; Hu, W.; You, Q.; Yang, Y.; Yu, C.; Liao, Z.; Gou, S.; Wang, H. Dual-targeting antitumor conjugates derived from platinum(IV) prodrugs and microtubule inhibitor CA-4 significantly exhibited potent ability to overcome cisplatin resistance. Bioorganic Chem. 2019, 92, 103236. [Google Scholar] [CrossRef] [PubMed]
- Yang, Y.; Yang, X.; Zhang, X.; Song, Z.; Liu, F.; Liang, Y.; Zhang, J.; Jin, D.-Q.; Xu, J.; Lee, D.; et al. Bioactive terpenoids from Euonymus verrucosus var. pauciflorus showing NO inhibitory activities. Bioorganic Chem. 2019, 87, 447–456. [Google Scholar] [CrossRef] [PubMed]
- Xi, Y.; An, L.; Yang, X.; Song, Z.; Zhang, J.; Tuerhong, M.; Jin, D.-Q.; Ohizumi, Y.; Lee, D.; Xu, J.; et al. NO inhibitory phytochemicals as potential anti-inflammatory agents from the twigs of Trigonostemon heterophyllus. Bioorganic Chem. 2019, 87, 417–424. [Google Scholar] [CrossRef]
- Trott, O.; Olson, A.J. AutoDock Vina: Improving the speed and accuracy of docking with a new scoring function, efficient optimization, and multithreading. J. Comput. Chem. 2010, 31, 455–461. [Google Scholar] [CrossRef]

| Position | 1a | 2b | ||
|---|---|---|---|---|
| δH, Mult, (J in Hz) | δC | δH, Mult, (J in Hz) | δC | |
| 1 | 2.47, m; 2.59, m | 24.2 | 1.34, m; 1.59, m | 35.9 |
| 2 | 2.51, m | 38.4 | 1.41, m 1.55, m |
18.4 |
| 3 | - | 214.7 | 1.10, m; 1.24, m | 44.5 |
| 4 | - | 52.1 | - | 33.5 |
| 5 | - | 130.3 | 1.68, d, (2.4) | 46.7 |
| 6 | 5.43, t, (2.8) | 68.5 | 5.23, dd, (5.6, 2.8) | 69.5 |
| 7 | 1.71, m | 36.0 | 1.35, m 1.62, m |
32.2 |
| 8 | 1.85, m | 34.5 | 2.02, m | 31.1 |
| 9 | - | 42.6 | - | 75.6 |
| 10 | - | 149.8 | - | 43.4 |
| 11 | 1.56, m | 30.0 | 1.37, m 1.57, m |
33.0 |
| 12 | 1.21, m 1.63, m |
40.4 | 2.23, t, (7.2) | 22.5 |
| 13 | - | 73.9 | - | 139.5 |
| 14 | 5.87, dd, (17.6, 10.8) | 146.2 | 6.79, s | 135.3 |
| 15 | 5.05, dd, (10.8, 2.0) 5.20, dd, (17.6, 2.0) |
112.4 | 3.96, s | 51.5 |
| 16 | 1.15, s | 27.7 | - | 170.8 |
| 17 | 1.04, d, (7.2) | 16.6 | 0.85, d, (6.8) | 16.0 |
| 18 | 4.05, d, (10.8) 4.20, d, (10.8) |
69.5 | 0.94, s | 23.5 |
| 19 | 1.18, s | 20.1 | 0.88, s | 33.4 |
| 20 | 1.24, s | 27.5 | 1.19, s | 19.0 |
| 21 | - | 172.2 | - | 169.9 |
| 22 | 1.98, s | 20.7 | 1.98, s | 21.6 |
| 23 | - | 172.4 | 3.38, t, (5.8) | 43.5 |
| 24 | 2.00, s | 21.5 | 3.50, t, (5.8) | 59.5 |
| Position | 3a | 4a | ||
|---|---|---|---|---|
| δH, Mult, (J in Hz) | δC | δH, Mult, (J in Hz) | δC | |
| 1 | 1.25, m; 1.51, m | 33.7 | 1.21, m; 1.48, m | 33.7 |
| 2 | 1.55, m; 1.72, m | 18.9 | 1.66, m; 1.53, m | 18.9 |
| 3 | 1.89, m; 1.75, m | 37.4 | 1.87, m | 37.3 |
| 4 | - | 39.3 | - | 39.2 |
| 5 | 1.86, d, (2.4) | 51.7 | 1.81, d, (2.4) | 51.4 |
| 6 | 5.51, dd, (5.6, 2.8) | 70.7 | 5.48, q, (2.4) | 70.7 |
| 7 | 1.75, m; 1.00, m | 37.1 | 1.70, m; 0.97, m | 37.0 |
| 8 | 2.24, m | 33.2 | 2.27, m | 33.1 |
| 9 | - | 103.3 | - | 101.5 |
| 10 | - | 44.2 | - | 43.9 |
| 11 | 2.31, m; 1.98, m | 25.8 | 2.36, m; 2.06, m | 26.7 |
| 12 | 2.96, m | 30.1 | 3.20, m | 30.9 |
| 13 | - | 183.6 | - | 186.6 |
| 14 | 5.09, d, (8.8) | 100.7 | 5.55, dt, (8.0, 2.0) | 101.7 |
| 15 | 9.86, d, (8.8) | 190.7 | 9.49, d, (8.0) | 193.2 |
| 17 | 0.88, d, (6.4) | 15.8 | 0.85, d, (6.4) | 15.7 |
| 18 | 4.13, dd, (11.2, 1.6) 4.48, d, (11.2) |
67.6 | 4.41, dd, (11.2, 1.6) 4.47, d, (11.2) |
67.6 |
| 19 | 1.05, s | 27.4 | 1.03, s | 27.4 |
| 20 | 1.33, s | 20.7 | 1.34, s | 20.7 |
| 21 | - | 173.1 | - | 173.1 |
| 22 | 2.03, s | 20.5 | 2.03, s | 20.6 |
| 23 | - | 172.0 | - | 172.0 |
| 24 | 2.10, s | 21.8 | 2.09, s | 21.8 |
| Compounds | Protein | -Log(FBE) | Targeting Residues | |||
|---|---|---|---|---|---|---|
| 4 | iNOS | -5.862 | Tyr341 | Arg375 | Trp84 | Val346 |
| COX-2 | -6.722 | Tyr348 | Val523 | Arg120 | Tyr355 | |
Disclaimer/Publisher’s Note: The statements, opinions and data contained in all publications are solely those of the individual author(s) and contributor(s) and not of MDPI and/or the editor(s). MDPI and/or the editor(s) disclaim responsibility for any injury to people or property resulting from any ideas, methods, instructions or products referred to in the content. |
© 2023 by the authors. Licensee MDPI, Basel, Switzerland. This article is an open access article distributed under the terms and conditions of the Creative Commons Attribution (CC BY) license (http://creativecommons.org/licenses/by/4.0/).


