1. Introduction
One of the most efficient thermal methods in the recovery of heavy and extra heavy oil from reservoirs is the steam-assisted gravity drainage (SAGD) technique, which was proposed and developed by Butler
et al [
1,
2,
3,
4] in the 1980’s. The SAGD process involves the injection of hot steam, at constant pressure, into the reservoir through an horizontal upper pipe and the extraction of condensates and water/oil emulsions through the parallel pipe located beneath the injection pipe. Incidentally, there are estimations that heavy oil reserves account for more than 70% of the world’s oil reserves [
5]. SAGD operations require large amounts of water (for instance, in Canada, approximately 179 million m
3 of fresh water was used in 2009 for oil sands-related extractive activities [
6]) along with a significant energy consumption. According to some calculations, losses represent more than 50% of the energy used in SAGD [
7]. Finally, a number of efforts have been made to recover and clean the water produced in the free water phase and in the water/oil emulsion, contained in the recovered fluids [
8,
9].
In the search for a strong reduction of the injected water and the wasted energy, it is crucial to understand the main physical mechanisms and conditions that control the efficient production of condensates [
10,
11,
12,
13,
14,
15]. For instance, some numerical [
12,
13] and experimental [
14,
15] studies suggest that it is possible to control the well spacing, the well placement or the injection temperature [
13] in order to optimize the oil production of heavy oil reservoirs.
By means of a simple theoretical model for a homogeneous reservoir [
10], we also found an optimal (dimensionless) injected steam mass flow rate, per unit length,
, that yields the maximal recovery of condensates or water/oil emulsions, at a given time-lapse. We predicted that this optimal value depends on the shape of the steam chamber edge, the physical properties of the reservoir, the operating parameters, including the wells spacing and placement, and the boiling and reservoir temperatures, all of them measured at a given time period of the growing stage of the chamber.
Following these latest ideas, in a recent experimental study [
16], the steam injection at various mass flow rates was carried out inside a
preformed steam chamber, made of glass beads occupying an elliptical space (with horizontal semi-major axis), in an iron slab of considerable mass. By analyzing the cumulative amounts of injected steam and recovered condensates, during a short time-lapse, we identified the optimal flow rate. Then,
a posteriori, we proceeded through visual and infrared images of such optimal process to track the motion of the condensation front until it reaches the cold solid edge (which is assumed to represent the region where the oil behaves as a solid), similarly, the time evolution of the temperature field was measured until there was no appreciable change. This method allowed us to determine when a steady-state of the steam injection was reached for a specific injected mass flow rate.
In this work we report new experimental studies related to the steam injection into preformed steam chambers of elliptical (with vertical semi-major axis) and circular cross-sectional shapes, to highlight their corresponding efficiency in the production of condensates. The use of preformed chambers embedded in highly massive slabs was conceived as an experimental set-up that reproduces the main physical characteristics of the SAGD process. Moreover, in an real life monitoring of the steam chamber formed in the oil sand layer in the lower Cretaceous McMurray formation, it was shown that the temperature distribution of the steam chamber evolved from a nearly elliptical with a horizontal semi-major axis to another ellipse with a vertical semi-major axis [
17].
It is important comment that, perhaps due to the seminal works of Butler [
1,
2,
3,
4], many theoretical and experimental works have reported the steam injection in terms of volume flow rates (see for instance [
7,
11,
14,
18,
19]). However, measuring gas flow using a volumetric flow meter, temperature and pressure measurement are required, along with the gas density, to convert volumetric flow to mass flow. One of the advantages of measuring gas mass flow, is that the mass does not change with temperature or pressure. Mass flow measurement is known to offer more reliable, accurate, and more repeatability data when compared with volumetric flow methods. Consequently, our main results for gas or liquid flows, will be given in terms of mass flow rates.
To reach our goals, the division of this work is as follows: in the next Section we provide the analytical expressions describing the shape of the chambers studied in the experiments. Also, we briefly discuss the main physical parameters involved in the determination of the optimal recovery of the condensates. Later on, in
Section 3, the experimental set-up will be presented. There, we will discuss the evolution of the transient condensation fronts in the elliptical and circular steam chambers and later on we will report measurements of the temperature fields in the chambers to also determine the steady-state phase change temperatures, close to the steam chamber edges. In
Section 4, the injected steam and the accumulated quantities of recovered condensates allows us to present, in a dimensionless form, the plots of the recovery efficiency of condensates for the elliptical and circular steam chambers. Finally, in
Section 5, the main conclusions and limitations of this study will be presented.
4. Optimal injected mass flow rates in the steam chambers
The aim of the current work is to demonstrate that, once the steady-state conditions have been reached, different shapes of the chamber edge yield unique values of the dimensionless optimal mass flow rate per unit length . To reach this goal we measured, during a given time period , the accumulated mass of injected steam and the corresponding recovered mass of water, because, as it has been argued before, this last quantity must be proportional to the drained oil at the recovery orifice, in experiments with oil-saturated steam chambers. We also need to mention that in some cases, due to an inefficient condensation of steam close to the edge of the steam chamber, in addition to the output water, an unrecoverable amount of steam is released into the atmosphere as a hot turbulent jet of steam that is bent round upwards by the gravitational field. Along with these measurements, the mass flow rate of injected steam per unit length, is also known, .
For the preformed
elliptical chambers we injected steam at
K, we repeated each injection experiment three times and the injection and recovery cycle in this case lasts
s. The amount of steam injected during a time period
, is quantified as
, meanwhile the mass of water recovered in the same period is
, and the mass flow rate of water recovered is
. A measure of the efficiency of the steam injection can be estimated through the factor of recovery efficiency,
, defined as the ratio of the mass of water recovered to the mass of injected steam
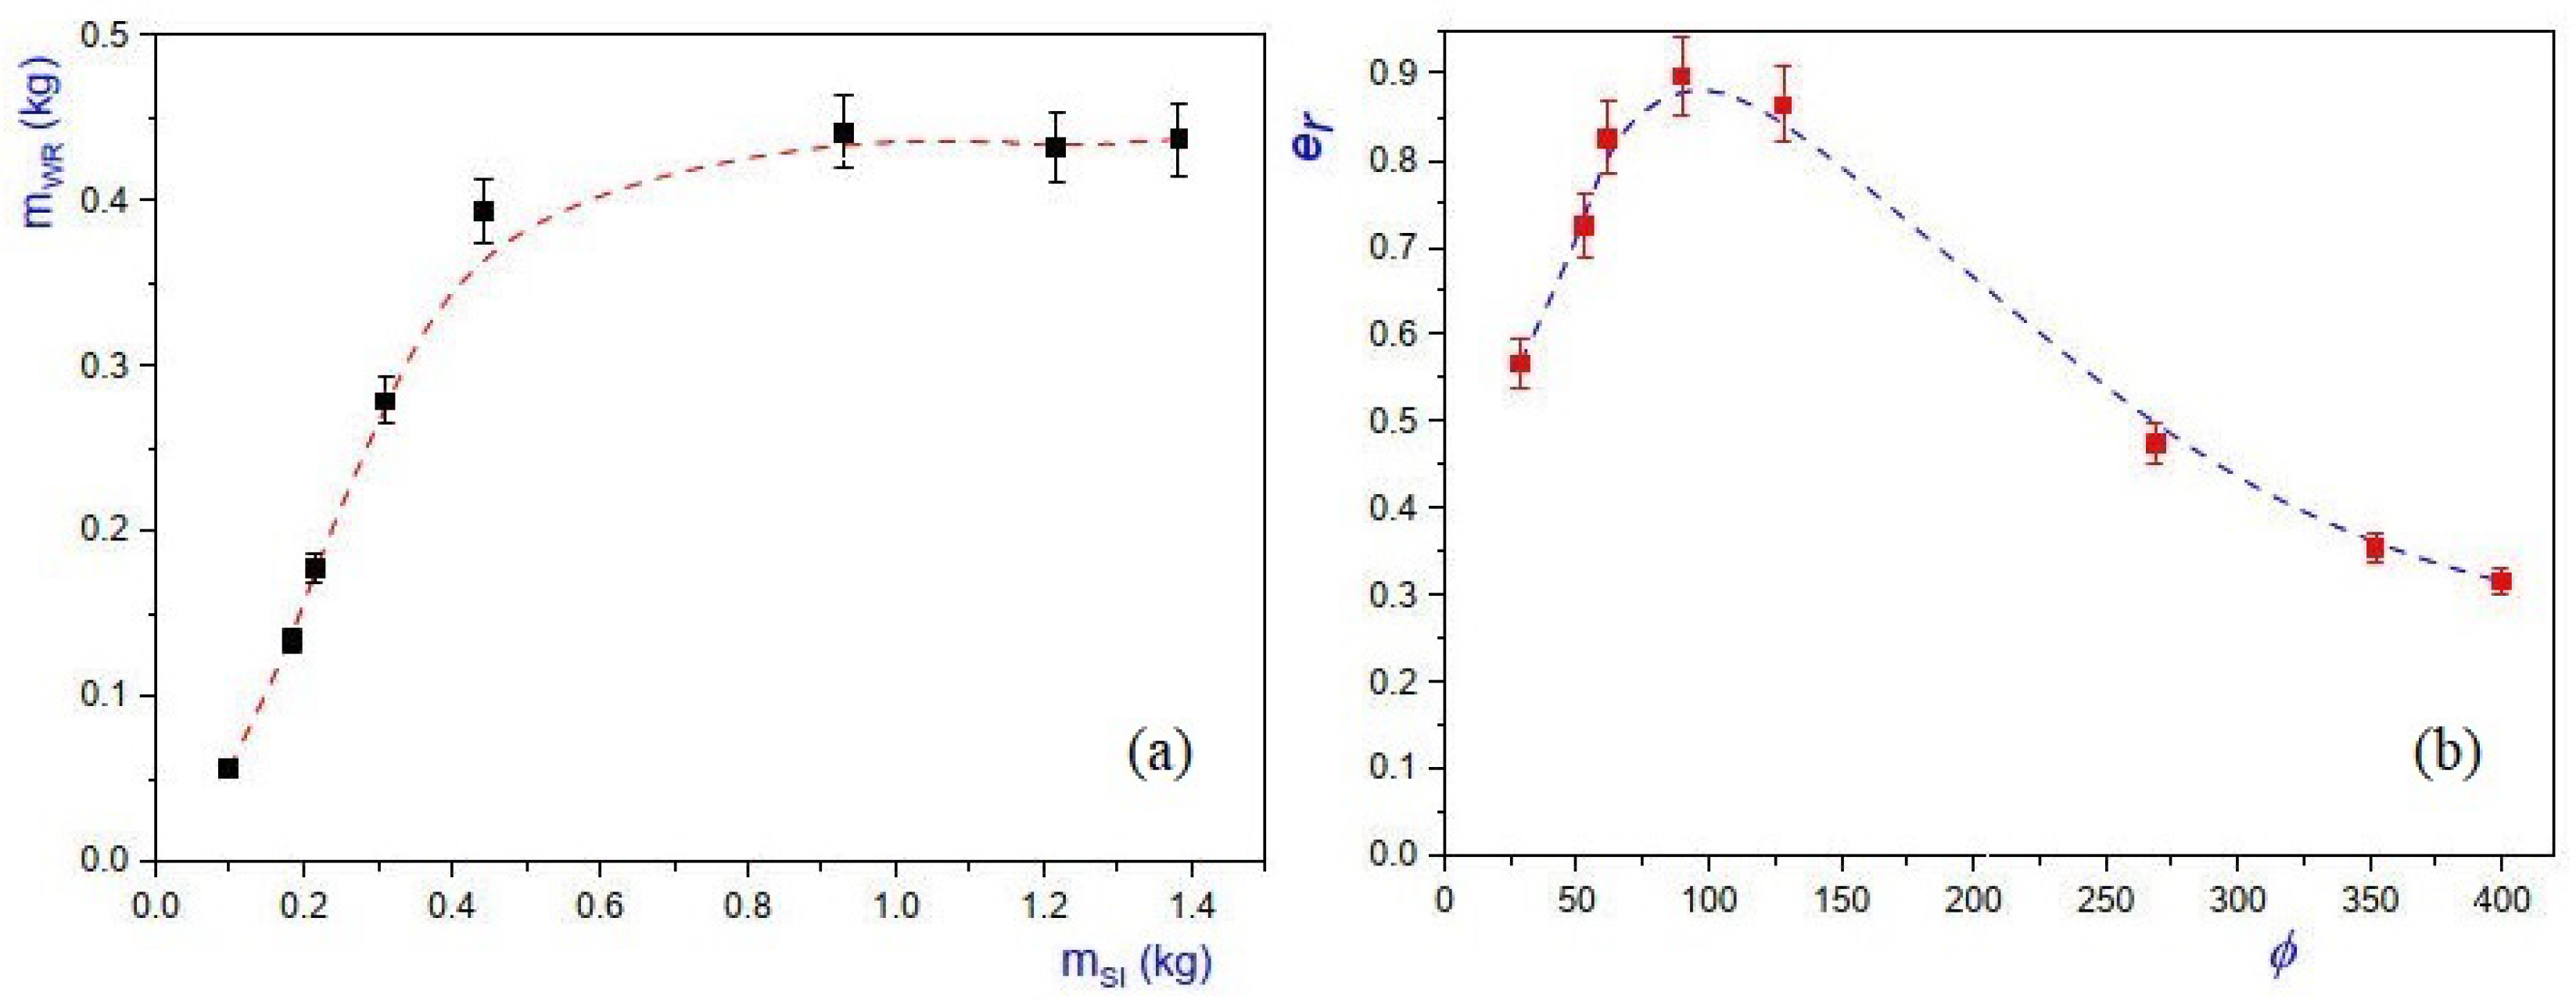
In
Figure 12(a) we show the plot of the mass of water recovered
, as a function of the mass of the injected steam
and in
Figure 12(b) the plot of the recovery efficiency
, as function of the dimensionless injected mass flow rate per unit length
, is given. Clearly, from the plot of
Figure 12(b) it can be concluded that the dimensionless injected optimal mass flow rate per unit length is
and at this value the recovery efficiency is close to 90%, i.e.,
.
We emphasize that the plots for the transient flow in the elliptical chamber, given in Figs 4-7, were selected once the optimal mass flow rate of recovered water was determined. Knowledge of the optimal value helps to get, from
Figure 7, an estimate of the value of the boiling temperature
K, we also know from experiments that
K. For completeness, other data measured includes the mean temperature of the reservoir
and the dimensionless radius is
. The water dynamic viscosity and density at temperature
have the values
Pa·s,
kg/m
3 and the latent heat is
kJ/kg, meanwhile the effective thermal conductivity of the steam saturated medium (with thermal conductivity of the glass beads
W/m·K and thermal conductivity of the steam
W/m·K) is
W/m·K and the specific heat of the steam at
is
kJ/kg·K [
26]. Consequently the dimensionless parameter given in (
2) are:
,
and
, the dimensionless condensate film thickness for the optimal mass flow rate is
.
For the
circular chambers steam was injected during
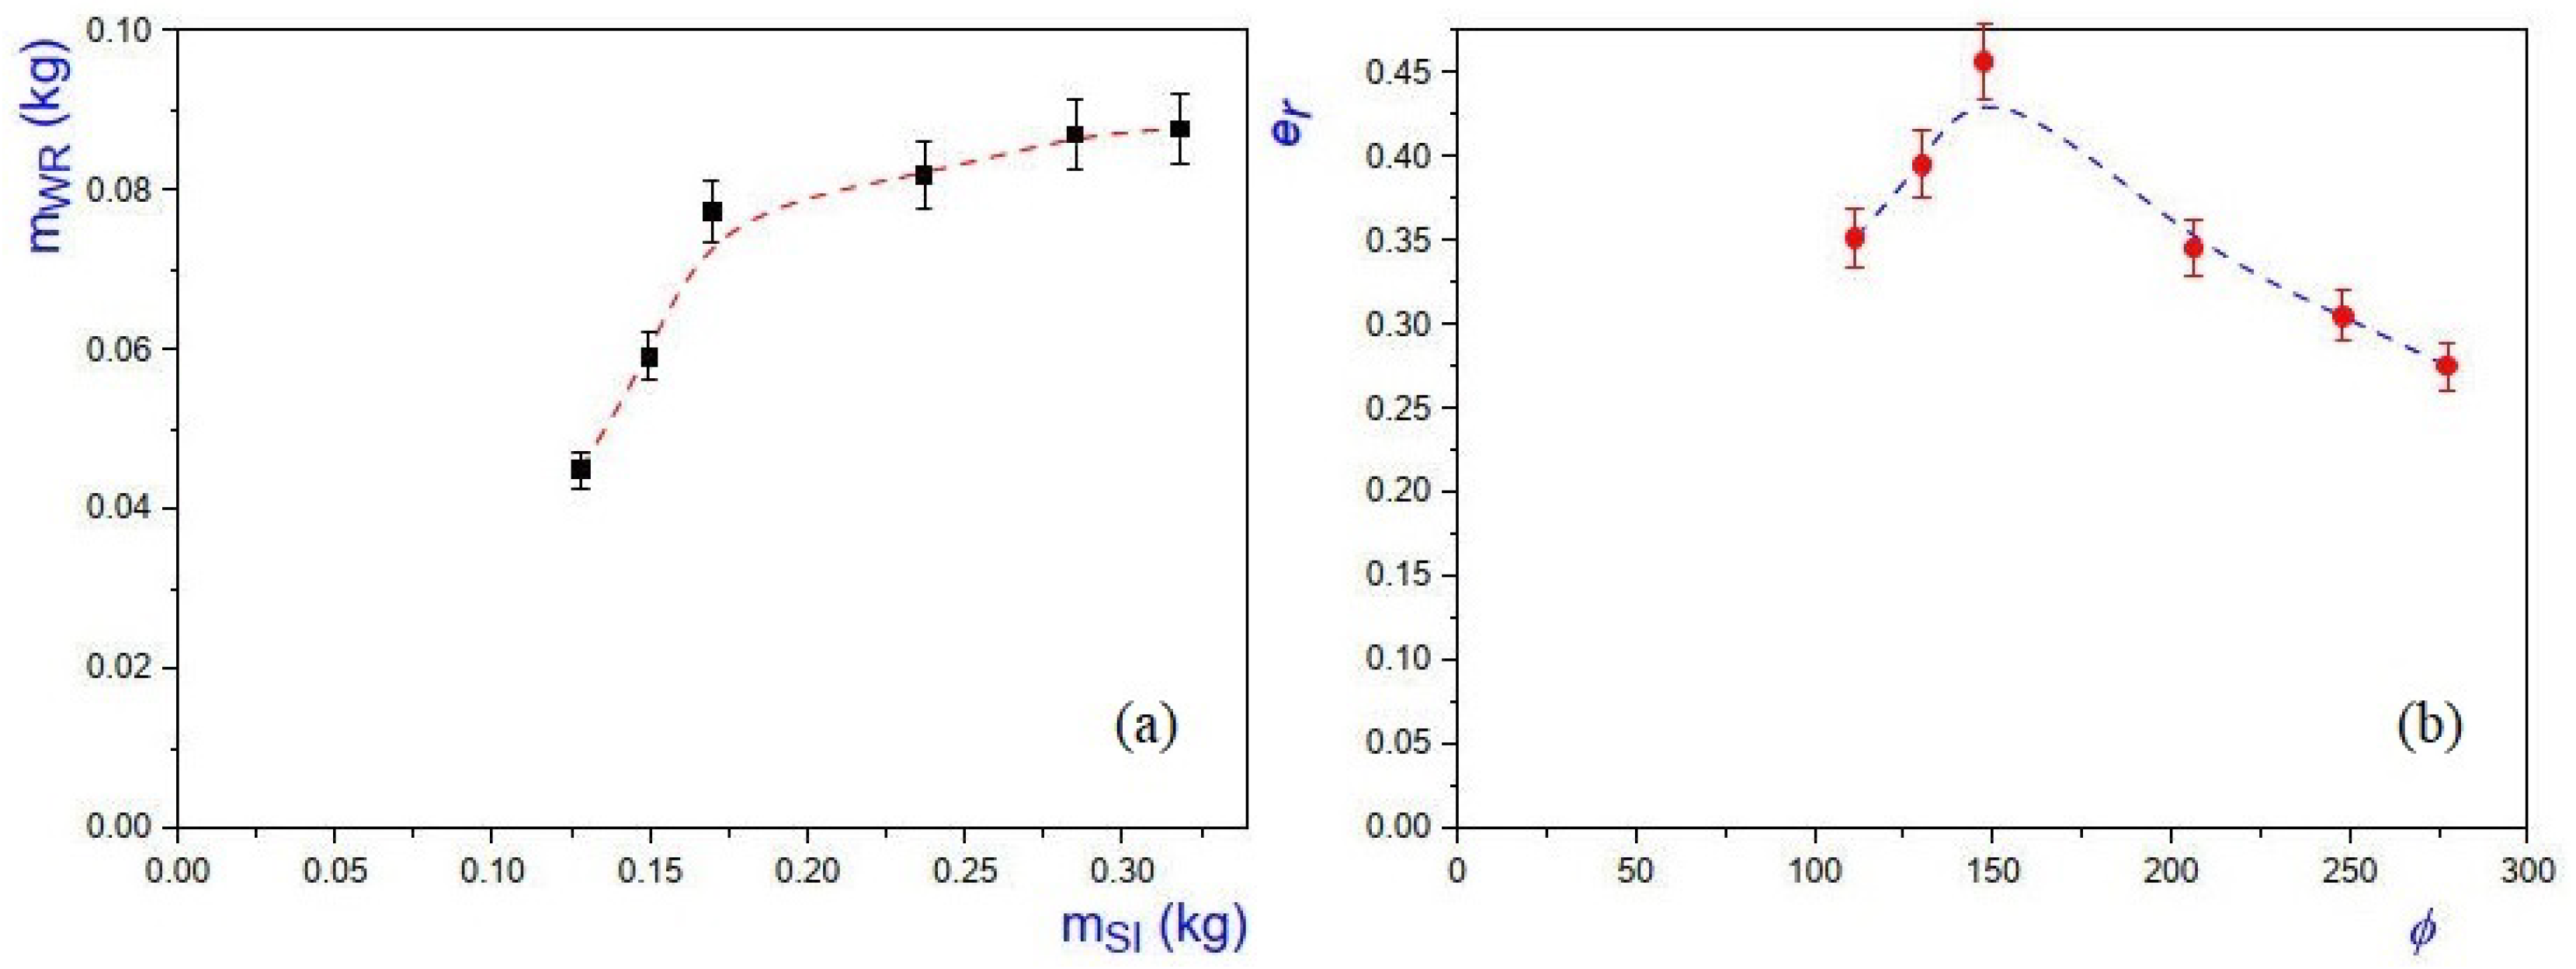
s and in
Figure 13(a) we present the plot of the mass of water recovered
, as a function of the mass of the steam injected
. In Fig. 13(b) we provide the plot of the recovery efficiency
, as function of the dimensionless injected mass flow rate per unit length
, we found that the optimal dimensionless mass flow rate per unit length is
and the recovery factor is
.
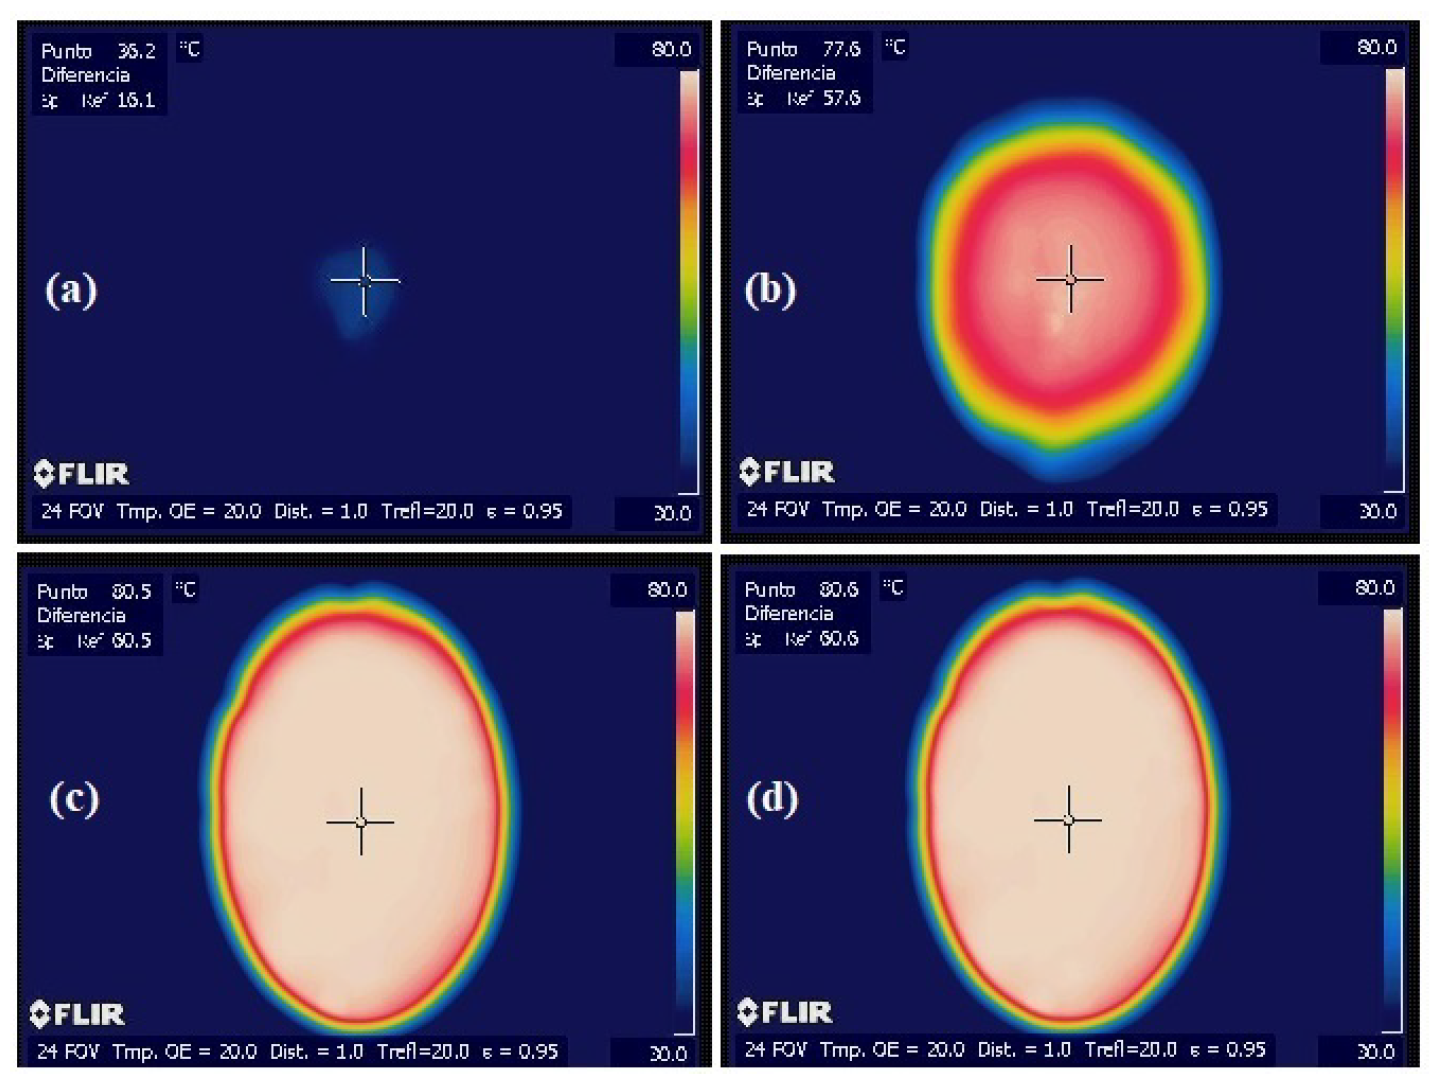
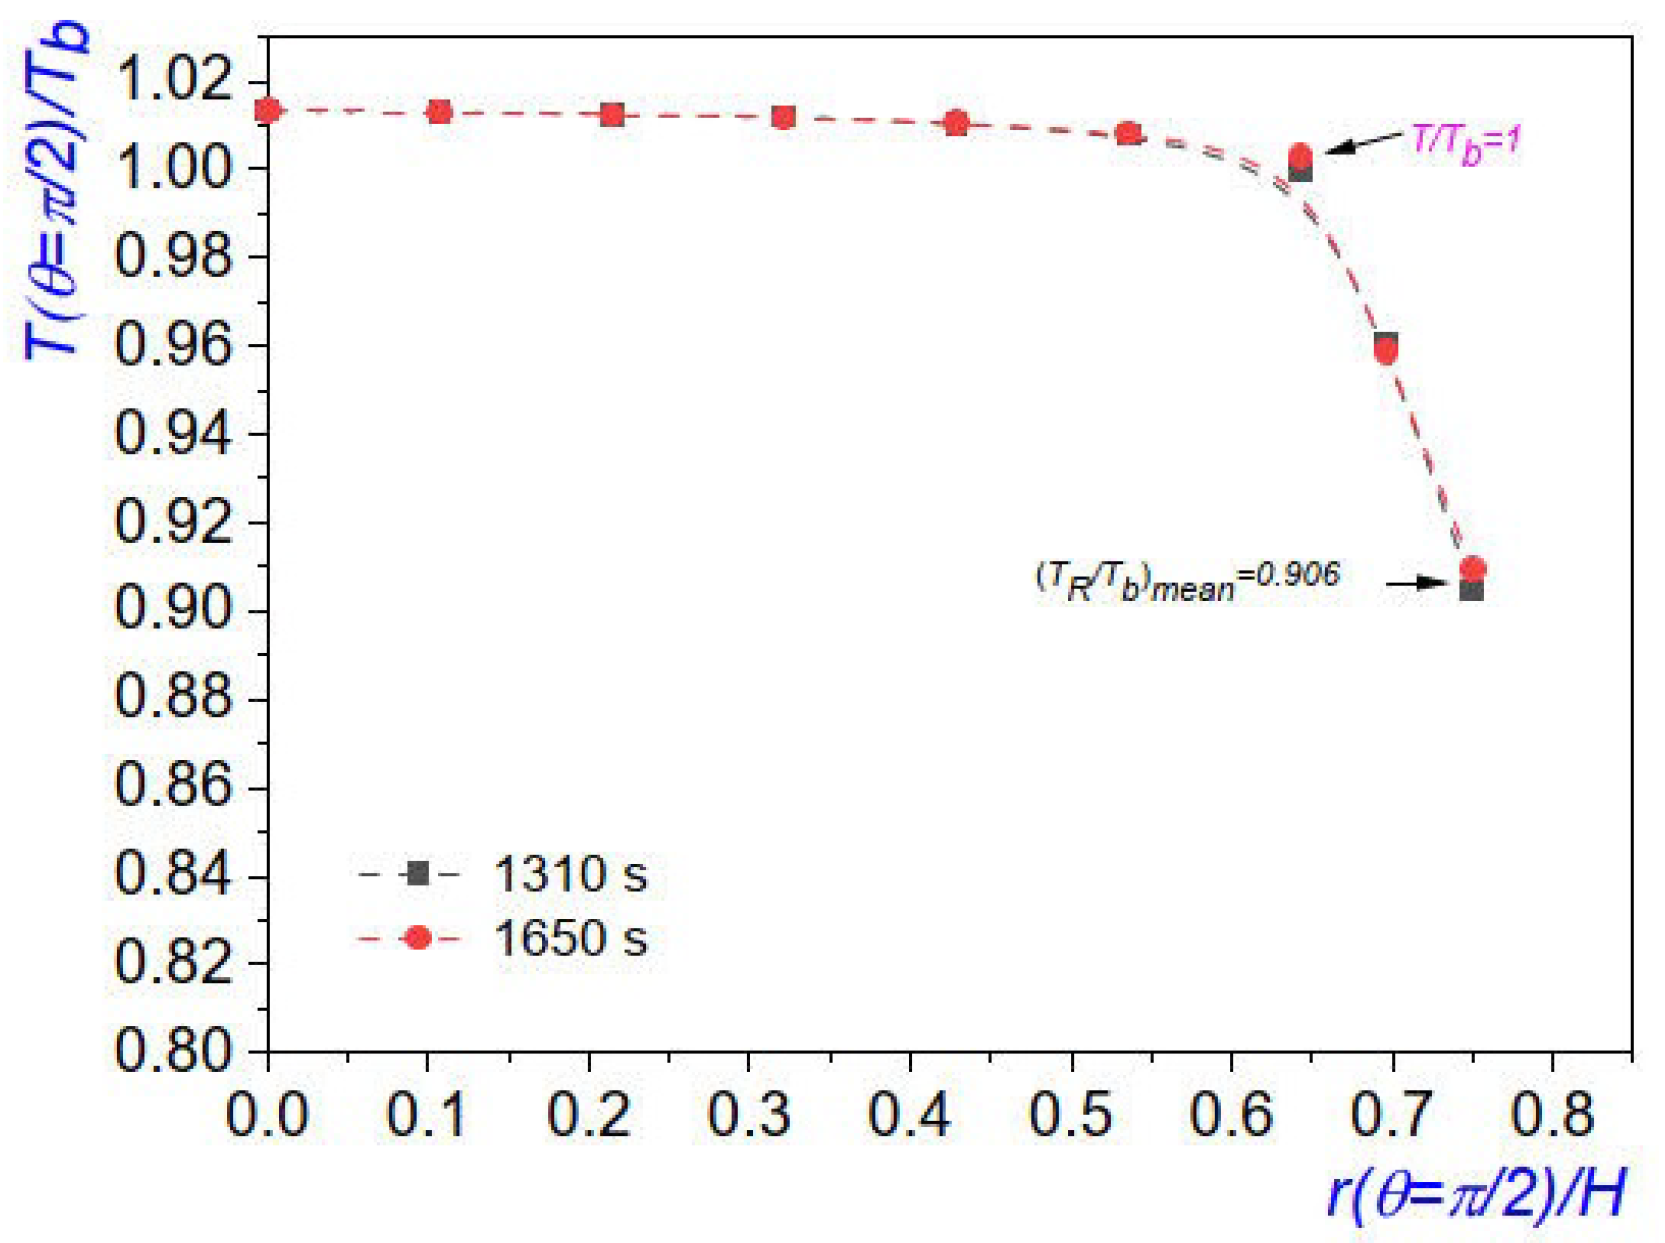
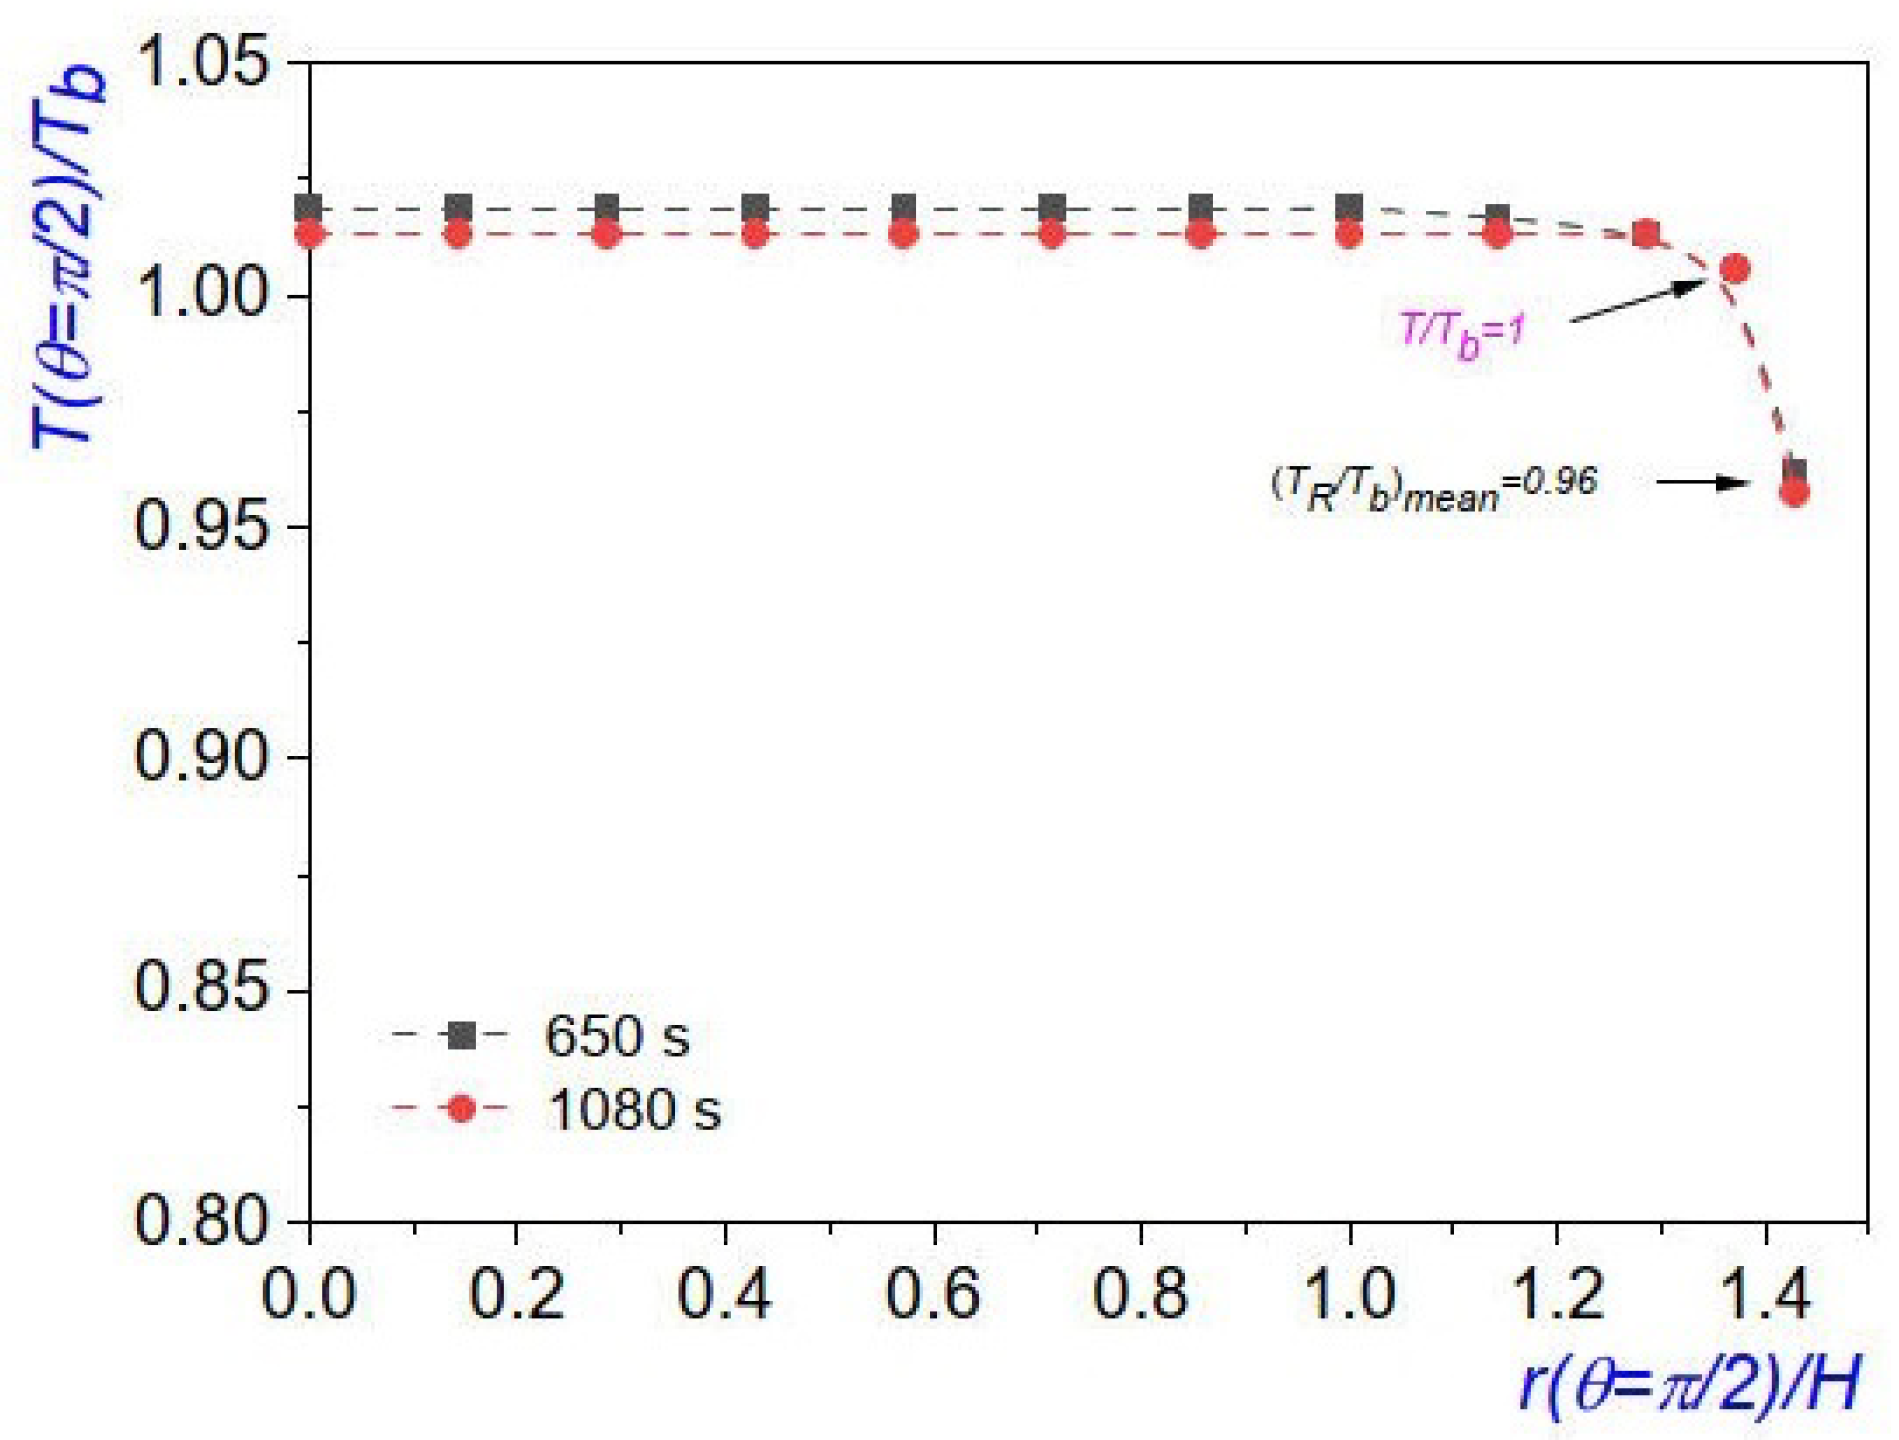
In this case, from
Figure 11 we found the boiling temperature to be
K,
K. The other data measured were and
m, the mean temperature of the reservoir
and the dimensionless radius is
. The water dynamic viscosity and density at temperature
have the values
Pa·s and
kg/m
3 and the latent heat is
kJ/kg, meanwhile the effective thermal conductivity of the steam saturated medium is
W/m·K and the specific heat of the steam at
is
kJ/kg·K [
26]. Consequently the dimensionless parameter given in (
2) are:
,
and
. In this case the dimensionless condensate film thickness for the optimal mass flow rate is estimated as
.
In summary, plots 12(a) and 13(a) confirm the prediction of the theoretical model [
10]: that if the injected mass flow rate is larger than
, then a fraction of the steam reaches the production pipe without condensing inside the chamber; meaning that in an actual exploitation under a SAGD process, considerable amounts of steam are wasted. Even more, the model also predicts that if the injected flow rate is smaller than
, then the steam cools down and condenses rapidly, before it reaches the chamber wall, thus explaining the production of water between 45-65% of the mass of injected steam, for low flow rates in the elliptic chamber and 35-43% in the circular chamber. In conclusion, the cases when
is far from
imply, for real processes, that a large amount of water and energy are wasted.
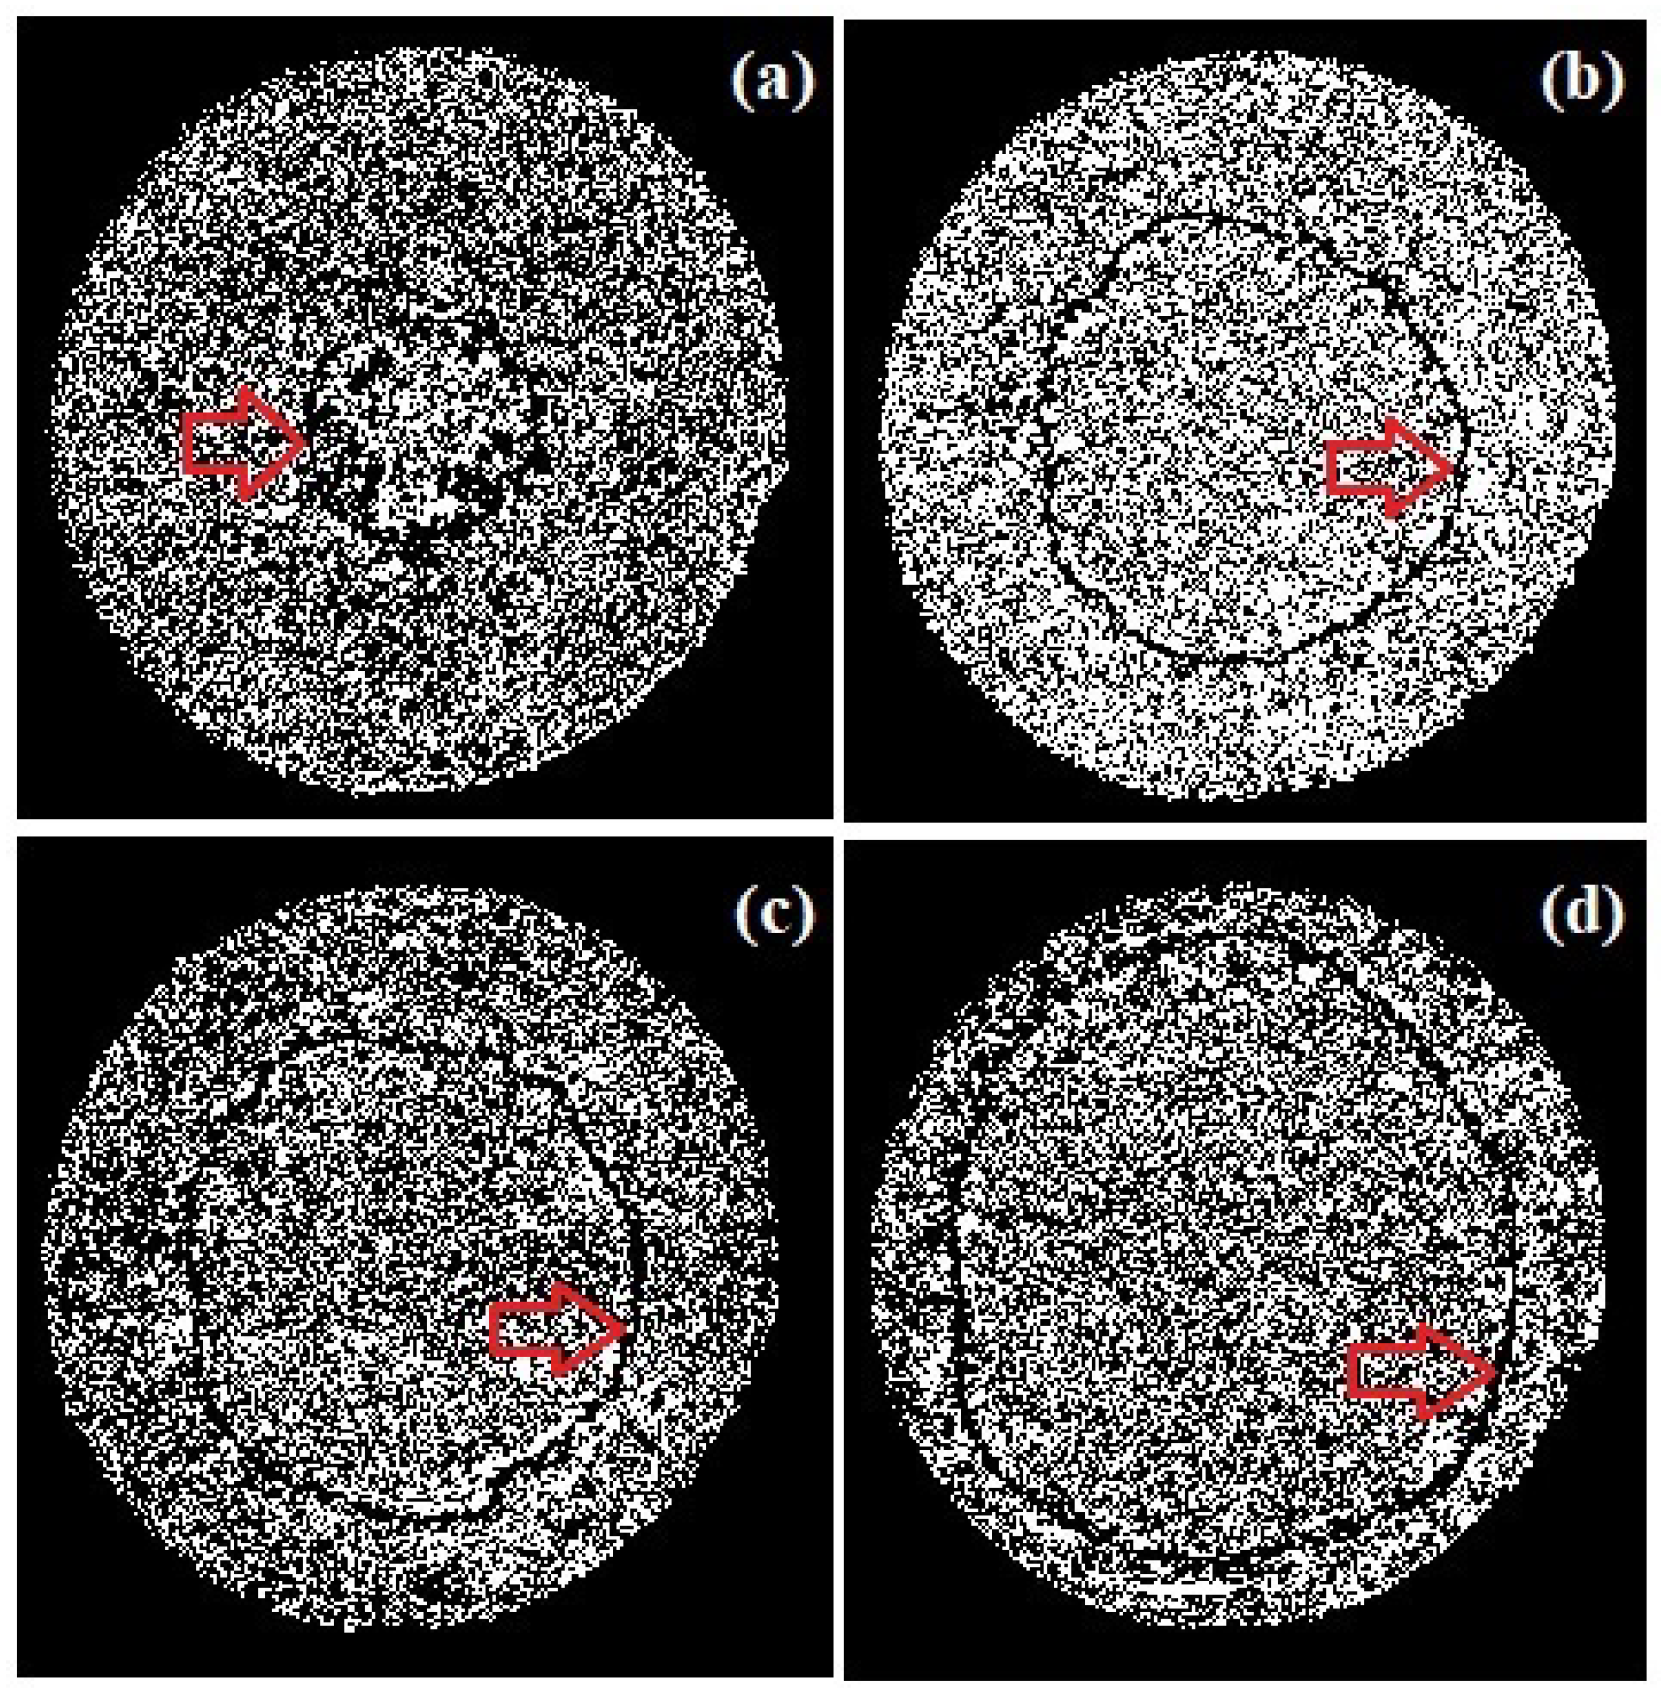
It should be mentioned that, by following the evolution of the condensation front we can confirm that the condensation must occur at the steam chamber edge (Figs. 4 and 8), however in our experiments the condensate water
wets the cast iron edge [
27] of the preformed steam chamber. Such conditions produce a substrate coated with a water film that absorbs the water drops contacting the film [
28]. On the contrary, in actual SAGD processes, the condensate water does not wets the steam chamber edge which essentially is in the base oil phase,
i.e., both fluids are immiscible, however, the produced fluids in the SAGD recovery method have been reported to be in emulsion form (the most common range of emulsified water in light crudes (> 20 API) of 5–20 vol% and 10–35 vol% in heavier crudes (< 20 API) [
29,
30], this shows that emulsification is more severe in hydrocarbon recovery from the heavy crude reservoirs). Recent studies have shown that when an aqueous drop contacts an immiscible oil film, it displays complex interfacial dynamics. When the spreading factor is positive, upon contact, the oil spreads onto the drop’s liquid–interface, first forming a liquid bridge whose curvature drives an apparent drop spreading motion and later engulfs the drop [
28]. Consequently, more careful studies correlating both types of liquid films will be performed in order to complement our experiments in preformed steam chambers.
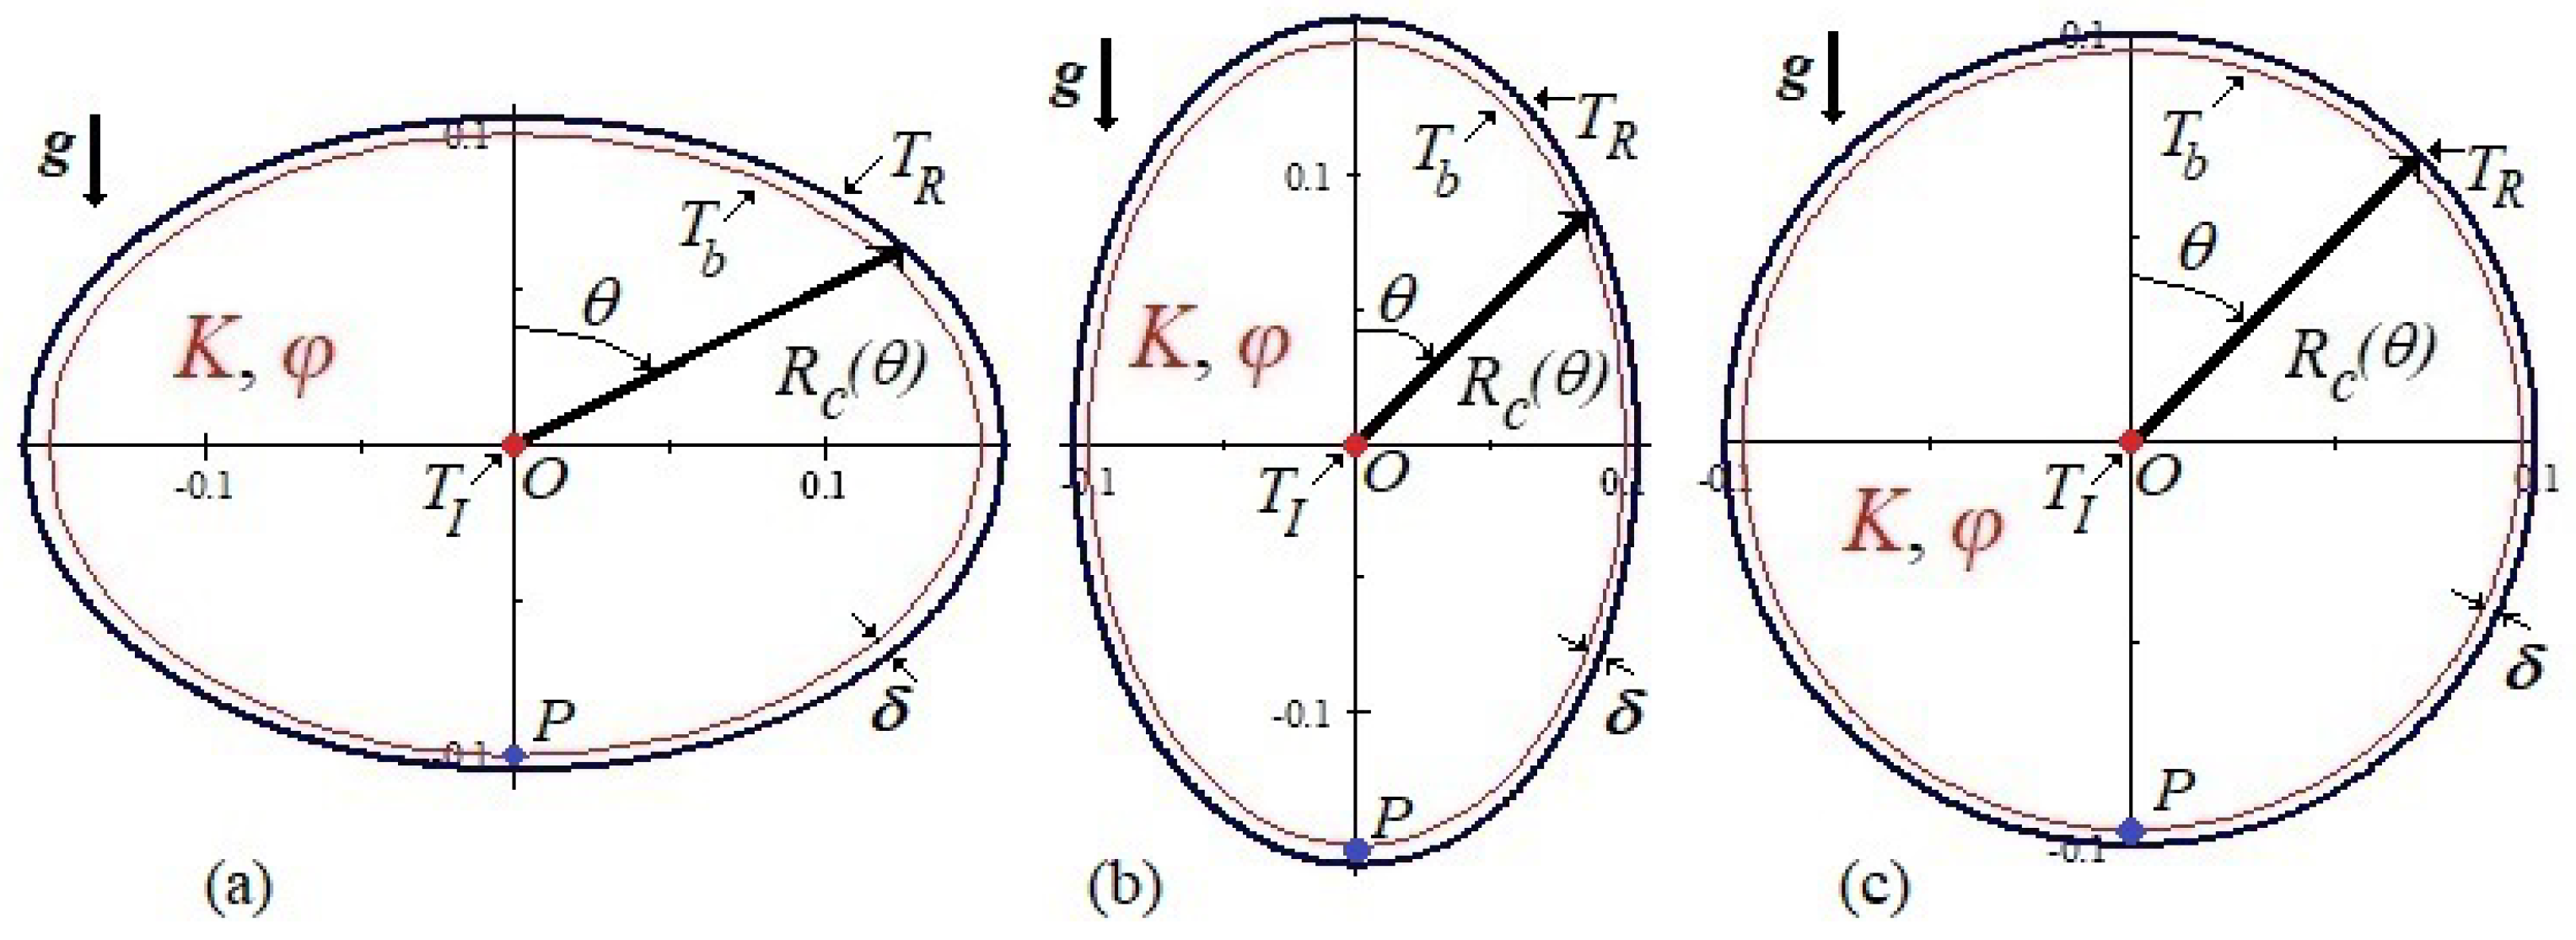
Figure 1.
Schematics of the cross-sectional regions of the preformed steam chambers with the injection pipe (red dot) at the center and the recovery pipe (blue dot) lying at the bottom. All chambers have symmetric shapes with a generic equation of the edge,
, given by Eq. (
1): (a) ellipse with horizontal semi-major axis, (b) ellipse with vertical semi-major axis and (c) circumference. Through the thin layer of mean thickness
, the water/oil emulsion drains by gravity to the production pipe. Scales on the axes are in meters.
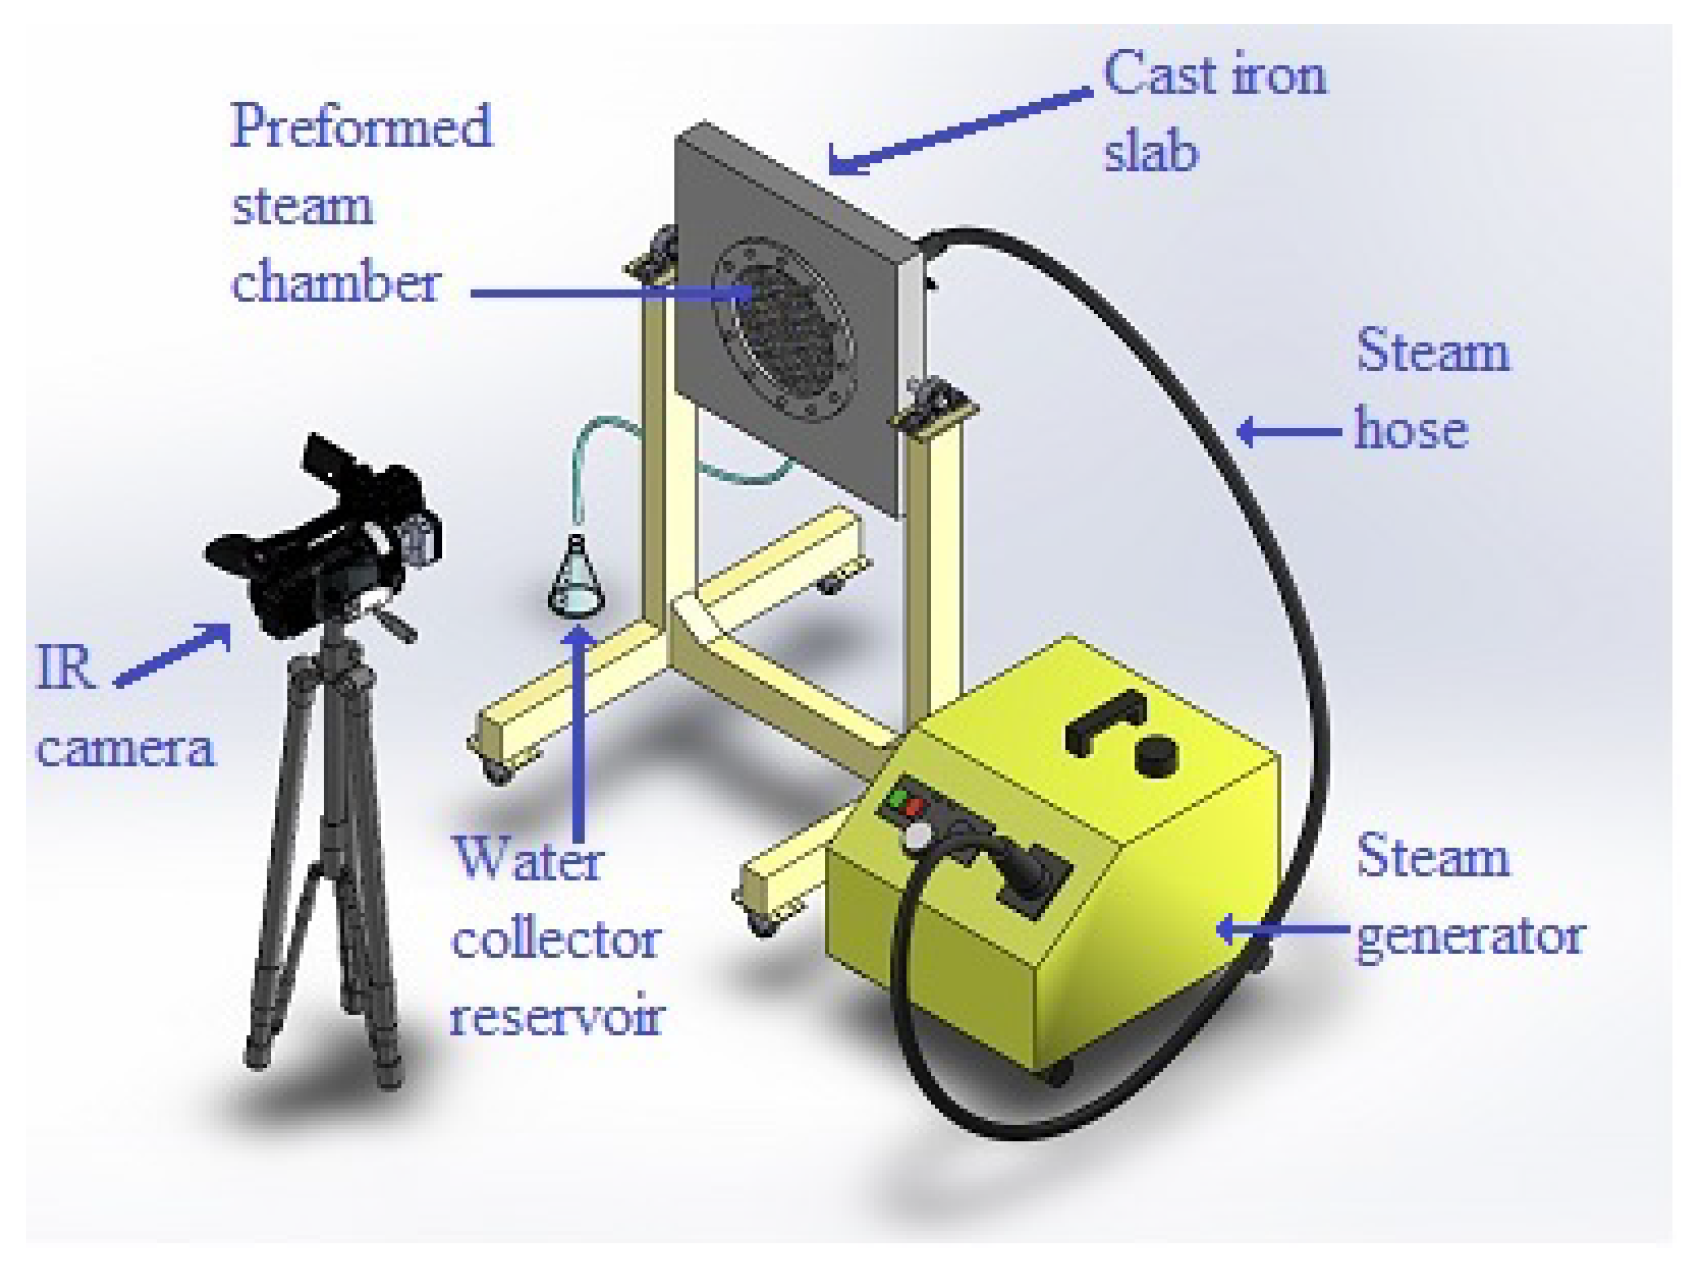
Figure 2.
Experimental set-up for the real time observation of steam injection into a preformed steam chamber enclosed in a metallic slab.
Figure 2.
Experimental set-up for the real time observation of steam injection into a preformed steam chamber enclosed in a metallic slab.
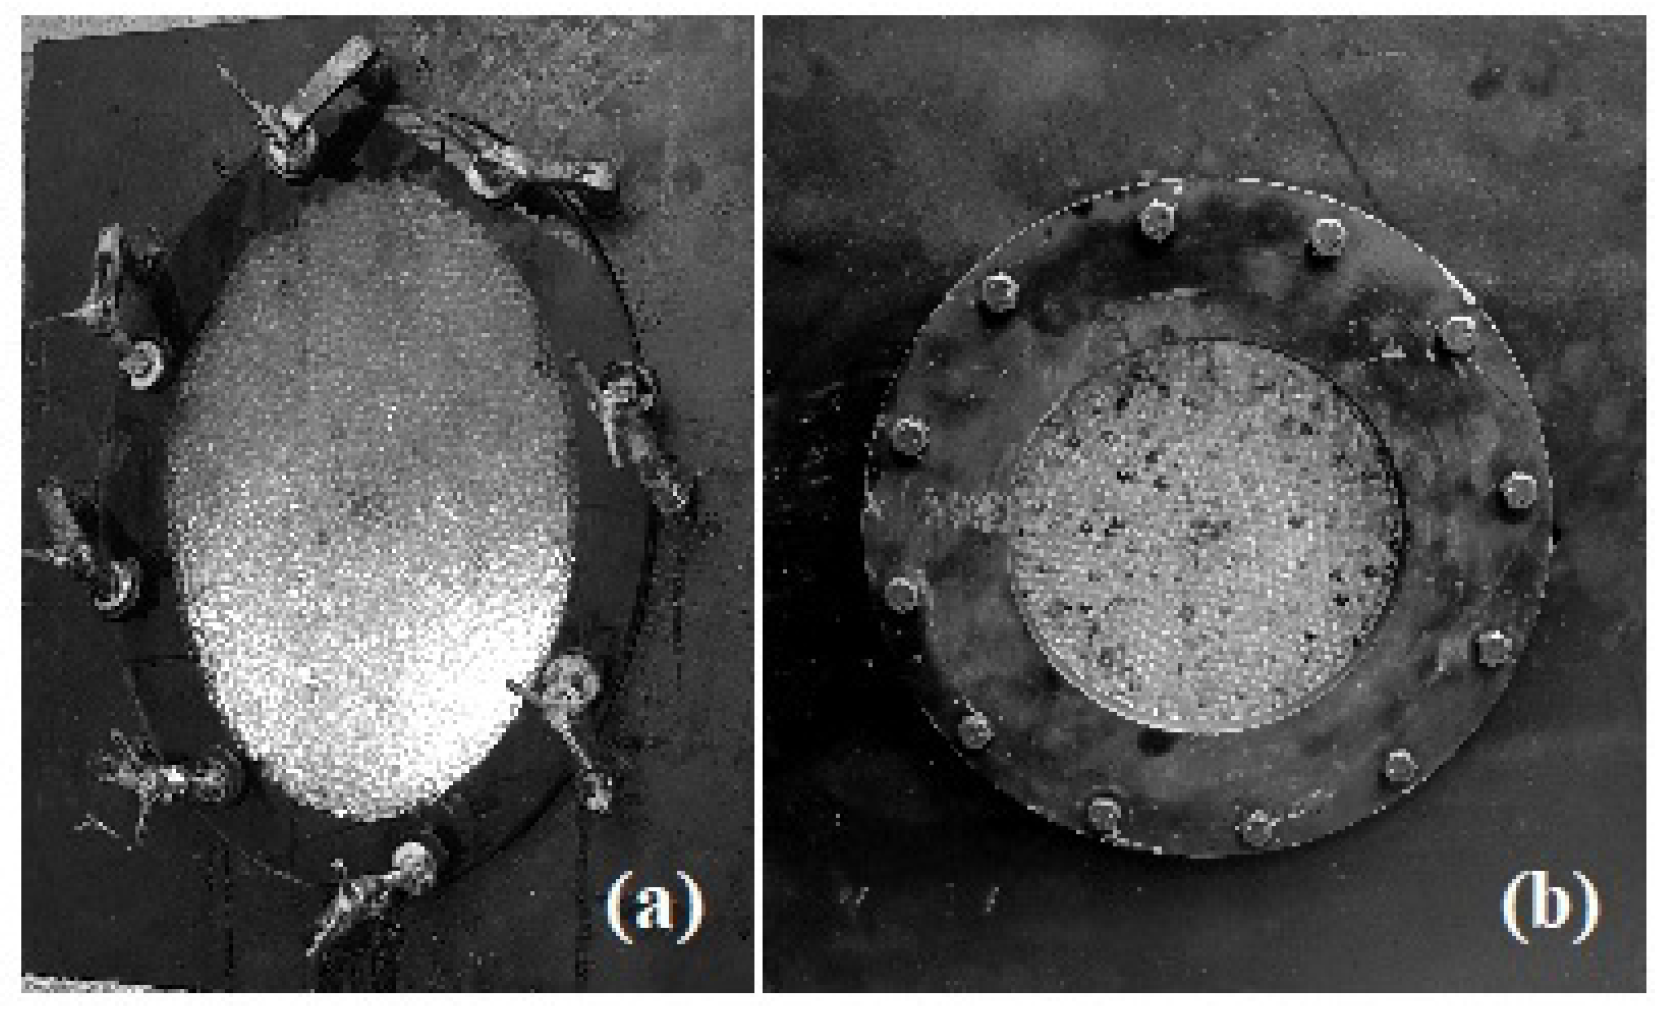
Figure 3.
Pictures of the preformed steam chambers filled with glass beads with a nominal diameter of 6 mm: (a) elliptical chamber and (b) circular chamber. The injection and recovery orifices were placed at the back plates.
Figure 3.
Pictures of the preformed steam chambers filled with glass beads with a nominal diameter of 6 mm: (a) elliptical chamber and (b) circular chamber. The injection and recovery orifices were placed at the back plates.
Figure 4.
Images of the evolution of the condensation fronts during steam injection into an elliptical preformed chamber at K. In this case, the condensation front was made visible by digital image substraction. The front is visible at (a) s, (b) s, (c) s, and (d) s, at this last instance, the front eventually reaches all places of the edge of the steam chamber.
Figure 5.
Plots of the dimensionless condensation front
along the vertical (
) and horizontal (
) simmetry lines for different times. In this case
m, as referred in
Section 2. Some measurements were made from images in
Figure 4.
Figure 5.
Plots of the dimensionless condensation front
along the vertical (
) and horizontal (
) simmetry lines for different times. In this case
m, as referred in
Section 2. Some measurements were made from images in
Figure 4.
Figure 6.
Thermographies obtained at different moments after the injection start-up into the steam chamber: (a) s , (b) s, (c) s, and (d) s. Notice that there is no appreciable difference between thermographies (c) and (d) (c) and (d). This means that a steady-state regime for the temperature distribution was practically reached.
Figure 7.
Dimensionless temperature distributions in the elliptic steam chamber, along which were obtained from the thermographies of Figs. 6(c) and 6(d). The temperature at the chamber edge, was located at . The error bars are of the same size as symbols.
Figure 7.
Dimensionless temperature distributions in the elliptic steam chamber, along which were obtained from the thermographies of Figs. 6(c) and 6(d). The temperature at the chamber edge, was located at . The error bars are of the same size as symbols.
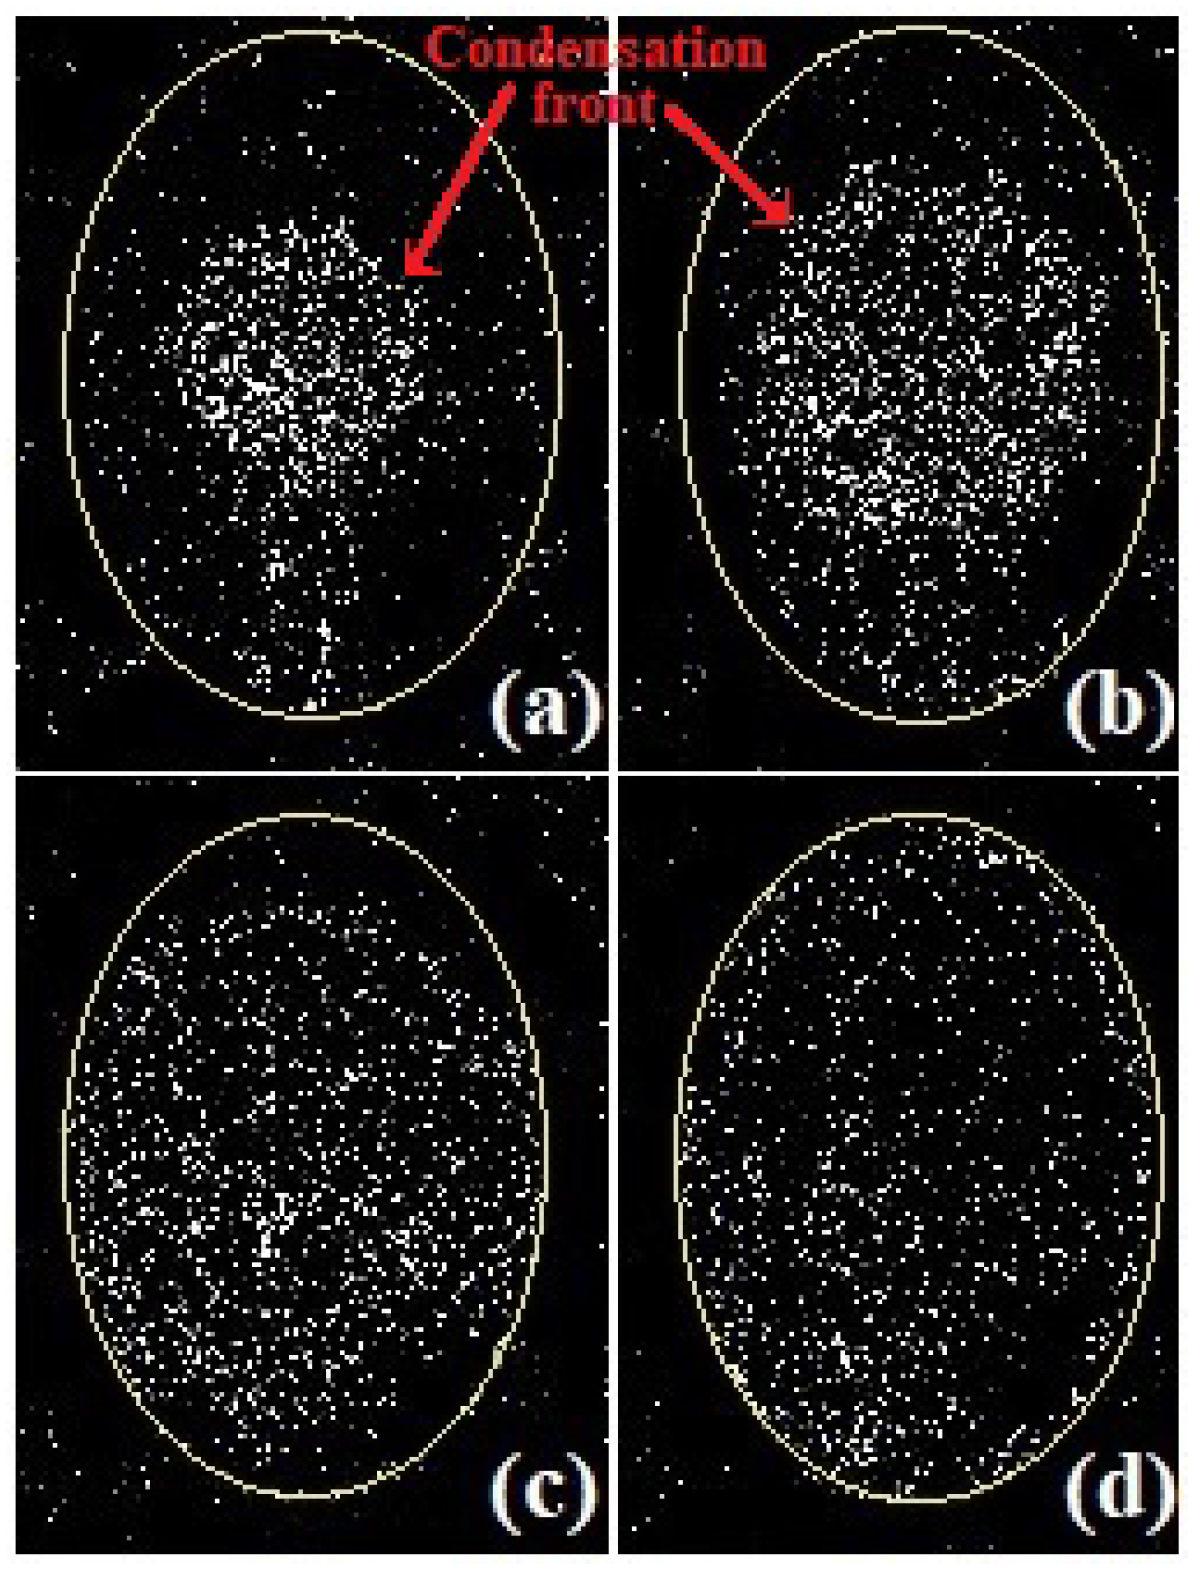
Figure 8.
Pictures obtained through image subtraction of the evolution of the condensation front (indicated by the arrows) during steam injection into the preforemed circular steam chamber. Images correspond to (a) s, (b) s, (c) s, and (d) s after the injection start-up.
Figure 8.
Pictures obtained through image subtraction of the evolution of the condensation front (indicated by the arrows) during steam injection into the preforemed circular steam chamber. Images correspond to (a) s, (b) s, (c) s, and (d) s after the injection start-up.
Figure 9.
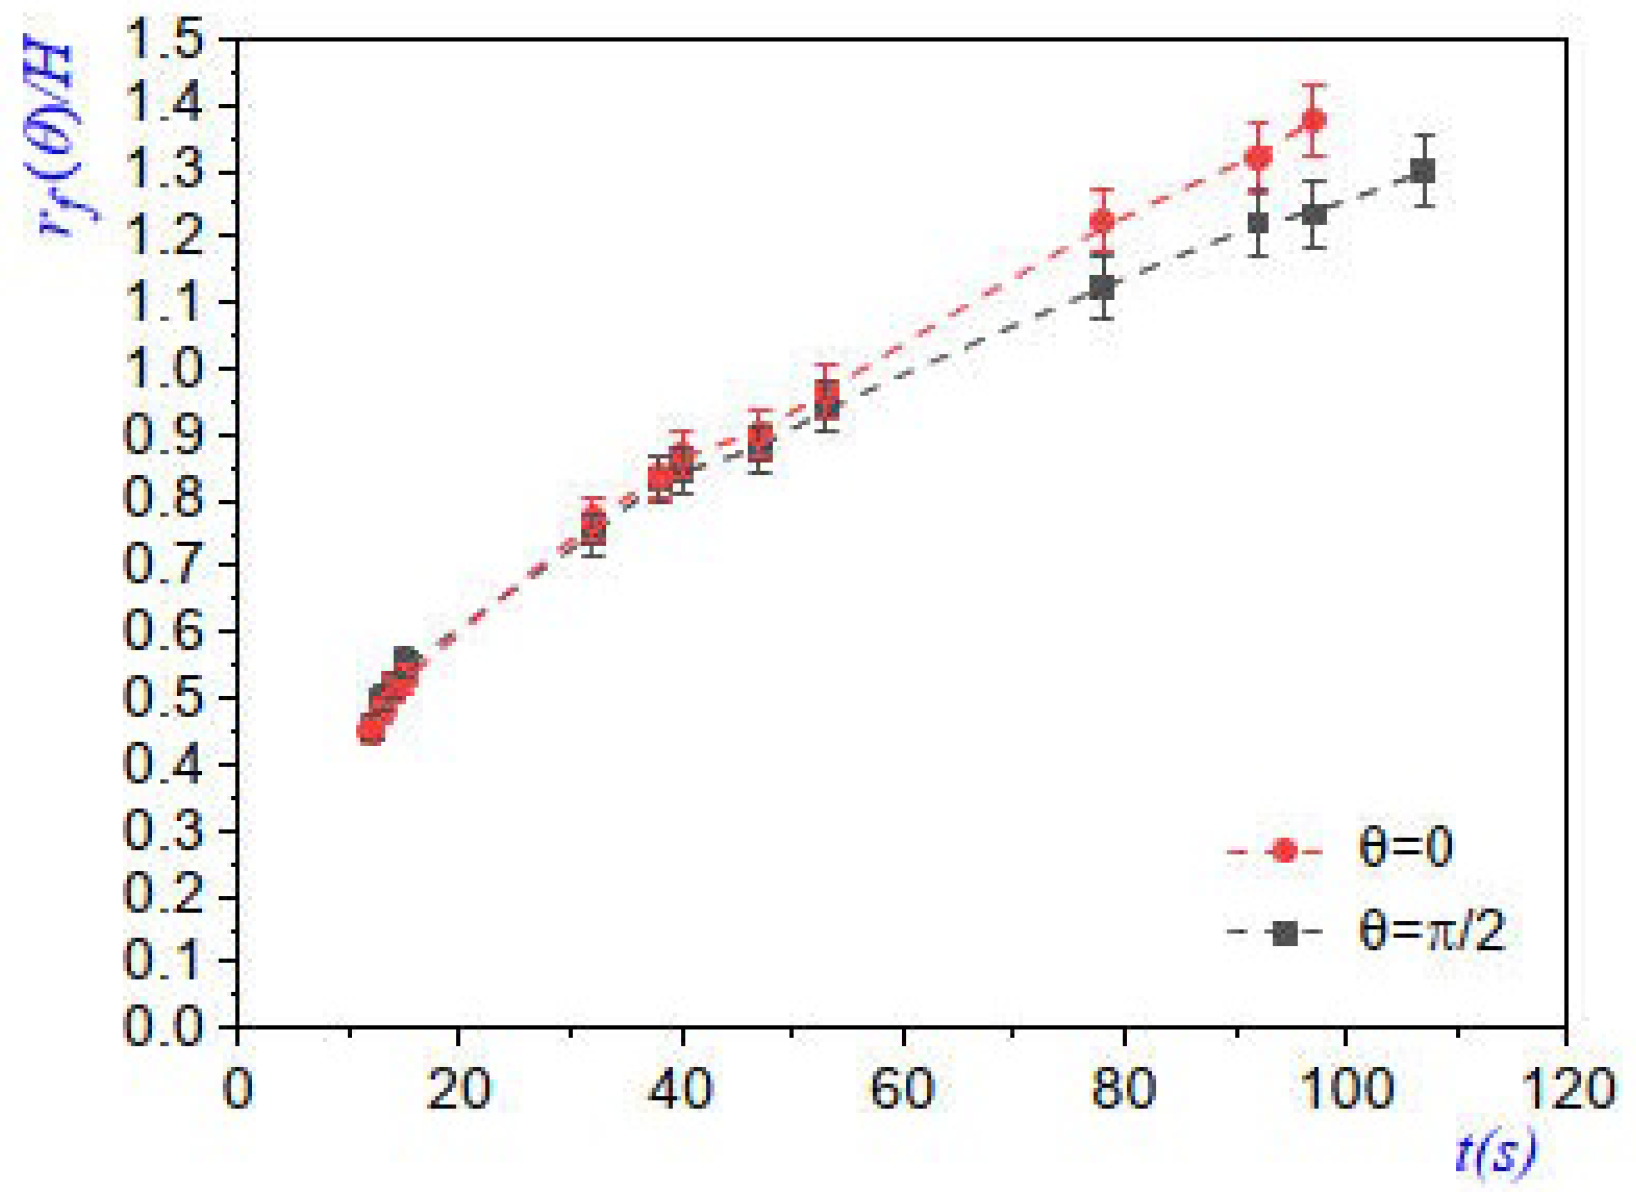
Plots of the displacement of the condensation front
versus
t, along the vertical (
) and horizontal (
) axes for different time instants. Some measurements were taken from images in
Figure 8.
Figure 9.
Plots of the displacement of the condensation front
versus
t, along the vertical (
) and horizontal (
) axes for different time instants. Some measurements were taken from images in
Figure 8.
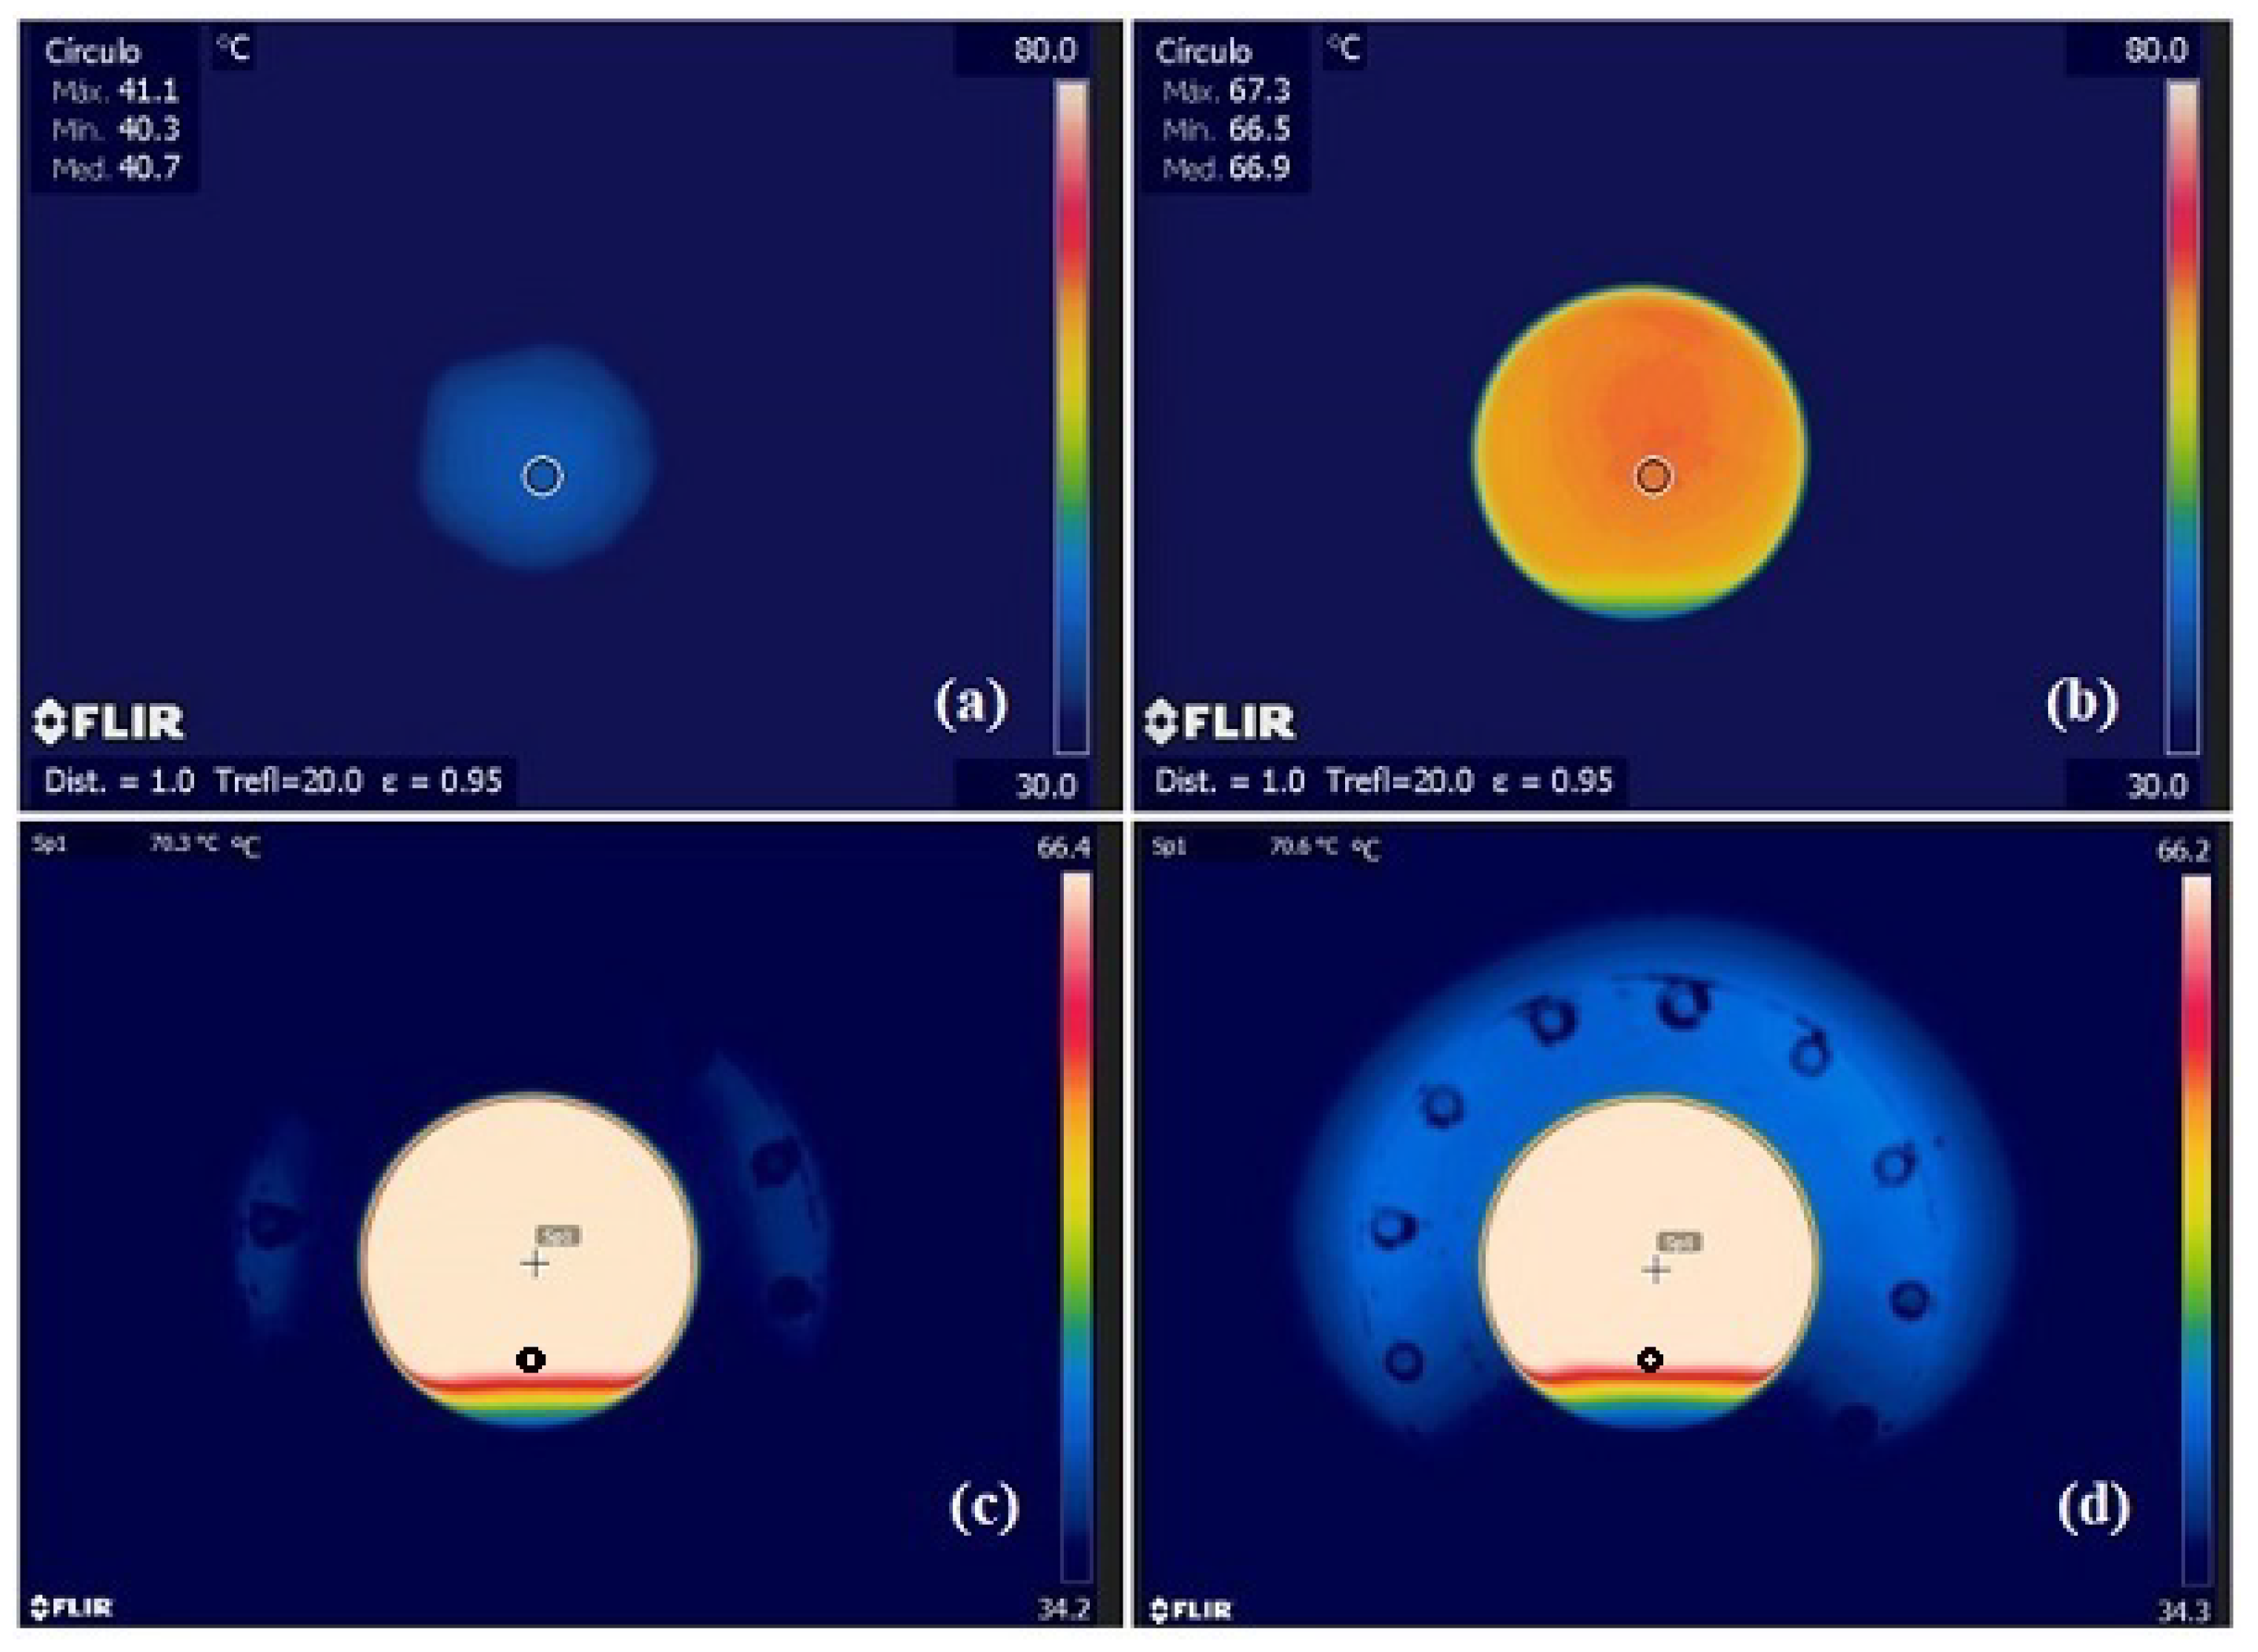
Figure 10.
Termographies taken during the transient steam injection into the circular preformed steam chamber. These thermographies were taken (a) s, (b) s, (c) s, and (d) s after the injection start-up.
Figure 10.
Termographies taken during the transient steam injection into the circular preformed steam chamber. These thermographies were taken (a) s, (b) s, (c) s, and (d) s after the injection start-up.
Figure 11.
Temperature distribution in the circular chamber, along , they were extracted from the thermographies of Figs. 10(c) and 10(d). For the dashed black curve K and for the dashed red curve K. These thermographies were taken 430 s, apart. The error bars are of the same size as the symbols.
Figure 11.
Temperature distribution in the circular chamber, along , they were extracted from the thermographies of Figs. 10(c) and 10(d). For the dashed black curve K and for the dashed red curve K. These thermographies were taken 430 s, apart. The error bars are of the same size as the symbols.
Figure 12.
(a) Plot of recovered water mass versus the injected steam mass in the elliptical chamber; data was taken during time lapse s after the injection start-up, (b) dimensionless plot of versus , where the occurrence of an optimum value can be observed at . The dashed curve is used as a visual guide and the error bars correspond to 5%.
Figure 13.
(a) Plot of recovered water mass versus the injected steam mass , in the circular steam chamber, in this case data was taken during time lapse s after the injection start-up. (b) Plot of versus , where the occurrence of an optimum value can be observed at . The dashed curve is used as a visual guide.
