Submitted:
09 May 2023
Posted:
10 May 2023
You are already at the latest version
Abstract
Keywords:
1. Introduction
2. Materials and Methods
2.1. Materials
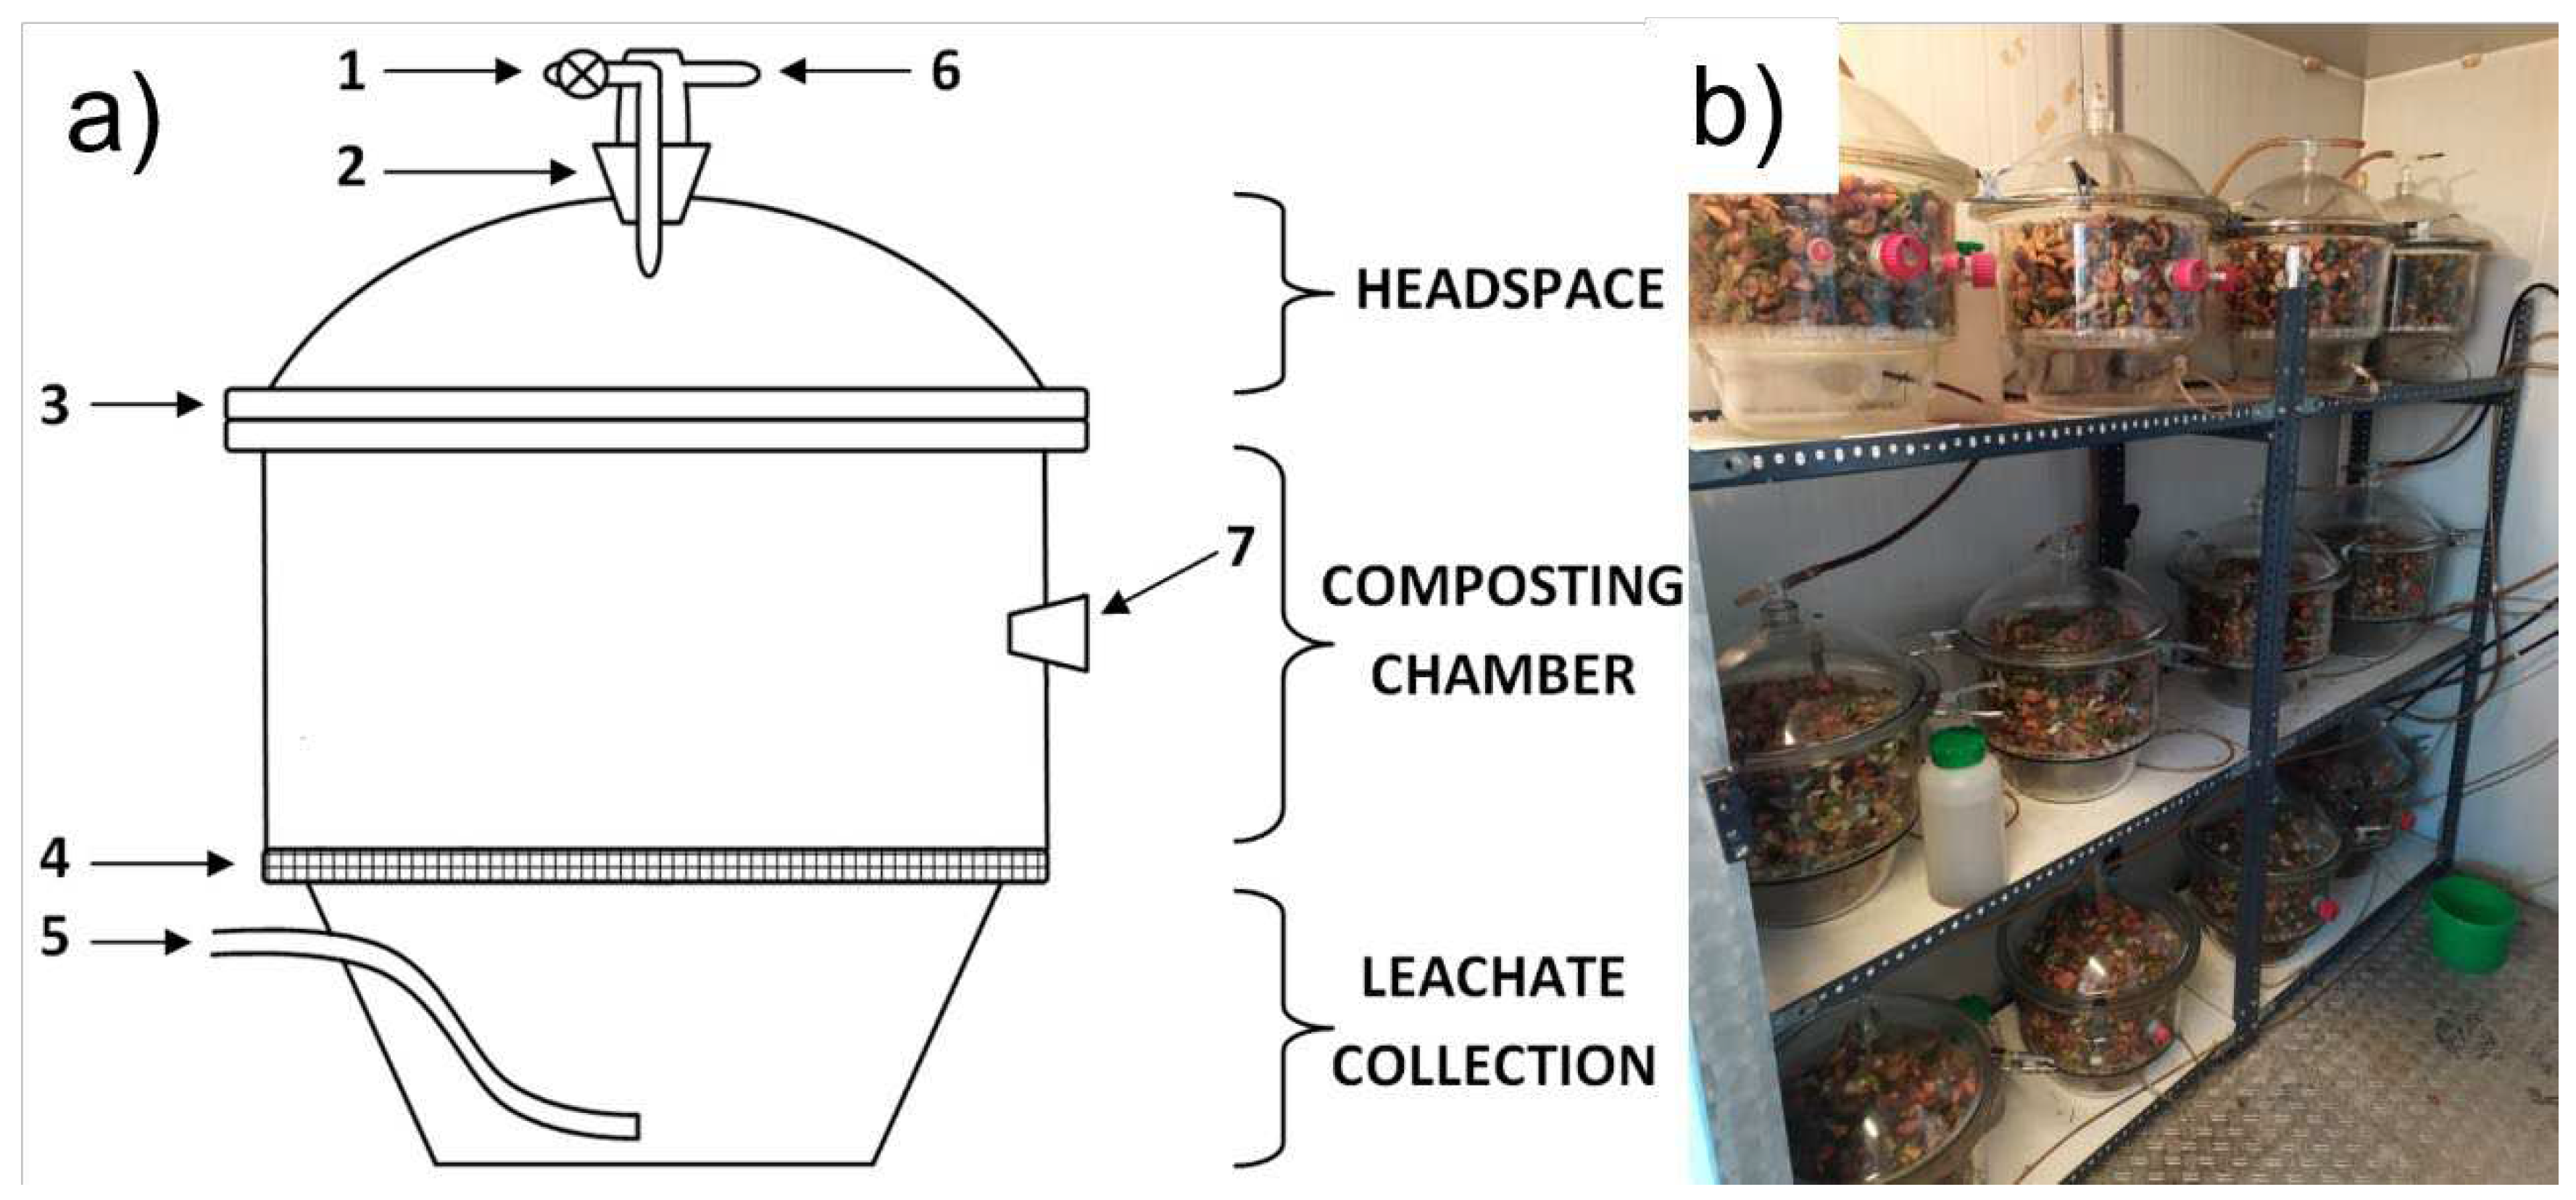
2.2. Bio-waste composting
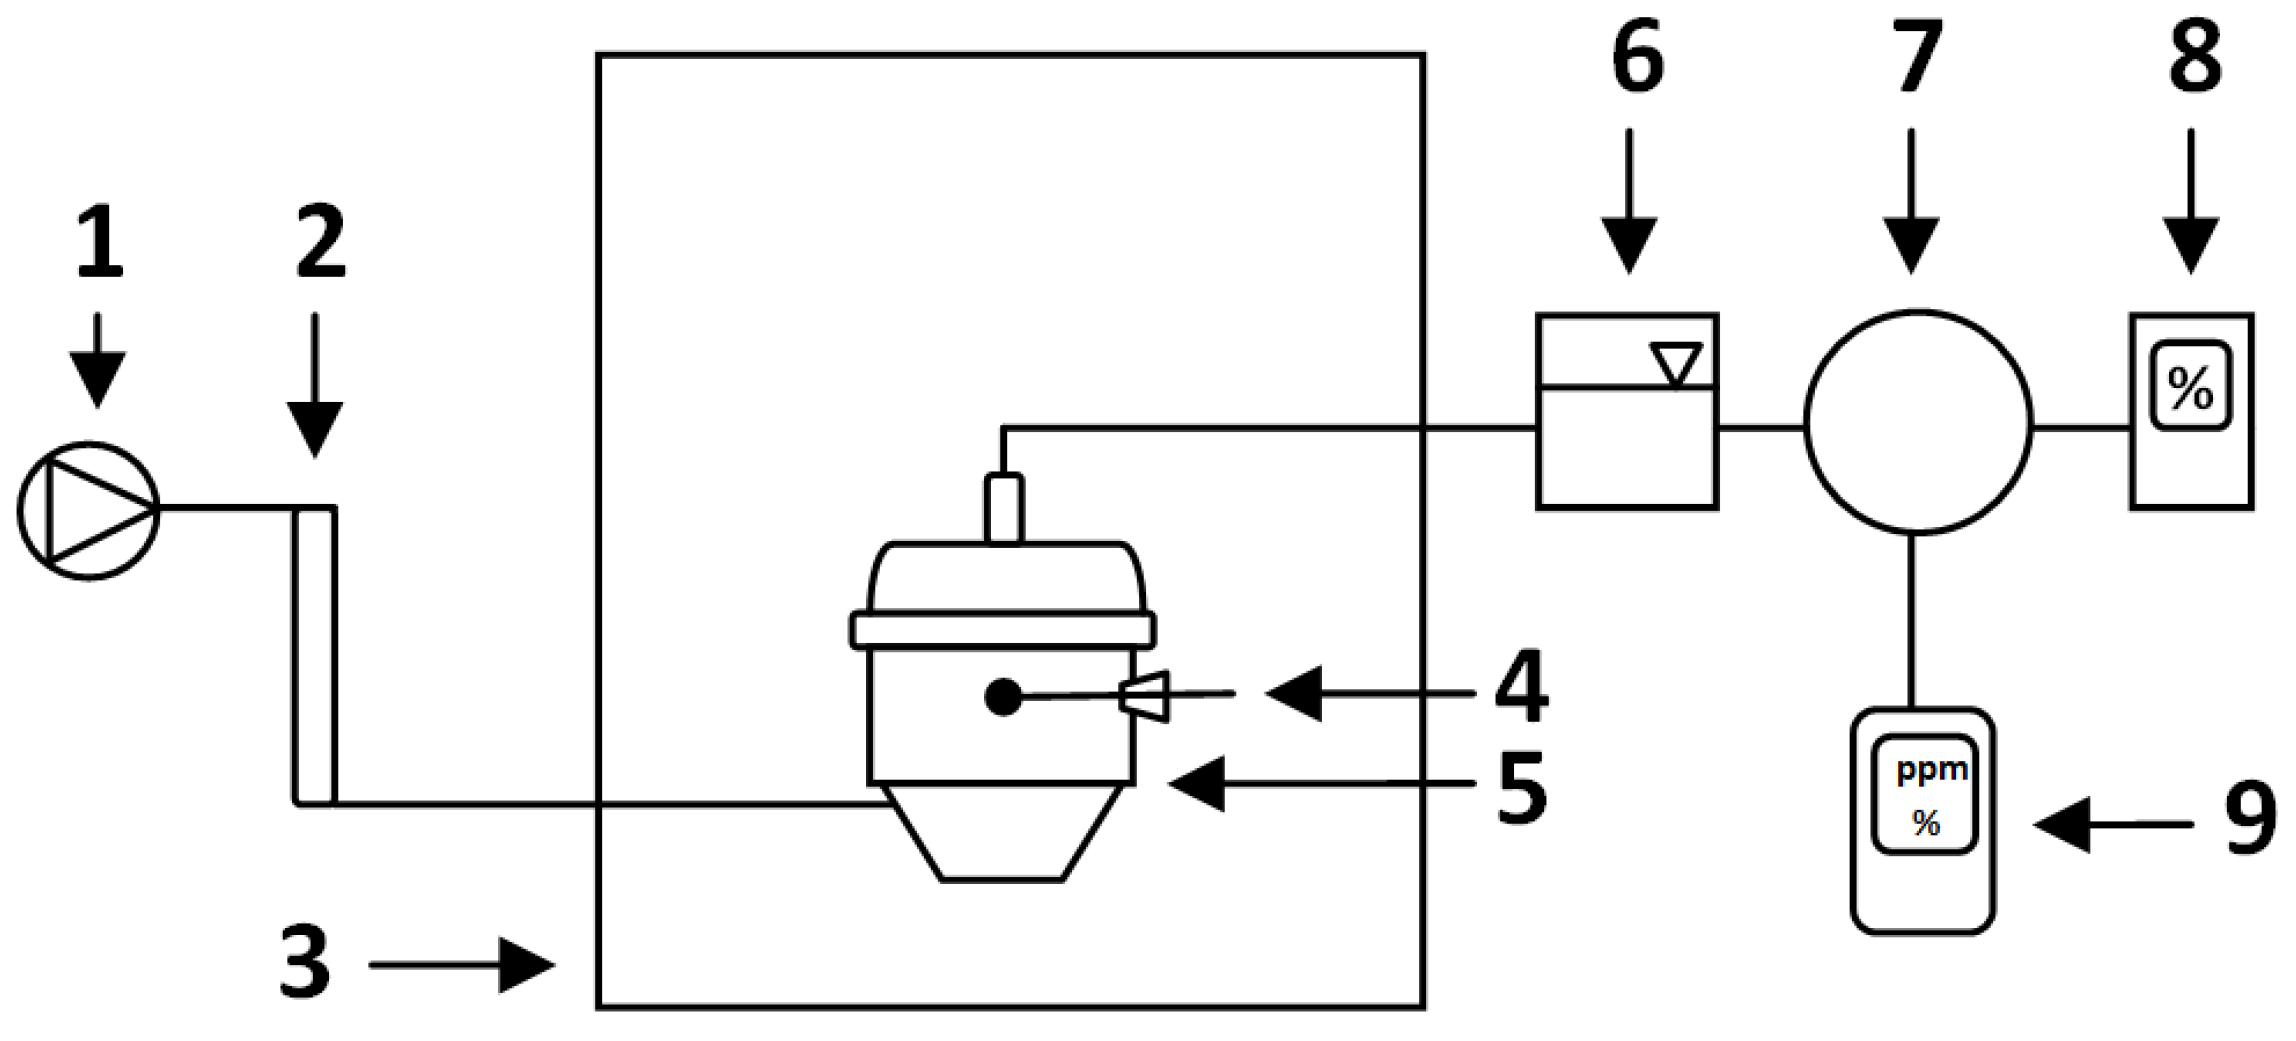
2.3. Measurements of process gases concentration and temperature
2.4. Bio-waste samples collection
2.5. Bio-waste and compost characterization
2.6. Calculations
- CCO—CO concentration at time t, ppm,
- a—regression coefficient indicating the decrease of CO concentration during the experiment, ppm·d−1),
- t—time, days (d).
- CCOmax—maximum CO concentration, ppm,
- k—decrease in CO concentration constant rate, days−1 (d−1),
- t—time, days (d).
2.7. Statistical analyses
3. Results
3.1. Bio-waste initial properties
3.2. Composts properties
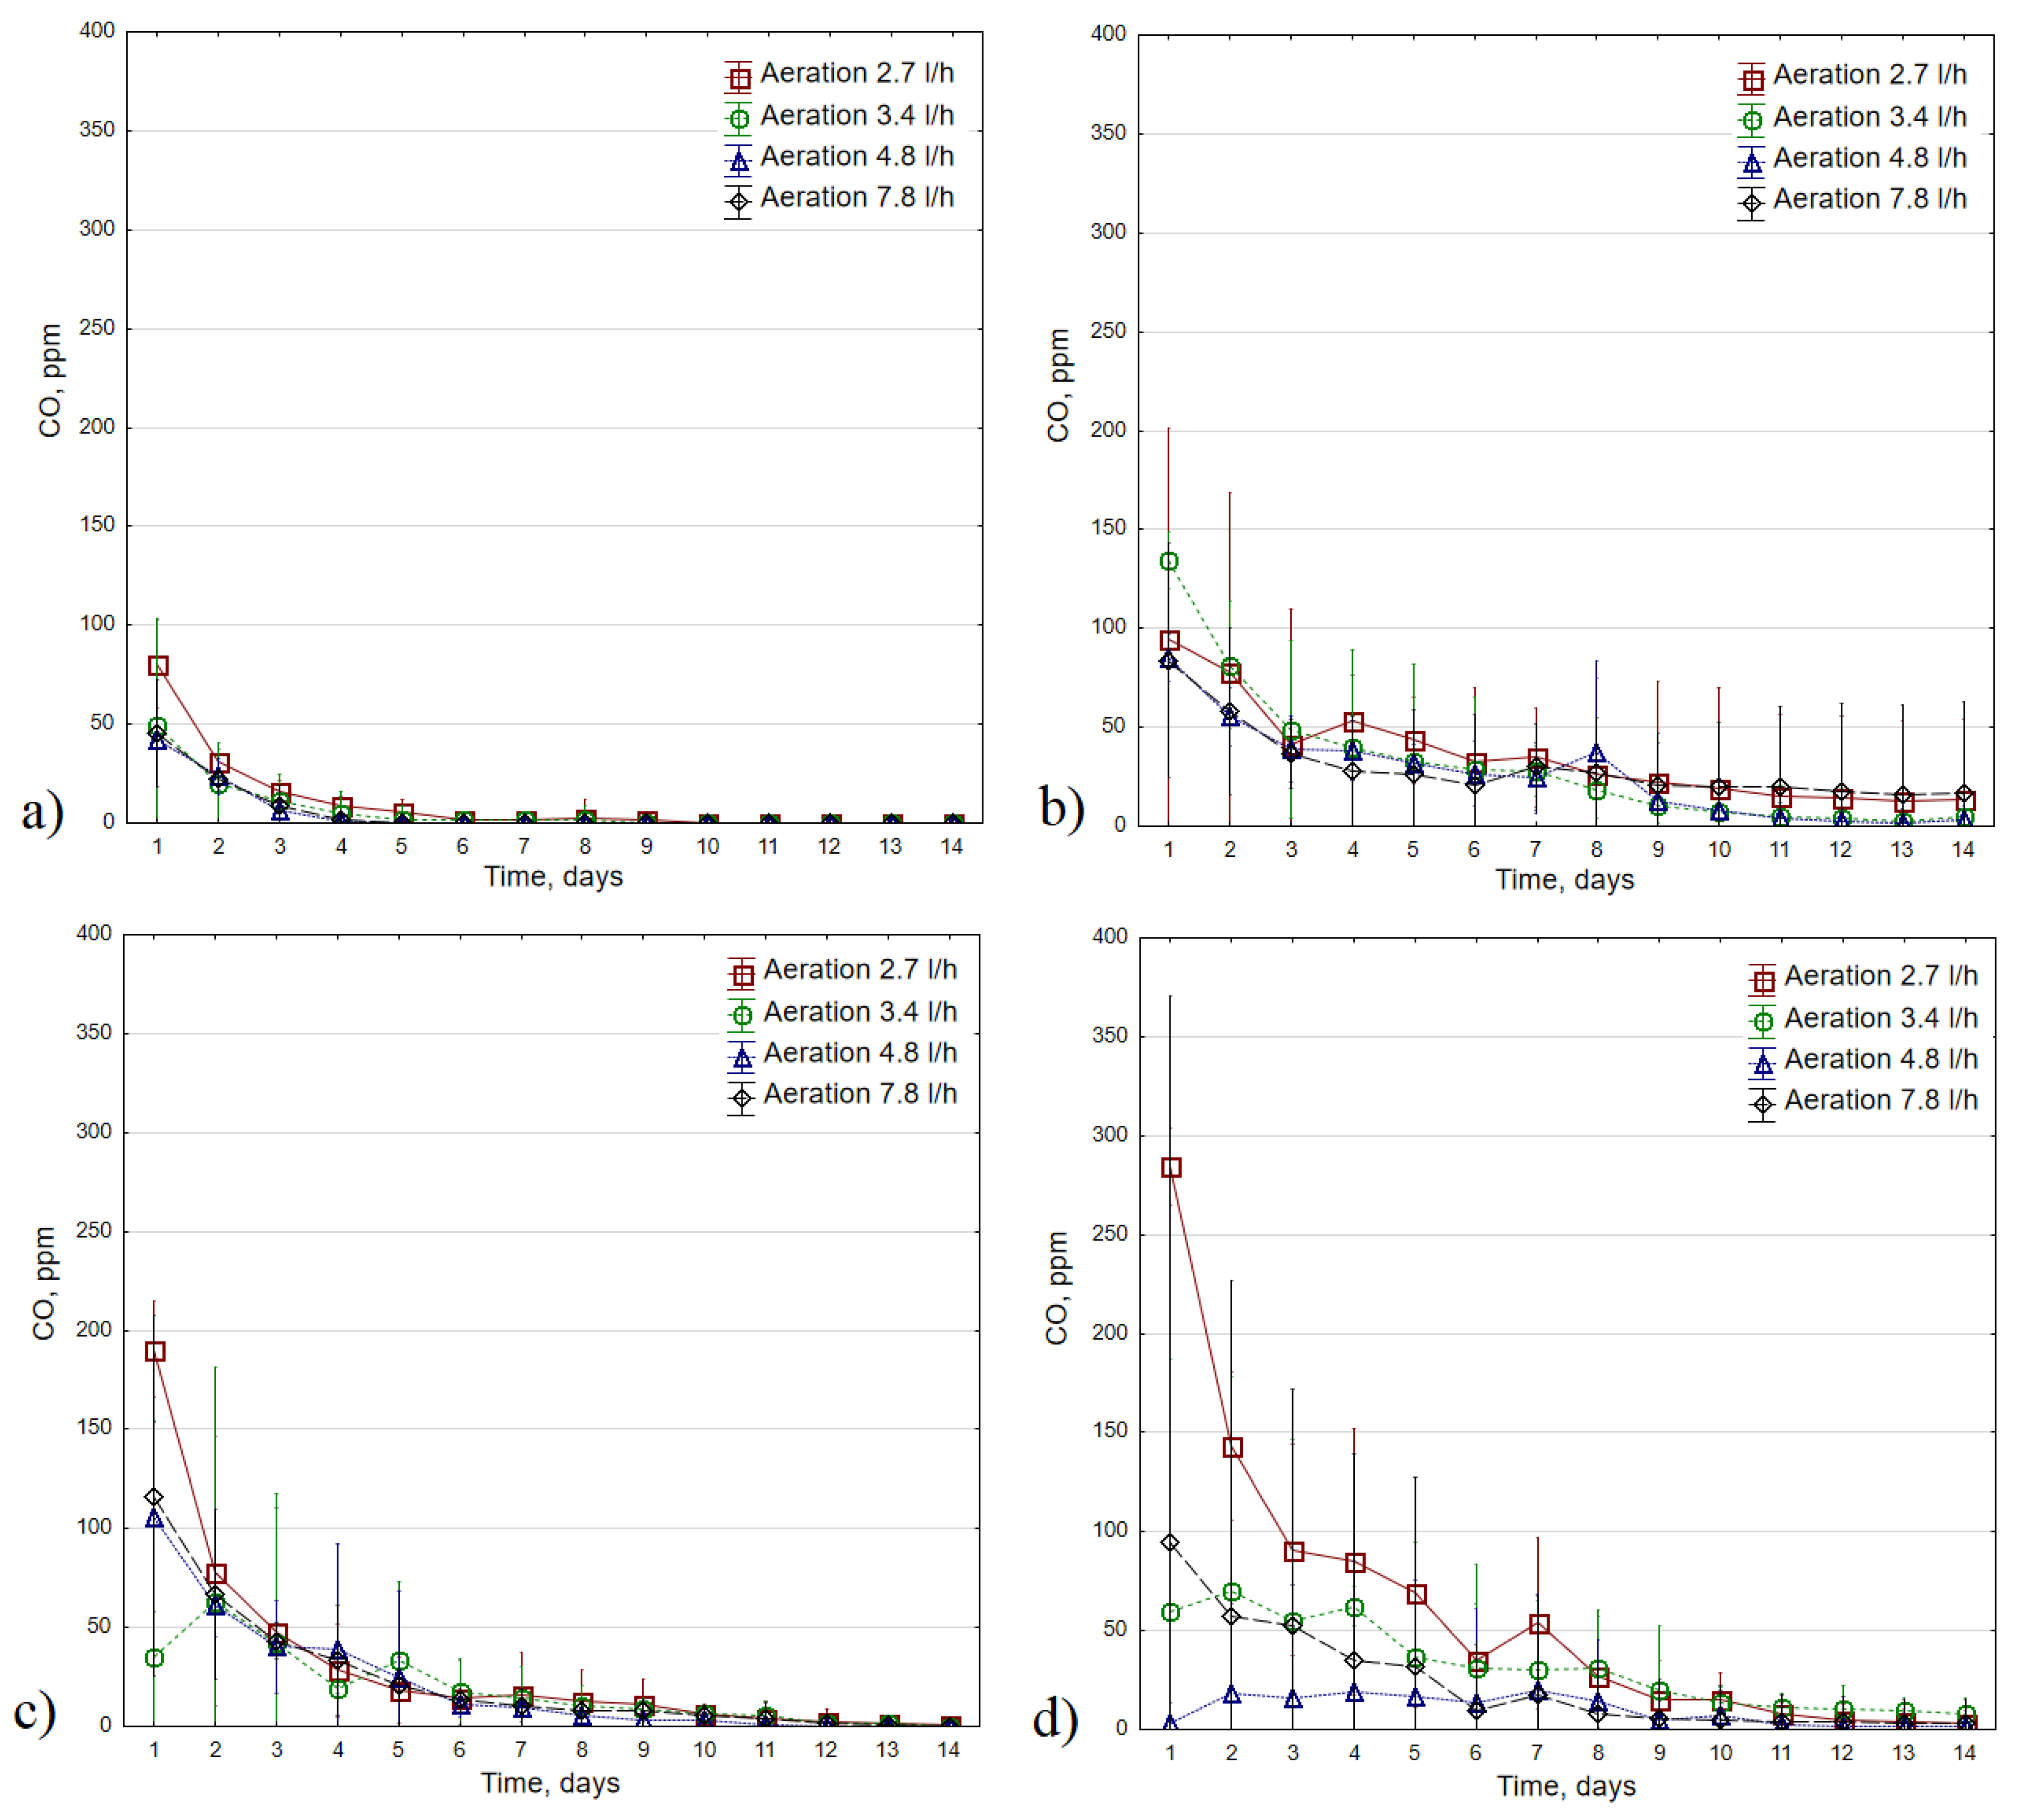
3.3. CO concentrations
| The composting variant, °C | Ambient temperature, °C | Compost temperature, °C | CO2, % | O2, % | |
|---|---|---|---|---|---|
| CO, ppm | 35 | 0.22* | 0.59* | 0.40* | -0.47* |
| 45 | -0.03 | -0.24* | -0.03 | 0.09 | |
| 55 | -0.11 | -0.56* | -0.53* | 0.55* | |
| 65 | 0.31* | 0.16 | 0.22* | -0.11 |
3.4. CO production kinetics
4. Discussion
5. Conclusions and future research recommendations
Supplementary Materials
Author Contributions
Funding
Data Availability Statement
Acknowledgments
Conflicts of Interest
References
- Awasthi, M.K.; Sindhu, R.; Sirohi, R.; Kumar, V.; Ahluwalia, V.; Binod, P.; Juneja, A.; Kumar, D.; Yan, B.; Sarsaiya, S.; et al. Agricultural Waste Biorefinery Development towards Circular Bioeconomy. Renewable and Sustainable Energy Reviews 2022, 158, 112122. [Google Scholar] [CrossRef]
- Sobieraj, K.; Stegenta-Dąbrowska, S.; Luo, G.; Koziel, J.A.; Białowiec, A. Biological Treatment of Biowaste as an Innovative Source of CO—The Role of Composting Process. Frontiers in Bioengineering and Biotechnology 2023, 11. [Google Scholar] [CrossRef] [PubMed]
- Stegenta, S.; Sobieraj, K.; Pilarski, G.; Koziel, J.A.; Białowiec, A. Analysis of the Spatial and Temporal Distribution of Process Gases within Municipal Biowaste Compost. Sustainability 2019, 11, 2340. [Google Scholar] [CrossRef]
- Stegenta, S.; Dębowski, M.; Bukowski, P.; Randerson, P.F.; Białowiec, A. The Influence of Perforation of Foil Reactors on Greenhouse Gas Emission Rates during Aerobic Biostabilization of the Undersize Fraction of Municipal Wastes. Journal of Environmental Management 2018, 207, 355–365. [Google Scholar] [CrossRef] [PubMed]
- Stegenta-Dąbrowska, S.; Randerson, P.F.; Christofides, S.R.; Białowiec, A. Carbon Monoxide Formation during Aerobic Biostabilization of the Organic Fraction of Municipal Solid Waste: The Influence of Technical Parameters in a Full-Scale Treatment System. Energies 2020, 13, 5624. [Google Scholar] [CrossRef]
- Phillip, E.A.; Clark, O.G.; Londry, K.; Yu, S.; Leonard, J. Emission of Carbon Monoxide During Composting of Municipal Solid Waste. Compost Science & Utilization 2011, 19, 170–177. [Google Scholar] [CrossRef]
- Hellebrand, H.J.; Kalk, W.-D. Emission of Carbon Monoxide during Composting of Dung and Green Waste. Nutrient Cycling in Agroecosystems 2001, 60, 79–82. [Google Scholar] [CrossRef]
- Haarstad, K.; Bergersen, O.; Sorheim, R. Occurrence of Carbon Monoxide during Organic Waste Degradation. Journal of the Air & Waste Management Association 2006, 56, 575–581. [Google Scholar]
- Hellebrand, H.J. Emission of Nitrous Oxide and Other Trace Gases during Composting of Grass and Green Waste. Journal of Agricultural Engineering Research 1998, 69, 365–375. [Google Scholar] [CrossRef]
- Hellebrand, H. Carbon Monoxide from Composting Due to Thermal Oxidation of Biomass: An Additional Pathway for CO in Agricultural and Forest Ecosystems. 2006. [Google Scholar]
- Hellebrand, H.; Schade, G. Carbon Monoxide from Composting Due to Thermal Oxidation of Biomass. Journal of environmental quality 2008, 37, 592–598. [Google Scholar] [CrossRef] [PubMed]
- Stegenta-Dąbrowska, S.; Drabczyński, G.; Sobieraj, K.; Koziel, J.A.; Białowiec, A. The Biotic and Abiotic Carbon Monoxide Formation During Aerobic Co-Digestion of Dairy Cattle Manure With Green Waste and Sawdust. Front. Bioeng. Biotechnol. 2019, 7. [Google Scholar] [CrossRef] [PubMed]
- Stegenta-Dąbrowska, S.; Sobieraj, K.; Koziel, J.A.; Bieniek, J.; Białowiec, A. Kinetics of Biotic and Abiotic CO Production during the Initial Phase of Biowaste Composting. Energies 2020, 13, 5451. [Google Scholar] [CrossRef]
- King, G.M. Attributes of Atmospheric Carbon Monoxide Oxidation by Maine Forest Soils. - Abstract - Europe PMC. Applied and Environmental Microbiology 1999, 65, 5257–5264. [Google Scholar] [CrossRef] [PubMed]
- Rich, J.J.; King, G.M. Carbon Monoxide Consumption and Production by Wetland Peats. FEMS Microbiology Ecology 1999, 28, 215–224. [Google Scholar] [CrossRef]
- Grassinger, D. Einfluß von Temperatur und Sauerstoffgehalt auf die Humifizierung und die Mineralisierung bei der Verrottung von Bioabfall. Universität für Bodenkultur Wien: Vienna, Austria, 1998. [Google Scholar]
- Świechowski, K.; Rasaq, W.A.; Stegenta-Dąbrowska, S.; Białowiec, A. Characterization of Engineered Biochar: Proximate Analyses, Ultimate Analyses, Physicochemical Analyses, Surface Analyses, and Molecular Analyses. In Engineered Biochar: Fundamentals, Preparation, Characterization and Applications; Ramola, S., Mohan, D., Masek, O., Méndez, A., Tsubota, T., Eds.; Springer Nature: Singapore, 2022; pp. 127–148. ISBN 978-981-19248-8-0. [Google Scholar]
- Binner, E.; Böhm, K.; Lechner, P. Large Scale Study on Measurement of Respiration Activity (AT(4)) by Sapromat and OxiTop. Waste Manag 2012, 32, 1752–1759. [Google Scholar] [CrossRef] [PubMed]
- Sobieraj, K.; Derkacz, D.; Krasowska, A.; Białowiec, A. Isolation and Identification of CO-Producing Microorganisms from Compost. Environmental Microbiology Reports 2023. under review. [Google Scholar]
- Sáez, J.A.; Clemente, R.; Bustamante, M.Á.; Yañez, D.; Bernal, M.P. Evaluation of the Slurry Management Strategy and the Integration of the Composting Technology in a Pig Farm - Agronomical and Environmental Implications. J Environ Manage 2017, 192, 57–67. [Google Scholar] [CrossRef]
- Zou, Y.; Hu, Z.; Zhang, J.; Xie, H.; Guimbaud, C.; Fang, Y. Effects of PH on Nitrogen Transformations in Media-Based Aquaponics. Bioresource Technology 2016, 210, 81–87. [Google Scholar] [CrossRef]
- Ministry of Environment Regulation of the Minister of the Environment of September 11, 2012 on the Mechanical and Biological Treatment of Unsorted Municipal Waste 2012.
- García-Sánchez, M.; Taušnerová, H.; Hanč, A.; Tlustoš, P. Stabilization of Different Starting Materials through Vermicomposting in a Continuous-Feeding System: Changes in Chemical and Biological Parameters. Waste Management 2017, 62, 33–42. [Google Scholar] [CrossRef]
- Sharma, D.; Varma, V.S.; Yadav, K.D.; Kalamdhad, A.S. Evolution of Chemical and Biological Characterization during Agitated Pile Composting of Flower Waste. Int J Recycl Org Waste Agricult 2017, 6, 89–98. [Google Scholar] [CrossRef]
- Soobhany, N.; Gunasee, S.; Rago, Y.P.; Joyram, H.; Raghoo, P.; Mohee, R.; Garg, V.K. Spectroscopic, Thermogravimetric and Structural Characterization Analyses for Comparing Municipal Solid Waste Composts and Vermicomposts Stability and Maturity. Bioresource Technology 2017, 236, 11–19. [Google Scholar] [CrossRef] [PubMed]
- Esmaeili, A.; Khoram, M.R.; Gholami, M.; Eslami, H. Pistachio Waste Management Using Combined Composting-Vermicomposting Technique: Physico-Chemical Changes and Worm Growth Analysis. Journal of Cleaner Production 2020, 242, 118523. [Google Scholar] [CrossRef]
- Aydın Temel, F. Evaluation of the Influence of Rice Husk Amendment on Compost Quality in the Composting of Sewage Sludge. Bioresource Technology 2023, 373, 128748. [Google Scholar] [CrossRef]
- Biester, A.; Dementin, S.; Drennan, C.L. Visualizing the Gas Channel of a Monofunctional Carbon Monoxide Dehydrogenase. Journal of Inorganic Biochemistry 2022, 230, 111774. [Google Scholar] [CrossRef]
- Wittenborn, E.C.; Guendon, C.; Merrouch, M.; Benvenuti, M.; Fourmond, V.; Léger, C.; Drennan, C.L.; Dementin, S. The Solvent-Exposed Fe–S D-Cluster Contributes to Oxygen-Resistance in Desulfovibrio Vulgaris Ni–Fe Carbon Monoxide Dehydrogenase. ACS Catal. 2020, 10, 7328–7335. [Google Scholar] [CrossRef]
- Merrouch, M.; Hadj-Saïd, J.; Domnik, L.; Dobbek, H.; Léger, C.; Dementin, S.; Fourmond, V. O2 Inhibition of Ni-Containing CO Dehydrogenase Is Partly Reversible. Chemistry-A European Journal 2015, 21, 18934–18938. [Google Scholar] [CrossRef]
- Alfano, M.; Cavazza, C. The Biologically Mediated Water–Gas Shift Reaction: Structure, Function and Biosynthesis of Monofunctional [NiFe]-Carbon Monoxide Dehydrogenases. Sustainable Energy Fuels 2018, 2, 1653–1670. [Google Scholar] [CrossRef]
- Andreides, D.; Fliegerova, K.O.; Pokorna, D.; Zabranska, J. Biological Conversion of Carbon Monoxide and Hydrogen by Anaerobic Culture: Prospect of Anaerobic Digestion and Thermochemical Processes Combination. Biotechnology Advances 2022, 58, 107886. [Google Scholar] [CrossRef]
- Zhang, L.; Can, M.; Ragsdale, S.W.; Armstrong, F.A. Fast and Selective Photoreduction of CO2 to CO Catalyzed by a Complex of Carbon Monoxide Dehydrogenase, TiO2, and Ag Nanoclusters. ACS Catal. 2018, 8, 2789–2795. [Google Scholar] [CrossRef]
- Robb, F.T.; Techtmann, S.M. Life on the Fringe: Microbial Adaptation to Growth on Carbon Monoxide. F1000Res 2018, 7. [Google Scholar] [CrossRef] [PubMed]
- Sokolova, T.G.; Henstra, A.-M.; Sipma, J.; Parshina, S.N.; Stams, A.J.M.; Lebedinsky, A.V. Diversity and Ecophysiological Features of Thermophilic Carboxydotrophic Anaerobes. FEMS Microbiology Ecology 2009, 68, 131–141. [Google Scholar] [CrossRef] [PubMed]
- Insam, H.; de Bertoldi, M. Chapter 3 Microbiology of the Composting Process. In Waste Management Series; Diaz, L.F., de Bertoldi, M., Bidlingmaier, W., Stentiford, E., Eds.; Compost Science and Technology; Elsevier, 2007; Volume 8, pp. 25–48. [Google Scholar]
| Composting series # | Compost substrates | Duration of the process, days | Temperature, °C | Aeration rate, L·h−1 |
|---|---|---|---|---|
| 1 | Bio-waste (green waste and vegetables) mixed with chopped branches | 14 | 35 | 2.7 |
| 3.4 | ||||
| 4.8 | ||||
| 7.8 | ||||
| 2 | 45 | 2.7 | ||
| 3.4 | ||||
| 4.8 | ||||
| 7.8 | ||||
| 3 | 55 | 2.7 | ||
| 3.4 | ||||
| 4.8 | ||||
| 7.8 | ||||
| 4 | 65 | 2.7 | ||
| 3.4 | ||||
| 4.8 | ||||
| 7.8 |
| Substrates for the composting process | ||||
|---|---|---|---|---|
| Properties ± st. dev. | 35 °C | 45 °C | 55 °C | 65 °C |
| pH | 7.48 ± 0.07 | 5.60 ± 0.01 | 6.51 ± 0.11 | 6.75 ± 0.09 |
| EC, mS·cm−1 | 3.53 ± 0.03 | 4.06 ± 0.05 | 3.09 ± 0.06 | 3.51 ± 0.04 |
| TOC, % d.m. | 35.66 ± 0.07 | 33.81 ± 0.47 | 33.03 ± 0.12 | 36.94 ± 0.83 |
| TN, % d.m. | 1.26 ± 0.02 | 1.50 ± 0.01 | 1.44 ± 0.03 | 1.62 ± 0.03 |
| C/N | 28 | 24 | 23 | 23 |
| Water content, % | 54.40 ± 0.30 | 55.70 ± 0.89 | 54.28 ± 0.32 | 61.00 ± 0.23 |
| LOI, % d.m. | 69.19 ± 0.26 | 67.48 ± 0.44 | 64.15 ± 0.30 | 71.01 ± 0.37 |
| AT4, mg O2·g d.m.−1 | 37.6 ± 0.2 | 64.0 ± 2.8 | 61.7 ± 1.2 | 71.1 ± 10.0 |
| NH4-N, mg·kg d.m.−1 | 140.46 ± 3.02 | 850.40 ± 13.76 | 689.28 ± 44.56 | 248.08 ± 1.63 |
| NO3-N, mg·kg d.m.−1 | 58.22 ± 6.10 | 82.90 ± 6.36 | 30.42 ± 12.69 | 169.62 ± 26.65 |
| Process temperature, °C | Aeration rate, L·h−1 | pH | EC | AT4 | TOC | TN | C/N | Water content | LOI | NH4-N | NO3-N |
|---|---|---|---|---|---|---|---|---|---|---|---|
| 35 | 2.7 | 12.47 | -24.54 | -65.38 | -6.17 | 38.93 | -32.14 | 3.27 | -8.21 | -90.94 | -51.23 |
| 3.4 | 12.47 | -25.25 | -65.65 | -6.87 | 43.77 | -35.71 | 1.65 | -8.89 | -89.95 | -33.10 | |
| 4.8 | 13.87 | -24.54 | -65.65 | -8.56 | 39.05 | -32.14 | -5.27 | -9.83 | -92.11 | -55.96 | |
| 7.2 | 15.08 | -23.40 | -66.18 | -8.70 | 46.42 | -35.71 | -0.73 | -11.70 | -93.21 | -66.07 | |
| 45 | 2.7 | -6.59 | 21.20 | -78.99 | -6.02 | 9.92 | -16.67 | 1.01 | -6.37 | 74.25 | -12.06 |
| 3.4 | 31.17 | 11.64 | -51.58 | -4.22 | 17.24 | -20.83 | 0.59 | -7.68 | -2.08 | -32.01 | |
| 4.8 | 32.06 | -0.49 | -27.23 | -9.66 | 22.50 | -29.17 | -7.49 | -10.22 | -22.49 | -4.45 | |
| 7.2 | 32.50 | -13.60 | -32.91 | -8.29 | 18.12 | -25.00 | -10.23 | -9.39 | -45.47 | -44.19 | |
| 55 | 2.7 | 27.59 | -19.68 | -46.19 | -3.02 | 19.07 | -17.39 | -12.36 | -5.15 | -43.29 | -7.94 |
| 3.4 | 27.44 | -22.90 | -76.23 | -4.06 | 28.45 | -26.09 | -23.68 | -8.93 | -80.02 | 184.66 | |
| 4.8 | 26.83 | -26.45 | -85.02 | -5.16 | 20.02 | -21.74 | -28.44 | -6.15 | -79.62 | -21.03 | |
| 7.2 | 27.36 | -22.90 | -80.00 | -8.54 | 29.52 | -30.43 | -28.84 | -7.18 | -89.53 | -30.12 | |
| 65 | 2.7 | 11.64 | -18.97 | -63.33 | -2.55 | 20.23 | -17.39 | -9.44 | -5.87 | 6.97 | -94.06 |
| 3.4 | 11.56 | -17.83 | -69.03 | -2.71 | 25.04 | -21.74 | -8.80 | -4.67 | -21.63 | -98.09 | |
| 4.8 | 14.68 | -26.96 | -75.93 | -3.06 | 15.45 | -17.39 | -15.98 | -4.84 | -61.60 | -85.16 | |
| 7.2 | 15.72 | -27.25 | -52.55 | -4.80 | 24.82 | -26.09 | -16.96 | -6.18 | -53.74 | -89.25 |
| Aeration rate, L·h−1 | Weight loss, % | 35 °C | 45 °C | 55 °C | 65 °C |
|---|---|---|---|---|---|
| 2.7 | Total | 11.44 ± 1.05 | 4.90 ± 2.50 | 7.48 ± 0.82 | 9.94 ± 0.96 |
| As leachate | 5.95 ± 1.03 | 0.99 ± 1.71 | 16.47 ± 1.65 | 9.20 ± 2.98 | |
| 3.4 | Total | 11.66 ± 1.16 | 8.09 ± 3.87 | 12.51 ± 0.85 | 12.04 ± 2.02 |
| As leachate | 6.18 ± 0.35 | 2.88 ± 2.50 | 18.84 ± 2.47 | 5.41 ± 4.69 | |
| 4.8 | Total | 13.64 ± 0.41 | 15.83 ± 9.10 | 16.15 ± 0.09 | 16.20 ± 0.37 |
| As leachate | 5.32 ± 0.83 | 7.43 ± 7.21 | 20.03 ± 0.82 | 12.31 ± 1.18 | |
| 7.8 | Total | 13.59 ± 0.76 | 12.88 ± 8.07 | 13.26 ± 1.27 | 16.14 ± 2.94 |
| As leachate | 5.80 ± 1.86 | 4.71 ± 4.93 | 20.10 ± 2.88 | 14.61 ± 4.09 |
| Process T, °C | Aeration, L·h−1 | Reaction order | CCOmax, ppm | k, d−1 | a=k·CCOmax, ppm·d−1 |
|---|---|---|---|---|---|
| 35 | 2.7 | 1st-order | 185.3 ± 21.4 | 0.846 ± 0.025 | 156.5 ± 15.6 |
| 3.4 | 1st-order | 109.5 ± 52.5 | 0.822 ± 0.185 | 90.4 ± 43.1 | |
| 4.8 | 1st-order | 101.0 ± 19.0 | 0.834 ± 0.160 | 86.2 ± 32.5 | |
| 7.8 | 1st-order | 120.1 ± 77.7 | 0.850 ± 0.335 | 119.4 ± 120.5 | |
| 45 | 2.7 | 1st-order | 103.1 ± 44.0 | 0.185 ± 0.053 | 18.5 ± 8.8 |
| 3.4 | 1st-order | 214.6 ± 84.7 | 0.453 ± 0.301 | 114.2 ± 116.2 | |
| 4.8 | 1st-order | 95.6 ± 12.4 | 0.218 ± 0.041 | 21.1 ± 6.5 | |
| 7.8 | 1st-order | 80.2 ± 18.2 | 0.179 ± 0.092 | 14.9 ± 10.2 | |
| 55 | 2.7 | 1st-order | 471.9 ± 283.4 | 0.816 ± 0.496 | 478.8 ± 530.0 |
| 3.4 | 1st-order | 168.8 ± 84.4 | 0.338 ± 0.088 | 61.9 ± 46.1 | |
| 4.8 | 1st-order | 153.0 ± 19.3 | 0.410 ± 0.051 | 62.2 ± 5.0 | |
| 7.8 | 1st-order | 183.9 ± 87.3 | 0.434 ± 0.157 | 89.0 ± 61.6 | |
| 65 | 2.7 | 1st-order | 403.6 ± 43.1 | 0.422 ± 0.090 | 172.8 ± 56.2 |
| 3.4 | 1st-order | 127.5 ± 89.1 | 0.183 ± 0.111 | 29.9 ± 27.6 | |
| 4.8 | 0-order | – | – | 0.09 ± 0.1 | |
| 7.8 | 1st-order | 161.9 ± 152.2 | 0.670 ± 0.620 | 92.0 ± 73.2 |
Disclaimer/Publisher’s Note: The statements, opinions and data contained in all publications are solely those of the individual author(s) and contributor(s) and not of MDPI and/or the editor(s). MDPI and/or the editor(s) disclaim responsibility for any injury to people or property resulting from any ideas, methods, instructions or products referred to in the content. |
© 2023 by the authors. Licensee MDPI, Basel, Switzerland. This article is an open access article distributed under the terms and conditions of the Creative Commons Attribution (CC BY) license (http://creativecommons.org/licenses/by/4.0/).


