Submitted:
10 May 2023
Posted:
11 May 2023
You are already at the latest version
Abstract
Keywords:
1. Introduction
2. Materials and Methods
3. Results
3.1. Velocity Distribution
3.2. Reynolds Normal and Shear Stress Distributions
3.3. Turbulence Kinetic Energy (TKE)
3.4. Turbulence Intensities
3.5. Skewness Coefficients
3.6. Quadrant Analysis
3.7. Spectral Analysis
4. Disscusions
5. Conclusions
- 1)
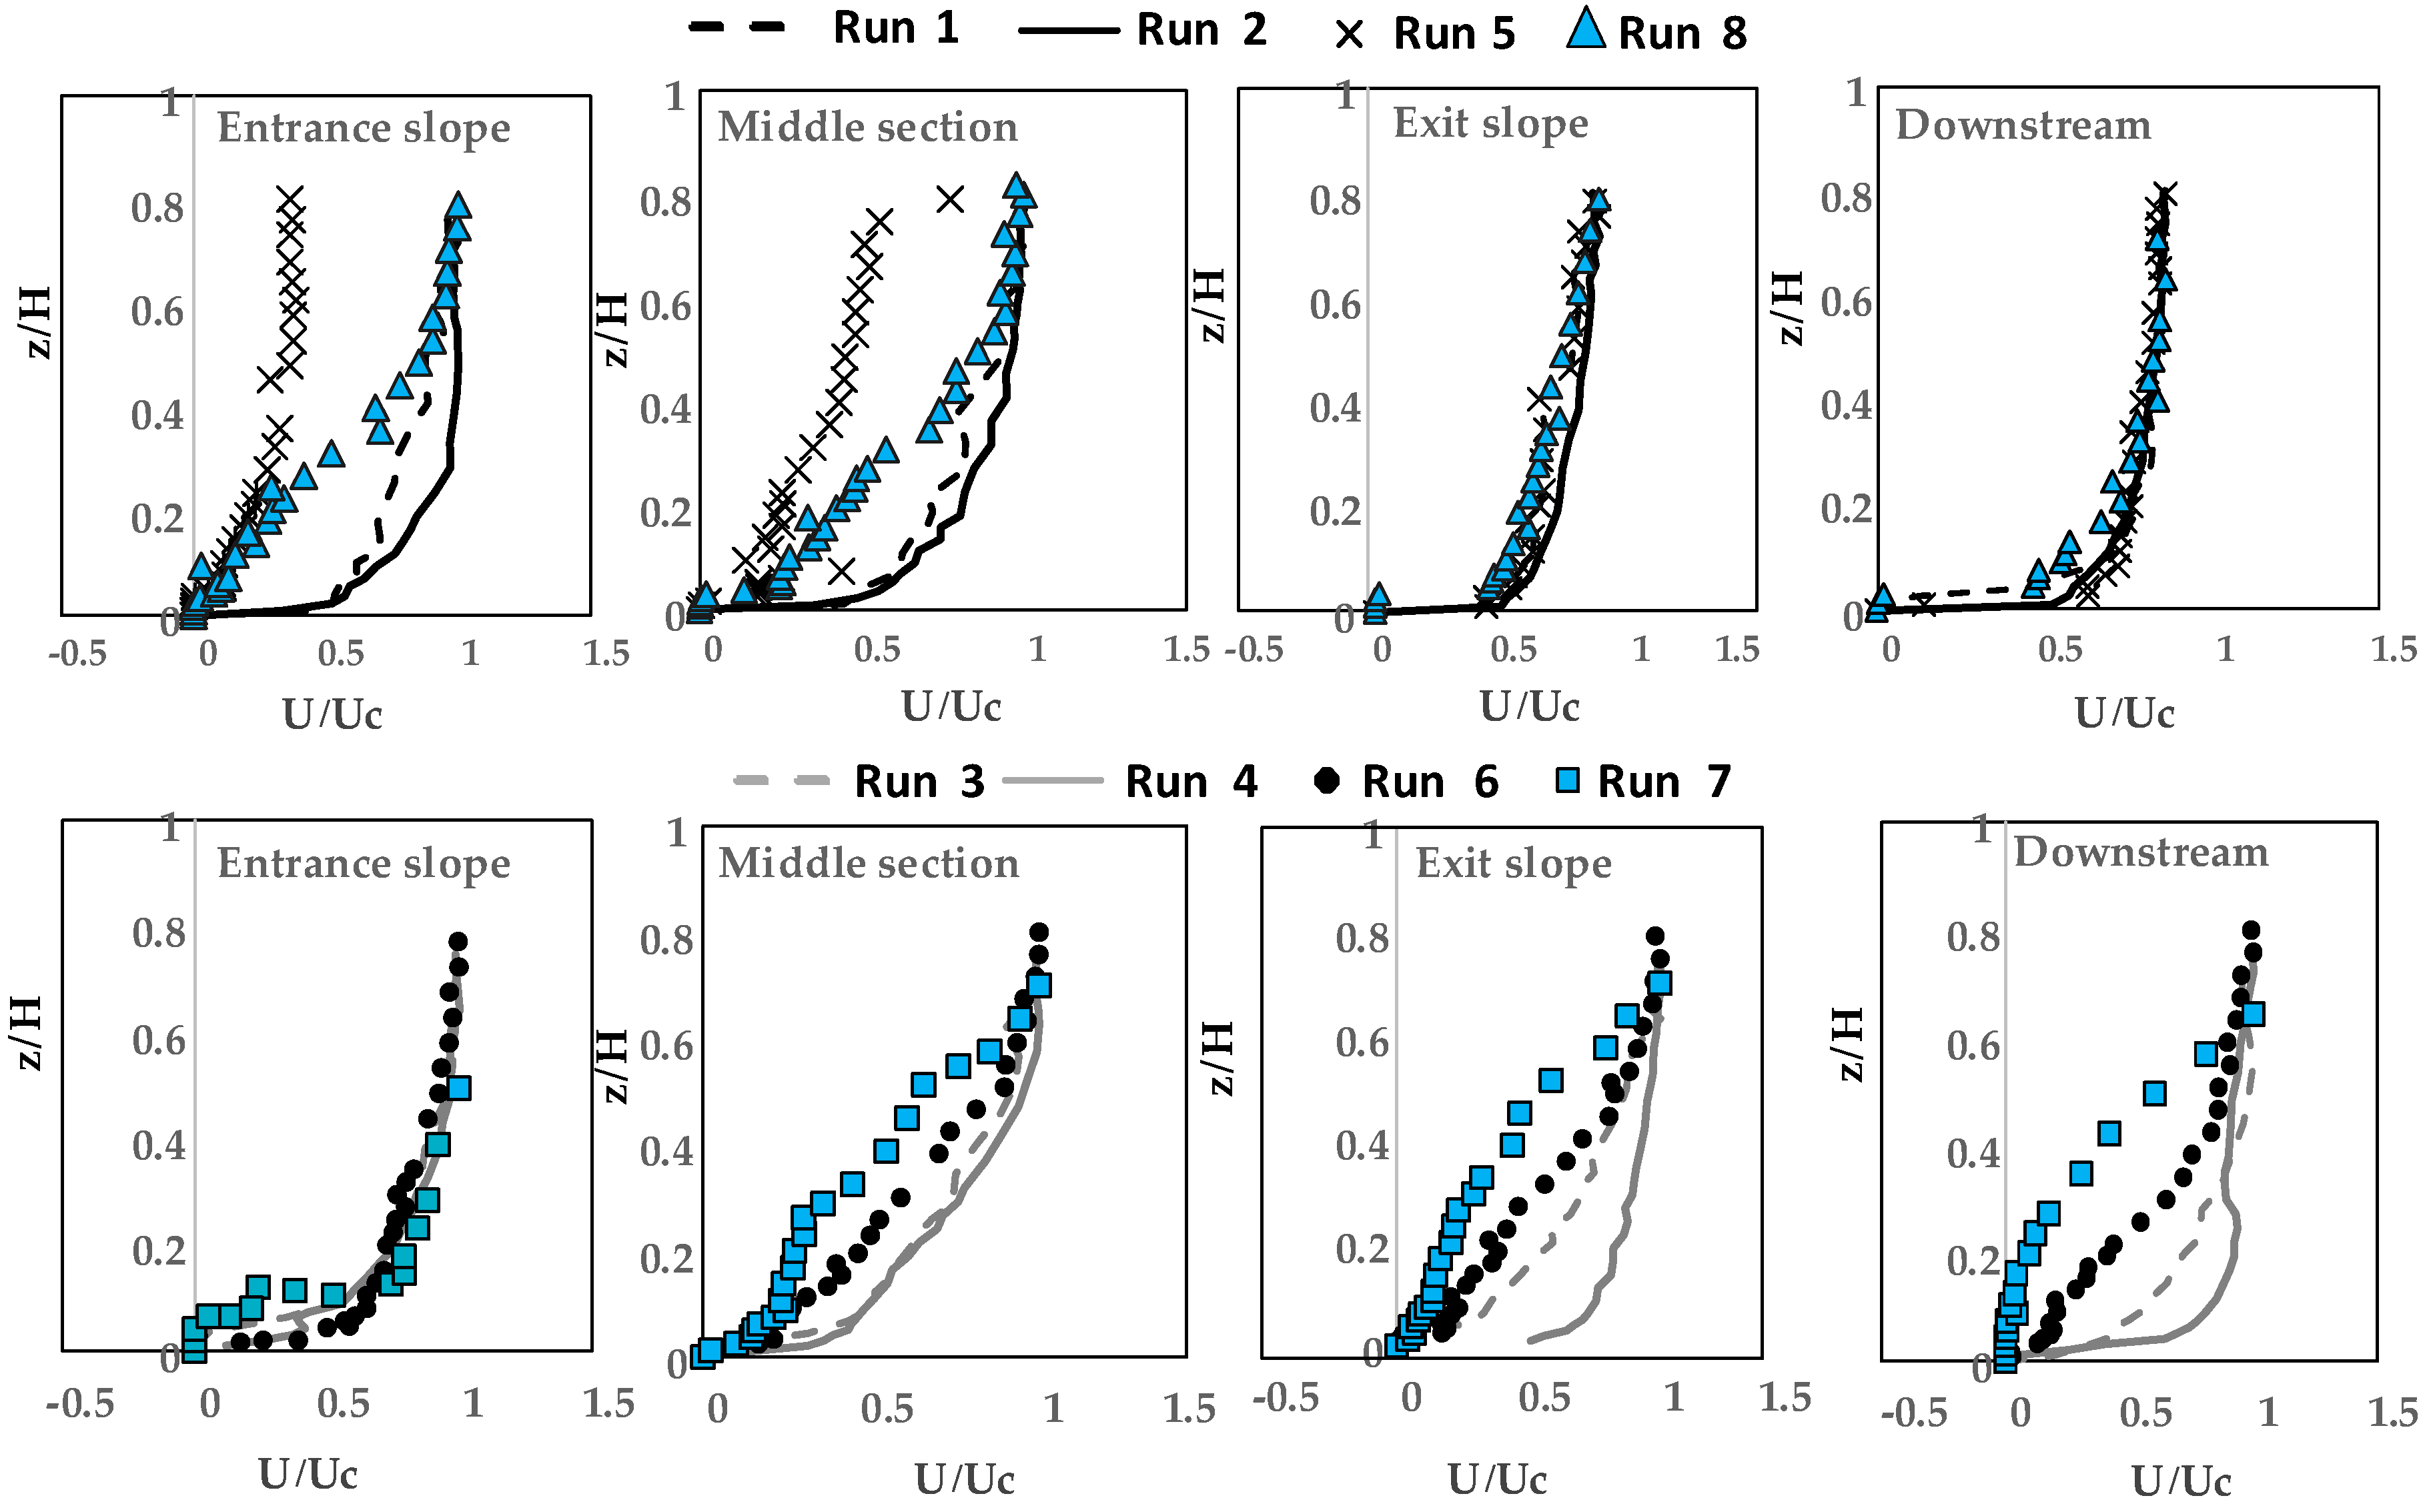
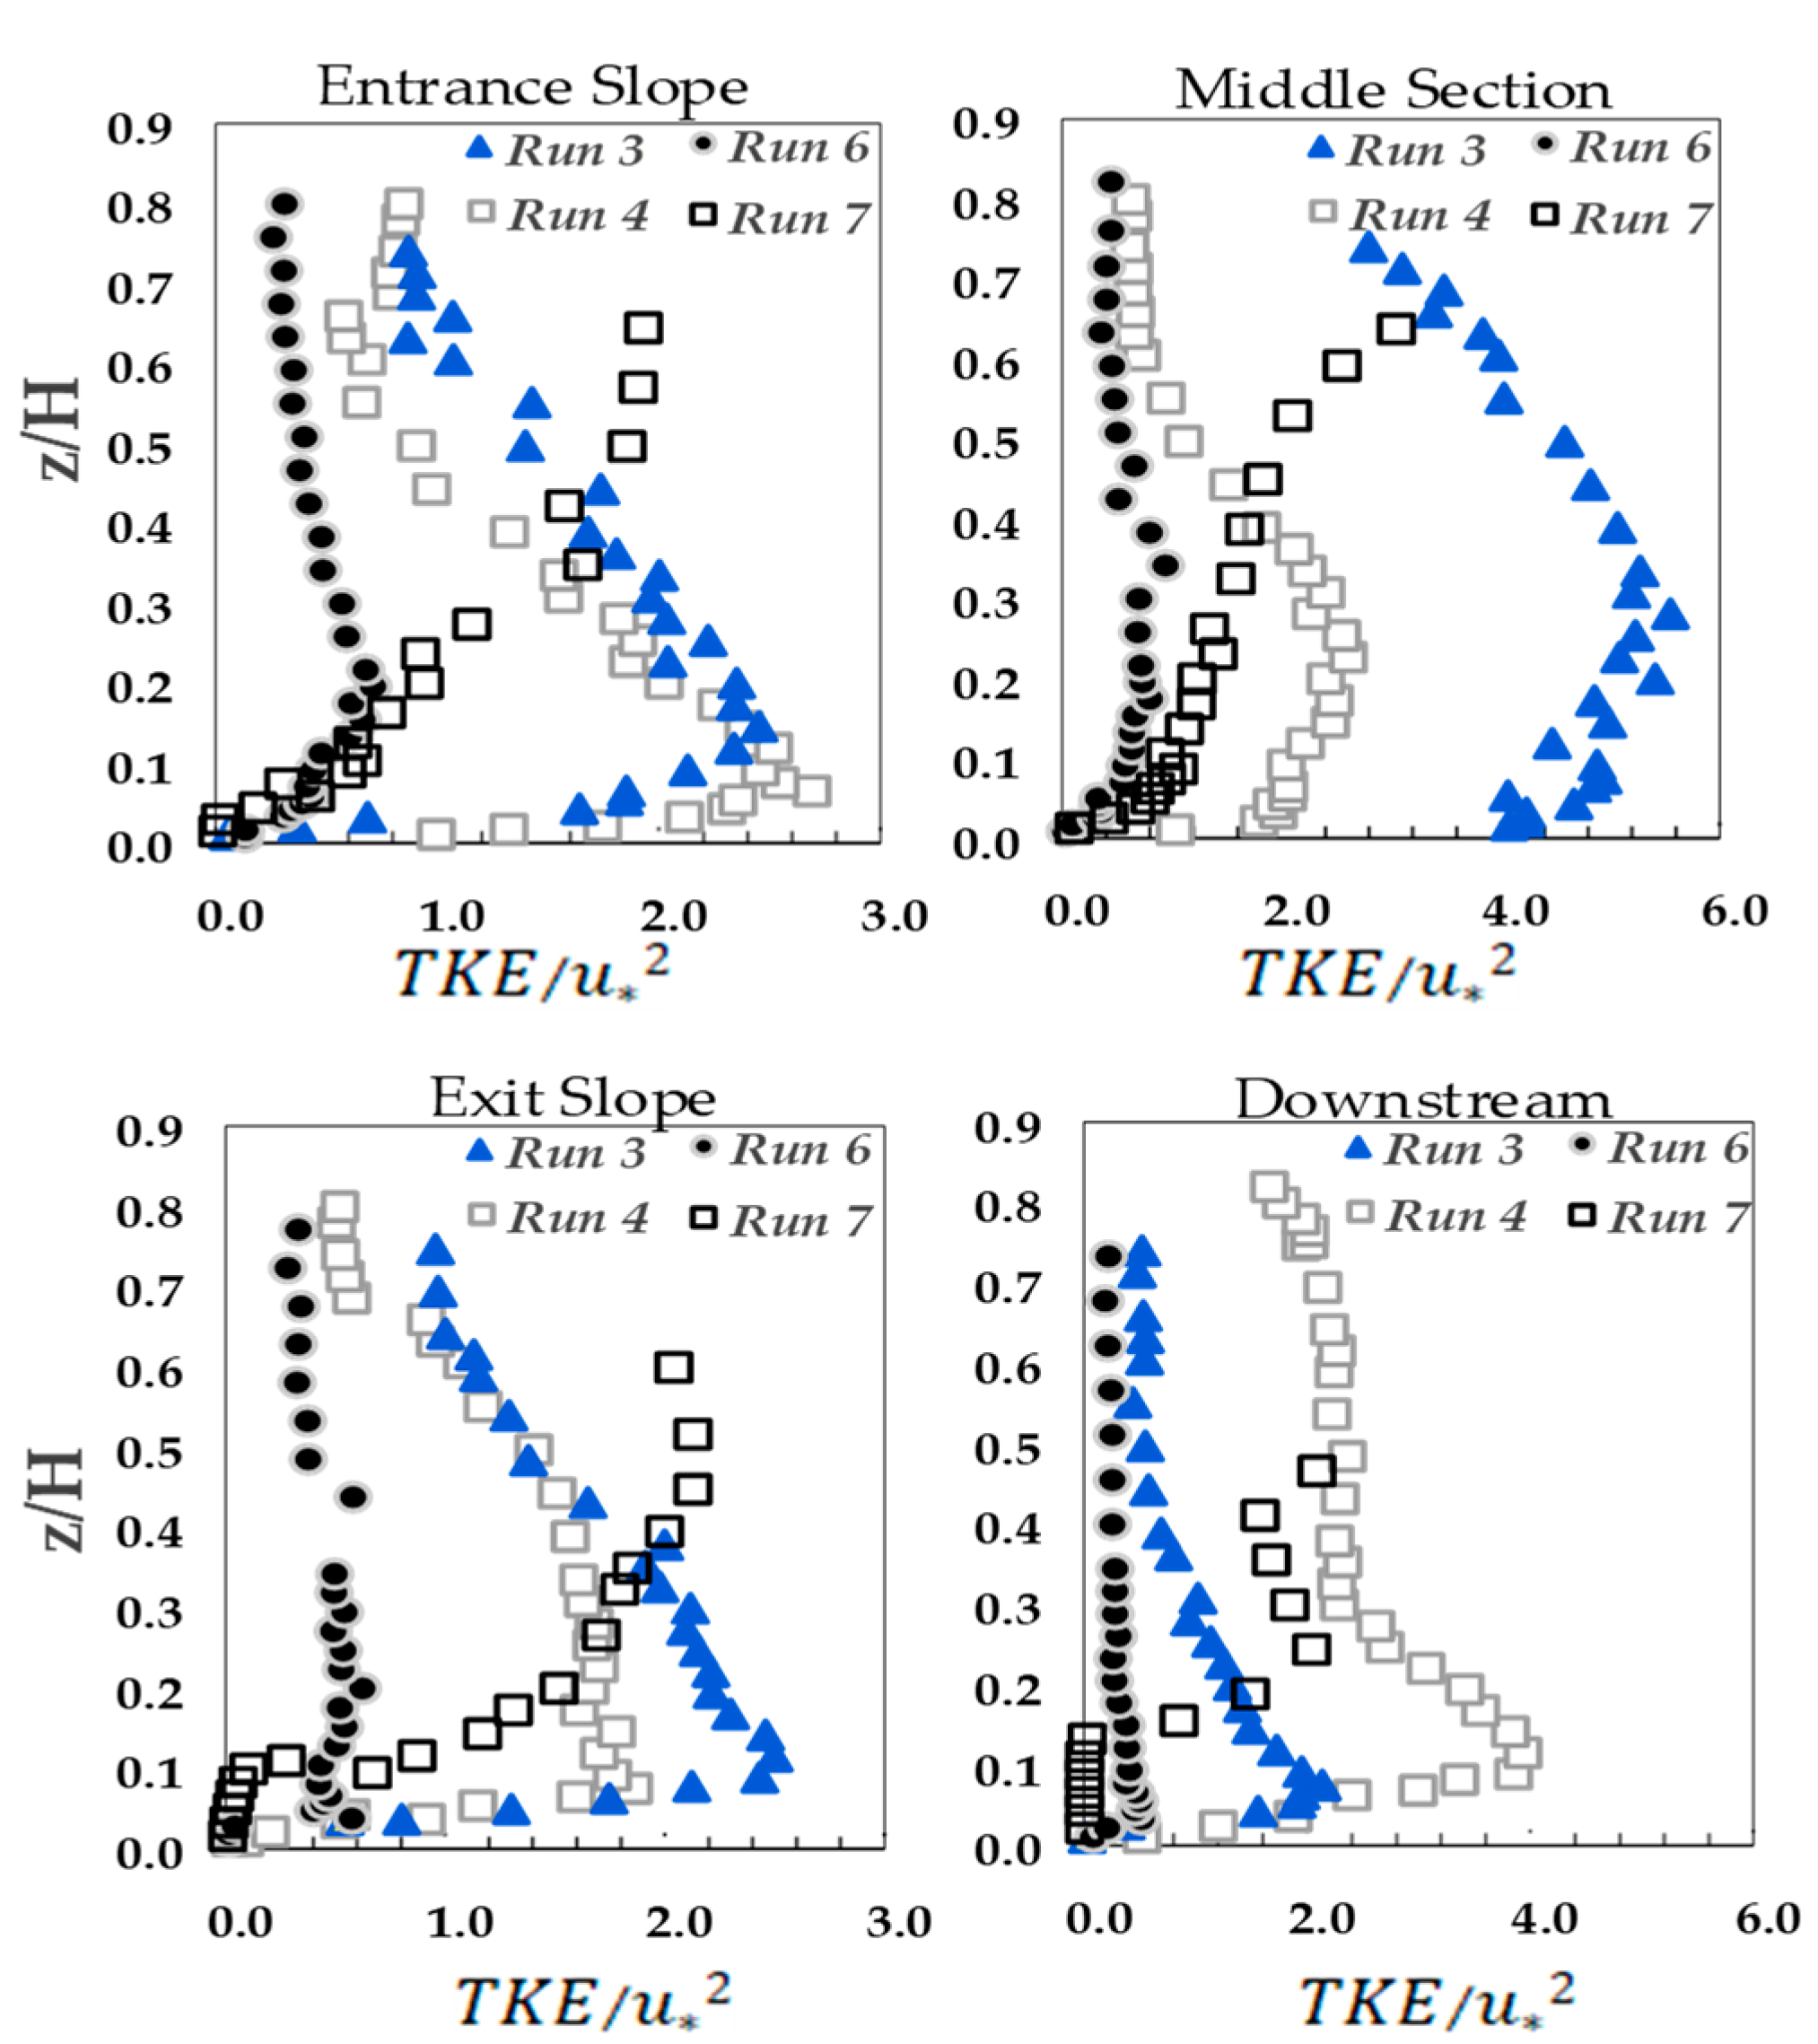
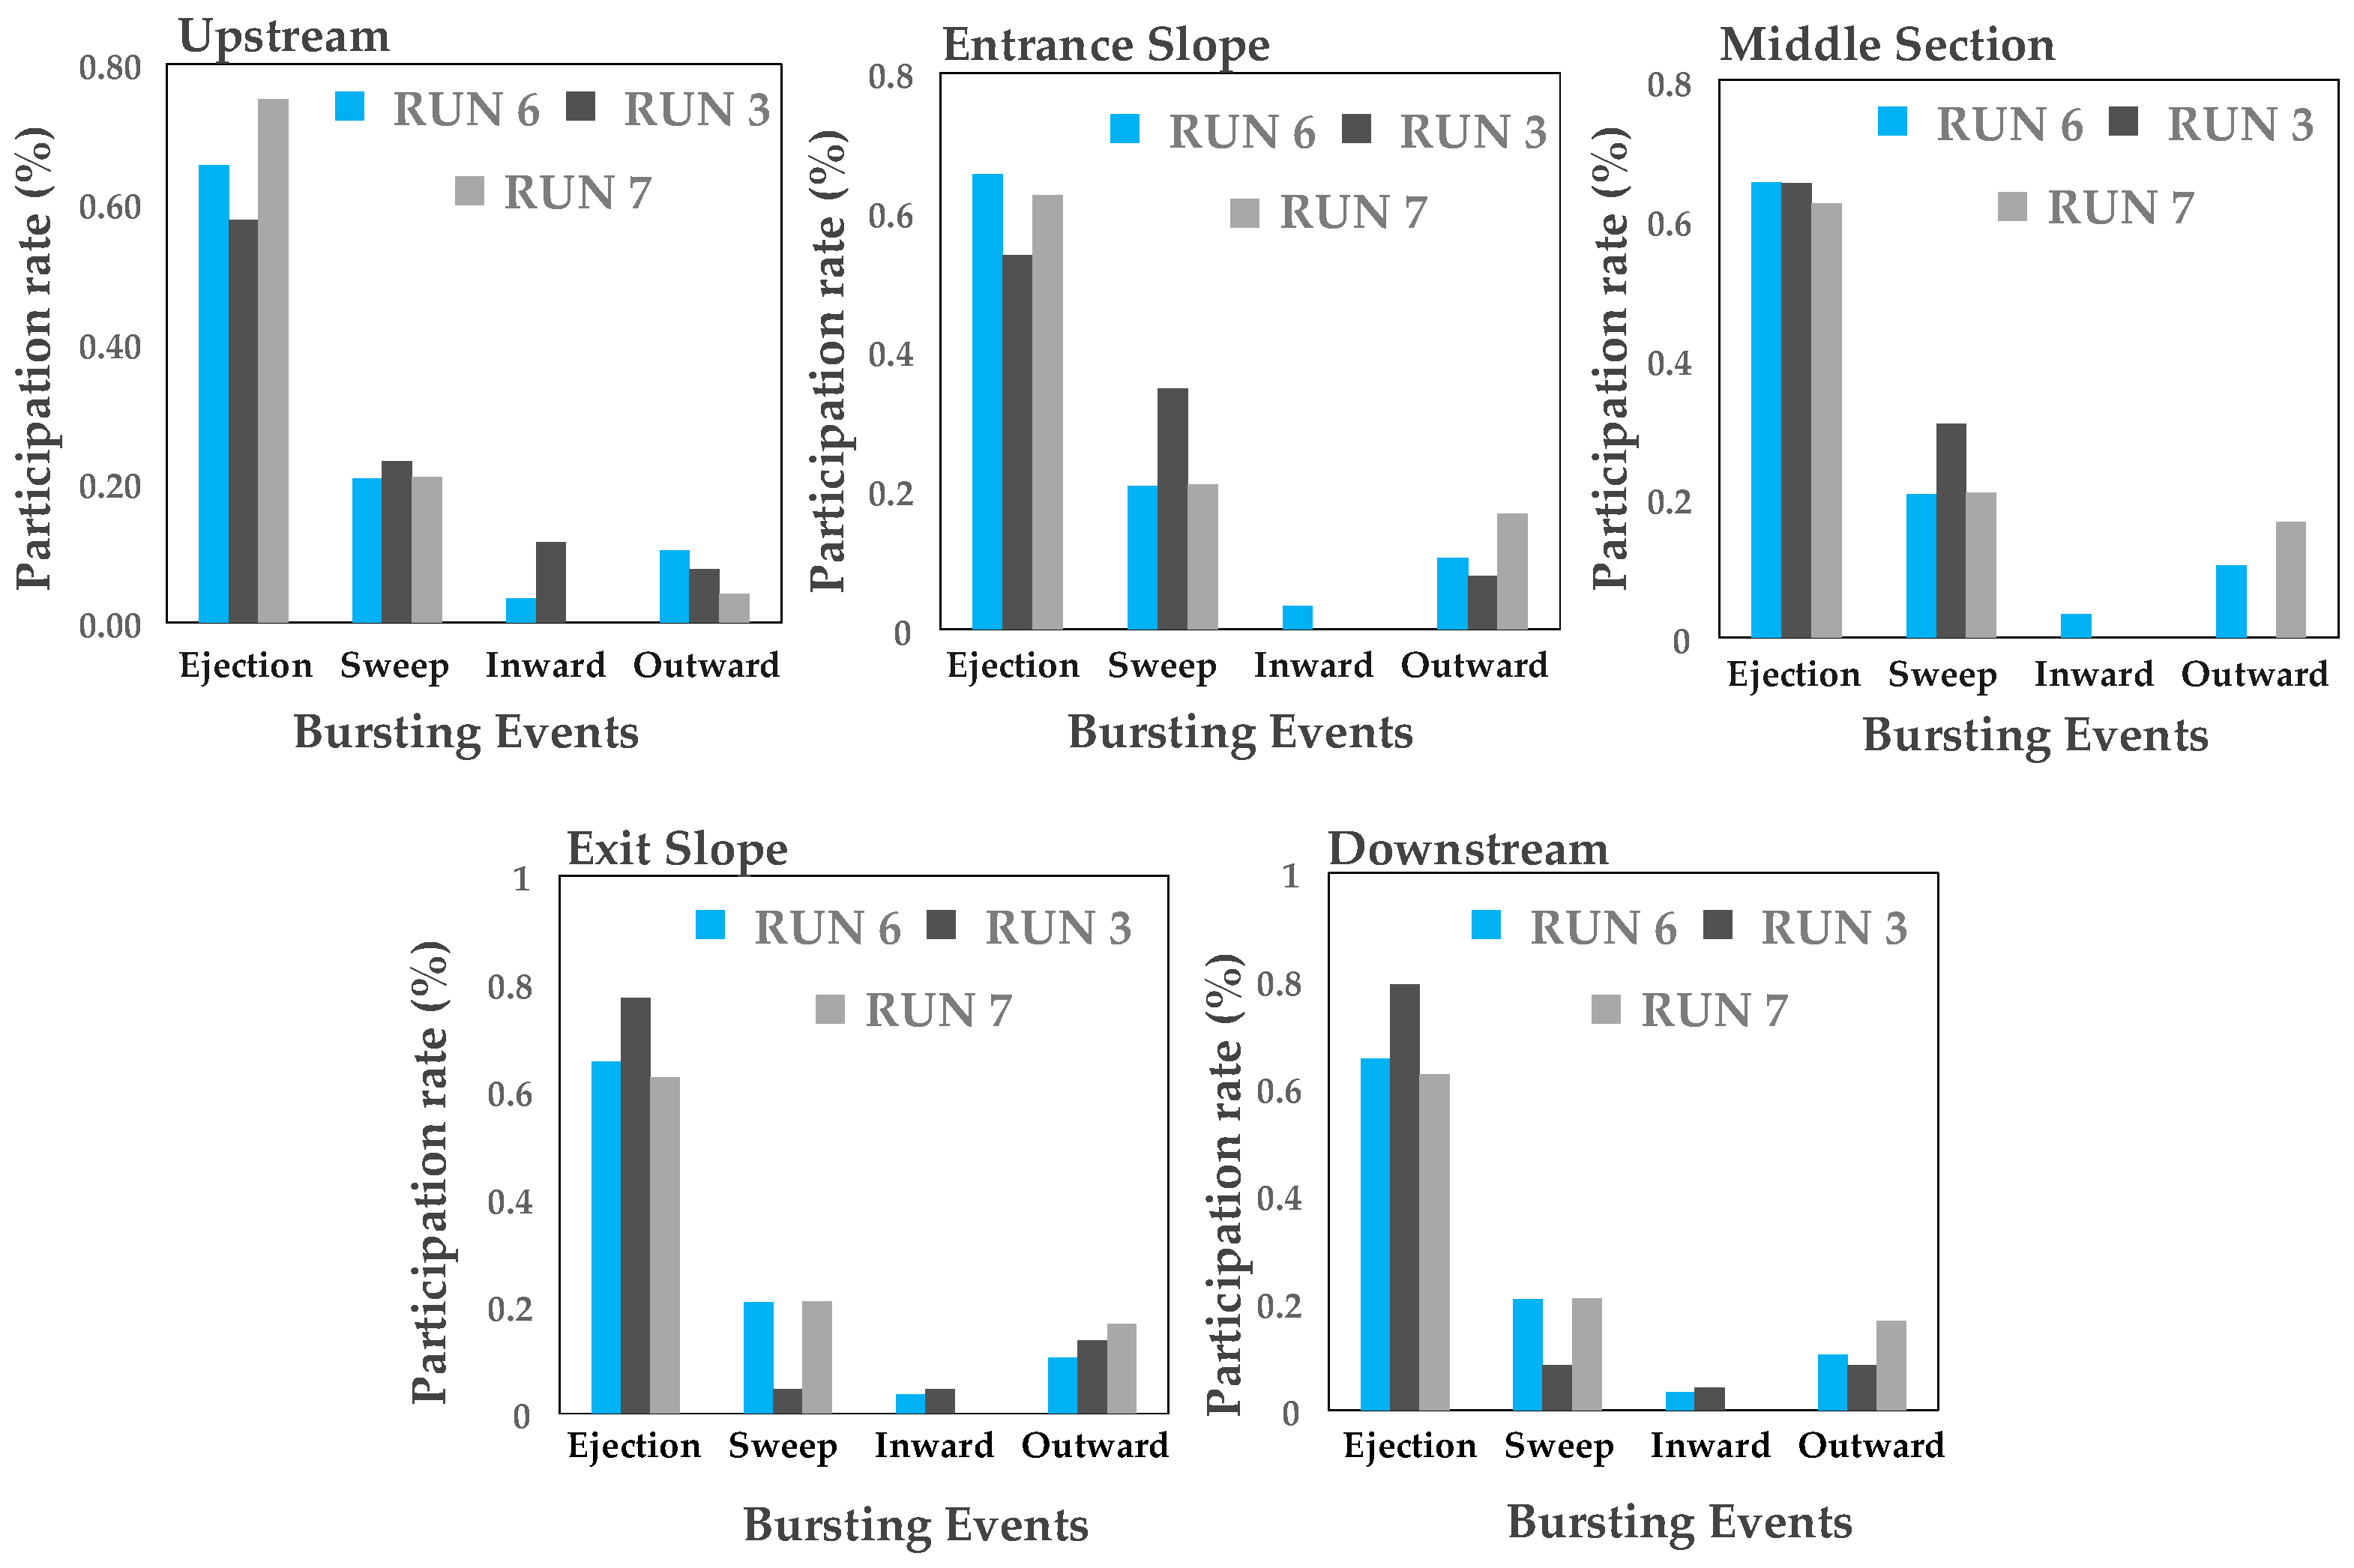
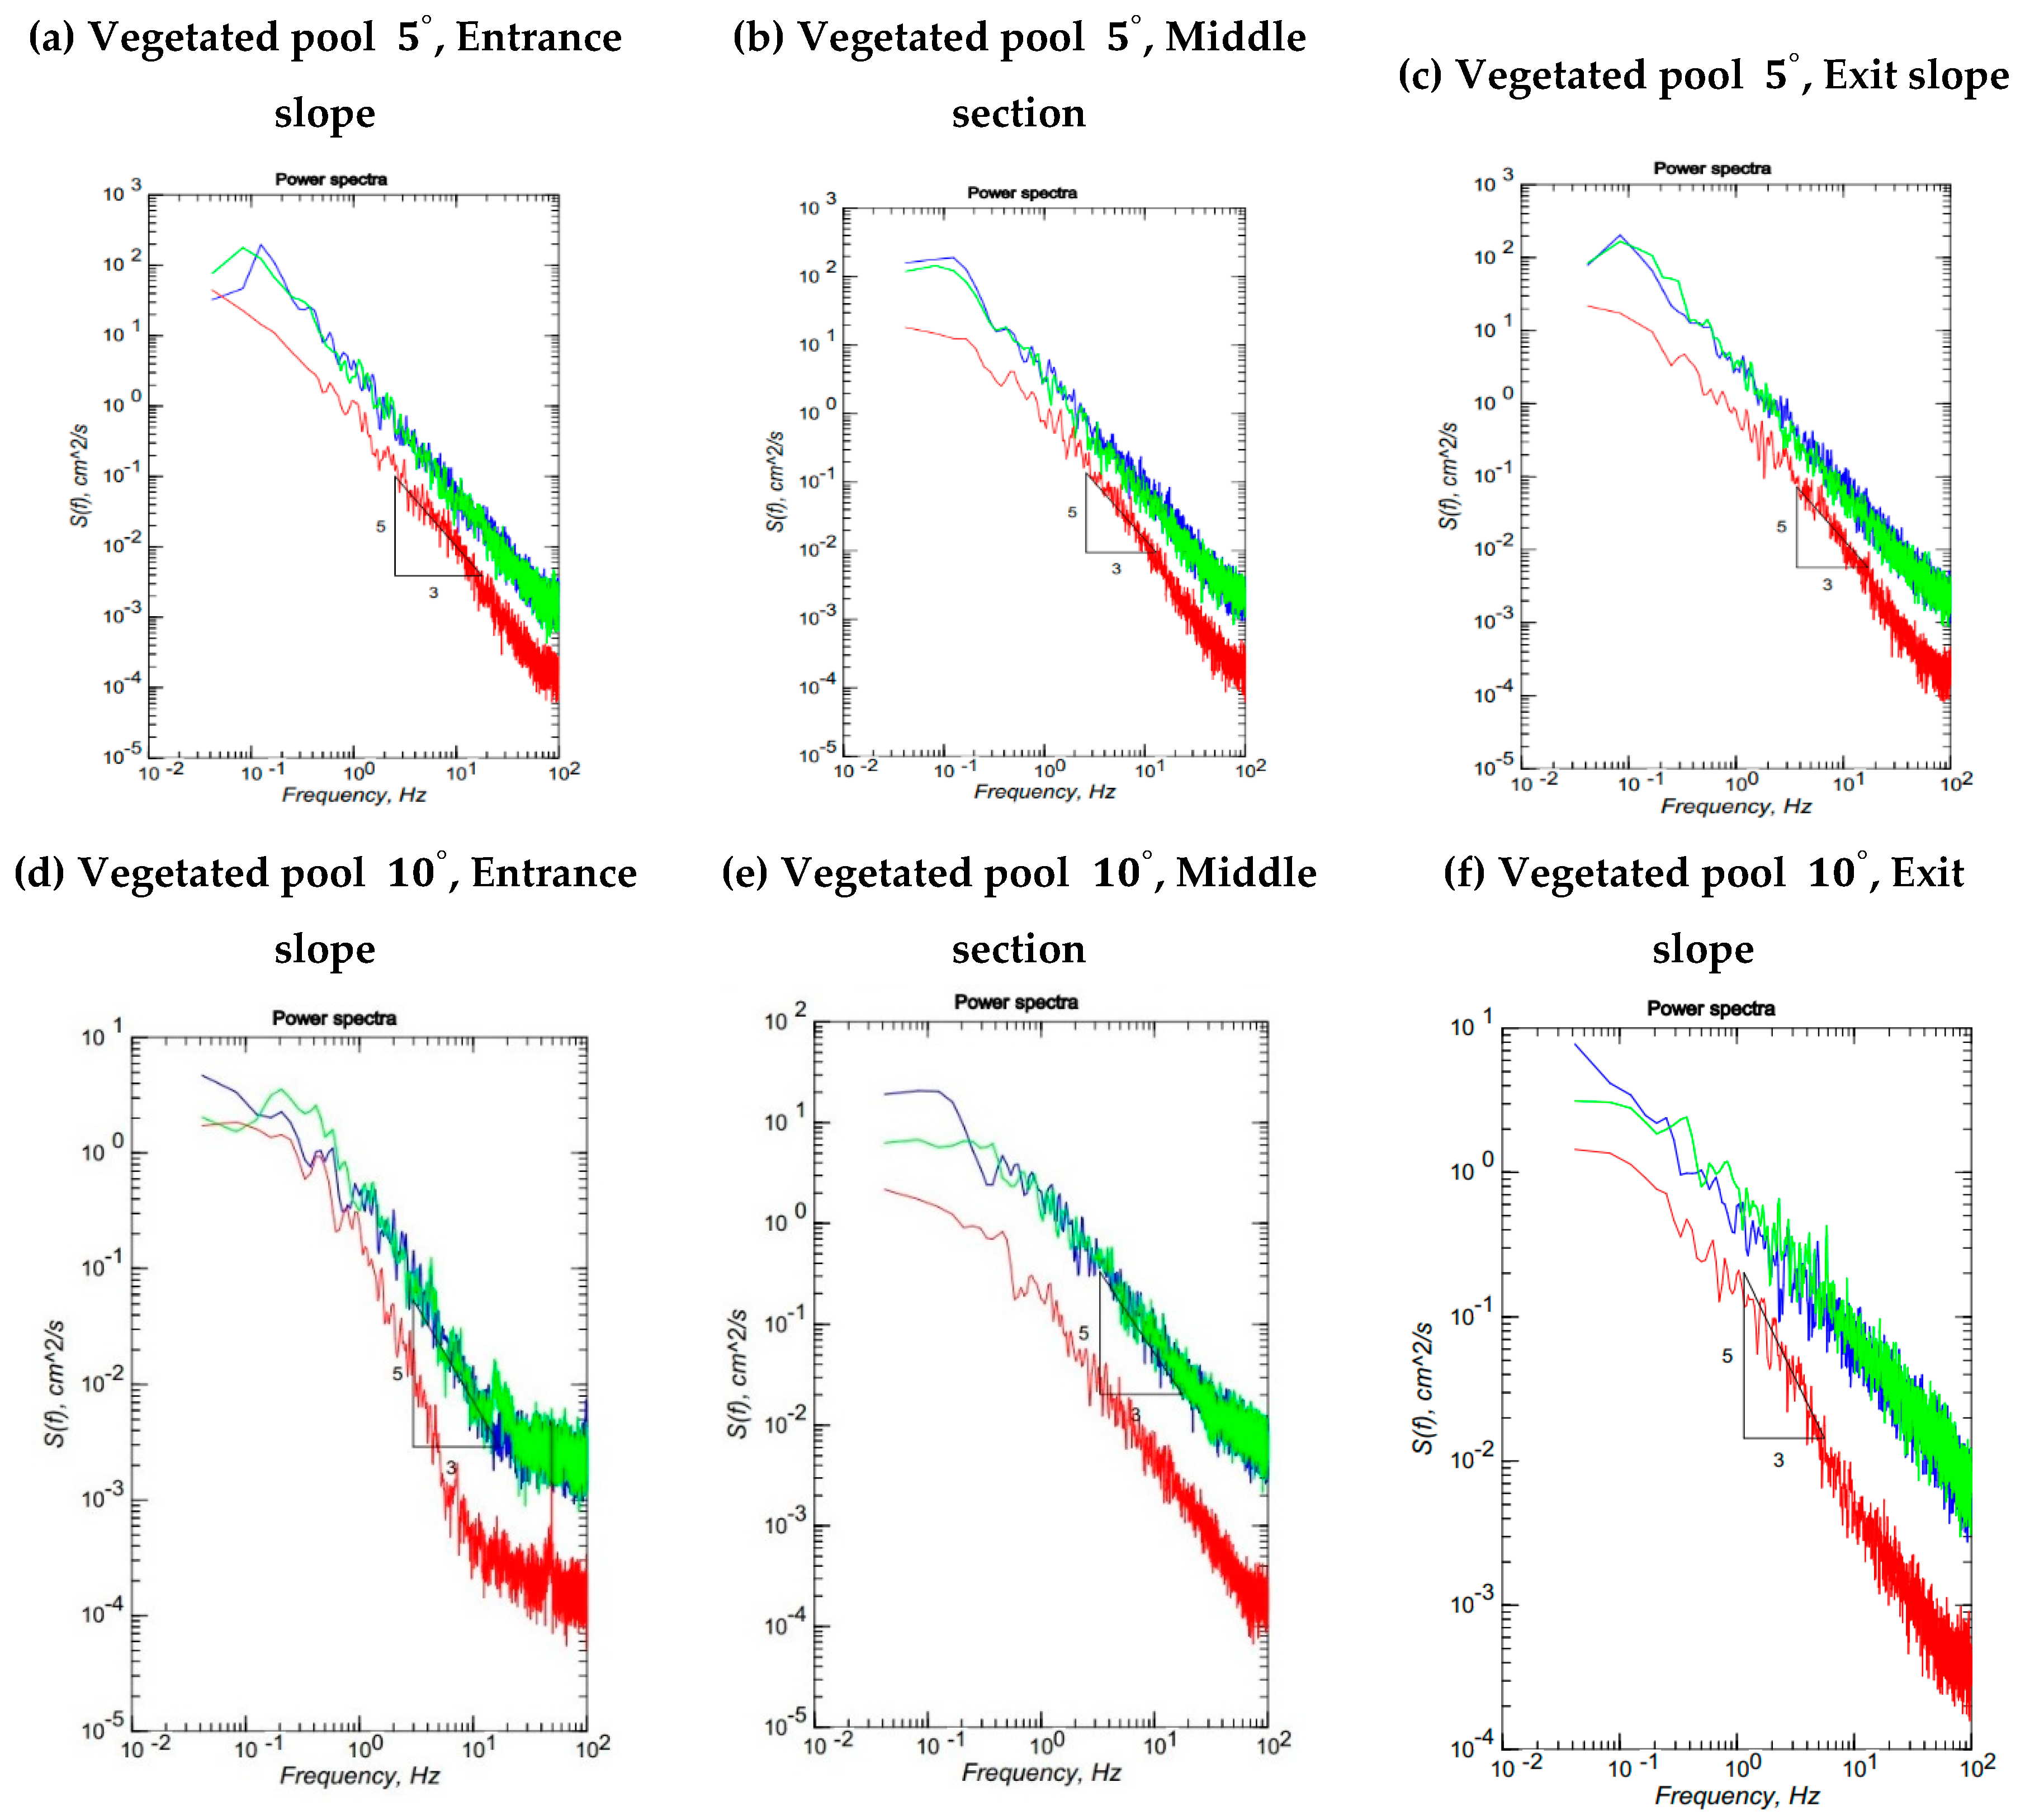
- In general, results of this study show that the bedform slopes of both entrance and exit sections, vegetation patch and the location of pool (entrance, middle and exit section) affects the velocity, Reynolds shear stresses, TKE distribution and the contribution of each bursting events on the turbulent flow structures. Results show that, with the entrance and exit slope of 10 dgree, the TKE distribution has no specific form (Run 7). However, with the small entrance and exit slope of 5 degree (Runs 3 and 4), a convex TKE distribution is observed with the maximum value near the bed. Results of the quadrant analysis reveals the bursting events at the trailing edge of vegetation patch where the flow leaves vegetation patch to gravel bed displays different distributions comparing to other locations along the 3D vegetation patch. This difference plays a significant role in estimating flow resitance in open channls. The validation of the spectral anaysis of the Kolmogorov power law for different bedforms slopes has been conducted.
- 2)
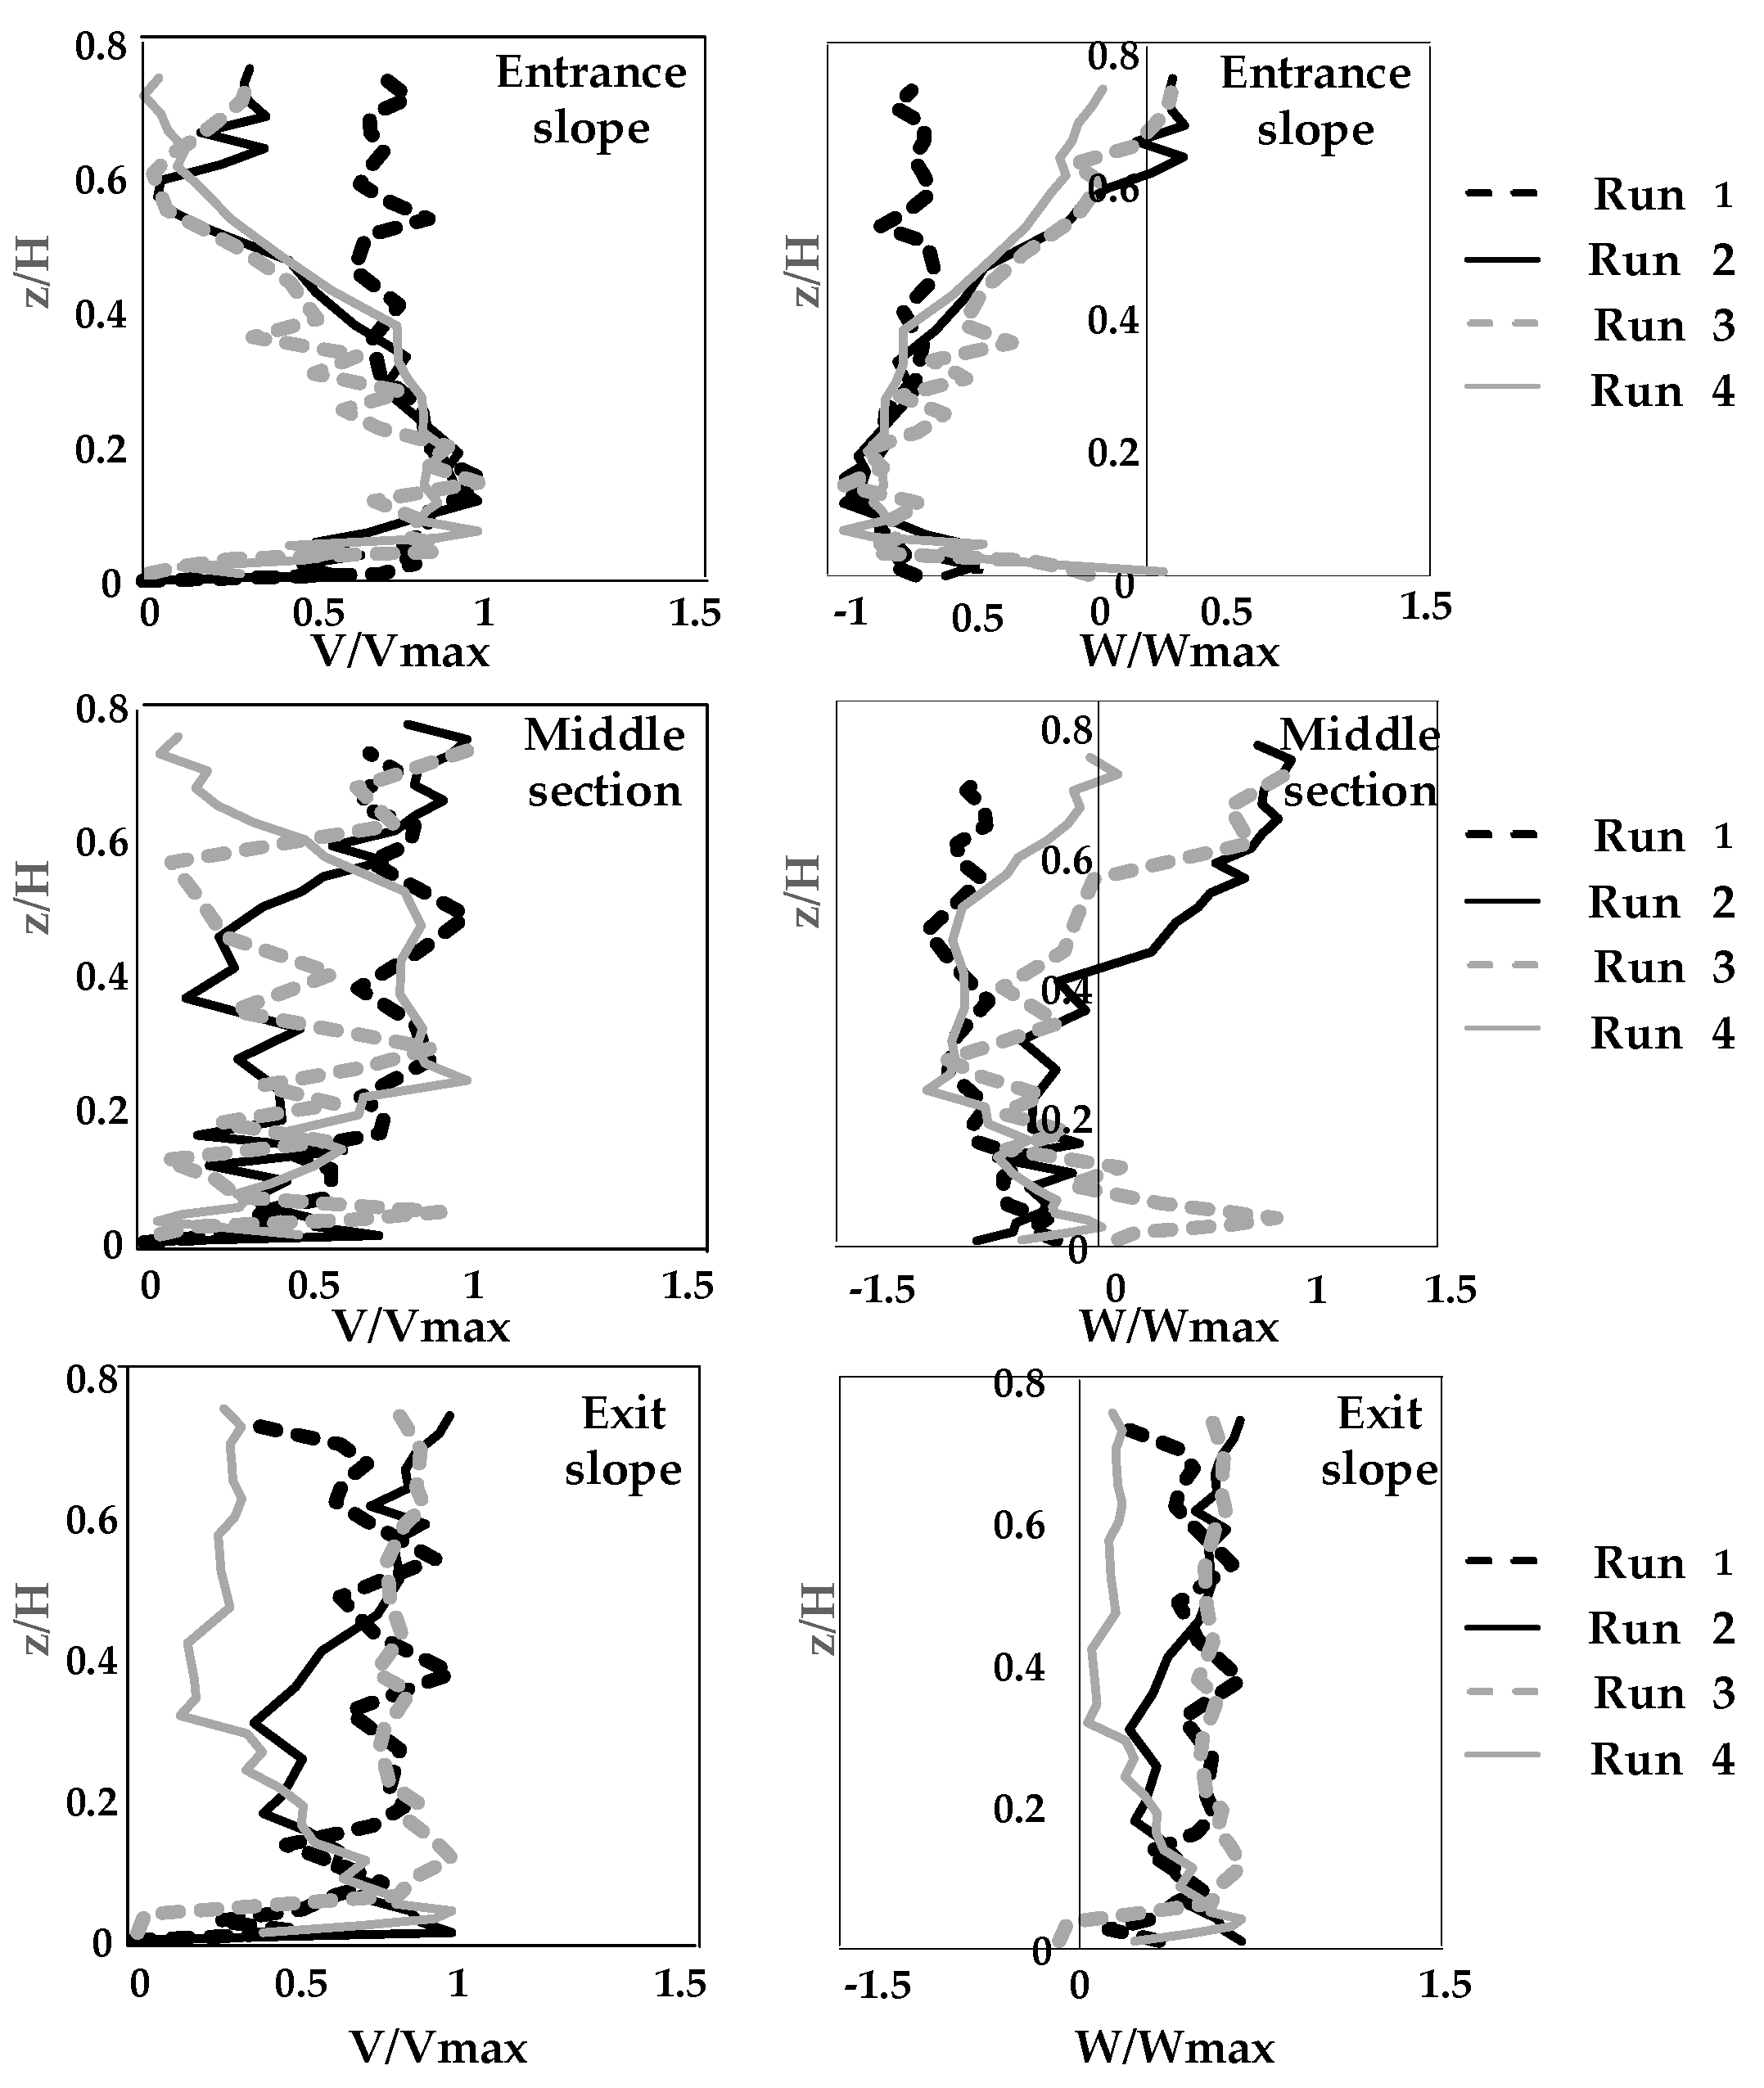
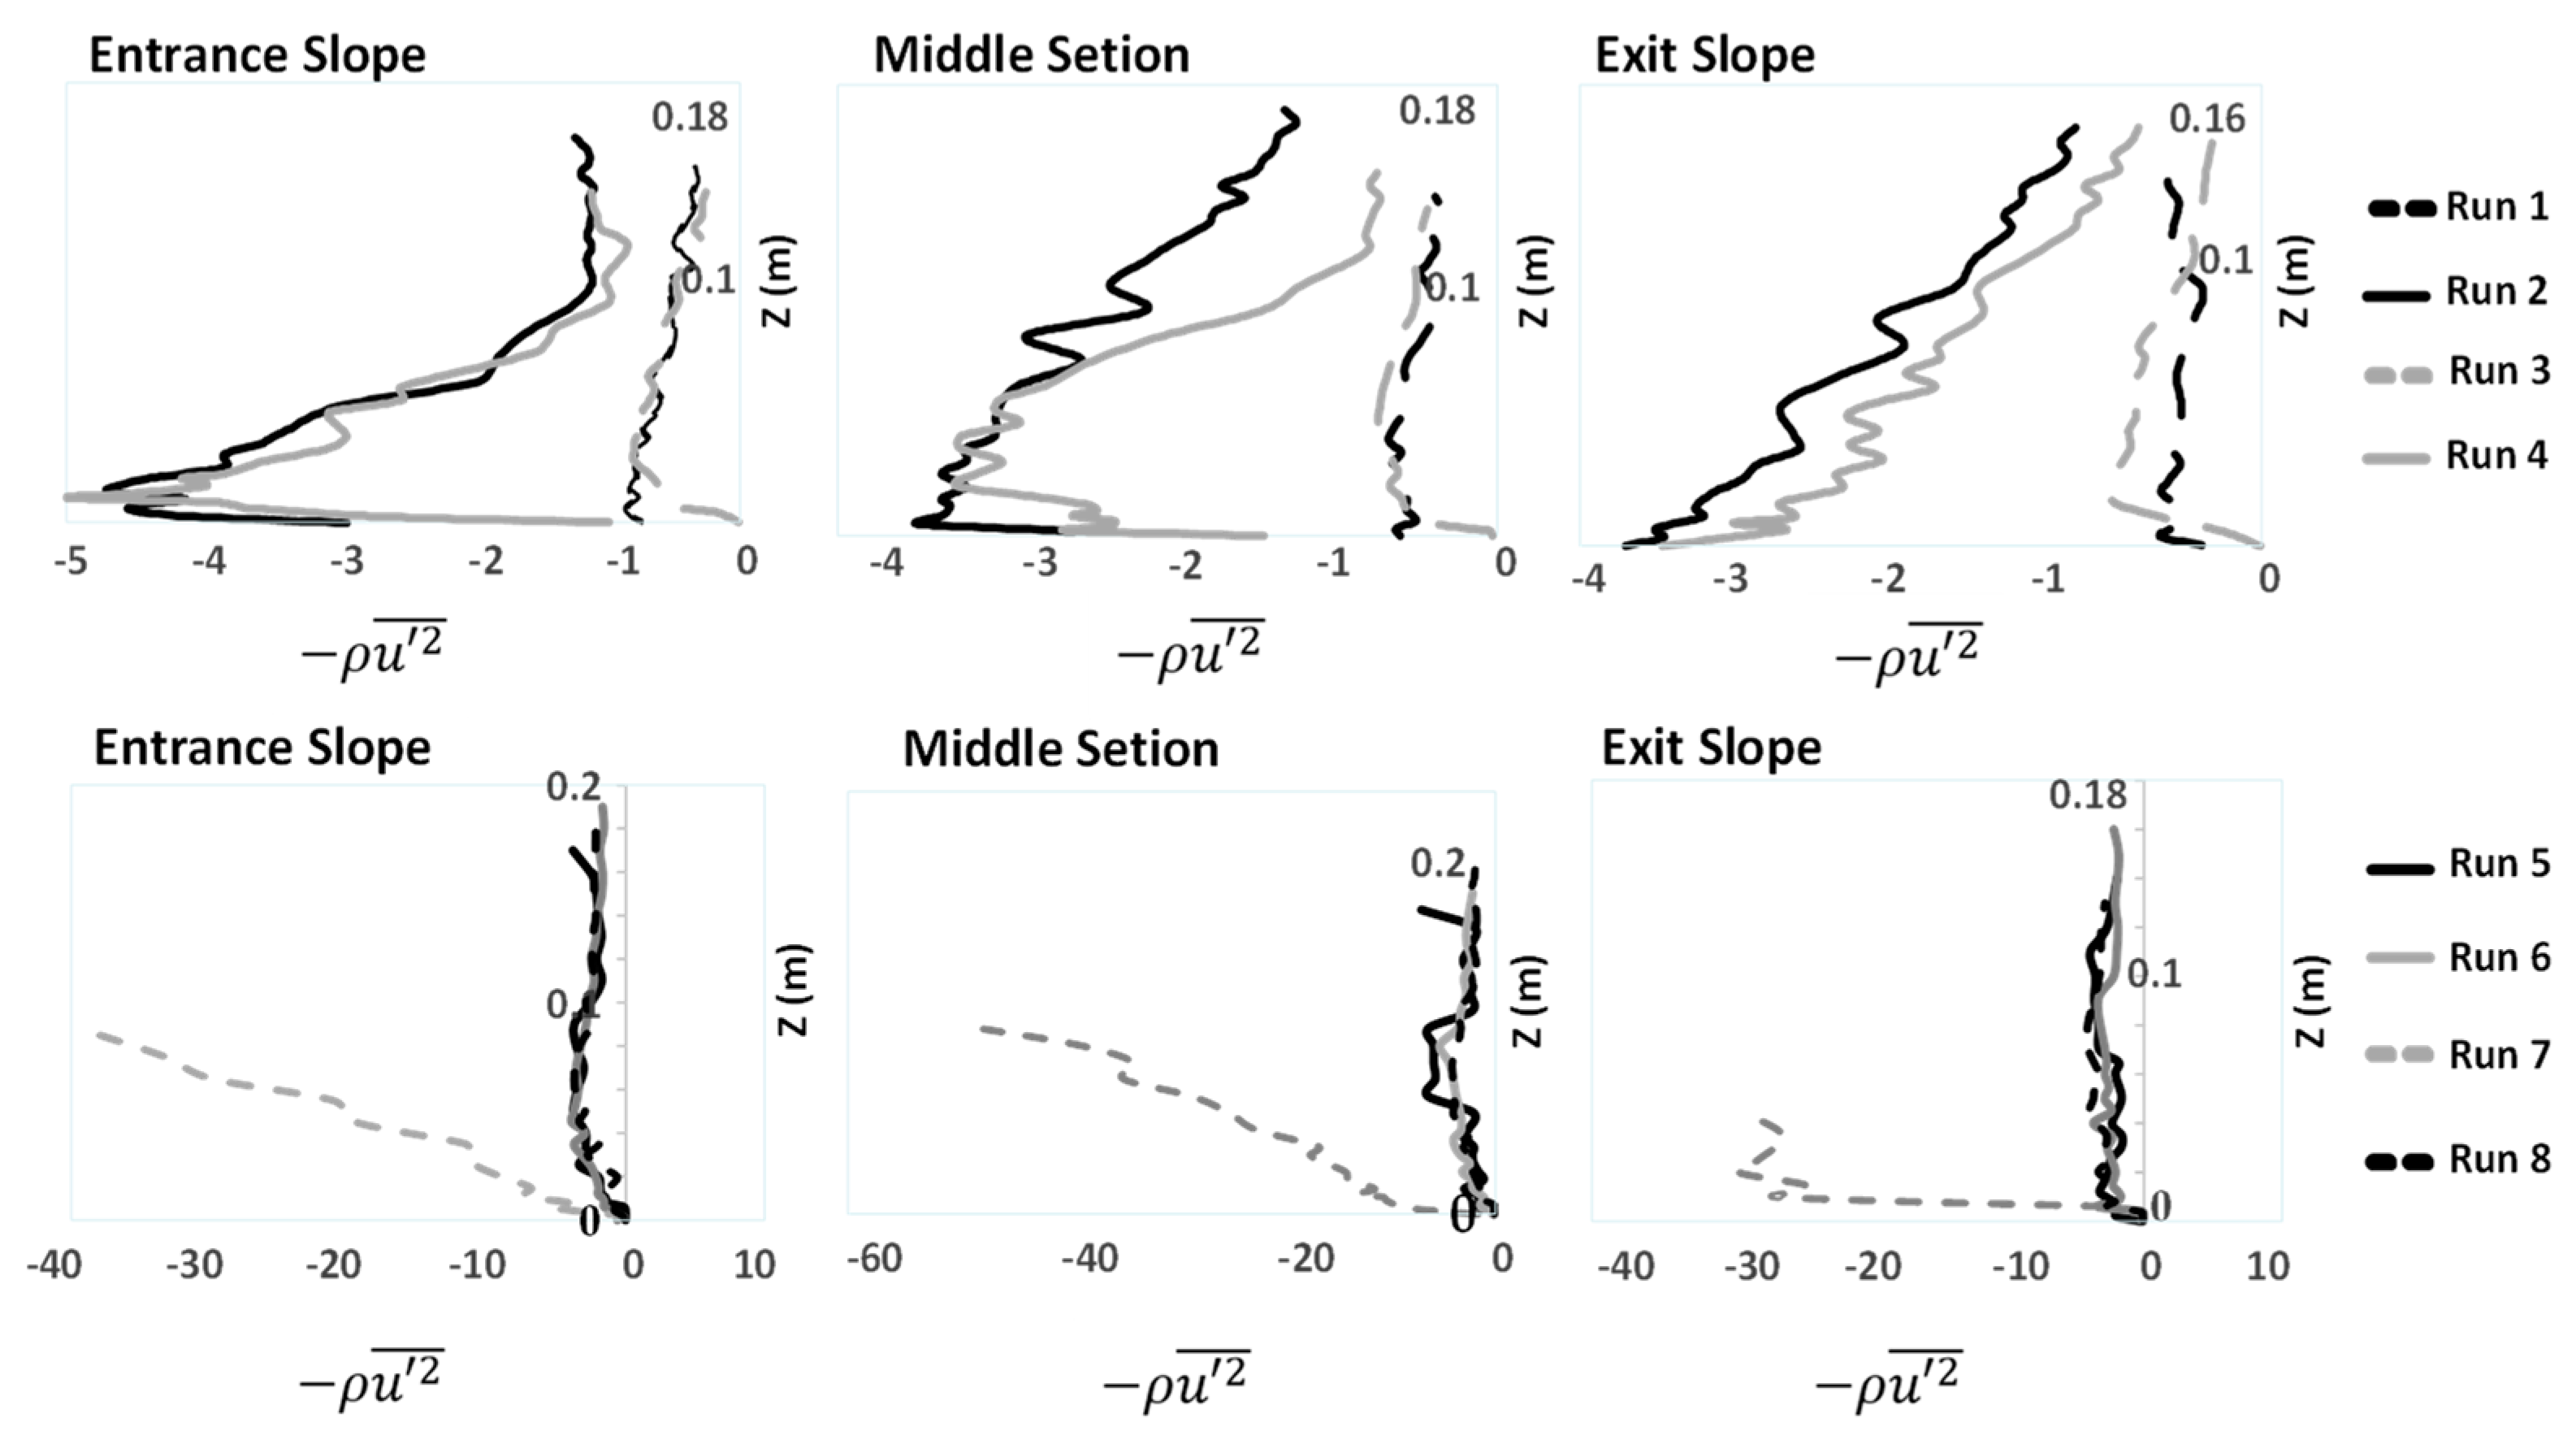
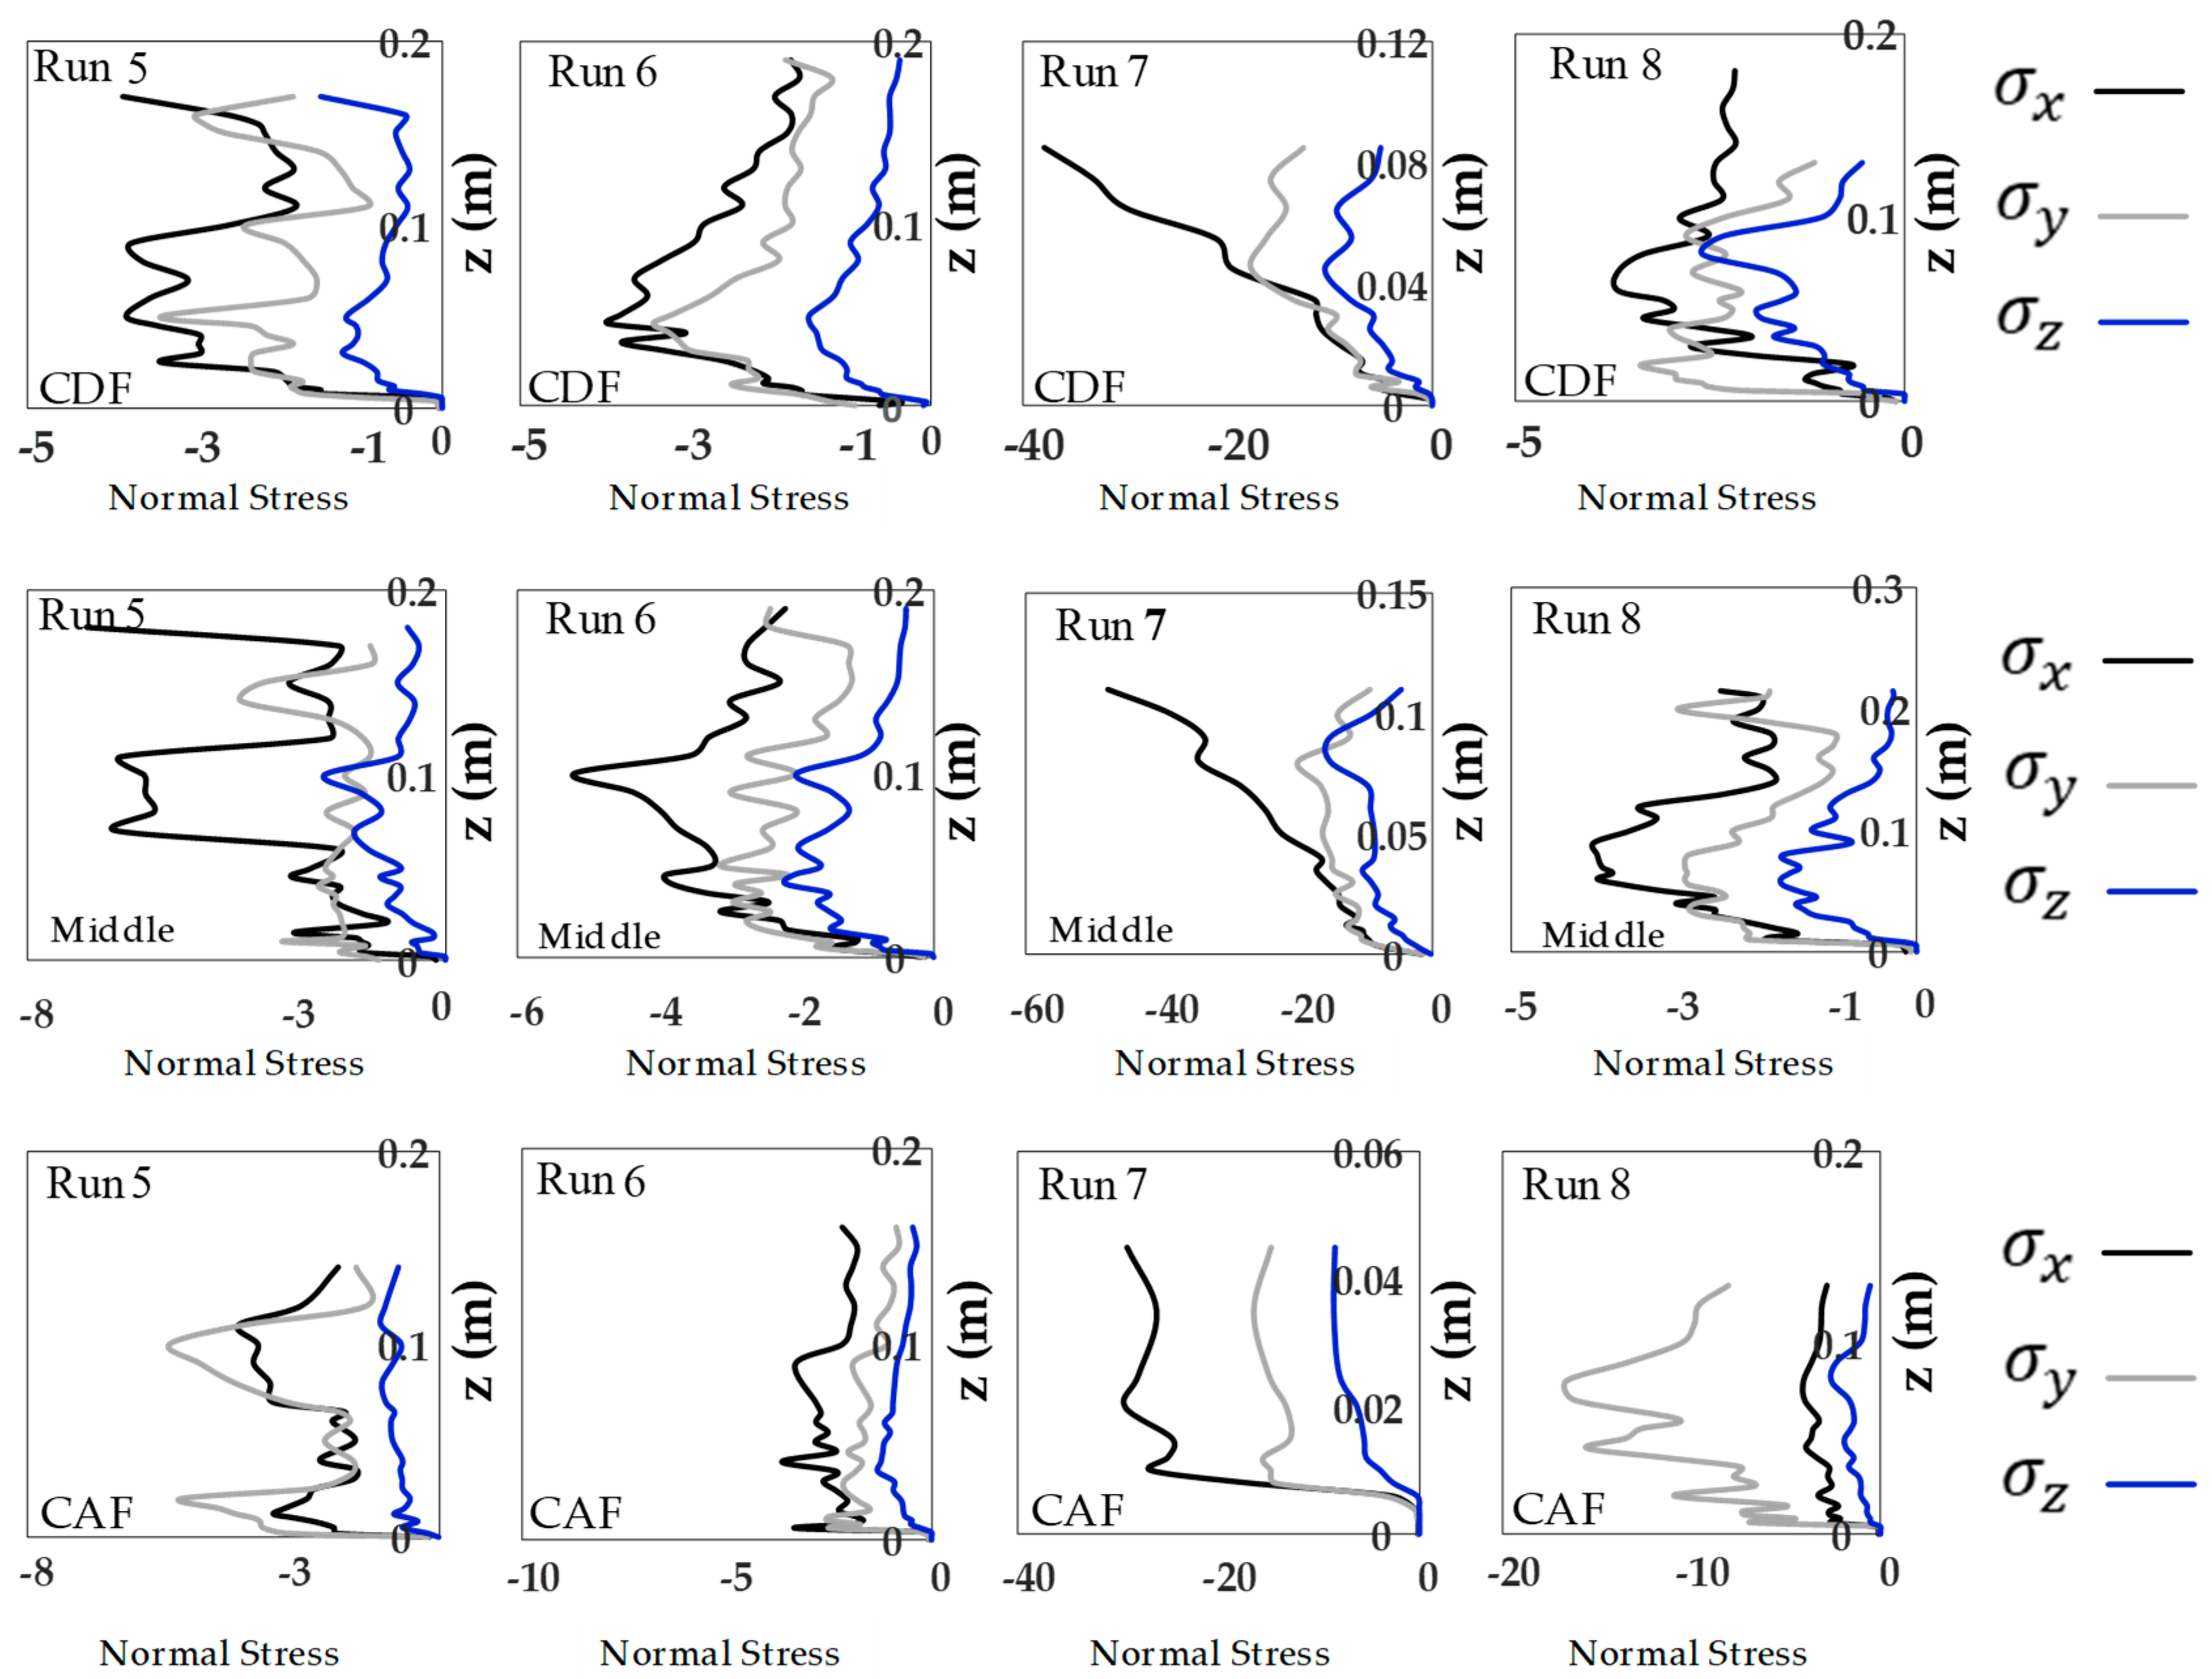
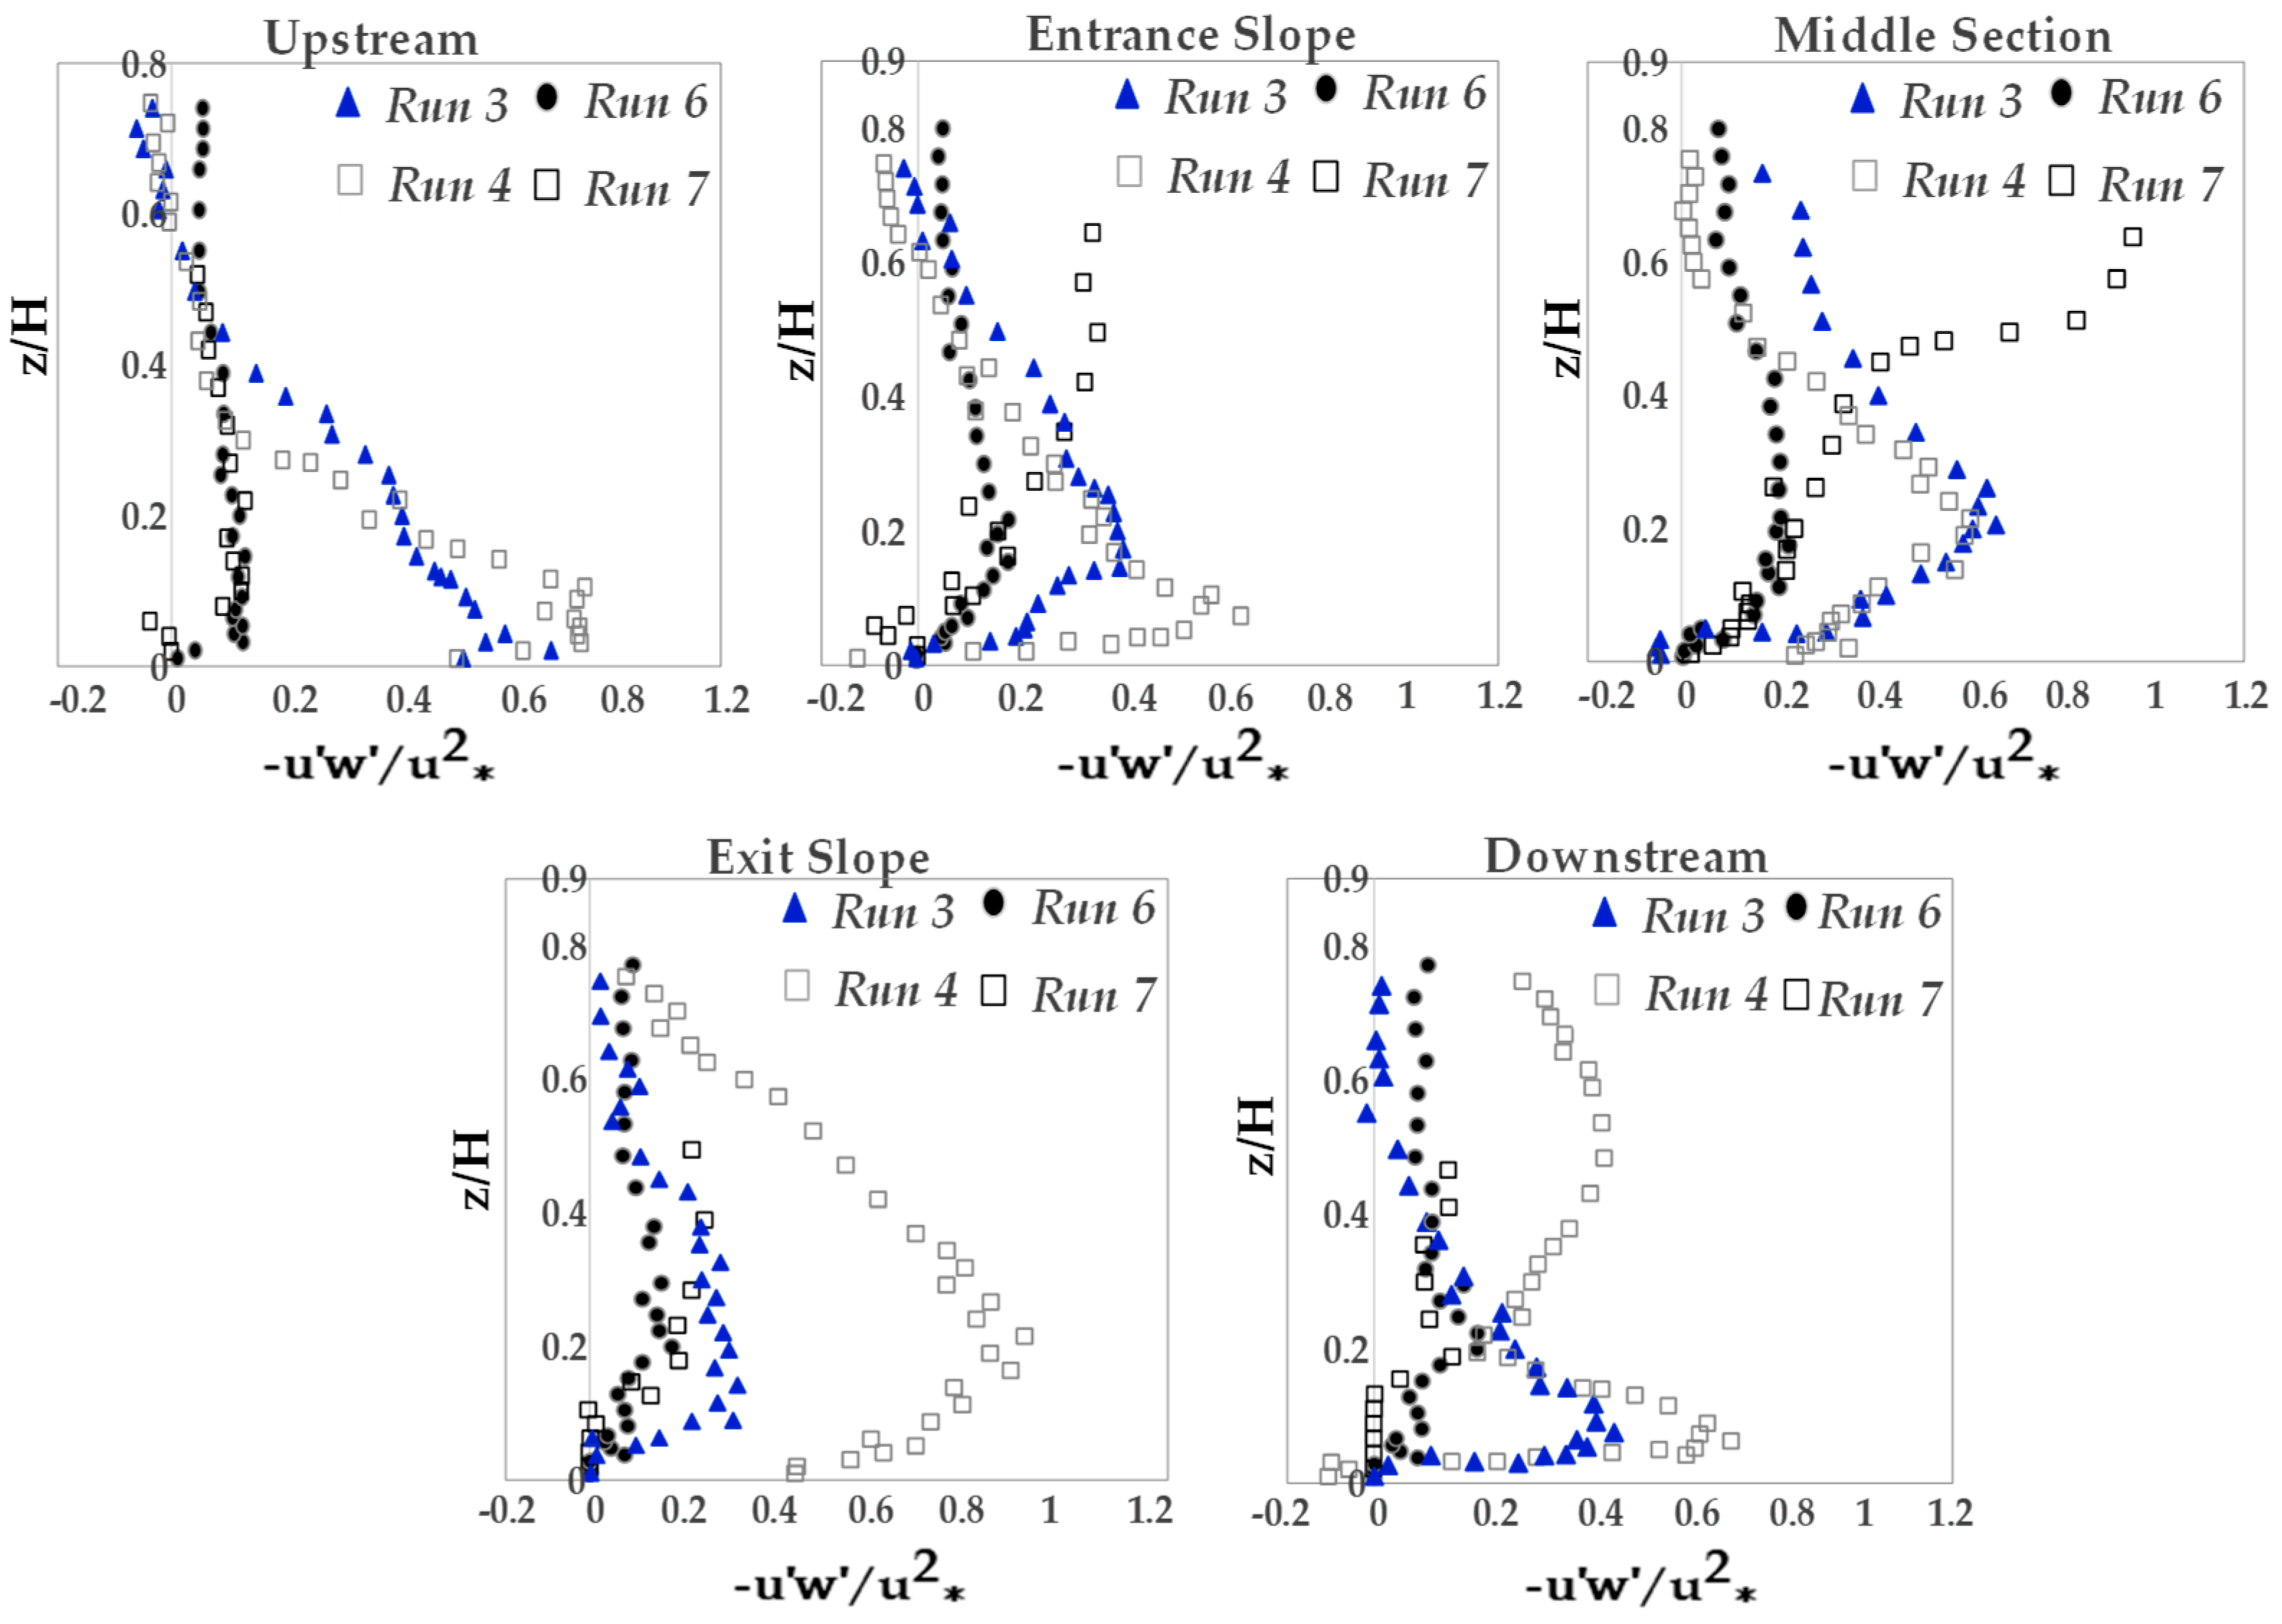
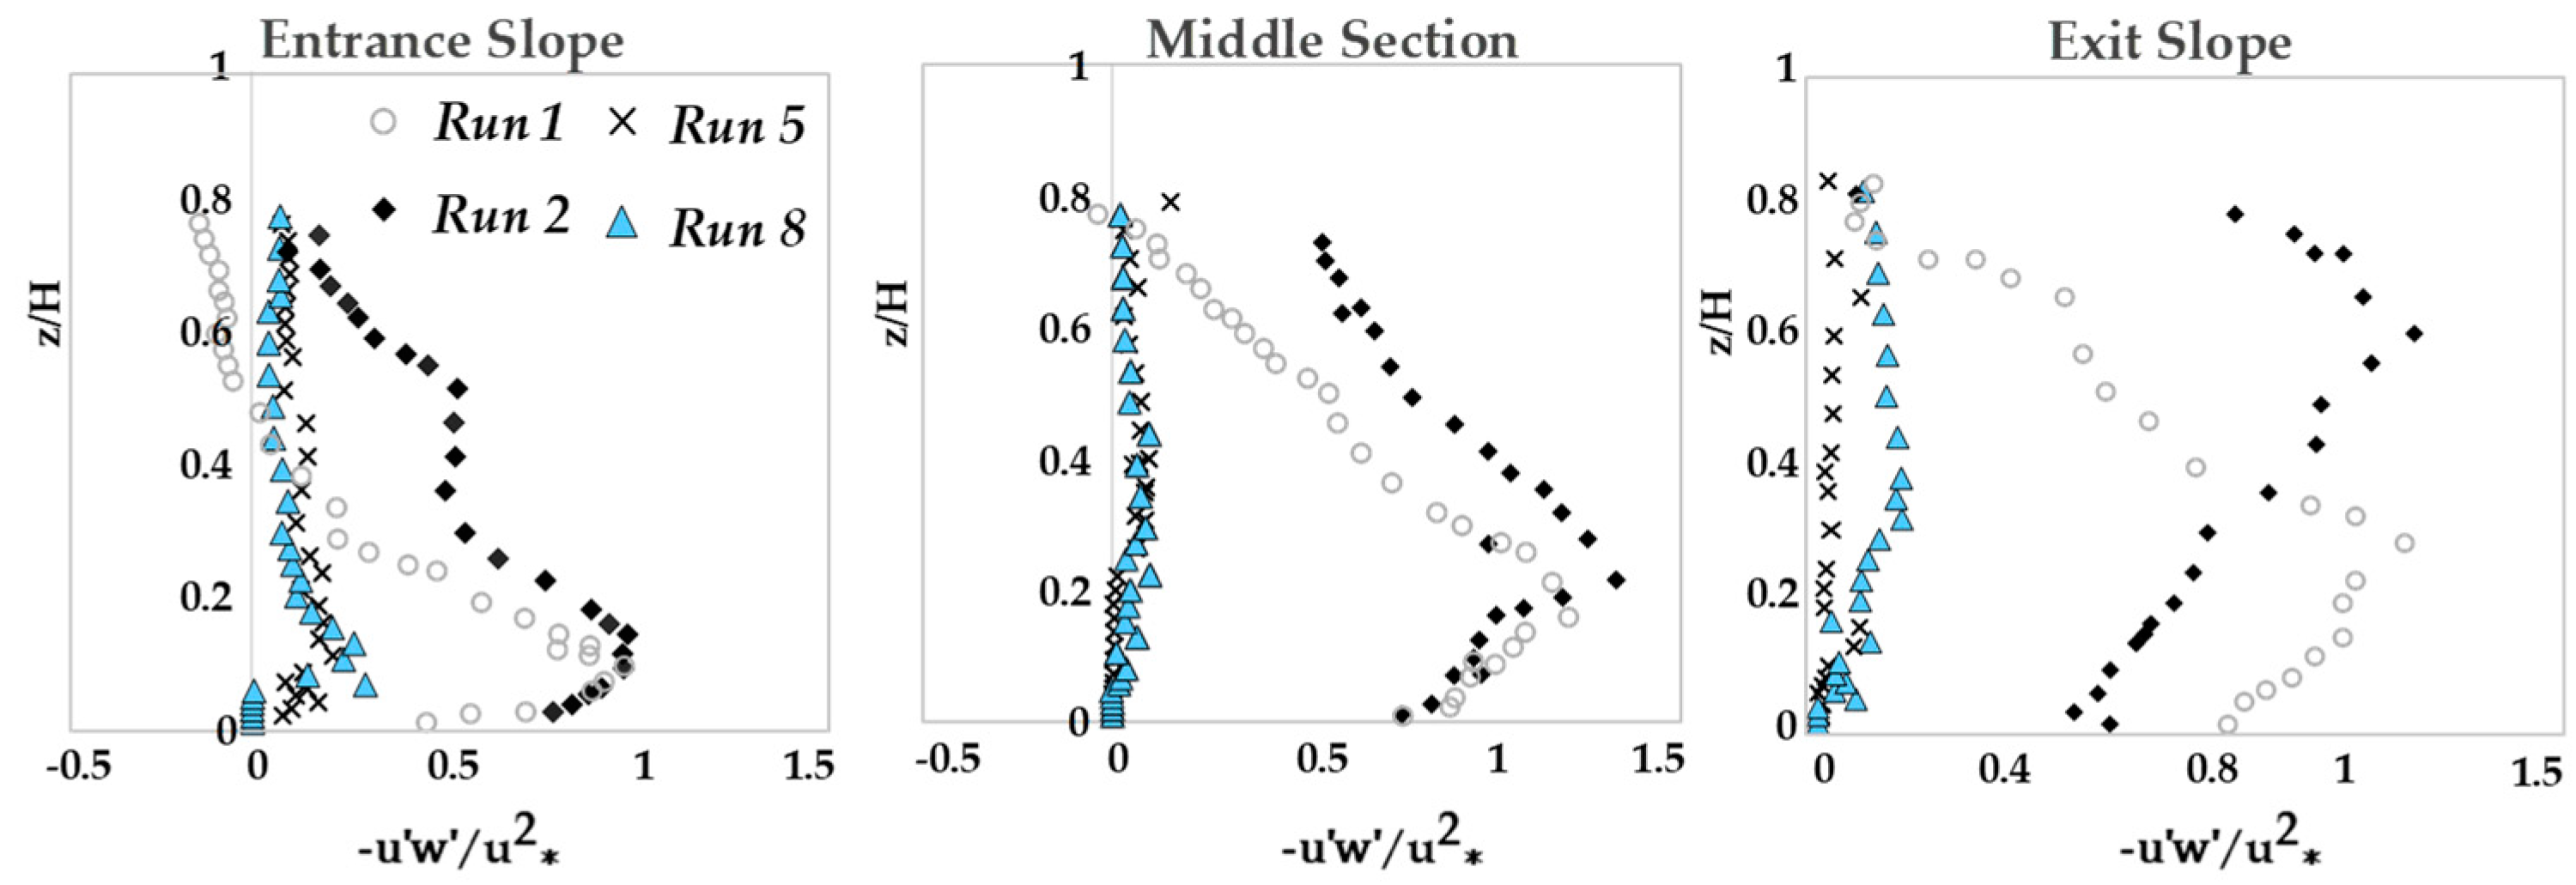
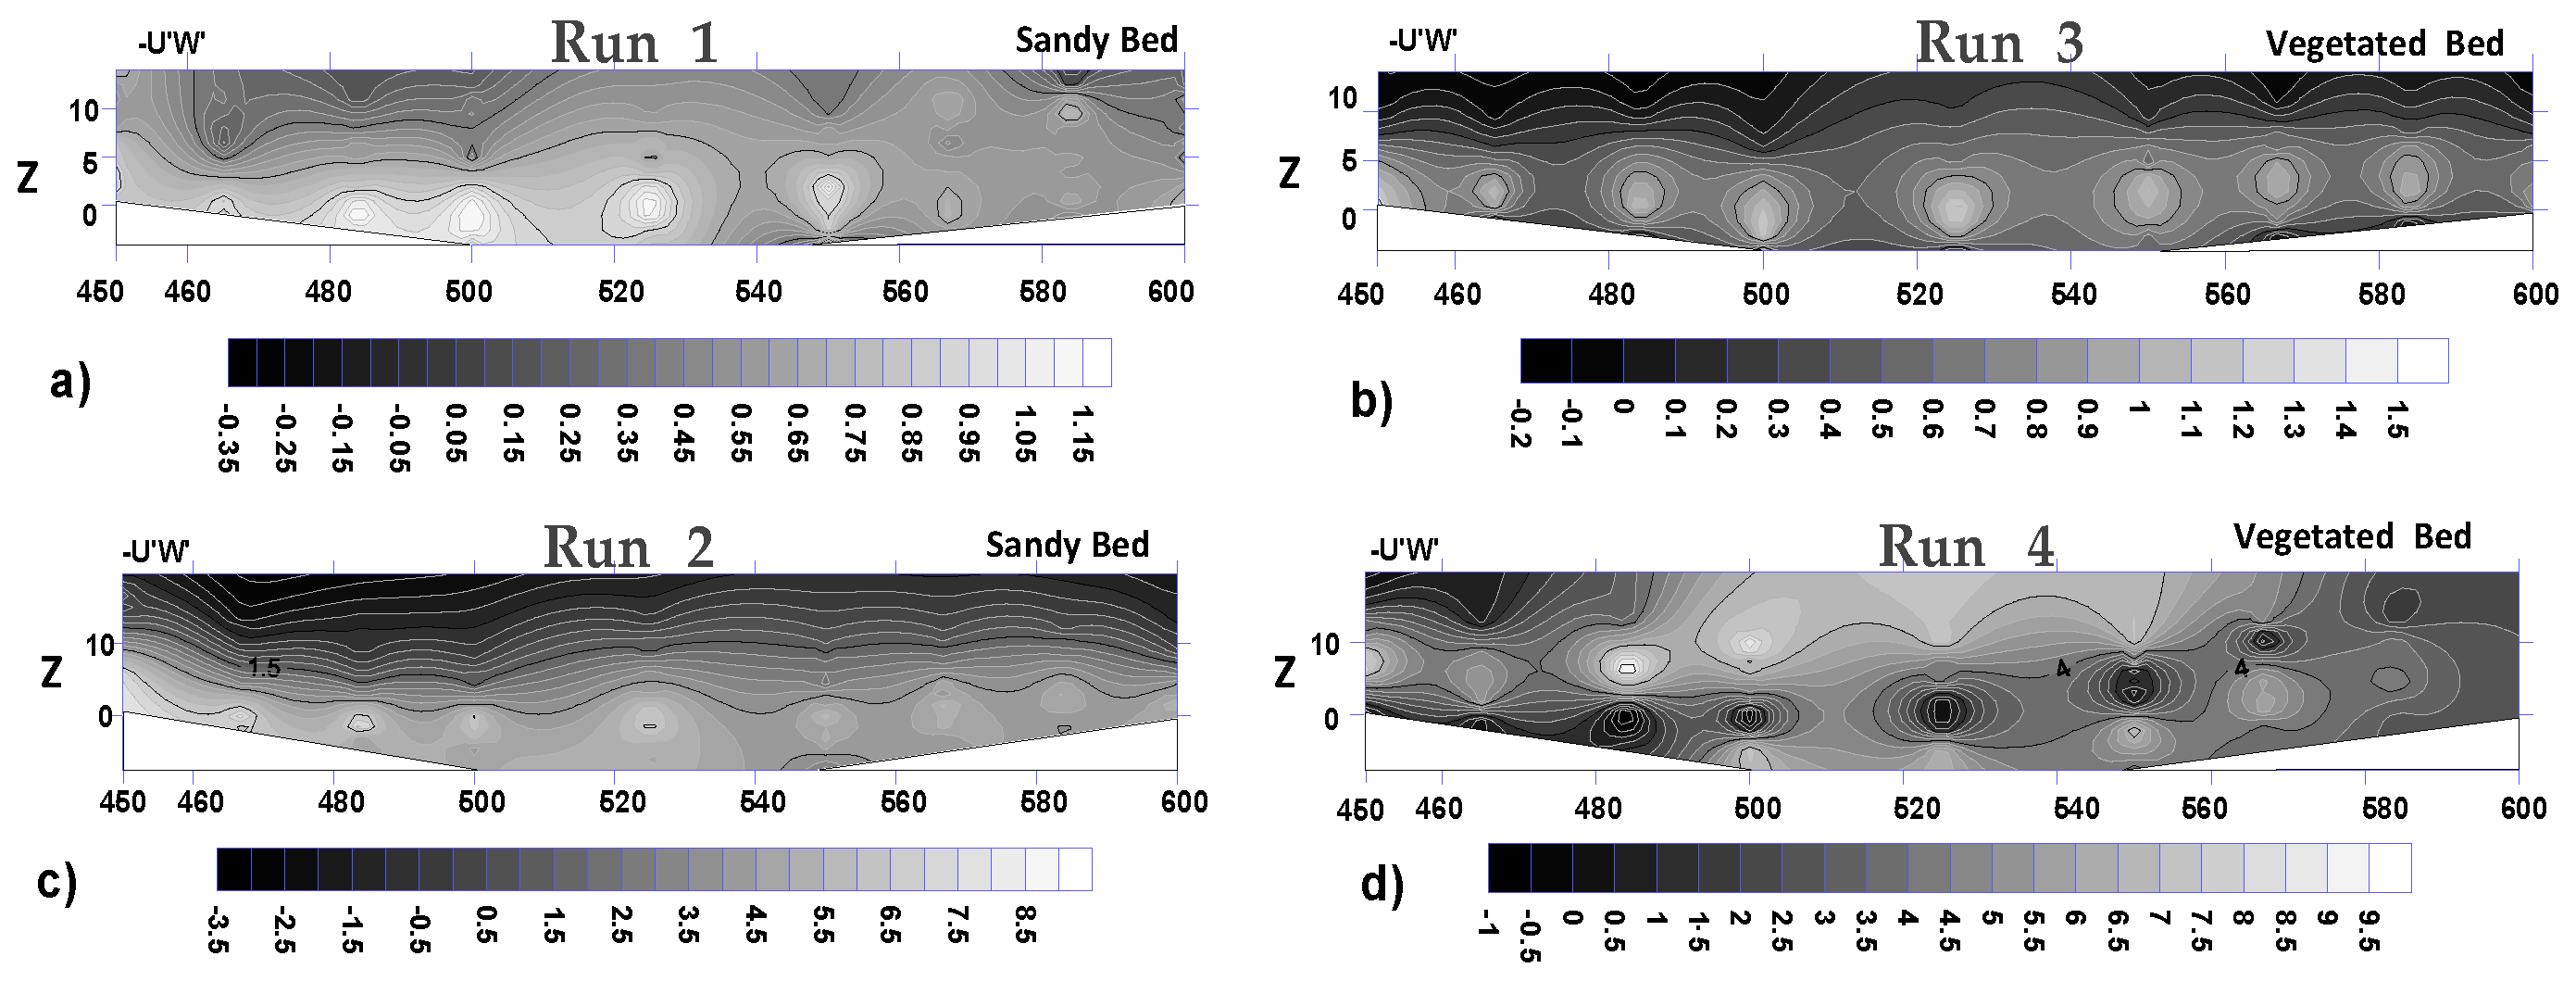
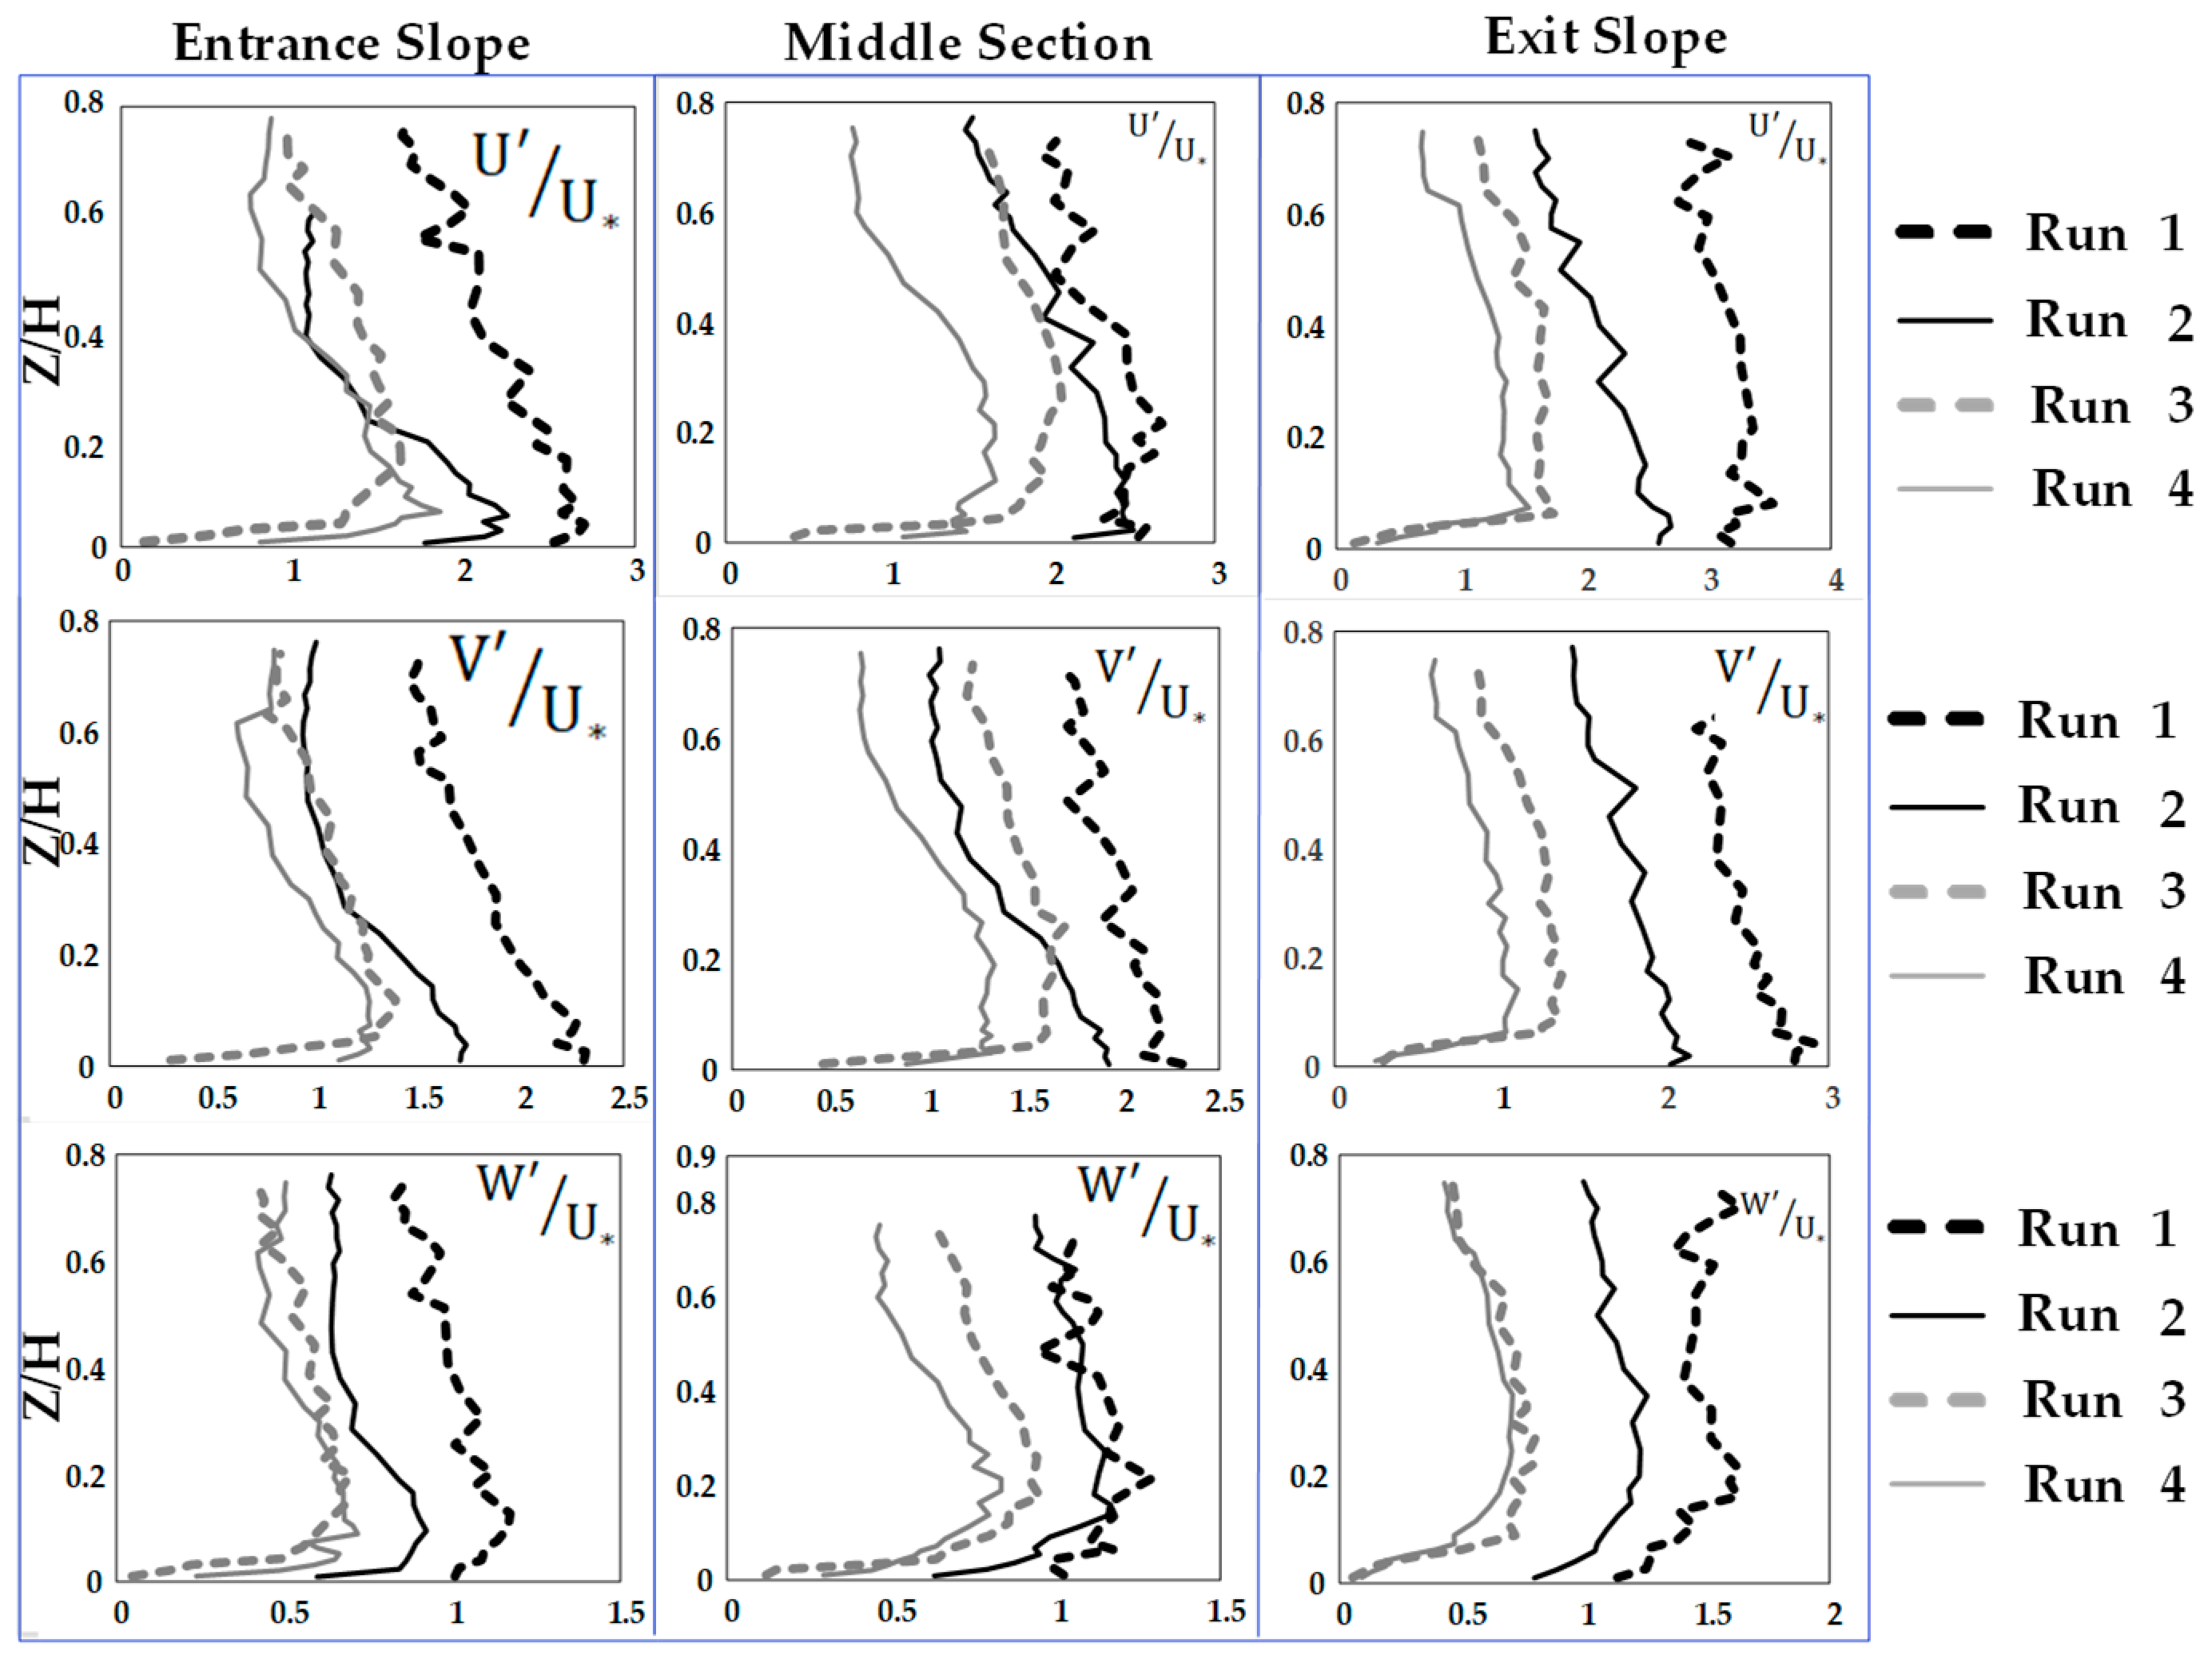
- The Reynolds normal stress in the stream-wise direction is greater than those in both lateral and vertical directions. There is a disruption of normal stress values in the stream-wise direction due to the presence of secondary currents generated due to different roughness of the channel bed and sidewalls of the flume. Therefore, the different roughness and bed slope influence the normal Reynolds stress distributions. In the stream-wise direction of the flow, the region with the highest Reynolds shear stress (RSS) moves away from the bed. The RSS values in the zone of z/H > 0.5 decreases as the bed slope increases. A decrease in the reverse pressure gradient and the favorable pressure gradient affects the distribution of Reynolds stresses in both decelerating flow zone (entrance section of a pool) and accelerating flow zone (exit section of a pool). When the entrance slope of the pool is smaller, the distribution of Reynolds stress is more regular toward the water surface.
- 3)
- The quadrant analysis in this sudy focus on the role of different bursting events at the trailing edge of the vegetation patch where the flow leaves the vegetation patch to the gravel bed. Results clarified that both ejections and sweeps govern the turbulence structures and coherent motions at the trailing edge of the vegetation patch. The presence of the vegetation patch as well as the variation of both entrance and exit slopes of pools generate the non-uniformity of the flow, increase the turbulence intensity and TKE in downstream section of the vegetation patch. The sweep motion occurs in a narrower zone above the vegetation canopy. The sweep motions of bursting events are the dominant process directly above the vegetation canopy, while the outward motion with slightly positive values has been observed at the leading edge of the vegetation patch.
- 4)
- The Kolmogorov -5/3 power law rests valid for the 3D vegetation patch. The geometry of bedform including both entrance and exit slopes of a pool does not influence this law compared to the presence of a vegetation patch in a flat bed.
- 5)
- The shedding frequency is affected by the changes in the bedform slopes and the presence of vegetation, revealing higher values than those reported in literature.
References
- Poggi, D.; Katul, G.; Albertson, J. A note on the contribution of dispersive fluxes to momentum transfer within canopies. Boundary-layer meteorology. 2004. 111: p. 615-621. [CrossRef]
- Folkard, A.M. Hydrodynamics of model Posidonia oceanica patches in shallow water. Limnol. Oceanogr. 2005. 50(5): p. 1592-1600. [CrossRef]
- Zong, L.; Nepf, H. Flow and deposition in and around a finite patch of vegetation. Geomorphology. 2010. 116(3-4): p. 363-372. [CrossRef]
- Nepf, H.; Ghisalberti, M. Flow and transport in channels with submerged vegetation. Acta Geophys. 2008. 56(3): p. 753-777. [CrossRef]
- Shi, H.; Zhang, J.; Huai, W. Experimental study on velocity distributions, secondary currents, and coherent structures in open channel flow with submerged riparian vegetation. Adv. Water Res. 2023: p. 104406. [CrossRef]
- MacVicar, B.J.; Rennie, C.D. Flow and turbulence redistribution in a straight artificial pool. Water Resour. Res. 2012. 5(2). [CrossRef]
- Richards, K. The morphology of riffle-pool sequences. Earth Surf. Process. 1976. 1(1): p. 71-88. [CrossRef]
- Sawyer, A.M.; Pasternack, G.B.; Moir, H.J.; Fulton, A.A. Riffle-pool maintenance and flow convergence routing observed on a large gravel-bed river. Geomorphology. 2010. 114(3): p. 143-160. [CrossRef]
- Thompson, D.M., The role of vortex shedding in the scour of pools. Adv. Water Resour. 2006. 29(2): p. 121-129. [CrossRef]
- Chen, Z.; Ortiz, A.; Zong, L.; Nepf, H. The wake structure behind a porous obstruction and its implications for deposition near a finite patch of emergent vegetation. Water Resour. Res. 2012. 48(9). [CrossRef]
- Liu, C.; Nepf, H. Sediment deposition within and around a finite patch of model vegetation over a range of channel velocity. Water Resour. Res. 2016. 52(1): p. 600-612. [CrossRef]
- Ortiz, A.C.; Ashton, A.; Nepf, H. Mean and turbulent velocity fields near rigid and flexible plants and the implications for deposition. J. Geophys. Res: Earth Surf. 2013. 118(4): p. 2585-2599. [CrossRef]
- Zong, L.; Nepf, H. Vortex development behind a finite porous obstruction in a channel. J. Fluid Mech. 2012. 691: p. 368-391. [CrossRef]
- Liu, C.; Hu, Z.; Lei, J.; Nepf, H. Vortex structure and sediment deposition in the wake behind a finite patch of model submerged vegetation. J. Hydraul. Eng. 2018. 144(2): p. 04017065. [CrossRef]
- Raupach, M.R.; Finnigan, J.J.; Brunet, Y. Coherent eddies and turbulence in vegetation canopies: the mixing-layer analogy. Boundary-Layer Meteorology. 1996: p. 351-382. [CrossRef]
- Okamoto, T.A.; Nezu, I. Spatial evolution of coherent motions in finite-length vegetation patch flow. Environ. Fluid Mech. 2013. 13(5): p. 417-434. [CrossRef]
- Houra, T.; Tsuji, T.; Nagano, Y. Effects of adverse pressure gradient on quasi-coherent structures in turbulent boundary layer. Int. J. heat fluid flow. 2000. 21(3): p. 304-311. [CrossRef]
- Ghisalberti, M.; Nepf, H.M. Mixing layers and coherent structures in vegetated aquatic flows. J. Geophys. Res. 2002. 107(C2): p. 3-1-3-11. [CrossRef]
- Kumar, P.; Sharma, A. Experimental investigation of 3D flow properties around emergent rigid vegetation. Ecohydrol. 2022. 15(8): p. e2474. [CrossRef]
- Kazem, M.; Afzalimehr, H.; Sui, J. Characteristics of turbulence in the downstream region of a vegetation patch. Water. 2021. 13(23): p. 3468. [CrossRef]
- Nosrati, K.; Afzalimehr, H.; Sui, J. Interaction of Irregular Distribution of Submerged Rigid Vegetation and Flow within a Straight Pool. Water. 2022. 14(13): p. 2036. [CrossRef]
- Afzalimehr, H.; Barahimi, M.; Sui, J. Non-uniform flow over cobble bed with submerged vegetation strip. Proc. ICE–Water Manag. 2019, 172, 86–101. [CrossRef]
- Parvizi, P.; Afzalimehr, H.; Sui, J.; Raeisifar, H.R.; Eftekhari, A.R. Characteristics of Shallow Flows in a Vegetated Pool—An Experimental Study. Water. 2023. 15(1): p. 205. [CrossRef]
- Nezu, I.; Nakagawa, H.; Jirka, G.H. Turbulence in open-channel flows. J. Hydraul. Eng. 1994. 120(10): p. 1235-1237.
- Kironoto, B.; Graf, W.H.; Reynolds. Turbulence characteristics in rough uniform open-channel flow. P. I. Civil Eng-Mar En. 1994. 106(4): p. 333-344. [CrossRef]
- Bassey, O.B.; Agunwamba, J. Derived Models for the Prediction of Cole’s and Dip Parameters for Velocity Gradients Determination in Open Natural Channels. 1998.
- Liu, M.; Huai, W.; Ji, B. Characteristics of the flow structures through and around a submerged canopy patch. Physic. Fluids. 2021. 33(3): p. 035144. [CrossRef]
- Fazlollahi, A.; Afzalimehr, H.; Sui, J. Effect of slope angle of an artificial pool on distributions of turbulence. Int. J. Sediment Res. 2015. 30(2): p. 93-99. [CrossRef]
- MacVicar, B.J.; Rennie. C.D. Lateral distribution of turbulence and secondary currents in non-uniform open channel flow. In Proceedings of the 33rd IAHR Congress: Water Engineering for a Sustainable Environment Hydraulics, Vancouver, BC, Canada, 9–14 August 2009; pp. 1908–1915.
- Afzalimehr, H.; Nosrati, K.; Kazem, M. Resistance to Flow in a Cobble-Gravel Bed River with Irregular Vegetation Patches and Pool-Riffle Bedforms (Case study: Padena Marbor River). Ferdowsi Civ. Eng.(JFCEI). 2021. 2: p. 35-50.
- Green, J.C. Comparison of blockage factors in modelling the resistance of channels containing submerged macrophytes. River Res. Appl. 2005. 21(6): p. 671-686. [CrossRef]
- Song, T.; Chiew, Y. Turbulence measurement in nonuniform open-channel flow using acoustic Doppler velocimeter (ADV). J. Eng. Mech. 2001. 127(3): p. 219-232. [CrossRef]
- Coles, D., The law of the wake in the turbulent boundary layer. J. Fluid Mech. 1956. 1(2): p. 191-226. [CrossRef]
- MacWilliams, Jr.; Wheaton, J. M.; Pasternack, G. B.; Street, R. L.; Kitanidis, P. K. Flow convergence routing hypothesis for pool-riffle maintenance in alluvial rivers. Water Resource Res. 2006. 42(10). [CrossRef]
- MacVicar, B.; Roy, A. Hydrodynamics of a forced riffle pool in a gravel bed river: 1. Mean velocity and turbulence intensity. Water Resources Res. 2007. 43(12). [CrossRef]
- Clifford, N.; Richards, K. The reversal hypothesis and teh maintenance of riffle-pool sequences: A review and field appraisal. In Lowland floodplain rivers. Geomorphological perspectives. 1992. p. 43-70.
- Kironoto, B.; Graf, W.H.; Reynolds. Turbulence characteristics in rough non-uniform open-channel flow. Proc. Inst. Civ. Eng.-Water Marit. Energy. 1995, 112, 336–348. [CrossRef]
- Yang, S.Q.; Chow, A.T. Turbulence structures in non-uniform flows. Adv. Water Resources. 2008. 31(10): p. 1344-1351. [CrossRef]
- Barahimi, M.; Sui, J. Effects of Submerged Vegetation Arrangement Patterns and Density on Flow Structure. Water. 2023. 15(1): p. 176. [CrossRef]
- McLean, S.; Nikora, V. Characteristics of turbulent unidirectional flow over rough beds: Double averaging perspective with particular focus on sand dunes and gravel beds. Water Resources Res. 2006. 42(10). [CrossRef]
- Kabiri, F.; Afzalimehr, H.; Sui, J. Flow structure over a wavy bed with vegetation cover. Int. J. Sediment Res. 2017. 32(2): p. 186-194. [CrossRef]
- Nepf, H.M.; Vivoni, E. Flow structure in depth-limited, vegetated flow. J. Geophys. Res. Ocean. 2000. 105(C12): p. 28547-28557.
- Nezu, I.; Sanjou, M. Turburence structure and coherent motion in vegetated canopy open-channel flows. J. Hydr-Environ. Res. 2008. 2(2): p. 62-90. [CrossRef]
- Shivpure, V.; Devi, T.B.; Kumar, B. Turbulent characteristics of densely flexible submerged vegetated channel. ISH J Hydraul Eng. 2016. 22(2): p. 220-226. [CrossRef]
- Nezu, I. Turbulence intensities in open channel flows. in Proceedings of the Japan Society of Civil Engineers. J. JSCE.1977. 261. 61-76. (In Japanese).
- Finnigan, J. Turbulence in plant canopies. Annu. Rev. Fluid Mech. 2000. 32(1): p. 519-571. [CrossRef]
- Wilson, C. A. M. E.; Stoesser, T.; Bates, P. D.; Batemann Pinzen, A., Open channel flow through different forms of submerged flexible vegetation. J. Hydraul. Eng. 2003. 129(11): p. 847-853. [CrossRef]
- Neary, V.S.; Constantinescu, S.G.; Bennett, S.J.; Diplas, P. Effects of Vegetation on Turbulence, Sediment Transport, and Stream Morphology. J. Hydraul. Eng. 2012, 138, 765–776. [CrossRef]
- Adrian, R.J., Meinhart, C.D.; Tomkins, C.D.Vortex organization in the outer region of the turbulent boundary layer. J. fluid Mech. 2000. 422: p. 1-54. [CrossRef]
- Wang, J.; He, G.; Dey, S.; Fang, H. Influence of submerged flexible vegetation on turbulence in an open-channel flow. Journal of Fluid Mechanics, 2022. 947, A31. [CrossRef]
- Najafabadi, E.F.; Afzalimehr, H.; Rowiński, P.M. Flow structure through a fluvial pool-riffle sequence–Case study. J. Hydro-environment Res. 2018. 19: p. 1-15. [CrossRef]
- Nepf, H.M. Drag, turbulence, and diffusion in flow through emergent vegetation. Water resources res, 1999. 35(2): p. 479-489. [CrossRef]
- Lacey, R.J.; Roy, A.G. A comparative study of the turbulent flow field with and without a pebble cluster in a gravel bed river. Water Resources Res. 2007. 43(5). [CrossRef]
- Afzalimehr, H.; Riazi, P.; Jahad, M.; Singh, VP. Effect of vegetation patches on flow structures and the estimation of friction factor. ISH J. Hydraul Eng, 2021. 27. p. 390-400. [CrossRef]
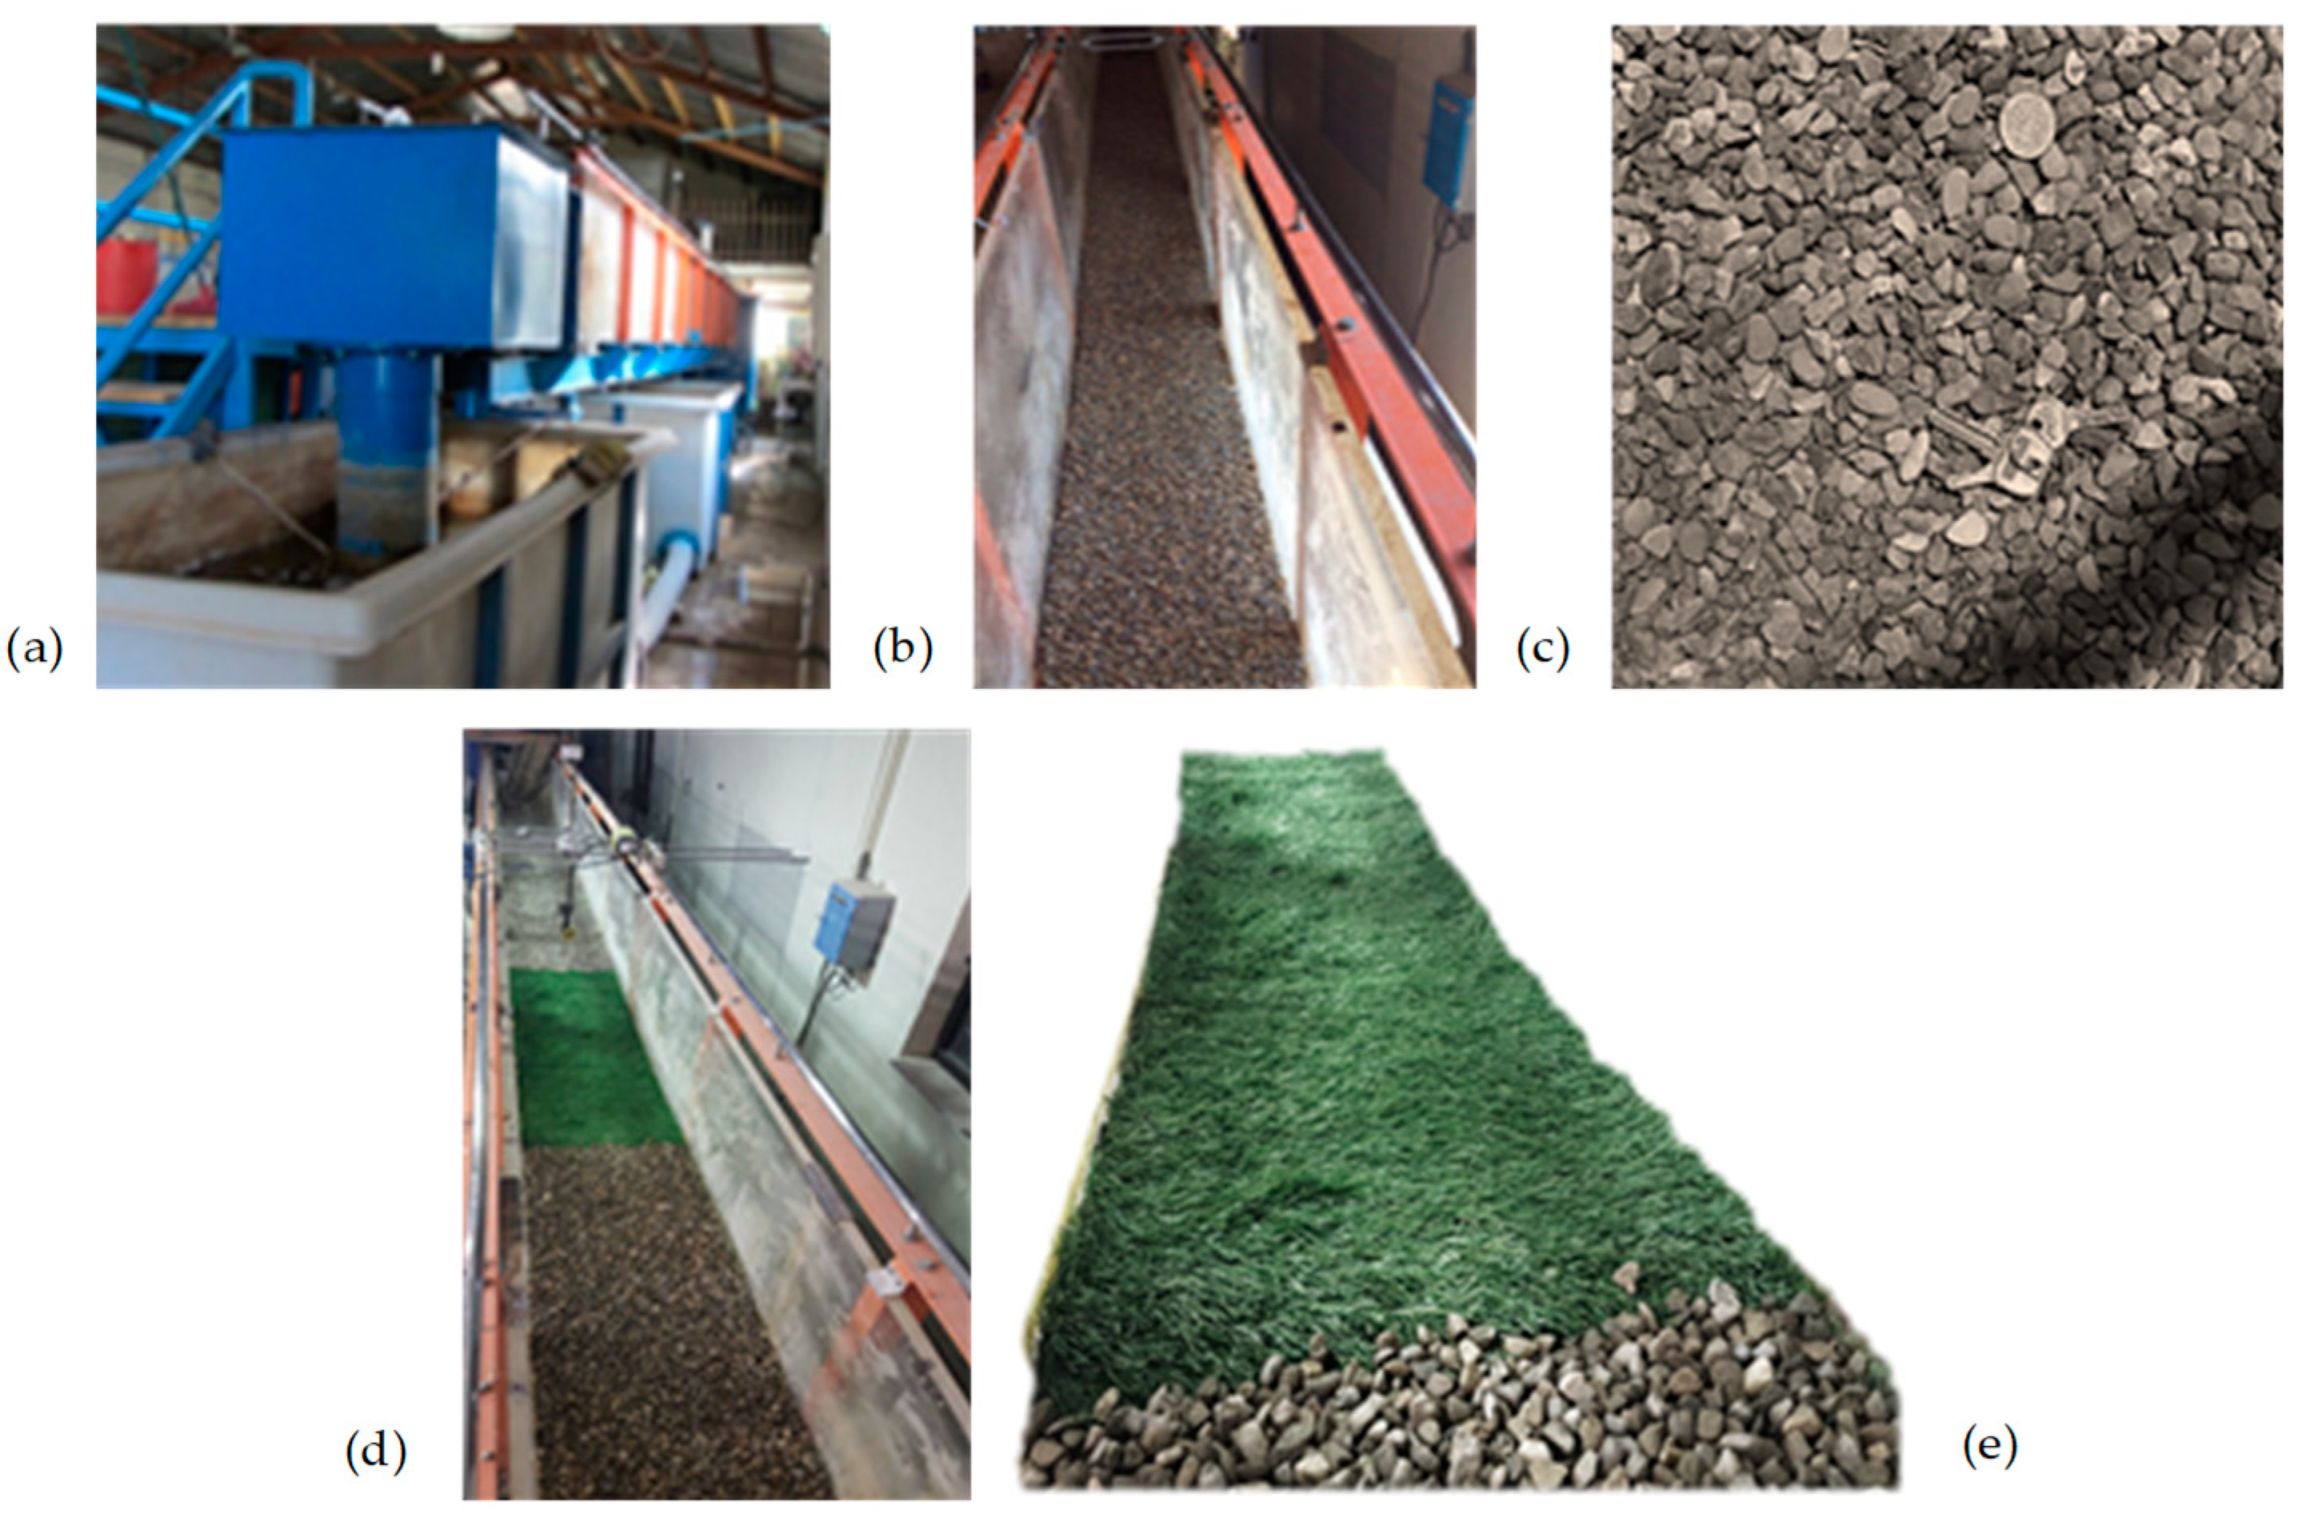
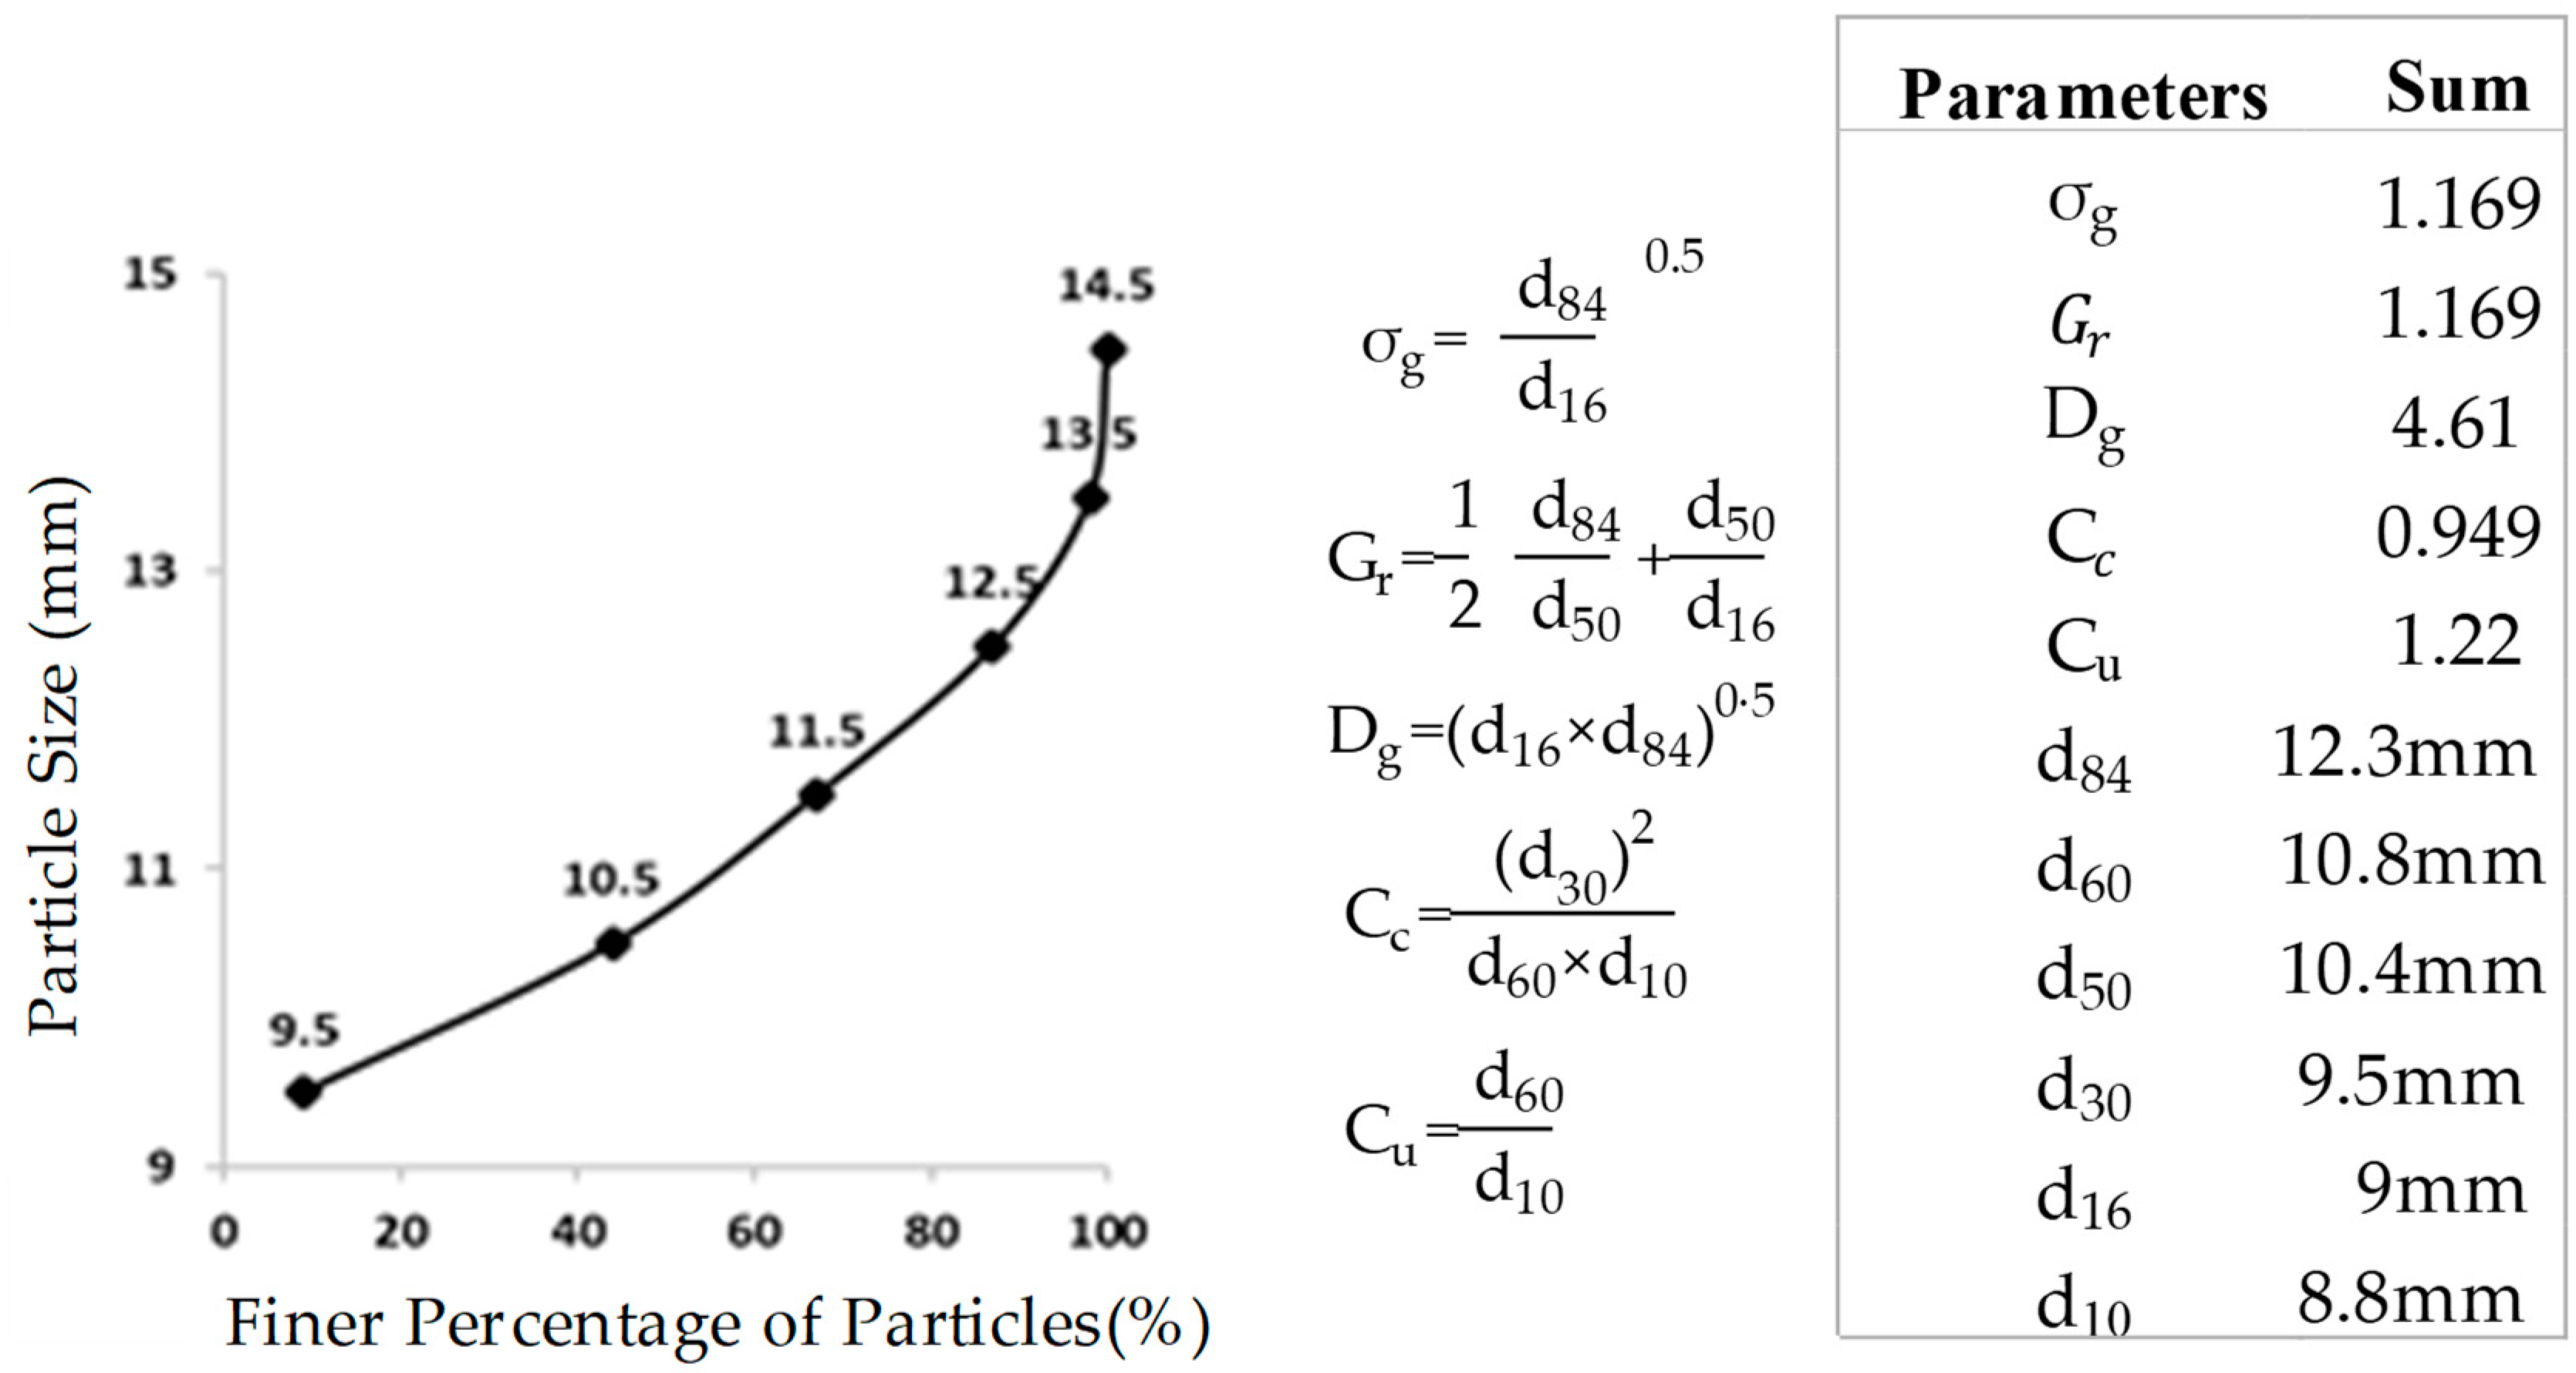

| Pool setup | Runs. | Entrance Slope |
Exit Slope |
Pool-Bed Material |
U(m/s) | Q |
w/h | |||
|---|---|---|---|---|---|---|---|---|---|---|
| Setup 1 | Run 1 | 5° | 5° | 20 | Gravel Bed | 0.125 | 10.5± 0.1 | 0.09 | 2.5 | 2 |
| Run 2 | 5° | 5° | 20 | Gravel Bed | 0.5 | 40.5± 0.1 | 0.13 | 10 | 2 | |
| Run 3 | 5° | 5° | 20 | Vegetated Canopy | 0.125 | 10.5± 0.1 | 0.09 | 2.5 | 2 | |
| Run 4 | 5° | 5° | 20 | Vegetated Canopy | 0.5 | 40.5± 0.1 | 0.13 | 10 | 2 | |
| Setup 2 | Run 5 | 10° | 10° | 20 | Gravel Bed | 0.125 | 10.5± 0.1 | 0.09 | 2.5 | 2 |
| Run 6 | 10° | 10° | 20 | Vegetated Canopy | 0.125 | 10.5± 0.1 | 0.09 | 2.5 | 2 | |
| Run 7 | 10° | 10° | 15 | Vegetated Canopy | 0.125 | 10.5± 0.1 | 0.09 | 2.5 | 2.67 | |
| Run 8 | 10° | 10° | 20 | Vegetated Canopy | 0.125 | 10.5± 0.1 | 0.09 | 2.5 | 2 |
Disclaimer/Publisher’s Note: The statements, opinions and data contained in all publications are solely those of the individual author(s) and contributor(s) and not of MDPI and/or the editor(s). MDPI and/or the editor(s) disclaim responsibility for any injury to people or property resulting from any ideas, methods, instructions or products referred to in the content. |
© 2023 by the authors. Licensee MDPI, Basel, Switzerland. This article is an open access article distributed under the terms and conditions of the Creative Commons Attribution (CC BY) license (http://creativecommons.org/licenses/by/4.0/).


