Submitted:
12 May 2023
Posted:
12 May 2023
You are already at the latest version
Abstract
Keywords:
1. Introduction
2. The upper critical field definition
3. Results
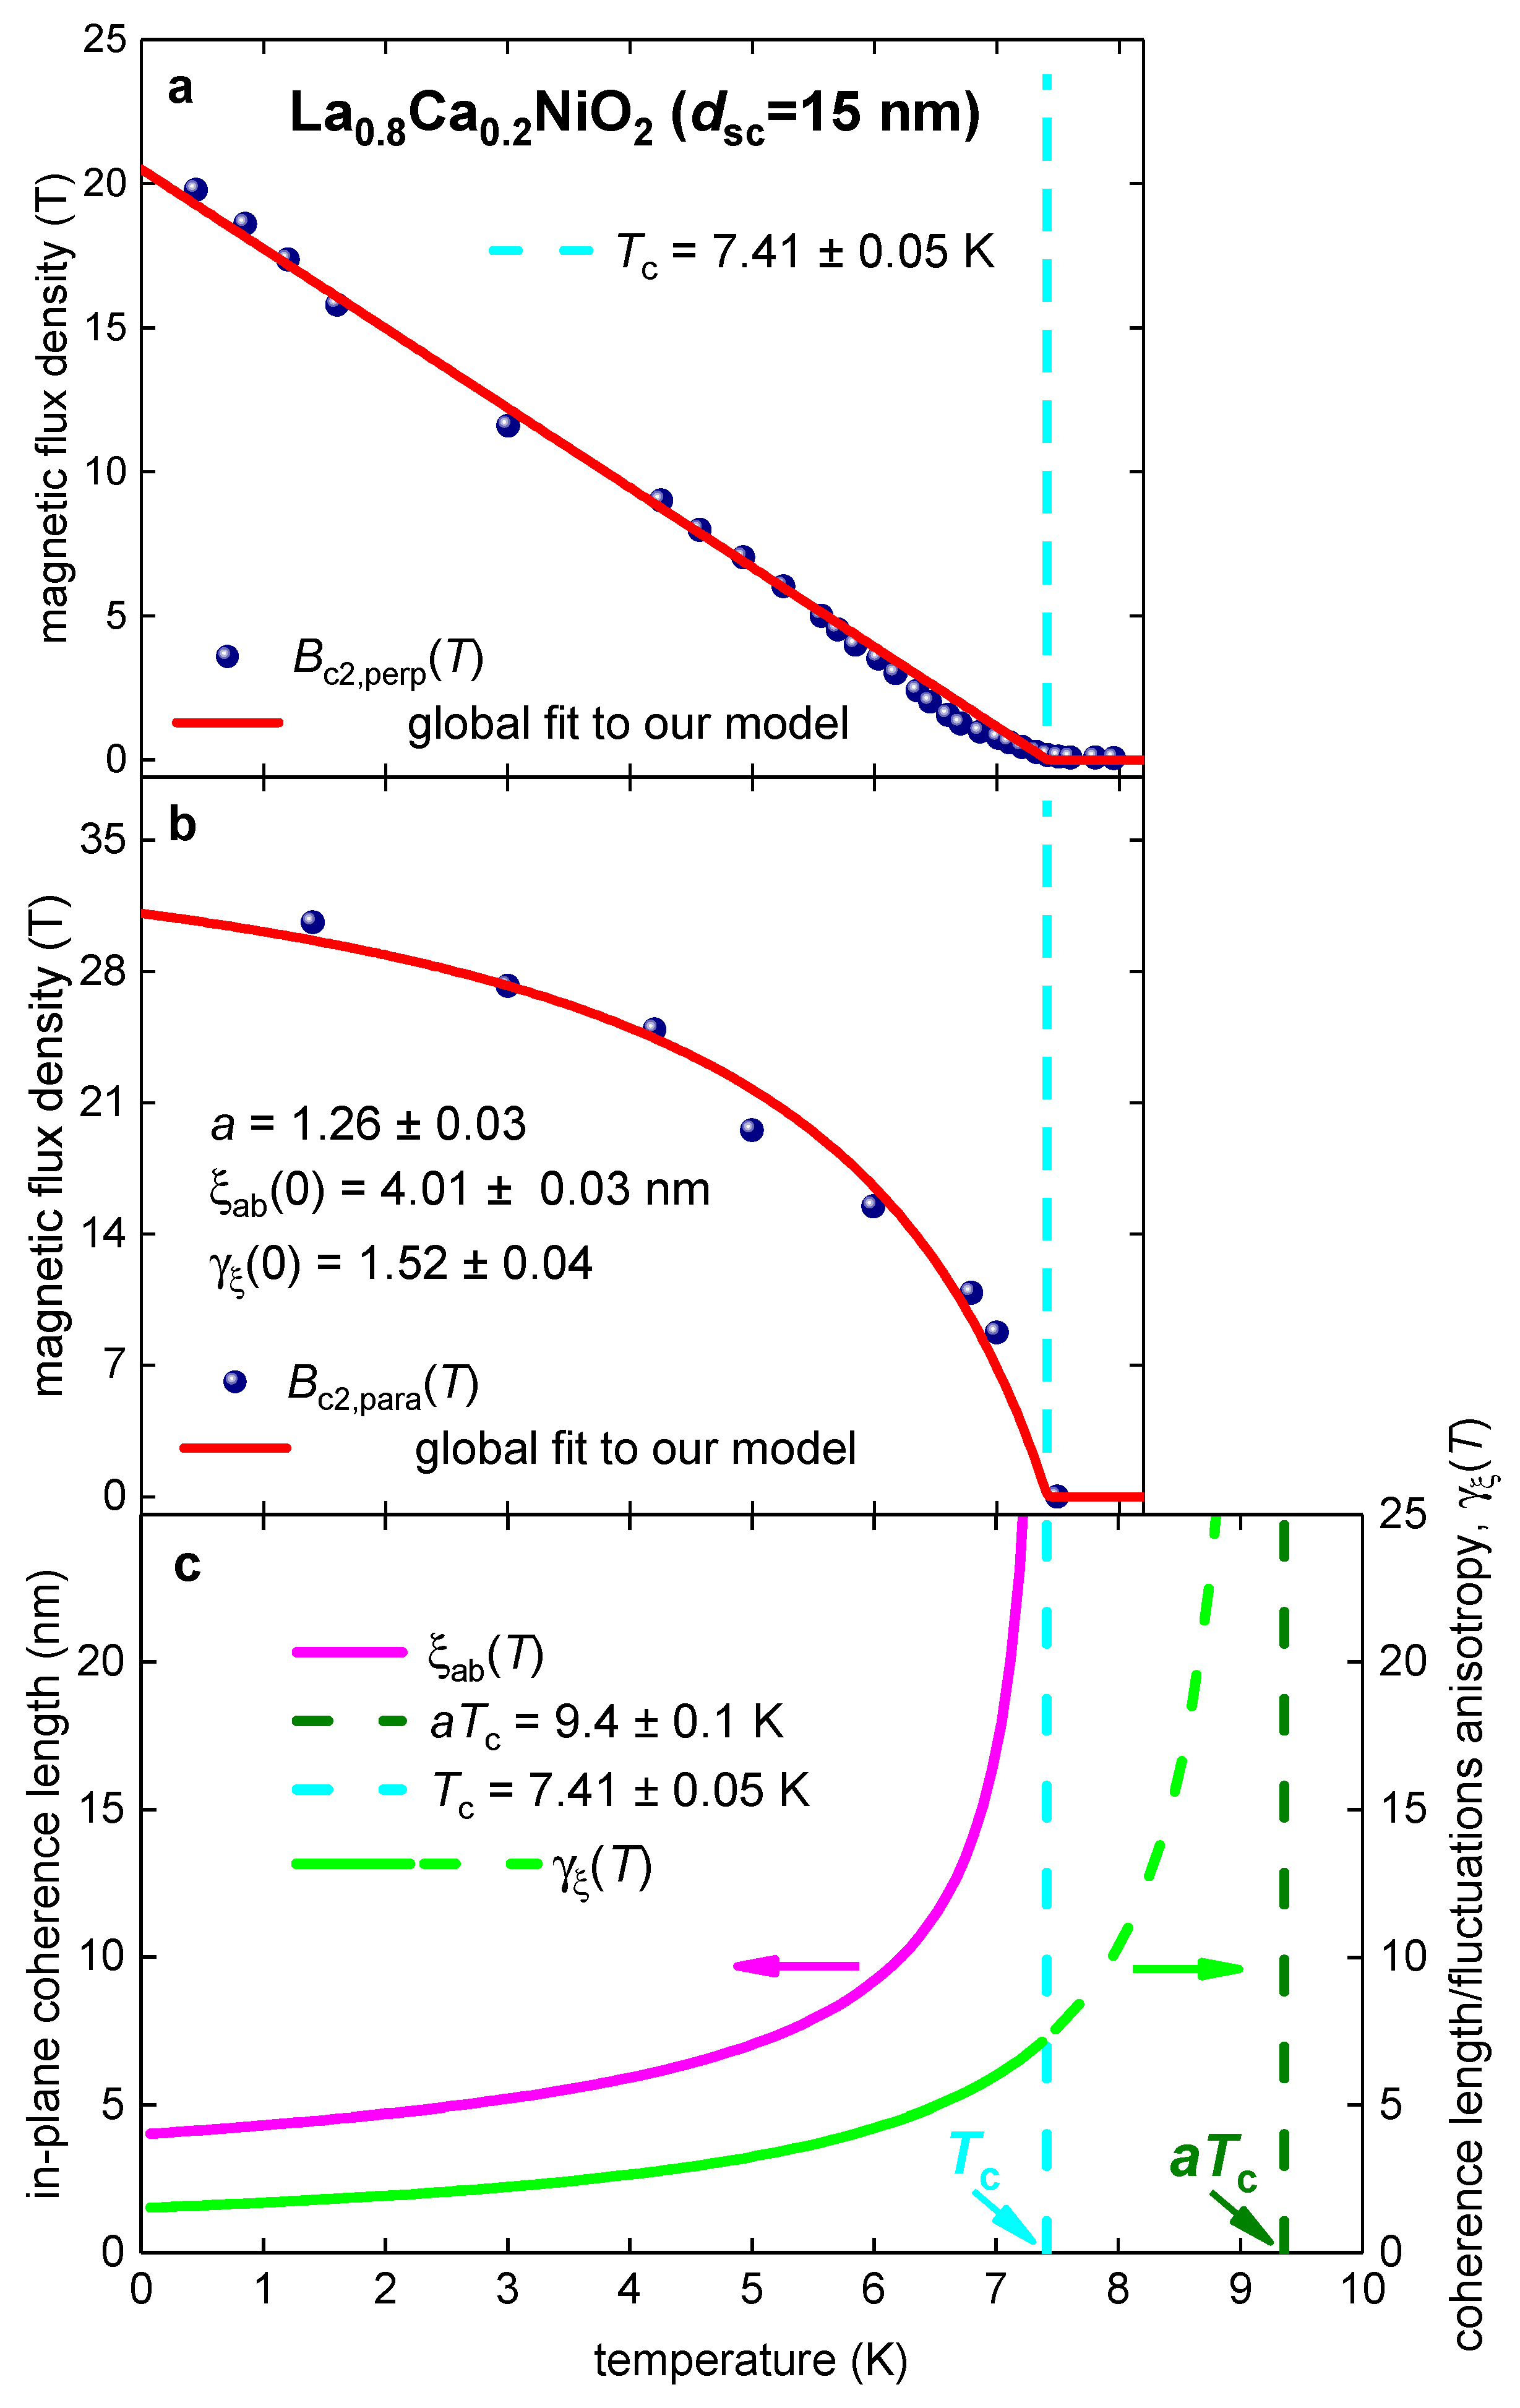
3.1. La0.8Ca0.2NiO2 film
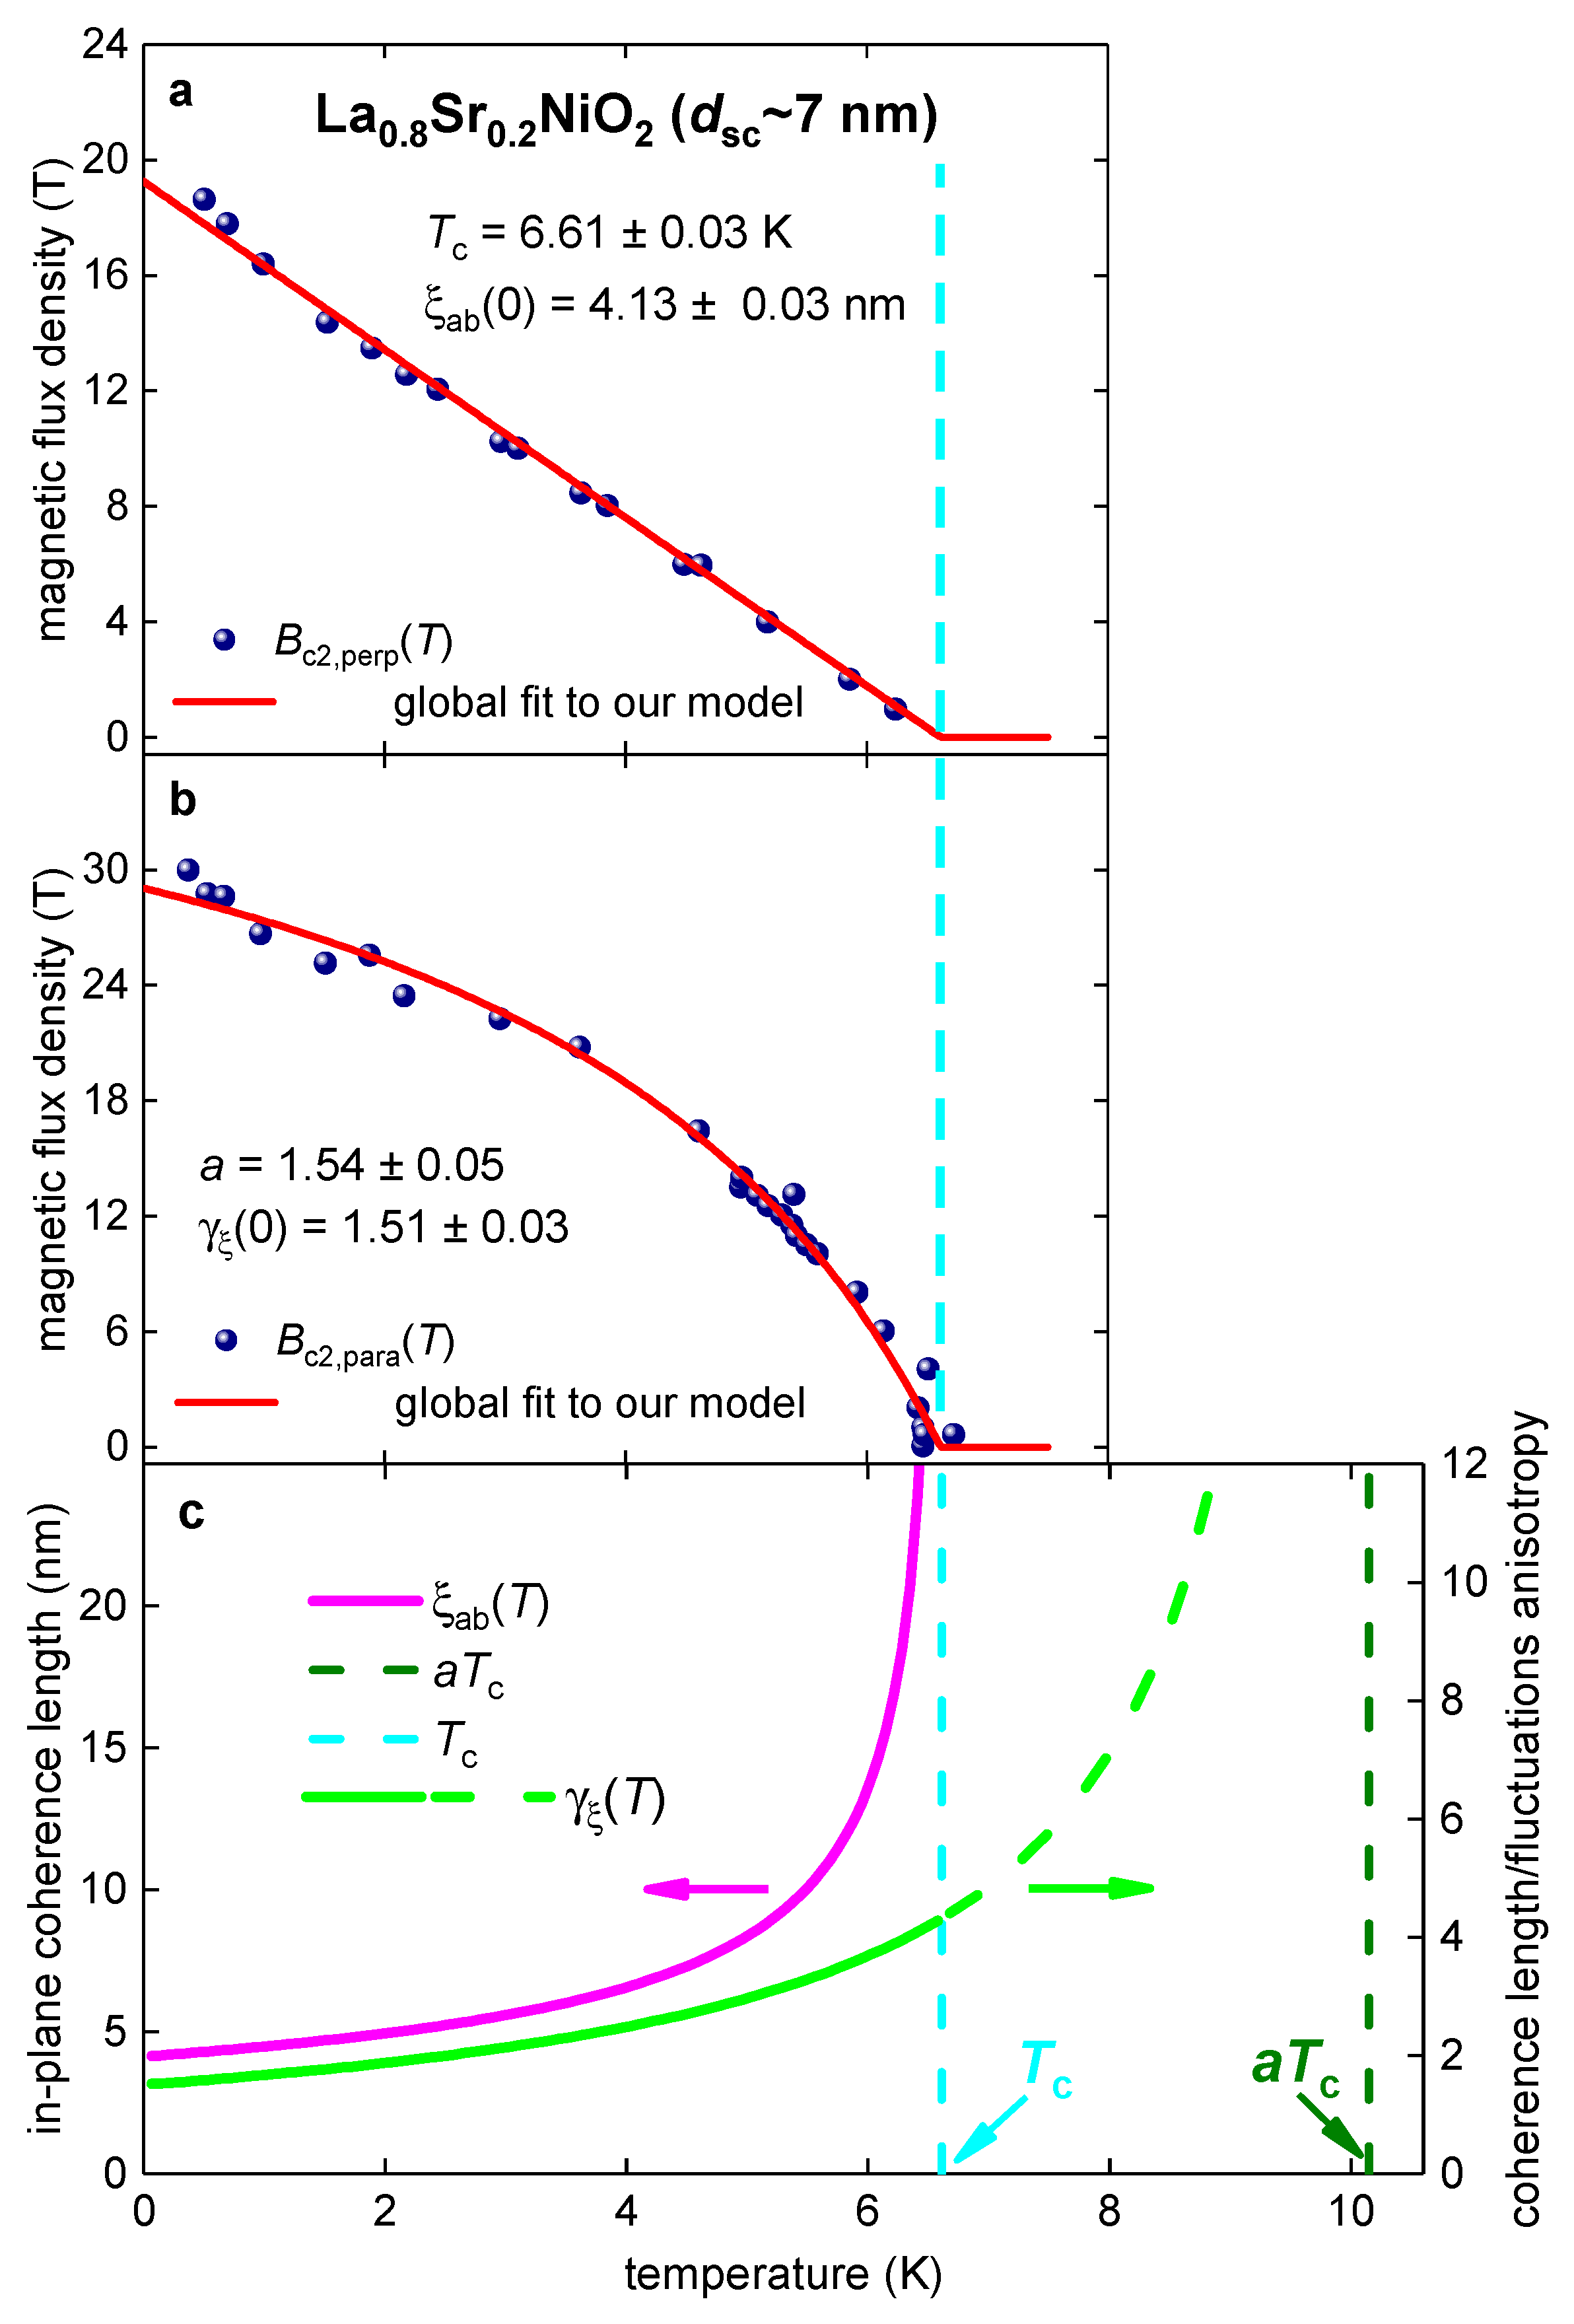
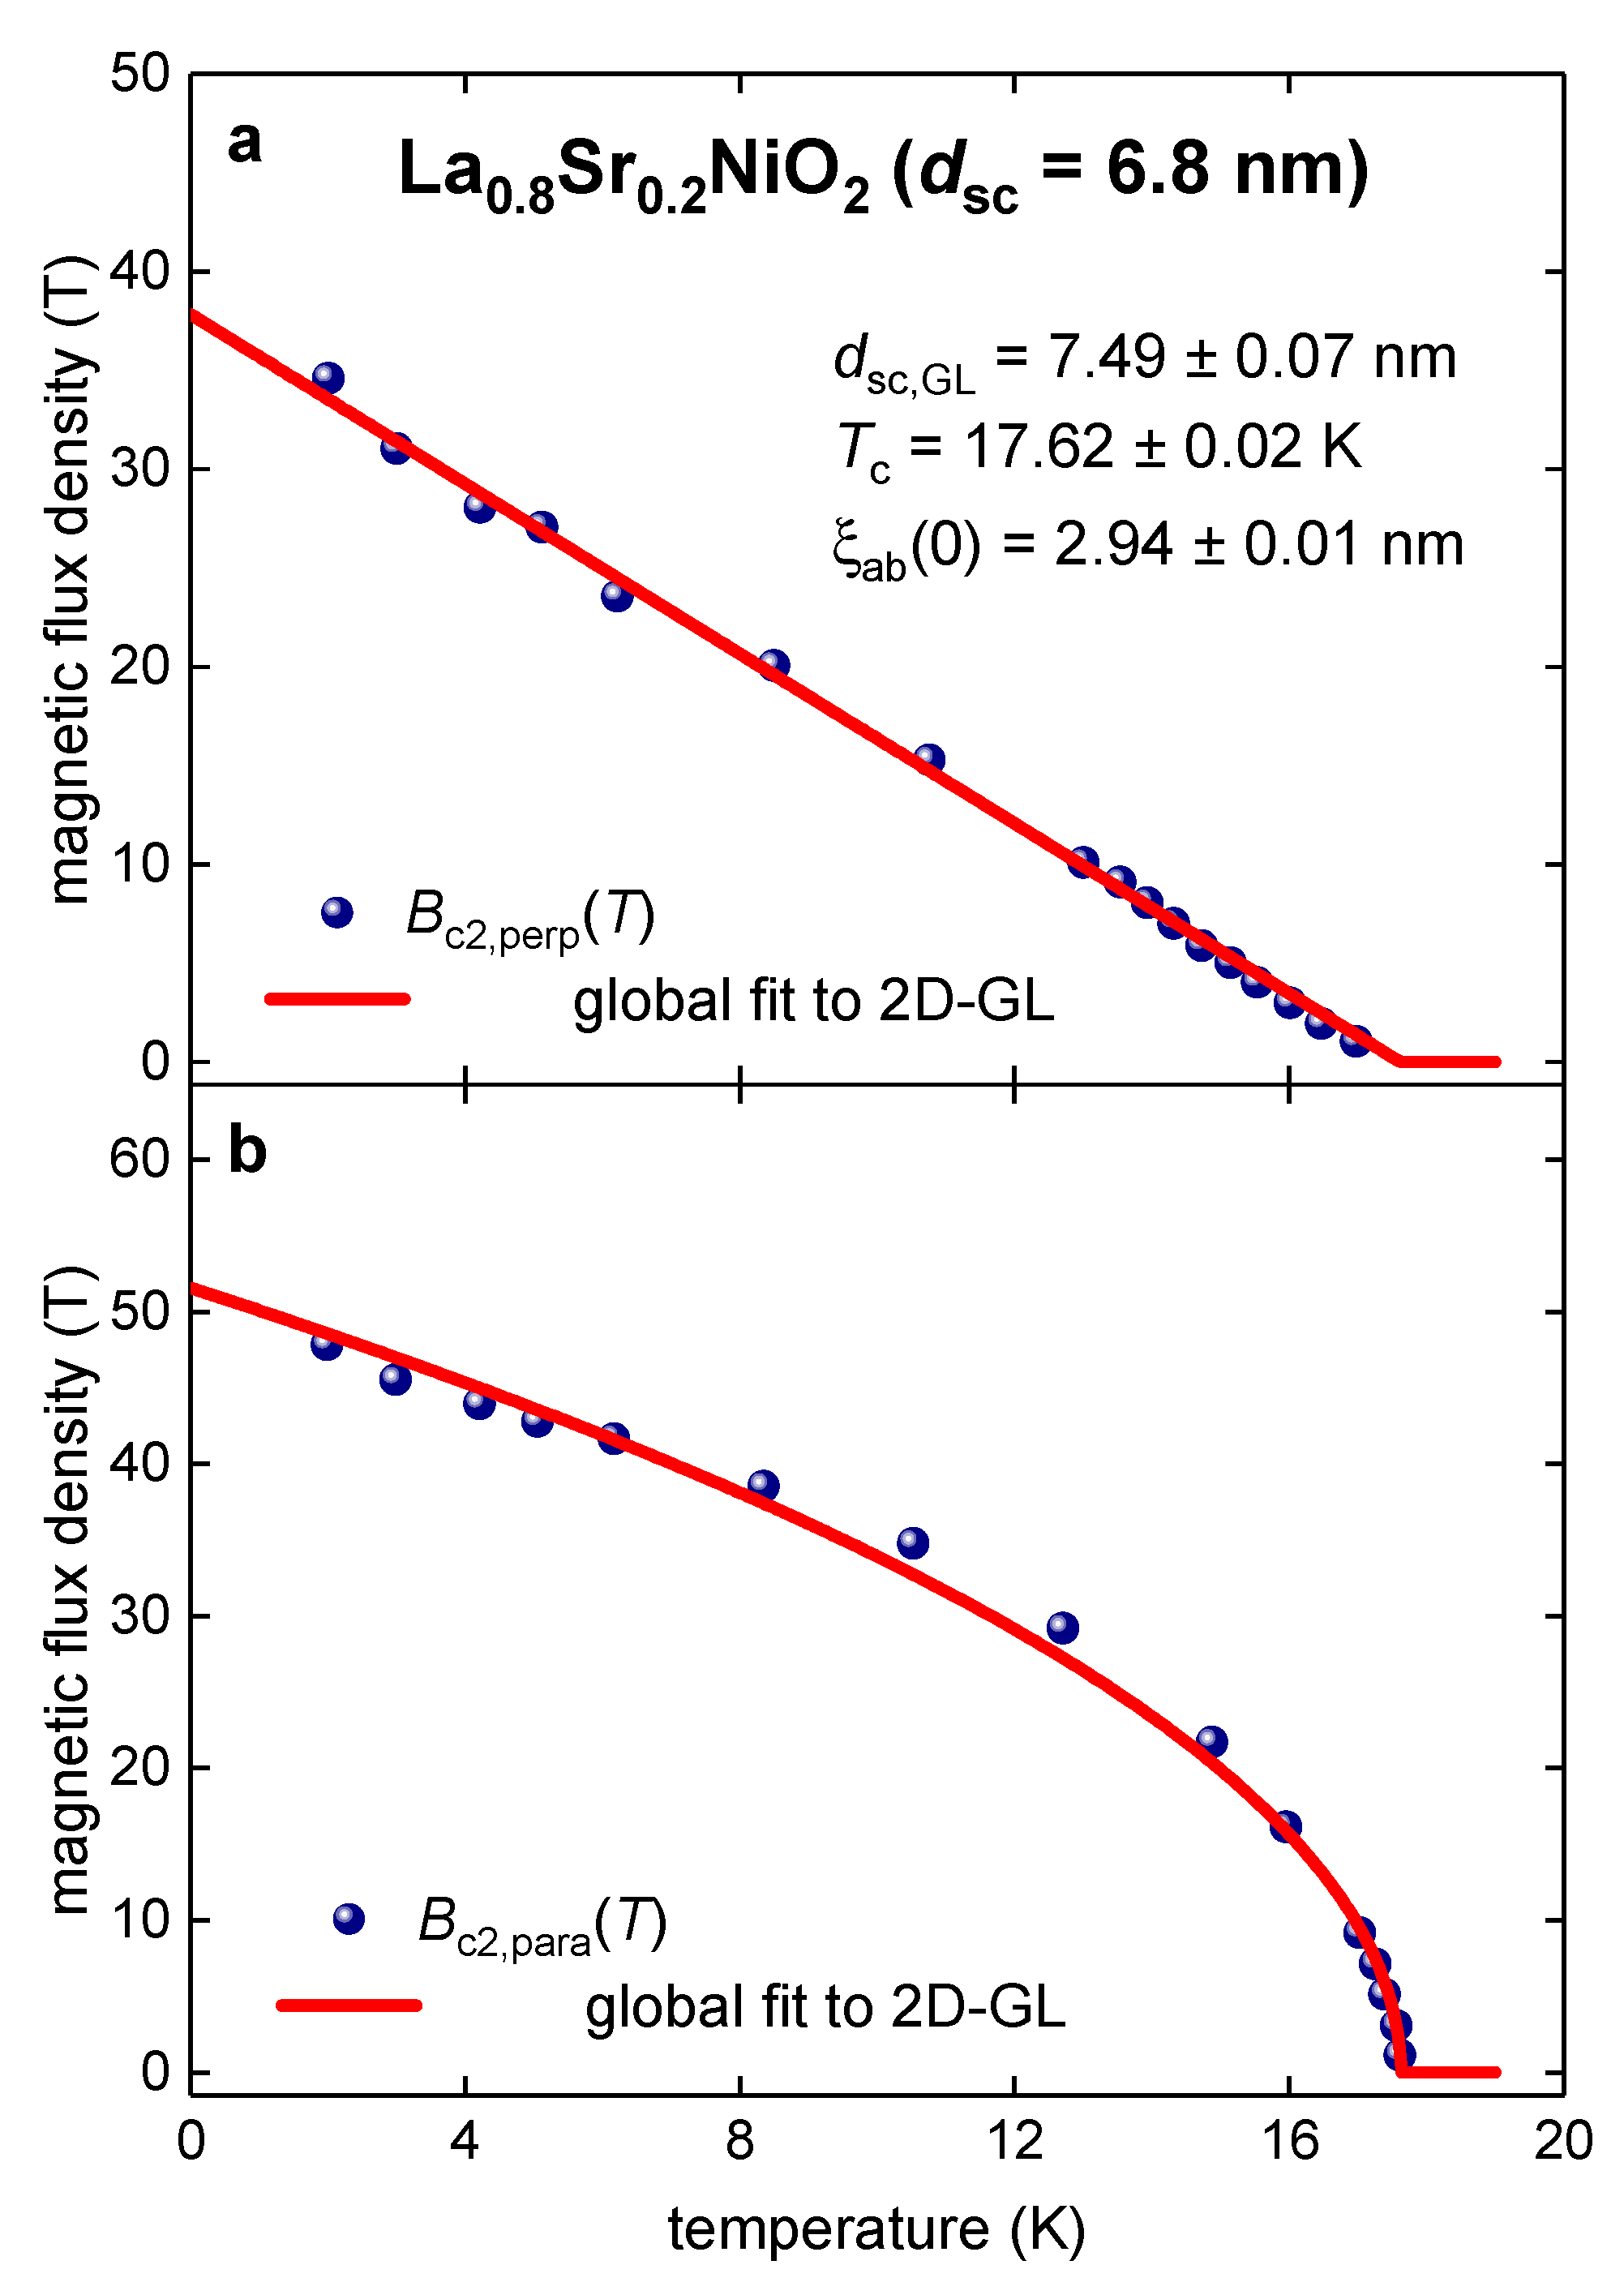
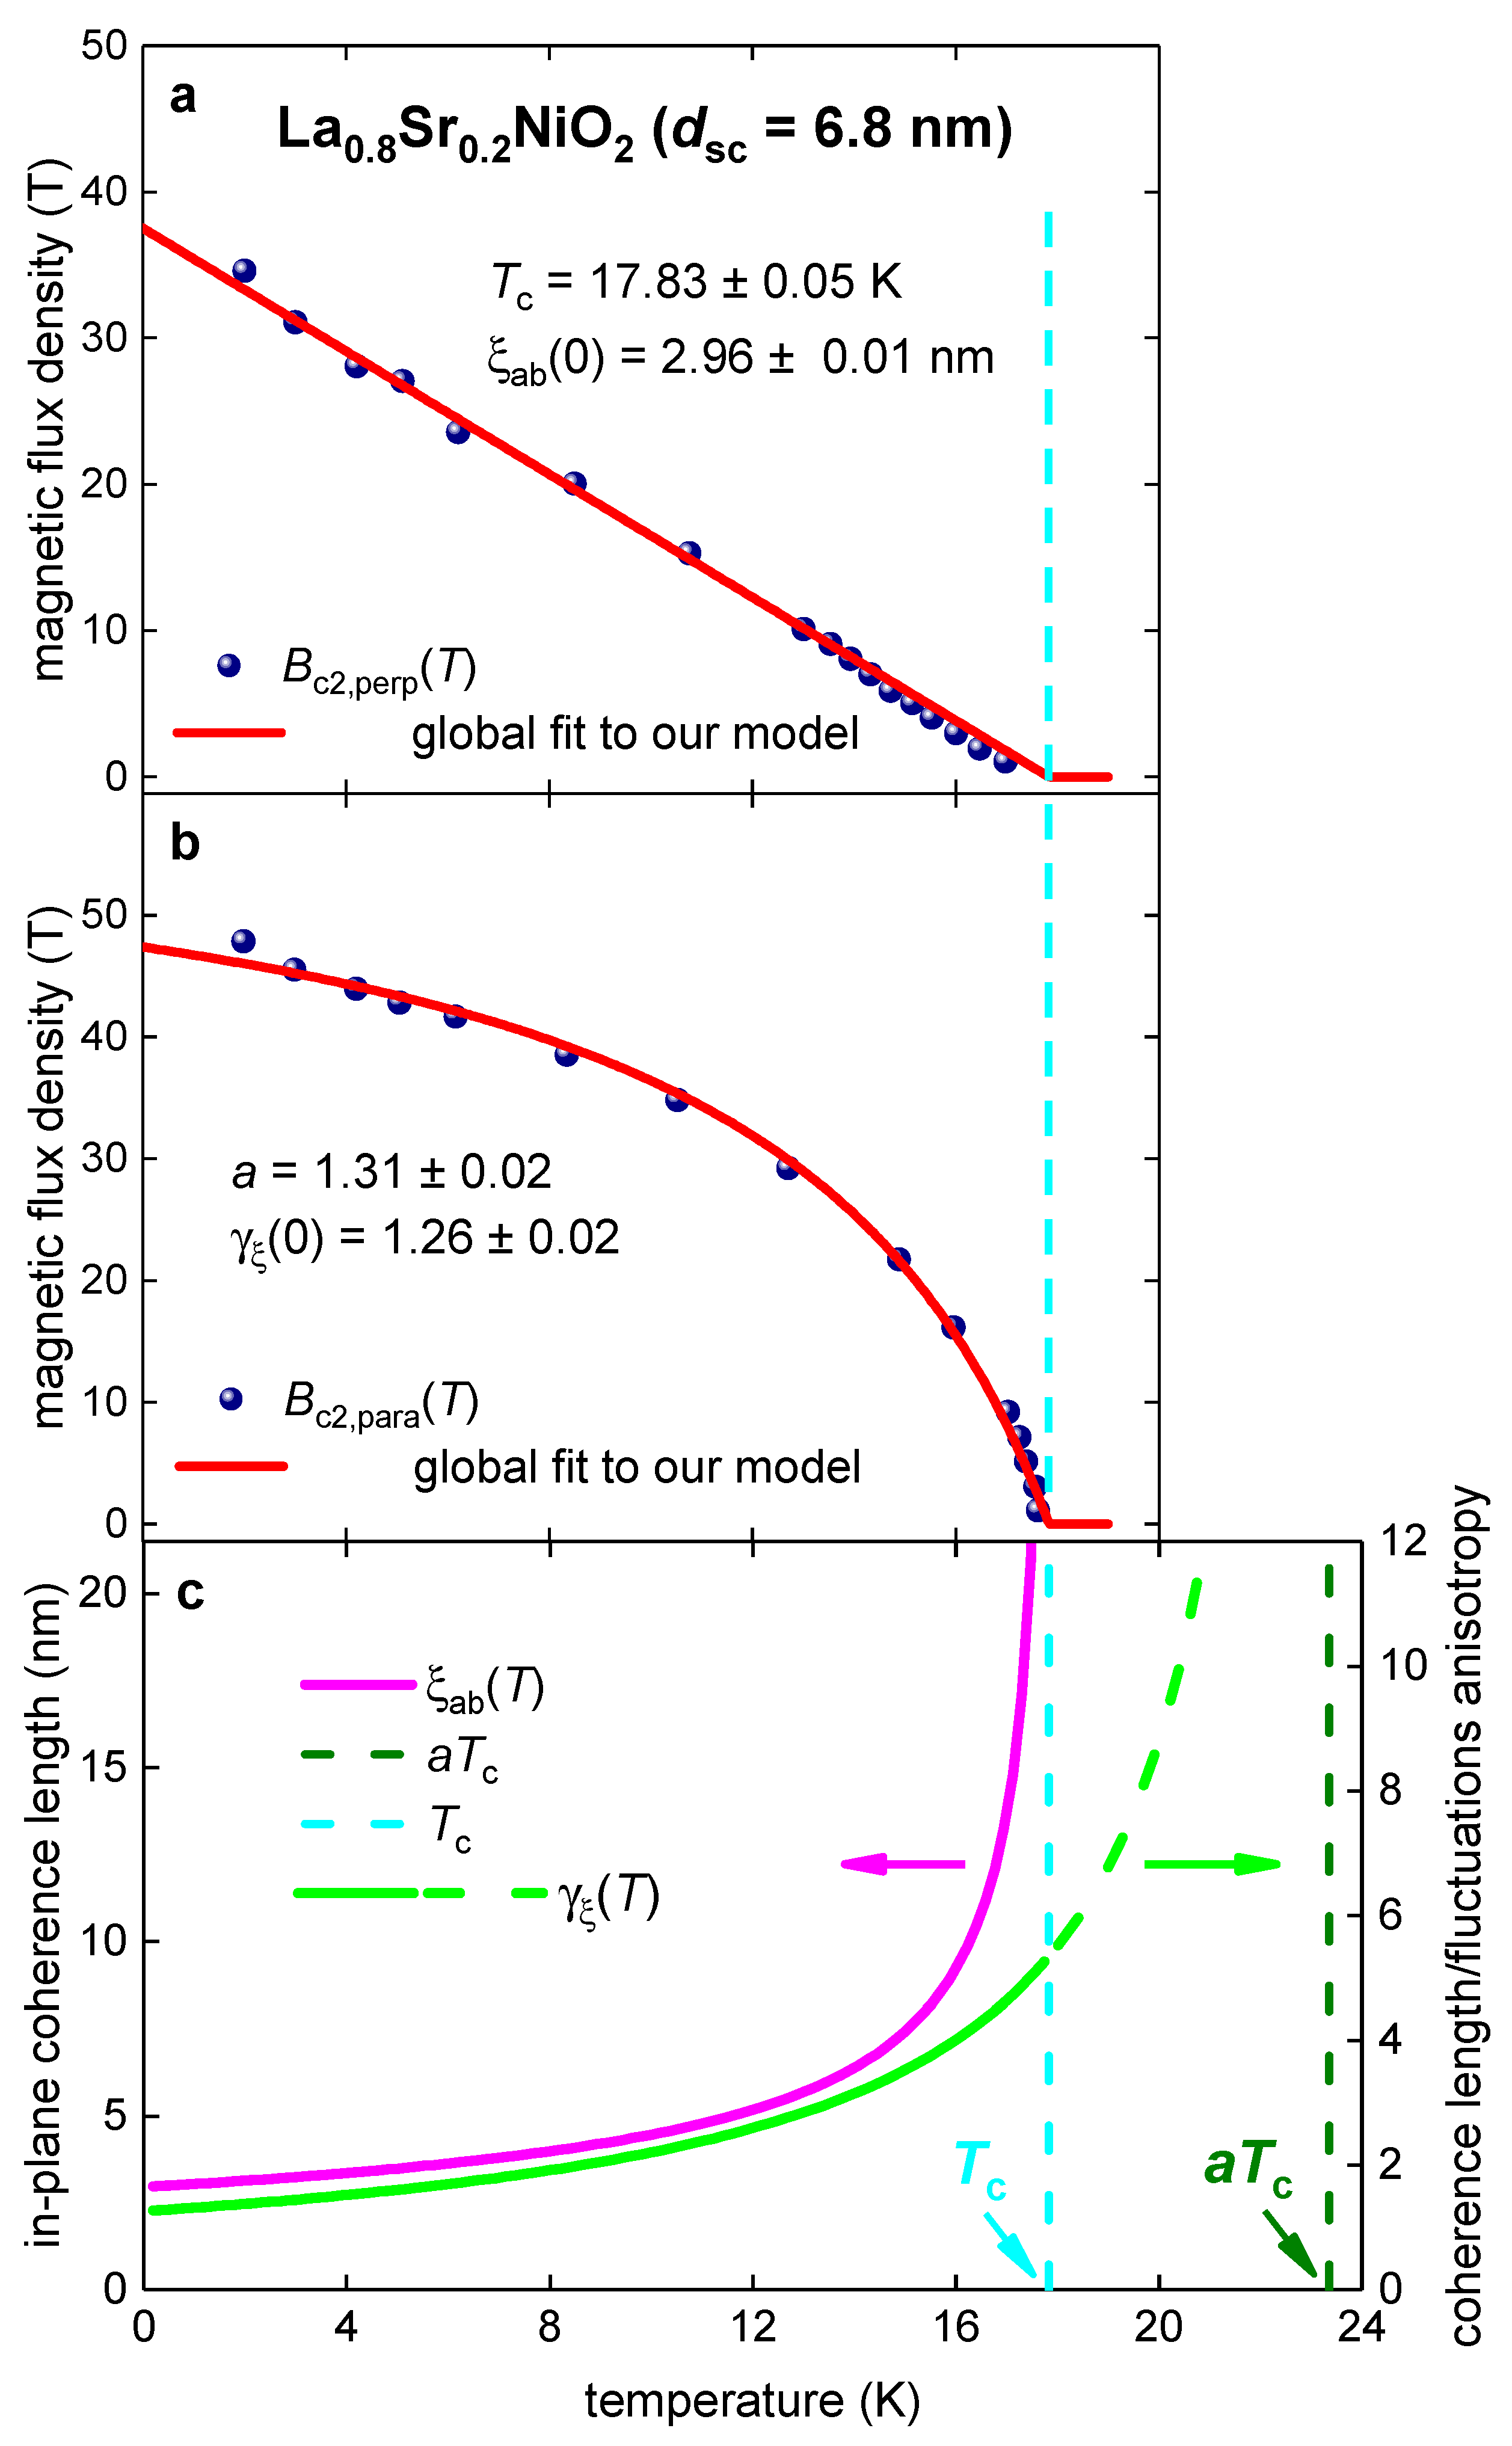
3.2. La0.8Sr0.2NiO2 film
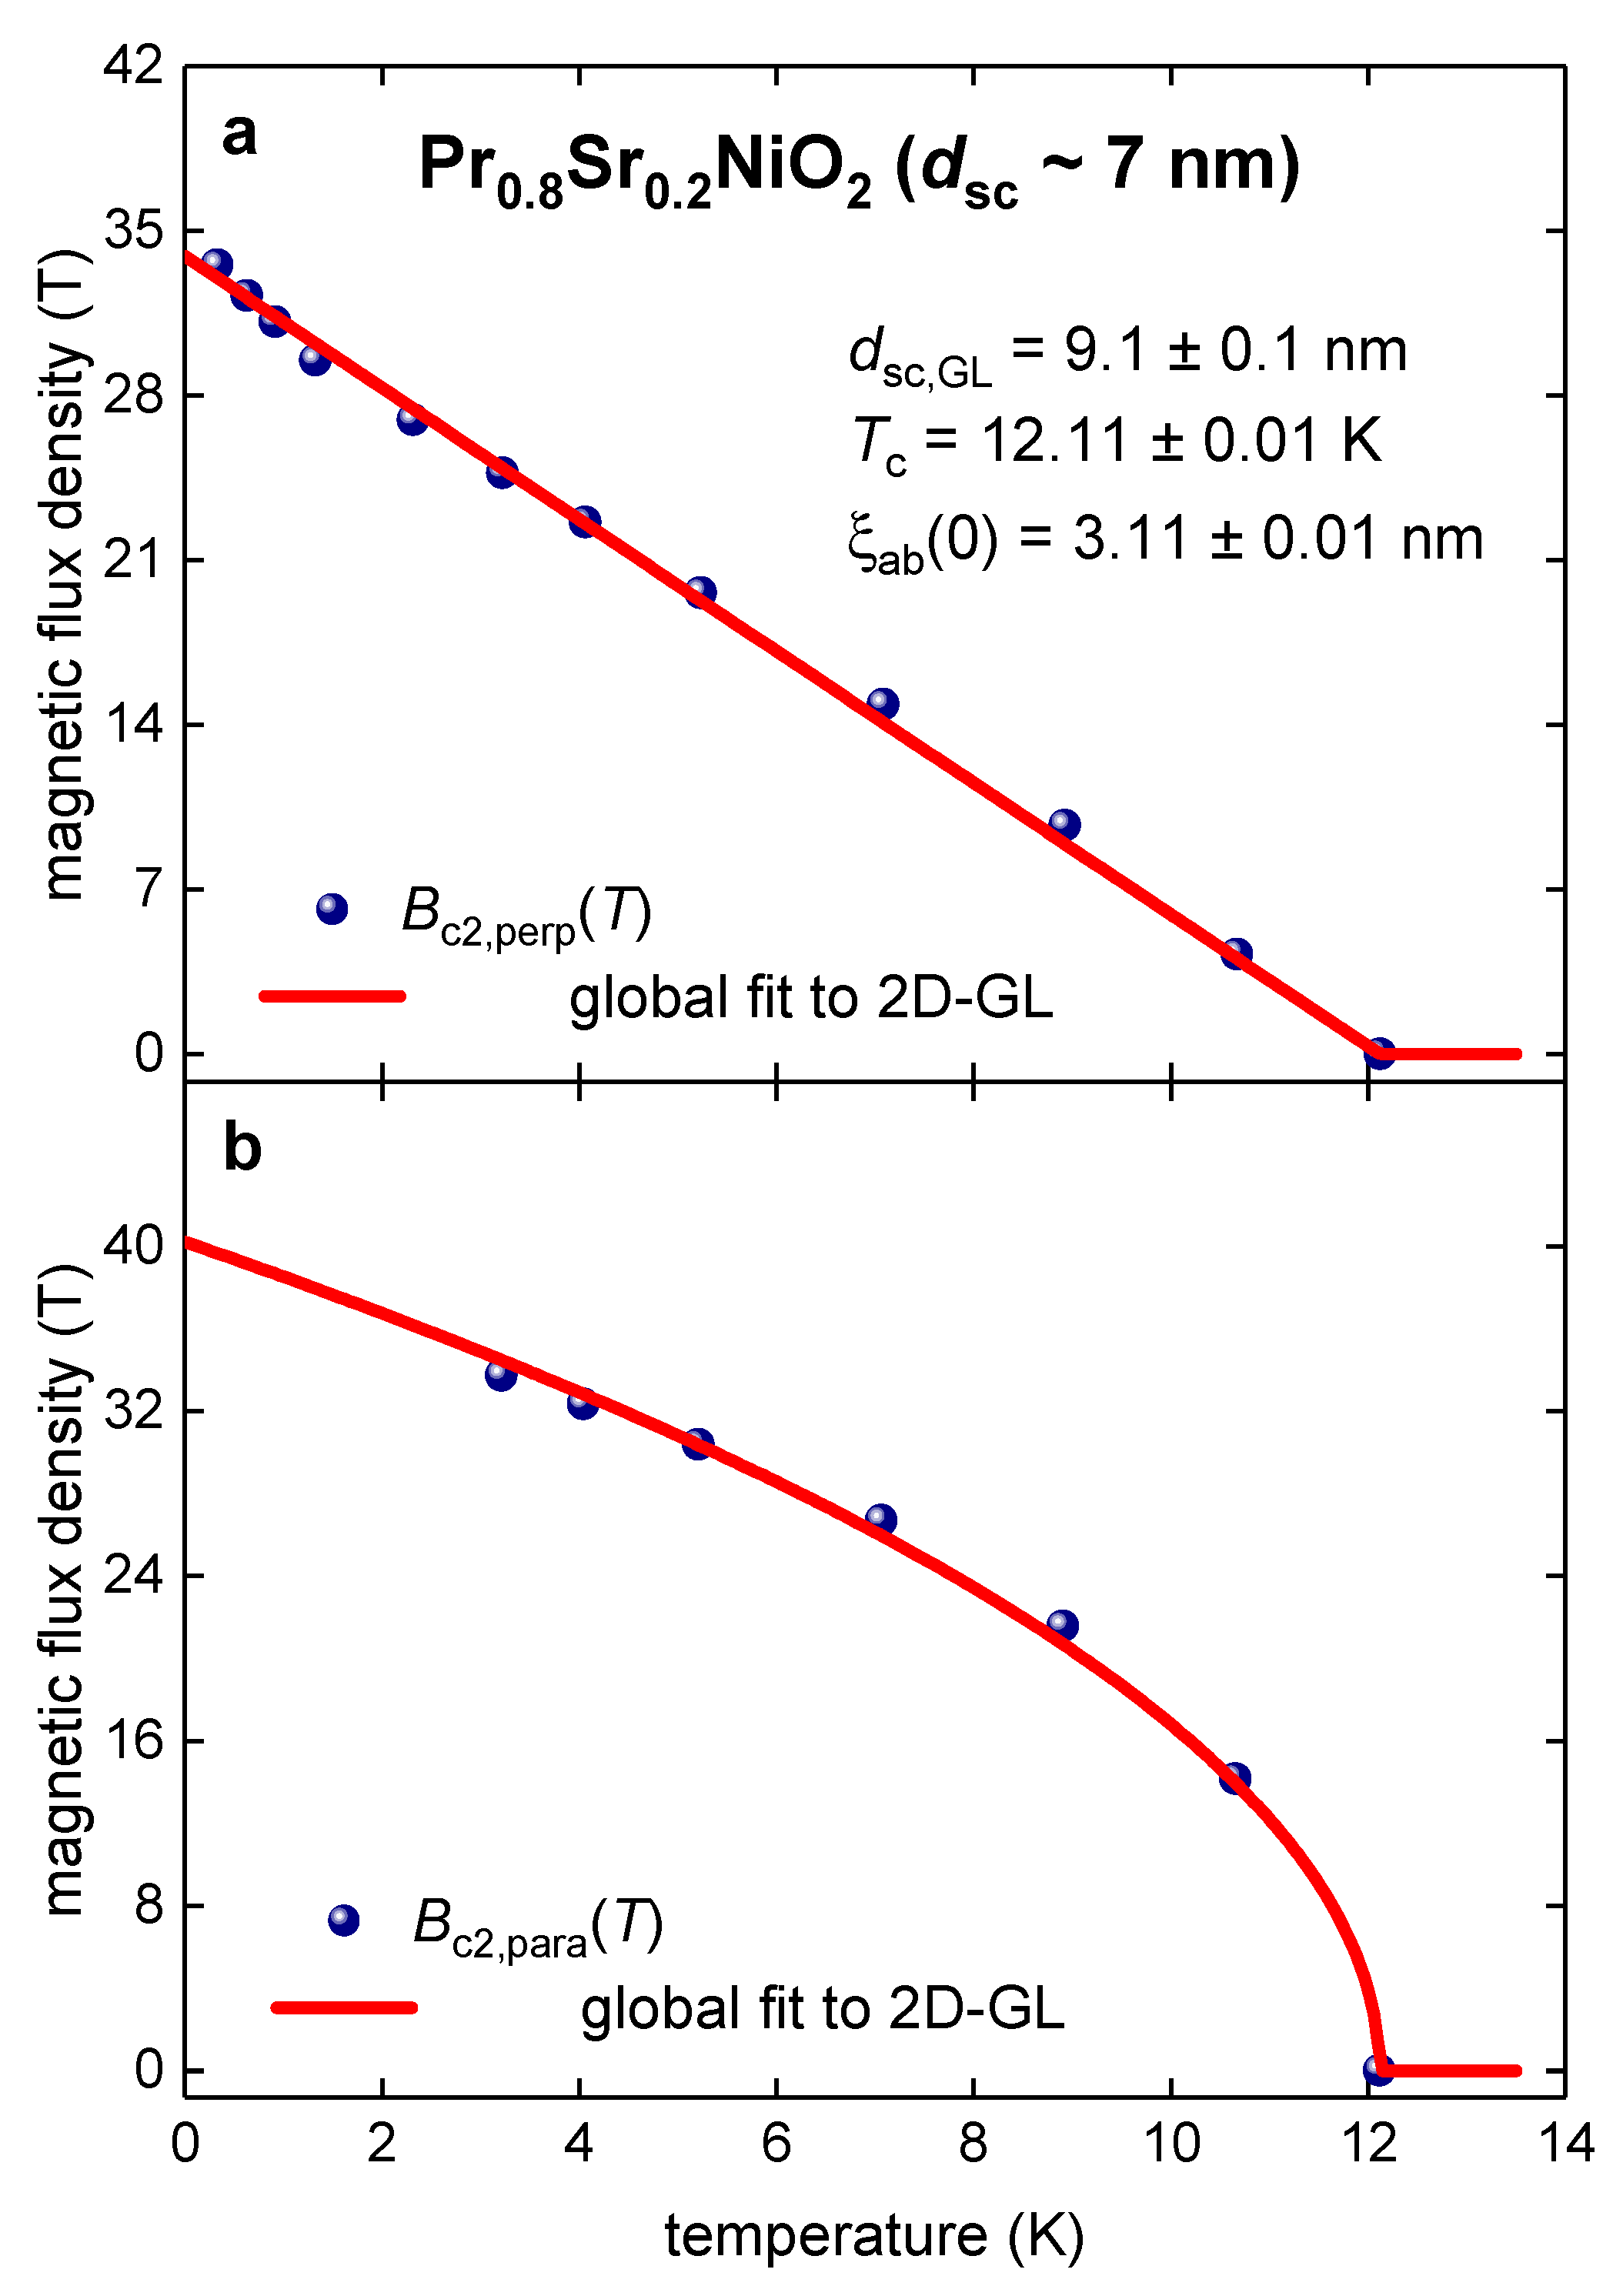
3.3. Pr0.8Sr0.2NiO2 film
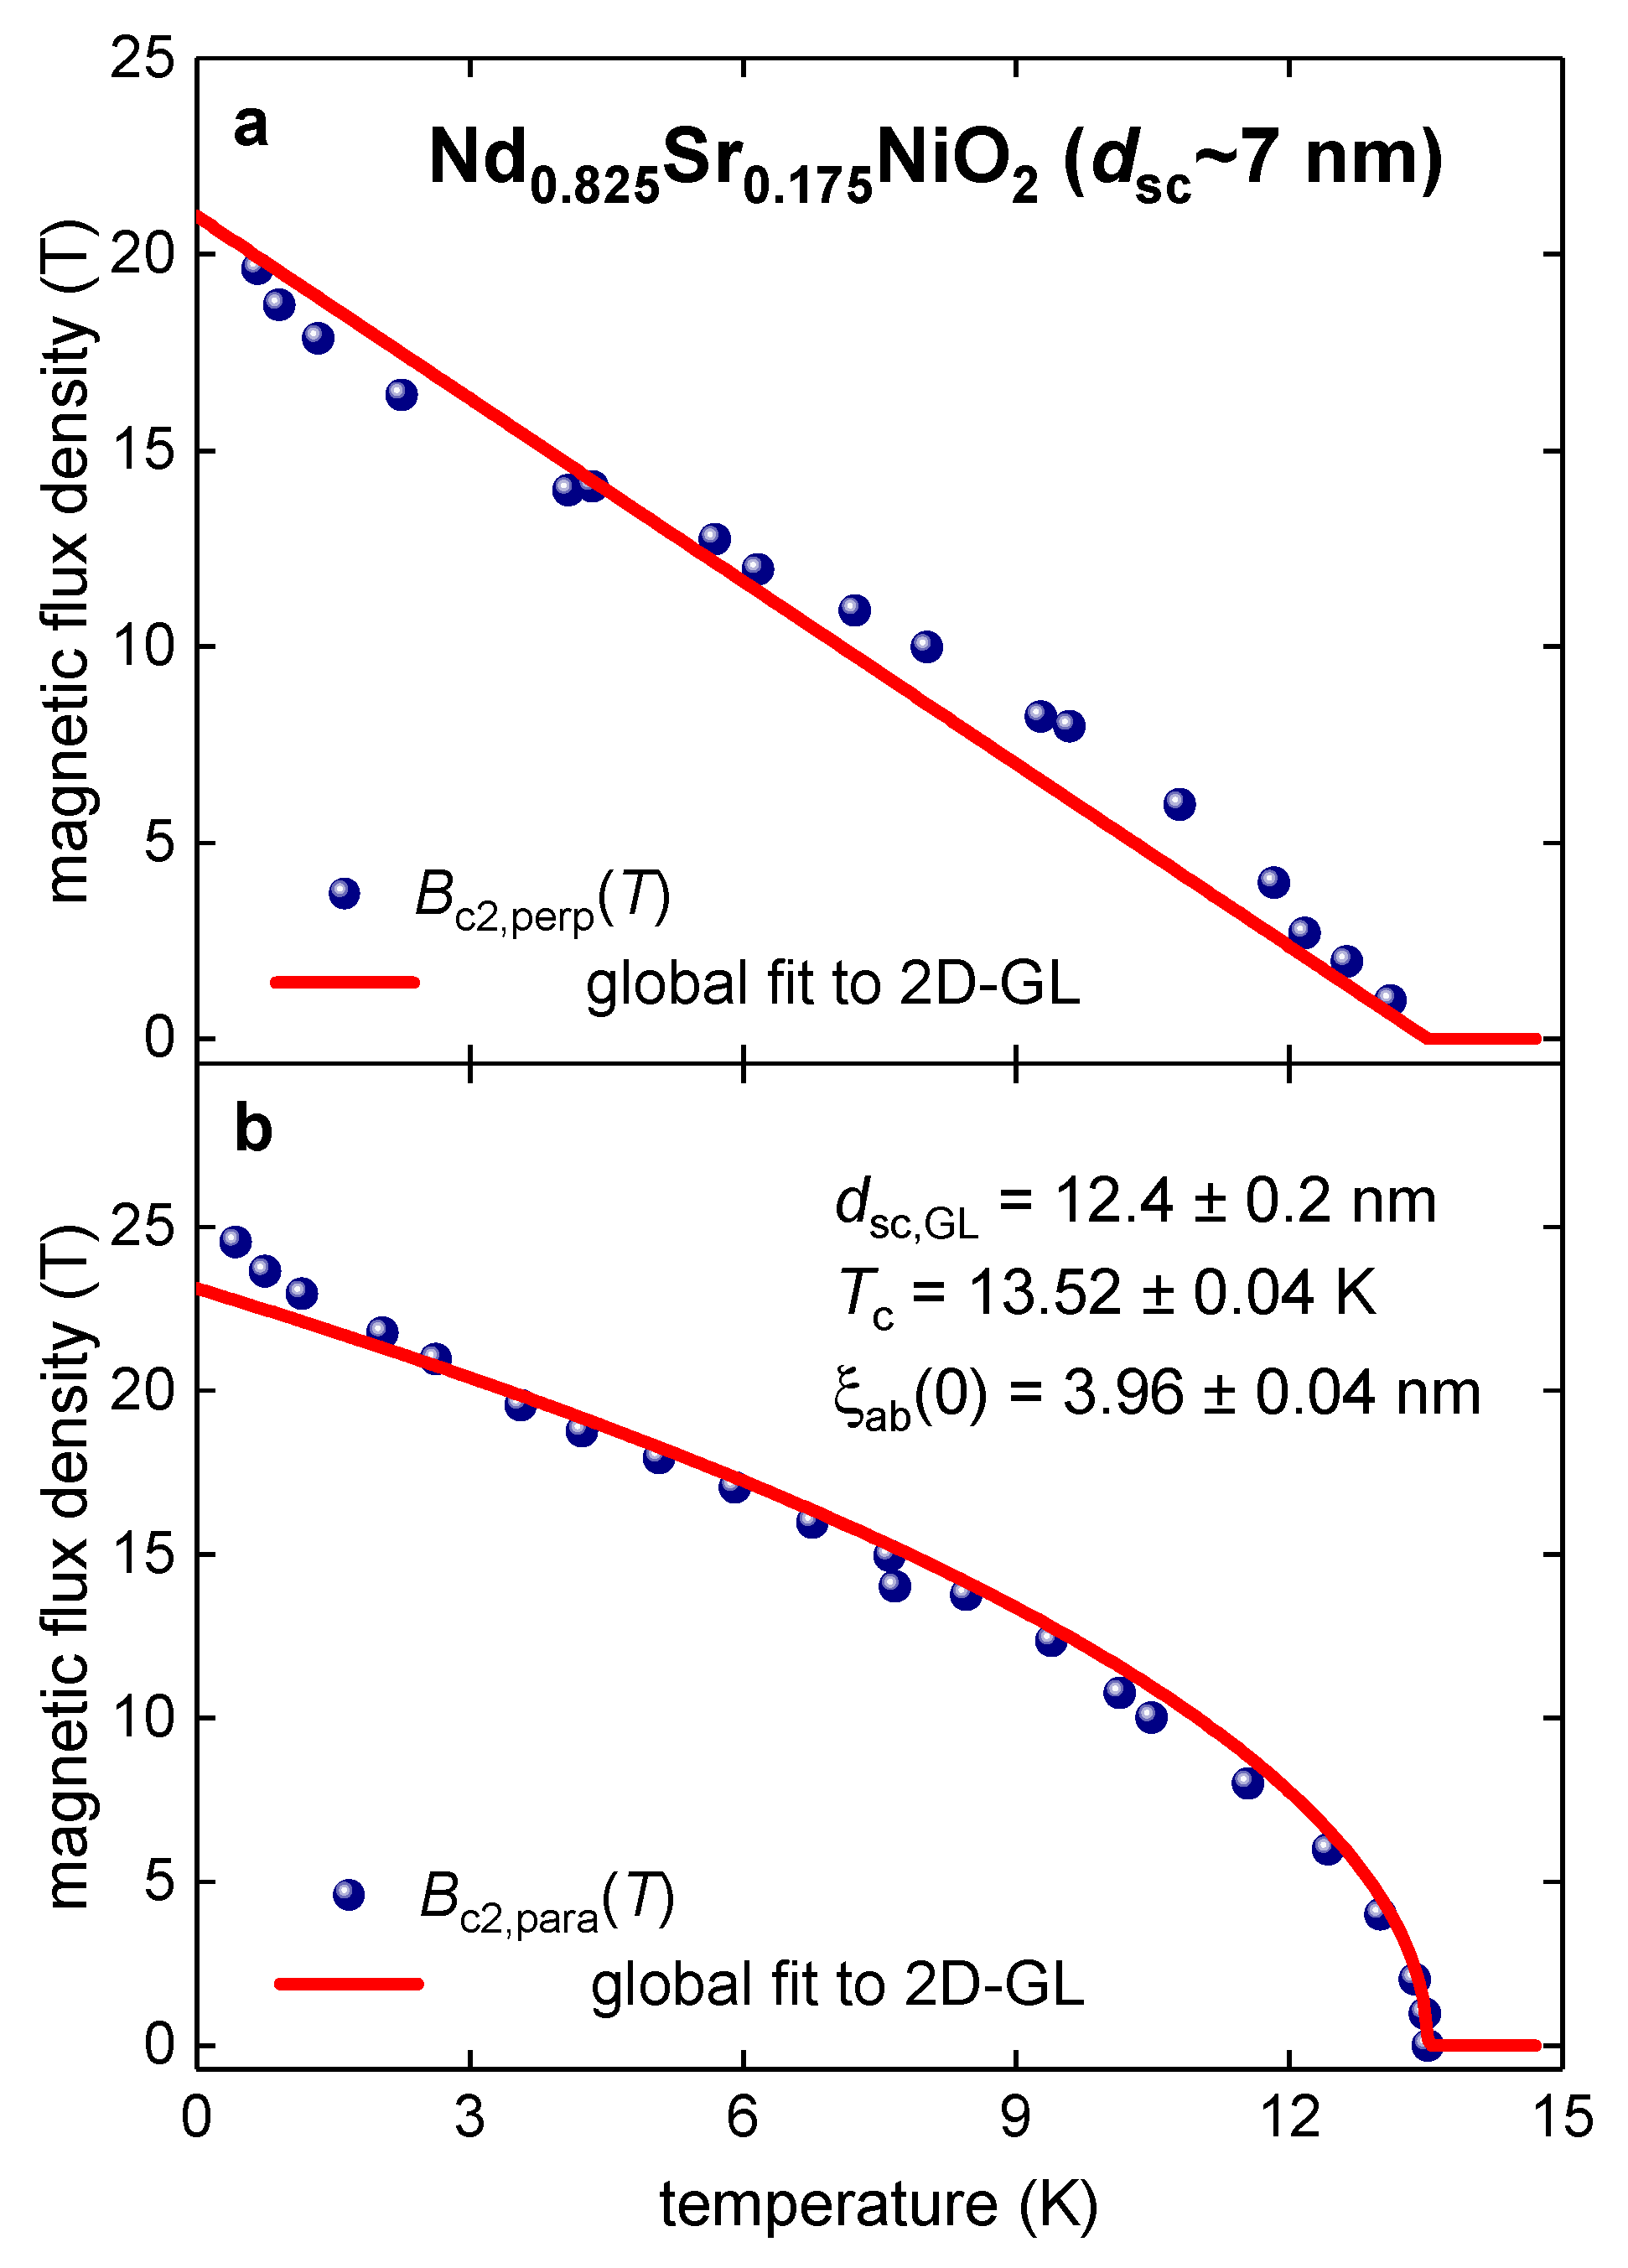
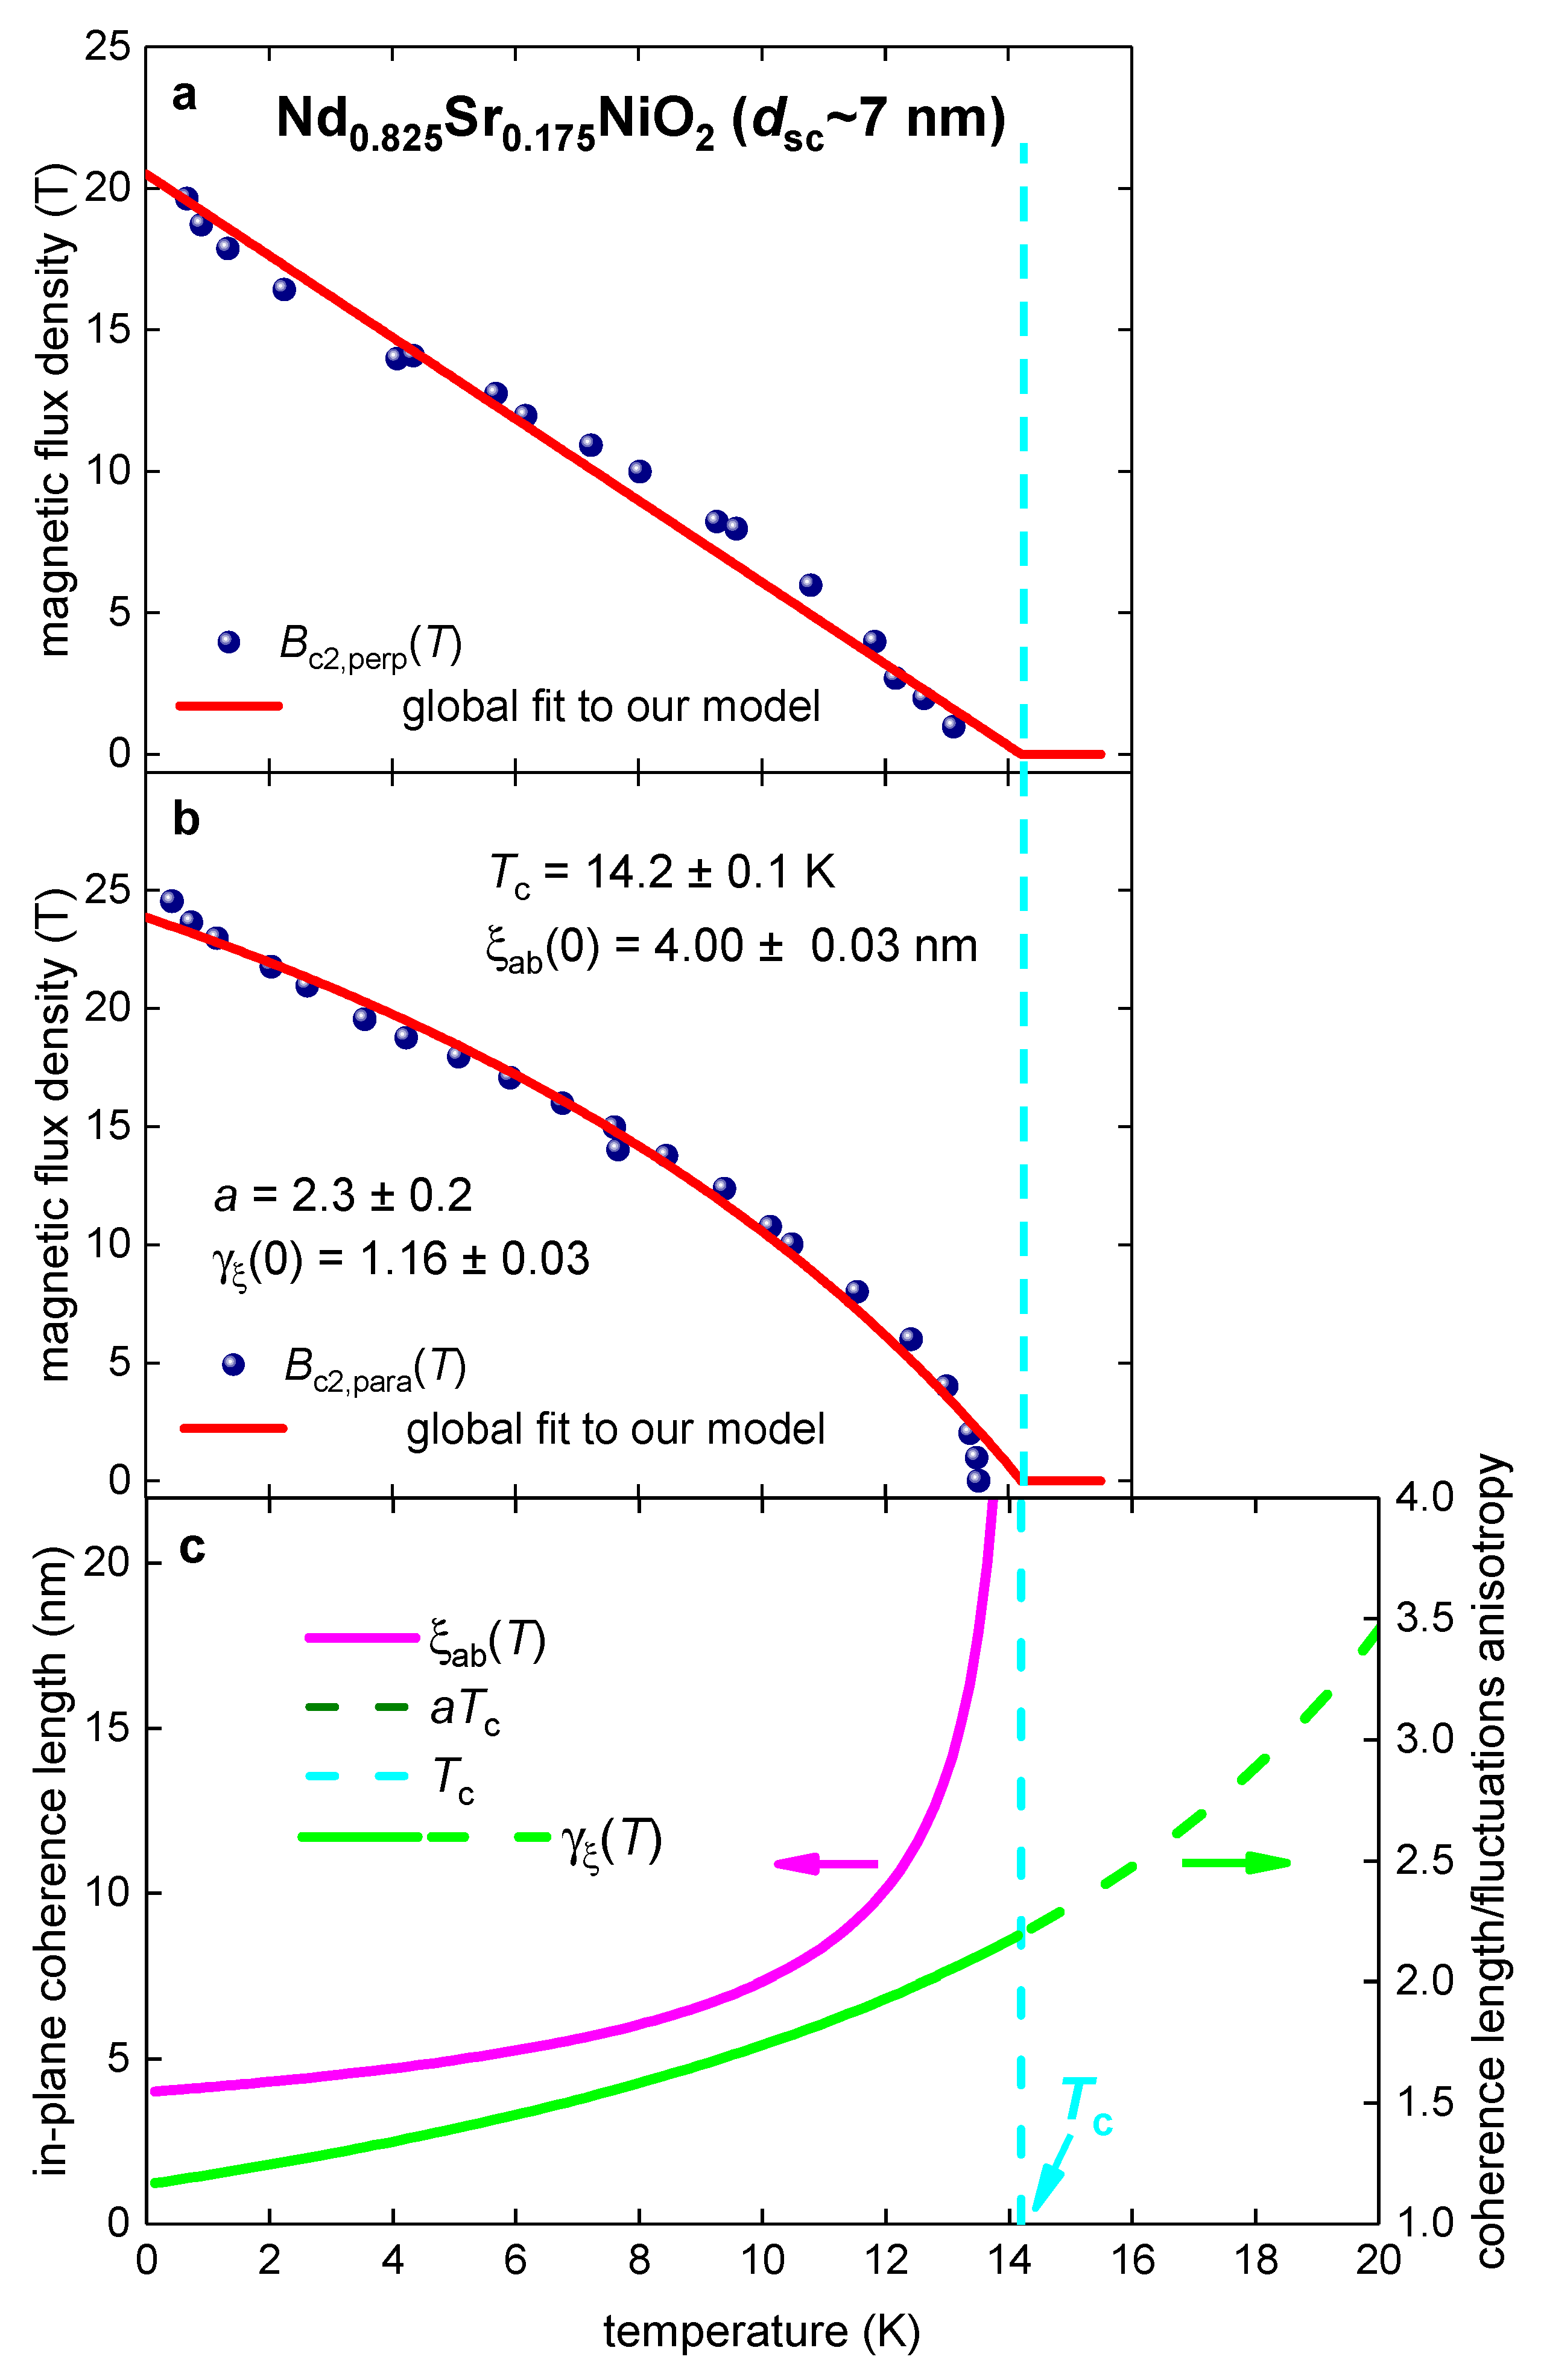
3.4. Nd0.825Sr0.175NiO2 film
3.5. La0.8Sr0.2NiO2 film
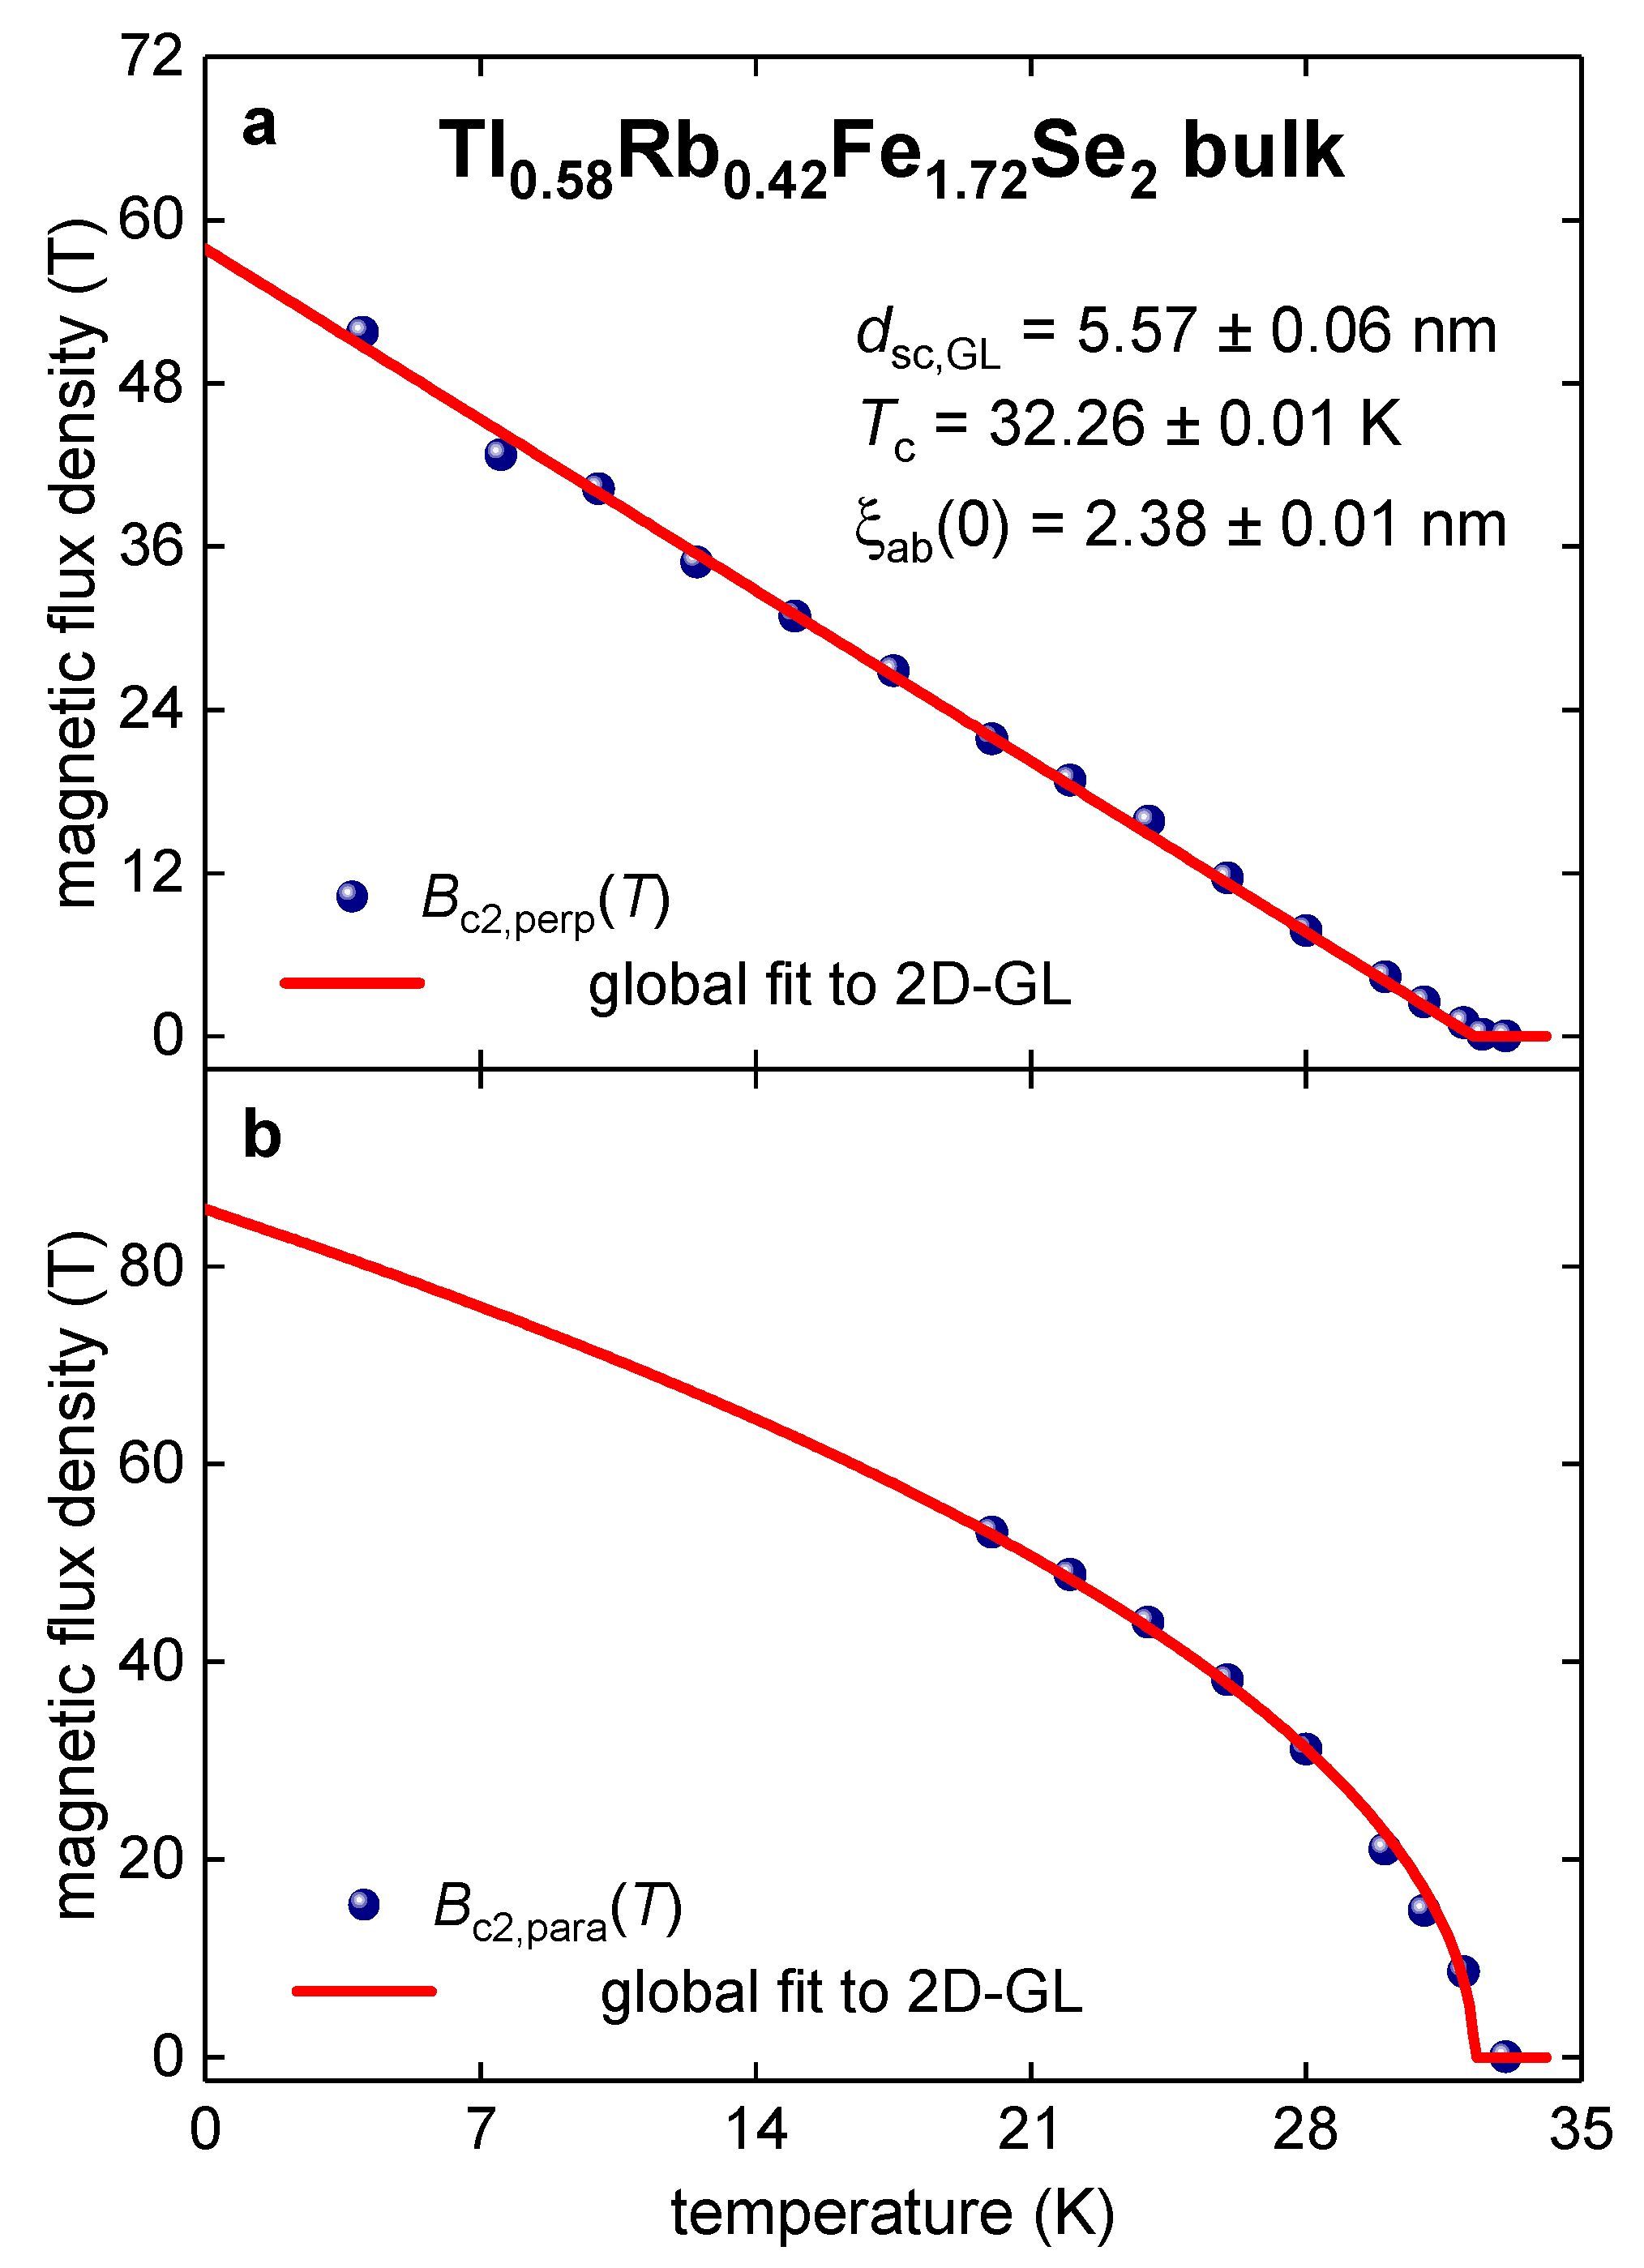
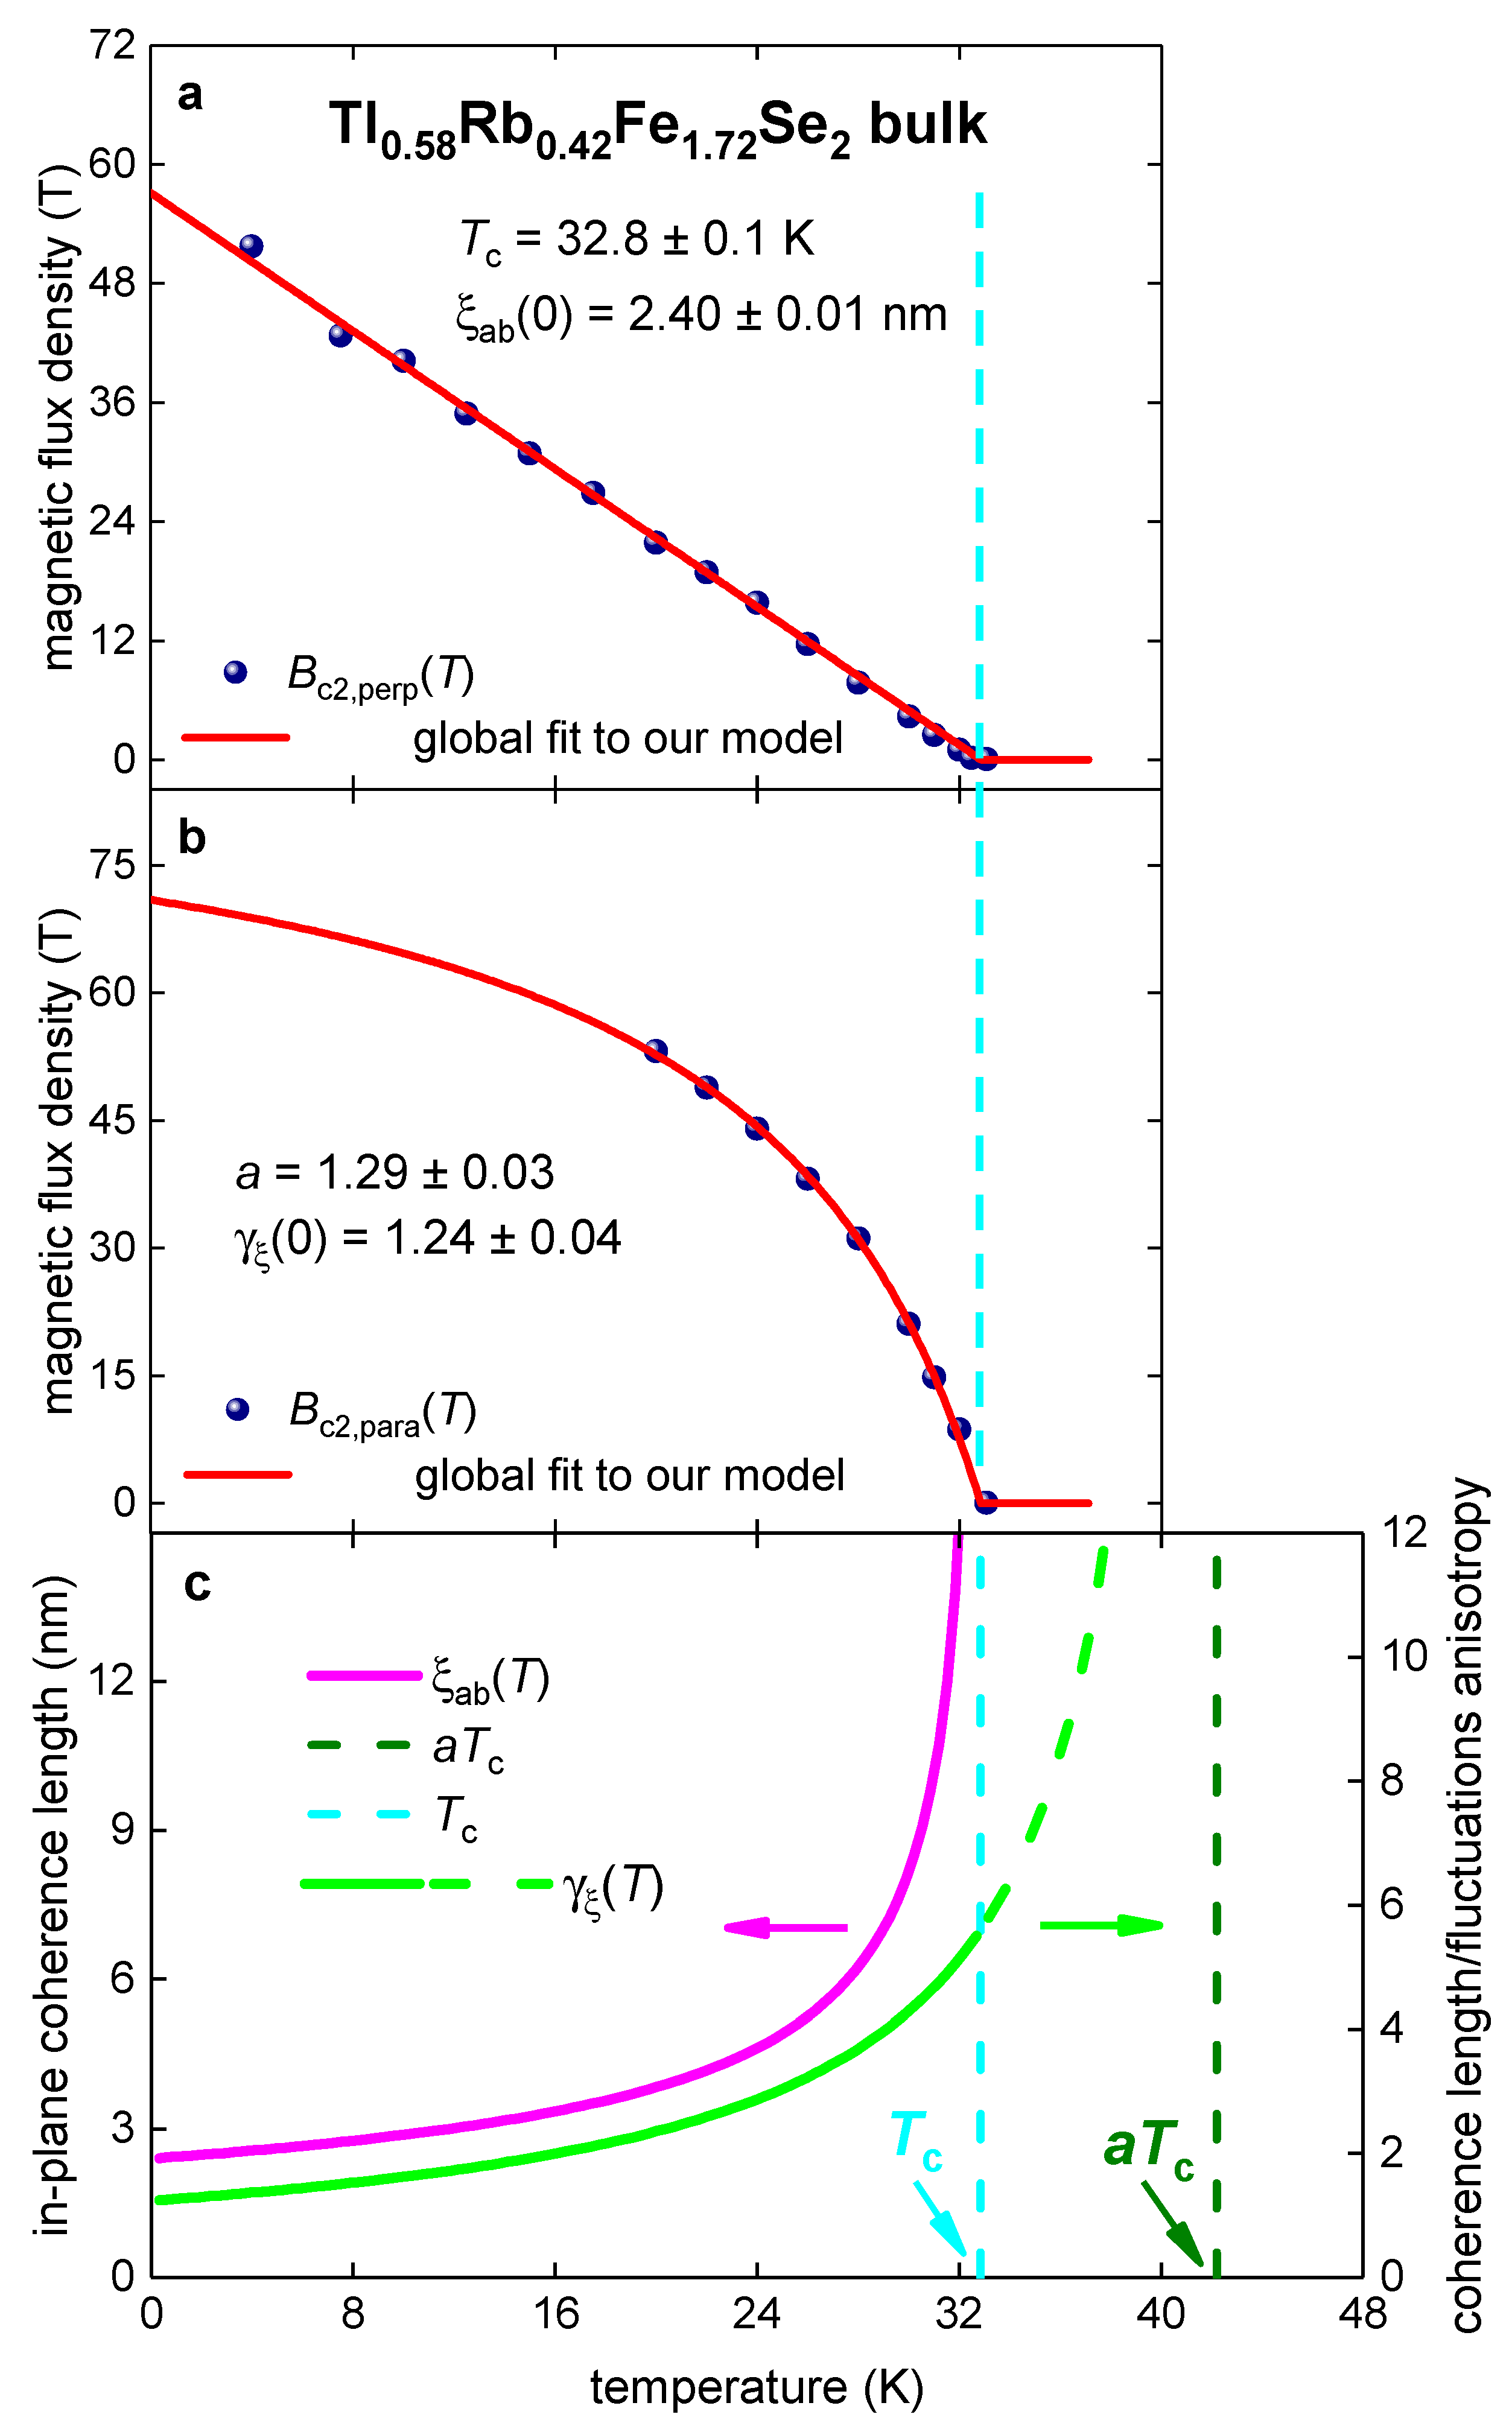
3.6. Bulk Tl0.58Rb0.42Fe1.72Se2
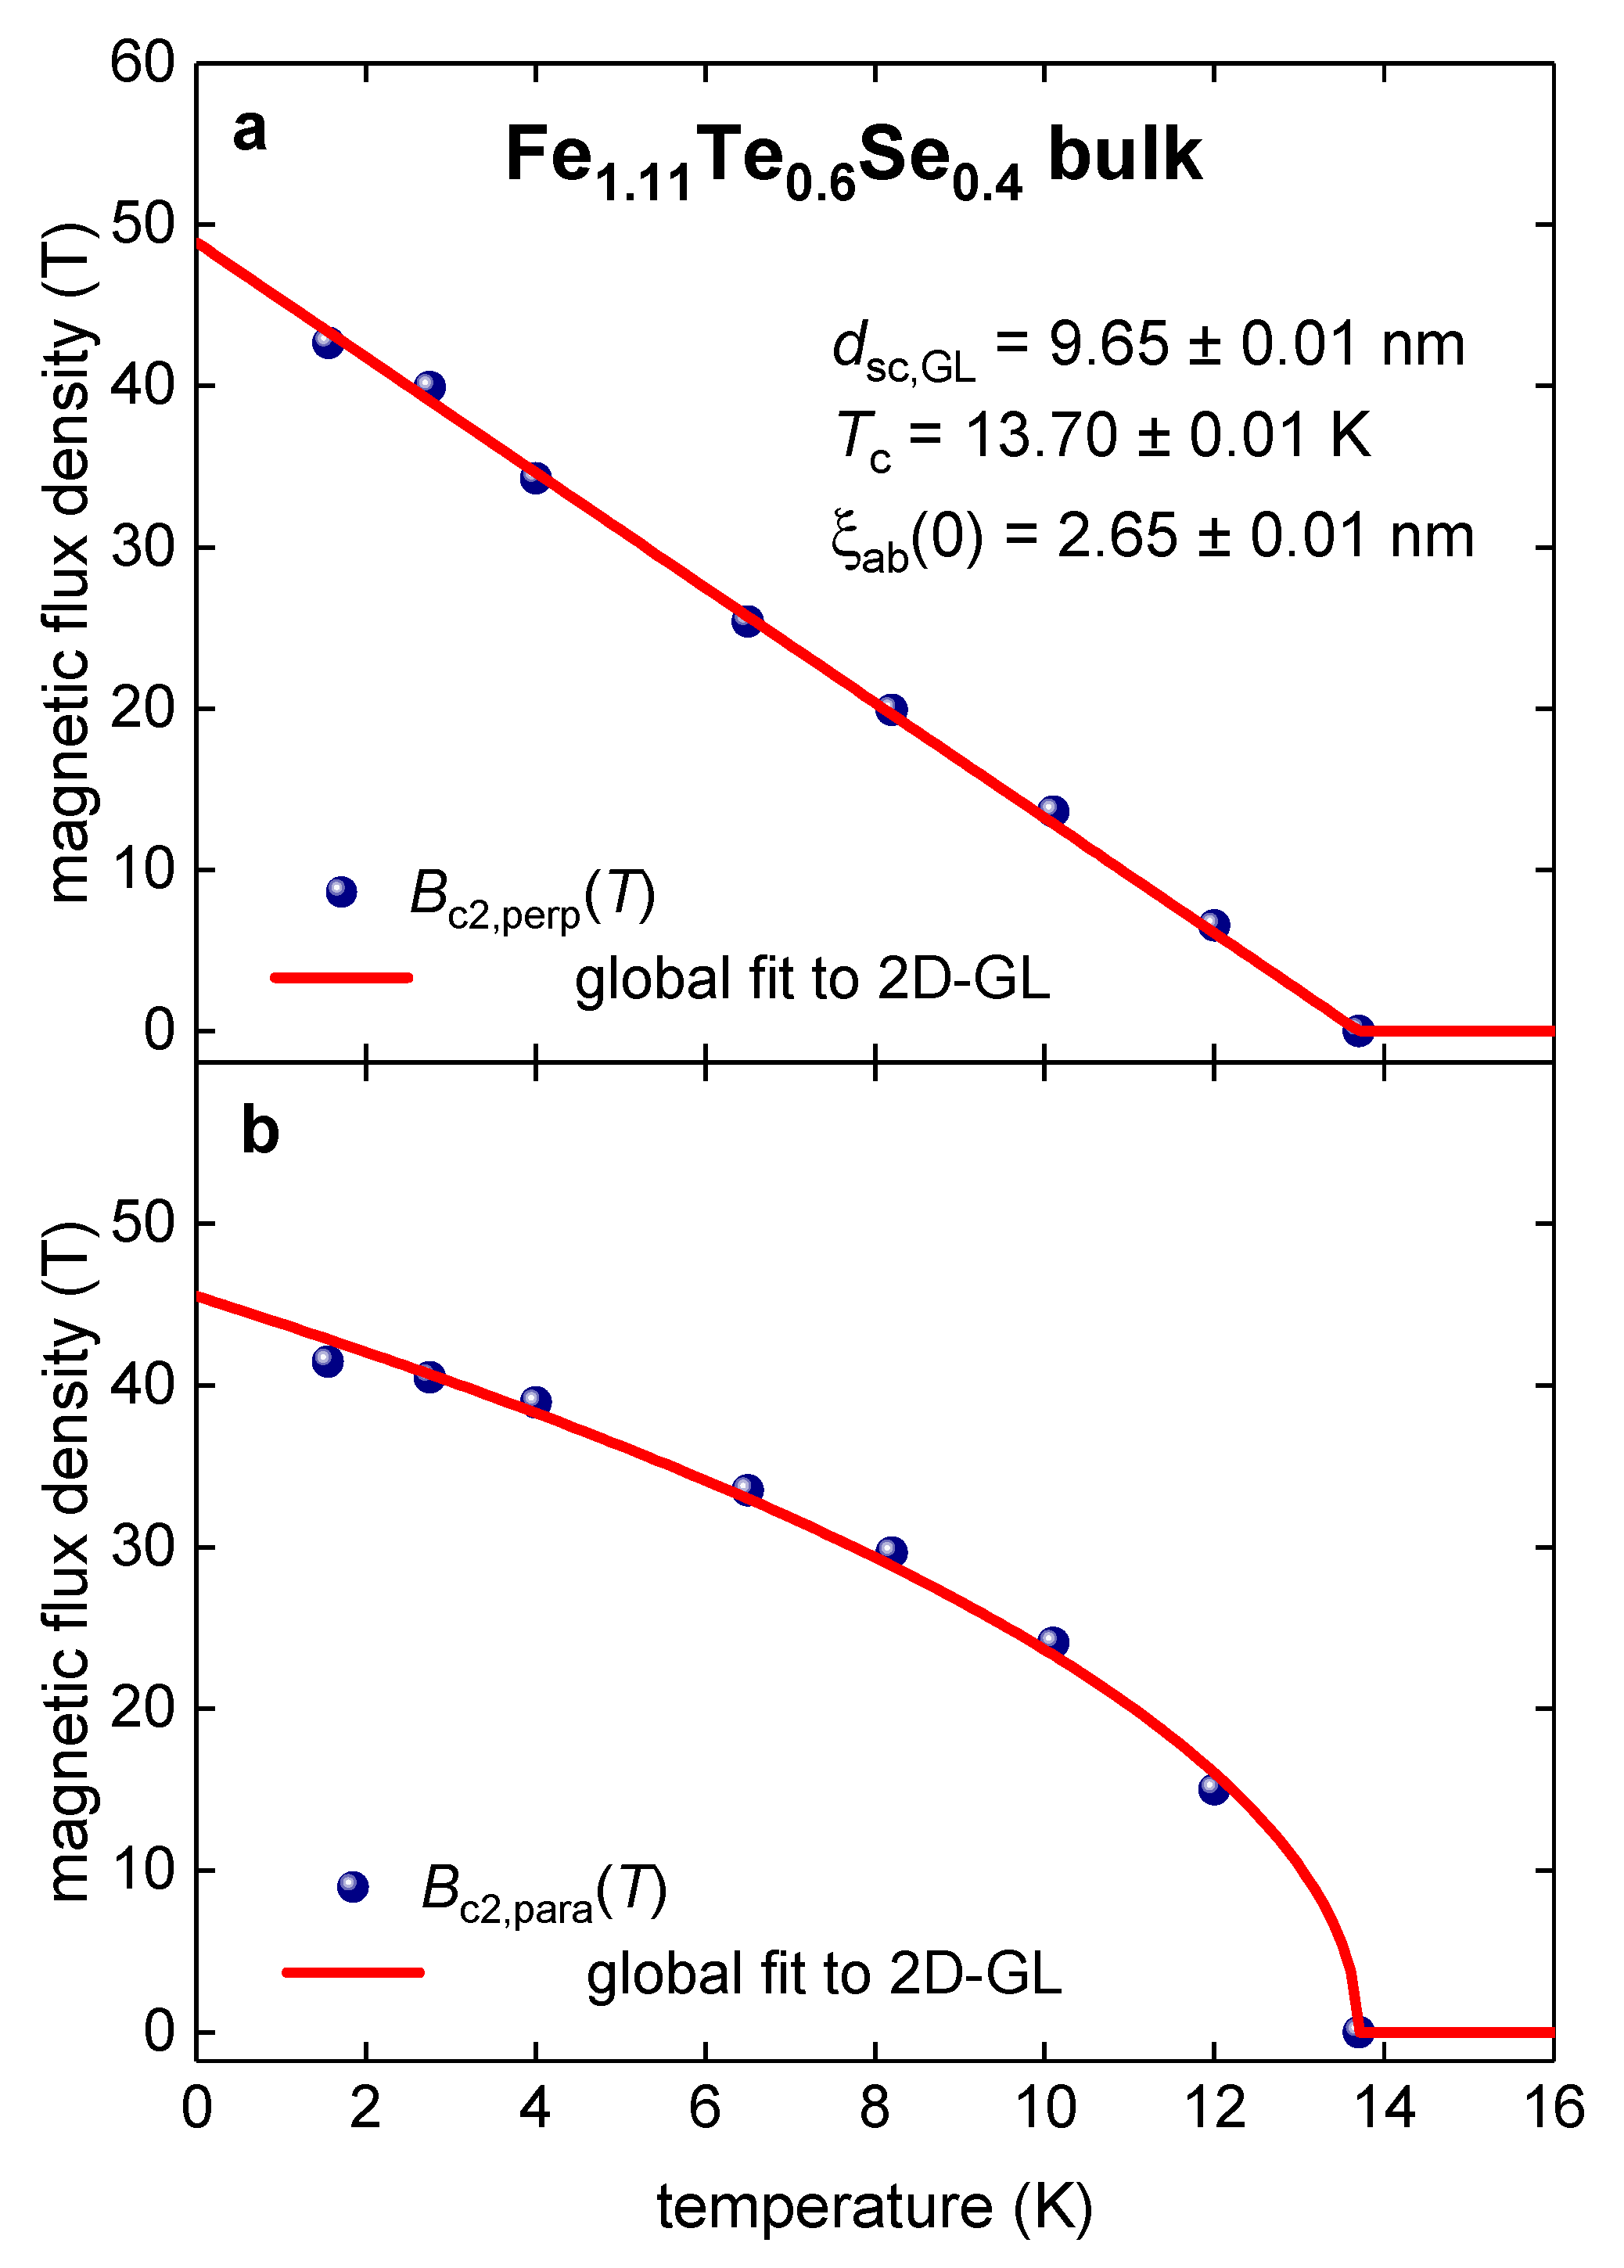
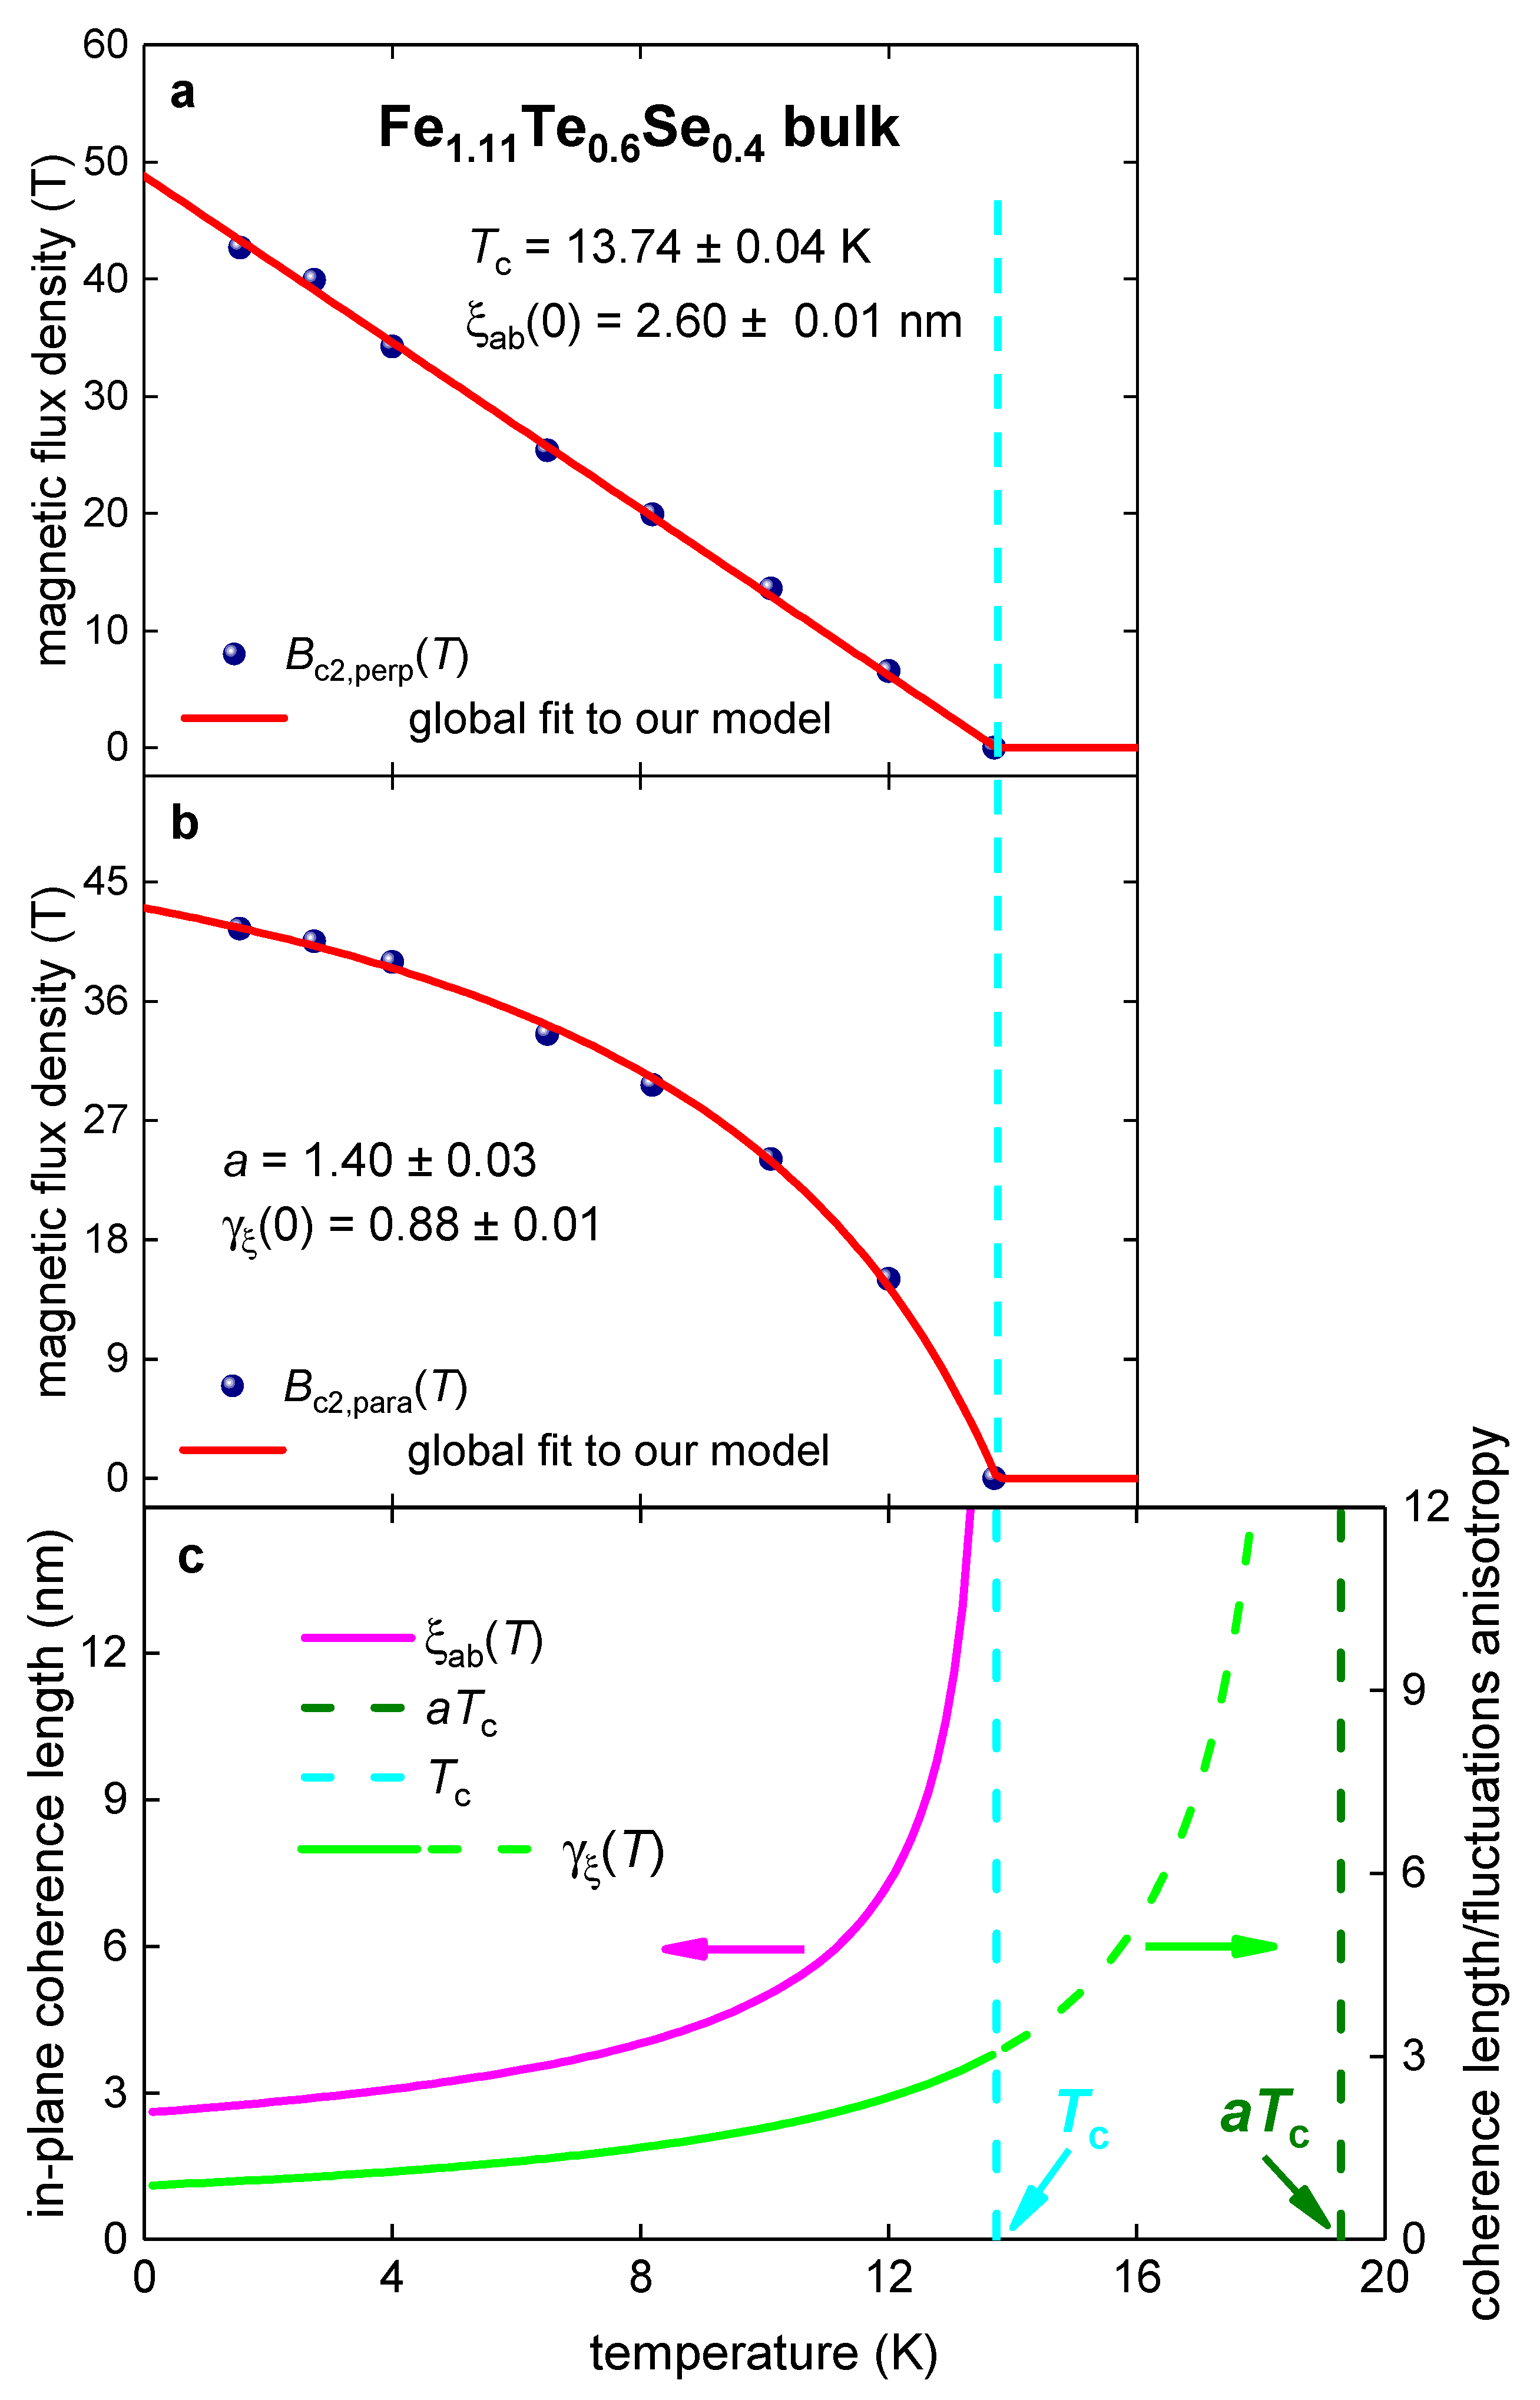
3.7. Bulk Fe1.11Te0.6Se0.4
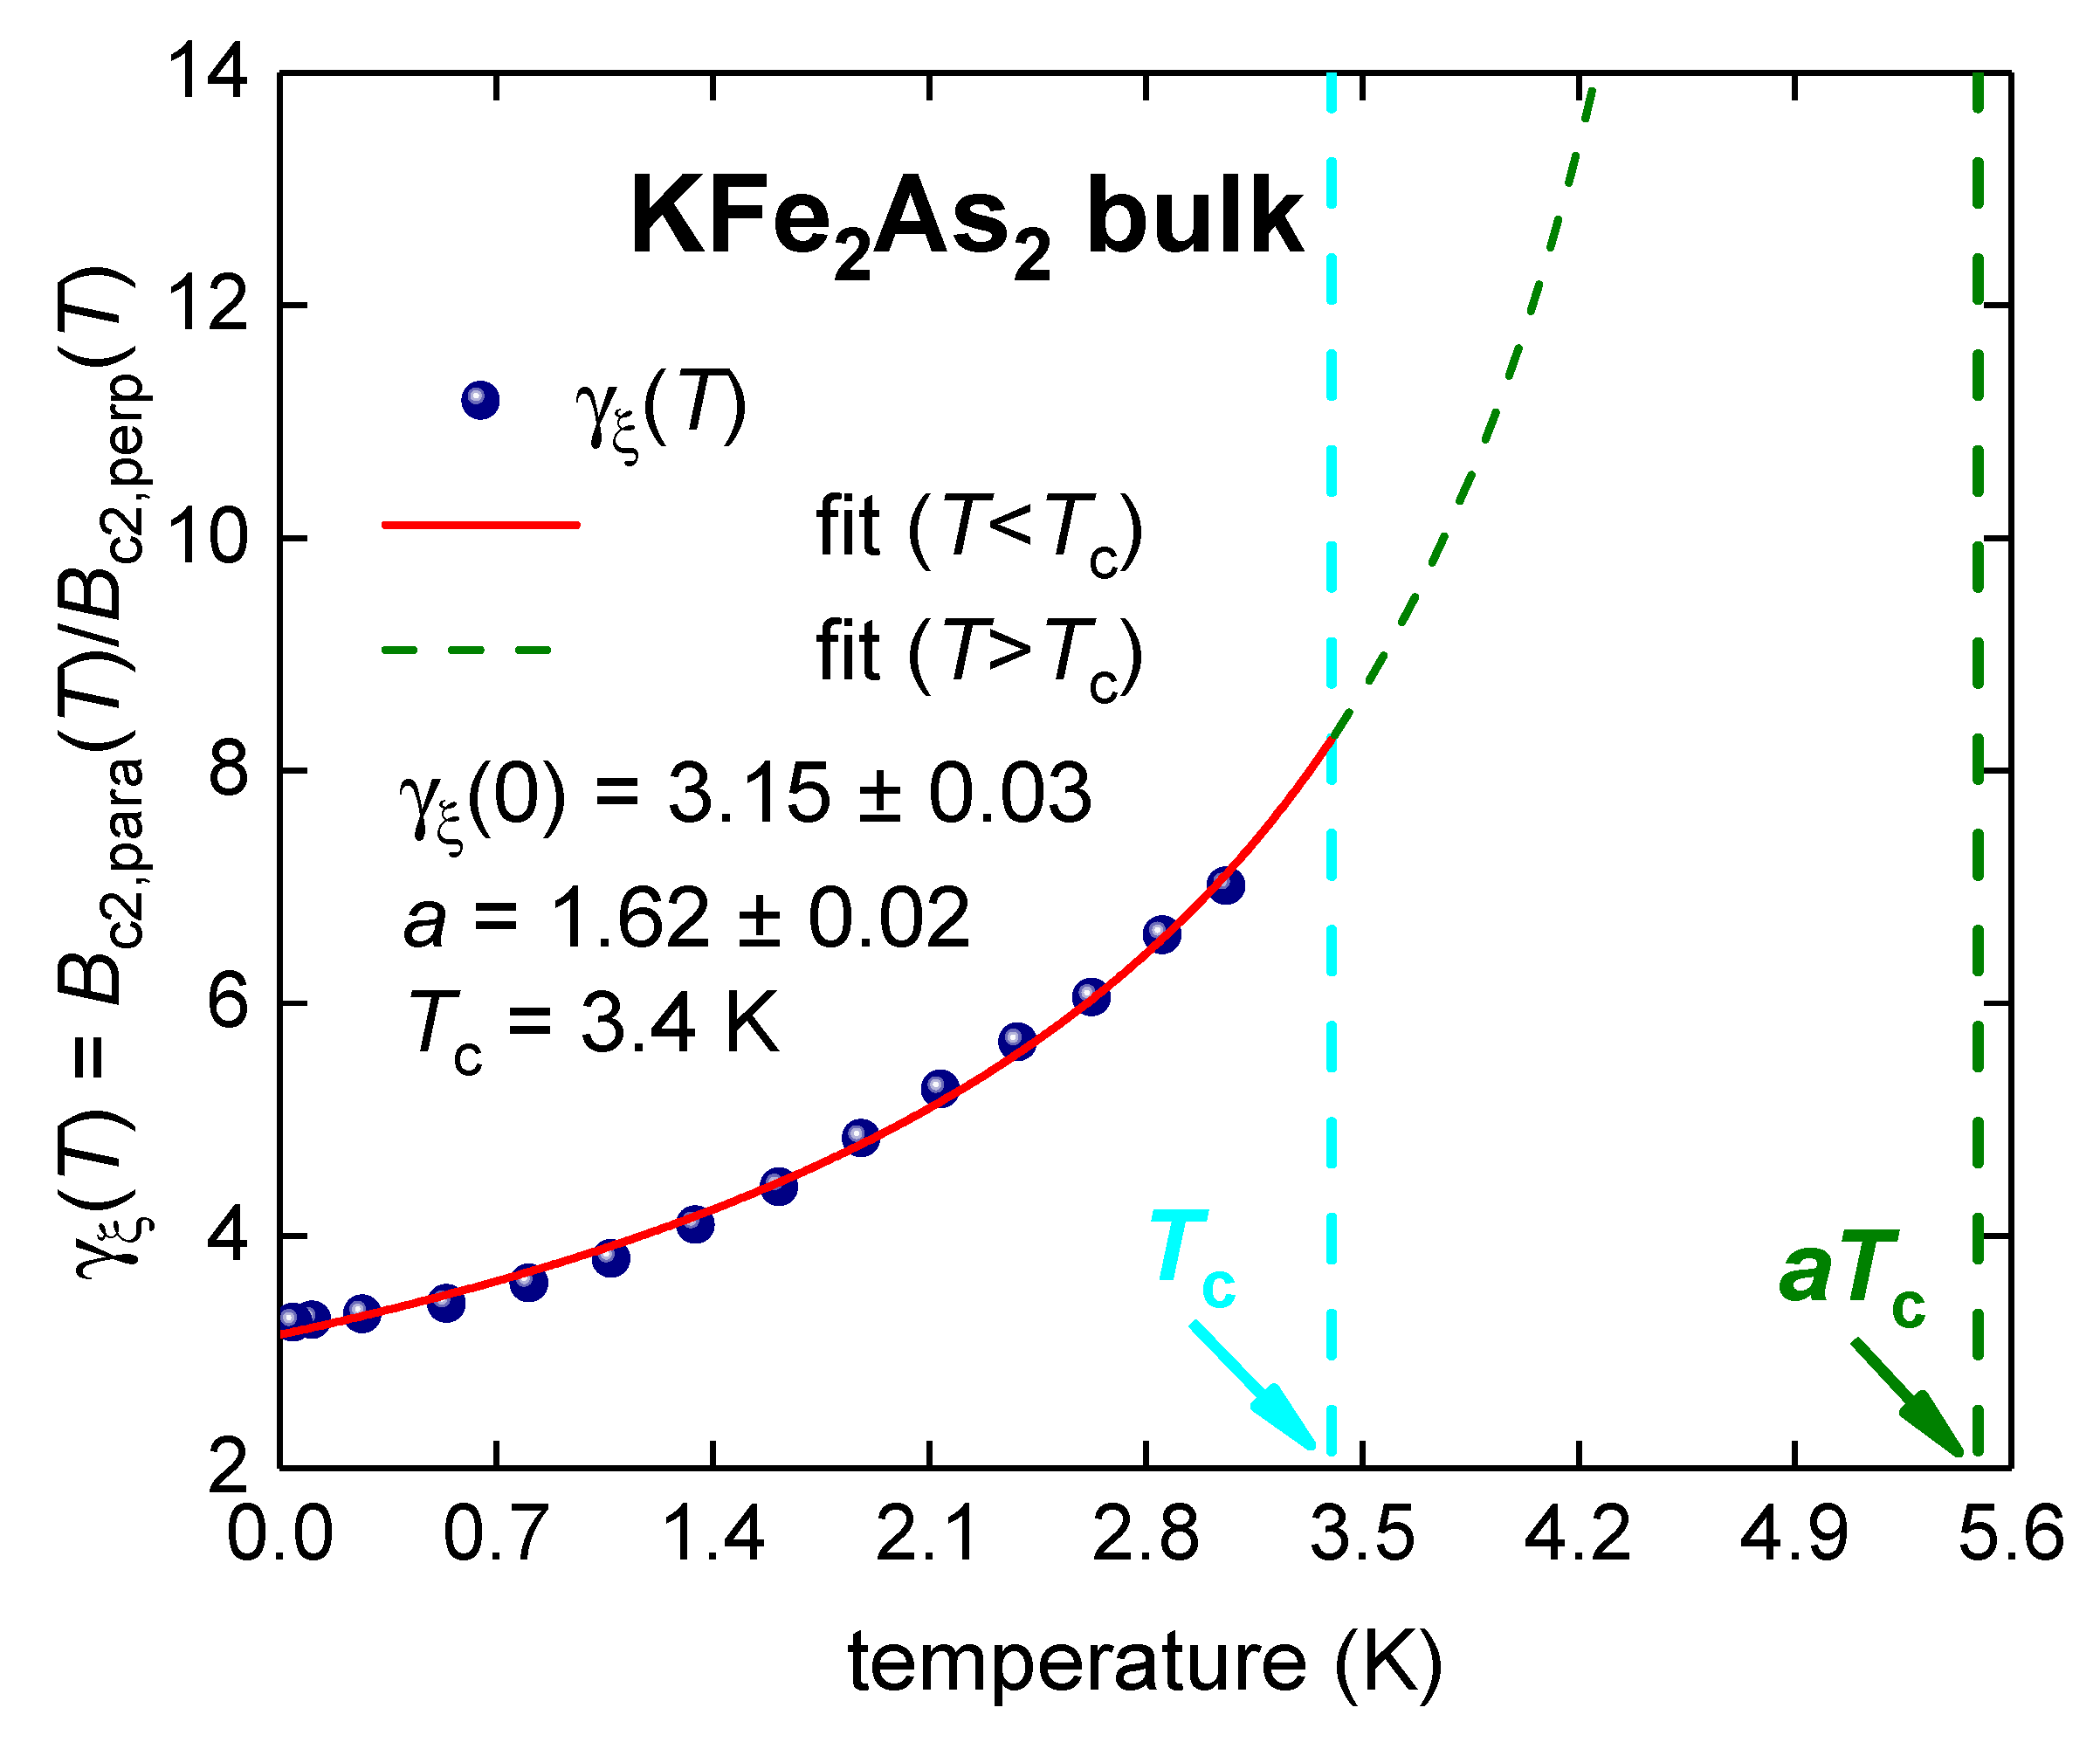
3.8. Bulk KFe2As2
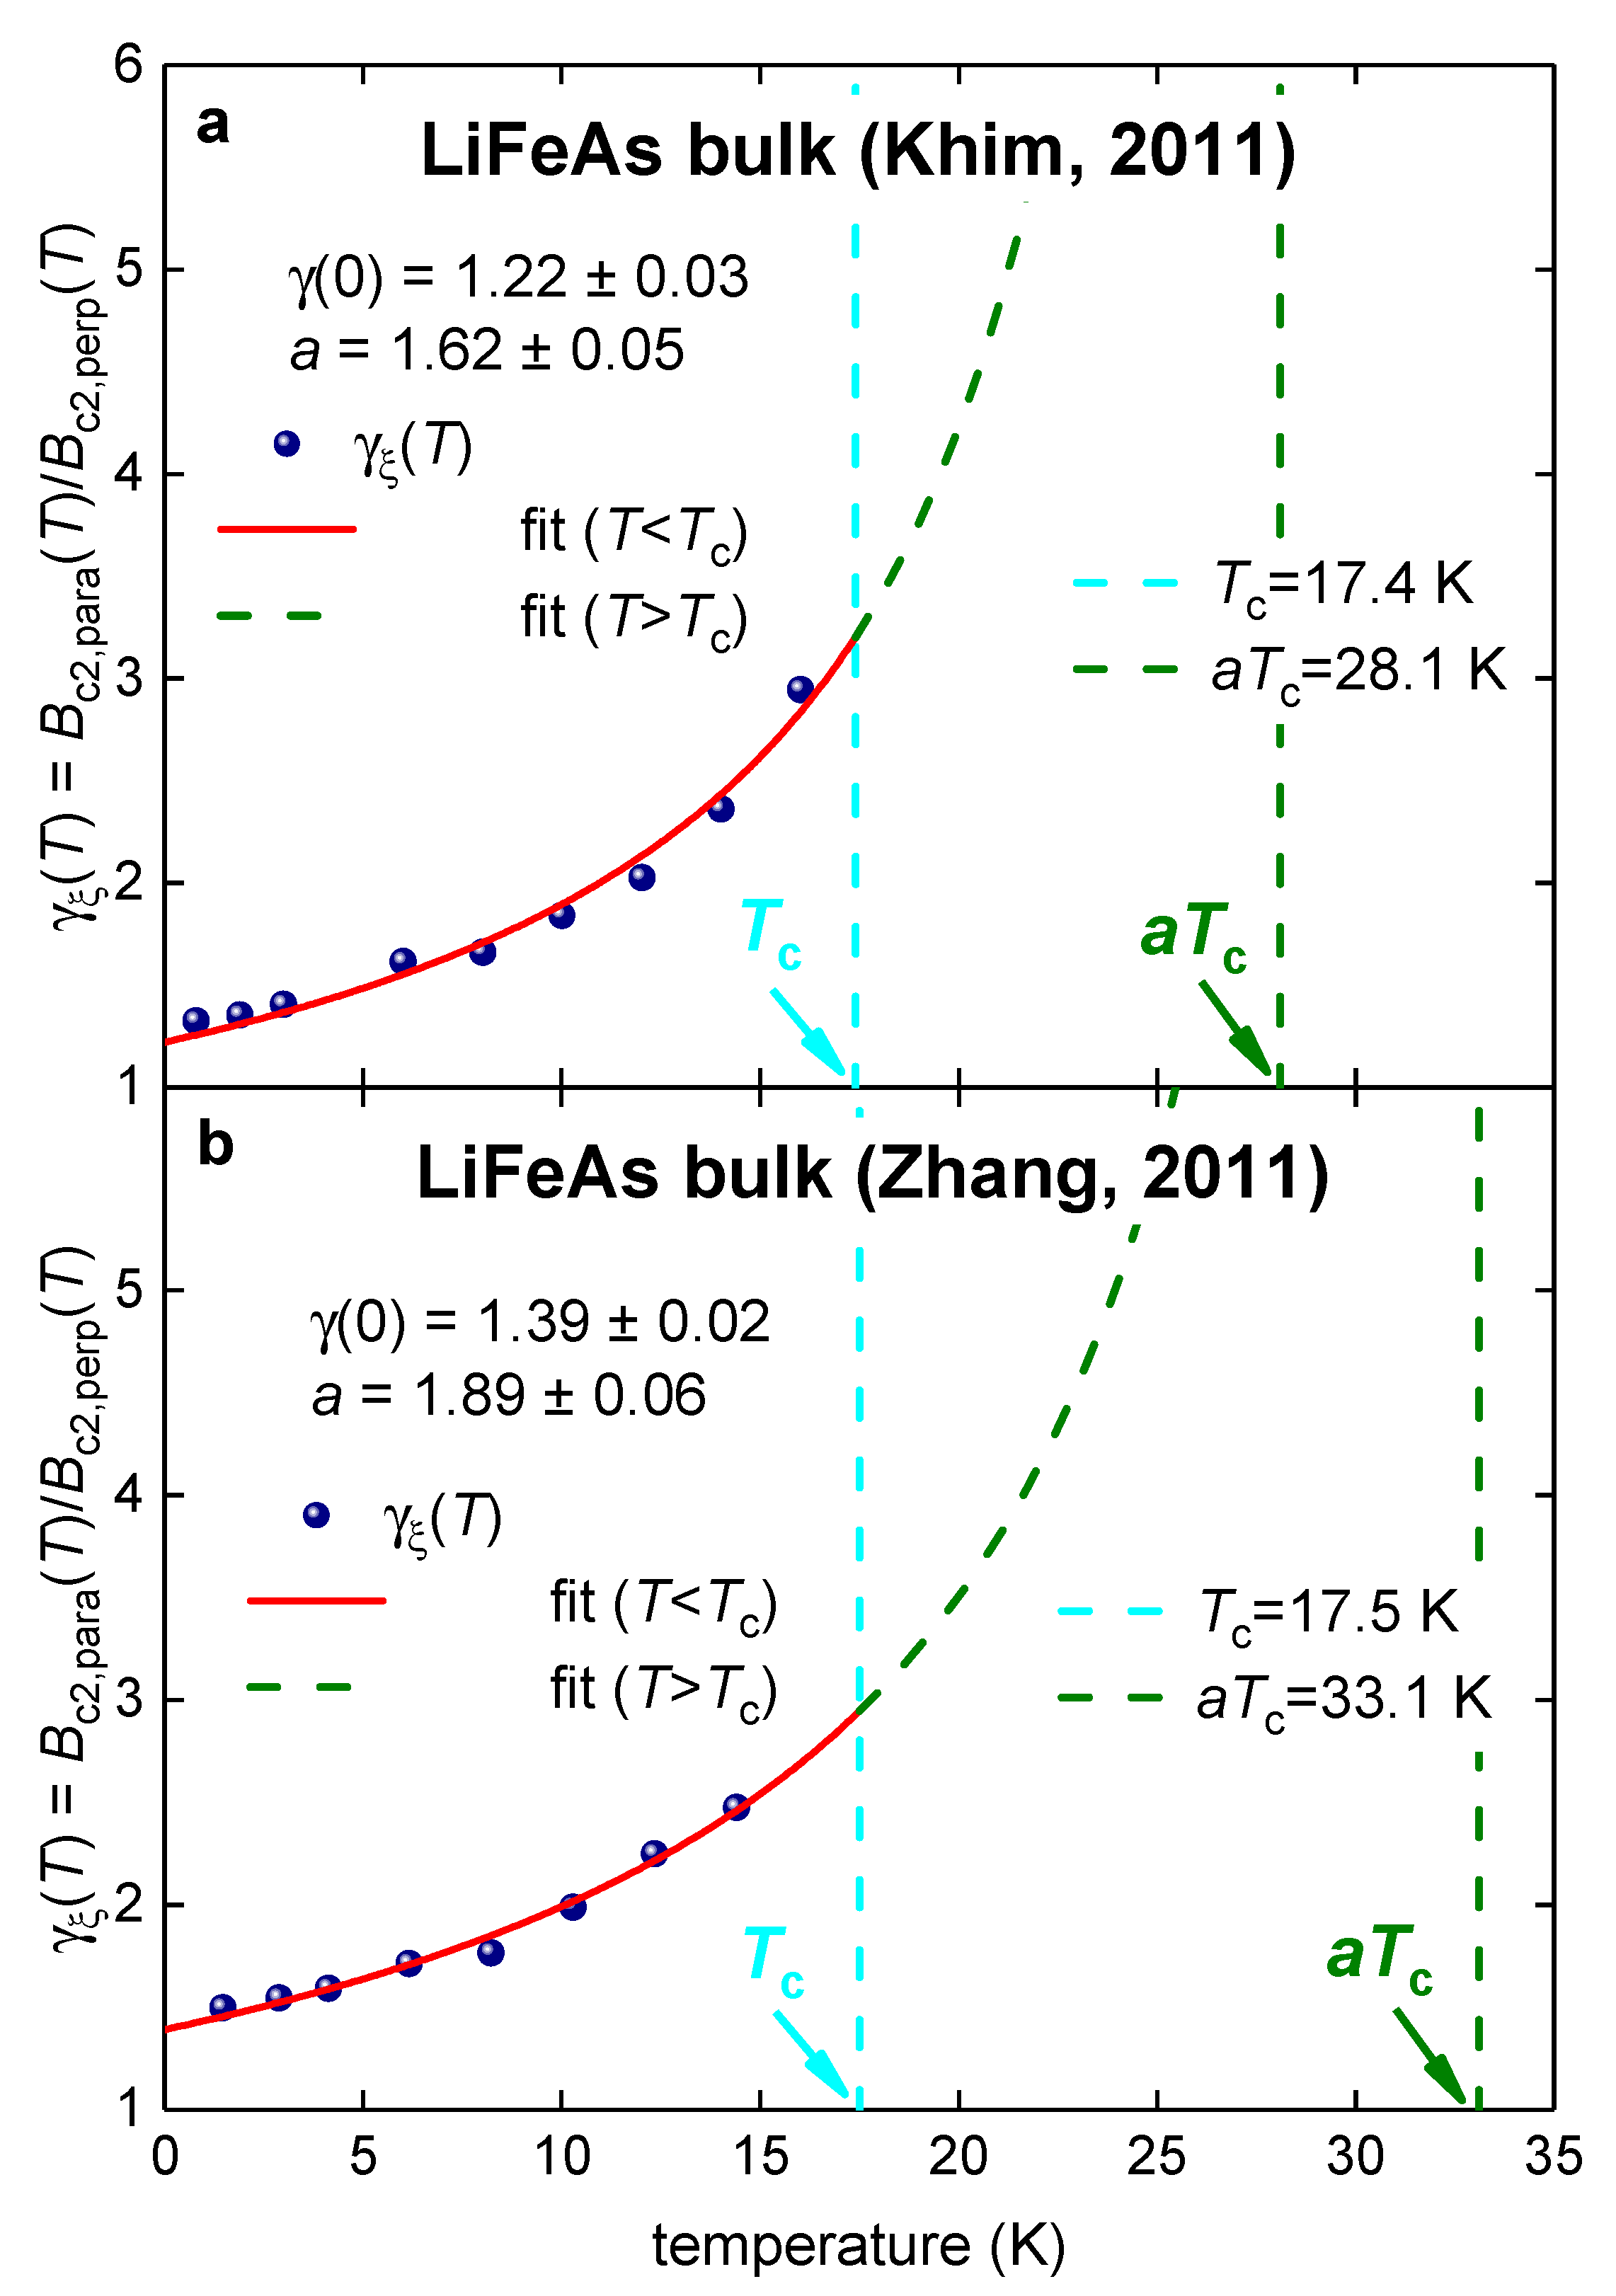
3.9. Bulk LiFeAs
4. Discussion
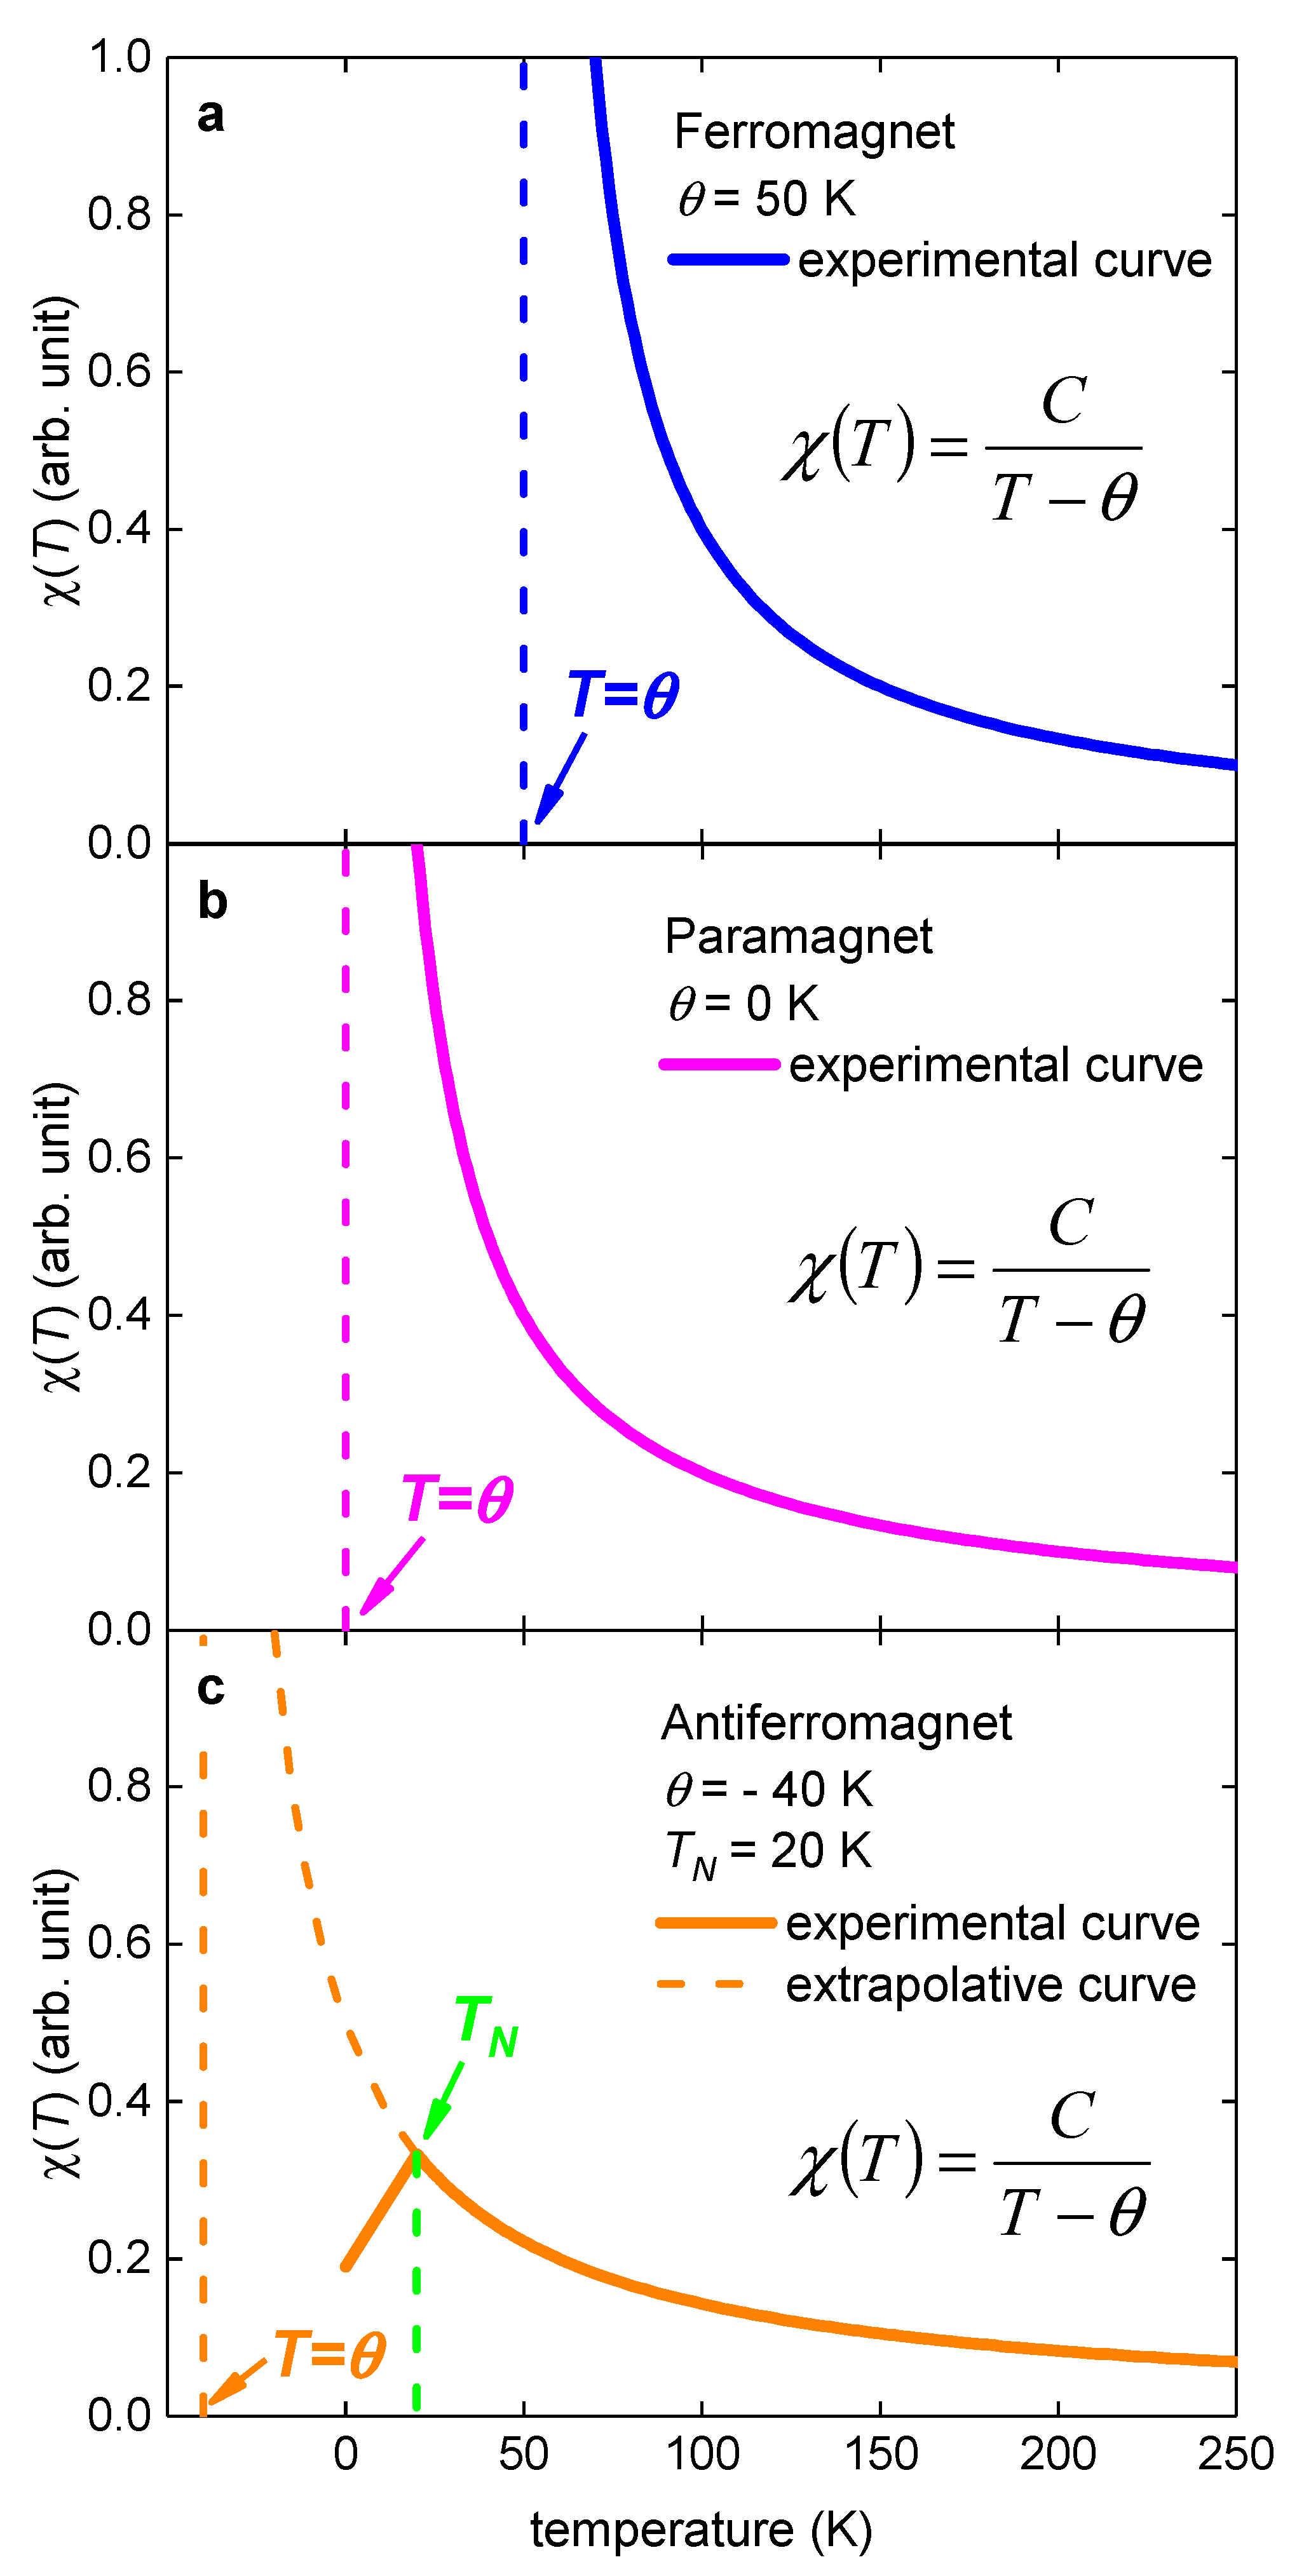
- for ferromagnetic materials;
- for paramagnetic materials;
- for antiferromagnetic materials.
4. Conclusion
Funding
Data Availability Statement
Conflicts of Interest
References
- D. Li, K. Lee, B. Y. Wang, M. Osada, S. Crossley, H. R. Lee, Y. Cui, Y. Hikita, and H. Y. Hwang. Superconductivity in an infinite-layer nickelate. Nature 2019, 572, 624–627. [Google Scholar]
- V. I. Anisimov, D. Bukhvalov, and T. M. Rice. Electronic structure of possible nickelate analogs to the cuprates. Phys. Rev. B 1999, 59, 7901. [Google Scholar] [CrossRef]
- Y. Nomura, M. Hirayama, T. Tadano, Y. Yoshimoto, K. Nakamura, and R. Arita. Formation of a two-dimensional single component correlated electron system and band engineering in the nickelate superconductor NdNiO2. Phys. Rev. B 2019, 100, 205138. [Google Scholar] [CrossRef]
- S. Zeng, C. S. Tang, X. Yin, C. Li, M. Li, Z. Huang, J. Hu, W. Liu, G. J. Omar, H. Jani, Z. S. Lim, K. Han, D. Wan, P. Yang, S. J. Pennycook, A. T. S. Wee, and A. Ariando. Phase diagram and superconducting dome of infinite layer Nd1-xSrxNiO2 thin films. Phys. Rev. Lett. 2020, 125, 147003. [Google Scholar]
- M. Osada, B. Y. Wang, B. H. Goodge, K. Lee, H. Yoon, K. Sakuma, D. Li, M. Miura, L. F. Kourkoutis, and H. Y. Hwang. A superconducting praseodymium nickelate with infinite layer structure. Nano Letters 2020, 20, 5735. [Google Scholar]
- Q. Gu, Y. Li, S. Wan, H. Li, W. Guo, H. Yang, Q. Li, X. Zhu, X. Pan, Y. Nie, and H.-H. Wen. Single particle tunnelling spectrum of superconducting Nd1-xSrxNiO2 thin films. Nature Communications 2020, 11, 6027. [Google Scholar] [CrossRef]
- E. F. Talantsev. Classifying superconductivity in an infinite-layer nickelate Nd0.8Sr0.2NiO2. Results in Physics 2020, 17, 103118. [Google Scholar] [CrossRef]
- Y. Wang, C.-J. Kang, H. Miao, and G. Kotliar. Hund's metal physics: From SrNiO2 to LaNiO2. Phys. Rev. B 2020, 102, 161118. [Google Scholar] [CrossRef]
- D. Li, B. Y. Wang, K. Lee, S. P. Harvey, M. Osada, B. H. Goodge, L. F. Kourkoutis, and H. Y. Hwang. Superconducting dome in Nd1-xSrxNiO2 infinite layer films. Phys. Rev. Lett. 2020, 125, 027001. [Google Scholar]
- M. Jiang, M. Berciu, and G. A. Sawatzky. Critical nature of the Ni spin state in doped NdNiO2. Phys. Rev. Lett. 2020, 124, 207004. [Google Scholar] [CrossRef]
- F. Lechermann. Late transition metal oxides with infinite-layer structure: Nickelates versus cuprates. Phys. Rev. B 2020, 101, 081110. [Google Scholar] [CrossRef]
- X. Wu, D. D. Sante, T. Schwemmer, W. Hanke, H. Y. Hwang, S. Raghu, and R. Thomale. Robust dx2-y2-wave superconductivity of infinite-layer nickelates. Phys. Rev. B 2020, 101, 060504. [Google Scholar] [CrossRef]
- A. S. Botana and M. R. Norman. Similarities and differences between LaNiO2 and CaCuO2 and implications for superconductivity. Phys. Rev. X 2020, 10, 011024. [Google Scholar]
- H. Sakakibara, H. Usui, K. Suzuki, T. Kotani, H. Aoki, and K. Kuroki. Model construction and a possibility of cupratelike pairing in a new d9 nickelate superconductor (Nd,Sr)NiO2. Phys. Rev. Lett. 2020, 125, 077003. [Google Scholar] [CrossRef]
- M. Kitatani, L. Si, O. Janson, R. Arita, Z. Zhong, and K. Held. Nickelate superconductors - a renaissance of the one-band Hubbard model. npj Quantum Materials 2020, 5, 59. [Google Scholar] [CrossRef]
- P. Adhikary, S. Bandyopadhyay, T. Das, I. Dasgupta, and T. Saha-Dasgupta. Orbital-selective superconductivity in a two-band model of infinite-layer nickelates. Phys. Rev. B 2020, 102, 100501. [Google Scholar] [CrossRef]
- Z. Wang, G.-M. Zhang, Y.-f. Yang, and F.-C. Zhang. Distinct pairing symmetries of superconductivity in infinite-layer nickelates. Phys. Rev. B 2020, 102, 220501. [Google Scholar] [CrossRef]
- P. Werner and S. Hoshino. Nickelate superconductors: Multiorbital nature and spin freezing. Phys. Rev. B 2020, 101, 041104. [Google Scholar] [CrossRef]
- Y. -H. Zhang and A. Vishwanath. Type-II t - J model in superconducting nickelate Nd1-xSrxNiO2. Phys. Rev. Research 2020, 2, 023112. [Google Scholar] [CrossRef]
- F. Lechermann. Multiorbital processes rule the Nd1-xSrxNiO2 normal state. Phys. Rev. X 2020, 10, 041002. [Google Scholar]
- Leonov, S. L. Skornyakov, and S. Y. Savrasov. Lifshitz transition and frustration of magnetic moments in infinite-layer NdNiO2 upon hole doping. Phys. Rev. B 2020, 101, 241108. [Google Scholar] [CrossRef]
- Y. Xiang, Q. Li, Y. Li, H. Yang, Y. Nie, and H.-H. Wen. Physical properties revealed by transport measurements for superconducting Nd0.8Sr0.2NiO2 thin films. Chinese Physics Letters 2021, 38, 047401. [Google Scholar] [CrossRef]
- B. Y. Wang, D. Li, B. H. Goodge, K. Lee, M. Osada, S. P. Harvey, L. F. Kourkoutis, M. R. Beasley, and H. Y. Hwang. Isotropic Pauli-limited superconductivity in the infinite layer nickelate Nd0.775Sr0.225NiO2. Nature Physics 2021, 17, 473–477. [Google Scholar] [CrossRef]
- B. H. Goodge, D. Li, K. Lee, M. Osada, B. Y. Wang, G. A. Sawatzky, H. Y. Hwang, and L. F. Kourkoutis. Doping evolution of the Mott-Hubbard landscape in infinite-layer nickelates. Proceedings of the National Academy of Sciences 2021, 118, e2007683118. [Google Scholar] [CrossRef]
- A. S. Botana, F. Bernardini, and A. Cano. Nickelate superconductors: An ongoing dialog between theory and experiments. Journal of Experimental and Theoretical Physics 2021, 132, 618–627. [Google Scholar] [CrossRef]
- F. Lechermann. Doping-dependent character and possible magnetic ordering of NdNiO2. Phys. Rev. Materials 2021, 5, 044803. [Google Scholar] [CrossRef]
- X. Wan, V. Ivanov, G. Resta, I. Leonov, and S. Y. Savrasov. Exchange interactions and sensitivity of the Ni two-hole spin state to Hund's coupling in doped NdNiO2. Phys. Rev. B 2021, 103, 075123. [Google Scholar] [CrossRef]
- C. -J. Kang and G. Kotliar. Optical properties of the infinite-layer La1-xSrxNiO2 and hidden Hund's physics. Phys. Rev. Lett. 2021, 126, 127401. [Google Scholar] [CrossRef] [PubMed]
- H. Lu, M. Rossi, A. Nag, M. Osada, D. F. Li, K. Lee, B. Y. Wang, M. Garcia-Fernandez, S. Agrestini, Z. X. Shen, E. M. Been, B. Moritz, T. P. Devereaux, J. Zaanen, H. Y. Hwang, Ke-Jin Zhou, and W. S. Lee. Magnetic excitations in infinite-layer nickelates. Science 2021, 373, 213–216. [Google Scholar]
- Q. Lin, P. Villar Arribi, G. Fabbris, A. S. Botana, D. Meyers, H. Miao, Y. Shen, D. G. Mazzone, J. Feng, S. G. Chiuzb_aian, A. Nag, A. C. Walters, M. Garcia-Fernandez, K.-J. Zhou, J. Pelliciari, I. Jarrige, J. W. Freeland, J. Zhang, J. F. Mitchell, V. Bisogni, X. Liu, M. R. Norman, and M. P. M. Dean. Strong super-exchange in a d9- nickelate revealed by resonant inelastic x-ray scattering. Phys. Rev. Lett. 2021, 126, 087001. [Google Scholar]
- Leonov. Effect of lattice strain on the electronic structure and magnetic correlations in infinite-layer (Nd,Sr)NiO2. Journal of Alloys and Compounds 2021, 883, 160888. [Google Scholar] [CrossRef]
- P. Choubey and I. M. Eremin. Electronic theory for scanning tunneling microscopy spectra in infinite layer nickelate superconductors. Phys. Rev. B 2021, 104, 144504. [Google Scholar] [CrossRef]
- X. -R. Zhou, Z.-X. Feng, P.-X. Qin, H. Yan, X.-N. Wang, P. Nie, H.-J. Wu, X. Zhang, H.-Y. Chen, Z.-A. Meng, Z.-W. Zhu, Z.-Q. Liu. Negligible oxygen vacancies, low critical current density, electric-field modulation, in-plane anisotropic and high-field transport of a superconducting Nd0.8Sr0.2NiO2/SrTiO3 heterostructure. Rare Met. 2021, 40, 2847–2854. [Google Scholar]
- E. Chow, S. K. 34. E. Chow, S. K. Sudheesh, P. Nandi, S. W. Zeng, Z. T. Zhang, X. M. Du, Z. S. Lim, Elbert E. M. Chia, and A. Ariando. Pairing symmetry in infinite-layer nickelate superconductor. arXiv, arXiv:2201.10038.
- S. P. Harvey, B. Y. 35. S. P. Harvey, B. Y. Wang, J. Fowlie, M. Osada, K. Lee, Y. Lee, D. Li, and H. Y. Hwang. Evidence for nodal superconductivity in infinite-layer nickelates. arXiv, arXiv:2201.12971.
- E. Chow, K. Y. 36. E. Chow, K. Y. Yip, M. Pierre, S. W. Zeng, Z. T. Zhang, T. Heil, J. Deuschle, P. Nandi, S. K. Sudheesh, Z. S. Lim, Z. Y. Luo, M. Nardone, A. Zitouni, P. A. van Aken, M. Goiran, S. K. Goh, W. Escoffier, and A. Ariando, Pauli-limit violation in lanthanide infinite-layer nickelate superconductors. arXiv, arXiv:2204.12606.
- Fowlie, M. Hadjimichael, M. M. Martins, D. Li, M. Osada, B. Y. Wang, K. Lee, Y. Lee, Z. Salman, T. Prokscha, J.-M. Triscone, H. Y. Hwang, and A. Suter. Intrinsic magnetism in superconducting infinite-layer nickelates. Nature Physics 2022, 18, 1043–1047. [Google Scholar] [CrossRef]
- H. Chen, A. Hampel, J. Karp, F. Lechermann, and A. Millis. Dynamical mean field studies of infinite layer nickelates: Physics results and methodological implications. Front. Phys. 2022, 10, 835942. [Google Scholar] [CrossRef]
- C. Lu, L.-H. Hu, Y. Wang, F. Yang, and C. Wu. Two-orbital model for possible superconductivity pairing mechanism in nickelates. Phys. Rev. B 2022, 105, 054516. [Google Scholar] [CrossRef]
- T. Y. Xie, Z. Liu, Chao Cao, Z. F.Wang, J. L. Yang, and W. Zhu. Microscopic theory of superconducting phase diagram in infinite-layer nickelates. Phys. Rev. B 2022, 106, 035111. [Google Scholar] [CrossRef]
- 41. Jiang. Characterizing the superconducting instability in a two-orbital d-s model: insights to infinite-layer nickelate superconductors. arXiv, arXiv:2201.12967.
- Karp, A. Hampel, and A. J. Millis. Superconductivity and antiferromagnetism in NdNiO2 and CaCuO2: A cluster DMFT study. Phys. Rev. B 2022, 105, 205131. [Google Scholar] [CrossRef]
- A. Kreisel, B. M. 43. A. Kreisel, B. M. Andersen, A. T. Roemer, I. M. Eremin, and F. Lechermann. Superconducting instabilities in strongly-correlated infinite-layer nickelates. arXiv, arXiv:2202.11135.
- G. Krieger, L. Martinelli, S. Zeng, L. E. Chow, K. Kummer, R. Arpaia, M. Moretti Sala, N. B. Brookes, A. Ariando, N. Viart, M. Salluzzo, G. Ghiringhelli, and D. Preziosi. Charge and spin order dichotomy in NdNiO2 driven by the SrTiO3 capping layer. Phys. Rev. Lett. 2022, 129, 027002. [Google Scholar]
- S. W. Zeng, X. M. Yin, C. J. Li, L. E. Chow, C. S. Tang, K. Han, Z. Huang, Y. Cao, D. Y. Wan, Z. T. Zhang, Z. S. Lim, C. Z. Diao, P. Yang, A. T. S. Wee, S. J. Pennycook, and A. Ariando. Observation of perfect diamagnetism and interfacial effect on the electronic structures in infinite layer Nd0.8Sr0.2NiO2 superconductors. Nature Communications 2022, 13, 743. [Google Scholar]
- C. C. Tam, J. Choi, X. Ding, S. Agrestini, A. Nag, M. Wu, B. Huang, H. Luo, P. Gao, M. García-Fernández, L. Qiao, and K.-J. Zhou. Charge density waves in infinite-layer NdNiO2 nickelates. Nature Materials 2022, 21, 1116–1120. [Google Scholar]
- Rossi, M. Osada, J. Choi, S. Agrestini, D. Jost, Y. Lee, H. Lu, B. Y. Wang, K. Lee, A. Nag, Y.-D. Chuang, C.-T. Kuo, S.-J. Lee, B. Moritz, T. P. Devereaux, Z.-X. Shen, J.-S. Lee, K.-J. Zhou, H. Y. Hwang, W.-S. Lee. A broken translational symmetry state in an infinite-layer nickelate. Nature Physics 2022, 18, 869–873. [Google Scholar]
- G. A. Pan, D. F. Segedin, H. LaBollita, Q. Song, E. M. Nica, B. H. Goodge, A. T. Pierce, S. Doyle, S. Novakov, D. C. Carrizales, A. T. N'Diaye, P. Shafer, H. Paik, J. T. Heron, J. A. Mason, A. Yacoby, L. F. Kourkoutis, O. Erten, C. M. Brooks, A. S. Botana, and J. A. Mundy. Superconductivity in a quintuple-layer square-planar nickelate. Nature Materials 2022, 21, 160–164. [Google Scholar]
- N. Wang, M. W. Yang, Z. Yang, K. Y. Chen, H. Zhang, Q. H. Zhang, Z. H. Zhu, Y. Uwatoko, L. Gu, X. L. Dong, J. P. Sun, K. J. Jin, and J.-G. Cheng. Pressure-induced monotonic enhancement of Tc to over 30 K in superconducting Pr0.82Sr0.18NiO2 thin films. Nature Communications 2022, 13, 4367. [Google Scholar]
- L. E. Chow, K. L. E. Chow, K. Rubi, K. Y. Yip, M. Pierre, M. Leroux, X. Liu, Z. Luo, S. Zeng, C. Li, M. Goiran, N. Harrison, W. Escoffier, S. K. Goh, A. Ariando. Dimensionality control and rotational symmetry breaking superconductivity in square-planar layered nickelates. arXiv. [CrossRef]
- Q. Li, C. He, J. Si, X. Zhu, Y. Zhang, and H.-H. Wen. Absence of superconductivity in bulk Nd1−xSrxNiO2. Communications Materials 2020, 1, 16. [Google Scholar] [CrossRef]
- Tinkham. Introduction to Superconductivity, 2nd ed. (McGraw Hill, New York, 1996), pp. 141–143.
- H. Matsuoka, M. Nakano, T. Shitaokoshi, T. Ouchi, Y. Wang, Y. Kashiwabara, S. Yoshida, K. Ishizaka, M. Kawasaki, Y. Kohama, T. Nojima, and Y. Iwasa. Angle dependence of Hc2 with a crossover between the orbital and paramagnetic limits. Physical Review Research 2020, 2, 012064. [Google Scholar]
- Y. Cao, J. M. Park, K. Watanabe, T. Taniguchi, P. Jarillo-Herrero. Pauli-limit violation and re-entrant superconductivity in moiré graphene. Nature 2021, 595, 526–531. [Google Scholar] [CrossRef]
- Y. Saito, T. Nojima, Y. Iwasa. Highly crystalline 2D superconductors. Nat. Rev. Mater. 2017, 2, 16094. [Google Scholar]
- V. Buntar, F. M. Sauerzopf, H. W. Weber, J. E. Fischer, H. Kuzmany, and M. Halushka. Mixed-state parameters and vortex pinning in single-crystalline K3C60 fullerene superconductors. Phys. Rev. B 1997, 56, 14128–14137. [Google Scholar] [CrossRef]
- G. K. Perkins, J. Moore, Y. Bugoslavsky, L. F. Cohen, J. Jun, S. M. Kazakov, J. Karpinski and A. D. Caplin. Superconducting critical fields and anisotropy of a MgB2 single crystal. Supercond. Sci. Technol. 2002, 15, 1156–1159. [Google Scholar] [CrossRef]
- Zehetmayer, M. Eisterer, J. Jun, S. M. Kazakov, J. Karpinski, A. Wisniewski, and H. W. Weber. Mixed-state properties of superconducting MgB2 single crystals. Phys. Rev. B 2002, 66, 052505. [Google Scholar] [CrossRef]
- F. Honda, S. 59. F. Honda, S. Kobayashi, N. Kawamura, S. Kawaguchi, T. Koizumi, Y. J. Sato, Y. Homma, N. Ishimatsu, J. Gouchi, Y. Uwatoko, H. Harima, J. Flouquet, and D. Aoki. Pressure-induced structural transition and new superconducting phase in UTe2. arXiv, arXiv:2211.02361.
- S. Kasahara, H. Suzuki, T. Machida, Y. Sato, Y. Ukai, H. Murayama, S. Suetsugu, Y. Kasahara, T. Shibauchi, T. Hanaguri, and Y. Matsuda. Quasiparticle nodal plane in the Fulde-Ferrell-Larkin-Ovchinnikov state of FeSe. Phys. Rev. Lett. 2021, 127, 257001. [Google Scholar]
- C. C. Zhao, L. S. C. C. Zhao, L. S. Wang, W. Xia, Q. W. Yin, J. M. Ni, Y. Y. Huang, C. P. Tu, Z. C. Tao, Z. J. Tu, C. S. Gong, H. C. Lei, Y. F. Guo, X. F. Yang, and S. Y. Li. Nodal superconductivity and superconducting domes in the topological Kagome metal CsV3Sb5. arXiv:2102. 0835. [Google Scholar] [CrossRef]
- T. Tayama, A. Harita, T. Sakakibara, Y. Haga, H. Shishido, R. Settai, and Y. Onuki. Unconventional heavy-fermion superconductor CeCoIn5: dc magnetization study at temperatures down to 50 mK. Physical Review B 2002, 65, 180504. [Google Scholar] [CrossRef]
- D. Y. Yan, M. Yang, C. X. Wang, P. B. Song, C. J. Yi, Y. G. Shi. Superconductivity in centrosymmetric topological superconductor candidate TaC. Superconductor Science and Technology 2021, 34, 035025. [Google Scholar] [CrossRef]
- D. Yan, et al. Superconductivity and Fermi-surface nesting in the candidate Dirac semimetal NbC. Physical Review B 2020, 102, 205117. [Google Scholar] [CrossRef]
- Y. Li, et al. Critical magnetic fields of superconducting aluminum-substituted Ba8Si42Al4 clathrate. Journal of Applied Physics 2015, 117, 213912. [Google Scholar] [CrossRef]
- F. Buta, M. Bonura, D. Matera, G. Bovone, A. Ballarino, S. C. Hopkins, B. Bordini, X. Chaud, and C. Senatore. Very high upper critical fields and enhanced critical current densities in Nb3Sn superconductors based on Nb–Ta–Zr alloys and internal oxidation. Journal of Physics: Materials 2021, 4, 025003. [Google Scholar]
- Y. Skourski, G. Fuchs, P. Kerschl, N. Kozlov, D. Eckert, K. Nenkov, K.-H. Mueller. Magnetization and magneto-resistance measurements of bulk YBa2Cu3O7-x in pulsed magnetic fields up to 50 T. Physica B 2004, 346–347, 325–328. [Google Scholar]
- C. L. Zhang, X. He, Z. W. Li, S. J. Zhang, B. S. Min, J. Zhang, K. Lu, J. F. Zhao, L. C. Shi, Y. Peng, X. C. Wang, S. M. Feng, R. C. Yu, L. H. Wang, V. B. Prakapenka, S. Chariton, H. Z. Liu, C. Q. Jin. Superconductivity above 80 K in polyhydrides of hafnium. Materials Today Physics 2022, 27, 100826. [Google Scholar]
- S. I. Vedeneev, B. A. Piot, D. K. Maude, A. V. Sadakov. Temperature dependence of the upper critical field of FeSe single crystals. Phys. Rev. B 2013, 87, 134512. [Google Scholar] [CrossRef]
- W. Wei, W. 70. W. Wei, W. Sun, Y. Sun, Y. Pan, G. Jin, F. Yang, Y. Li, Z. Zhu, Y. Nie, Z. Shi. Large upper critical fields and dimensionality crossover of superconductivity in infinite-layer nickelate La0.8Sr0.2NiO2. arXiv, arXiv:2304.14196.
- H. Zhang, W. Zhong, Y. Meng, B. Yue, X. Yu, J.-T. Wang, and F. Hong. Superconductivity above 12 K with possible multiband features in CsCl-type PbS. Phys. Rev. B 2023, 107, 174502. [Google Scholar] [CrossRef]
- R. Gupta, D. Das, C. H. Mielke, III, Z. Guguchia, T. Shiroka, C. Baines, M. Bartkowiak, H. Luetkens, R. Khasanov, Q. Yin, Z. Tu, C. Gong, and He. Lei. Microscopic evidence for anisotropic multigap superconductivity in the CsV3Sb5 kagome superconductor. npj Quantum Materials 2022, 7, 49. [Google Scholar]
- B. -B. Ruan, L.-W. Chen, Y.-Q. Shi, J.-K. Yi, Q.-S. Yang, M.-H. Zhou, M.-W. Ma, G.-F. Chen, and Z.-A. Ren. Superconductivity in Mo4Ga20As with endohedral gallium clusters. arXiv 2023, arXiv:2305.02838. [Google Scholar]
- T. Shang, J. 74. T. Shang, J. Meng, X. Y. Zhu, H. Zhang, B. C. Yu, Z. X. Zhen, Y. H. Wang, Y. Xu, Q. F. Zhan, D. J. Gawryluk, and T. Shiroka. Fully-gapped superconductivity with preserved time-reversal symmetry in NiBi3 single crystals. arXiv, arXiv:2305.03278.
- Y. Xing, et al. Quantum Griffiths singularity of superconductor-metal transition in Ga thin films. Science 2015, 350, 542–545. [Google Scholar] [CrossRef]
- S. C. de la Barrera, et al. Tuning Ising superconductivity with layer and spin–orbit coupling in two-dimensional transition-metal dichalcogenides. Nat Commun 2018, 9, 1427. [Google Scholar] [CrossRef]
- Y. Liu, et al. Anomalous quantum Griffiths singularity in ultrathin crystalline lead films. Nature Communications 2019, 10, 3633. [Google Scholar] [CrossRef]
- J. M. Park, Y. Cao, L.-Q. Xia, S. Sun, K. Watanabe, T. Taniguchi, and P. Jarillo-Herrero. Robust superconductivity in magic-angle multilayer graphene family. Nature Materials 2022, 21, 877–883. [Google Scholar] [CrossRef]
- L. N. Bulaevskii, V. L. Ginzburg, A. A. Sobyanin. Macroscopic theory of superconductors with small coherence length. Physica C 1988, 152, 378–388. [Google Scholar] [CrossRef]
- V. J. Emery, S. A. Kivelson. Importance of phase fluctuations in superconductors with small superfluid density. Nature 1995, 374, 434–437. [Google Scholar] [CrossRef]
- A. Larkin, V. A. Larkin, V. Varlamov. Theory of Fluctuations in Superconductors (Oxford University Press, Oxford, 2005).
- T. He, Q. Huang, A. P. Ramirez, Y. Wang, K. A. Regan, N. Rogado, M. A. Hayward, M. K. Haas, J. S. Slusky, K. Inumara, H. W. Zandbergen, N. P. Ong, and R. J. Cava. Superconductivity in the non-oxide perovskite MgCNi3. Nature 2001, 411, 54–56. [Google Scholar]
- J. Chen, L. Jiao, J. L. Zhang, Y. Chen, L. Yang, M. Nicklas, F. Steglich, and H. Q. Yuan. BCS-like superconductivity in the noncentrosymmetric compounds NbxRe1-x (0.13 < x < 0.38). Phys. Rev. B 2013, 88, 144510. [Google Scholar]
- J. Pan, W. H. Jiao, X. C. Hong, Z. Zhang, L. P. He, P. L. Cai, J. Zhang, G. H. Cao, and S. Y. Li. Nodal superconductivity and superconducting dome in the layered superconductor Ta4Pd3Te16. Phys. Rev. B 2015, 92, 180505. [Google Scholar] [CrossRef]
- D. Adroja, A. Bhattacharyya, P. K. Biswas, M. Smidman, A. D. Hillier, H. Mao, H. Luo, G.-H. Cao, Z. Wang, and C. Wang. Multigap superconductivity in ThAsFeN investigated using μSR measurements. Phys. Rev. B 2017, 96, 144502. [Google Scholar] [CrossRef]
- Zhou, Y. Sun, C. Y. Xi, Z. S. Wang, J. L. Zhang, Y. Zhang, Y. F. Zhang, C. Q. Xu, Y. Q. Pan, J. J. Feng, Y. Meng, X. L. Yi, L. Pi, T. Tamegai, X. Xing and Z. Shi. Disorder-robust high-field superconducting phase of FeSe single crystals. Phys. Rev. B 2021, 104, L140504. [Google Scholar] [CrossRef]
- M. Mandal, C. Patra, A. Kataria, D. Singh, P. K. Biswas, J. S. Lord, A. D. Hillier, and R. P. Singh. Superconducting ground state of nonsymmorphic superconducting compound Zr2Ir. Phys. Rev. B 2021, 104, 054509. [Google Scholar] [CrossRef]
- Z. Ryżyńska, J. R. Chamorro, T. M. McQueen, P. Wiśniewski, D. Kaczorowski, W. Xie, R. J. Cava, T. Klimczuk, and M. J. Winiarski. RuAl6 - An endohedral aluminide superconductor. Chem. Mater. 2020, 32, 3805–3812. [Google Scholar]
- T. Takenaka, K. Ishihara, M. Roppongi, Y. Miao, Y. Mizukami, T. Makita, J. Tsurumi, S. Watanabe, J. Takeya, M. Yamashita, K. Torizuka, Y. Uwatoko, T. Sasaki, X. Huang, W. Xu, D. Zhu, N. Su, J.-G. Cheng, T. Shibauchi, K. Hashimoto. Strongly correlated superconductivity in a copper-based metal-organic framework with a perfect kagome lattice. Science Advances 2021, 7, eabf3996. [Google Scholar]
- X. Gui and R. J. Cava. LaIr3Ga2: A superconductor based on a Kagome lattice of Ir. Chemistry of Materials 2022, 34, 2824–2832. [Google Scholar] [CrossRef]
- J. Wang, T. J. Wang, T. Ying, J. Deng, C. Pei, T. Yu, X. Chen, Y. Wan, M. Yang, W. Dai, D. Yang, Y. Li, S. Li, S. Iimura, S. Du, H. Hosono, Y. Qi, J.-g. Guo. Superconductivity in an orbital-reoriented SnAs square lattice: A case study of Li0.6Sn2As2 and NaSnAs, Angewandte Chemie (International Edition) accepted; doi.org/10.1002/anie.202216086.
- F. H. Yu, D. H. Ma, W. Z. Zhuo, S. Q. Liu, X. K. Wen, B. Lei, J. J. Ying, and X. H. Chen. Unusual competition of superconductivity and charge-density-wave state in a compressed topological kagome metal. Nature Communications 2021, 12, 3645. [Google Scholar] [CrossRef]
- Y. Sun, Z. Shi, and T. Tamegai. Review of annealing effects and superconductivity in Fe1+yTe1-xSex superconductors. Supercond. Sci. Technol. 2019, 32, 103001. [Google Scholar] [CrossRef]
- J. Yuan, et al. Scaling of the strange-metal scattering in unconventional superconductors. Nature 2022, 602, 431–436. [Google Scholar] [CrossRef] [PubMed]
- Y. Saito, J. Ge, K. Watanabe, T. Taniguchi, and A. F. Young. Independent superconductors and correlated insulators in twisted bilayer graphene. Nature Physics 2020, 16, 926–930. [Google Scholar] [CrossRef]
- E. F. Talantsev, W. P. Crump, J. G. Storey, J. L. Tallon. London penetration depth and thermal fluctuations in the sulphur hydride 203 K superconductor. Annalen der Physik 2017, 529, 1700197. [Google Scholar]
- J. L. Tallon and E. F. Talantsev. Compressed H3S, superfluid density and the quest for room-temperature superconductivity. J. Supercond. Nov. Magn. 2018, 31, 619–624. [Google Scholar] [CrossRef]
- B. Y. Wang, T. C. 98. B. Y. Wang, T. C. Wang, Y.-T. Hsu, M. Osada, K. Lee, C. Jia, C. Duffy, D. Li, J. Fowlie, M. R. Beasley, T. P. Devereaux, I. R. Fisher, N. E. Hussey, H. Y. Hwang. Rare-earth control of the superconducting upper critical field in infinite-layer nickelates. arXiv, arXiv:2205.15355.
- Y. Kamihara, H. Hiramatsu, M. Hirano, R. Kawamura, H. Yanagi, T. Kamiya, and H. Hosono. Iron-based layered superconductor. LaOFeP. J. Am. Chem. Soc 2006, 128, 10012–10013. [Google Scholar] [CrossRef] [PubMed]
- Y. Kamihara, T. Watanabe, M. Hirano, and H. Hosono. Iron-based layered superconductor La[O1-xFx]FeAs (x = 0.05−0.12) with Tc = 26 K. J. Am. Chem. Soc. 2008, 130, 3296–3297. [Google Scholar] [CrossRef]
- L. Jiao, Y. Kohama, J. L. Zhang, H. D. Wang, B. Maiorov, F. F. Balakirev, Y. Chen, L. N. Wang, T. Shang, M. H. Fang, and H. Q. Yuan. Upper critical field and thermally activated flux flow in single-crystalline Tl0.58Rb0.42Fe1.72Se2. Phys. Rev. B 2012, 85, 064513. [Google Scholar] [CrossRef]
- F. Harper, M. Tinkham. The mixed state in superconducting thin films. Phys. Rev. 1968, 172, 441–450. [Google Scholar] [CrossRef]
- X. S. Wu, P. W. Adams, Y. Yang, and R. L. McCarley. Spin proximity effect in ultrathin superconducting Be–Au bilayers. Phys. Rev. Lett. 2006, 96, 127002. [Google Scholar] [CrossRef]
- M. B. Shalom, M. Sachs, D. Rakhmilevitch, A. Palevski, and Y. Dagan. Tuning spin–orbit coupling and superconductivity at the SrTiO3/LaAlO3 interface: a magnetotransport study. Phys. Rev. Lett. 2010, 104, 126802. [Google Scholar] [CrossRef]
- M. Fang, J. Yang, F. F. Balakirev, Y. Kohama, J. Singleton, B. Qian, Z. Q. Mao, Hangdong Wang, and H. Q. Yuan. Weak anisotropy of the superconducting upper critical field in Fe1.11Te0.6Se0.4 single crystals. Phys. Rev. B 2010, 81, 020509. [Google Scholar] [CrossRef]
- Y. Sun, Z. Shi, T. Tamegai. Review of annealing effects and superconductivity in Fe1+yTe1-xSex superconductors. Supercond. Sci. Technol. 2019, 32, 103001. [Google Scholar] [CrossRef]
- J. L. Zhang, L. Jiao, Y. Chen, H. Q. Yuan. Universal behavior of the upper critical field in iron based superconductors. Frontiers of Physics 2011, 6, 463–473. [Google Scholar] [CrossRef]
- D. A. Zocco, K. Grube, F. Eilers, T. Wolf, and H. v. Löhneysen. Pauli-Limited Multiband Superconductivity in KFe2As2. Phys. Rev. Lett. 2013, 111, 057007. [Google Scholar] [CrossRef]
- S. Khim, B. Lee, J. W. Kim, E. S. Choi, G. R. Stewart, and K. H. Kim. Pauli-limiting effects in the upper critical fields of a clean LiFeAs single crystal. Phys. Rev. B 2011, 84, 104502. [Google Scholar] [CrossRef]
- J. L. Zhang, L. Jiao, F. F. Balakirev, X. C. Wang, C. Q. Jin, and H. Q. Yuan. Upper critical field and its anisotropy in LiFeAs. Phys. Rev. B 2011, 83, 174506. [Google Scholar]
- C. Kittel. Introduction to Solid State Physics, Seventh Ed (John Wiley and Sons, Inc., New York, 1957).
- S. Mugiraneza, and A. M. Hallas. Tutorial: a beginner’s guide to interpreting magnetic susceptibility data with the Curie-Weiss law. Communications Physics 2022, 5, 95. [Google Scholar] [CrossRef]
- R. Werthamer, E. Helfand, and P.C. Hohenberg. Temperature and purity dependence of the superconducting critical field, Hc2. III. Electron spin and spin–orbit effects. Phys. Rev. 1966, 147, 295–302. [Google Scholar] [CrossRef]
- A. Gurevich. Enhancement of the upper critical field by nonmagnetic impurities in dirty two-gap superconductors. Phys. Rev. B 2003, 67, 184515. [Google Scholar] [CrossRef]
- J. Hänisch, K. Iida, F. Kurth, E. Reich, C. Tarantini, J. Jaroszynski, T. Förster, G. Fuchs, R. Hühne, V. Grinenko, L. Schultz, and B. Holzapfel. High field superconducting properties of Ba(Fe1-xCox)2As2 thin films. Scientific Reports 2015, 5, 17363. [Google Scholar]
- Y. Pan, Y. 116. Y. Pan, Y. Sun, N. Zhou, X. Yi, J. Wang, Z. Zhu, H. Mitamura, M. Tokunaga, Z. Shi. Novel anisotropy of upper critical fields in Fe1+yTe0.6Se0.4. arXiv, arXiv:2305.04515.
- R. Prozorov, M. A. Tanatar, R. T. Gordon, C. Martin, H. Kim, V. G. Kogan, N. Ni, M.E. Tillman, S. L. Bud’ko, P. C. Canfield. Anisotropic London penetration depth and superfluid density in single crystals of iron-based pnictide superconductors. Physica C 2009, 469, 582–589. [Google Scholar] [CrossRef]
- V. G. Kogan, R. Prozorov, and A. E. Koshelev. Temperature-dependent anisotropies of upper critical field and London penetration depth. Physical Review B 2019, 100, 014518. [Google Scholar] [CrossRef]
- D. Torsello, E. Piatti, G. A. Ummarino, X. Yi, X. Xing, Z. Shi, G. Ghigo, and D. Daghero. Nodal multigap superconductivity in the anisotropic iron-based compound RbCa2Fe4As4F2. npj Quantum Materials 2022, 7, 10. [Google Scholar] [CrossRef]

Disclaimer/Publisher’s Note: The statements, opinions and data contained in all publications are solely those of the individual author(s) and contributor(s) and not of MDPI and/or the editor(s). MDPI and/or the editor(s) disclaim responsibility for any injury to people or property resulting from any ideas, methods, instructions or products referred to in the content. |
© 2023 by the authors. Licensee MDPI, Basel, Switzerland. This article is an open access article distributed under the terms and conditions of the Creative Commons Attribution (CC BY) license (http://creativecommons.org/licenses/by/4.0/).


