1. Introduction
WC-Co hard alloys with increased fracture toughness and satisfactory strength are widely used in machine tool engineering for the production of metal cutting tools (MCT) [
1,
2,
3]. Liquid-phase sintering is generally used to obtain WC-Co hard alloys [
1,
4,
5]. This technology stands out since it ensures a uniform distribution of the fusible phase in the bulk of the material. New hard alloys of WC-Ni [
1,
4] and WC-Fe [
4] type as well as other hard alloys are produced in the same way. Fine-grained hard alloys with 6-10% Co are characterized by H
V = 18-22 GPa and Palmquist fracture toughness coefficient of 10-14 MPa·m
1/2.
At present, fine-grained ceramics based on binderless tungsten carbide are of great interest. The key feature of WC-based ceramics is the combination of high hardness (H
V > 30 GPa) and increased fracture toughness coefficient (K
IC > 4-5 MPa·m
1/2) [
6,
7]. Besides, tungsten carbide has a high melting point, high elastic modulus and high corrosion resistance. Such a combination of properties enables binderless tungsten carbide to be used to manufacture MCT designed for finishing engineering structural materials. It is noteworthy that binderless WC-based ceramics produced by conventional pressureless sintering (CPS) have low density and poor mechanical properties.
Particles of oxides, carbides and nitrides are added to WC-based ceramics to improve the mechanical properties [
5,
8,
9]. Preliminary studies suggest far-reaching prospects for dispersion-hardened WC-SiC ceramics with increased strength and hardness [
10,
11,
12]. The introduction of dispersed SiC particles into tungsten carbide is expected to increase its strength and fracture toughness and will allow to control the friction coefficient, which is an important feature for MCT.
The general task of this paper is to produce and study ultrafine-grained (UFG) WC-SiC ceramics with varying carbon content. Tungsten monocarbide has a very narrow homogeneity area in the W-C diagram [
2], so even a slight carbon concentration deviation from the equilibrium concentration (С
0 = 6.14% wt.) leads to the formation of W
2C particles that impair the mechanical properties of ceramics. The carbon concentration in WC decreases during sintering. This is due to the fact that oxygen atoms interact with carbon atoms in the WC lattice [
2,
6]. This leads to the formation of W
2C particles. Besides, it should be noted that excess carbon concentrations lead to the formation of graphite particles that further reduce the mechanical properties of WC-based ceramics [
6]. Therefore, optimizing carbon concentrations in WC-based ceramics is a relevant task with practical implications.
Plasma chemical synthesis of tungsten monocarbide nanopowders [
13] and spark plasma sintering (SPS) [
2,
14,
15,
16,
17,
18,
19,
20,
21,
22,
23] have been used to produce ceramics for the goals of this study. We reckon that these technologies combined will help to further improve the mechanical properties of WC-based ceramics by forming a high-density UFG microstructure. One of the crucial SPS advantages is the possibility to sinter ceramics at high heating rates (up to 2500℃/min), which allows to limit grain growth and obtain materials with grains extremely small in size [
15,
17,
23]. Earlier studies have shown promising prospects of applying plasma chemical synthesis of WC nanoparticles and SPS jointly to obtain UFG WC-based ceramics with advanced mechanical properties [
6,
14,
24].
This study aims to investigate the peculiarities of flash sintering of WC-SiC ceramics with varying carbon content, as well as to research the effect of sintering modes on the microstructure parameters, phase composition and mechanical properties of WC-SiC ceramics.
2. Materials and Methods
Binderless tungsten carbide and WC+SiC ceramics based on α-WC nanopowders make up the target of this research.
α-WC nanopowders have been obtained by DC arc plasma chemical synthesis followed by hydrogen annealing at 1050℃ (3 h) (see [
13]). 0.3 and 0.5% wt. of colloidal graphite and 1, 3, 5% wt. of β-SiC nanopowders with an average particle size of 45-55 nm (as follows from the manufacturer’s certificate of Alfa Aesar, Germany) were added to the α-WC nanopowder. The powders were mixed in a Pulverisette 6 planetary mill at room temperature in 45-60 ml of isopropyl alcohol. To reduce grinding yield, milling pots and balls (∅ 1.6 mm, 150 g) made of WC-Co solid carbide were used. The weight of each powder batch totaled 50 g. To reduce the degree of agglomeration, the powders were subjected to a two-step ultrasonic treatment with UP200Ht (Hielscher UP 200 Ht) before mixing. To that end, the required amount of SiC and/or graphite powder was added to the isopropyl alcohol, and the resulting suspension was subjected to ultrasound for 5 min. Then, the required amount of WC nanopowder and an additional amount of isopropyl alcohol were added to the suspension. After that, the WC + SiC + C suspension was subjected to ultrasonic treatment for 10 min at room temperature and stirred in a Pulverisette 6 planetary mill at 150 rpm for 6 h. To prevent excessive heating, interruptions of 1 min/h were made with a simultaneous reversal of rotation. The resulting suspension was placed in a Binder vacuum drying chamber and dried at 50℃ and 100 mbar for 2 h.
The average particle size of the powders (RBET) was calculated based on the specific surface area (Ssp) measured using the BET method: RBET = 6/(ρth⋅Ssp), where ρth = 15.44 g/cm3 – theoretical density of tungsten monocarbide. The specific surface area of the powders was measured using a TriStar 3000 analyzer (Micrometrics). The oxygen and carbon concentrations were measured using a CS-600 Leco analyzer.
The cylindrical samples of 12 mm in diameter and 5-6 mm high were sintered using Dr. Sinter model SPS-625. Sintering was carried out in vacuum (6 Pa) in graphite molds with an inner diameter of 12.8 mm. Graphite foil placed between the samples and the inner surface of the mold was used to make the adherence of the sample to the mold tighter. The temperature was controlled by a CHINO IR-AH optical pyrometer focused on the surface of the graphite mold. The temperature accuracy was ±20℃. The dilatometer as part of Dr. Sinter model SPS-625 was used to determine the effective shrinkage temperature dependence of powders L
eff(Т). To account for the contribution of the mold thermal expansion L
0(T), an experiment on heating empty molds was performed. The true shrinkage value (L) was determined from the formula: L(T) = L
eff(T) – L
0(T) (see [
25]).
Two sintering modes were used in this study.
Mode I: sintering of tungsten carbide powders in a continuous heating mode at a heating rate of 10 and 100 ℃/min up to a point when shrinkage is complete (T
s). Sintering took place under uniaxial stress of 70 MPa applied simultaneously with the start of heating. The holding time at T
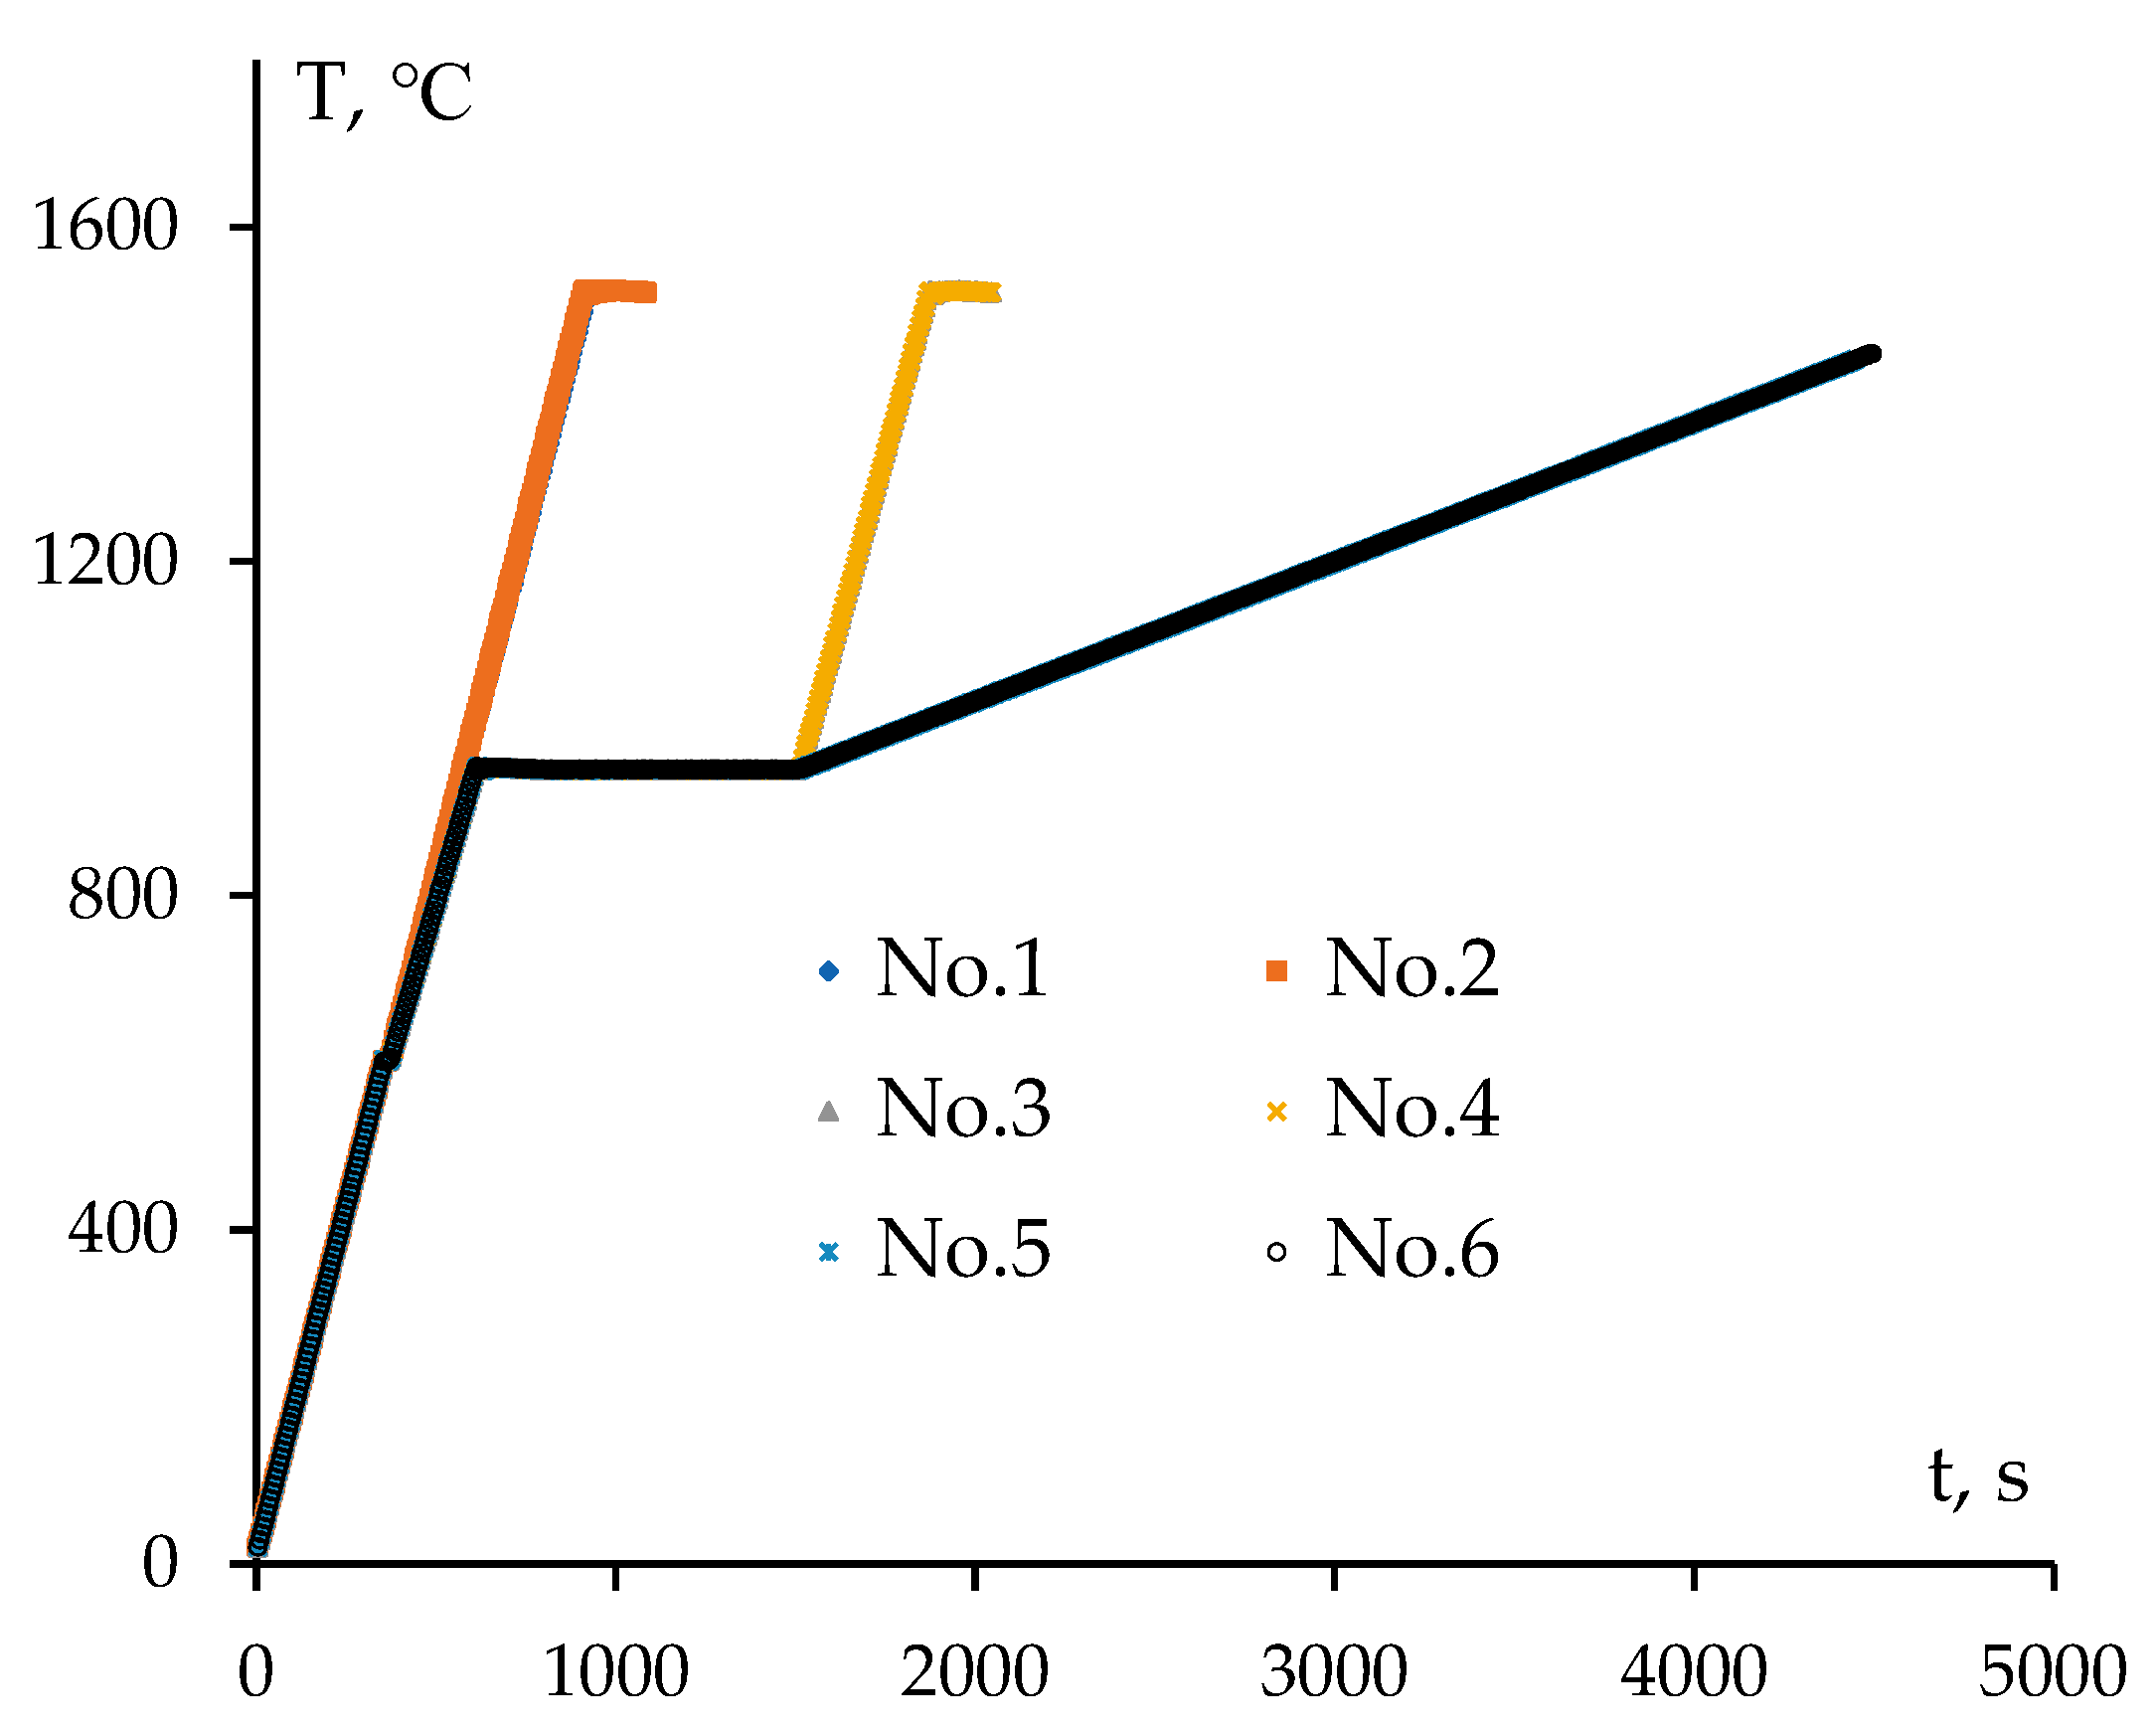
s was 0 and 3 min, respectively. In addition, the effects of degassing at 950℃ for 15 min and powder prepressing under 350 MPa were studied. Prepressing of powders was carried out in a steel mold with an inner diameter of 12 mm using a Sorokin hydraulic press. A detailed description of the sintering modes is presented below in
Table 1 and
Figure 1.
Mode II: SPS of WC + С and WC + SiC + C powders weighing 6 g in a continuous heating mode at 50 ℃/min up to Ts. The holding time at Ts was 0, 3 and 30 min, respectively.
The samples together with the setup were cooled down to room temperature.
A Linseis L75VS1750C high-temperature dilatometer was used to analyze the kinetics of the initial sintering stage. Dilatometer studies were performed under minimum stress of the lower punch of 500 mN. The heating rate was 10℃/min; the samples were heated up to 1650℃. The samples together with the dilatometer were cooled down to room temperature. The temperature was controlled using a B-type thermocouple (platinum-rhodium), the samples were heated using MoSi2 heaters. The dilatometric shrinkage-temperature curves were recorded in argon at a purge rate of 25 ml/min.
The microstructure of powders and ceramics was studied using a TESCAN VEGA 2 scanning electron microscope (SEM) with an Oxford Instruments INCA 350 energy dispersive (EDS) microanalyzer and a Jeol JEM-2100F transmission electron microscope (TEM). X-ray diffraction (XRD) analysis was carried out with a Shimadzu XRD-7000 diffractometer (CuKα, step size of 0.04°, holding time of 2 s). The Rietveld method was applied to quantitative phase analysis. The accuracy of determining the content of α-WC, W2C and β-SiC particles was ±0.5% wt. Initial phase parameters were taken from the ICSD and PDF-2 database.
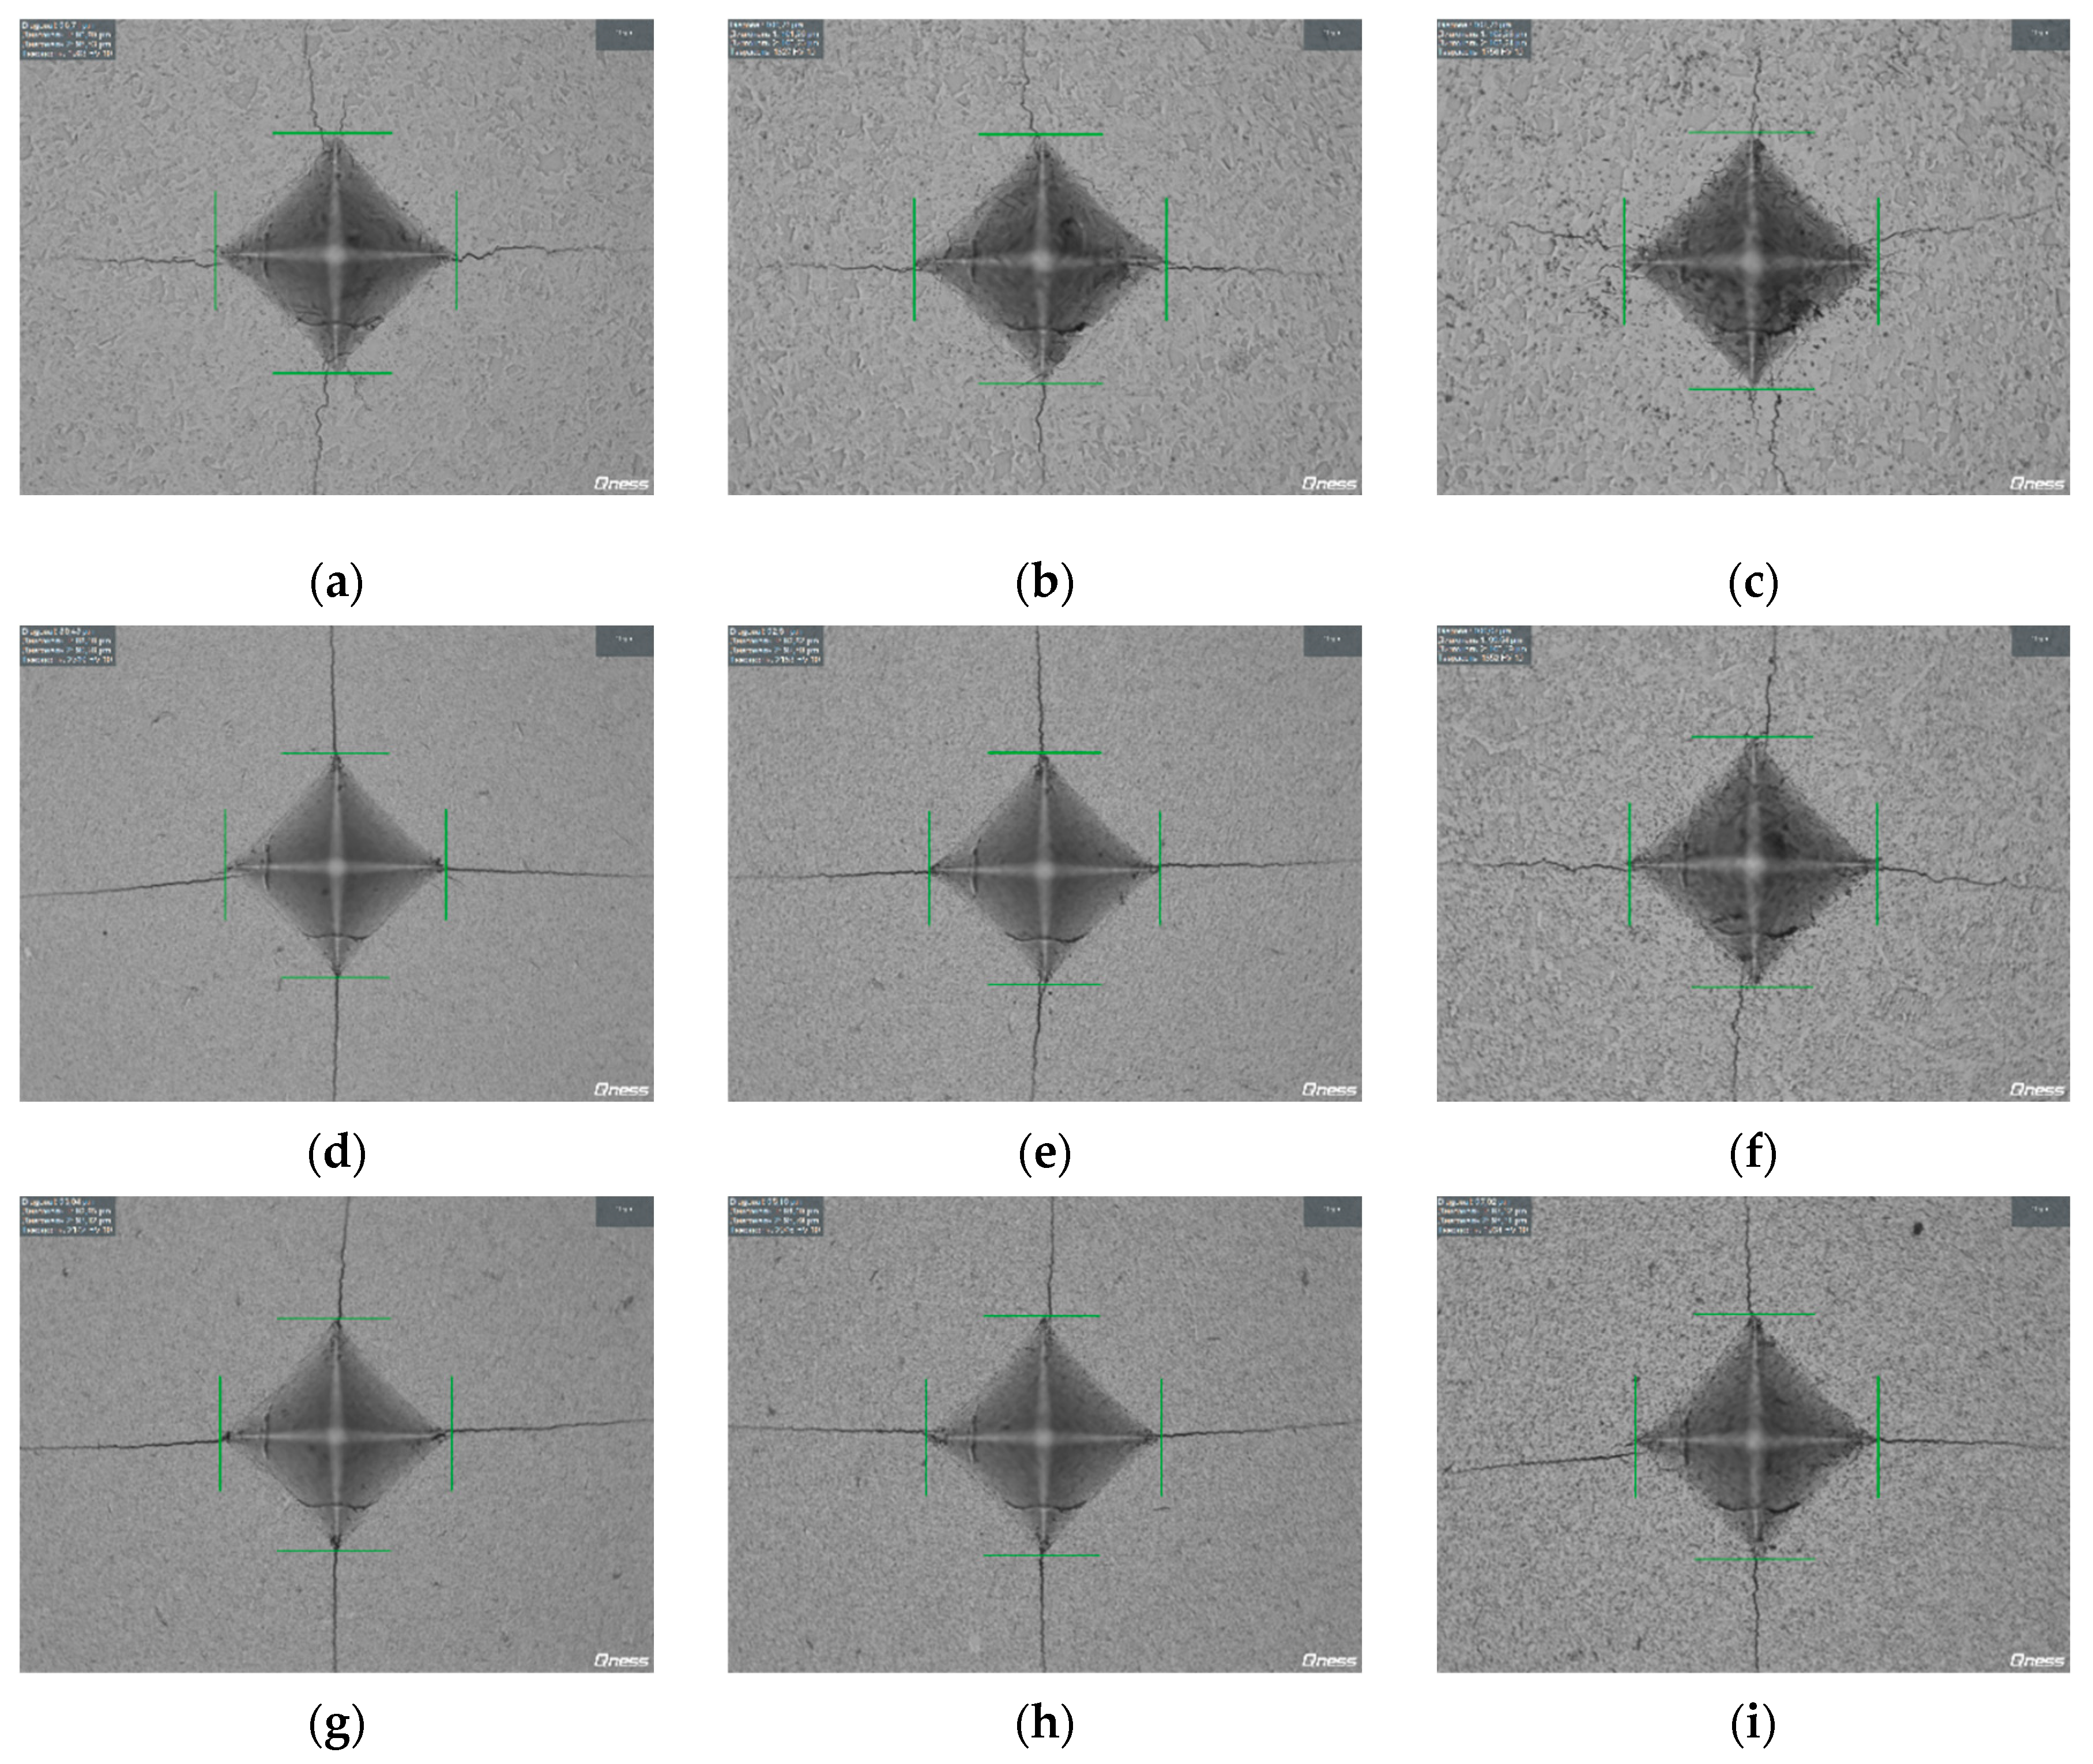
The Vickers hardness (HV) of ceramics was measured with a Qness A60+ hardness tester. The load totaled 10 kg. The minimum fracture toughness coefficient (KIC) was calculated based on the Palmquist model by the longest radial fracture. When calculating KIC, the elastic modulus of ceramics was taken as E = 710 GPa. The average inaccuracy of HV and KIC was ±0.2 GPa and ±0.2 MPa·m1/2, respectively.
The density of the samples (ρ) was measured by hydrostatic weighing using Sartorius CPA 225D scales. When calculating relative density (ρ/ρth), the theoretical density of binderless tungsten carbide was taken as ρth = 15.77 g/cm3, the theoretical density of W2C carbide was 17.15 g/cm3, the theoretical density of SiC was 3.21 g/cm3. The inaccuracy of relative density (ρ/ρth) was ±0.2%, while that of absolute density was 0.05 g/cm3.
Prior to investigating the microstructure, phase composition and mechanical properties, the samples were mechanically polished to eliminate a ~300-350 µm thick carburized layer formed as a result of carbon diffusing from the graphite mold onto the surface of the ceramic sample (see [
24]).
4. Discussion
As shown in the Results section, the L(T) curves during SPS have a three-stage character: low-temperature Stage I, at which the compaction intensity is low, intense shrinkage at Stage II, and high-temperature Stage III, at which the shrinkage rate changes slowly again (
Figure 3 and
Figure 6). The processes occurring at each of the stages are described in sufficient detail in classical monographs on sintering (see, for example, [
28,
29,
30,
31]), so we will not dwell on this here.
Let us identify diffusion mechanisms that control nanopowder compaction at each of the SPS stages and dilatometric heating.
The kinetics of nanopowders compaction at the intensive compaction stage (Stage II) can be analyzed using the Young-Cutler model [
32], which describes the initial stage of non-isothermal sintering of spherical particles accompanied by simultaneous processes of volume and grain boundary diffusion as well as plastic deformation:
where ε – shrinkage, t – time, γ – free energy, D
v – volume diffusion coefficient, D
b – grain boundary diffusion coefficient, d – grain size, p – stress, D – diffusion coefficient during plastic deformation. According to [
32,
33], the slope of ln(T∂ε/∂T) – T
m/T dependence corresponds to the effective activation energy of the sintering process mQ
s2, where m is a numerical coefficient that depends on the diffusion mechanism (m = 1/3 for grain boundary diffusion, m = ½ for lattice diffusion, m = 1 for viscous flow (creep), T
m = 3053 K – tungsten monocarbide melting temperature).
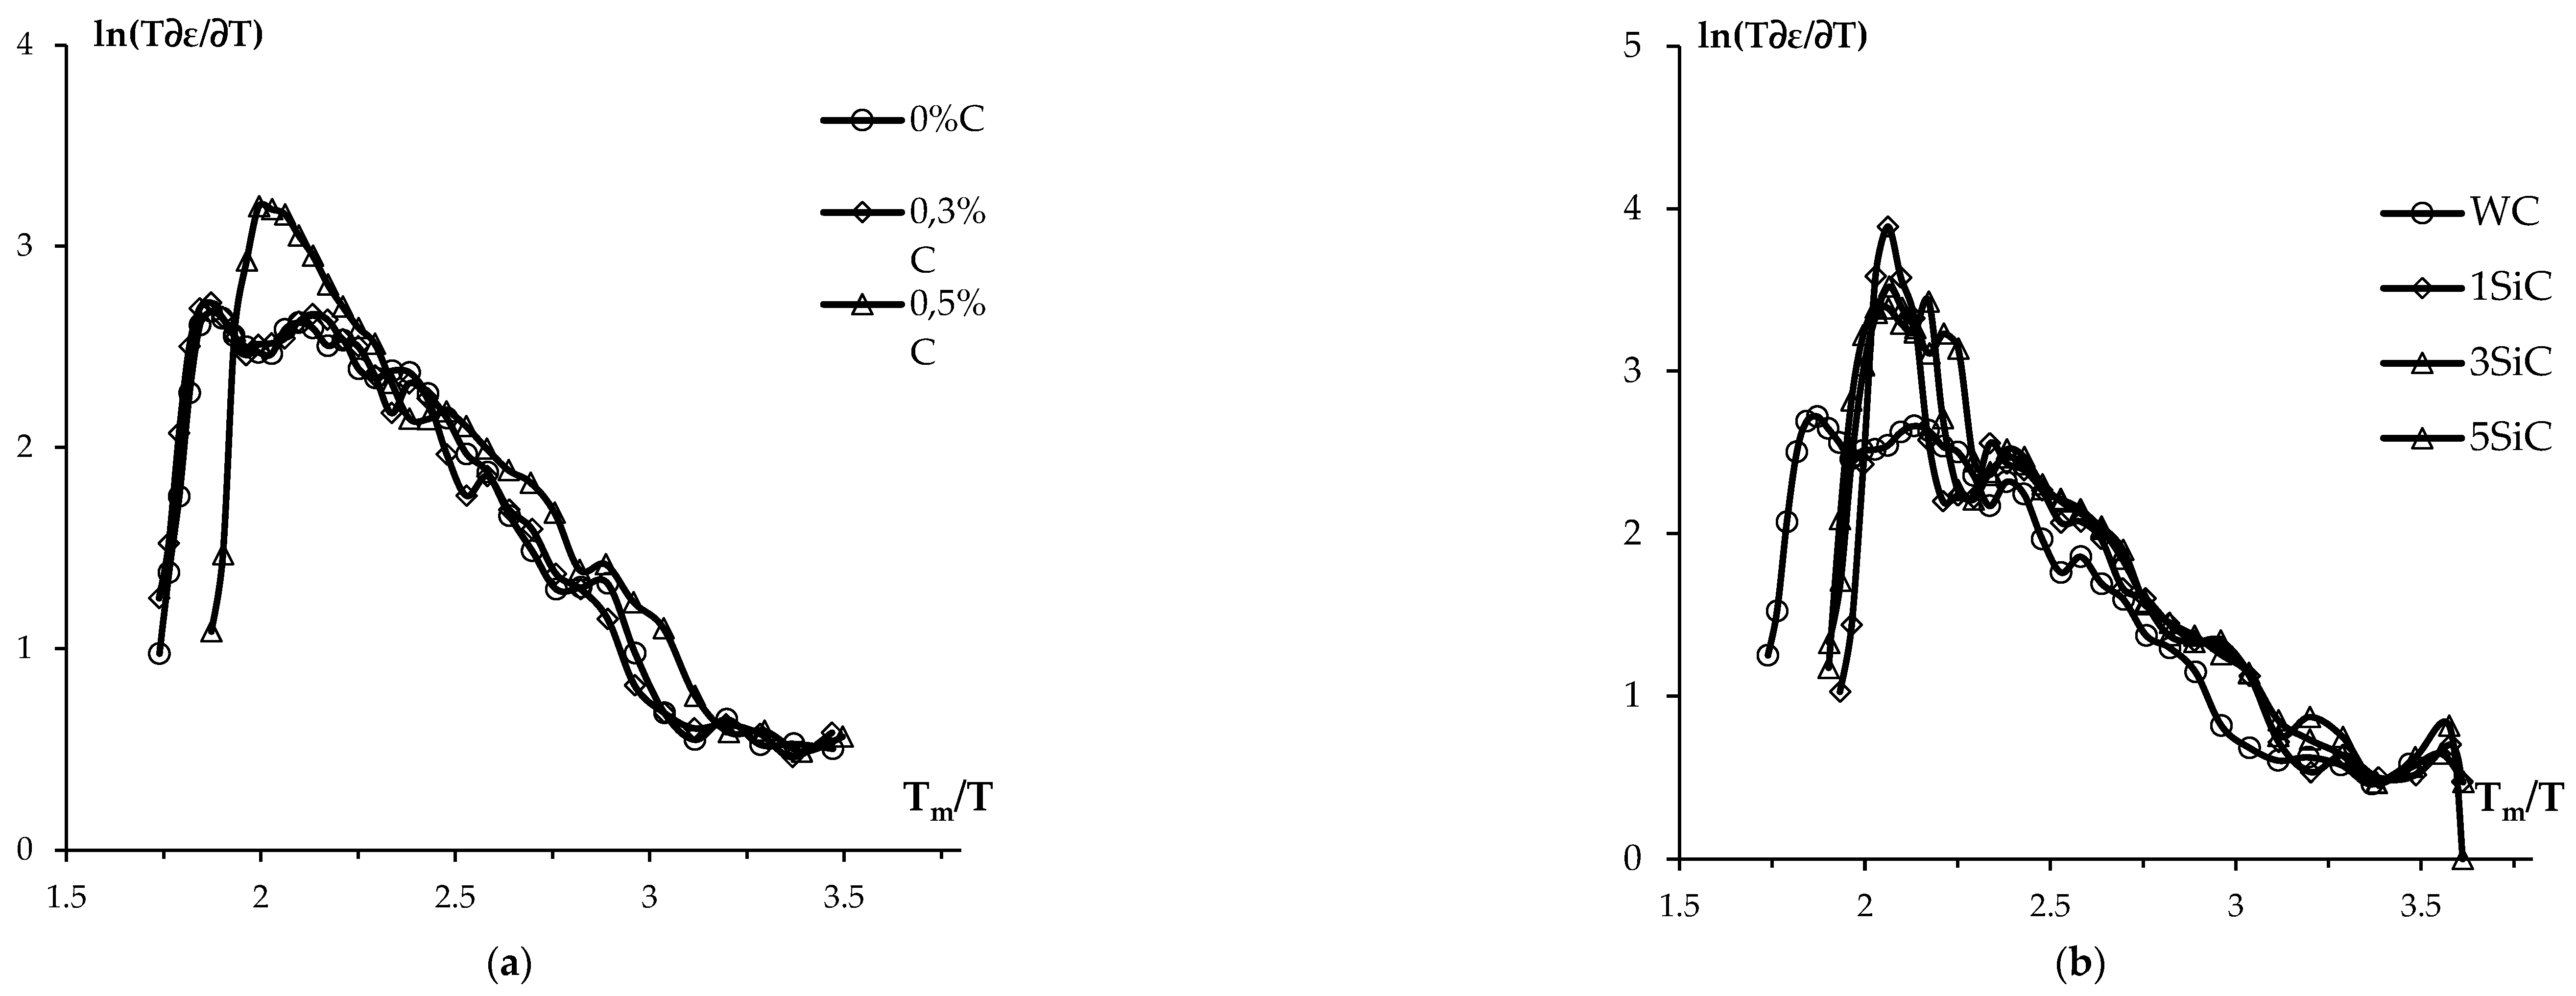
Figure 15 show ln(T∂ε/∂T) – T
m/T dependences for tungsten carbide samples with varying graphite content (
Figure 15a) and WC + SiC + 0.3% C ceramics (
Figure 15b). For all ceramics, ln(T∂ε/∂T) – T
m/T dependences have a typical two-stage character, which indirectly testifies to the validity of the Young-Cutler model (see [
32]). It may be further noted that the correctness of applying this approach while analyzing temperature-shrinkage dependences during SPS of WC and WC-Co powders was demonstrated in [
24,
34].
The average values of the effective SPS activation energy for WC + C ceramics at Stage II (mQ
s2) are presented in
Table 2; the accuracy of the effective activation energy mQ
s2 is ± 0.3 kT
m.
Table 2 shows that an increase in the graphite content from 0 to 0.5% leads to an increase in mQ
s2 from 1.3 to 2.3 kT
m. At m = 1/3 [
32], the SPS activation energy at Stage II Q
s2 varies from 4.9 to 6.9 kT
m (124 – 175 kJ/mol). The SPS activation energy values appear to be lower than those of the carbon grain boundary diffusion activation energy in tungsten monocarbide (240 kJ/mol [
35] ~9.1 kT
m).
The effective activation energy for sintering WC + SiC ceramics is mQ
s2 ~2.0-2.2 kT
m (
Table 3). At m = 1/3 [
32], the SPS activation energy for WC + SiC ceramics at Stage II is Q
s2 = 6.0-6.6 kT
m (152 – 167 kJ/mol). Thus, the SPS activation energy values for WC + SiC ceramics appear to be lower than those of the carbon grain boundary diffusion activation energy in tungsten monocarbide.
Now let us analyze the results of dilatometric studies.
Figure 16 show ln(T∂ε/∂T) – T
m/T dependences for tungsten carbide samples with varying graphite content (
Figure 16a) and WC + SiC + 0.3% C ceramics (
Figure 16b). The dilatometric curves ln(T∂ε/∂T) – T
m/T have a two-stage character. For binderless tungsten carbide, the effective CPS activation energy is mQ
s2 ~ 3.6 kT
m. Similar effective sintering activation energy values (mQ
s2 ~ 3.6-4 kT
m) are observed for tungsten carbide with 0.3 and 0.5% wt. graphite. At m = 1/3, the CPS activation energy values are 10.8-12 kT
m (272-303 kJ/mol) and close to the table value of the carbon grain boundary diffusion activation energy in tungsten carbide (~9.1 kT
m (240 kJ/mol [
35])). The findings indicate that low SPS activation energy values in the medium heating temperatures range (Stage II) are mostly caused by the effect that applied voltage has on the intensity of WC nanoparticles rearrangement and slippage.
The effective CPS activation energy values for WC + SiC + 0.3% C ceramics (
Figure 14) are mQ
s2 ~ 5-5.8 kT
m. At m = 1/3, the CPS activation energy for WC + SiC + 0.3% C ceramics is Q
s2 = 15-17.4 kT
m (379-439 kJ/mol). These values appear to be bigger than those of the carbon grain boundary diffusion activation energy in tungsten carbide and approach those of the
14С diffusion activation energy in the tungsten carbide lattice. At the same time, it should be noted that the dilatometric curves ln(T∂ε/∂T) – T
m/T for WC + SiC + C ceramics are more complicated in nature, therefore, it is difficult to pin down the CPS activation energy.
Let us analyze SPS mechanisms for ceramics at high temperatures. At high heating temperatures, the slope of ln(T∂ε/∂T) – T
m/T dependence becomes negative (
Figure 15 and
Figure 16). It means that in order to estimate the SPS activation energy for WC-based ceramics at Stage III (Q
s3), other approaches are required.
According to [
25], the activation energy at Stage III can be estimated using the diffusion model of dissolving pores located along grain boundaries in UFG materials. The applicability of this procedure for tungsten carbide was previously demonstrated in [
14,
24]. In line with the model described in [
25], the sintering activation energy Q
s3 is determined by the slope of ρ(T)/ρ
th dependence in double logarithmic coordinates ln(ln(α⋅ρ/ρ
th/(1-ρ/ρ
th)) – T
m/T, where α = 0.33 – compaction coefficient of α-WC nanopowders (
Figure 17). The average accuracy of determining the activation energy Q
s3 is ± 1 kT
m.
ln(ln(αρ/ρ
th/(1-ρ/ρ
th)) – T
m/T dependence for tungsten carbide at Stage III can be accurately plotted with a straight line (
Figure 17). The introduction of SiC particles into the WC nanopowder leads to a shift in the above dependences towards higher temperatures, but the character of dependences (slope and monotonicity) does not change with an increase in the SiC content. The SPS activation energy for WC + SiC samples is Q
s3 = 10-12 kT
m (253-304 kJ/mol) (see
Table 2). These values turn out to be close to those of the
14С volume diffusion in tungsten monocarbide (~ 355 kJ/mol [
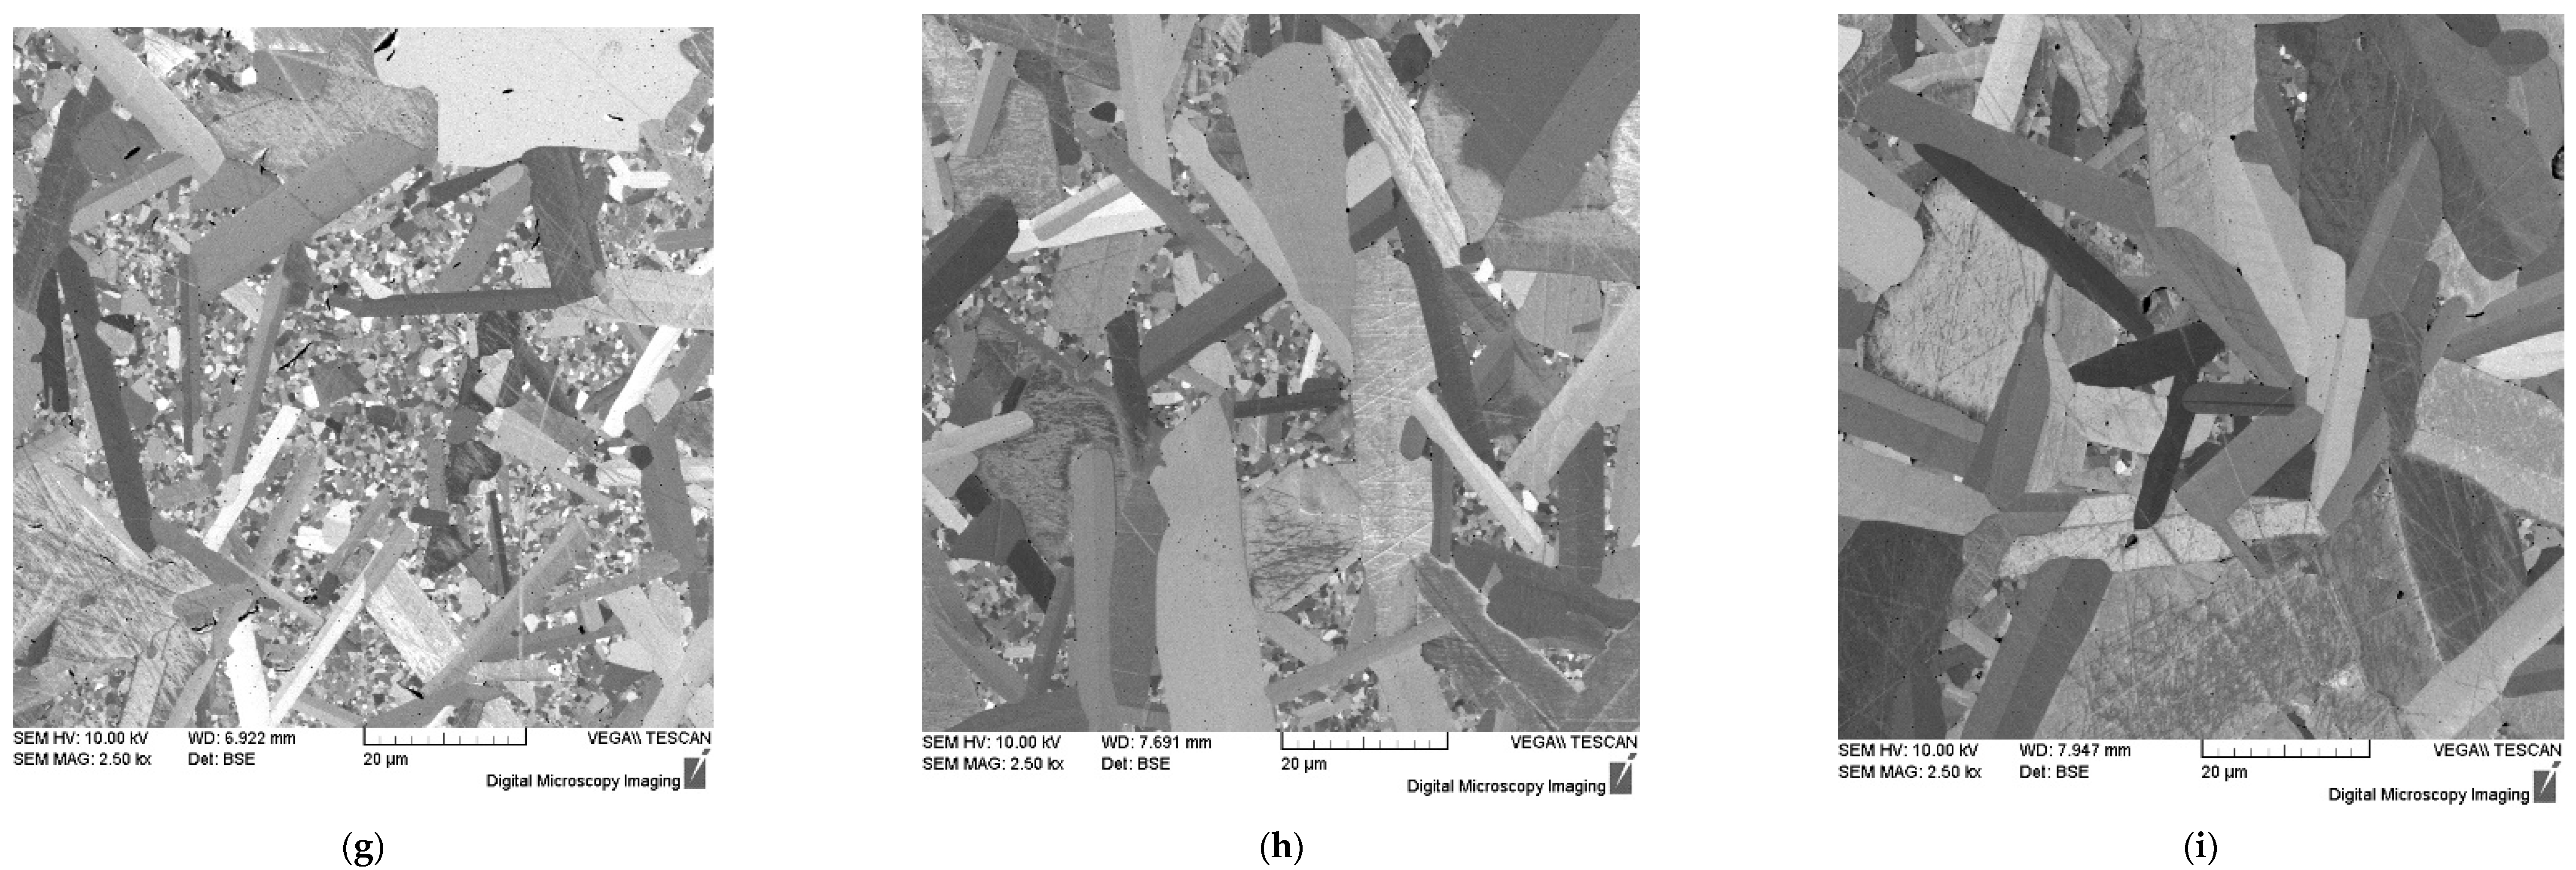
35]). We reckon that one of the reasons for an increase in the SPS activation energy and a change in the sintering mechanism is an intensive grain growth in tungsten carbide with an increased graphite content (see
Figure 9).
As follows from
Figure 17, a two-stage character of ln(ln(α⋅ρ/ρ
th/(ρ/ρ
th-1)) – T
m/T dependence is observed for WC + SiC ceramics. The SPS activation energy for WC + SiC ceramics at Stage III-1 in the low heating temperatures range is Q
s3(1) ~ 10-13 kT
m, which is close to the carbon volume diffusion activation energy in tungsten monocarbide. At higher temperatures, at the final sintering stage, the SPS activation energy decreases to Q
s3(2) ~ 5-6 kT
m. We reckon that the SPS activation energy at the final high temperature heating stage (Stage III-2, see
Figure 17) reduces due to a decrease in the W
2C phase, the presence of which triggers abnormal grain growth and slows down the sintering process.
Figure 1.
Temperature-time diagram of heating powders during SPS.
Figure 1.
Temperature-time diagram of heating powders during SPS.
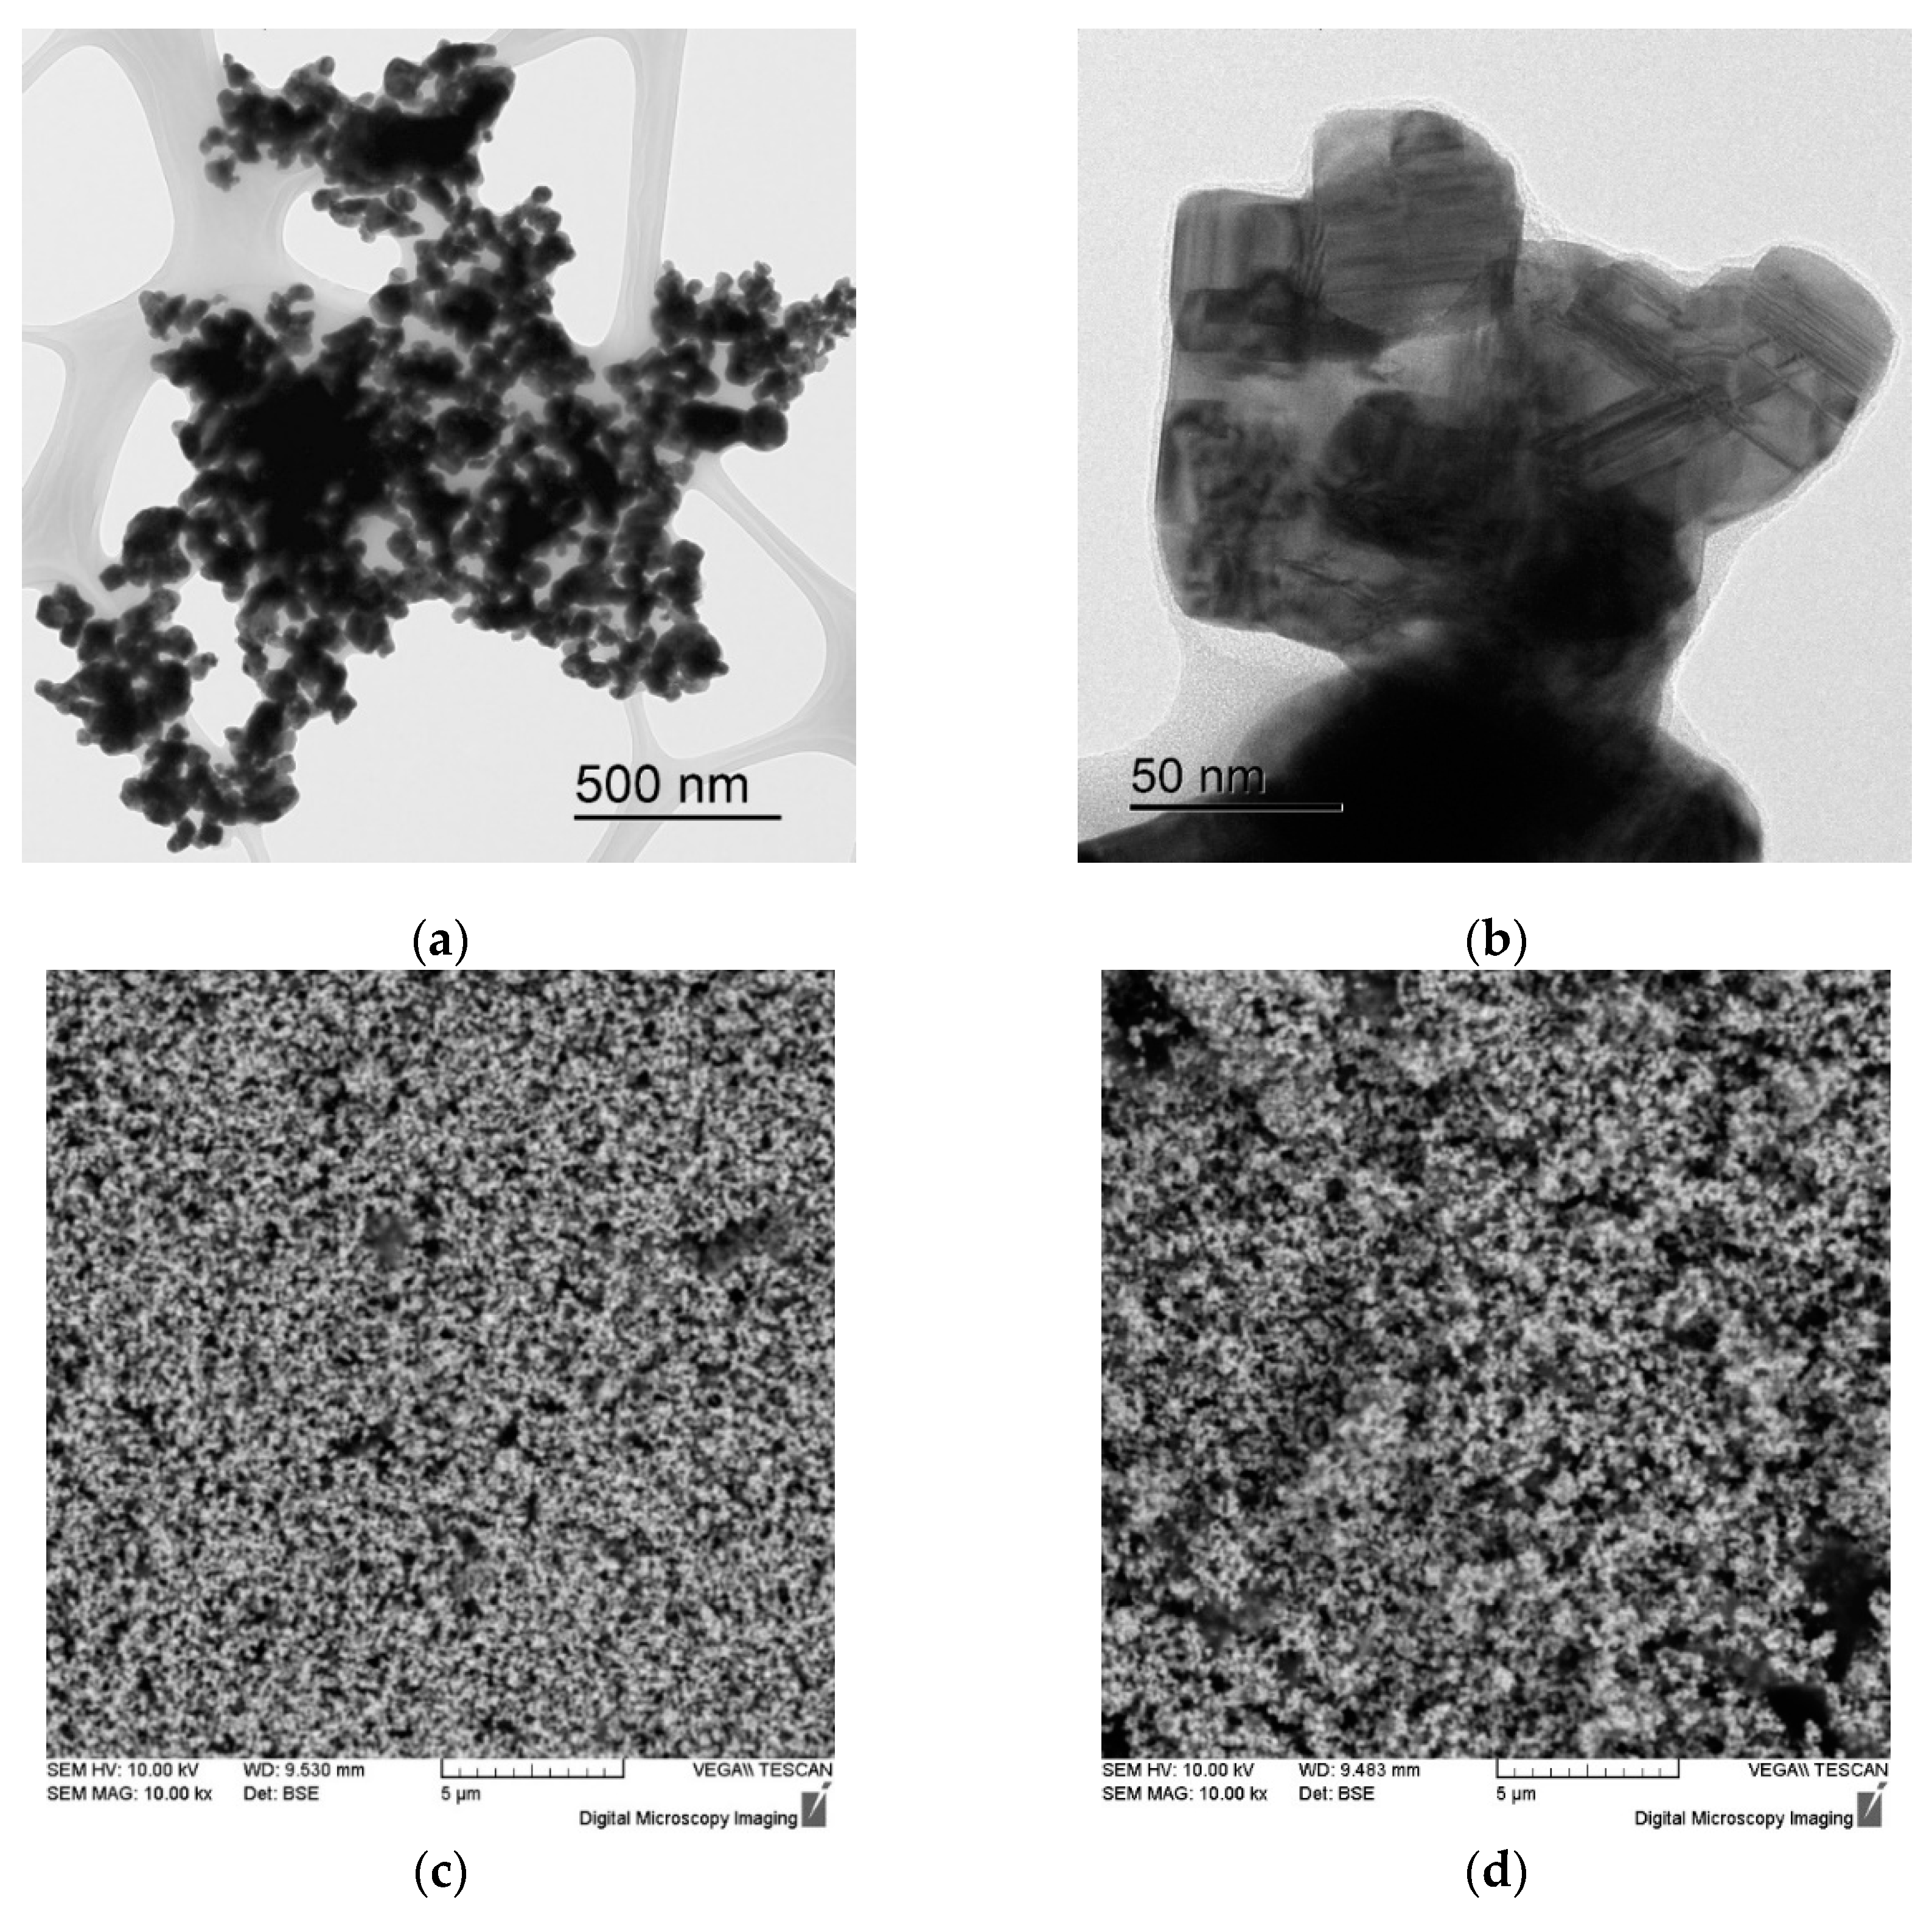
Figure 2.
Electron microscope images of WC powders (a, b), WC + 3% SiC (c) and WC + 5% SiC (d).
Figure 2.
Electron microscope images of WC powders (a, b), WC + 3% SiC (c) and WC + 5% SiC (d).
Figure 3.
XRD results of WC + SiC and WC + C powders.
Figure 3.
XRD results of WC + SiC and WC + C powders.
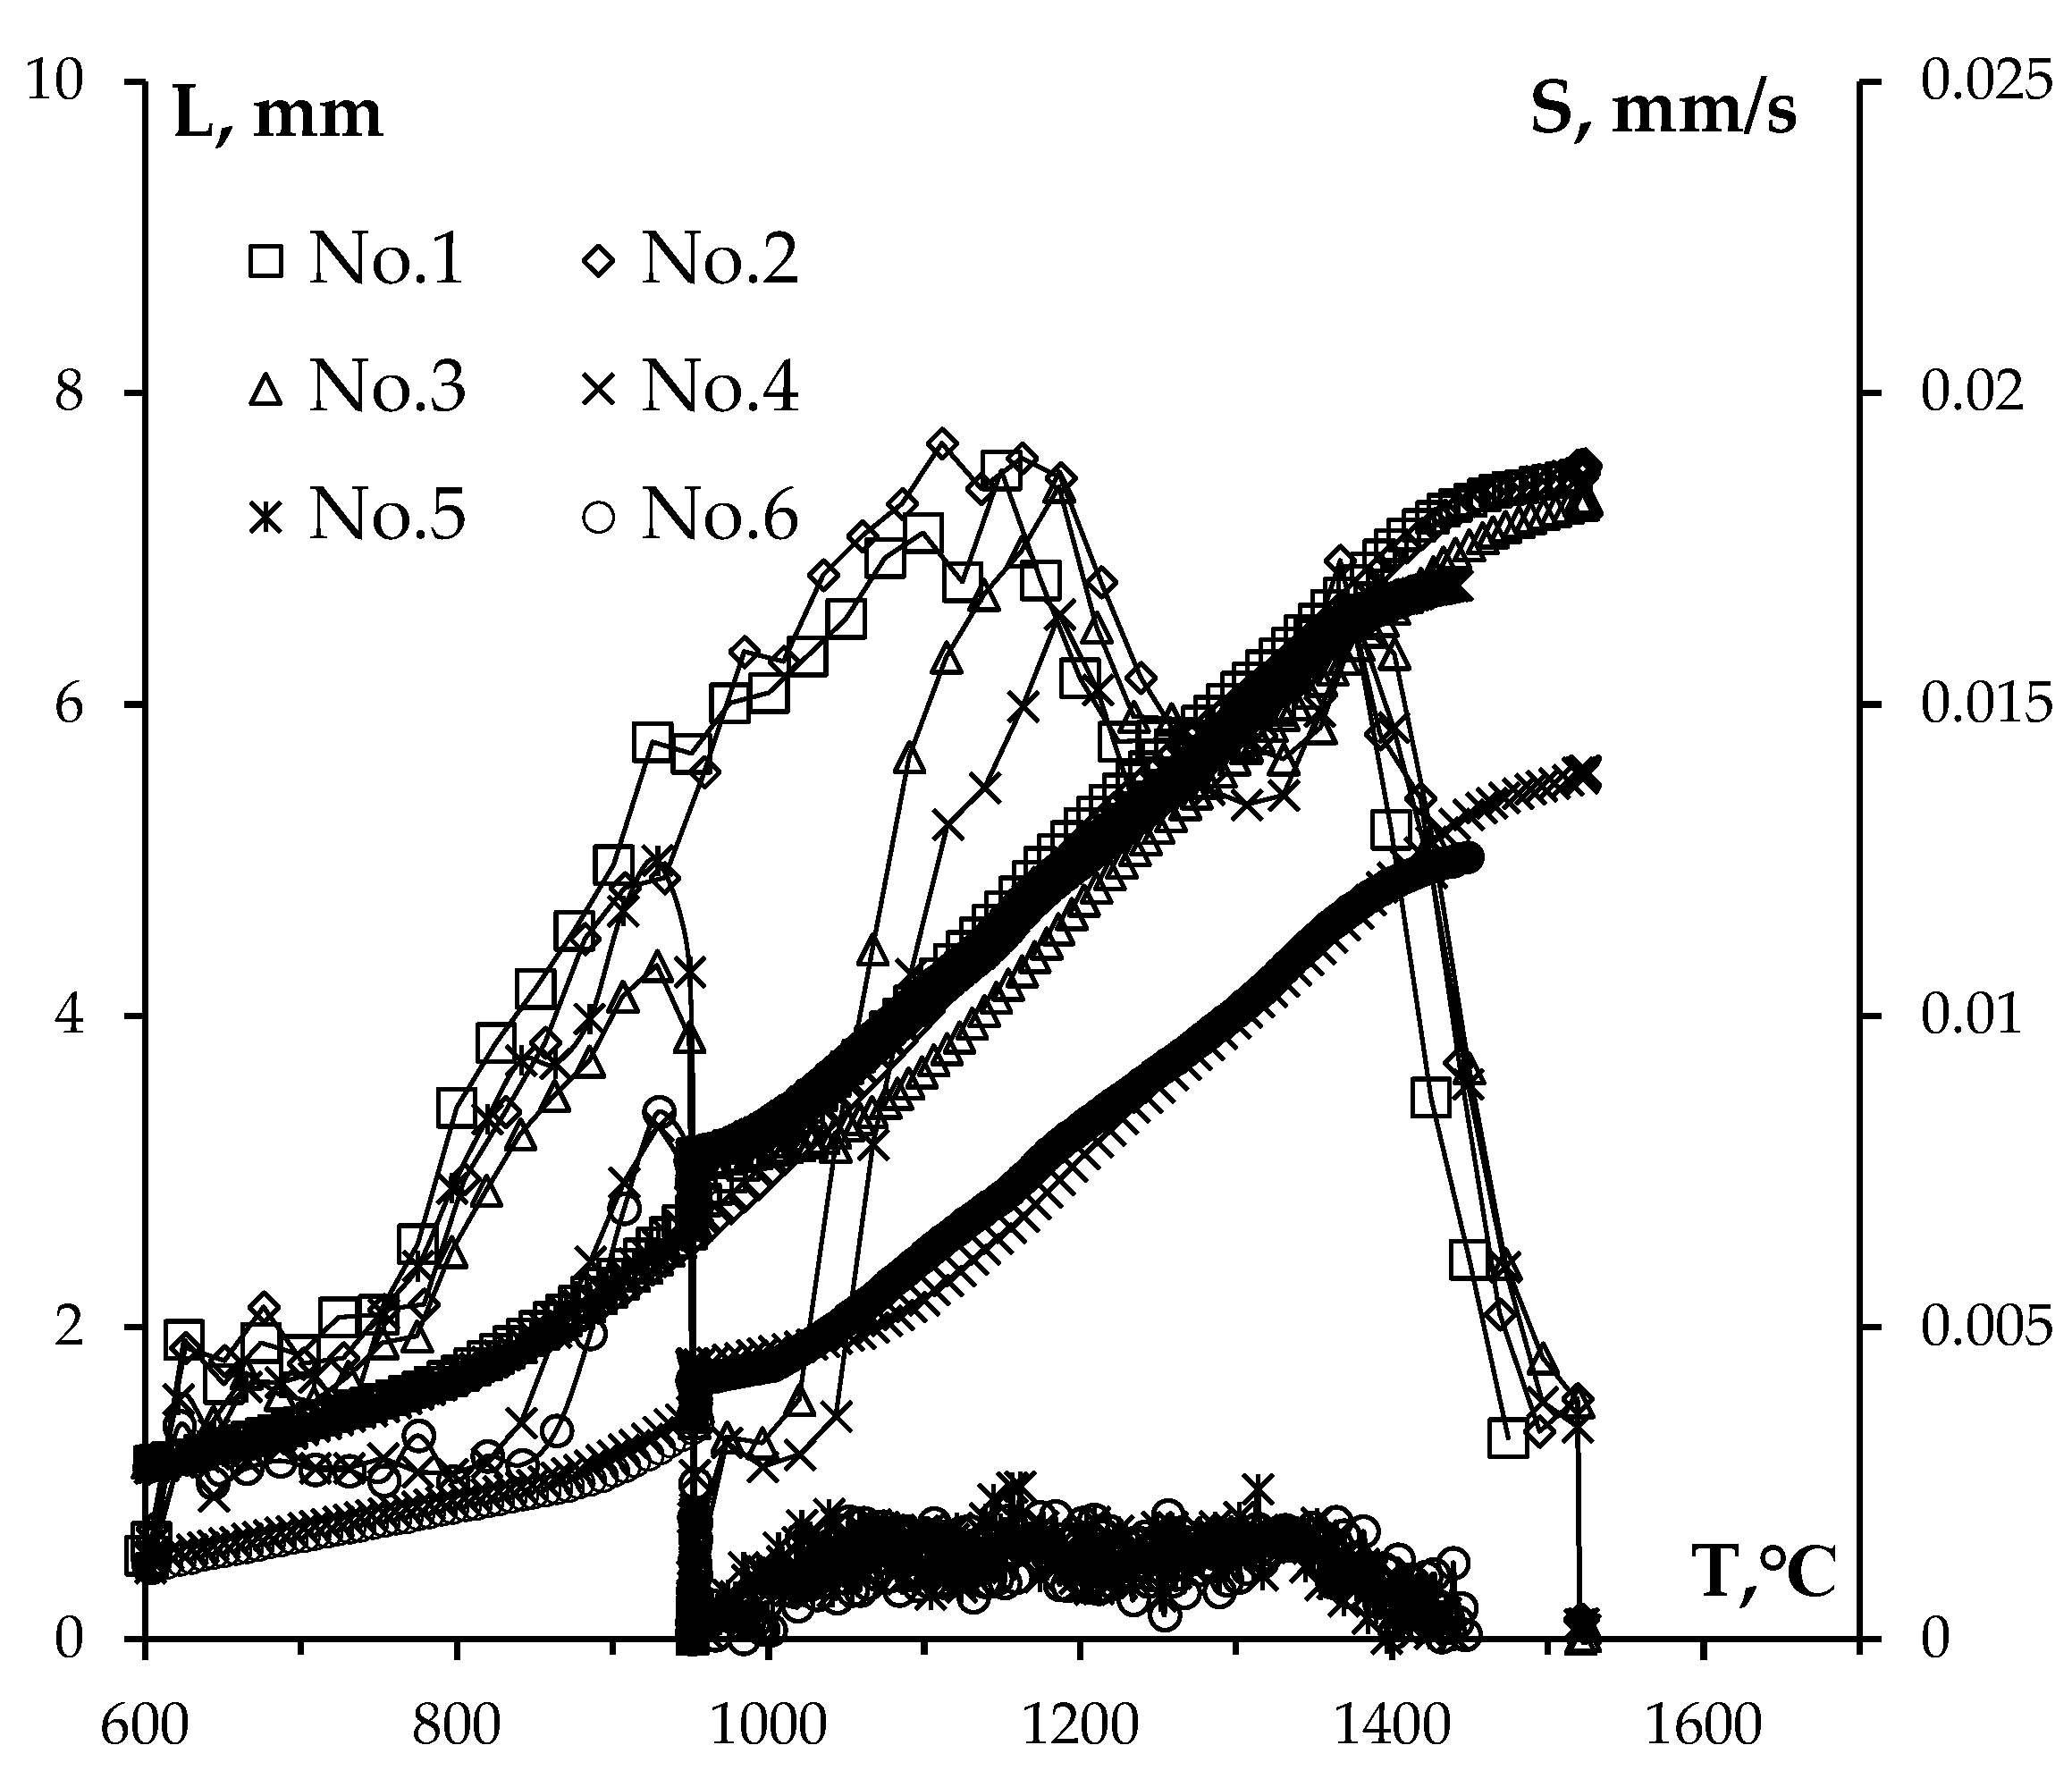
Figure 4.
Temperature curves for shrinkage L and shrinkage rate S of WC powders. Numbers in the chart stand for powder numbers (see
Table 1).
Figure 4.
Temperature curves for shrinkage L and shrinkage rate S of WC powders. Numbers in the chart stand for powder numbers (see
Table 1).
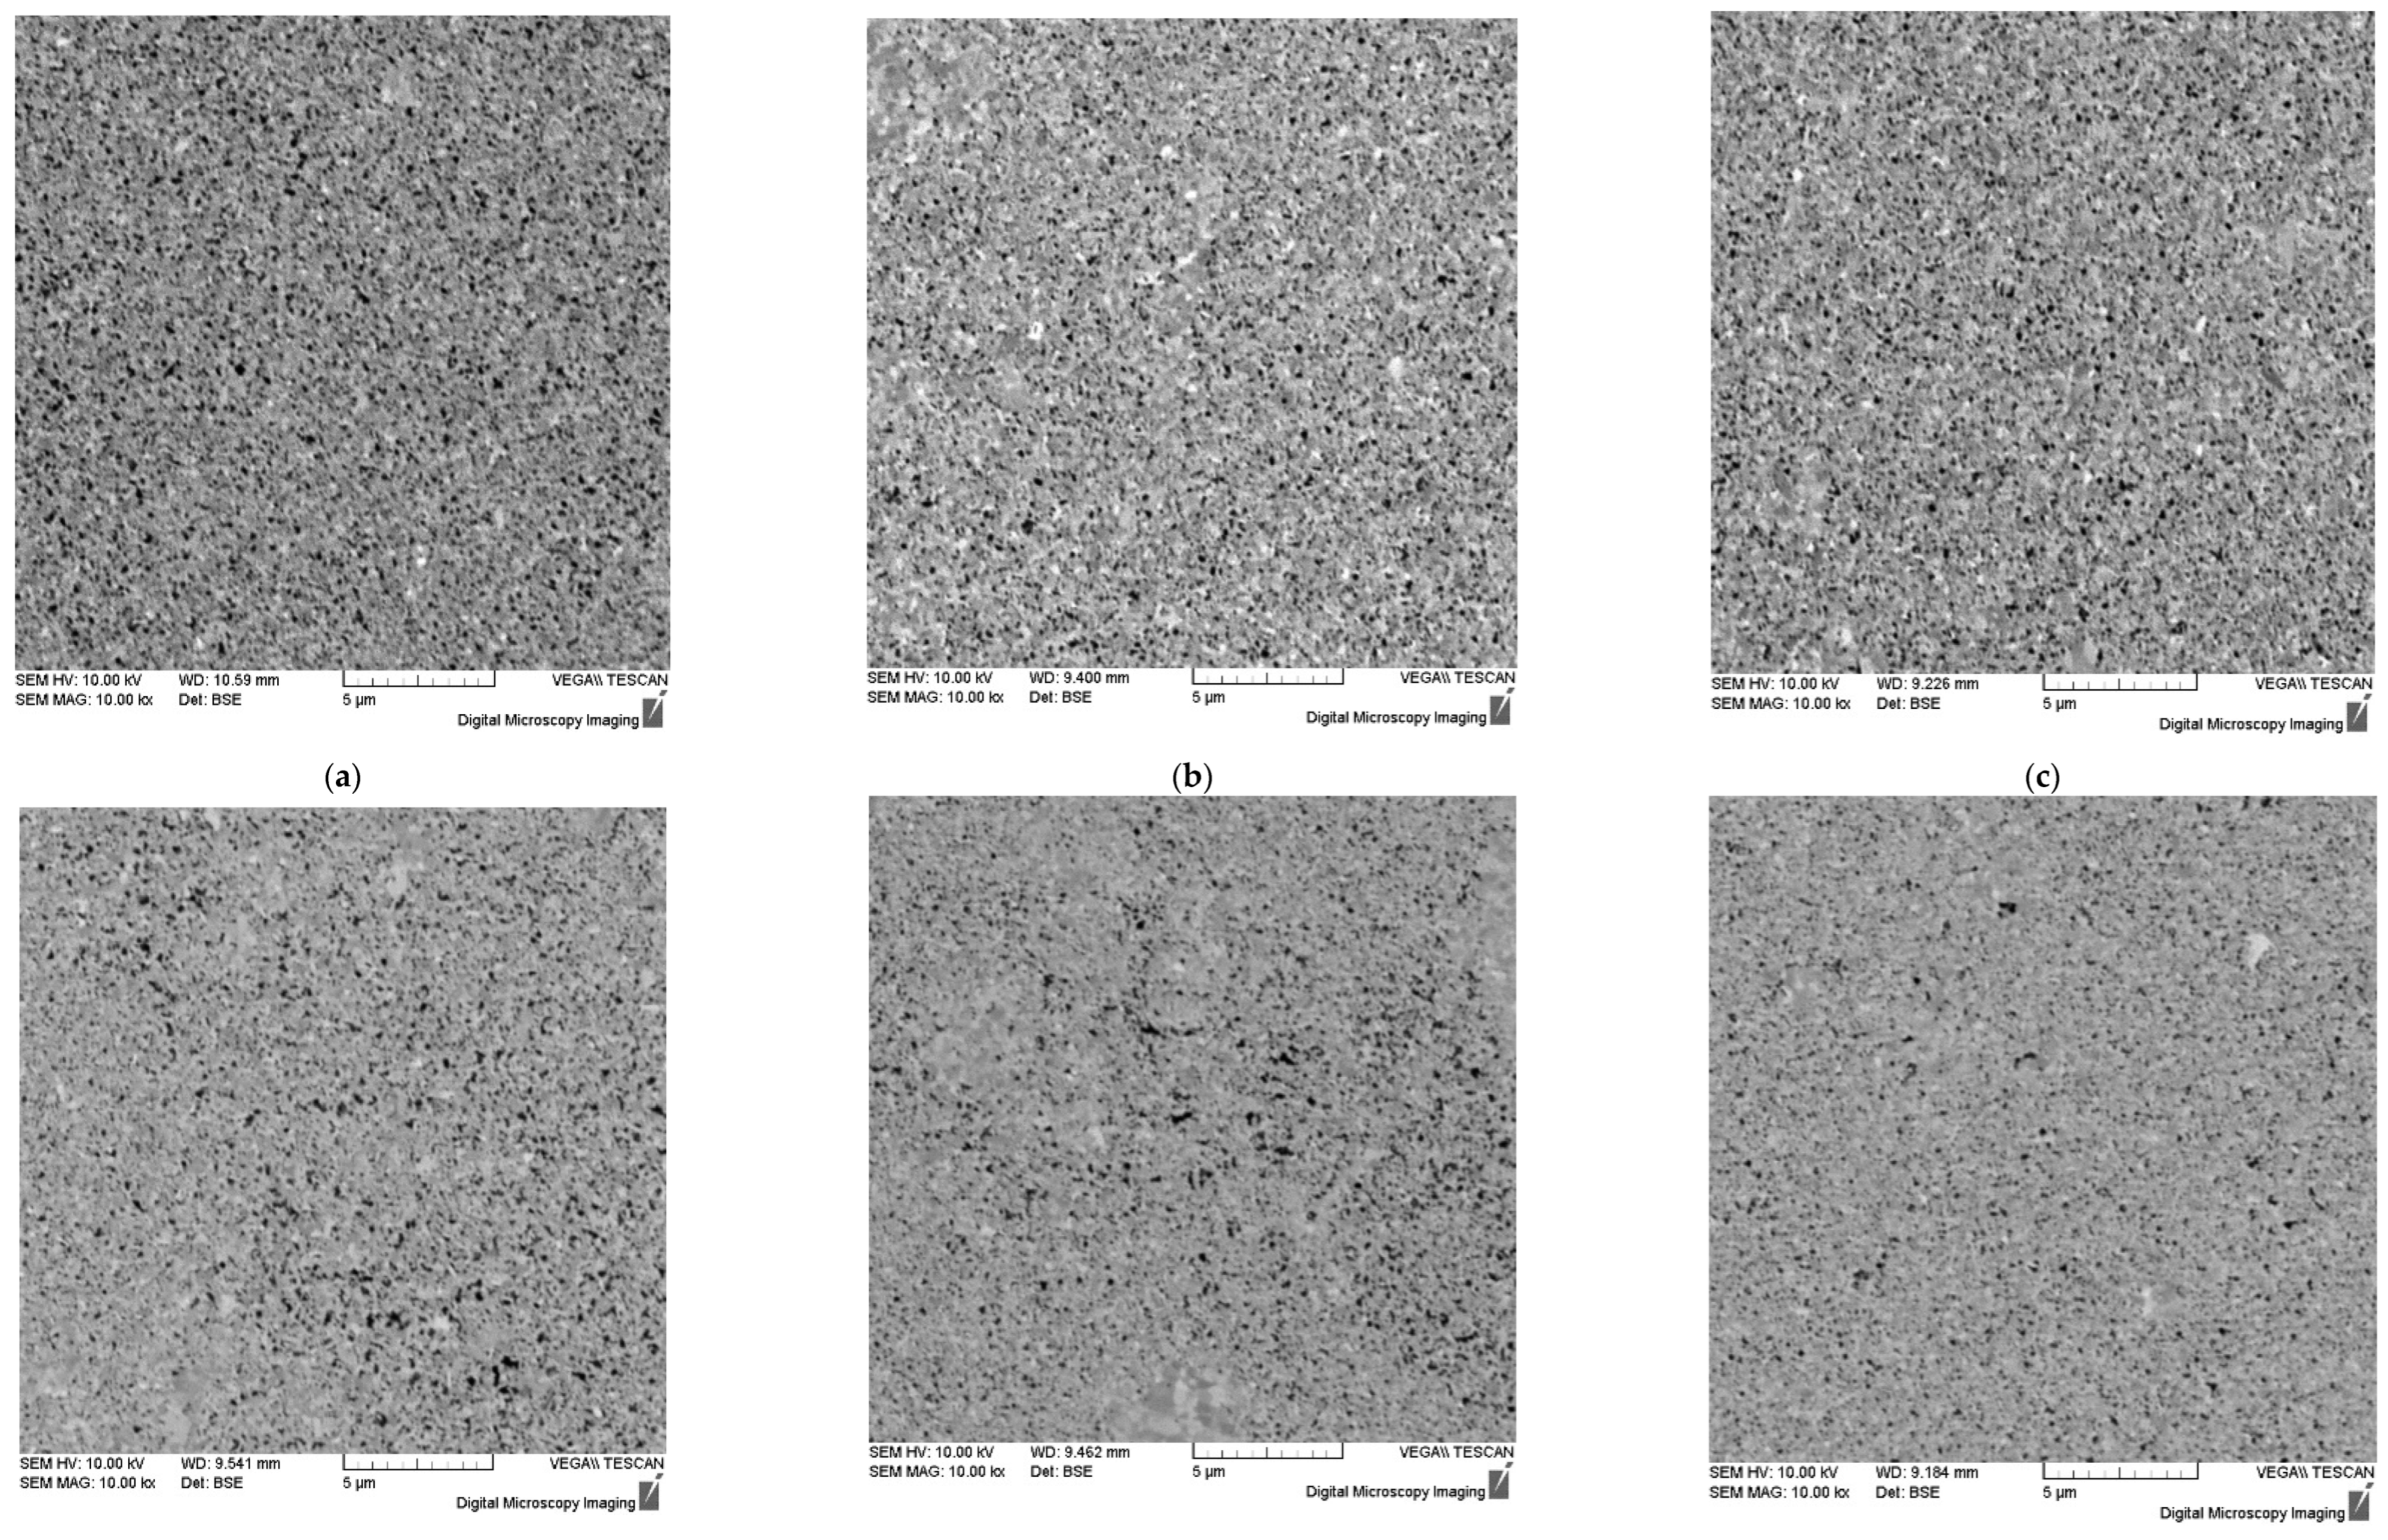
Figure 5.
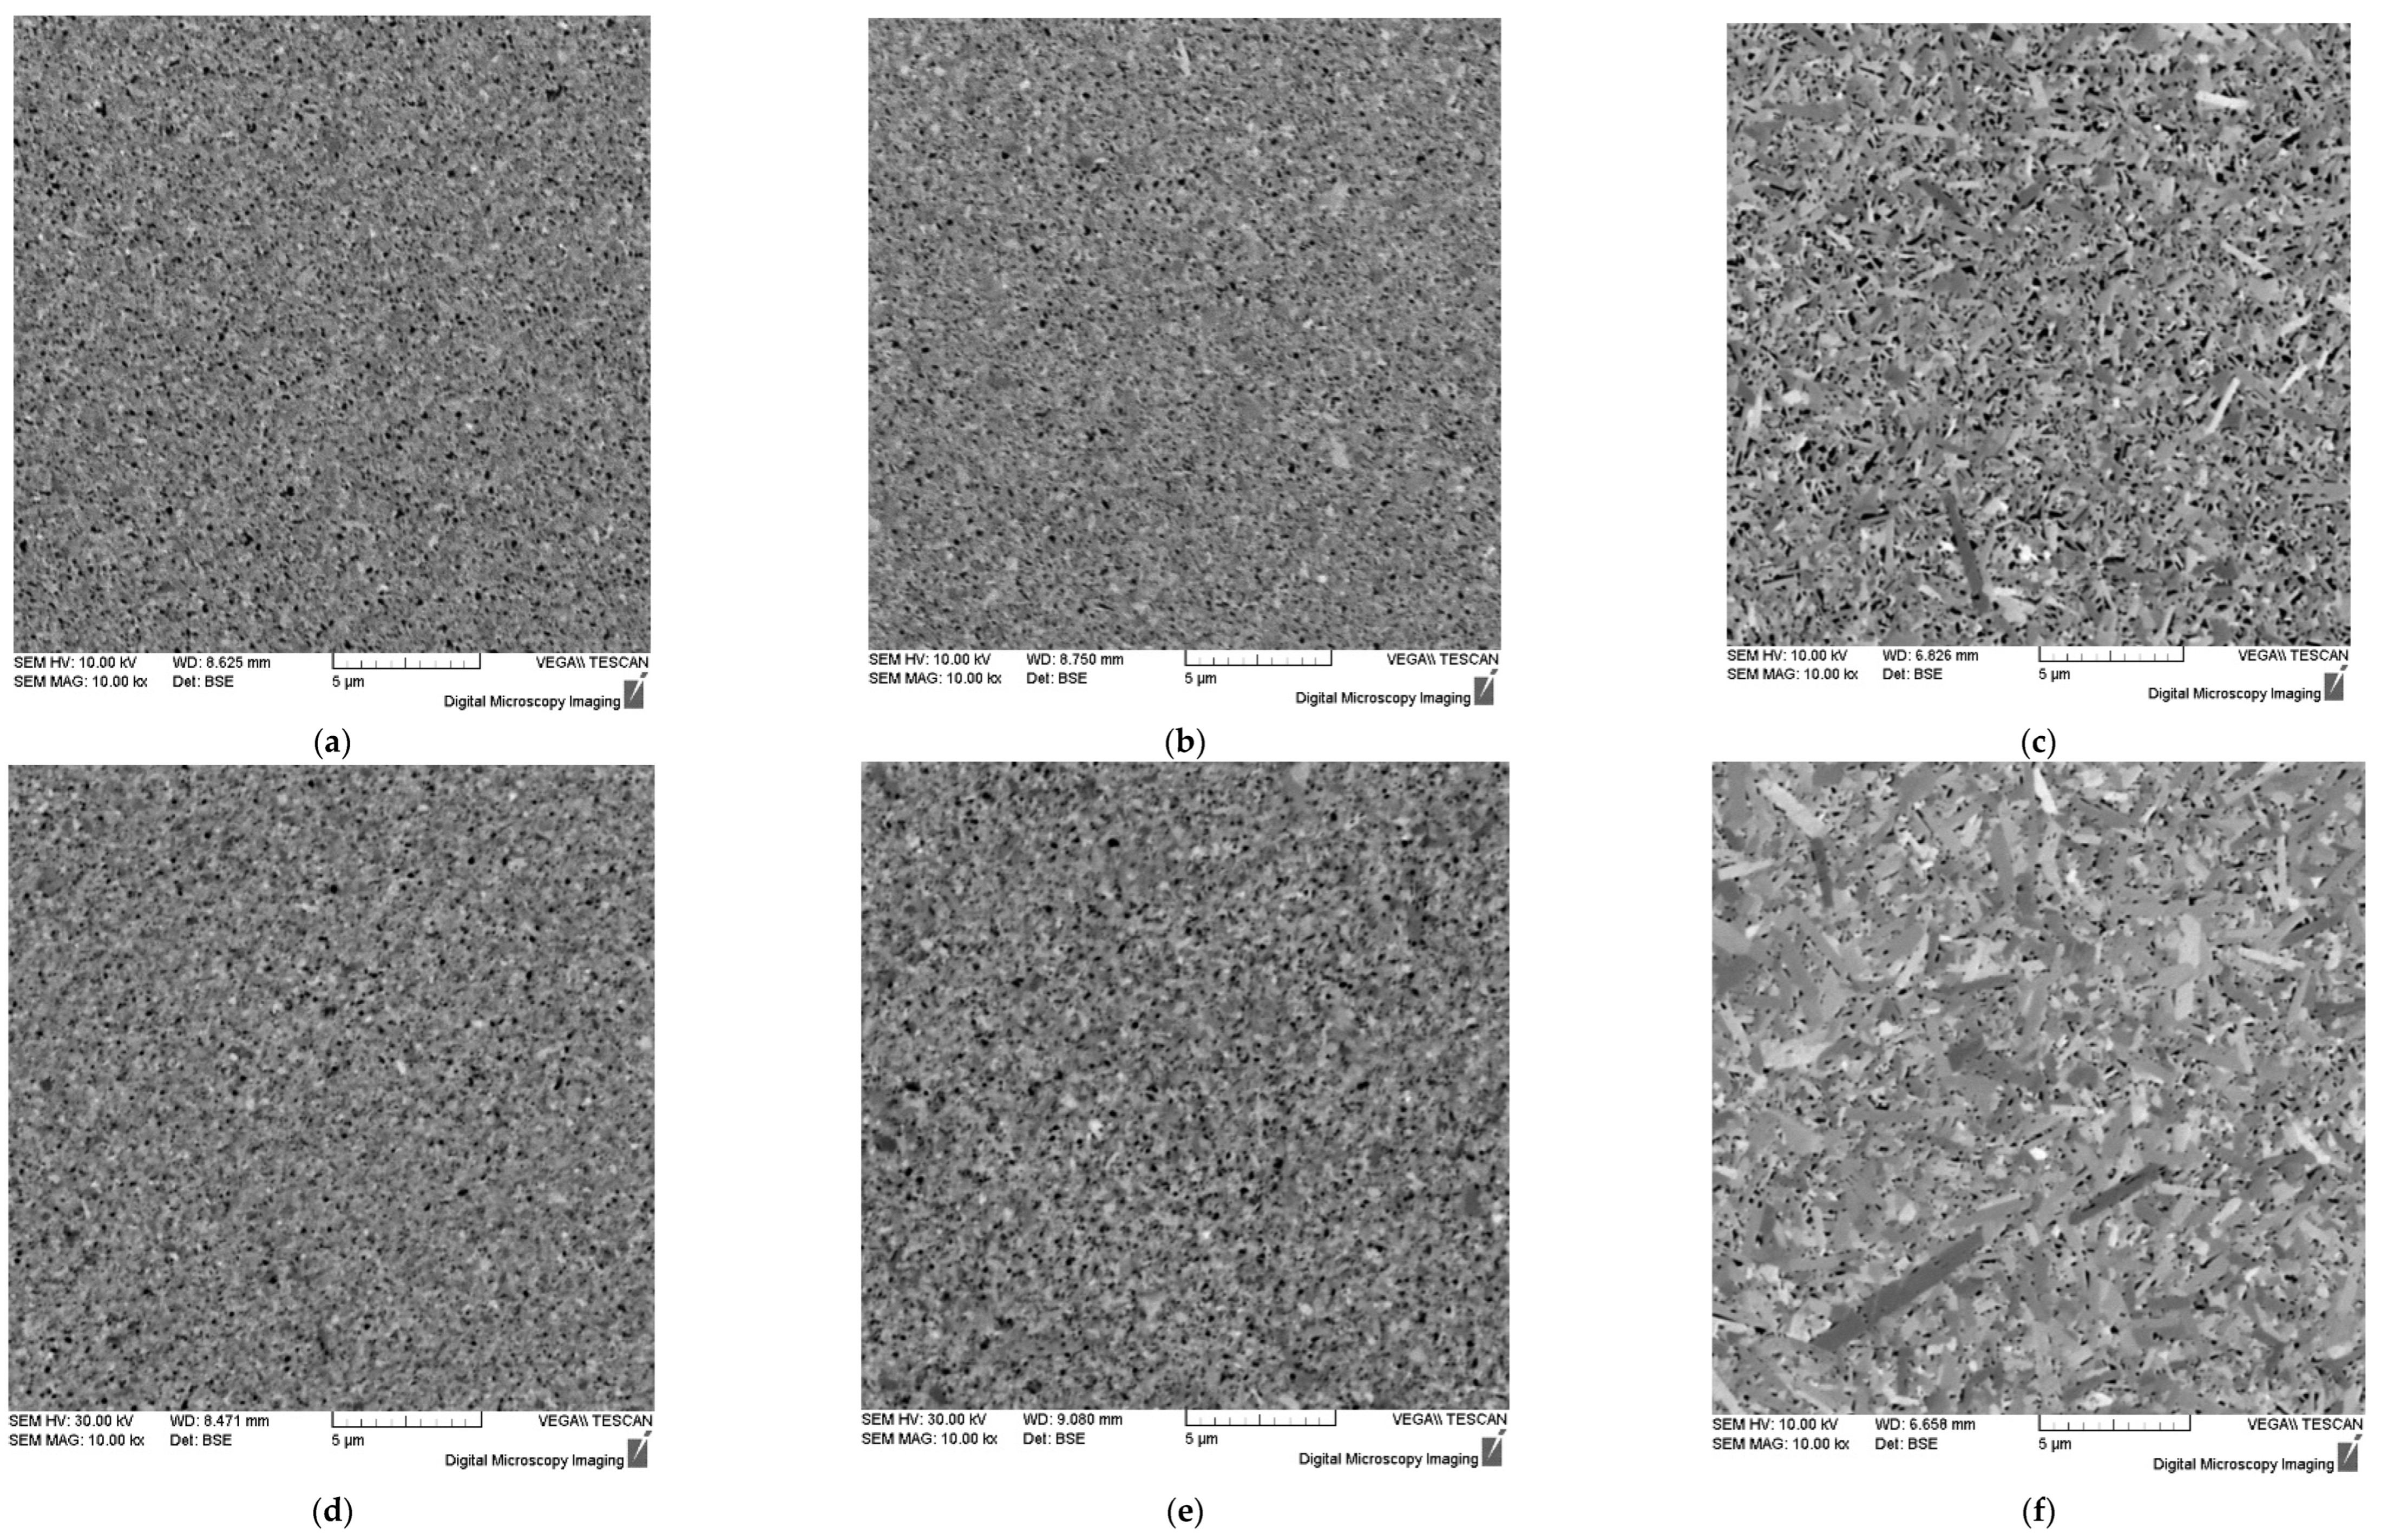
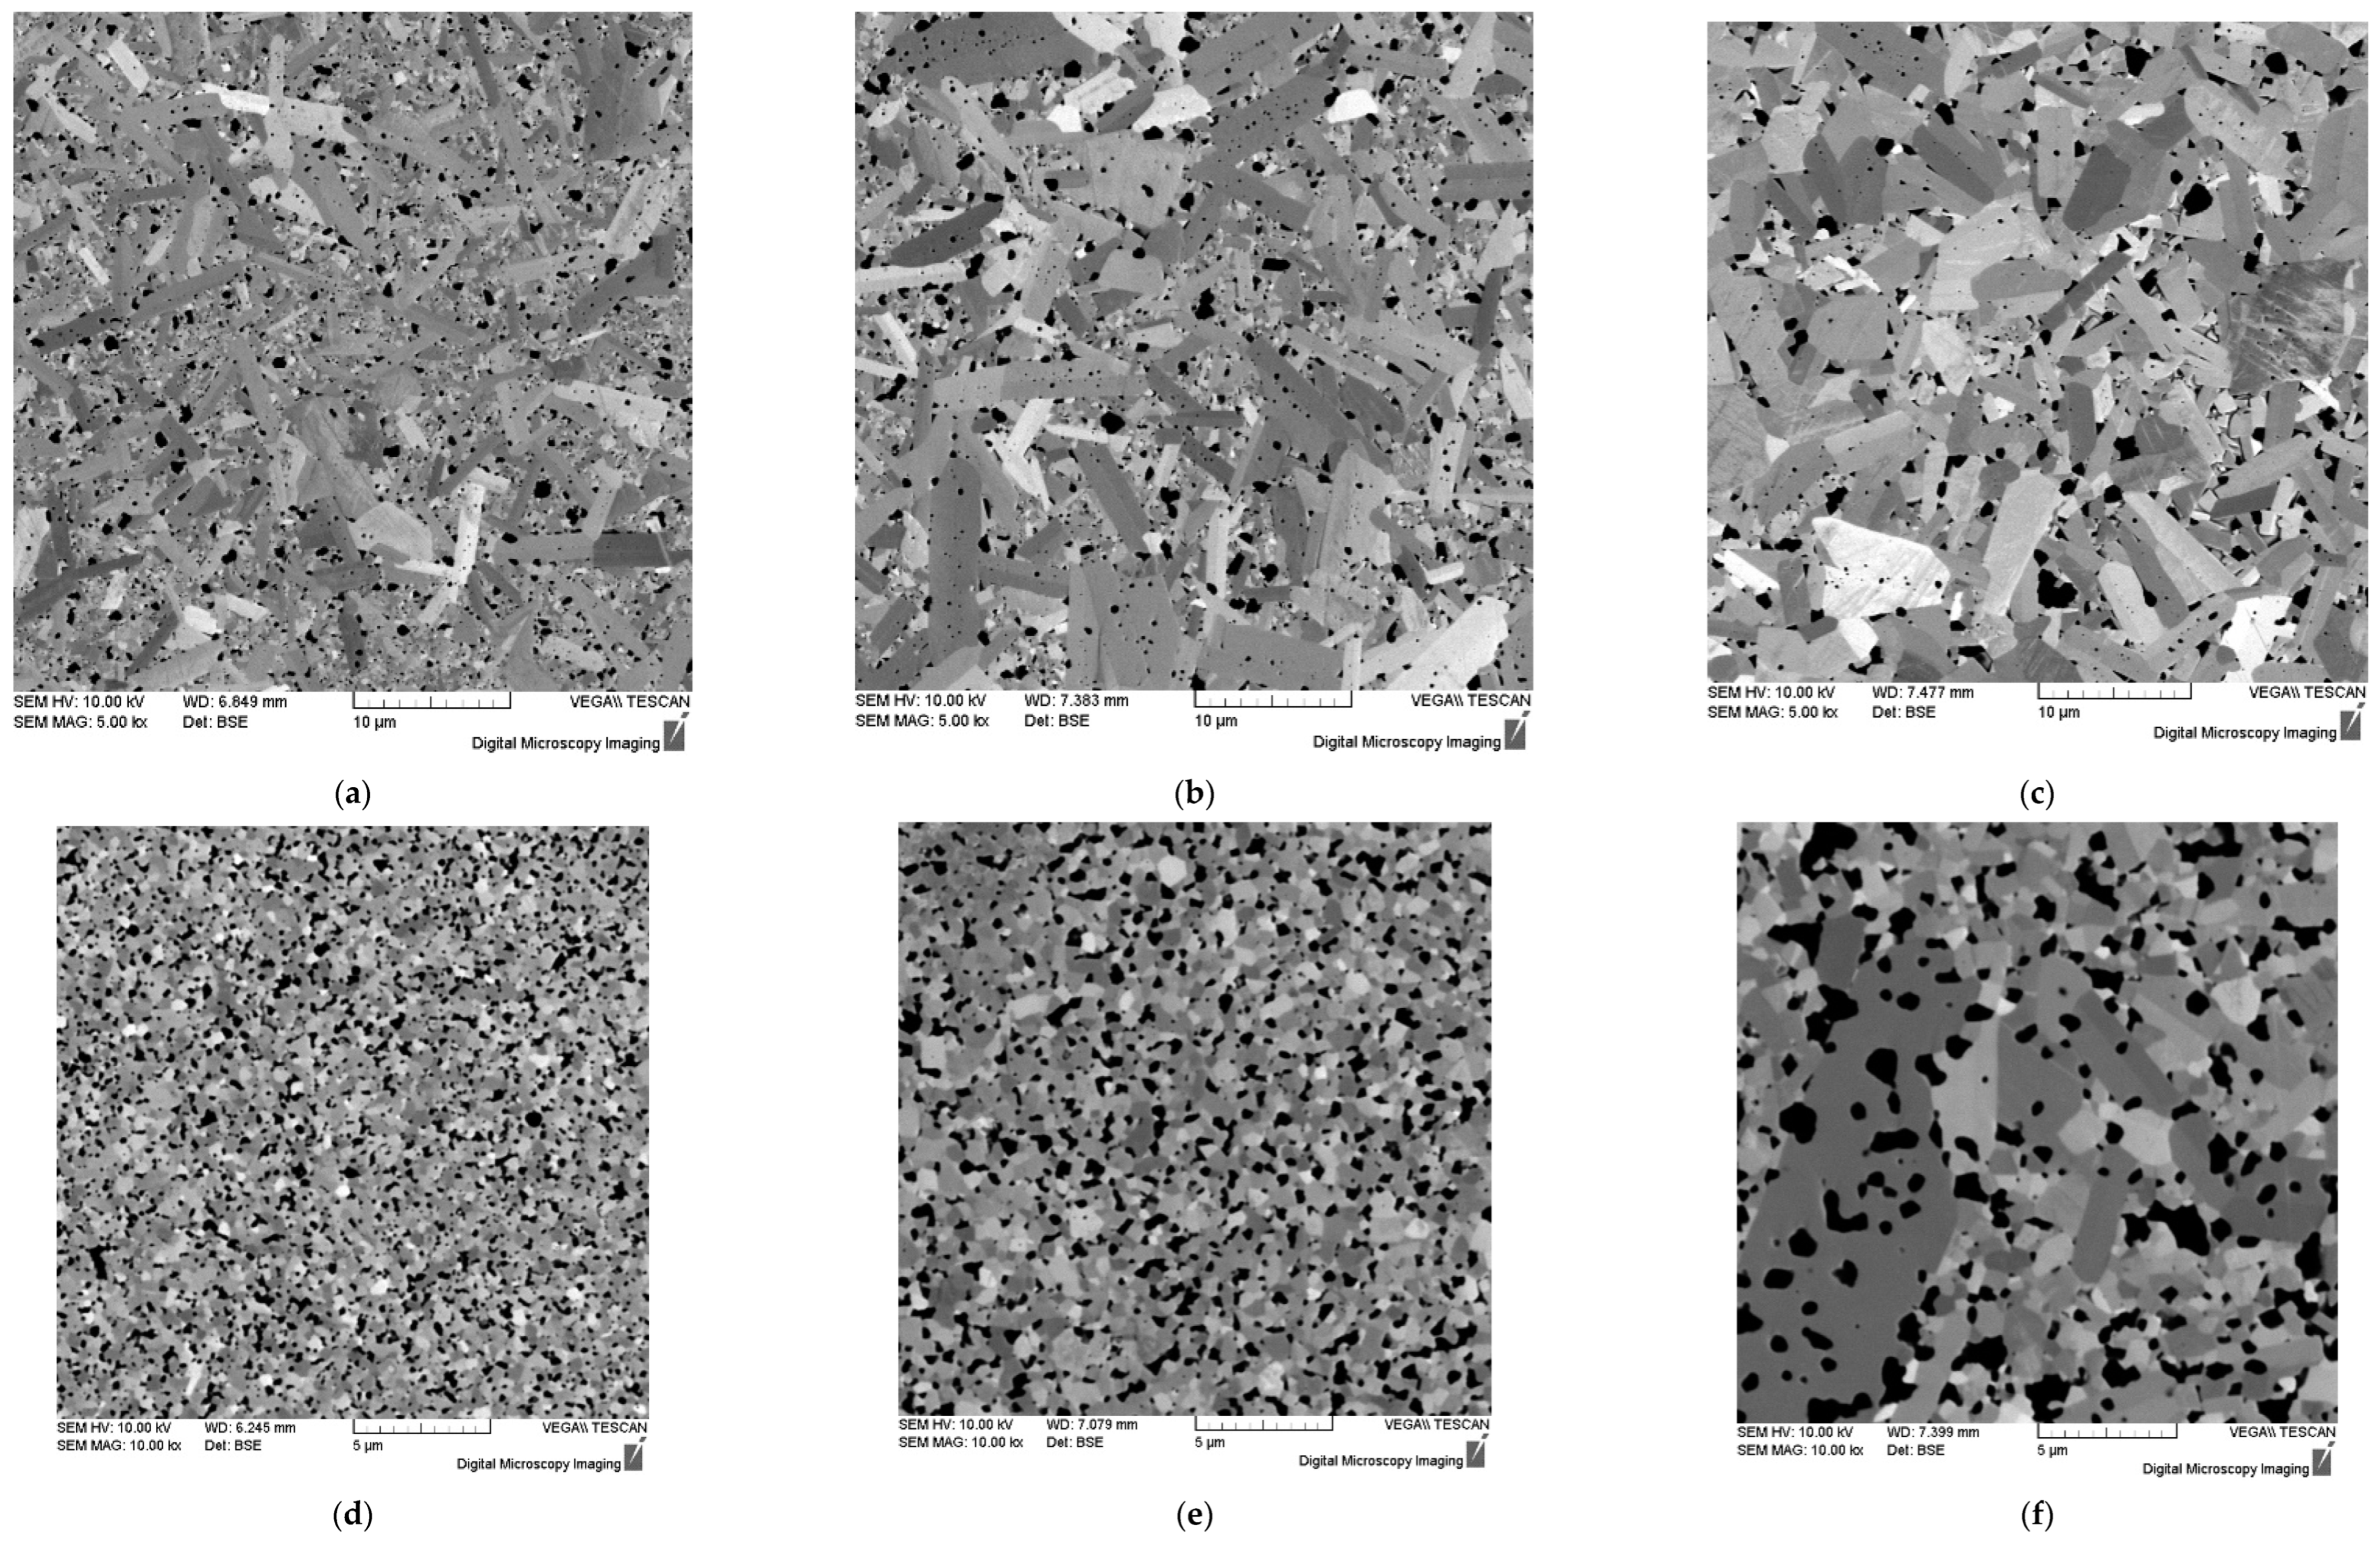
Microstructure of ceramics #1 (
a), #2 (
b), #3 (
c), #4 (
d), #5 (
e), #6 (
f) sintered using different SPS modes (
Table 1). SEM.
Figure 5.
Microstructure of ceramics #1 (
a), #2 (
b), #3 (
c), #4 (
d), #5 (
e), #6 (
f) sintered using different SPS modes (
Table 1). SEM.
Figure 6.
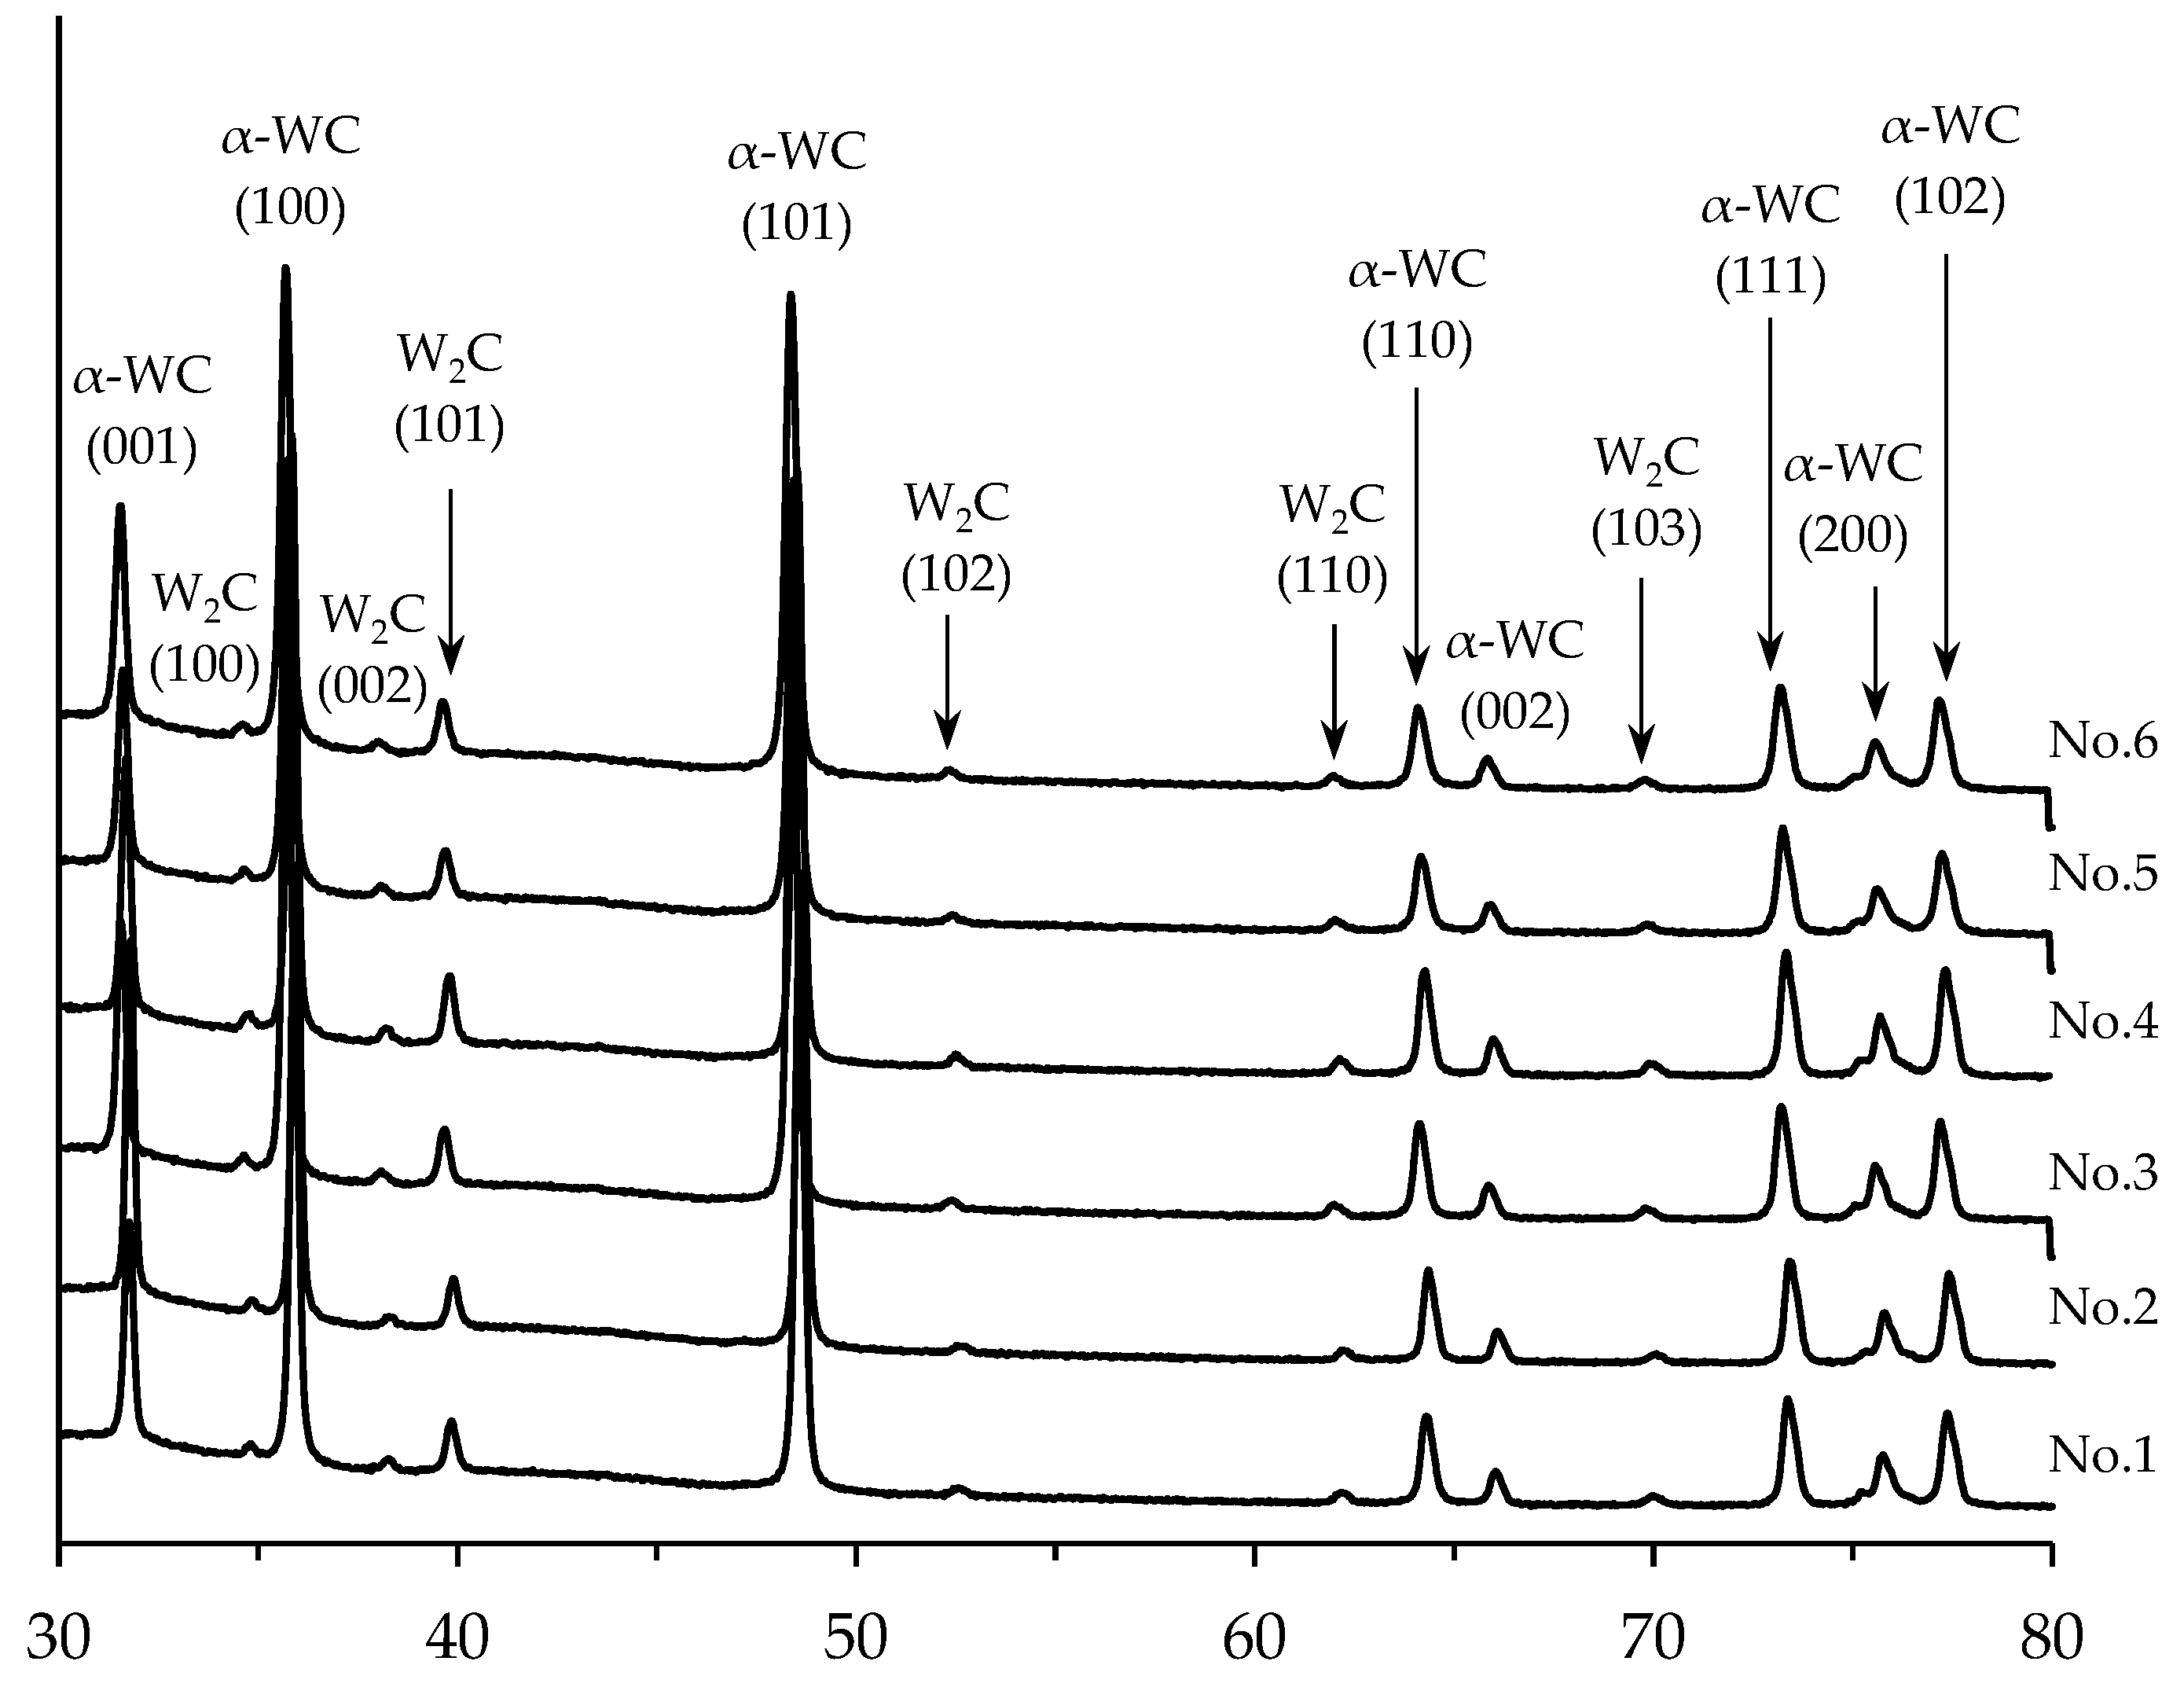
XRD results of tungsten carbide samples. Mode I. Curve numbers stand for ceramic numbers (see
Table 1).
Figure 6.
XRD results of tungsten carbide samples. Mode I. Curve numbers stand for ceramic numbers (see
Table 1).
Figure 7.
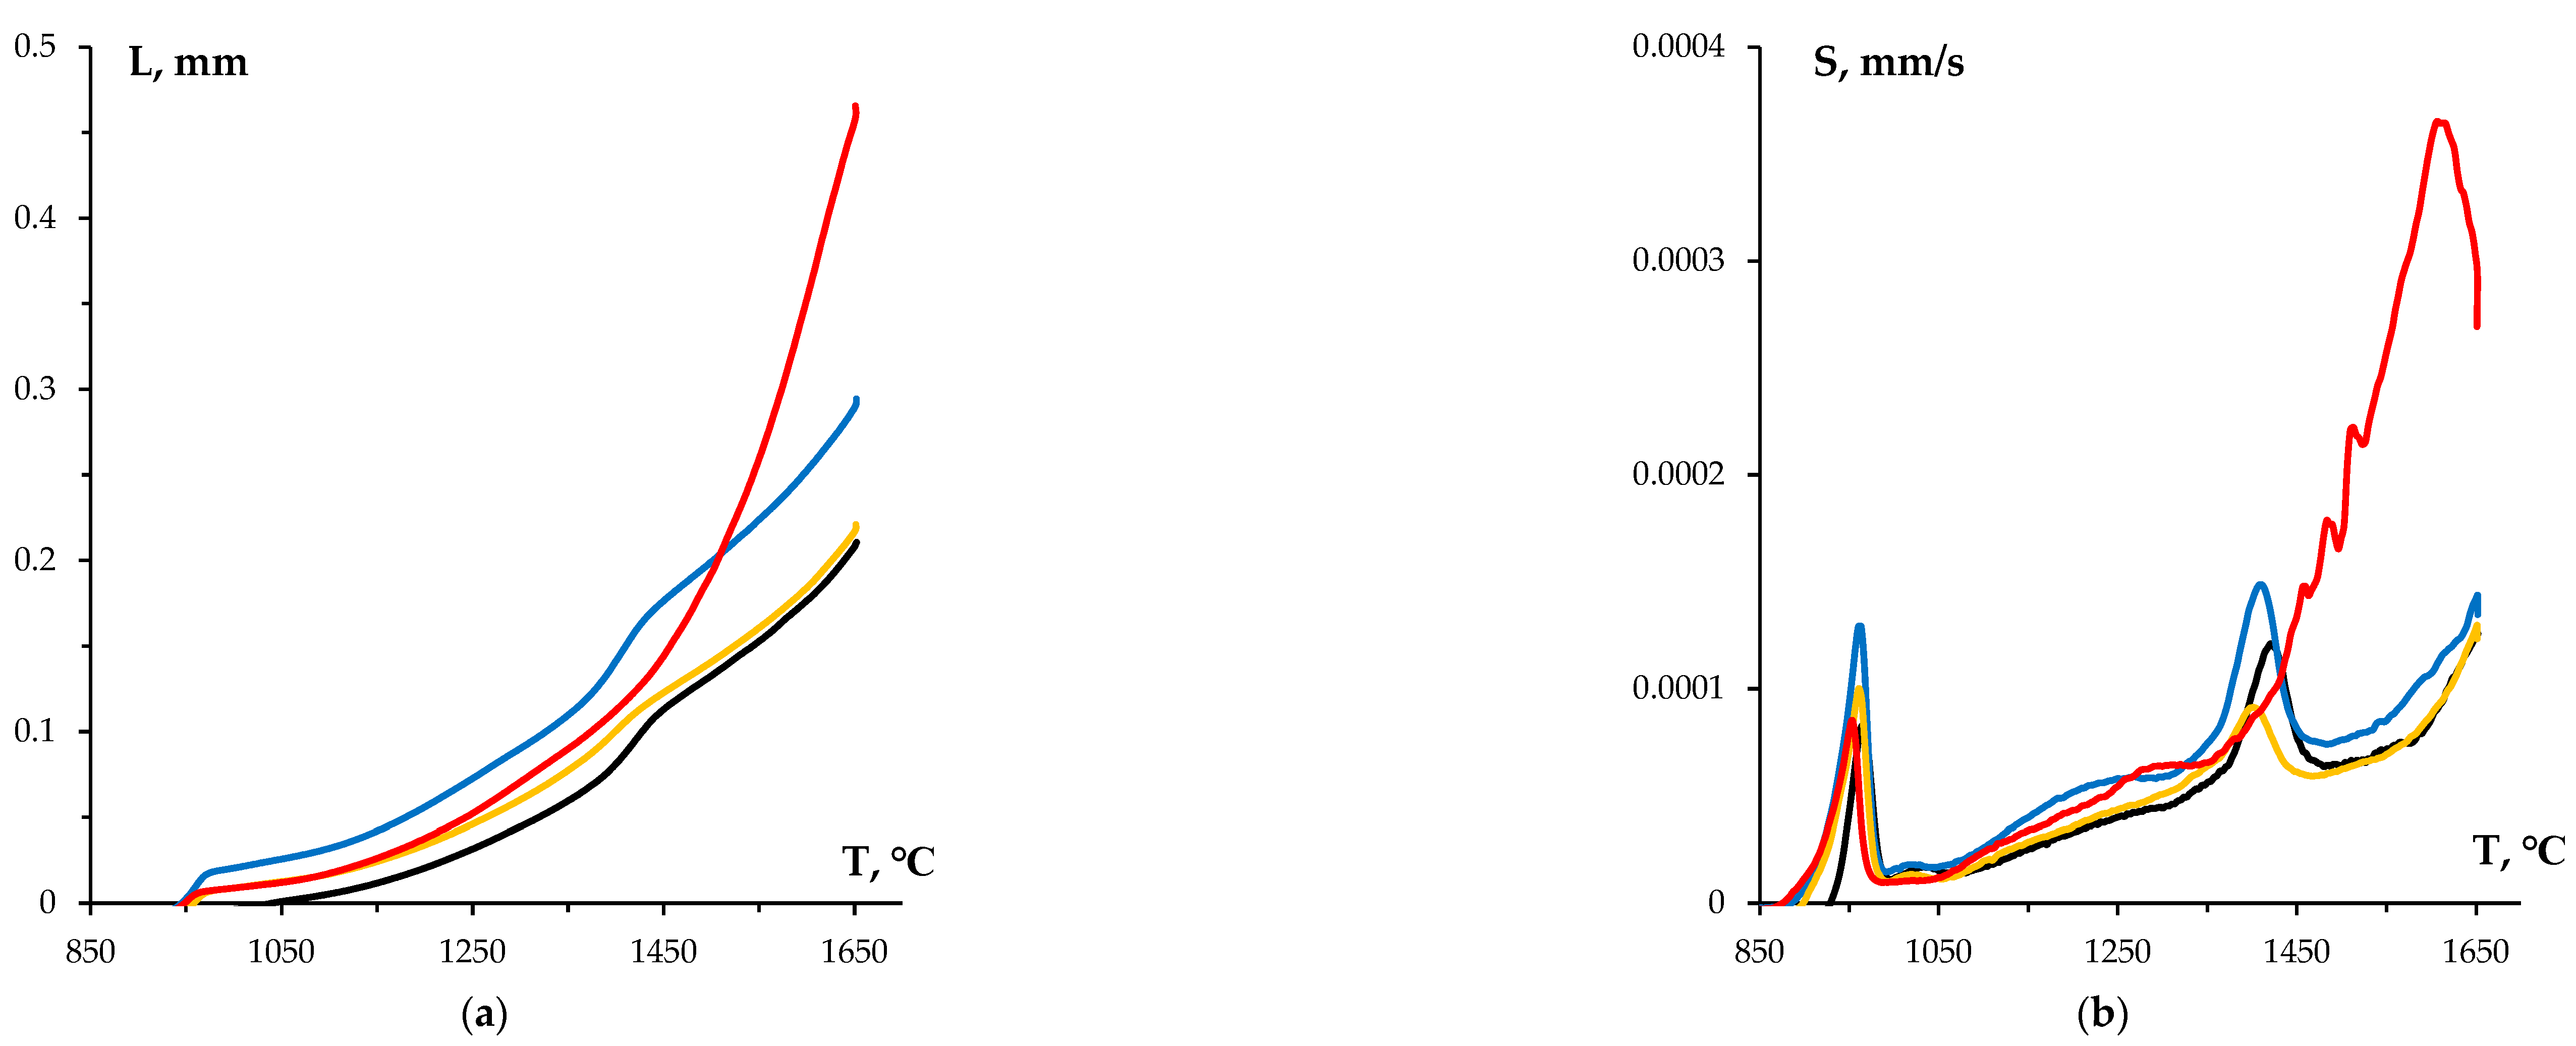
Results of dilatometric studies of WC sintering kinetics. Temperature curves for shrinkage (a) and shrinkage rate (b) of tungsten carbide powders with varying graphite content: the black line stands for the initial WC nanopowder, the blue line shows the WC nanopowder after treatment in a planetary mill, the orange line denotes WC + 0.3% C, while the red line indicates WC + 0.5% C.
Figure 8.
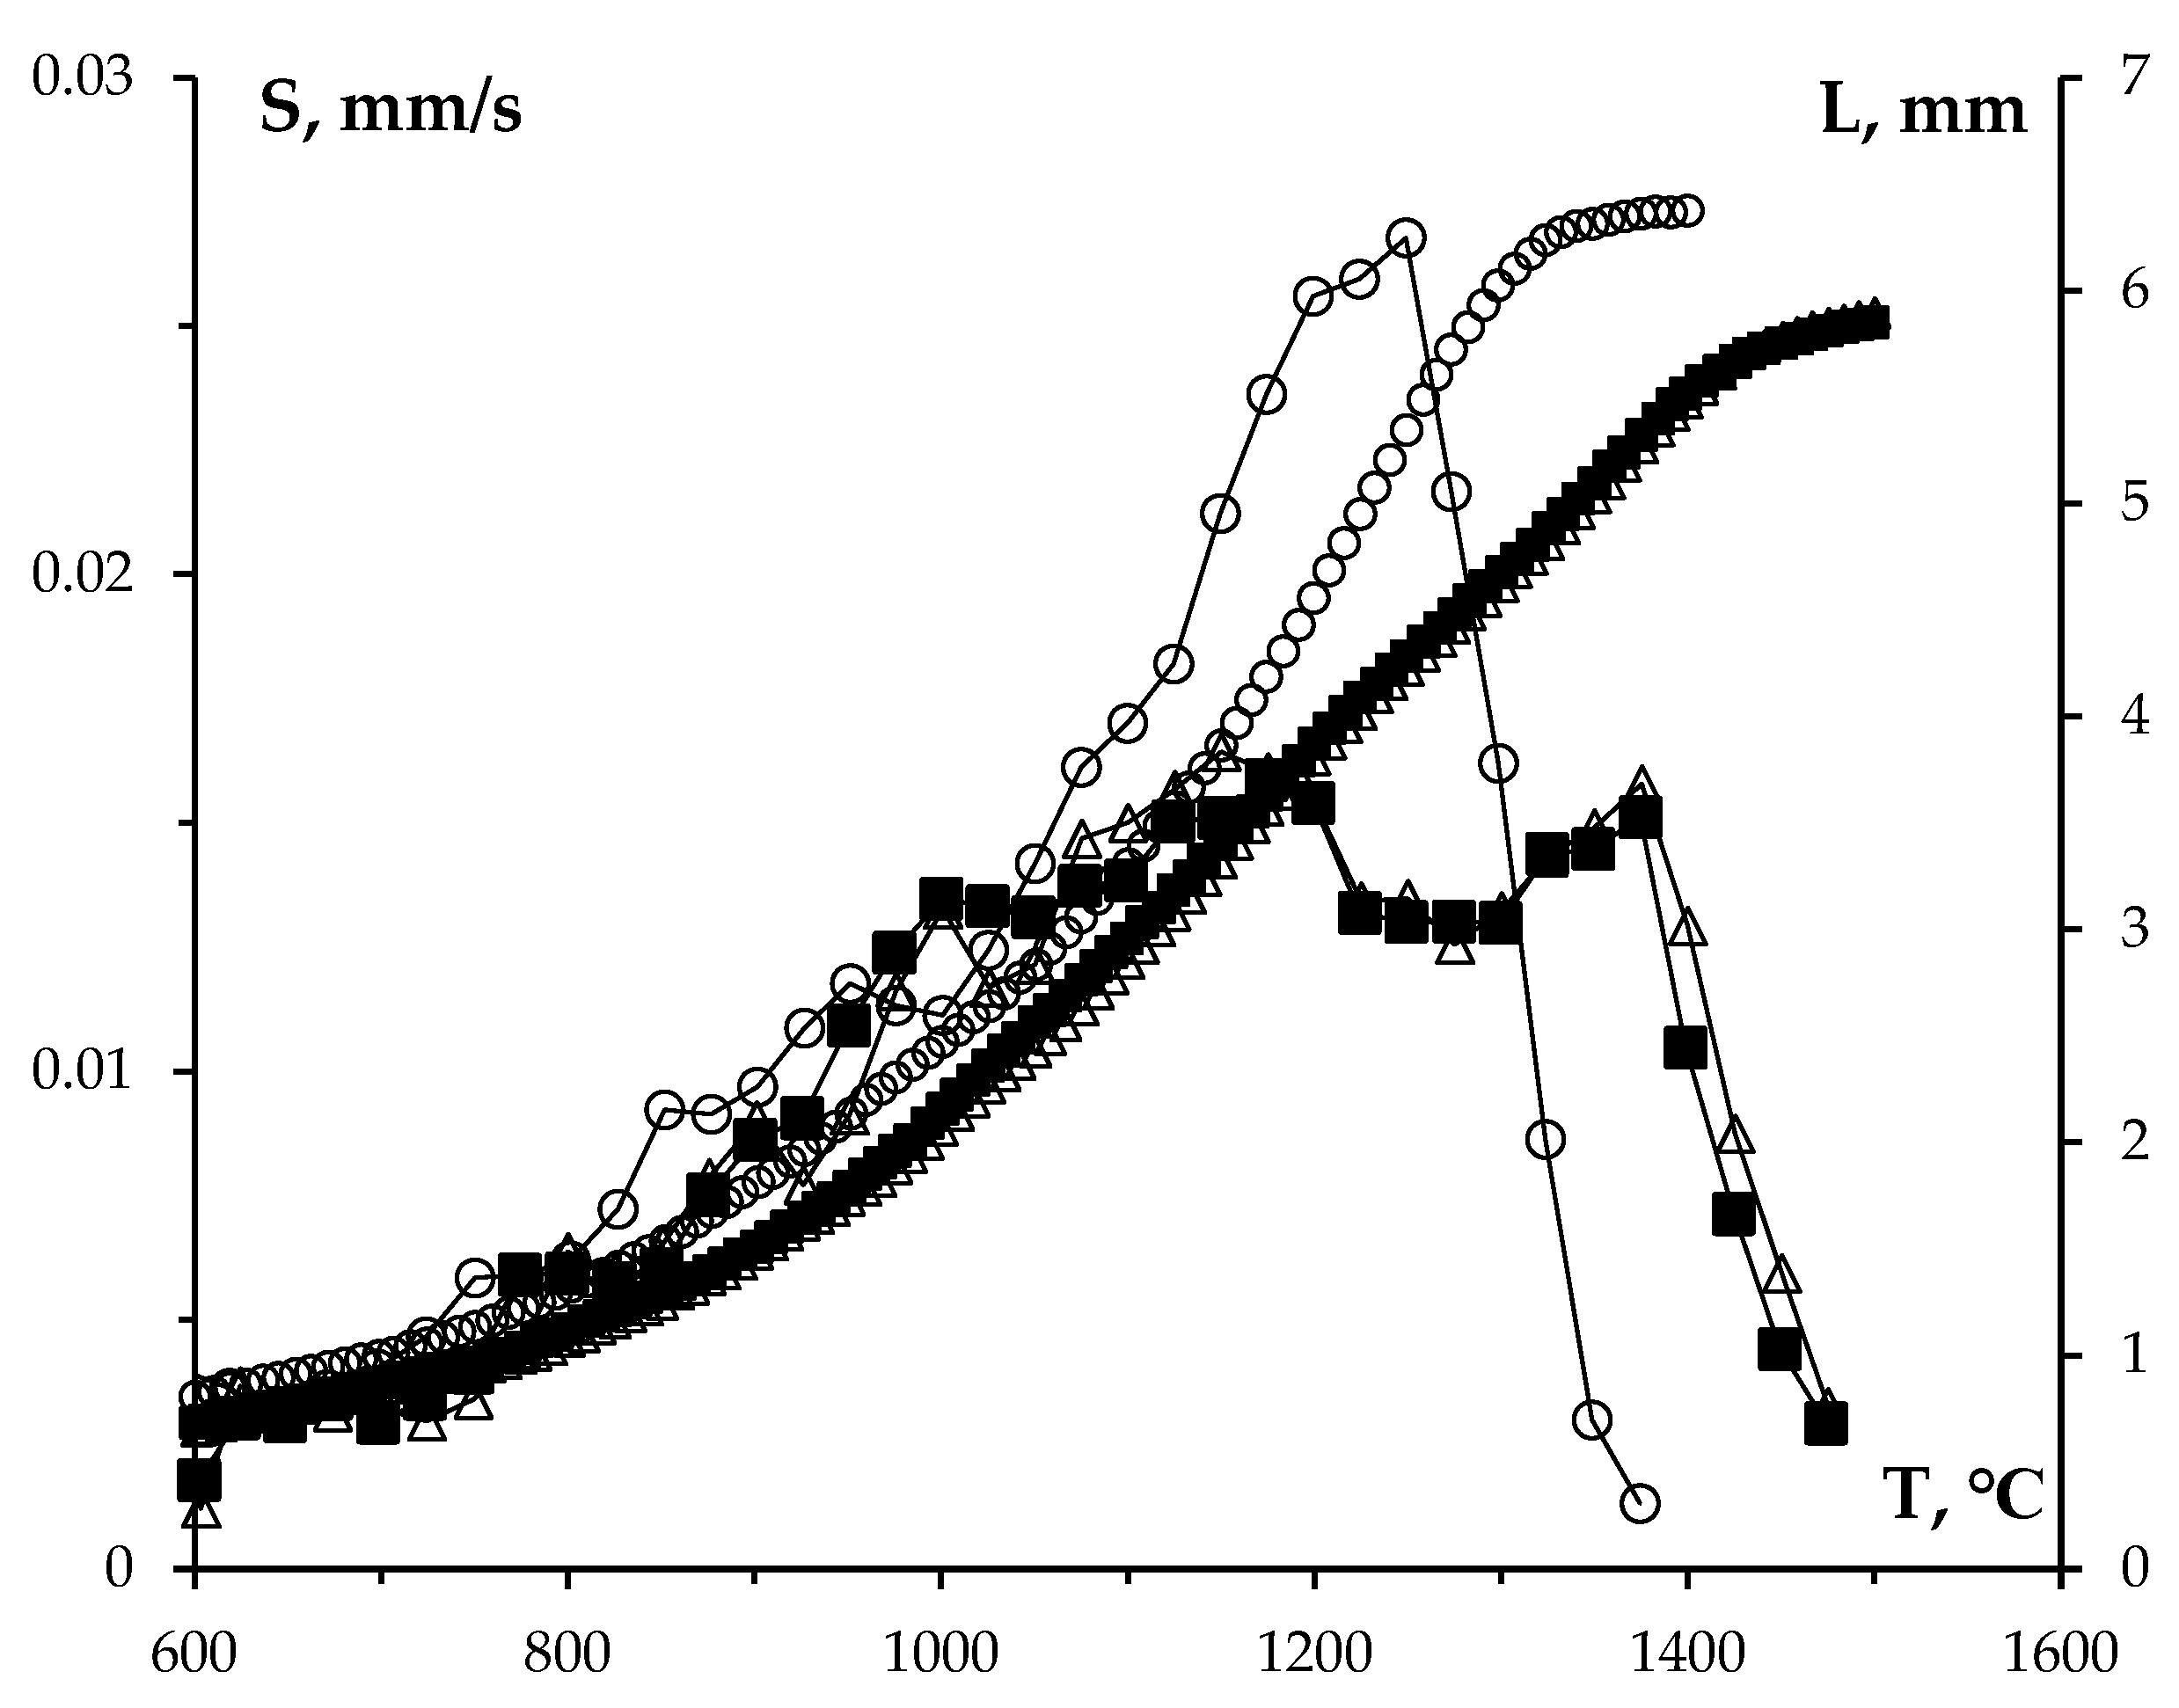
Temperature curves for shrinkage L and shrinkage rate S of WC powders with varying graphite content: ■ – 0%, ▲ – 0.3%, ● – 0.5%.
Figure 8.
Temperature curves for shrinkage L and shrinkage rate S of WC powders with varying graphite content: ■ – 0%, ▲ – 0.3%, ● – 0.5%.
Figure 9.
Microstructure of WC (a, b, c), WC + 0.3% C (d, e, f) and WC + 0.5% C (g, h, i) ceramics with different holding times at Ts: 0 min (a, d, g), 3 min (b, e, h) and 30 min (c, f, i). SEM.
Figure 9.
Microstructure of WC (a, b, c), WC + 0.3% C (d, e, f) and WC + 0.5% C (g, h, i) ceramics with different holding times at Ts: 0 min (a, d, g), 3 min (b, e, h) and 30 min (c, f, i). SEM.
Figure 10.
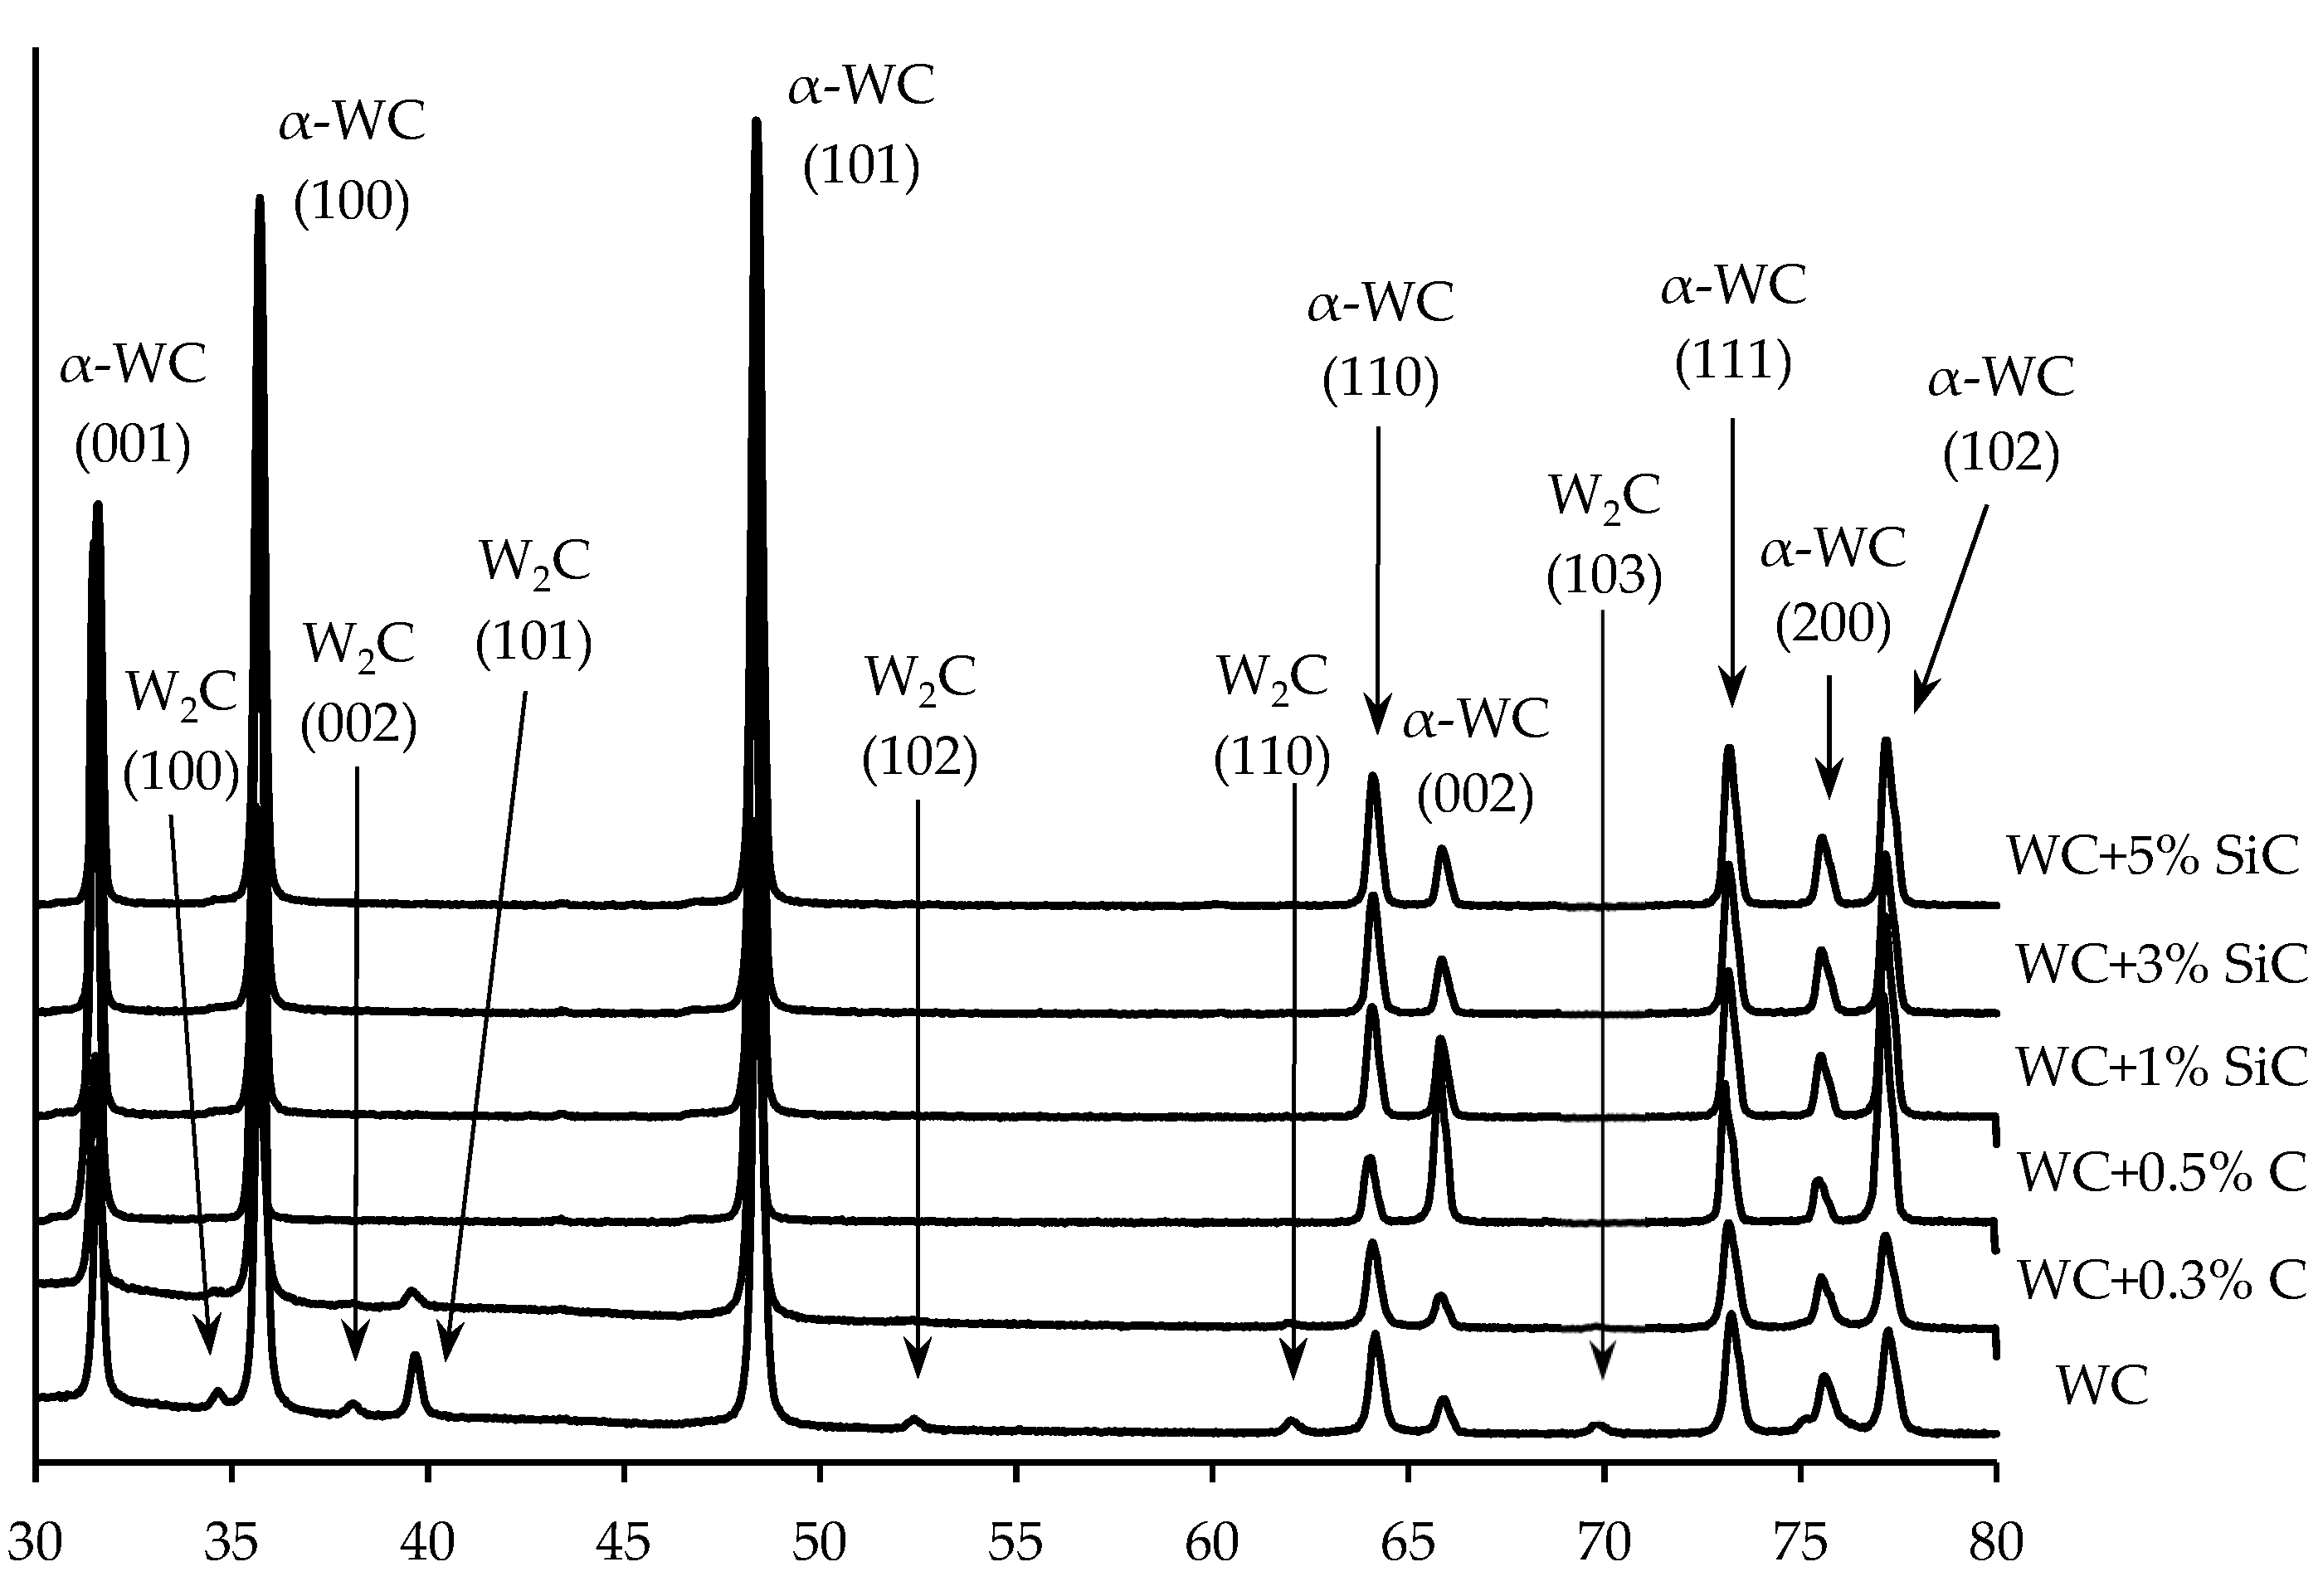
XRD results for WC ceramics with varying graphite content and WC + SiC + 0.3% C ceramics with varying SiC particles content.
Figure 10.
XRD results for WC ceramics with varying graphite content and WC + SiC + 0.3% C ceramics with varying SiC particles content.
Figure 11.
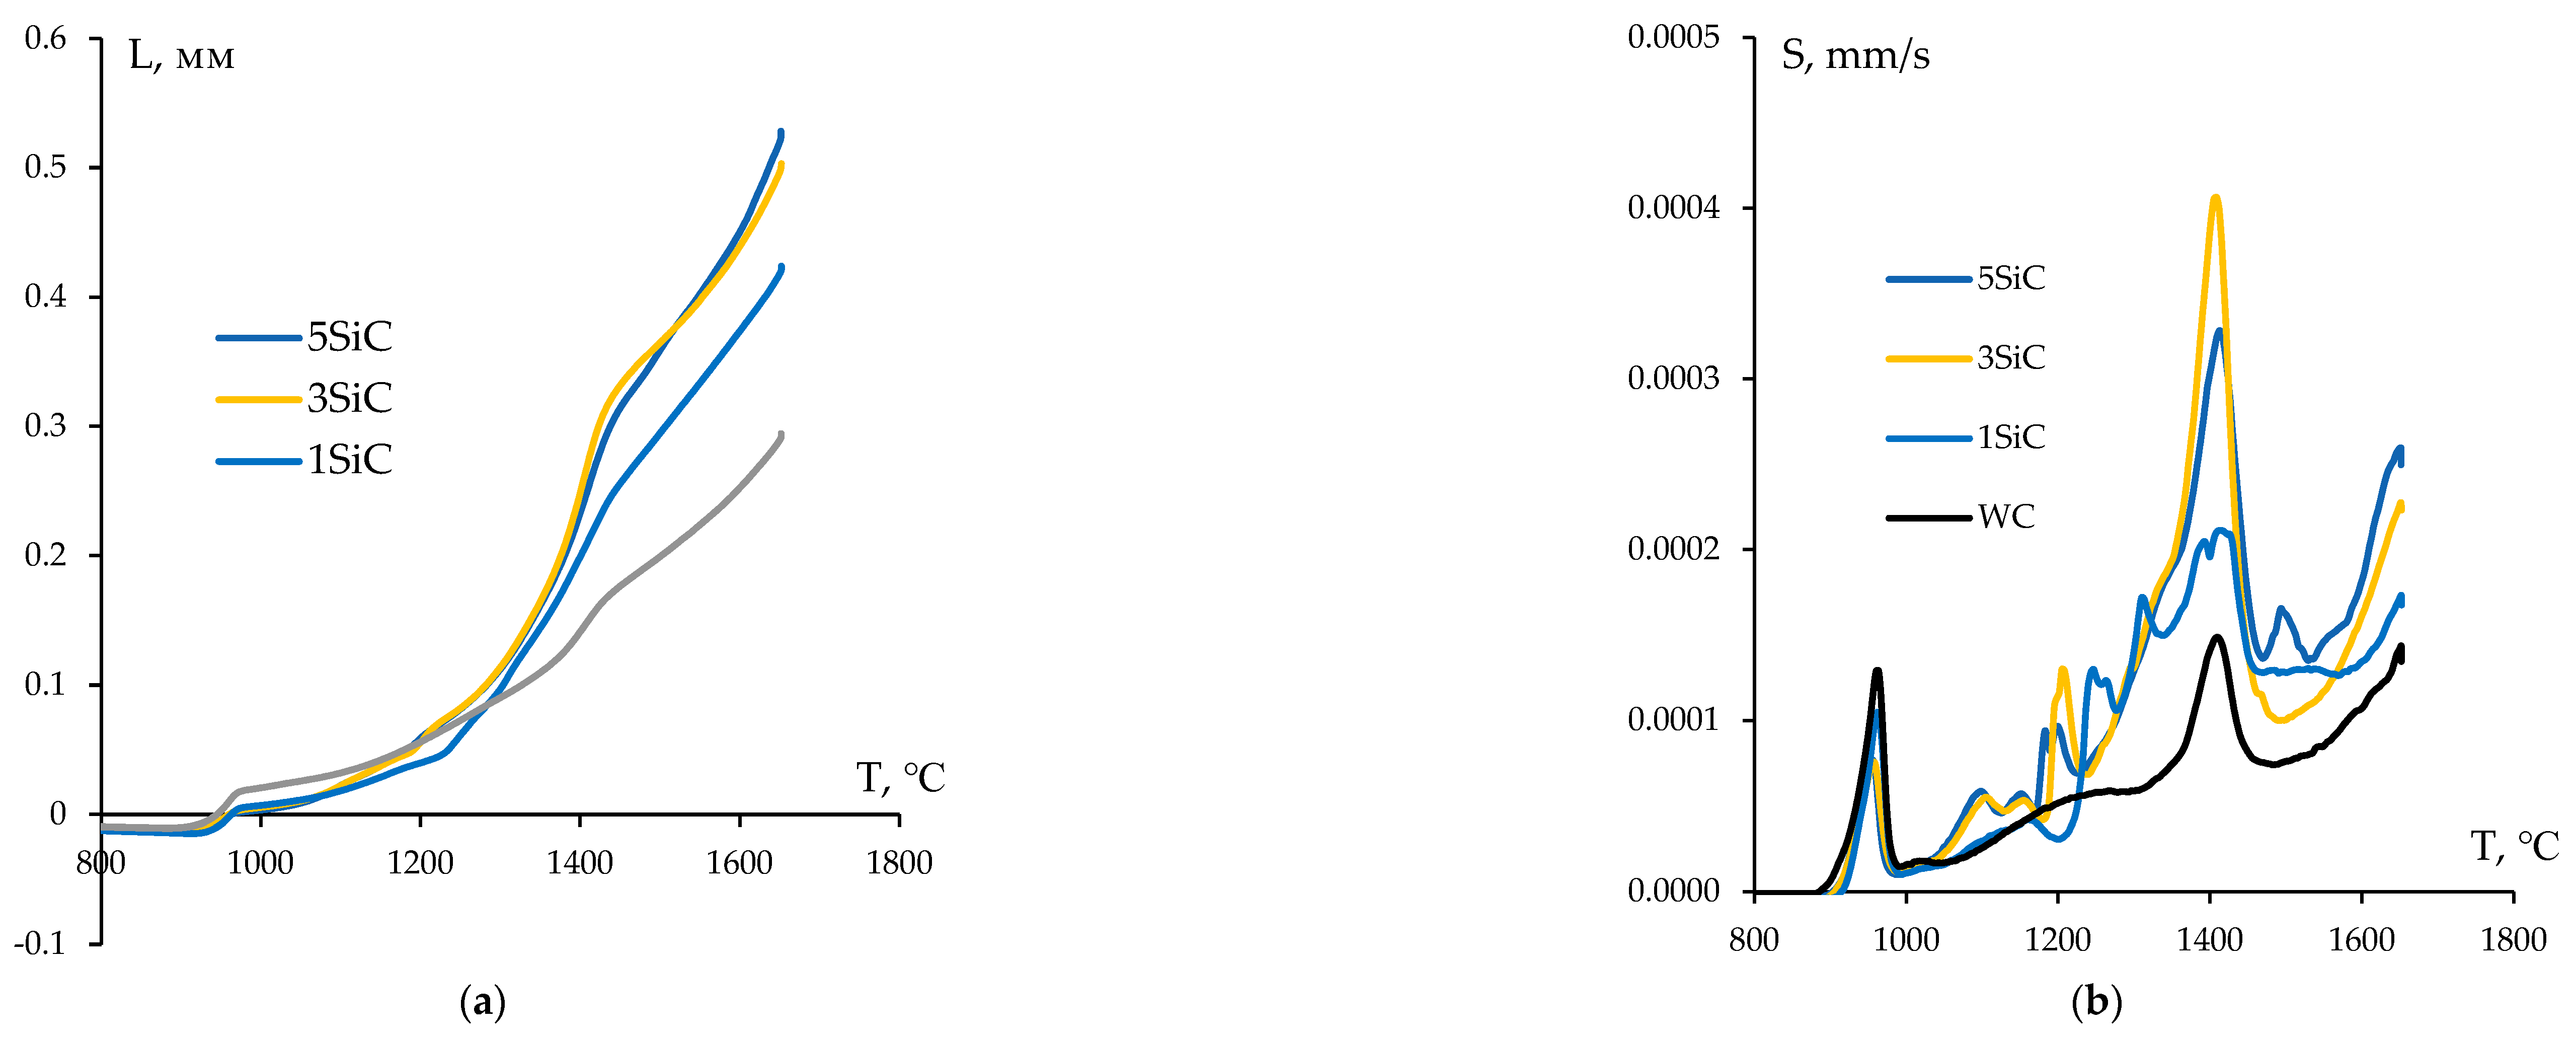
Results of dilatometric studies of the CPS kinetics of WC + SiC powders. Temperature dependences for shrinkage (a) and shrinkage rate (b) in tungsten carbide powders with varying SiC content.
Figure 11.
Results of dilatometric studies of the CPS kinetics of WC + SiC powders. Temperature dependences for shrinkage (a) and shrinkage rate (b) in tungsten carbide powders with varying SiC content.
Figure 12.
Dependencies of shrinkage L (shaded markers) and shrinkage rate S (light markers) on heating temperatures of WC + 0.3% C powders with varying SiC content: ● – 0%, ♦ - 1%, ■ – 3%, ▲ – 5% SiC.
Figure 12.
Dependencies of shrinkage L (shaded markers) and shrinkage rate S (light markers) on heating temperatures of WC + 0.3% C powders with varying SiC content: ● – 0%, ♦ - 1%, ■ – 3%, ▲ – 5% SiC.
Figure 13.
Microstructure of WC + 0.3% C ceramics with 1% (a, b, c), 3% (d, e, f), 5% SiC (g, h, i) obtained by SPS exposed for ts = 0 min (a, d, g), 3 min (b, e, h) and 30 min (c, f, i) at Ts = 1350℃. SEM.
Figure 13.
Microstructure of WC + 0.3% C ceramics with 1% (a, b, c), 3% (d, e, f), 5% SiC (g, h, i) obtained by SPS exposed for ts = 0 min (a, d, g), 3 min (b, e, h) and 30 min (c, f, i) at Ts = 1350℃. SEM.
Figure 14.
Hardness indentation images during hardness and fracture toughness tests of WC + 0.3% C ceramics with 1% (a, b, c), 3% (d, e, f), 5% SiC (g, h, i) obtained by SPS with isothermal holding for ts = 0 min (a, d, g), 3 min (b, e, h) and 30 min (c, f, i) at Ts = 1350℃. SEM.
Figure 14.
Hardness indentation images during hardness and fracture toughness tests of WC + 0.3% C ceramics with 1% (a, b, c), 3% (d, e, f), 5% SiC (g, h, i) obtained by SPS with isothermal holding for ts = 0 min (a, d, g), 3 min (b, e, h) and 30 min (c, f, i) at Ts = 1350℃. SEM.
Figure 15.
Temperature-shrinkage curves for WC-C (
a) and WC + SiC (
b) powders in ln(T∂ε/∂T) – T
m/T coordinates. SPS activation energy calculation for Stage II. For
Figure 15a: Graphite content: ● – 0.5%, ▲ – 0.3%, ■ – 0%. For.
Figure 15b: SiC content: ● – 0%, ♦ - 1%, ■ – 3%, ▲ – 5%.
Figure 15.
Temperature-shrinkage curves for WC-C (
a) and WC + SiC (
b) powders in ln(T∂ε/∂T) – T
m/T coordinates. SPS activation energy calculation for Stage II. For
Figure 15a: Graphite content: ● – 0.5%, ▲ – 0.3%, ■ – 0%. For.
Figure 15b: SiC content: ● – 0%, ♦ - 1%, ■ – 3%, ▲ – 5%.
Figure 16.
Temperature-shrinkage curves for WC-C powders in ln(T∂ε/∂T) – Tm/T coordinates. CPS activation energy calculation for Stage II. Dilatometric data analysis.
Figure 16.
Temperature-shrinkage curves for WC-C powders in ln(T∂ε/∂T) – Tm/T coordinates. CPS activation energy calculation for Stage II. Dilatometric data analysis.
Figure 17.
Dependences of compaction on heating temperature in ln(ln(αρ/ρ
th/(1-ρ/ρ
th) – T
m/T coordinates for WC ceramics with varying graphite content (
a) and for WC + SiC + 0.3% С ceramics with silicon carbide particles content (
b). For
Figure 17a: ■ – 0%, ▲ – 0.3%, ● – 0.5%. For
Figure 17b: : ● – 0%, ♦ - 1%, ■ – 3%, ▲ – 5%. SPS activation energy calculation at Stage III.
Table 1.
Sintering modes and characteristics of tungsten carbide samples. Mode I.
Table 1.
Sintering modes and characteristics of tungsten carbide samples. Mode I.
| Ceramics No. |
1 |
2 |
3 |
4 |
5 |
6 |
| Powder characteristics |
| Carbon concentration, % wt. |
6.26 |
| Oxygen concentration, % wt. |
0.64 |
| α-WC content, % wt. |
100 |
| SPS modes |
| Stress during prepressing, MPa |
0 |
0 |
0 |
350 |
0 |
350 |
| Applied stress, MPa |
70 |
70 |
70 |
70 |
70 |
70 |
| Heating rate, ℃/min |
100 |
100 |
100 |
100 |
10 |
10 |
| Holding time at 950℃, min |
0 |
0 |
15 |
15 |
15 |
15 |
| Sintering completion temperature Ts, ℃ |
1520 |
1520 |
1520 |
1520 |
1440 |
1440 |
| Holding time at Ts, min |
0 |
3 |
3 |
3 |
0 |
0 |
| Ceramics characteristics |
| W2C content, % wt. |
7.4 |
7.0 |
7.5 |
7.8 |
7.7 |
8.3 |
| Absolute density, g/cm3
|
15.65 |
15.71 |
15.71 |
15.71 |
15.50 |
15.55 |
| Relative density, % |
98.59 |
99.06 |
98.97 |
98.98 |
97.69 |
97.93 |
| Grain size d, µm |
0.1 |
0.1 |
0.1 |
0.1 |
0.1 |
0.1 |
| HV, GPa (±0.2) |
28.7 |
28.0 |
27.9 |
27.4 |
28.0 |
27.4 |
| KIC, MPa·m1/2 (±0.2) |
5.0 |
4.9 |
4.4 |
4.9 |
4.2 |
4.3 |
Table 2.
Characteristics of sintered WC-C samples.
Table 2.
Characteristics of sintered WC-C samples.
| C, % wt. |
t, min |
Ts, ℃ |
ρ/ρth, %
(±0.05%) |
d, μm |
W2C, % wt. |
HV, GPa
(±0.2) |
KIC, MPa·m1/2 (±0.2) |
SPS activation energy |
|
mQsII, kTm (kJ/mol) |
QsIII, kTm (kJ/mol) |
| 0 |
0 |
1500 |
99.4 |
0.1 |
7.5 |
27.8 |
4.0 |
1.3 (33) |
11.0 (279) |
| 3 |
99.7 |
0.15 |
28.2 |
3.9 |
| 30 |
99.6 |
3.0 |
25.3 |
5.0 |
| 0.3 |
0 |
1500 |
98.5 |
0.1 |
2.5 |
28.8 |
3.6 |
2.0 (51) |
13.0 (330) |
| 3 |
99.1 |
0.2 |
27.6 |
4.1 |
| 30 |
98.6 |
5.5 |
24.1 |
5.2 |
| 0.5 |
0 |
1400 |
97.7 |
22 |
0 |
12.9 |
9.0 |
2.3 (58) |
12.0 (304) |
| 3 |
97.7 |
85 |
12.3 |
8. |
| 30 |
97.9 |
200 |
11.7 |
8.5 |
Table 3.
Characteristics of WC + SiC + 0.3% graphite.
Table 3.
Characteristics of WC + SiC + 0.3% graphite.
| SiC, % wt. |
t, min |
Ts, ℃ |
ρ/ρth, %
(±0.05%) |
d, μm |
W2C, % wt. |
HV, GPa (±0.2) |
KIC, MPa·m1/2 (±0.2) |
SPS activation energy |
|
mQsII, kTm (kJ/mol) |
QsIII, kTm (kJ/mol) |
| 1 |
0 |
1350 |
97.4 |
7 |
0 |
19.2 |
5.9 |
2.2 (56) |
10.0 (250) |
| 3 |
97.3 |
10 |
18.1 |
6.1 |
| 30 |
97.7 |
16 |
17.3 |
6.2 |
| 3 |
0 |
1350 |
95.5 |
0.5 |
0 |
22.6 |
3.8 |
2.2 (56) |
12.0 (304) |
| 3 |
95.4 |
1.2 |
21.1 |
4.1 |
| 30 |
96.7 |
12 |
18.3 |
4.4 |
| 5 |
0 |
1350 |
95.1 |
0.3 |
0 |
21.5 |
3.9 |
2.15 (55) |
10.0 (250) |
| 3 |
96.1 |
1 |
20.1 |
4 |
| 30 |
95.8 |
3.2 |
18.7 |
4.4 |
