Submitted:
12 May 2023
Posted:
15 May 2023
You are already at the latest version
Abstract
Keywords:
1. Introduction
2. Materials and Methods
2.1. Equivalent circuit of the PV cell based on the two-diode model
2.2. Mathematical model of reverse saturation diode current
2.3. Method for and computation
2.4. PV conversion efficiency
2.5. Methods and implemented algorithm of PVMSim
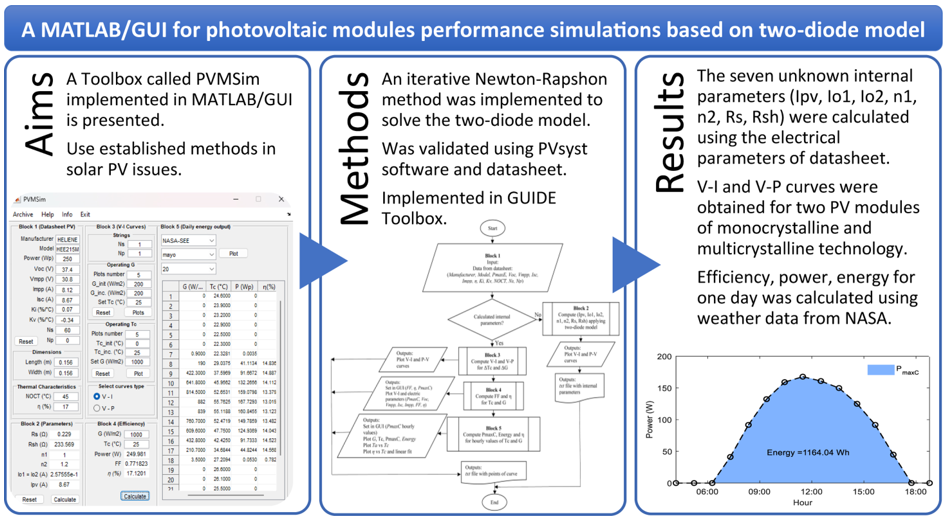
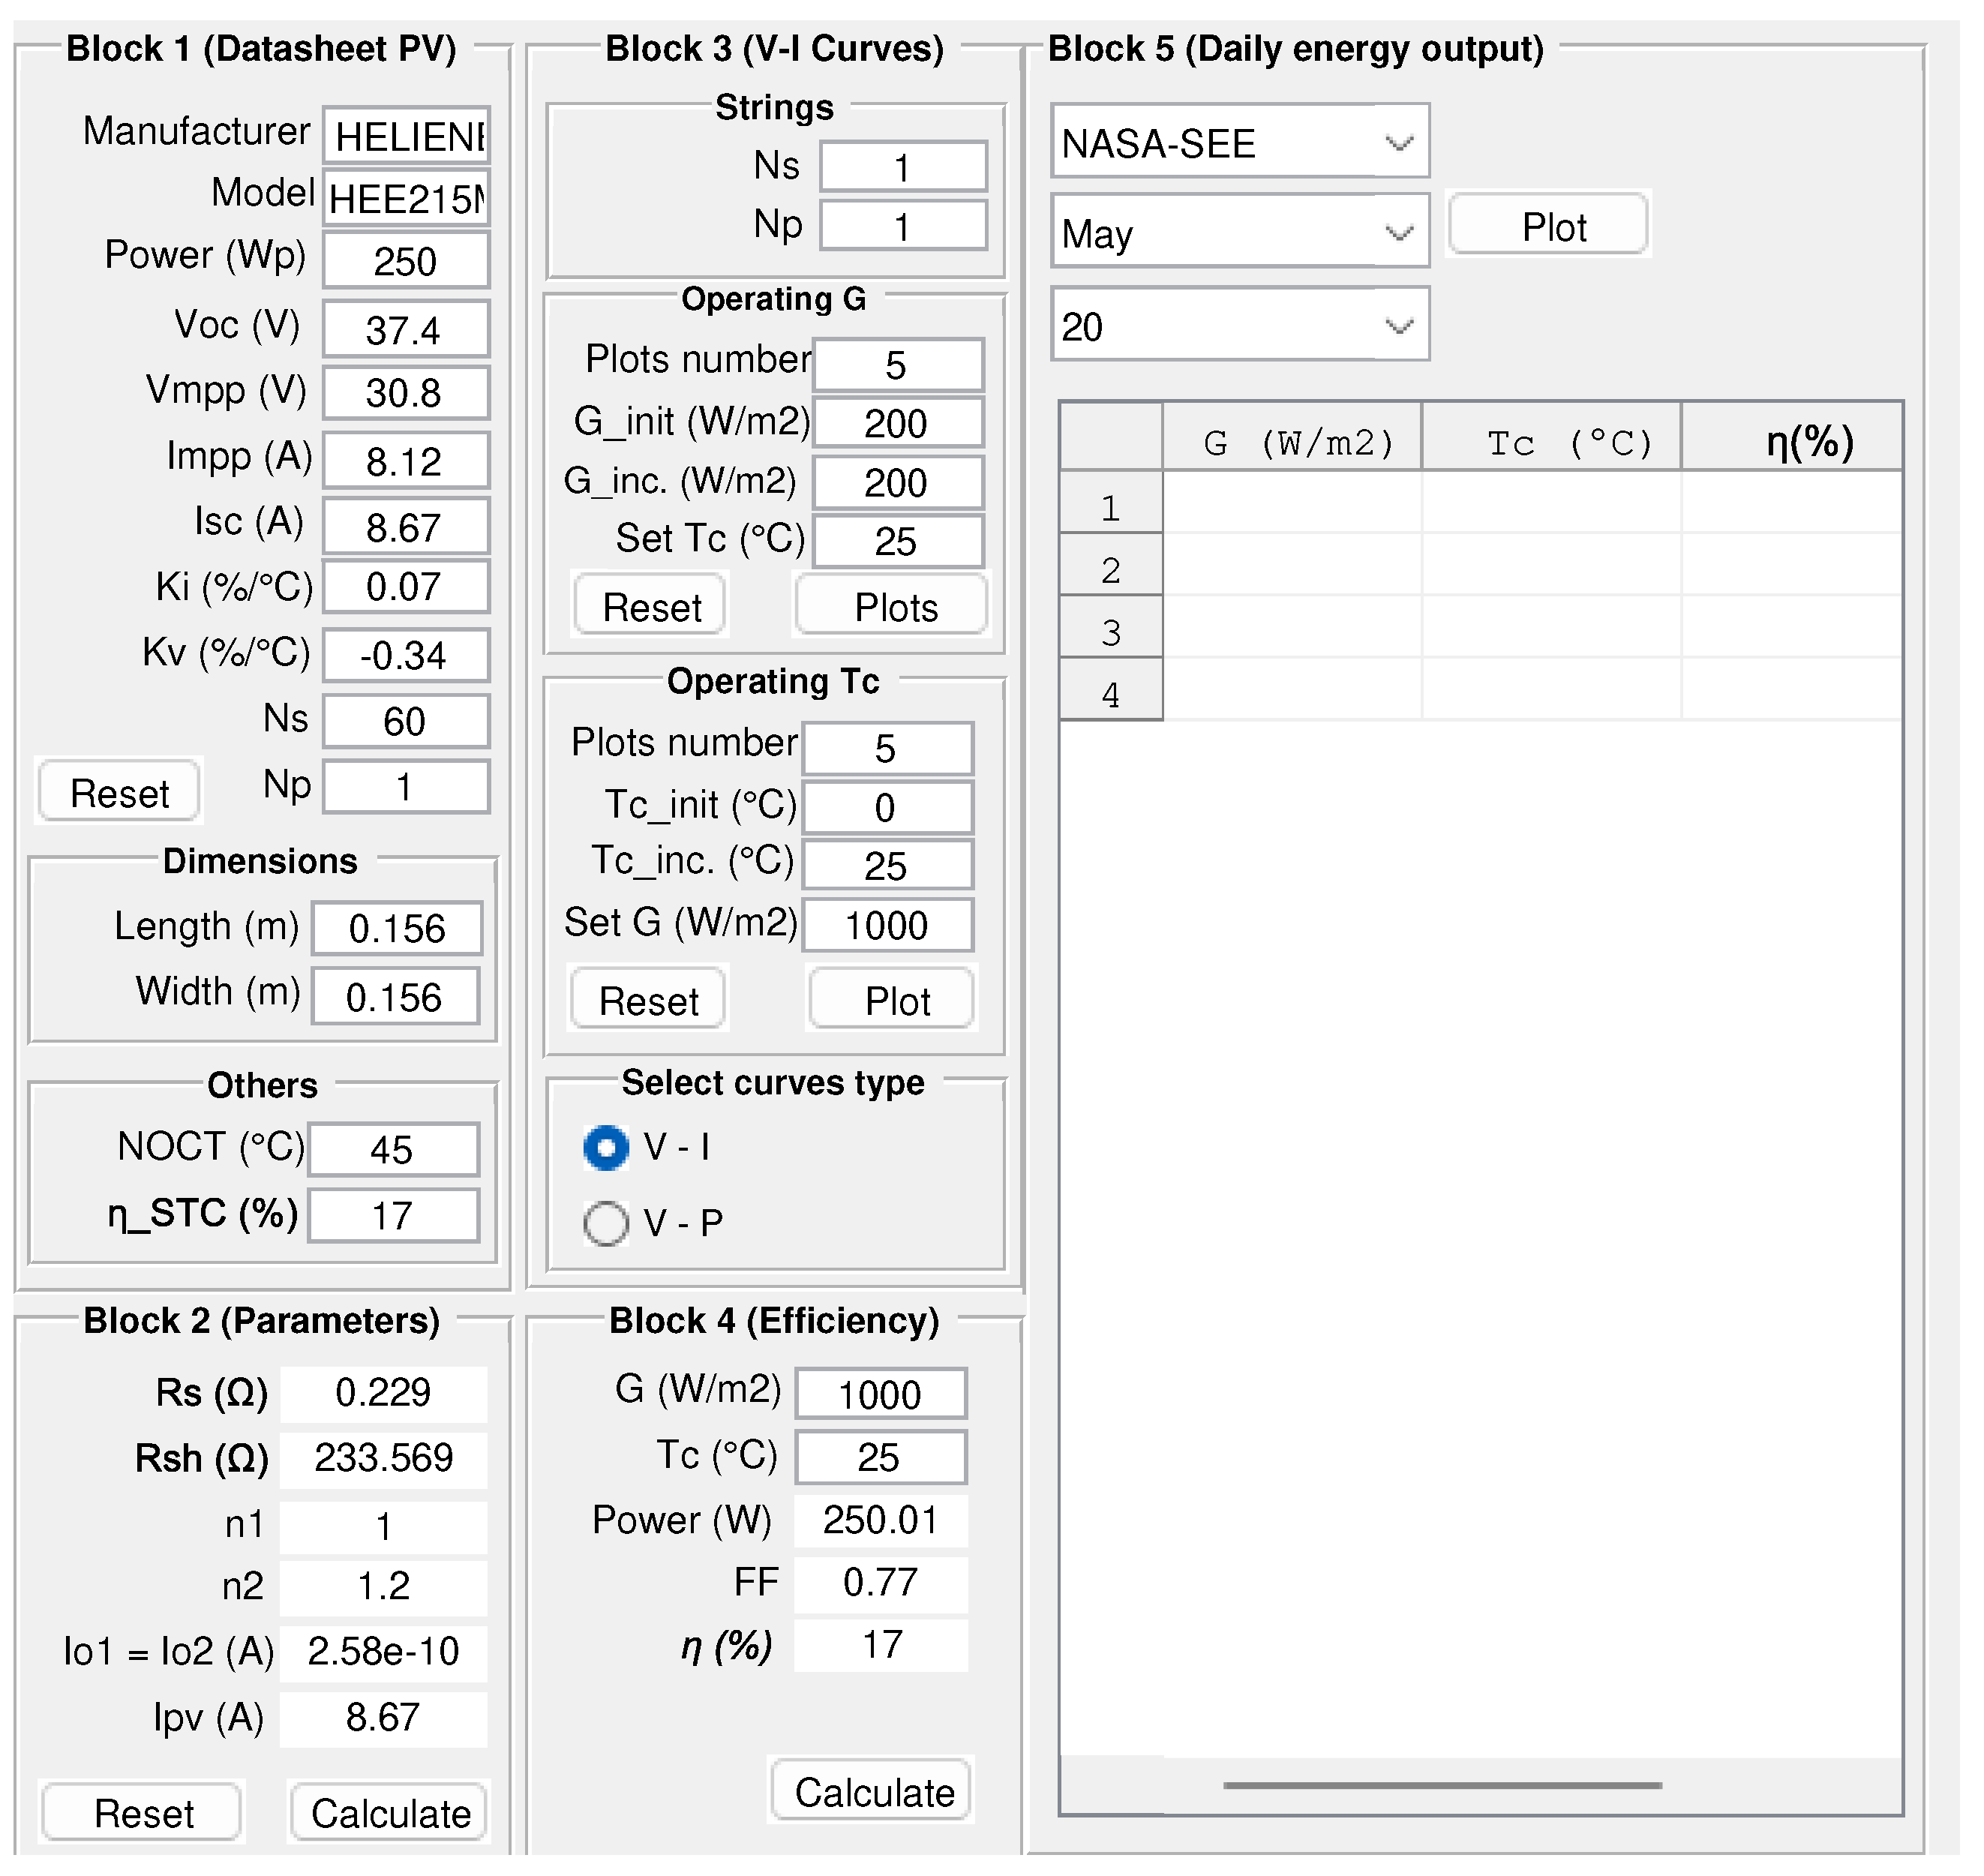
- GUI’s Block 1: input data of manufacturer’s datasheet, it is important to add all the values of the electrical parameters for the STC and NOC, also the mechanical data such as dimensions of PV cells, no Editbox of this block can be left incomplete.
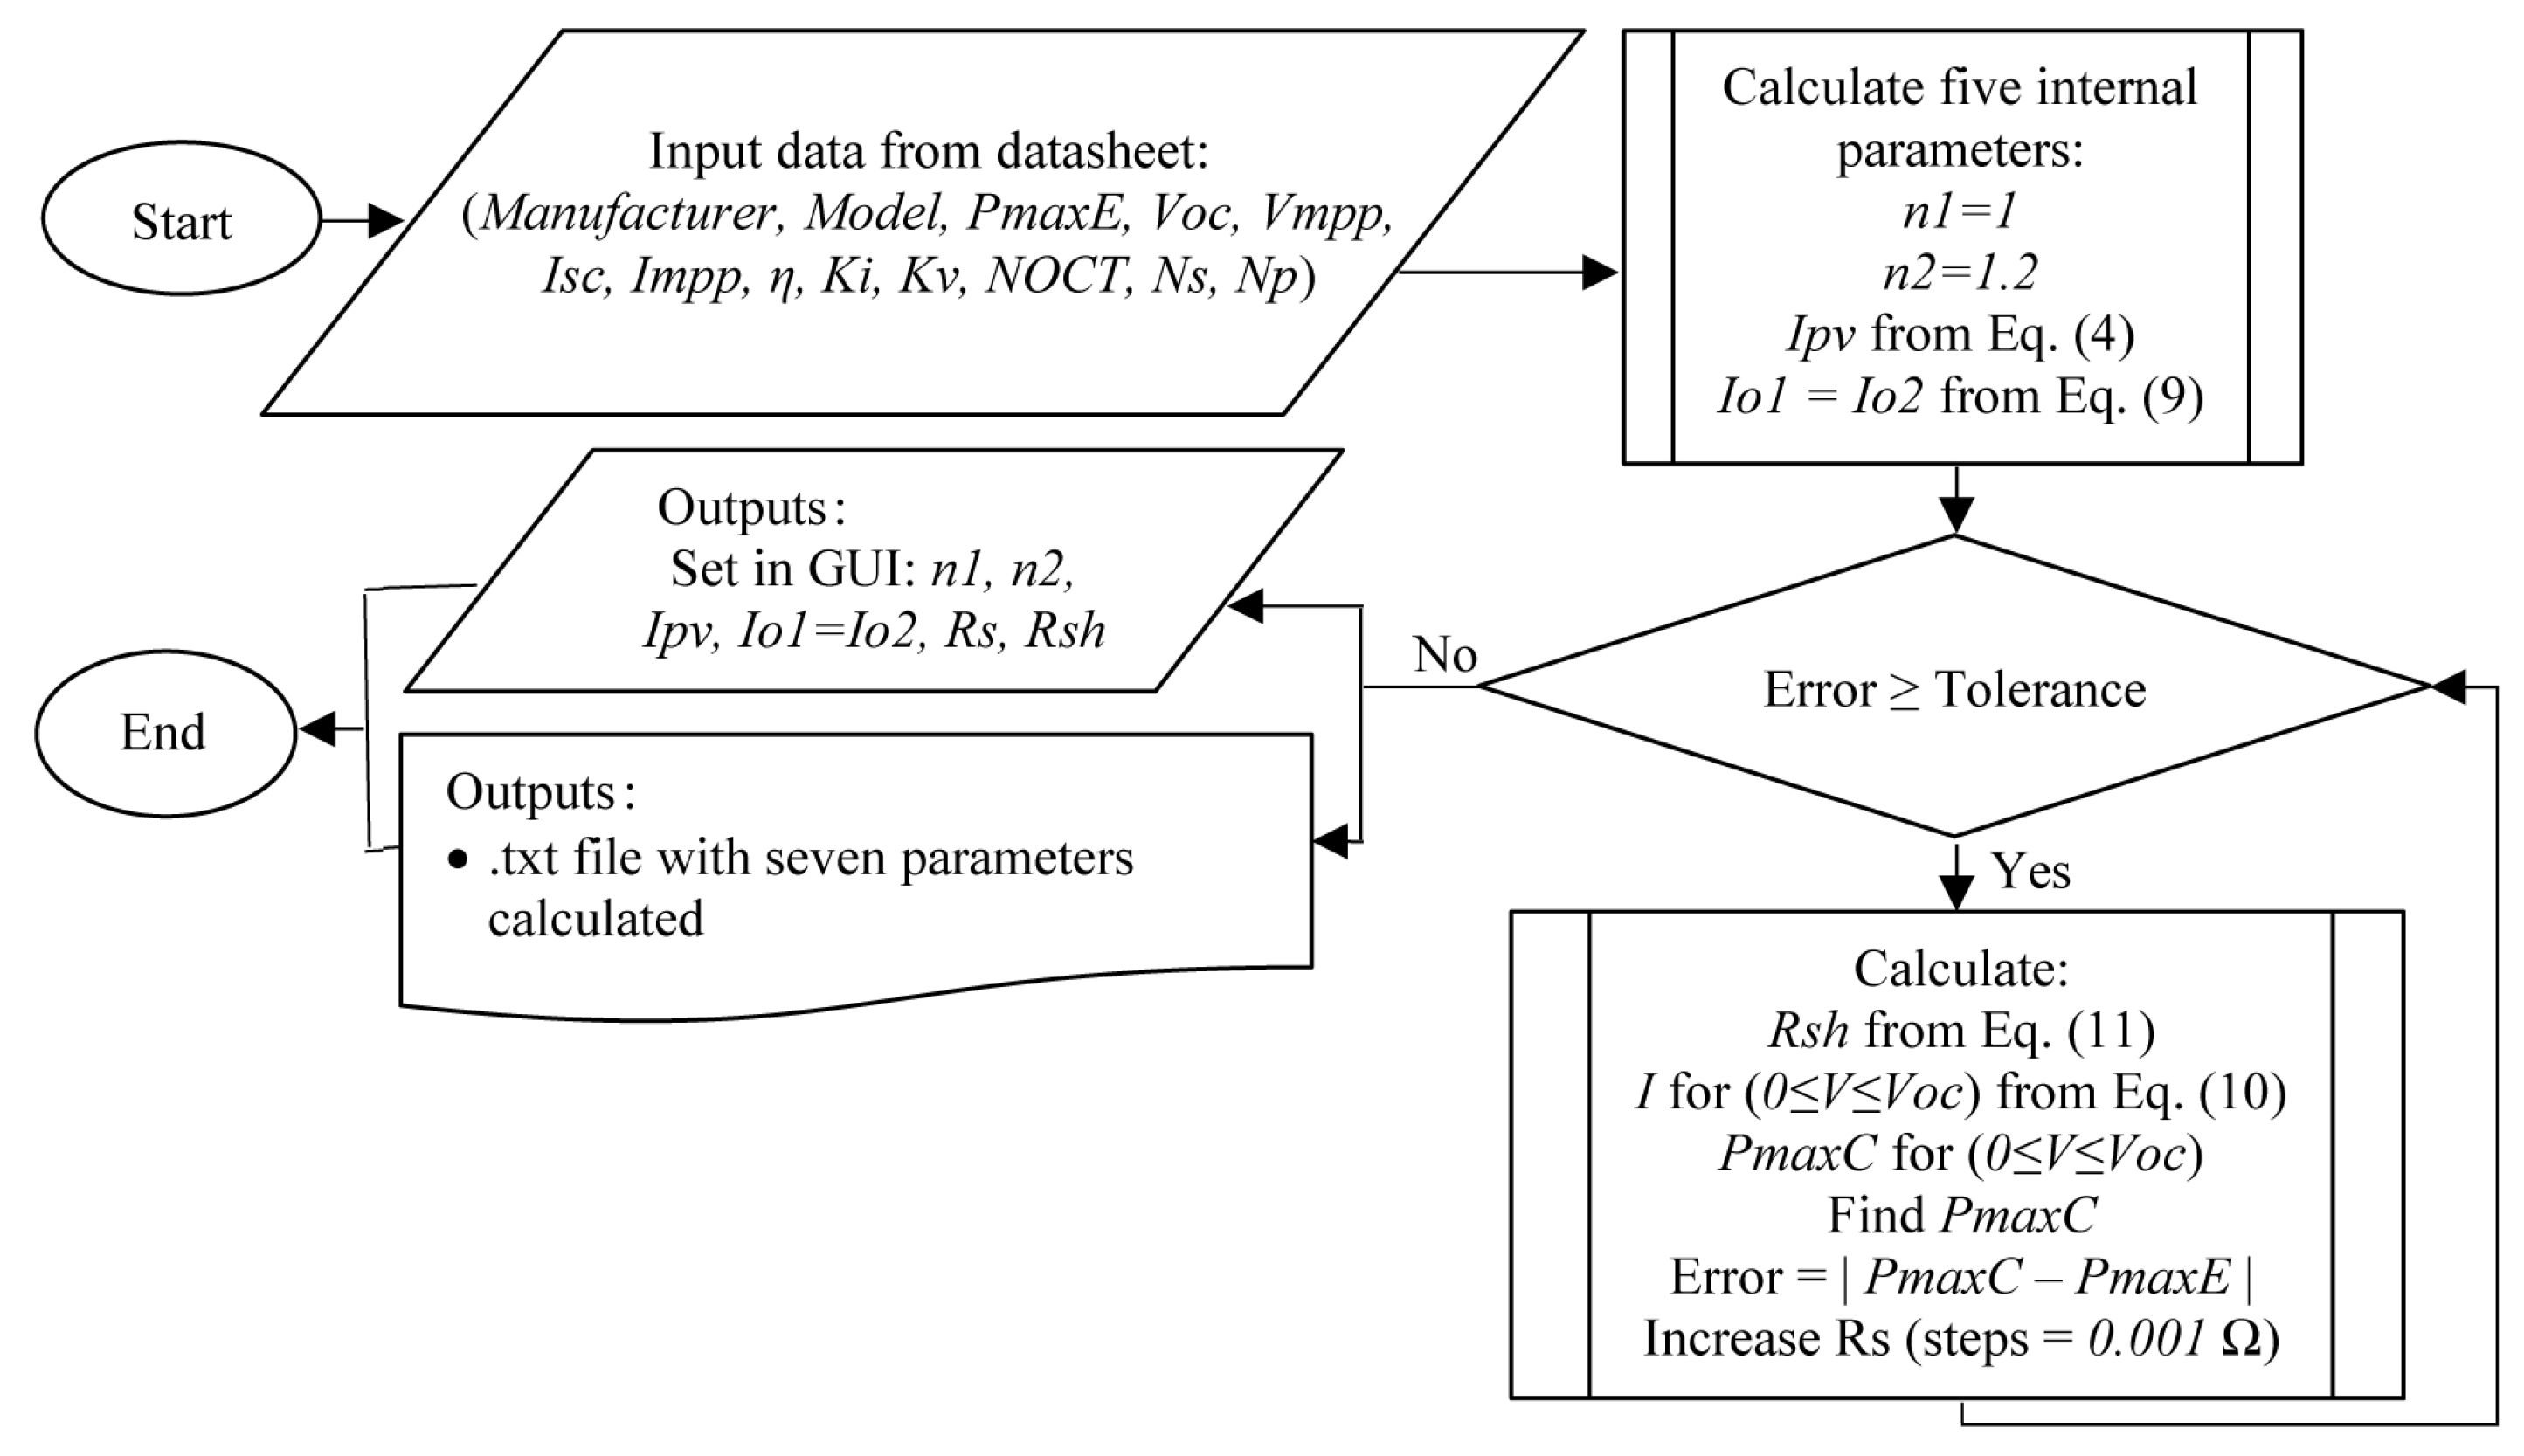
- GUI’s Block 2: the modeling algorithm of this block is shown in Figure 6. By Pushbutton (Calculate), the defined process of extracting the seven unknown internal parameters of the PV module begins, through the iterative method of Newton-Raphson, using the two-diode model and applying the methods described above. Once the calculations are completed and the defined tolerance is reached, the values of the parameters are displayed in the Textboxs. No data in this block is entered.
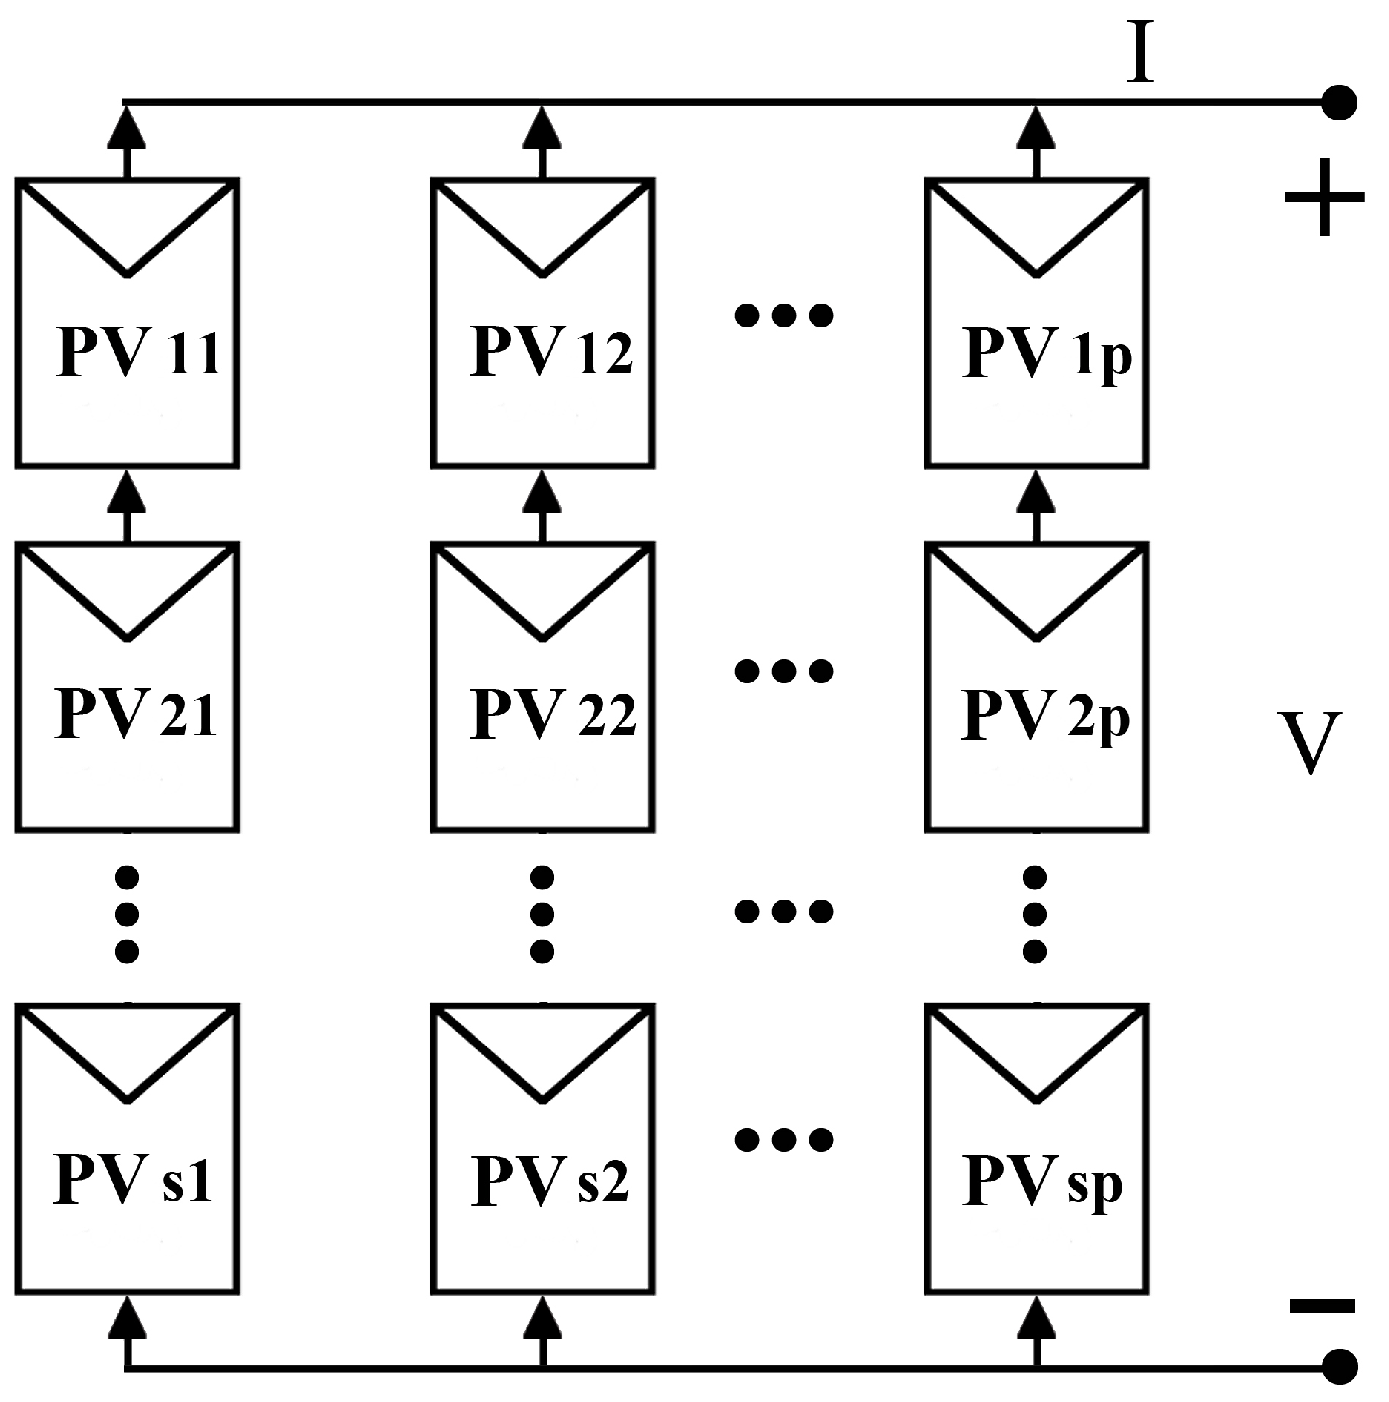
- GUI’s Block 3: the simulation algorithm of this block is shown in Figure 7. First, the number of PV modules per string is entered, and the modules connected in series and in parallel must be defined. Then the number of I-V curves and P-V curves are going to be plotted, and the variation of the irradiance and the temperature of the PV cells must also be specified. By pushbutton (Plot) the corresponding curves are obtained. Finally, the points used for the plotted curves are automatically saved in a .txt file.
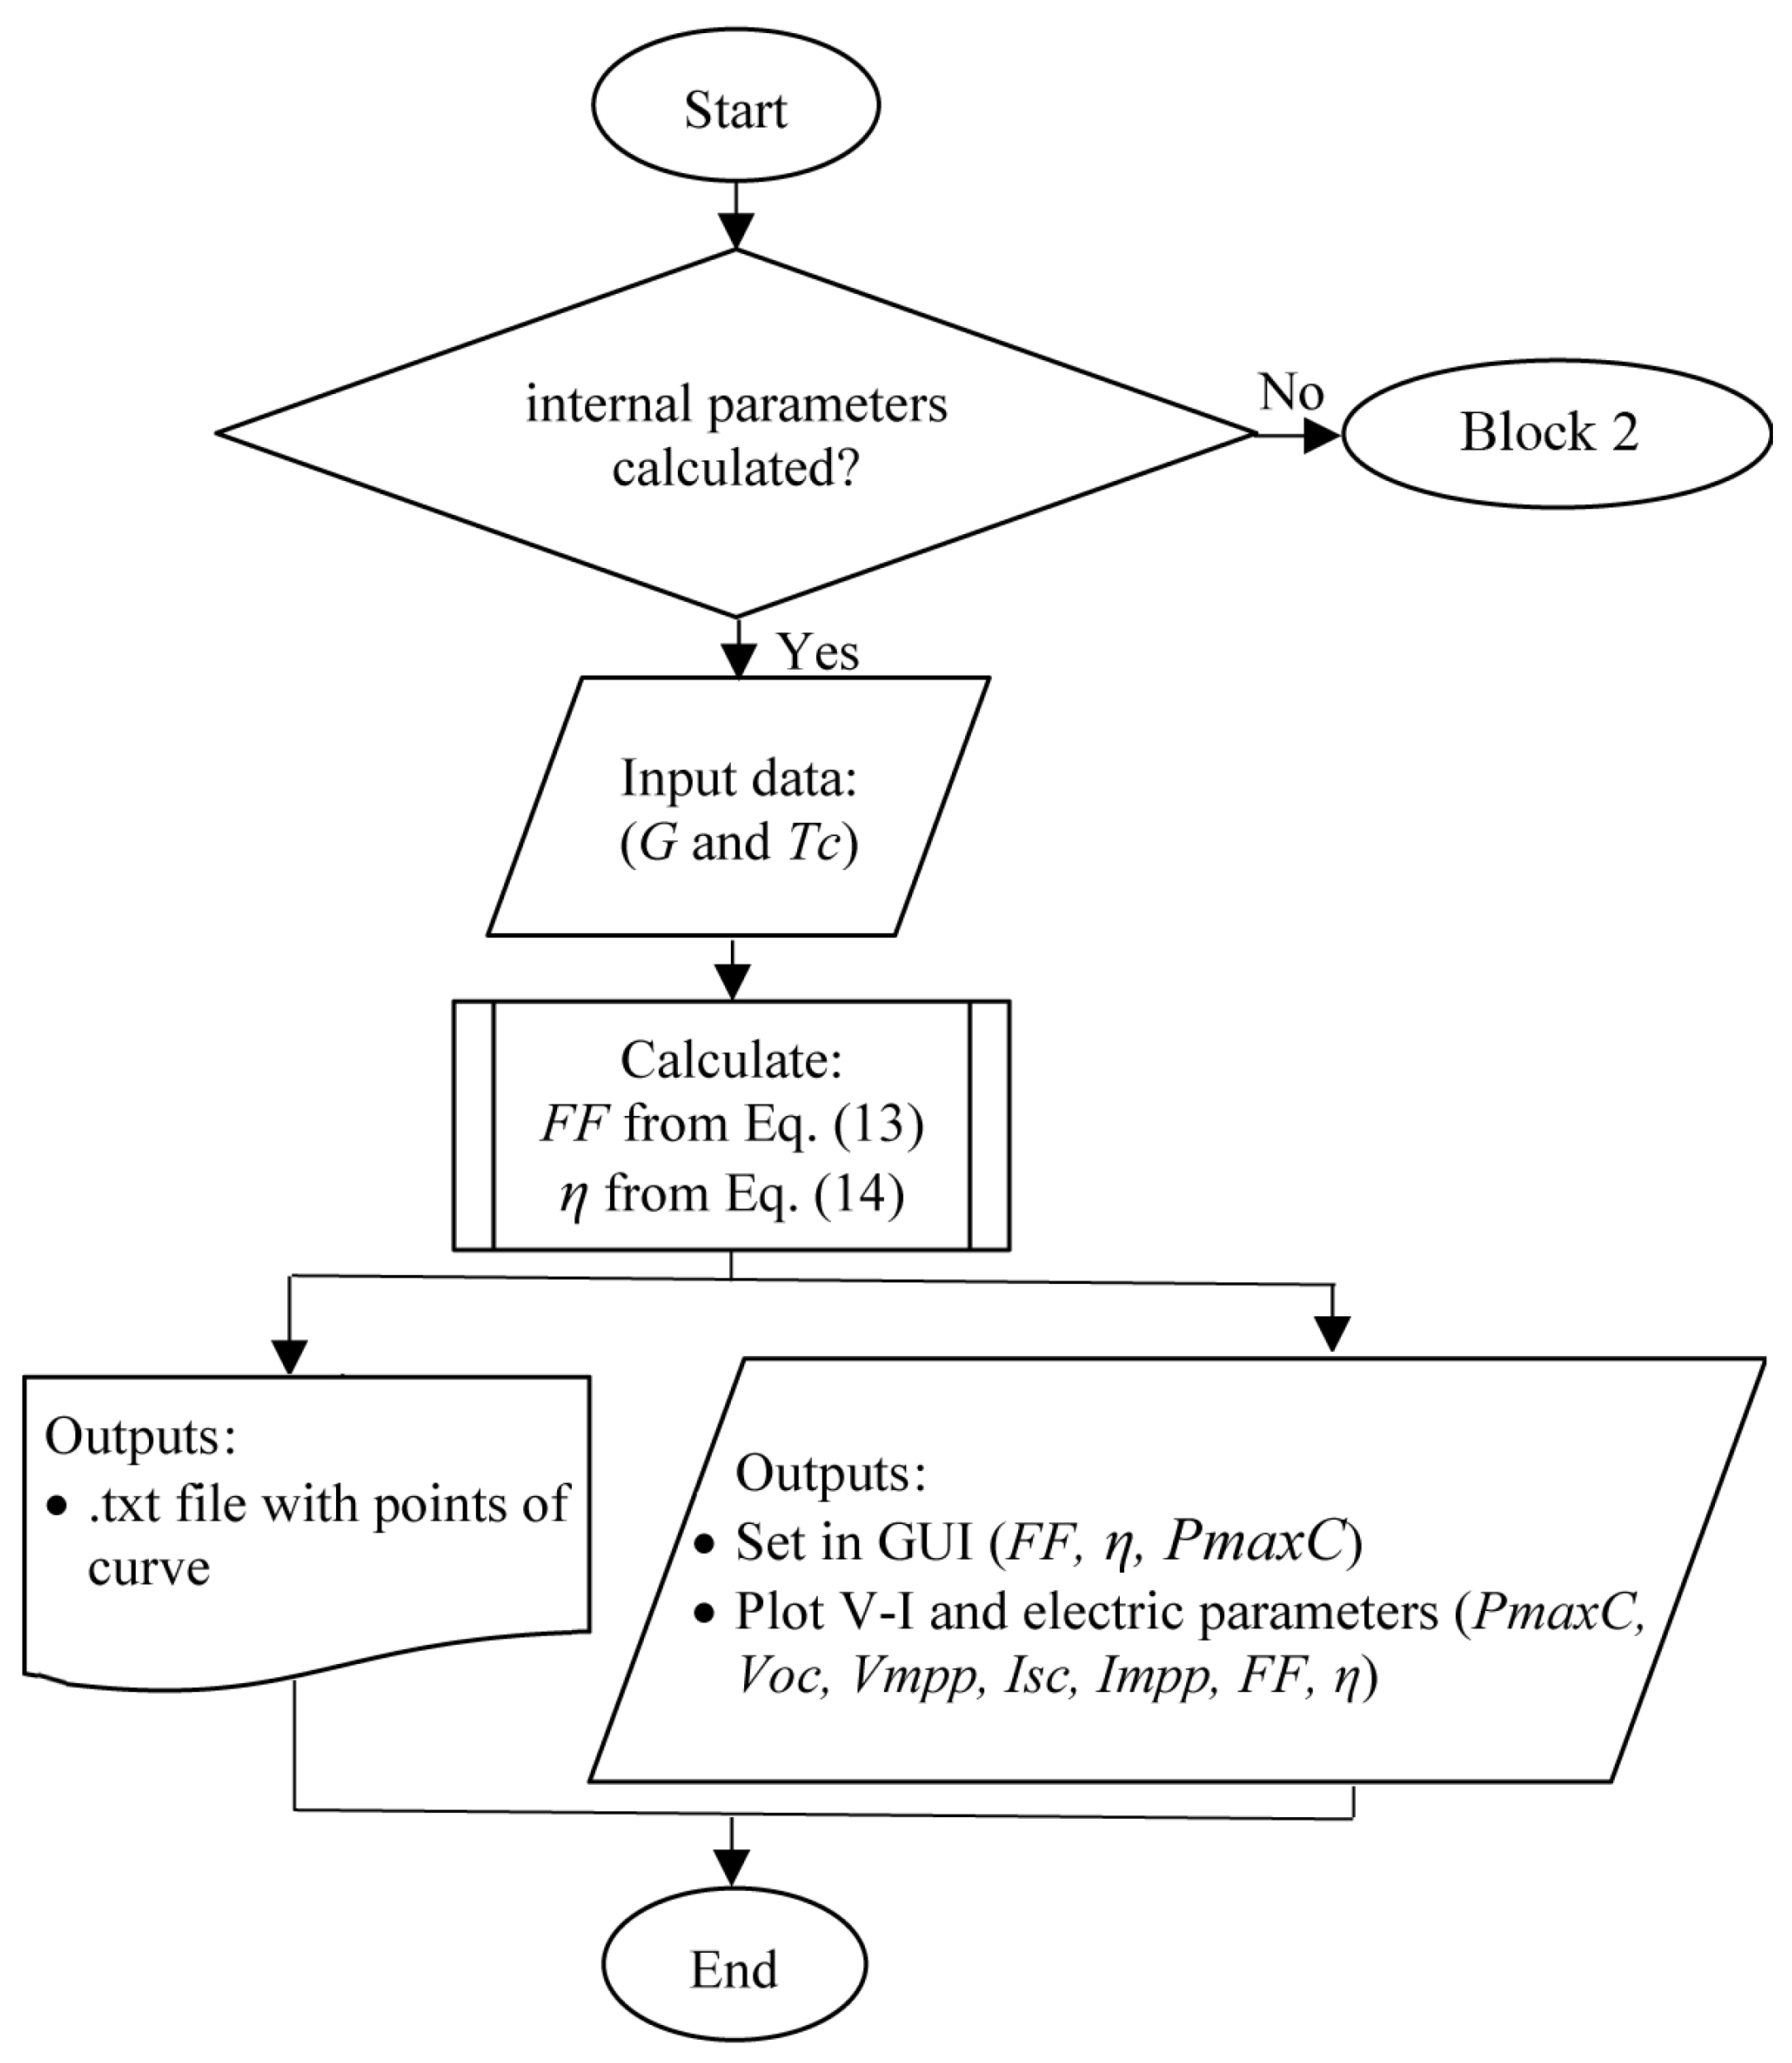
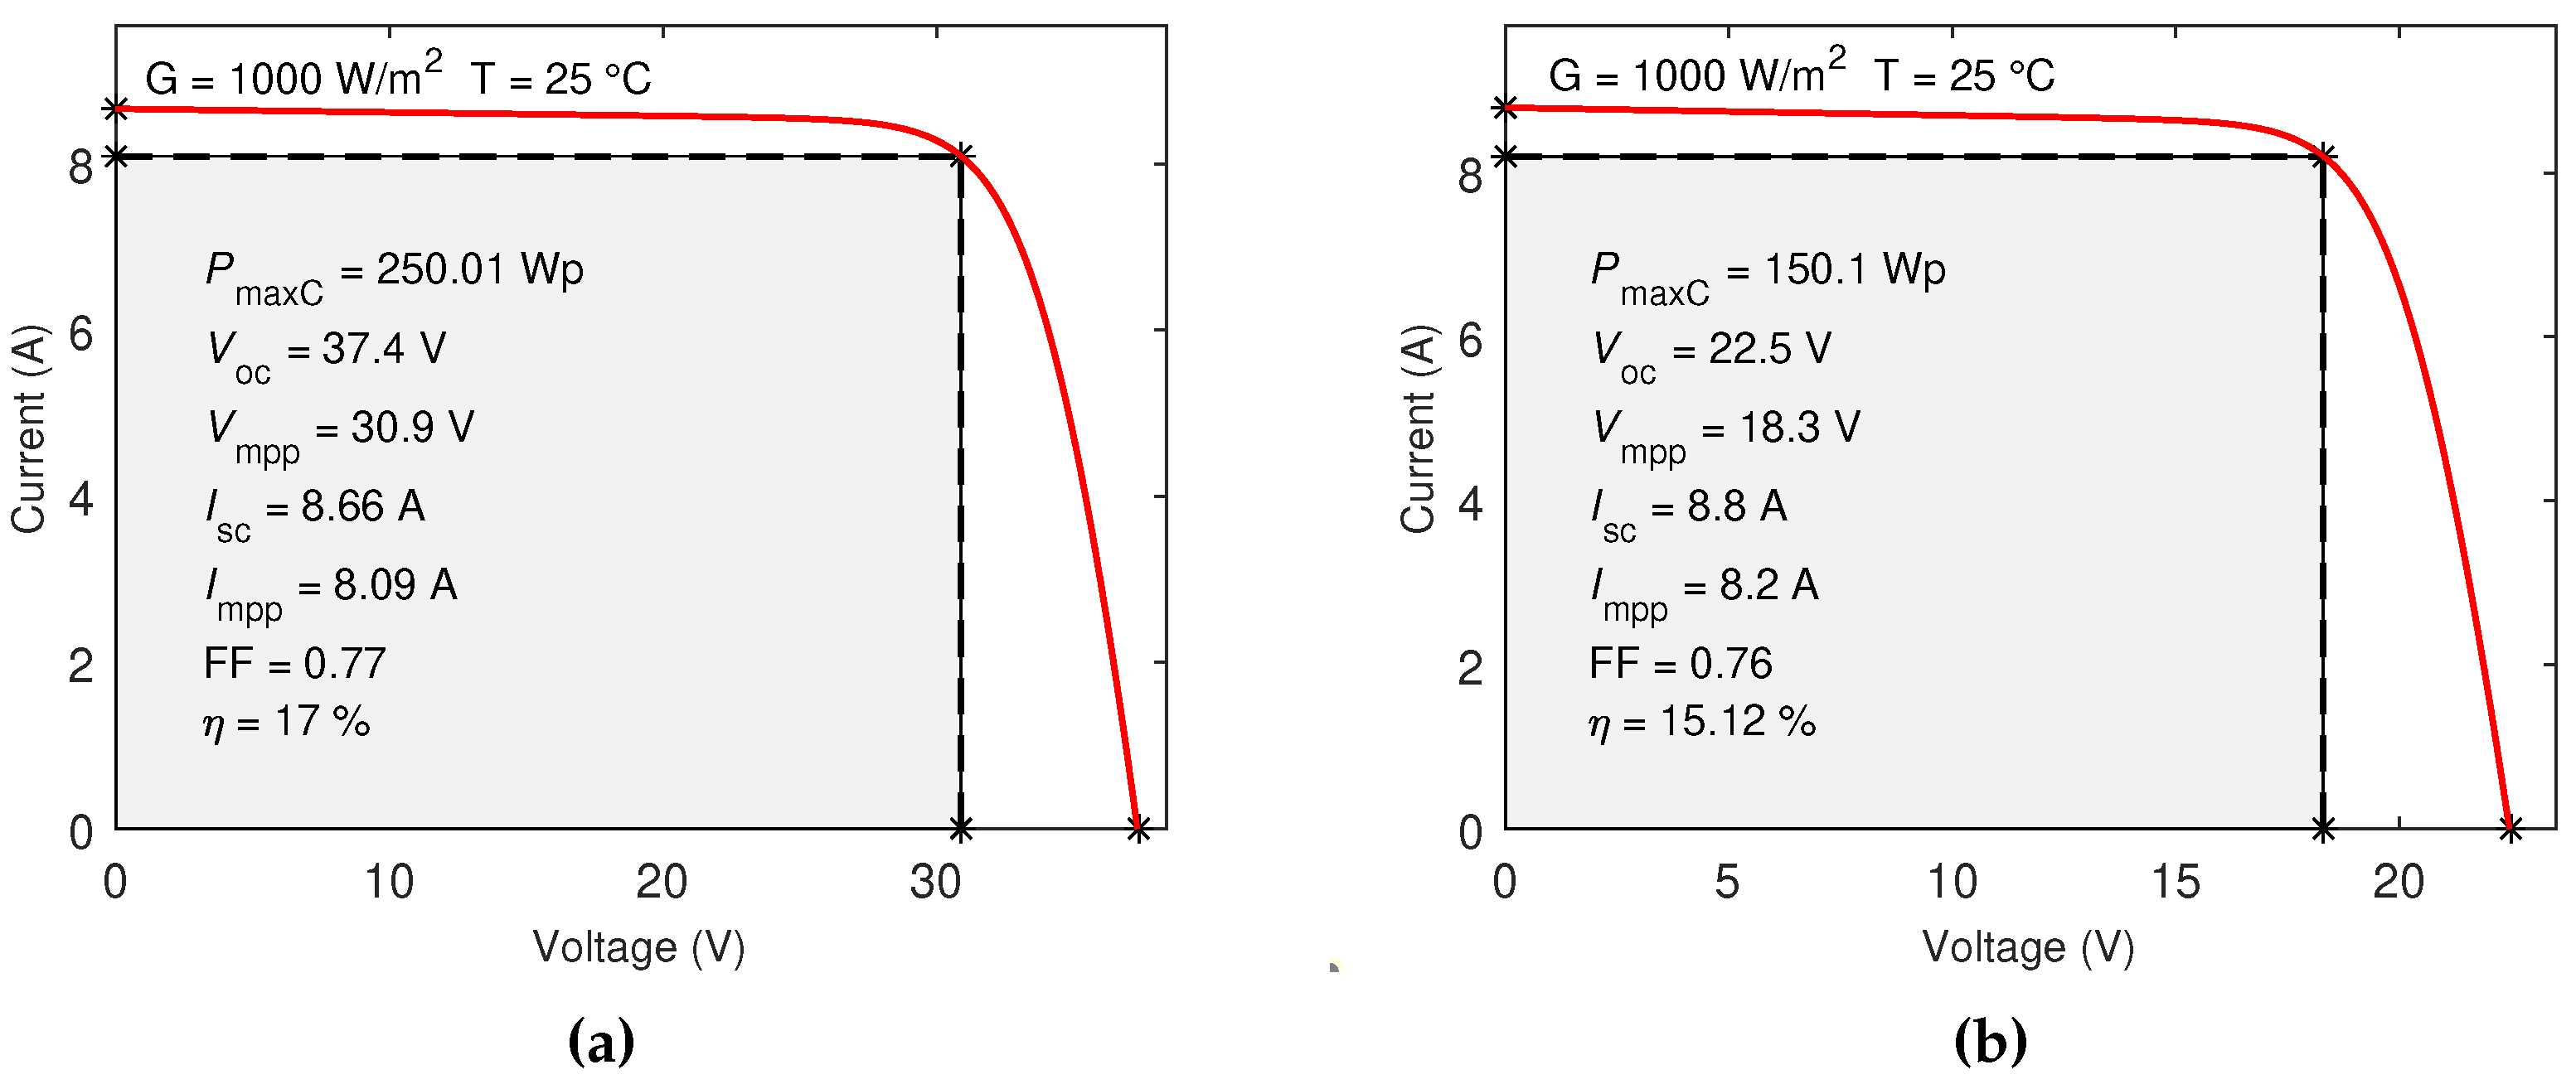
- GUI’s Block 4: The simulation algorithm of this block is shown in Figure 8. Calculates and plots the fill factor and numerical values, and plot a single I-V curve with the electrical parameters corresponding to that simulation. Input data of G and must be entered for the simulation.
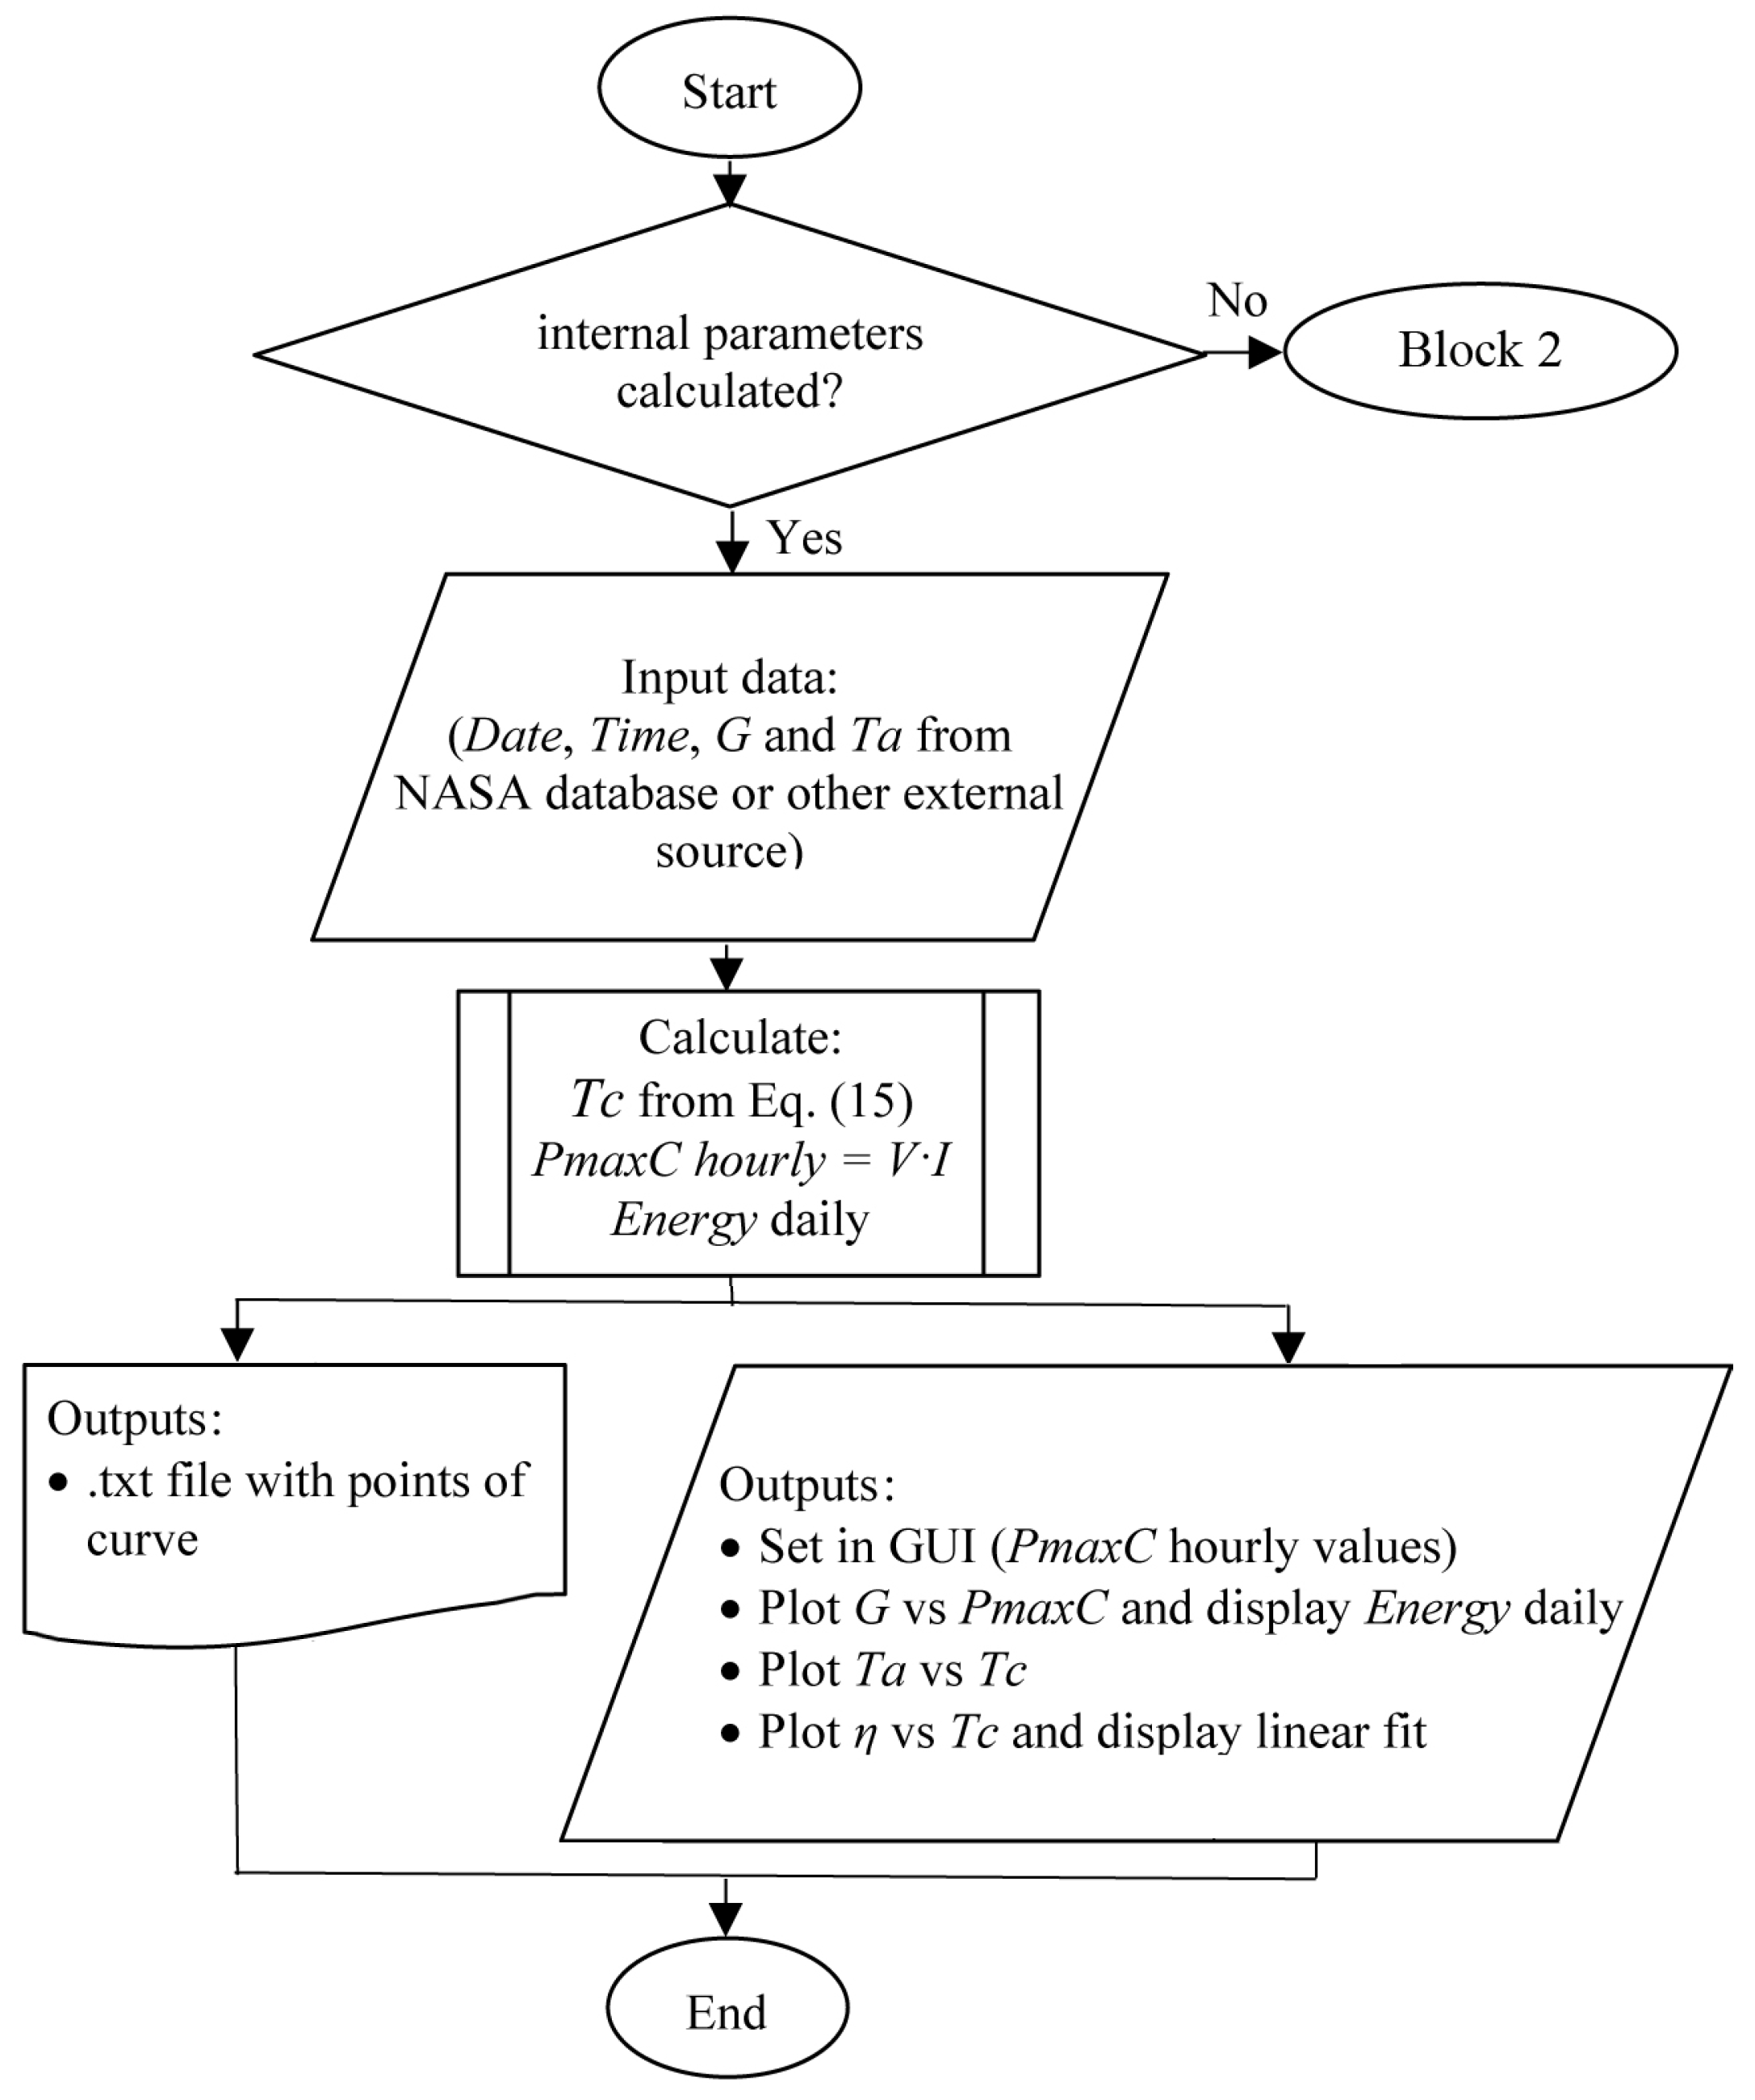
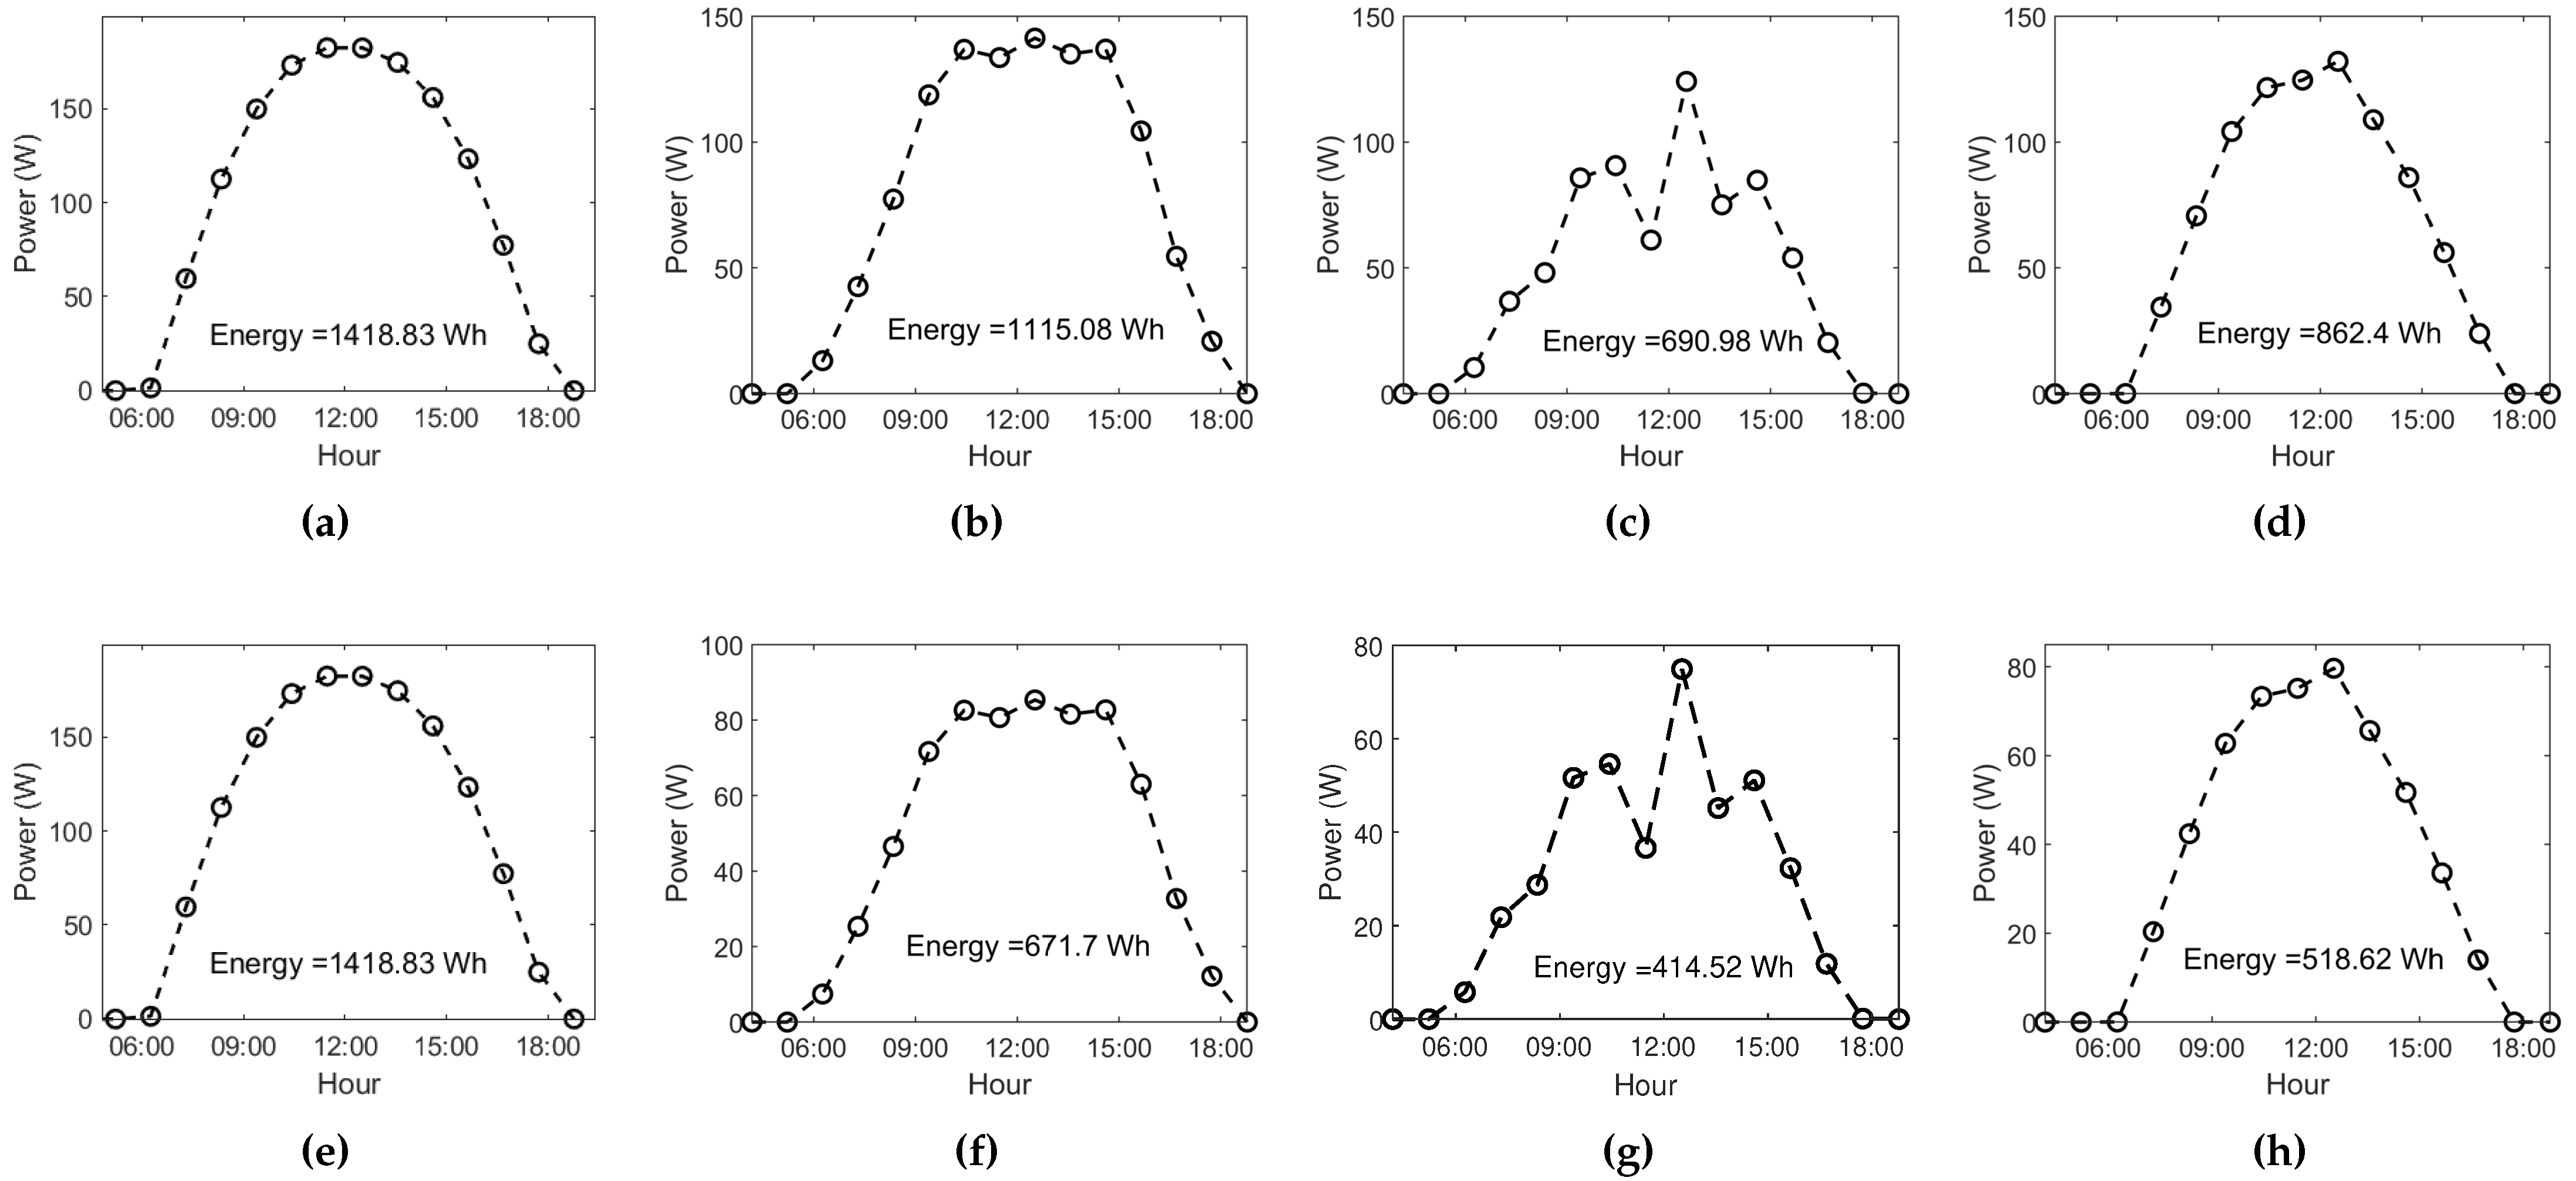
- GUI’s Block 5: the calculation algorithm of this block is shown in Figure 9. Plot , G, , and for the effect of climatic conditions of a given region, within a date selected by the user. To obtain the power values at each hour of the day, PVMSim imports a file in .txt format, with the annual records of the geographic site analyzed. In this case, the data provided by NASA is imported [57]. This data is commonly used for this type of simulation [48,67]. In this block, the hourly data of , , G and is also exported to a .txt file.
3. Results
3.1. Extracting unknown internal parameters
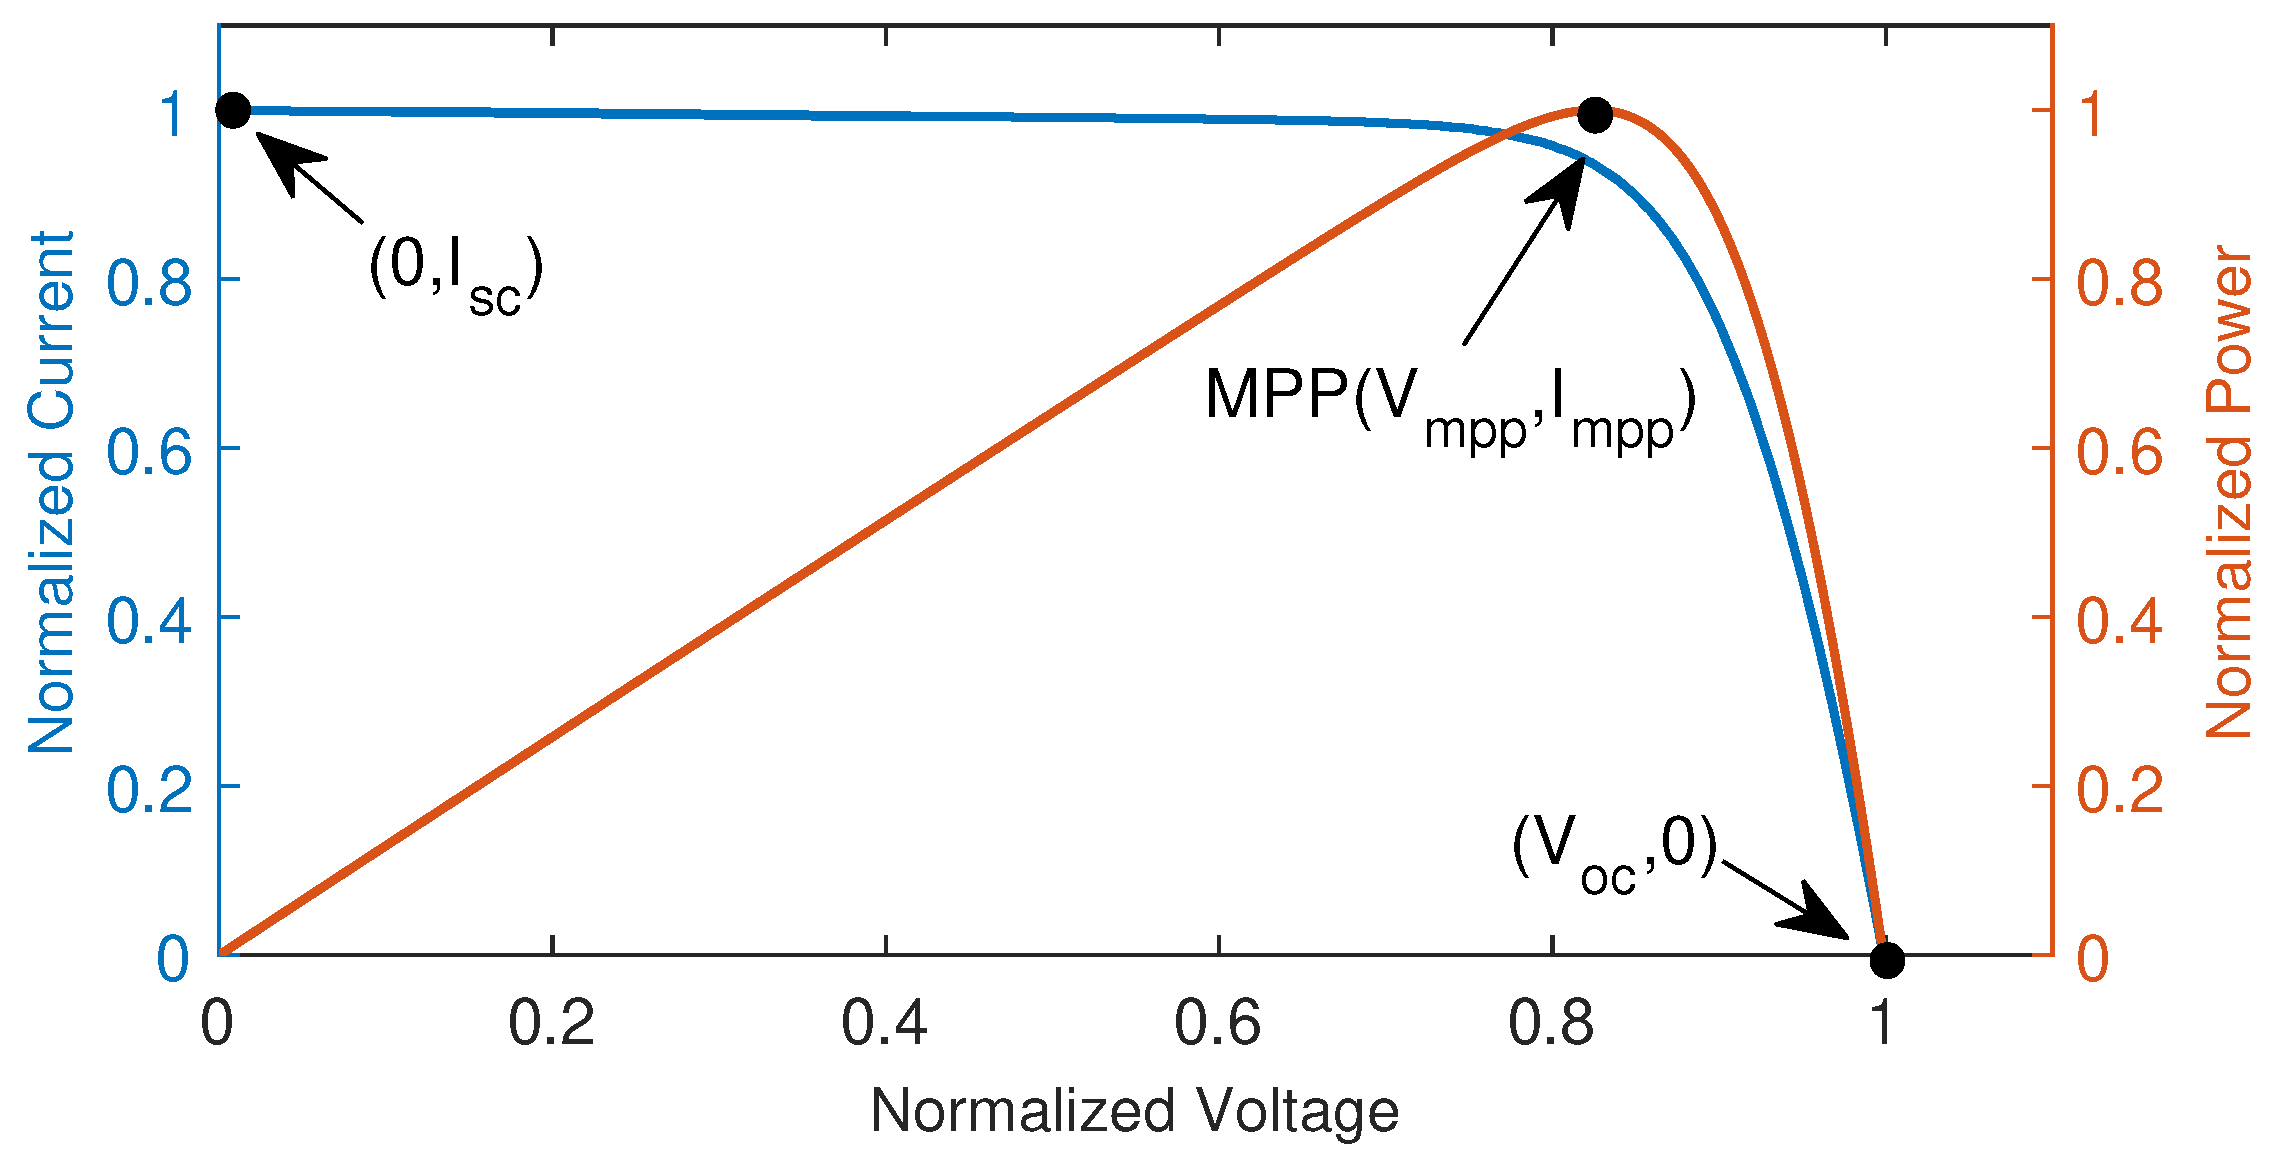
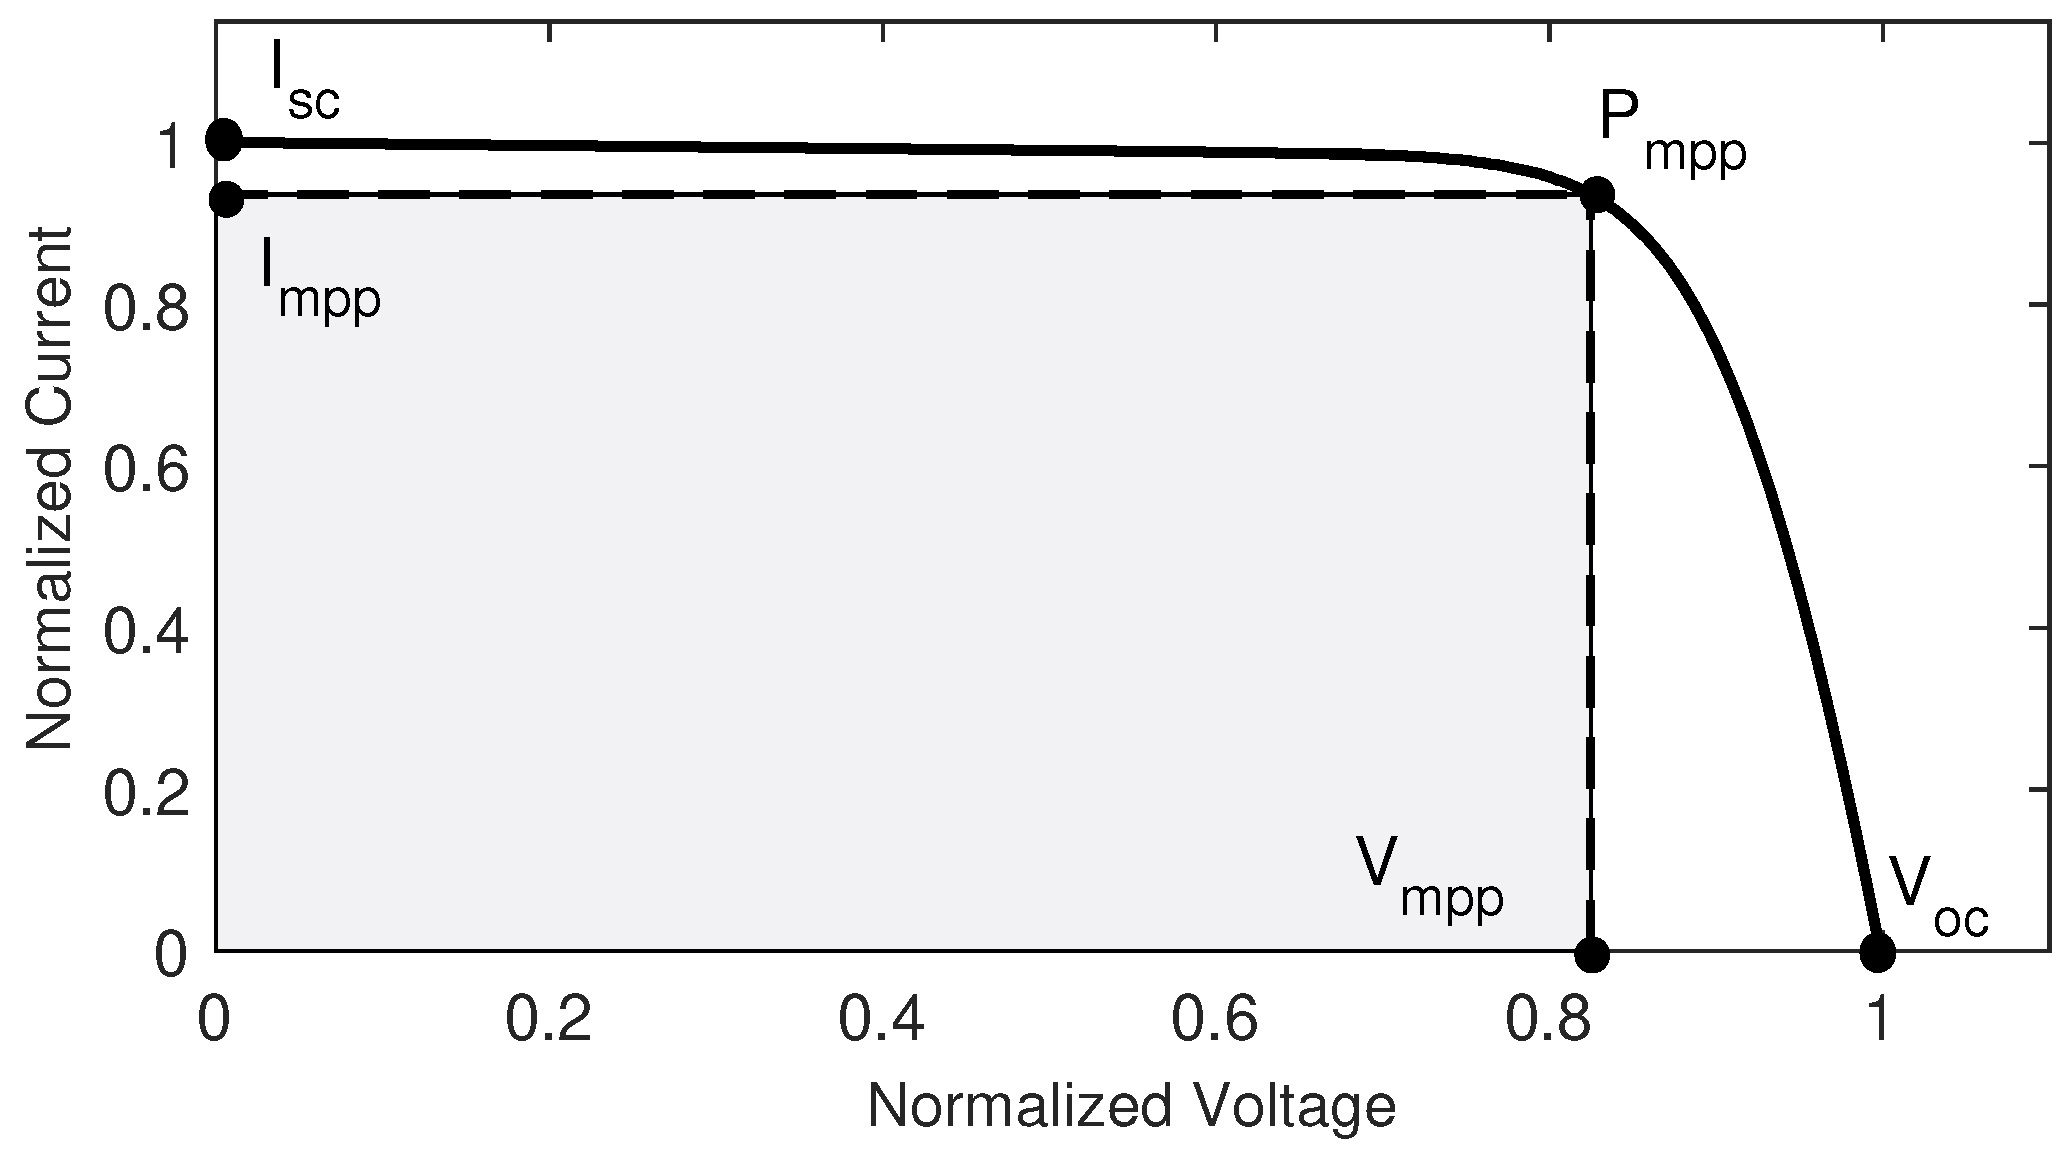
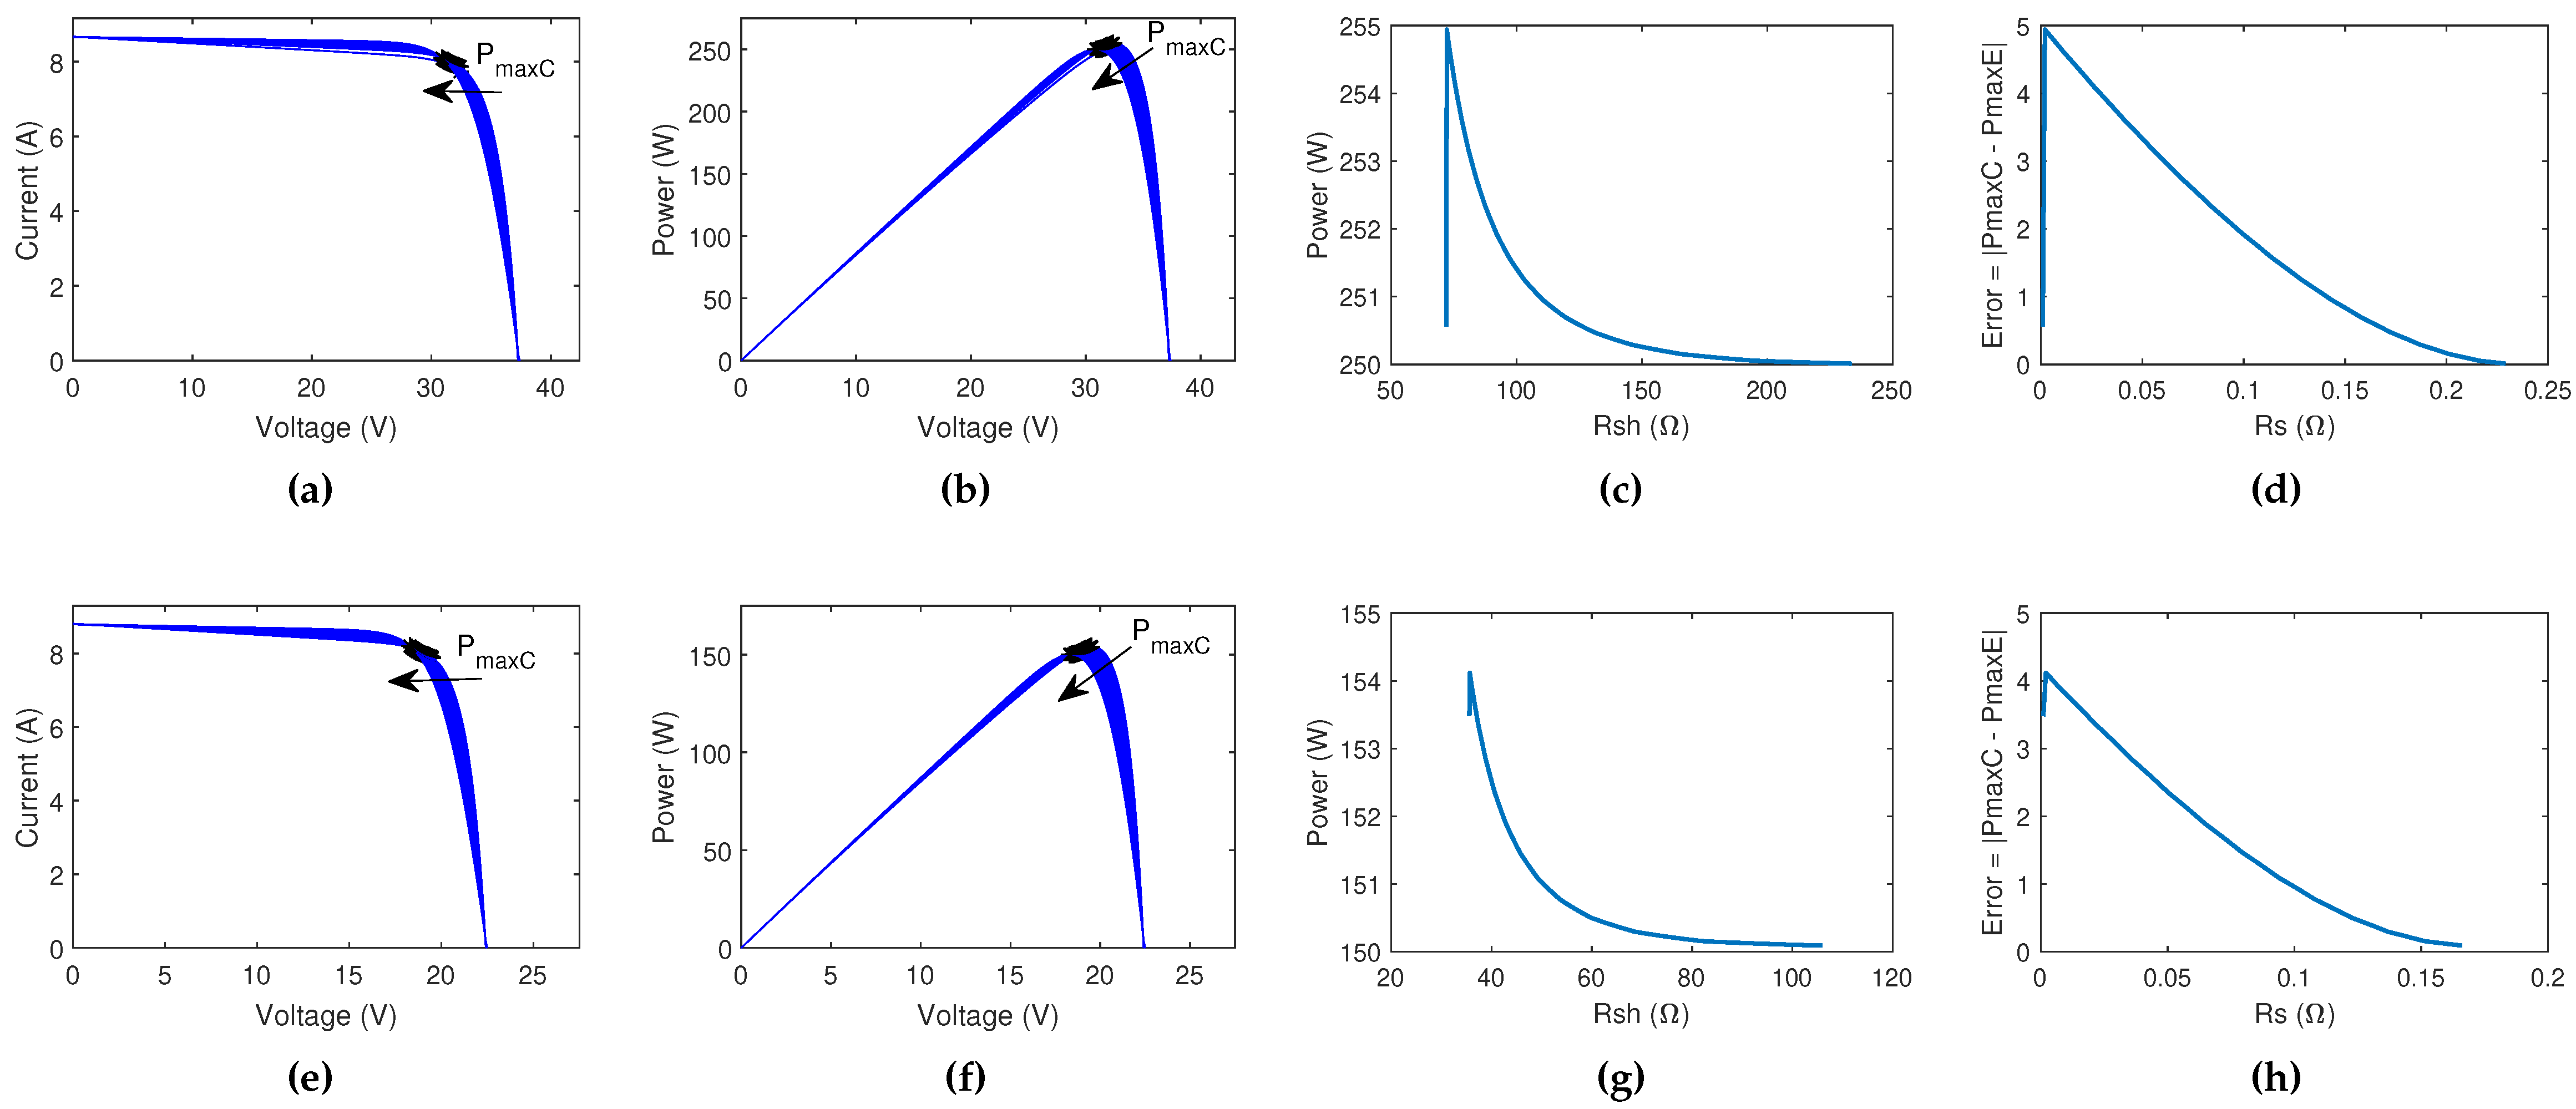
- I-V (a,e) and P-V (b,f) characteristic curves show the movement of . The maximum power of the PV modules is available in the datasheets, with a tolerance for STC. For the analyzed PV modules, the tolerance are and for HEE215MA68 and SW150polyR6A, respectively. It is important to take this data into account to analyze the accuracy of the algorithm for extracting the unknown internal parameters in Figure 7. The black asterisks represent the , while the arrow indicates the direction of movement of the V-I and V-P curves.
- Curves in the plot (c,g) show the variation of according to the variation of the value of . The algorithm starts the iterative method with values of greater than the value of . For the PV HEE215MA68 module, the value of while for the SW150polyR6A the value of . The value of is increased (Equation (11) until the stop condition is reached.
- Curves in the plot (d,h) begin with the value of (Equation (12)), then this value is increased with until the stop condition is reached.
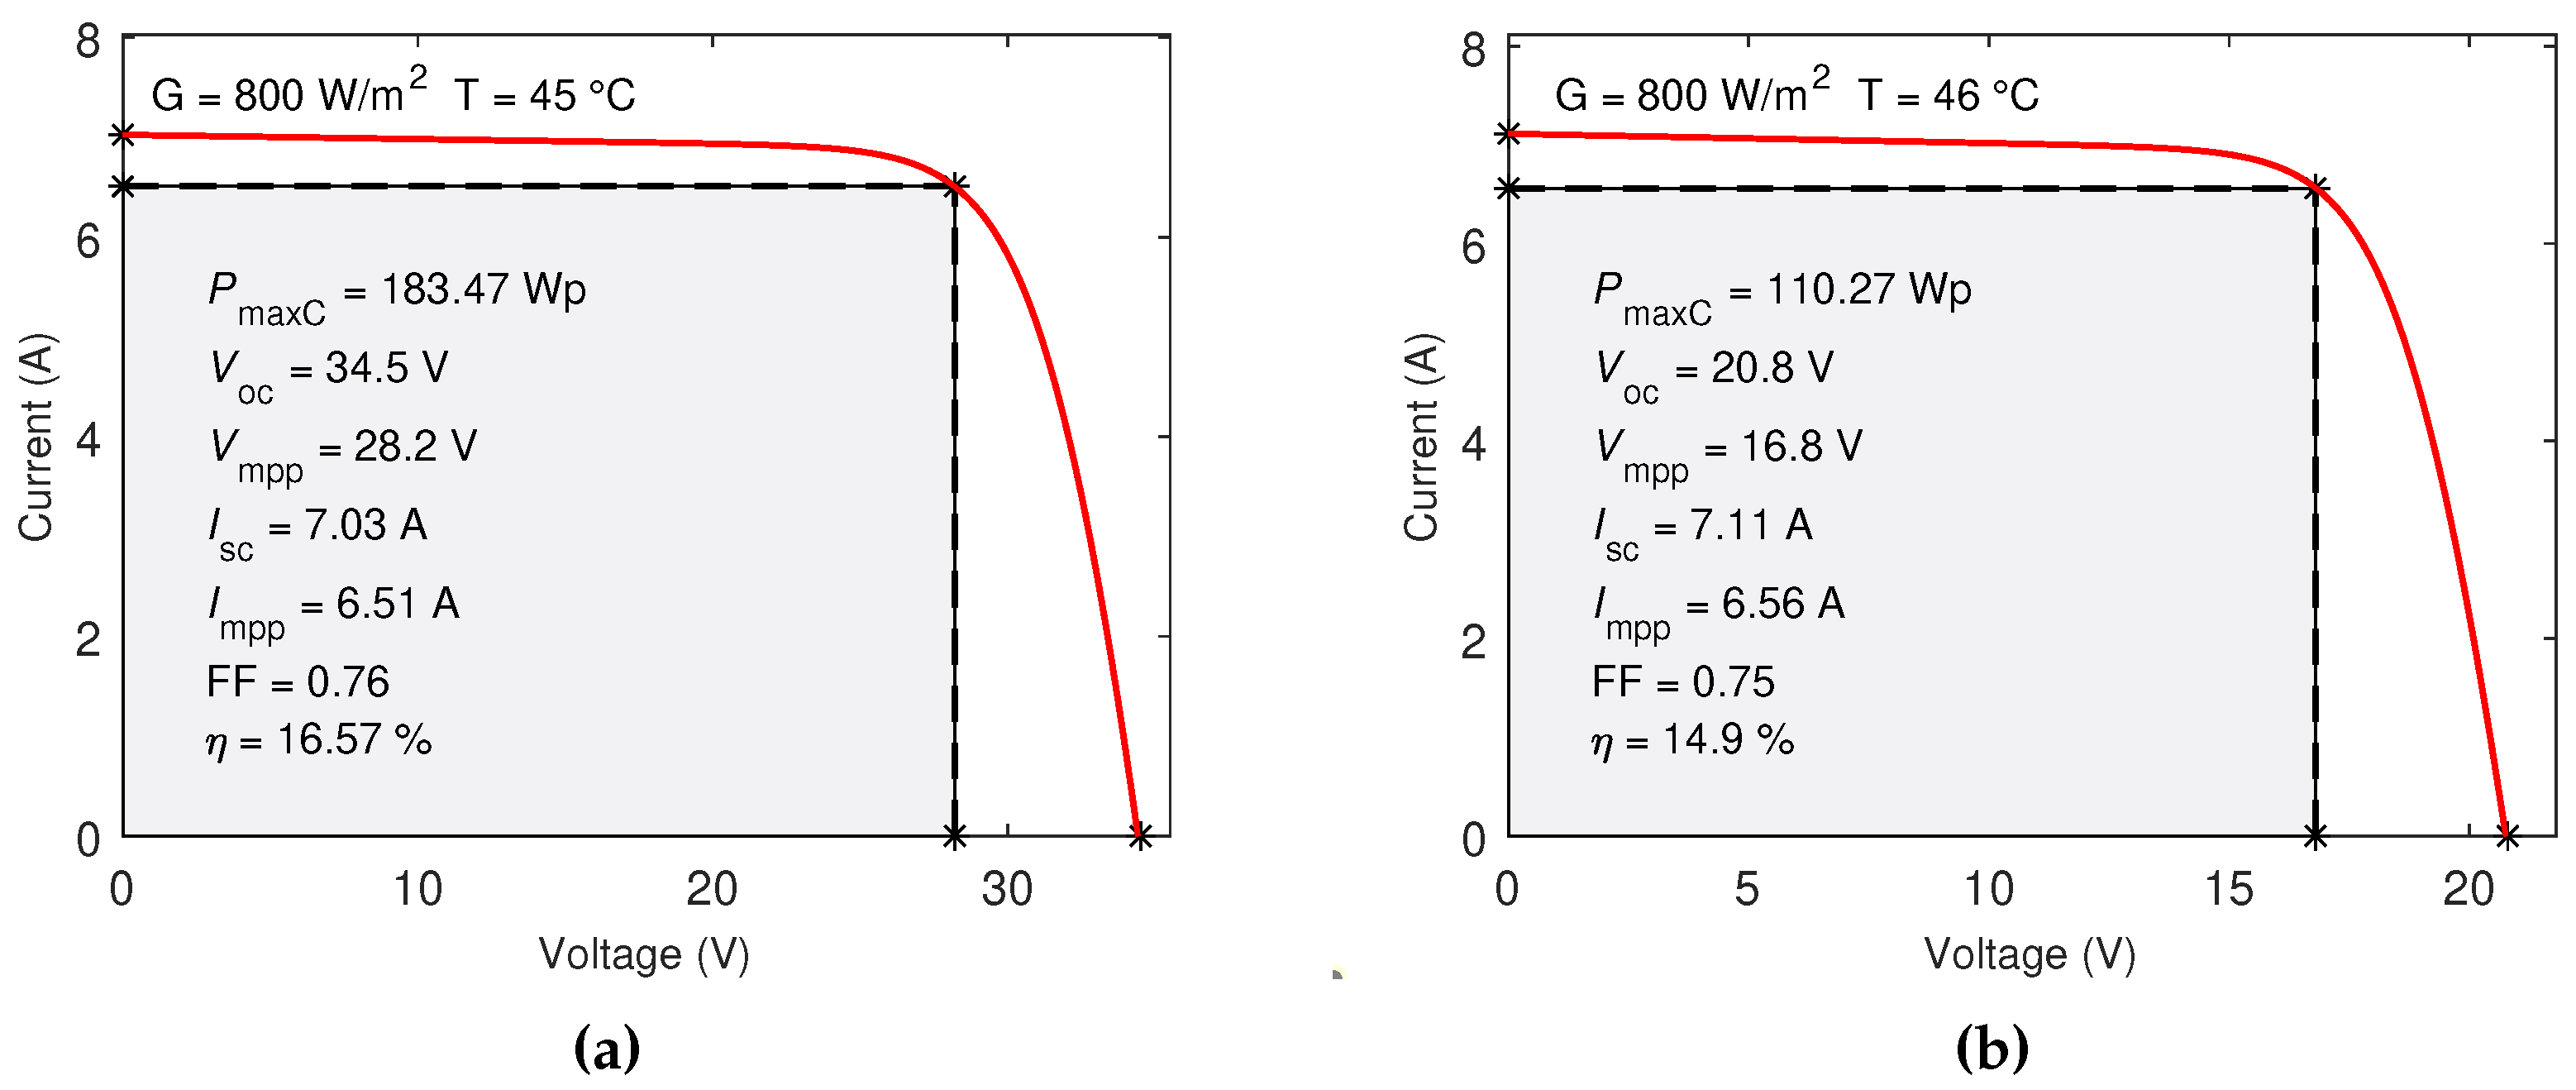
- The modeling algorithm reaches the stopping condition when for STC.
3.2. Simulating the effect of irradiance and temperature
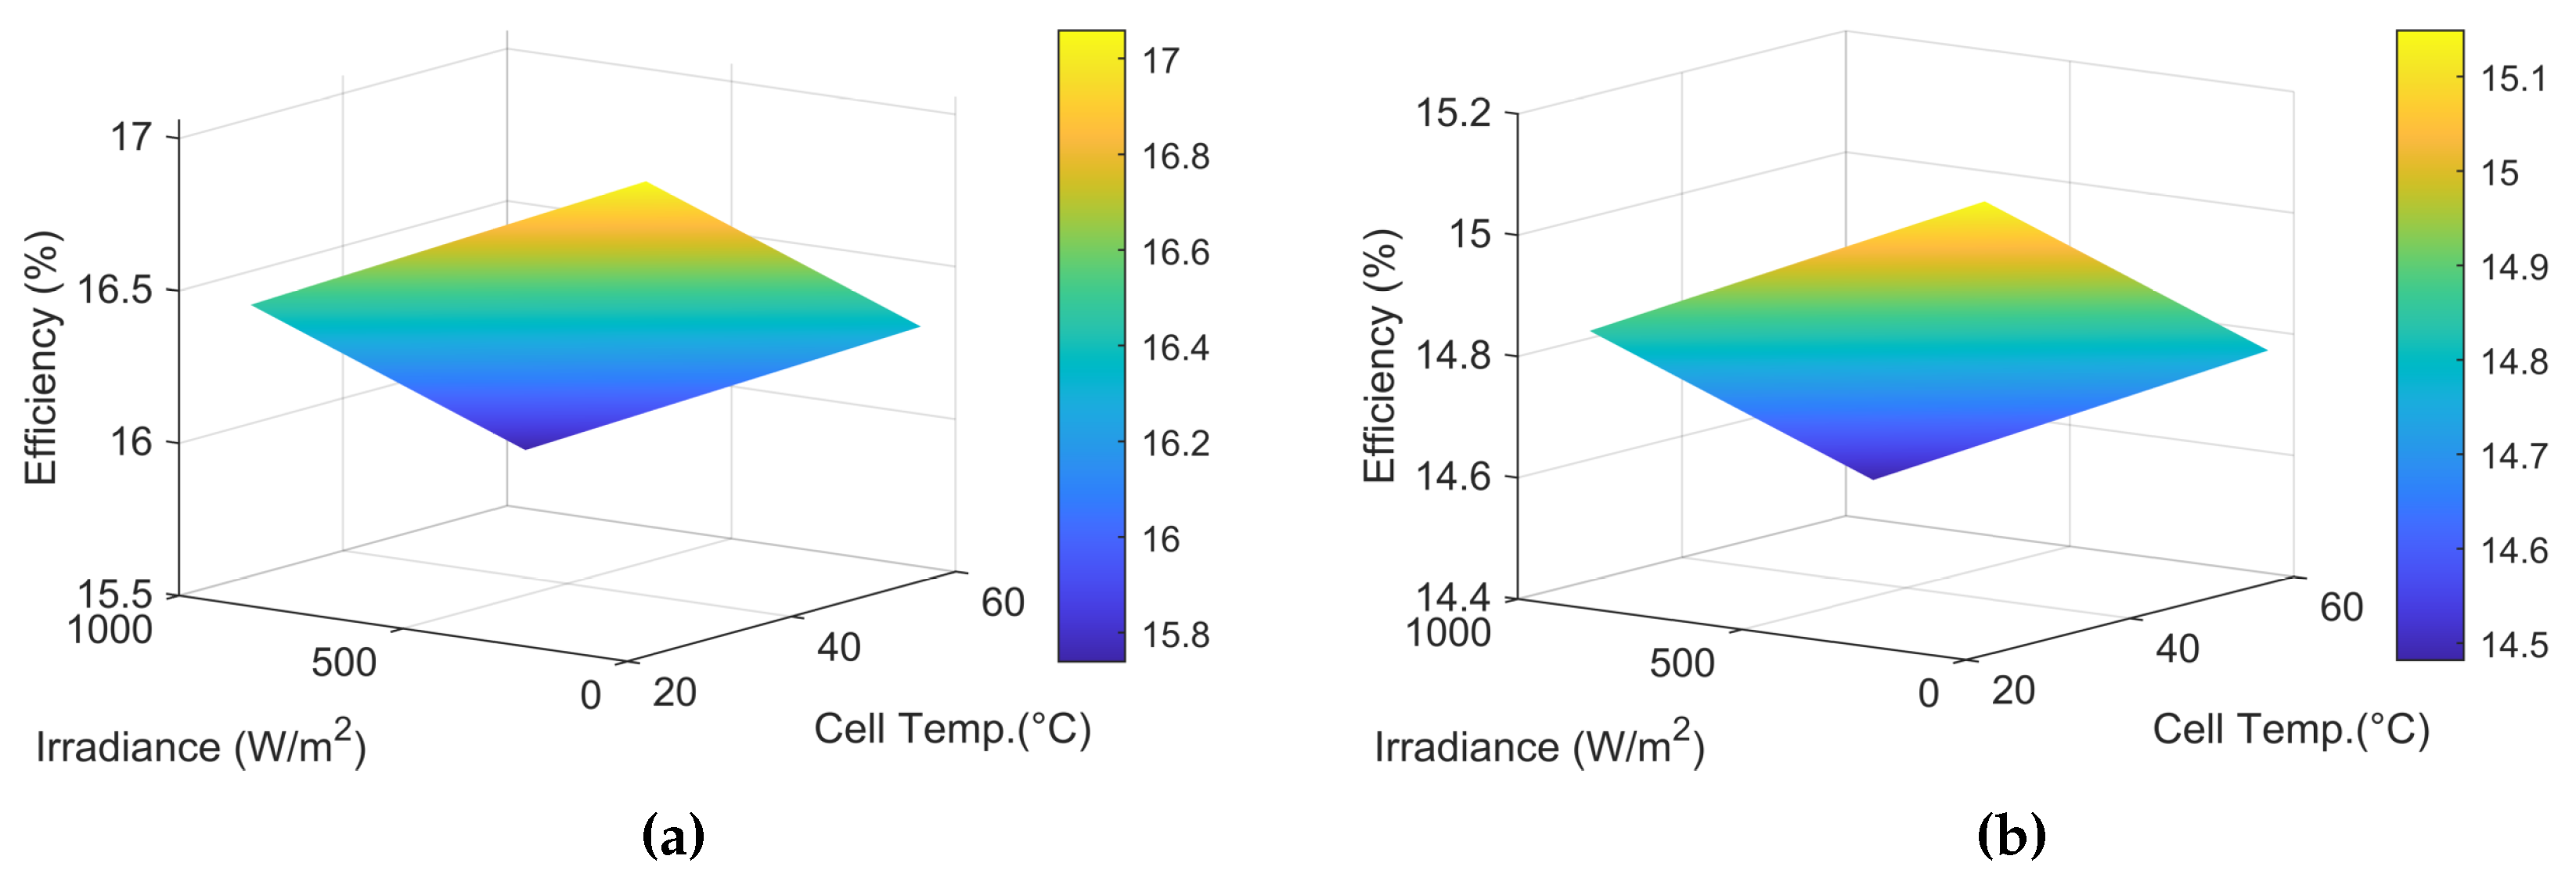
3.3. Predictions of PV efficiency
3.4. Obtaining daily energy output
4. Discussion
- 1st column: date and time 01/01/2022 0:00:00
- 2nd column: irradiance value G ()
- 3th column: ambient temperature value ()
5. Conclusions
- In Block 1, only the electrical parameters and dimensions of the PV cell from the manufacturer’s datasheet are needed to solve the two-diode model, without the need for field measurements.
- In Block 3, the Newton-Raphson iterative method applied to solve the two-diode modeling provided accurate results for extraction of the seven unknown internal parameters (, , , , , , ) for the two PV modules investigated. For STC conditions, MAE=0.01 and MAE=0.1 errors were obtained for HEE215MA68 and SW150polyR6A respectively, at the maximum power point, evidenced that the iterative method calculates according to the tolerance defined by the manufacturer.
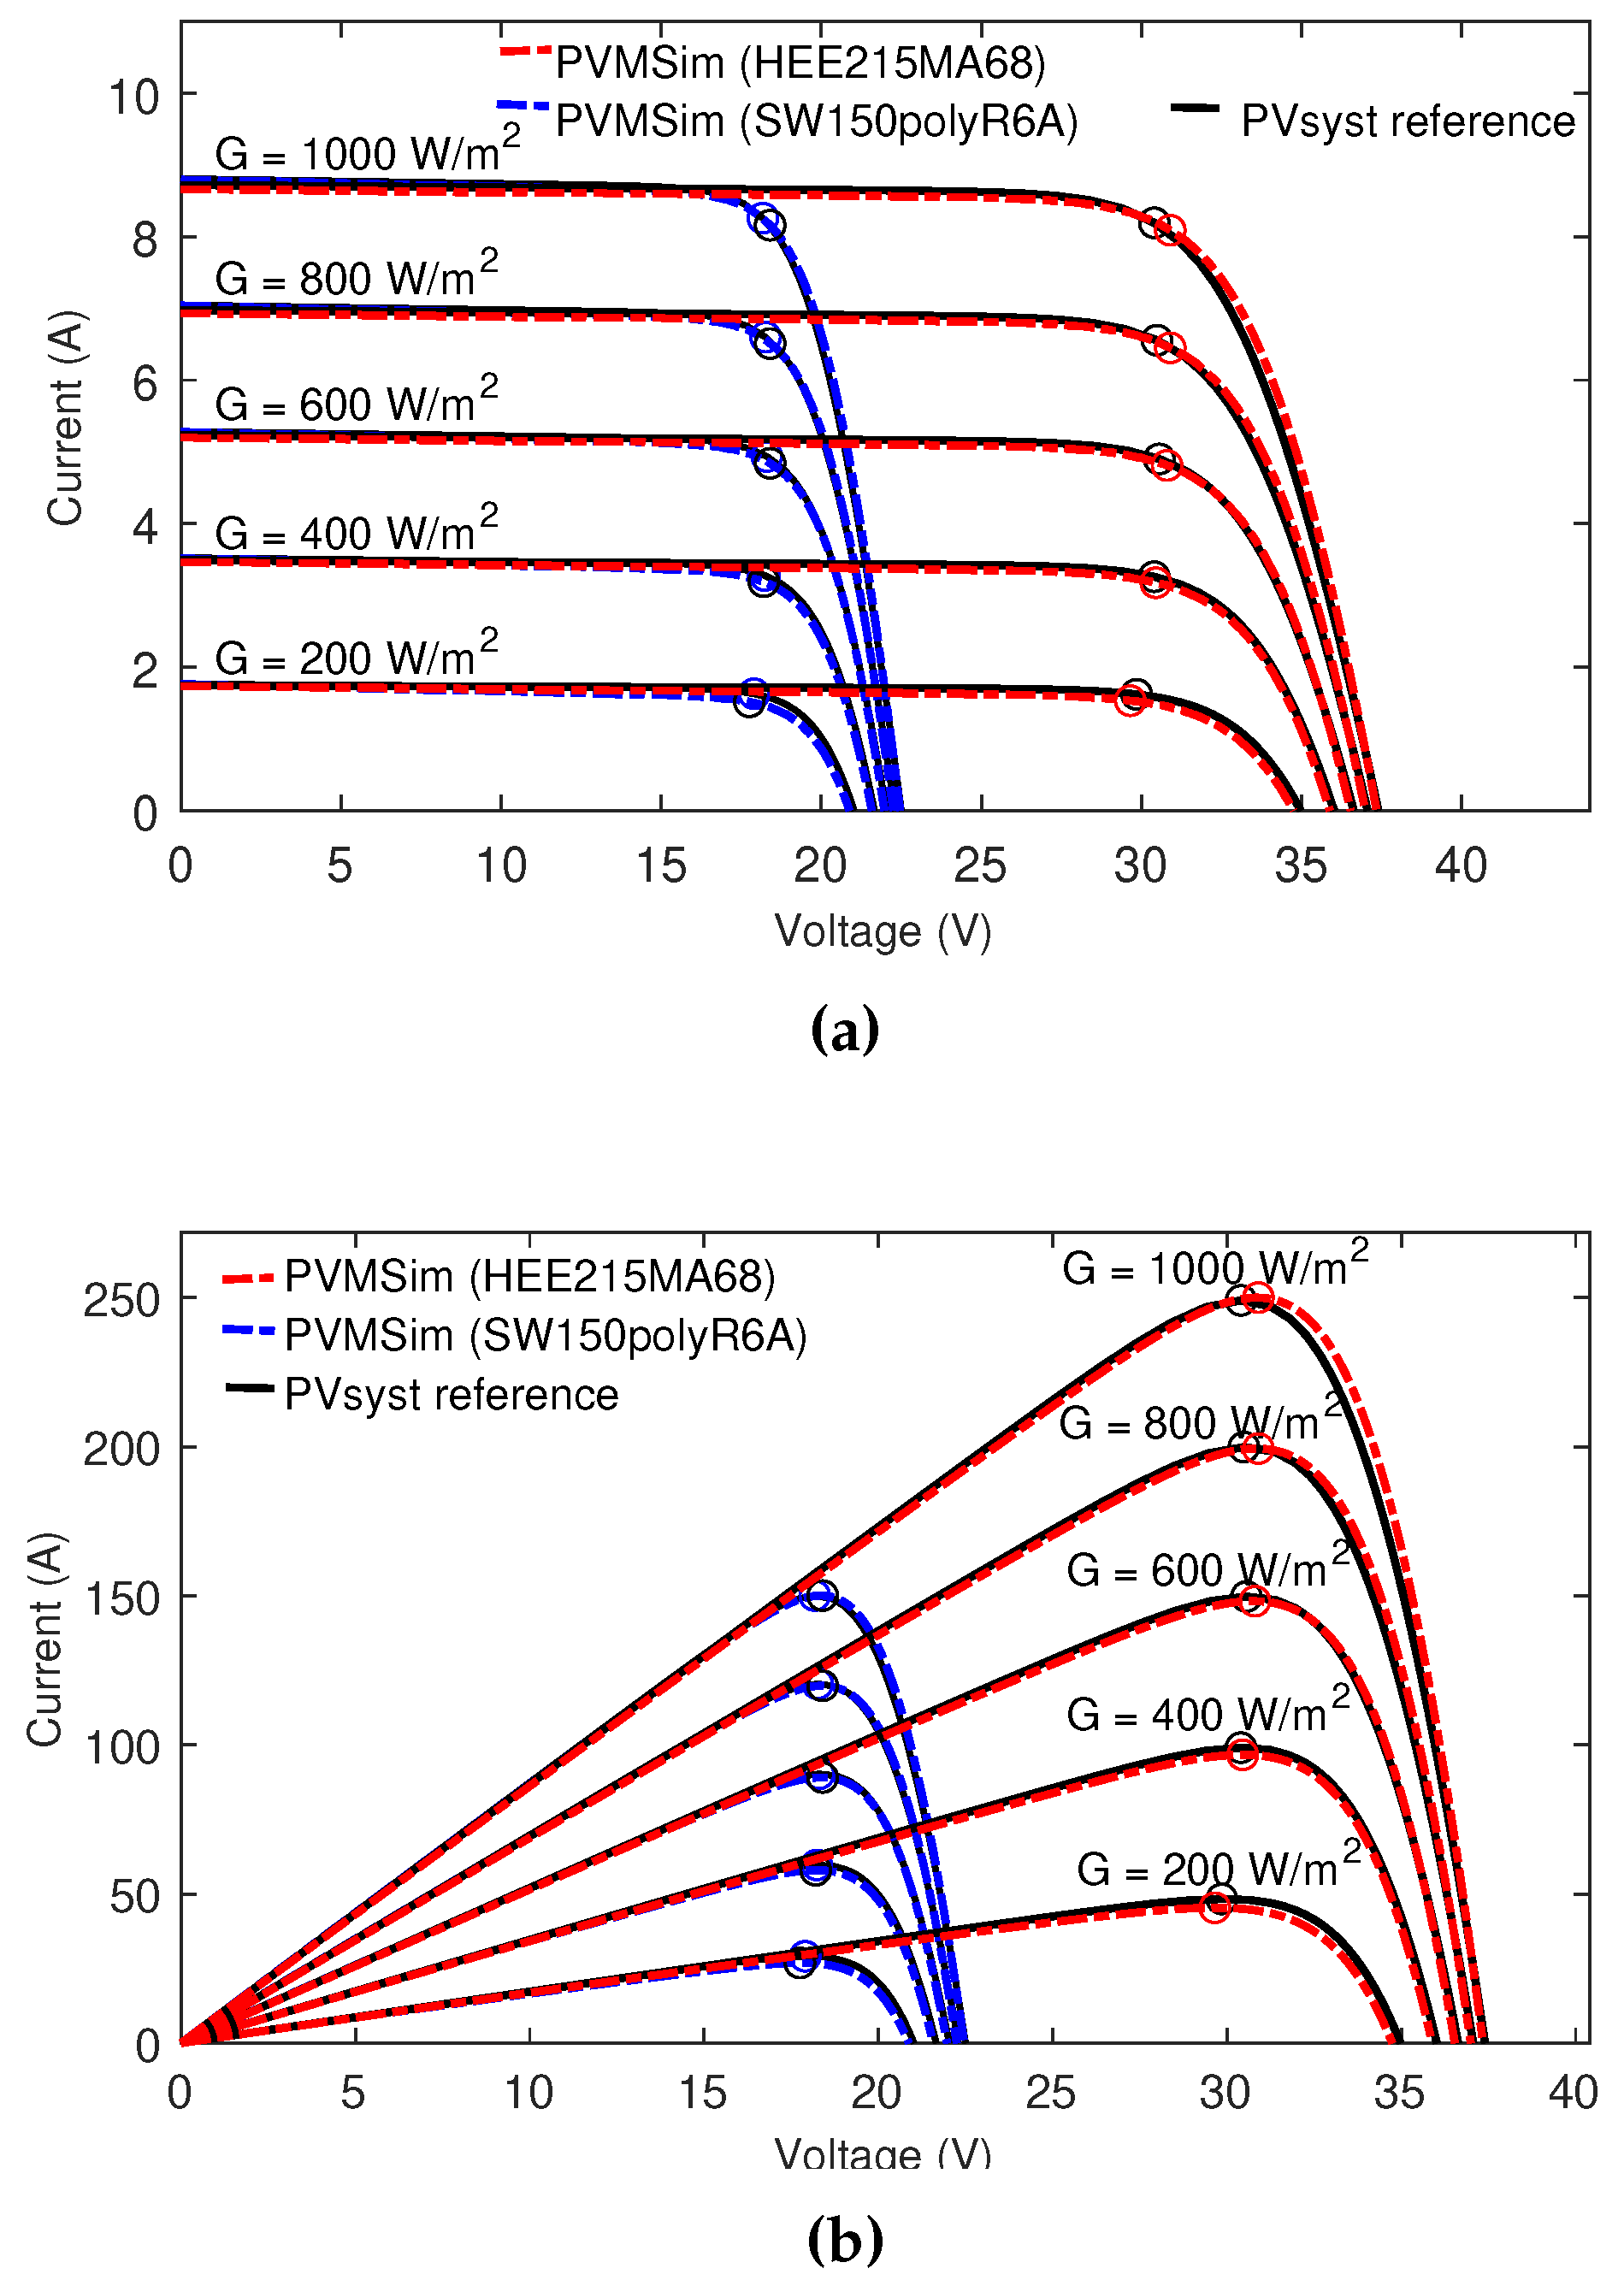
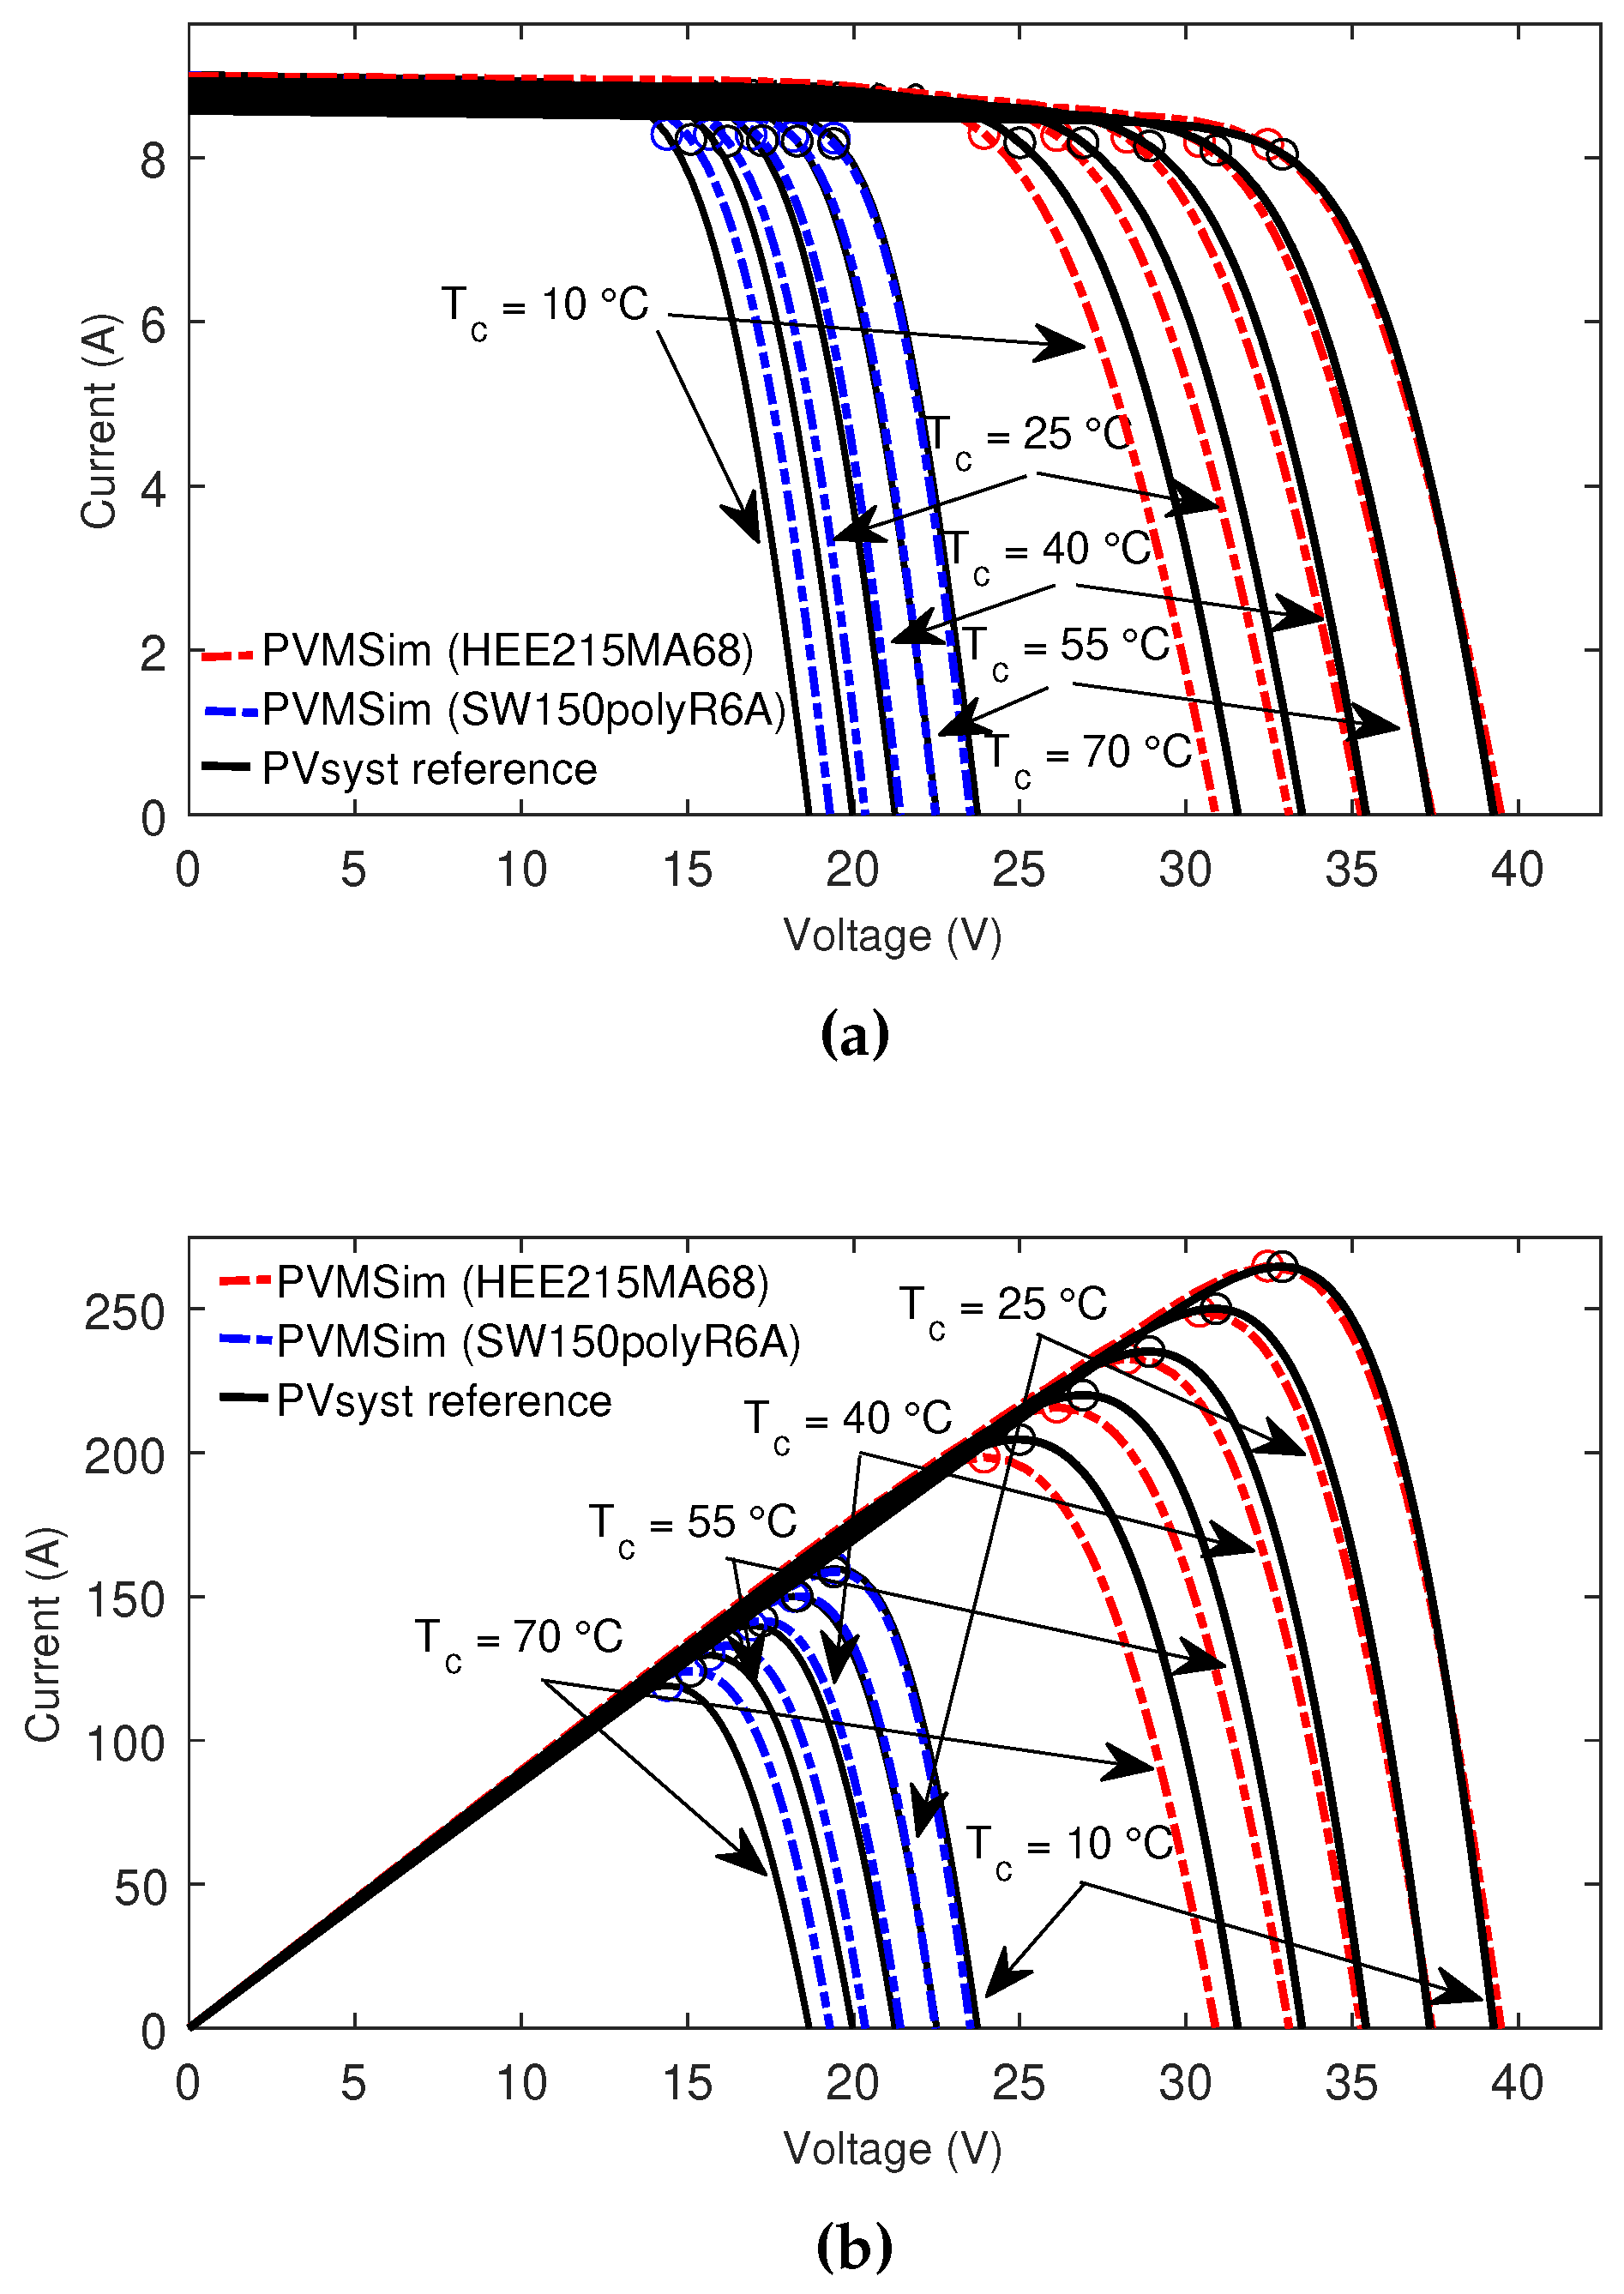
- In Block 4, the methodology applied for the plotting of the V-I and V-P characteristic curves, and , allows obtaining them at different irradiance and temperature levels other than STC and NOC laboratory conditions.
- In Block 5, the effect of weather parameters (G and ) on electrical parameters (, , , , , ) was simulated using a NASA dataset. Therefore, the daily energy produced is calculated.
- Finally, PVMSim is a useful Toolbox for users to model and simulate the PV modules silicon-based, for any weather conditions. This GUI-based tool allows interaction with the other complementary toolboxes of MATLAB that offer a wide variety of engineering and research applications.
Author Contributions
Funding
Institutional Review Board Statement
Informed Consent Statement
Data Availability Statement
Acknowledgments
Conflicts of Interest
References
- IRENA. Renewable Capacity Highlights-20 March 2023. https://www.irena.org/Publications/2023/Mar/Renewable-capacity-statistics-2023, accessed on April 10, 2023.
- IRENA. Renewable capacity statistics 2023, International Renewable Energy Agency, Abu Dhabi. https://www.irena.org/Publications/2023/Mar/Renewable-capacity-statistics-2023, accessed on April 18, 2023.
- Sarquis Filho, E.A.; Fernandes, C.A.F.; da Costa Branco, P.J. A complete framework for the simulation of photovoltaic arrays under mismatch conditions. Solar Energy 2021, 213, 13–26. [CrossRef]
- Abbassi, A.; Ben Mehrez, R.; Touaiti, B.; Abualigah, L.; Touti, E. Parameterization of photovoltaic solar cell double-diode model based on improved arithmetic optimization algorithm. Optik 2022, 253, 168600. [CrossRef]
- Tao, M.; Fthenakis, V.; Ebin, B.; Steenari, B.M.; Butler, E.; Sinha, P.; Corkish, R.; Wambach, K.; Simon, E.S. Major challenges and opportunities in silicon solar module recycling. Progress in Photovoltaics: Research and Applications 2020, 28, 1077–1088. [CrossRef]
- Shockley, W.; Queisser, H.J. Detailed balance limit of efficiency of p-n junction solar cells. Journal of applied physics 1961, 32, 510–519. [CrossRef]
- Schwingshackl, C.; Petitta, M.; Wagner, J.E.; Belluardo, G.; Moser, D.; Castelli, M.; Zebisch, M.; Tetzlaff, A. Wind effect on PV module temperature: Analysis of different techniques for an accurate estimation. Energy Procedia 2013, 40, 77–86. [CrossRef]
- Munoz, M.A.; Alonso-García, M.C.; Vela, N.; Chenlo, F. Early degradation of silicon PV modules and guaranty conditions. Solar Energy 2011, 85, 2264–2274. [CrossRef]
- Kinsey, G.S. Solar cell efficiency divergence due to operating spectrum variation. Solar Energy 2021, 217, 49–57. [CrossRef]
- Umoette, A.T.; Ubom, E.A.; Akpan, I.E. Comparative Analysis of Three NOCT-Based Cell Temperature Models. International Journal of Systems Science and Applied Mathematics 2016, 1, 69. [CrossRef]
- Duffie, J.A.; Beckman, W.A.; McGowan, J. Solar Engineering of Thermal Processes . American Journal of Physics 1985, 53, 382–382. [CrossRef]
- Venkateswari, R.; Rajasekar, N. Review on parameter estimation techniques of solar photovoltaic systems. International Transactions on Electrical Energy Systems 2021, 31, 1–72. [CrossRef]
- Houssein, E.H.; Zaki, G.N.; Diab, A.A.Z.; Younis, E.M. An efficient Manta Ray Foraging Optimization algorithm for parameter extraction of three-diode photovoltaic model. Computers & Electrical Engineering 2021, 94, 107304. [CrossRef]
- Ridha, H.M.; Hizam, H.; Gomes, C.; Heidari, A.A.; Chen, H.; Ahmadipour, M.; Muhsen, D.H.; Alghrairi, M. Parameters extraction of three diode photovoltaic models using boosted LSHADE algorithm and Newton Raphson method. Energy 2021, 224, 120136. [CrossRef]
- Castro, R.; Silva, M. Experimental and theoretical validation of one diode and three parameters–based pv models. Energies 2021, 14. [CrossRef]
- Huang, C.M.; Chen, S.J.; Yang, S.P. A Parameter Estimation Method for a Photovoltaic Power Generation System Based on a Two-Diode Model. Energies 2022, 15, 1–16. [CrossRef]
- Siddiqui, M.U.; Siddiqui, O.K.; Alquaity, A.B.; Ali, H.; Arif, A.F.; Zubair, S.M. A comprehensive review on multi-physics modeling of photovoltaic modules. Energy Conversion and Management 2022, 258, 115414. [CrossRef]
- Almaktoof, A.; Shebani, N.; Elfallah, A. GUI-PV Application Tool for Teaching Performance of PV System using MATLAB-Graphical User Interface Environment. In Proceedings of the 2021 IEEE 1st International Maghreb Meeting of the Conference on Sciences and Techniques of Automatic Control and Computer Engineering MI-STA, 2021, pp. 447–451. [CrossRef]
- Shekoofa, O.; Wang, J.; Luo, Y.; Sun, C.; Xiong, B. PVSIM-GUI, a characterization tool for parameter extraction, modeling and simulation of pv devices. In Proceedings of the 31st European Photovoltaic Solar Energy Conference and Exhibitation, 2015, pp. 2249–52.
- Figueiredo, G.; Macêdo, W.; Pinho, J.T. Computational tool for sizing and assessment of grid-connected photovoltaic systems. Energy Procedia 2014, 57, 168–177. [CrossRef]
- Belhaouas, N.; Khechafi, S.; Mehareb, F.; Aseem, H.; Bensalem, S.; Hadj Arab, A. Electrical Standalone PV System Sizing with Graphic User Interface (GUI) based on UTE C15-712-2 Guide. Proceedings of 2019 7th International Renewable and Sustainable Energy Conference, IRSEC 2019 2019. [CrossRef]
- Aprilianti, K.P.; Baghta, N.A.; Aryani, D.R.; Jufri, F.H.; Utomo, A.R. Potential assessment of solar power plant: A case study of a small island in Eastern Indonesia. IOP Conference Series: Earth and Environmental Science 2020, 599. [CrossRef]
- Noor, S.Z.; Zaini, S.; Omar, A.M. Design of graphical user interface development environment software for sizing of Grid Connected Photovoltaic (GCPV) system. International Journal of Engineering and Technology(UAE) 2018, 7, 145–150. [CrossRef]
- Da Silva, J.R.C.; Pacheco, G.M. Open source software development in matlab for sizing photovoltaic systems. 2018 13th IEEE International Conference on Industry Applications, INDUSCON 2018 - Proceedings 2019, pp. 256–262. [CrossRef]
- Hassan, M.U.; Saha, S.; Haque, M.E. PVAnalytX: A MATLAB toolkit for techno-economic analysis and performance evaluation of rooftop PV systems. Energy 2021, 223, 120074. [CrossRef]
- Salim, S.; Ohri, J. Monitoring and Analysis of Solar PV based on GUI. In Proceedings of the 2020 First IEEE International Conference on Measurement, Instrumentation, Control and Automation (ICMICA), 2020, pp. 1–4. [CrossRef]
- Ruchira.; Sao, A.; Patel, R.N.; Sinha, S.K. GUI Supported Experimental Investigation of Central Inverter and Microinverter Integrated with 1kW PV System. 3rd International Conference and Workshops on Recent Advances and Innovations in Engineering, ICRAIE 2018 2018, 2018, 1–6. [CrossRef]
- Bilu, A.C.; Durusu, A.; Dogansahin, K.; Kekezoglu, B. A new educational software package for photovoltaic system feasibility: PVGUI. International Journal of Electrical Engineering Education 2019. [CrossRef]
- Bektas, S.C.; Cakmak, R.; Altas, I.H. Design of a MATLAB GUI for Day Ahead Forecasting of PV Panel Power. Proceedings - 2019 Innovations in Intelligent Systems and Applications Conference, ASYU 2019 2019, pp. 3–7. [CrossRef]
- Mittal, M.; Bora, B.; Saxena, S.; Gaur, A.M. Performance prediction of PV module using electrical equivalent model and artificial neural network. Solar Energy 2018, 176, 104–117. [CrossRef]
- Kermadi, M.; Chin, V.J.; Mekhilef, S.; Salam, Z. A fast and accurate generalized analytical approach for PV arrays modeling under partial shading conditions. Solar Energy 2020, 208, 753–765. [CrossRef]
- Mahmood, R.S.; Yaqoob Javed, M.; Tariq, A.R.; Rizvi, S.N.R.; Cheema, K.M.; Waqas, M. A Comprehensive approach to Study Double Diode Model and Shading Effects on Photovoltaic Arrays. Proceedings - 2020 23rd IEEE International Multi-Topic Conference, INMIC 2020 2020. [CrossRef]
- Lorenzo, E.; Araujo, G.; Cuevas, A.; Egido, M.; Minano, J.; Zilles, R. Solar Electricity: Engineering of Photovoltaic Systems. Ed., PROGENSA 1994, p. 316.
- Cubas, J.; Pindado, S.; De Manuel, C. Explicit expressions for solar panel equivalent circuit parameters based on analytical formulation and the lambert W-function. Energies 2014, 7, 4098–4115. [CrossRef]
- Meyer, E.L. Extraction of Saturation Current and Ideality Factor from Measuring Voc and Isc of Photovoltaic Modules. International Journal of Photoenergy 2017, 2017. [CrossRef]
- Villalva, M.G.; Gazoli, J.R.; Filho, E.R. Comprehensive approach to modeling and simulation of photovoltaic arrays. IEEE Transactions on Power Electronics 2009, 24, 1198–1208. [CrossRef]
- Lo Brano, V.; Orioli, A.; Ciulla, G.; Di Gangi, A. An improved five-parameter model for photovoltaic modules. Solar Energy Materials and Solar Cells 2010, 94, 1358–1370. [CrossRef]
- Farivar, G.; Asaei, B. Photovoltaic module single diode model parameters extraction based on manufacturer datasheet parameters. PECon2010 - 2010 IEEE International Conference on Power and Energy 2010, pp. 929–934. [CrossRef]
- Piliougine, M.; Guejia-Burbano, R.A.; Petrone, G.; Sánchez-Pacheco, F.J.; Mora-López, L.; Sidrach-de Cardona, M. Parameters extraction of single diode model for degraded photovoltaic modules. Renewable Energy 2021, 164, 674–686. [CrossRef]
- Chaibi, Y.; Salhi, M.; El-jouni, A.; Essadki, A. A new method to extract the equivalent circuit parameters of a photovoltaic panel. Solar Energy 2018, 163, 376–386. [CrossRef]
- Ishaque, K.; Salam, Z.; Syafaruddin. A comprehensive MATLAB Simulink PV system simulator with partial shading capability based on two-diode model. Solar Energy 2011, 85, 2217–2227. [CrossRef]
- Ishaque, K.; Salam, Z.; Taheri, H. Simple, fast and accurate two-diode model for photovoltaic modules. Solar Energy Materials and Solar Cells 2011, 95, 586–594. [CrossRef]
- Aoun, N.; Bouchouicha, K.; Bailek, N. Seasonal Performance Comparison of Four Electrical Models of Monocrystalline PV Module Operating in a Harsh Environment. IEEE Journal of Photovoltaics 2019, 9, 1057–1063. [CrossRef]
- Al-Masri, H.M.K.; Magableh, S.K.; Abuelrub, A.; Saadeh, O.; Ehsani, M. Impact of Different Photovoltaic Models on the Design of a Combined Solar Array and Pumped Hydro Storage System. Applied Sciences 2020, 10. [CrossRef]
- Franzitta, V.; Orioli, A.; Di Gangi, A. Assessment of the usability and accuracy of two-diode models for photovoltaic modules. Energies 2017, 10. [CrossRef]
- Chennoufi, K.; Ferfra, M.; Mokhlis, M. An accurate modelling of Photovoltaic modules based on two-diode model. Renewable Energy 2021, 167, 294–305. [CrossRef]
- Meng, Z.; Zhao, Y.; Tang, S.; Sun, Y. An efficient datasheet-based parameters extraction method for two-diode photovoltaic cell and cells model. Renewable Energy 2020, 153, 1174–1182. [CrossRef]
- Morcillo-Herrera, C.; Hernández-Sánchez, F.; Flota-Bañuelos, M. Method to calculate the electricity generated by a photovoltaic cell, based on its mathematical model simulations in MATLAB. International Journal of Photoenergy 2015, 2015. [CrossRef]
- Richter, A.; Hermle, M.; Glunz, S.W. Reassessment of the limiting efficiency for crystalline silicon solar cells. IEEE Journal of Photovoltaics 2013, 3, 1184–1191. [CrossRef]
- Leilaeioun, M.; Holman, Z.C. Accuracy of expressions for the fill factor of a solar cell in terms of open-circuit voltage and ideality factor. Journal of Applied Physics 2016, 120. [CrossRef]
- Fernández-Solas, Á.; Montes-Romero, J.; Micheli, L.; Almonacid, F.; Fernández, E.F. Estimation of soiling losses in photovoltaic modules of different technologies through analytical methods. Energy 2022, 244. [CrossRef]
- Green, M.; Blakers, A.; Shi, J.; Keller, E.; Wenham, S. High-efficiency silicon solar cells. IEEE Transactions on Electron Devices 1984, 31, 679–683. [CrossRef]
- Skoplaki, E.; Boudouvis, A.; Palyvos, J. A simple correlation for the operating temperature of photovoltaic modules of arbitrary mounting. Solar Energy Materials and Solar Cells 2008, 92, 1393–1402. [CrossRef]
- Kamuyu, W.C.L.; Lim, J.R.; Won, C.S.; Ahn, H.K. Prediction model of photovoltaic module temperature for power performance of floating PVs. Energies 2018, 11. [CrossRef]
- Mukisa, N.; Zamora, R.; Lie, T.T. Analysis of Solar Cell Temperature Models used in Solar Photovoltaic Simulating Softwares. 2019 IEEE PES GTD Grand International Conference and Exposition Asia, GTD Asia 2019 2019, pp. 124–129. [CrossRef]
- Appelbaum, J.; Maor, T. Dependence of PV Module Temperature on Incident Time-Dependent Solar Spectrum. Applied Sciences 2020, 10. [CrossRef]
- Stackhouse, P. NASA POWER|Data Access Viewer. https://power.larc.nasa.gov/data-access-viewer/, accessed on March 26, 2023.
- Osorio Laurencio, L.; Retirado-Mediaceja, Y.; Yero, R.P.; Ramos, R. Assessing different models to estimate photovoltaic monocrystalline modules operating temperature using weather data. https://rie.cujae.edu.cu/index.php/RIE/article/view/705/858, accessed on February 13, 2023.
- Patchali, T.E.; Ajide, O.O.; Matthew, O.J.; Salau, T.A.; Oyewola, O.M. Generation of meteorological year for the assessment of photovoltaic systems performance in Togo, West Africa. Scientific African 2022, 16, e01171. [CrossRef]
- Sun, T.; Shan, M.; Rong, X.; Yang, X. Estimating the spatial distribution of solar photovoltaic power generation potential on different types of rural rooftops using a deep learning network applied to satellite images. Applied Energy 2022, 315, 119025. [CrossRef]
- Sengupta, M.; Xie, Y.; Lopez, A.; Habte, A.; Maclaurin, G.; Shelby, J. The National Solar Radiation Data Base (NSRDB). Renewable and Sustainable Energy Reviews 2018, 89, 51–60. [CrossRef]
- Santiago, I.; Trillo-Montero, D.; Moreno-Garcia, I.; Pallarés-López, V.; Luna-Rodríguez, J. Modeling of photovoltaic cell temperature losses: A review and a practice case in South Spain. Renewable and Sustainable Energy Reviews 2018, 90, 70–89. [CrossRef]
- Ross, R.; Smokler, M.I. Flat-Plate solar array project final report,. Volume VI: Engineering Sciences and Reliability, Report DOE/JPL-1012-125; JPL: California, United States of America, 1986.
- Bailek, N.; Bouchouicha, K.; Hassan, M.A.; Slimani, A.; Jamil, B. Implicit regression-based correlations to predict the back temperature of PV modules in the arid region of south Algeria. Renewable Energy 2020, 156, 57–67. [CrossRef]
- Silva, D.D.; Marson, V.; de Souza, R.R.; de Oliveira, J.D.; Silva, J.B.C.; Cardoso, E.M. A new predictive model for a photovoltaic module’s surface temperature. Energy Reports 2022, 8, 15206–15220. [CrossRef]
- Yolcan, O.O.; Kose, R. Photovoltaic module cell temperature estimation: Developing a novel expression. Solar Energy 2023, 249, 1–11. [CrossRef]
- Alexis Alvarado Silva, C.; Mejia Vasquez, O.; Orlando Gamarra-Rosado, V. Development of a Virtual Learning Module Using Graphic Interface for Remote Teaching of Photovoltaic Systems. ACM International Conference Proceeding Series 2021, pp. 46–52. [CrossRef]
- HELIENE. Helios Energy Europe S.L. Photovoltaics Modules. https://avdira-solar.eu/pdf/heliene/215m_en.pdf, accessed on March 12, 2023.
- SolarWorld. Sunmodule SW 150 poly R6A. https://www.enfsolar.com/Product/pdf/Crystalline/57733963c96c5.pdf, accessed on February 20, 2023.
- PVsyst. PVsyst S.A. - official website. https://www.pvsyst.com, accessed on February 13, 2023.
- Meng, Z.; Zhao, Y.; Tang, S.; Sun, Y. An efficient datasheet-based parameters extraction method for two-diode photovoltaic cell and cells model. Renewable Energy 2020, 153, 1174–1182. [CrossRef]
- Xu, J.; Zhou, C.; Li, W. Photovoltaic single diode model parameter extraction by dI/dV-assisted deterministic method. Solar Energy 2023, 251, 30–38. [CrossRef]
- Toledo, F.J.; Galiano, V.; Blanes, J.M.; Herranz, V.; Batzelis, E. Photovoltaic single-diode model parametrization. An application to the calculus of the Euclidean distance to an I–V curve. Mathematics and Computers in Simulation 2023. [CrossRef]
- Qais, M.H.; Hasanien, H.M.; Alghuwainem, S.; Loo, K.; Elgendy, M.; Turky, R.A. Accurate Three-Diode model estimation of Photovoltaic modules using a novel circle search algorithm. Ain Shams Engineering Journal 2022, 13, 101824. [CrossRef]
- Garip, Z. Parameters estimation of three-diode photovoltaic model using fractional-order Harris Hawks optimization algorithm. Optik 2023, 272, 170391. [CrossRef]
- Benda, V.; Cerna, L. A Note on Limits and Trends in PV Cells and Modules. Applied Sciences 2022, 12. [CrossRef]
- Min, K.H.; Kim, T.; Kang, M.G.; Song, H.e.; Kang, Y.; Lee, H.S.; Kim, D.; Park, S.; Lee, S.H. An Analysis of Fill Factor Loss Depending on the Temperature for the Industrial Silicon Solar Cells. Energies 2020, 13. [CrossRef]
- Serenelli, L.; Martini, L.; Menchini, F.; Izzi, M.; de Cesare, G.; Condorelli, G.; Gerardi, C.; Muñoz, D.; Tucci, M. Selective contacts and fill factor limitations in heterojunction solar cells. Progress in Photovoltaics: Research and Applications 2021, 29, 876–884. [CrossRef]
- Raillani, B.; Ouali, H.A.L.; Amraqui, S.; Moussaoui, M.A.; Mezrhab, A. Analyze and Study on Photovoltaic Parameters of Mono-Crystalline Silicon Solar Cell. In Proceedings of the 2019 International Conference on Intelligent Systems and Advanced Computing Sciences (ISACS), 2019, pp. 1–5. [CrossRef]
- Stein, J.S.; Holmgren, W.F.; Forbess, J.; Hansen, C.W. PVLIB: Open source photovoltaic performance modeling functions for Matlab and Python. In Proceedings of the 2016 IEEE 43rd Photovoltaic Specialists Conference (PVSC), 2016, pp. 3425–3430. [CrossRef]
- Theristis, M.; Livera, A.; Micheli, L.; Jones, C.B.; Makrides, G.; Georghiou, G.E.; Stein, J.S. Modeling nonlinear photovoltaic degradation rates. In Proceedings of the 2020 47th IEEE Photovoltaic Specialists Conference (PVSC), 2020, pp. 0208–0212. [CrossRef]
- Driesse, A.; Theristis, M.; Stein, J.S. PV Module Operating Temperature Model Equivalence and Parameter Translation. In Proceedings of the 2022 IEEE 49th Photovoltaics Specialists Conference (PVSC), 2022, pp. 0172–0177. [CrossRef]




| HEE215MA68 | SW150polyR6A | |||
|---|---|---|---|---|
| Parameter | STC | NOC | STC | NOC |
| 250±3% | 183 | 150±2% | 110.1 | |
| 37.40 | 34.5 | 22.5 | 20.5 | |
| 30.3 | 27.7 | 18.3 | 16.6 | |
| 8.72 | 7.25 | 8.81 | 7.17 | |
| 8.22 | 6.7 | 8.27 | 6.62 | |
| -0.34 | - | -0.31 | - | |
| - | 45 | - | 46 | |
| No | Parameter | HEE215MA68 | SW150polyR6A |
|---|---|---|---|
| 1 and 2 | |||
| 3 | 8.67 | 8.81 | |
| 4 | 1 | 1 | |
| 5 | 1.2 | 1.2 | |
| 6 | 0.229 | 0.166 | |
| 7 | 233.569 | 105.973 |
| HEE215MA68 | SW150polyR6A | ||||||
|---|---|---|---|---|---|---|---|
| Condition | Parameter | Datasheet | PVMSim | MAE | Datasheet | PVMSim | MAE |
| 250 | 250.01 | 0.01 | 150 | 150.1 | 0.1 | ||
| STC | 37.4 | 37.4 | 0 | 22.5 | 22.5 | 0 | |
| 8.72 | 8.66 | 0.06 | 8.81 | 8.8 | 0.01 | ||
| 183 | 183.47 | 0.47 | 110.1 | 110.27 | 0.17 | ||
| NOC | 34.5 | 34.5 | 0 | 20.5 | 20.8 | 0.30 | |
| 7.25 | 7.03 | 0.22 | 7.17 | 7.11 | 0.06 | ||
| HEE215MA68 | SW150polyR6A | ||||||
|---|---|---|---|---|---|---|---|
| Condition | Value | PVsyst | PVMSim | MAE | PVsyst | PVMSim | MAE |
| 48.35 | 45.40 | 2.95 | 29.13 | 27.00 | 2.13 | ||
| 99.08 | 96.69 | 2.39 | 59.74 | 58.09 | 1.65 | ||
| 149.76 | 148.21 | 1.55 | 90.30 | 89.17 | 1.13 | ||
| 199.88 | 199.39 | 0.49 | 120.50 | 119.89 | 0.61 | ||
| 249.10 | 250.01 | 0.91 | 150.10 | 150.10 | 0 | ||
| 264.81 | 264.60 | 0.21 | 159.89 | 158.56 | 1.36 | ||
| 249.10 | 250.01 | 0.91 | 150.10 | 150.10 | 0 | ||
| 232.76 | 235.13 | 2.37 | 140.02 | 141.52 | 1.50 | ||
| 215.86 | 219.98 | 4.12 | 129.67 | 132.85 | 3.18 | ||
| 198.41 | 204.56 | 6.15 | 119.07 | 124.08 | 5.01 | ||
| PV Module | Parameter | 21th March | 21th June | 21th Sept. | 21th Dec. |
|---|---|---|---|---|---|
| HEE215MA68 | 998.7 | 710.3 | 602.7 | 639.5 | |
| 28.4 | 29.5 | 28.2 | 25.8 | ||
| 59.61 | 51.7 | 47.03 | 45.78 | ||
| 182.51 | 141.28 | 124.08 | 132.06 | ||
| 16.25 | 16.44 | 16.52 | 16.55 | ||
| SW150polyR6A | 998.7 | 710.3 | 602.7 | 639.5 | |
| 28.4 | 29.5 | 28.2 | 25.8 | ||
| 60.86 | 52.58 | 47.79 | 46.58 | ||
| 110.13 | 85.33 | 74.9 | 79.66 | ||
| 14.74 | 14.83 | 14.88 | 14.89 |
Disclaimer/Publisher’s Note: The statements, opinions and data contained in all publications are solely those of the individual author(s) and contributor(s) and not of MDPI and/or the editor(s). MDPI and/or the editor(s) disclaim responsibility for any injury to people or property resulting from any ideas, methods, instructions or products referred to in the content. |
© 2023 by the authors. Licensee MDPI, Basel, Switzerland. This article is an open access article distributed under the terms and conditions of the Creative Commons Attribution (CC BY) license (http://creativecommons.org/licenses/by/4.0/).


