Submitted:
15 May 2023
Posted:
16 May 2023
You are already at the latest version
Abstract
Keywords:
1. Introduction
2. Description of the Constitutive Model
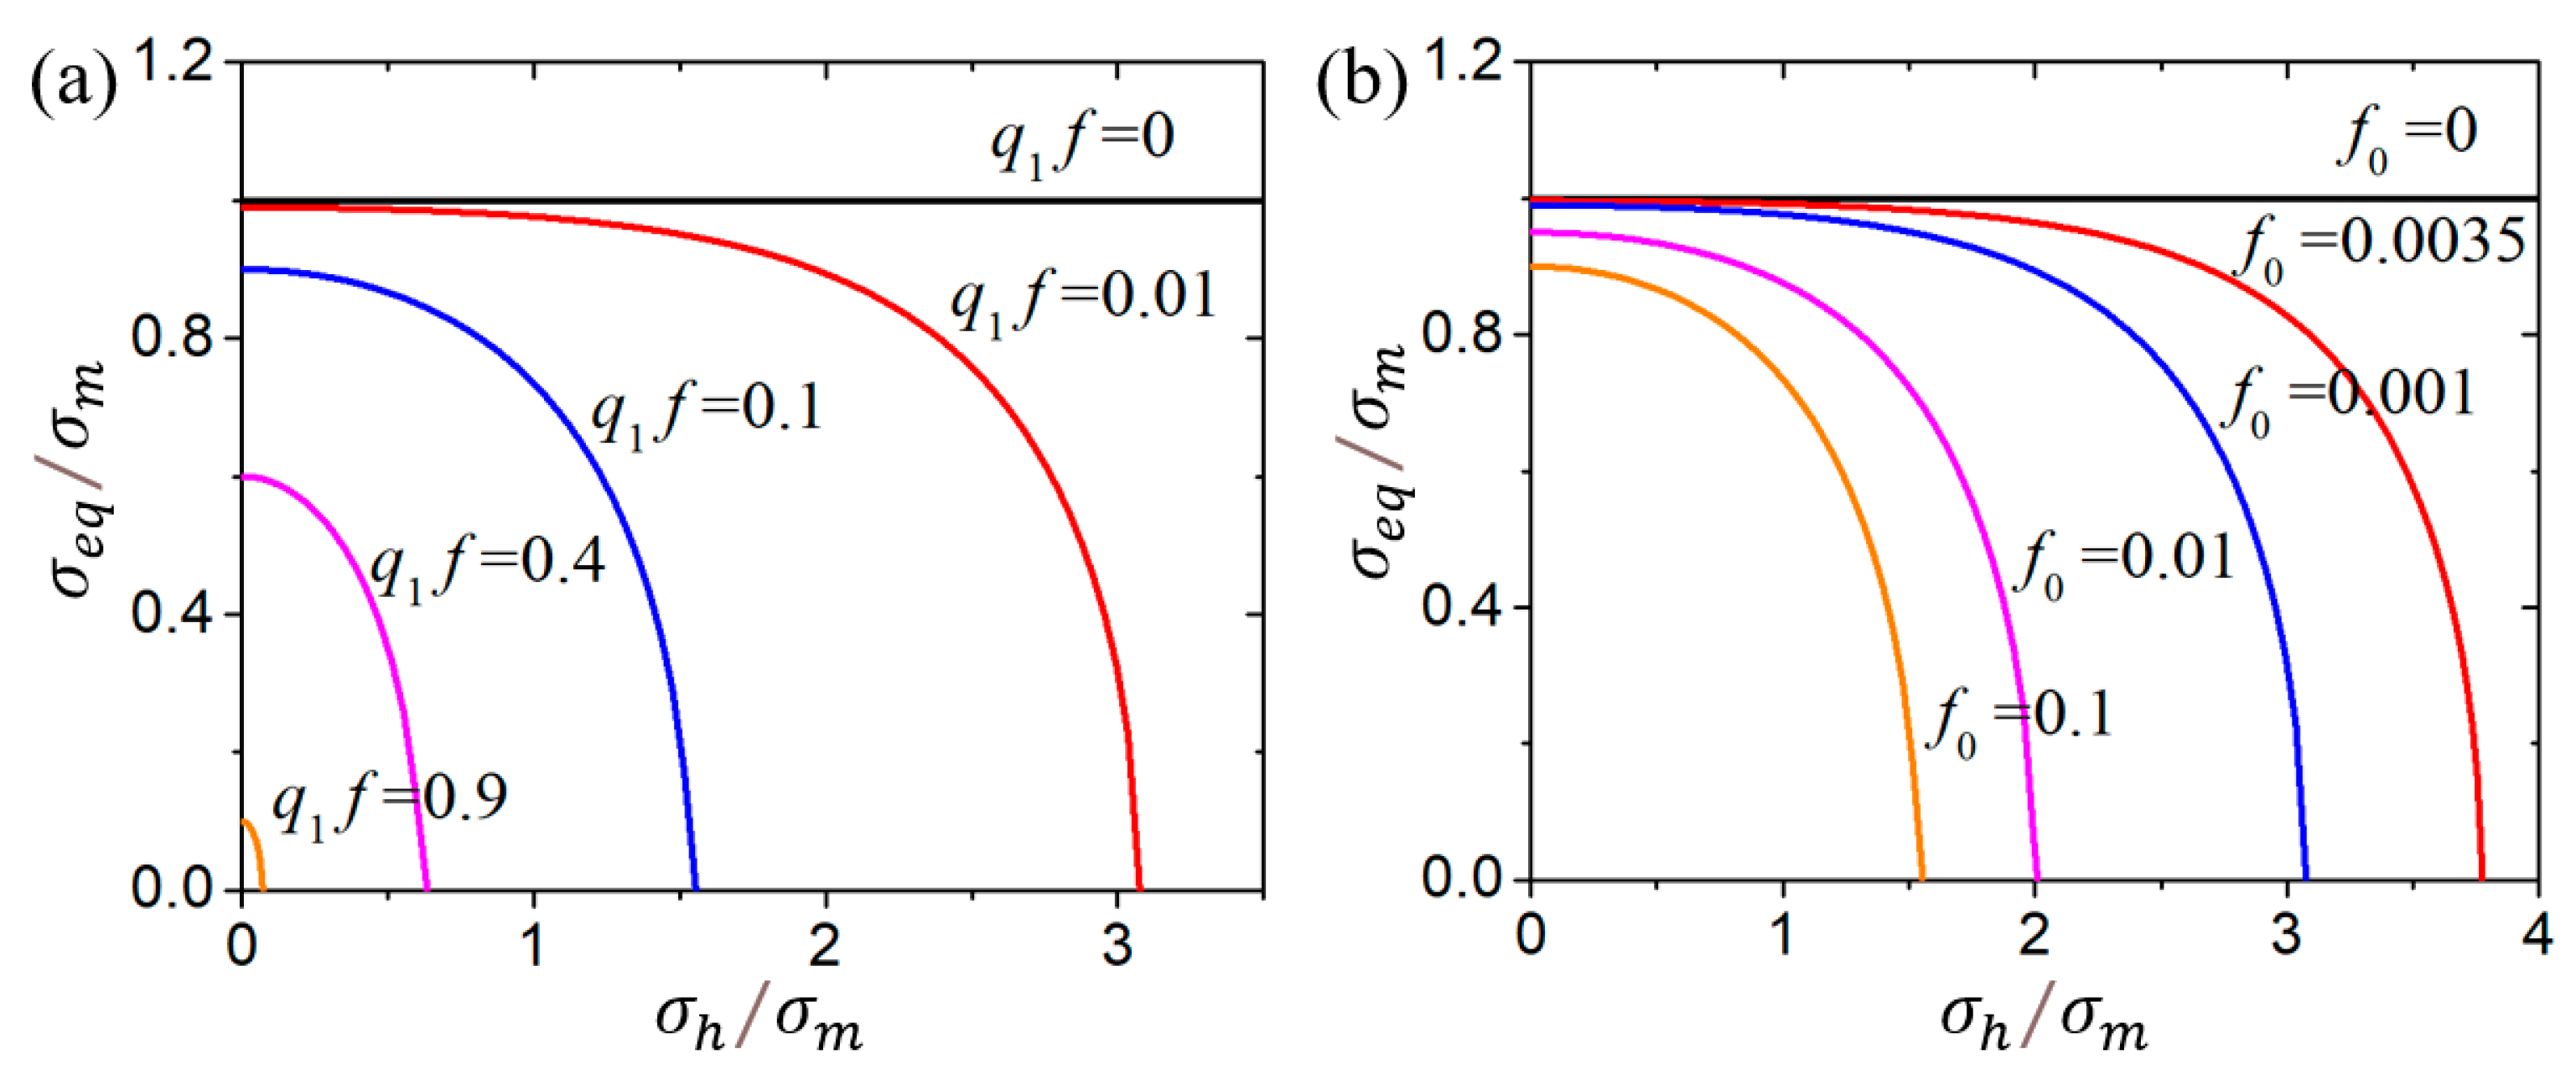
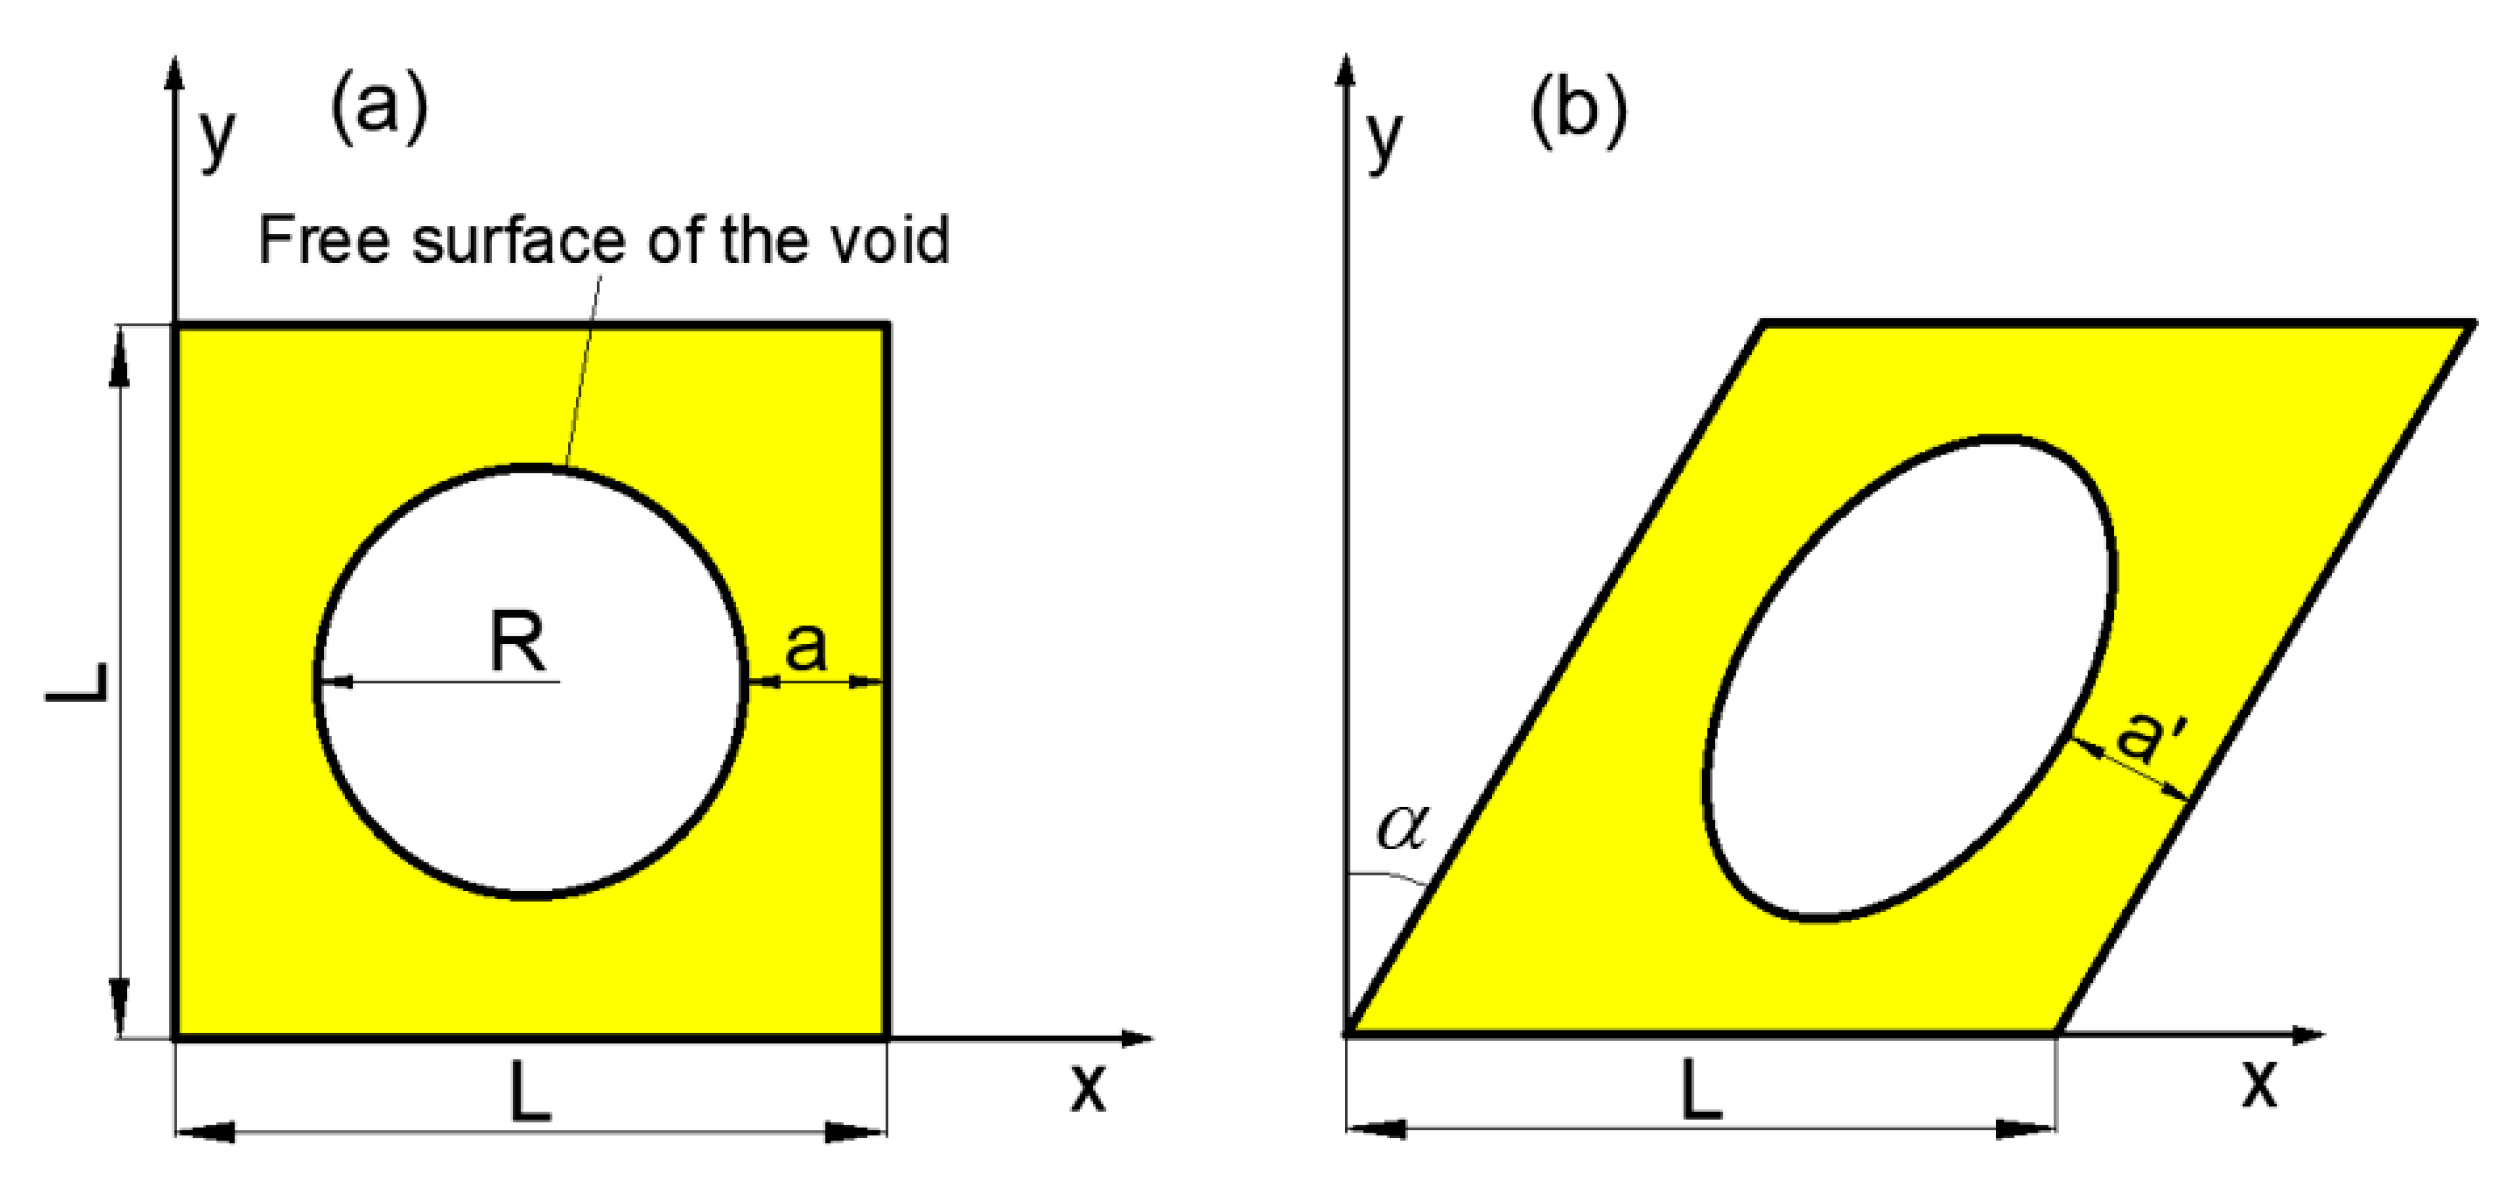
2.1. GTN Model
2.2. Modified GTN model for Shear Failure
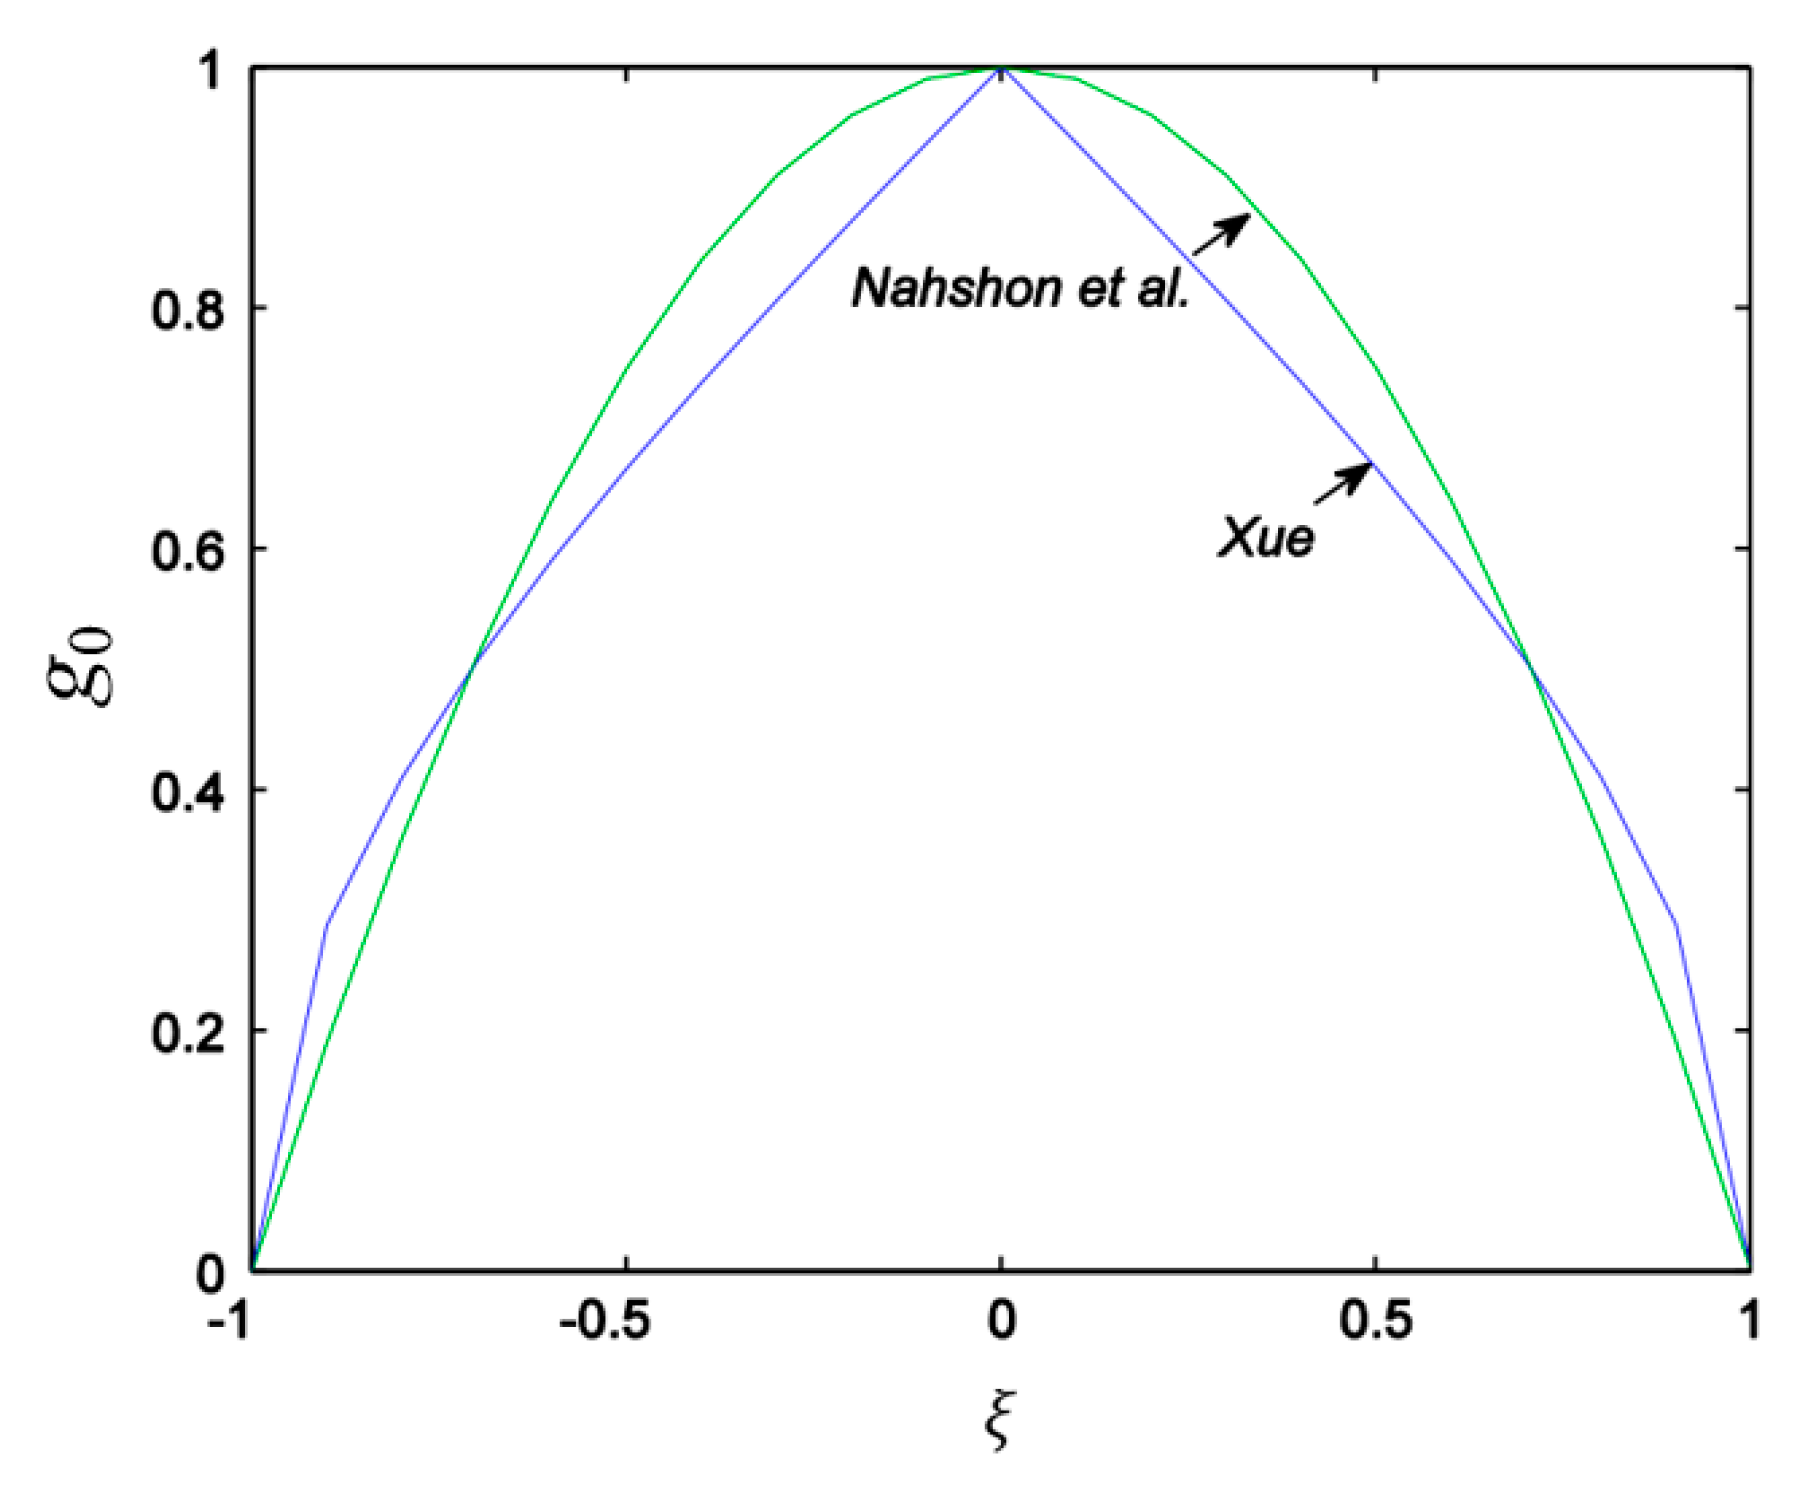
2.2.1. Xue’s Modified GTN Model
2.2.2. Nahshon and Hutchinson’s (N-H) Modified GTN Model
3. Quasi-Static Tension Tests Correlations
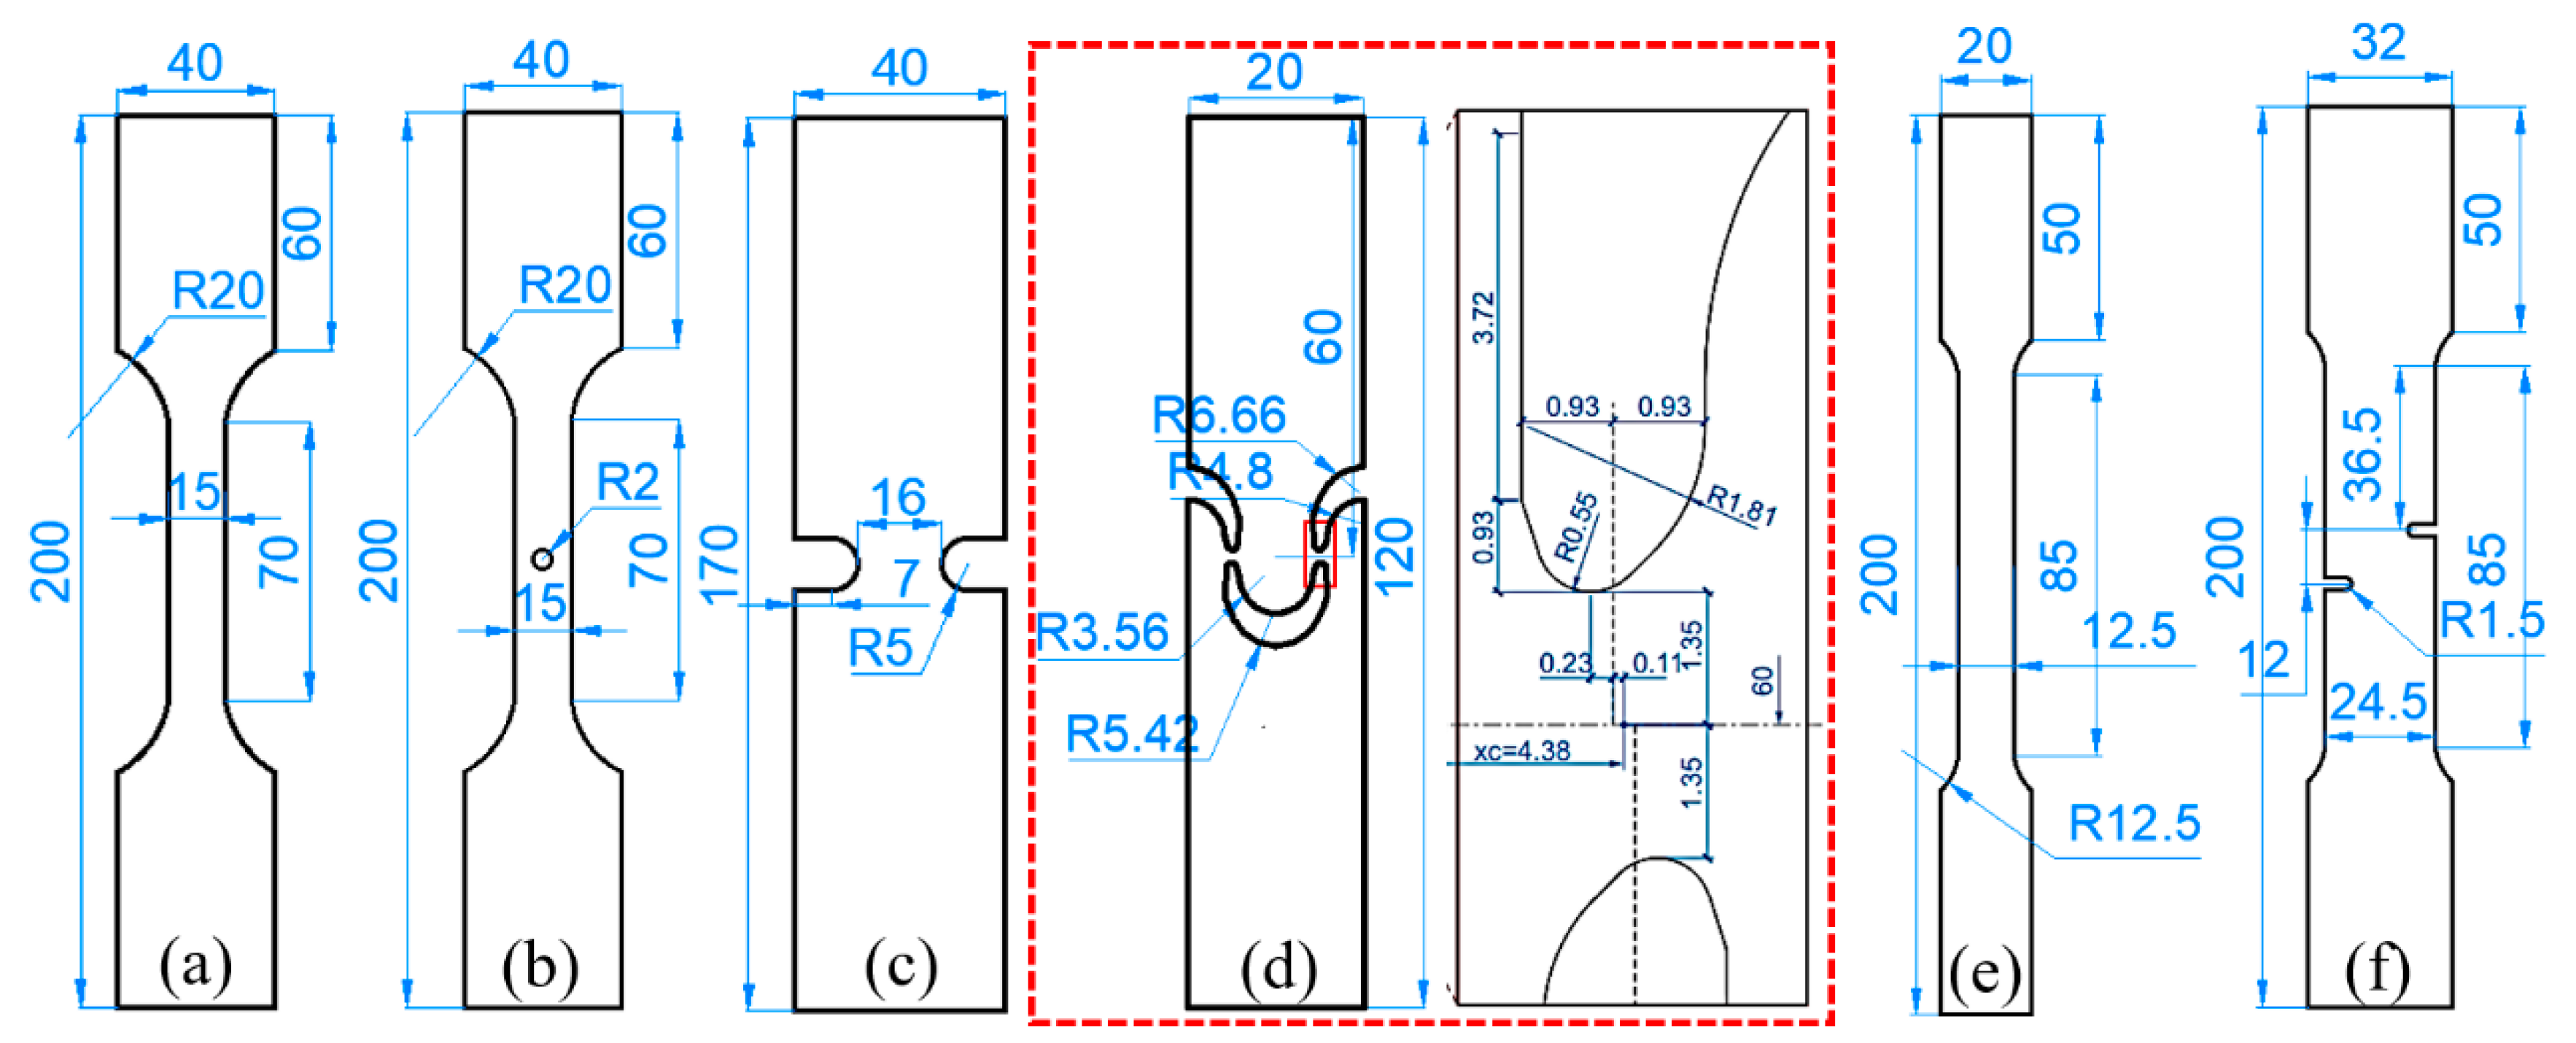
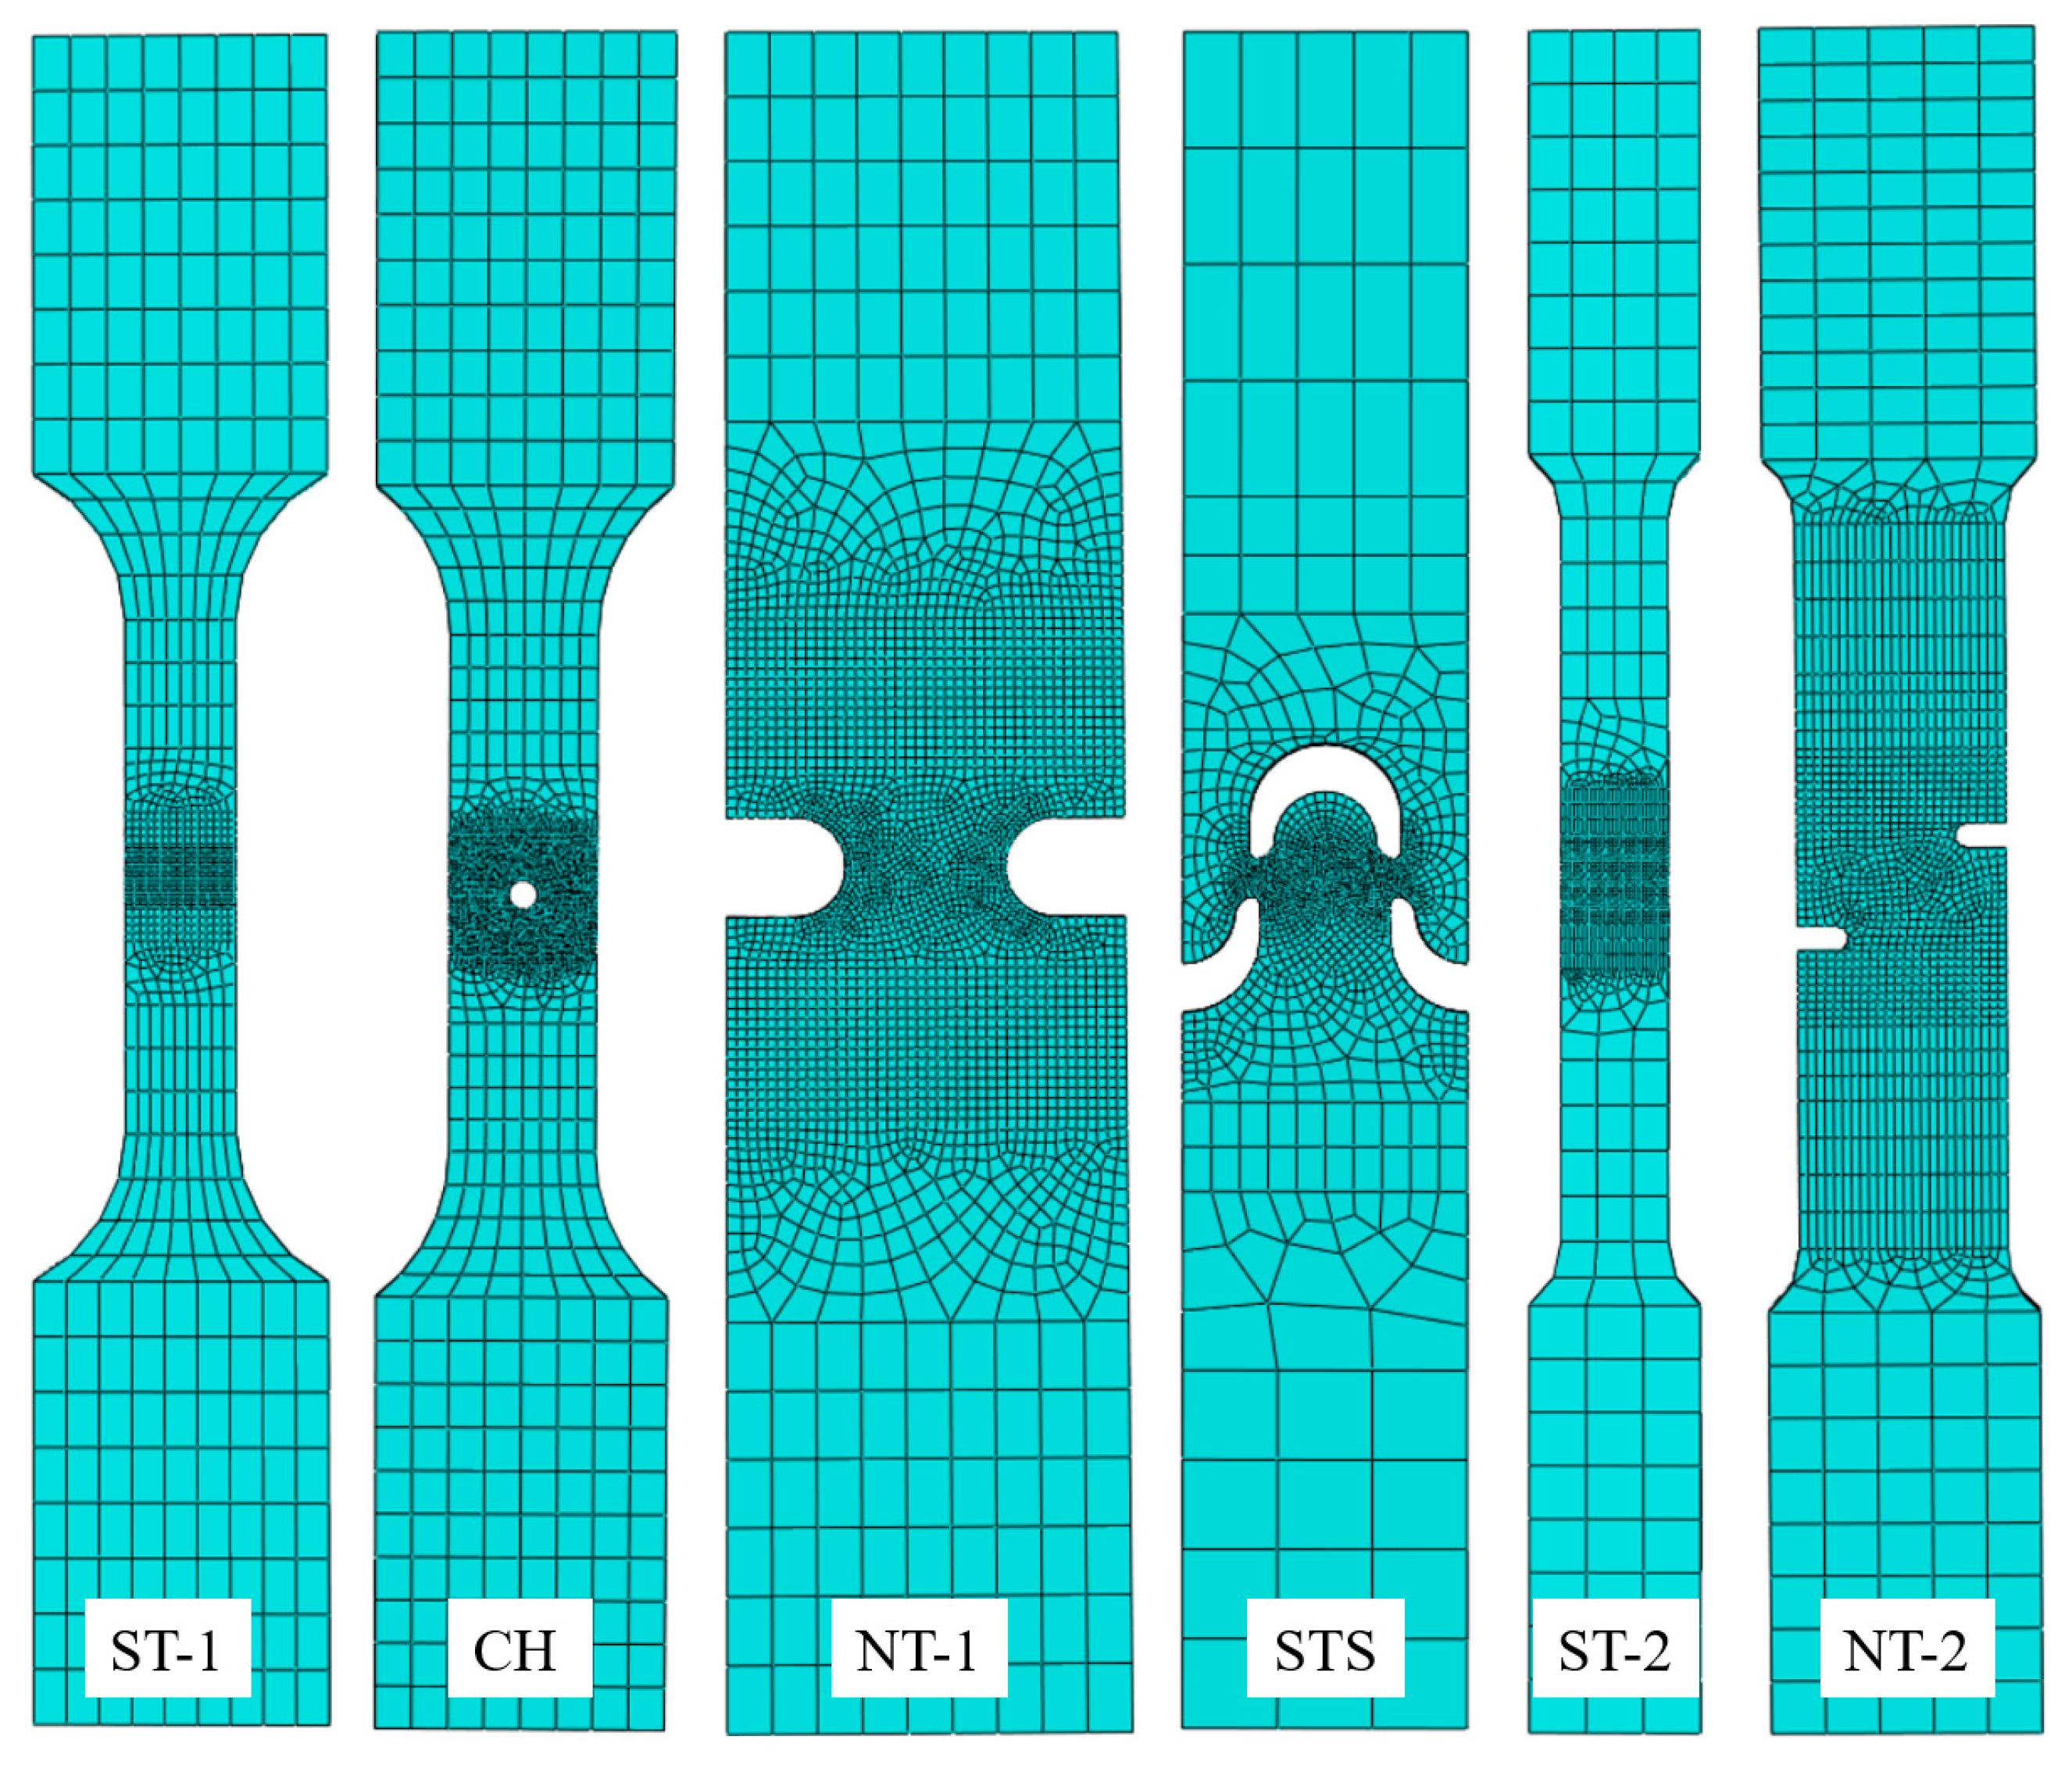
3.1. Finite Element Models for Tensile Specimens
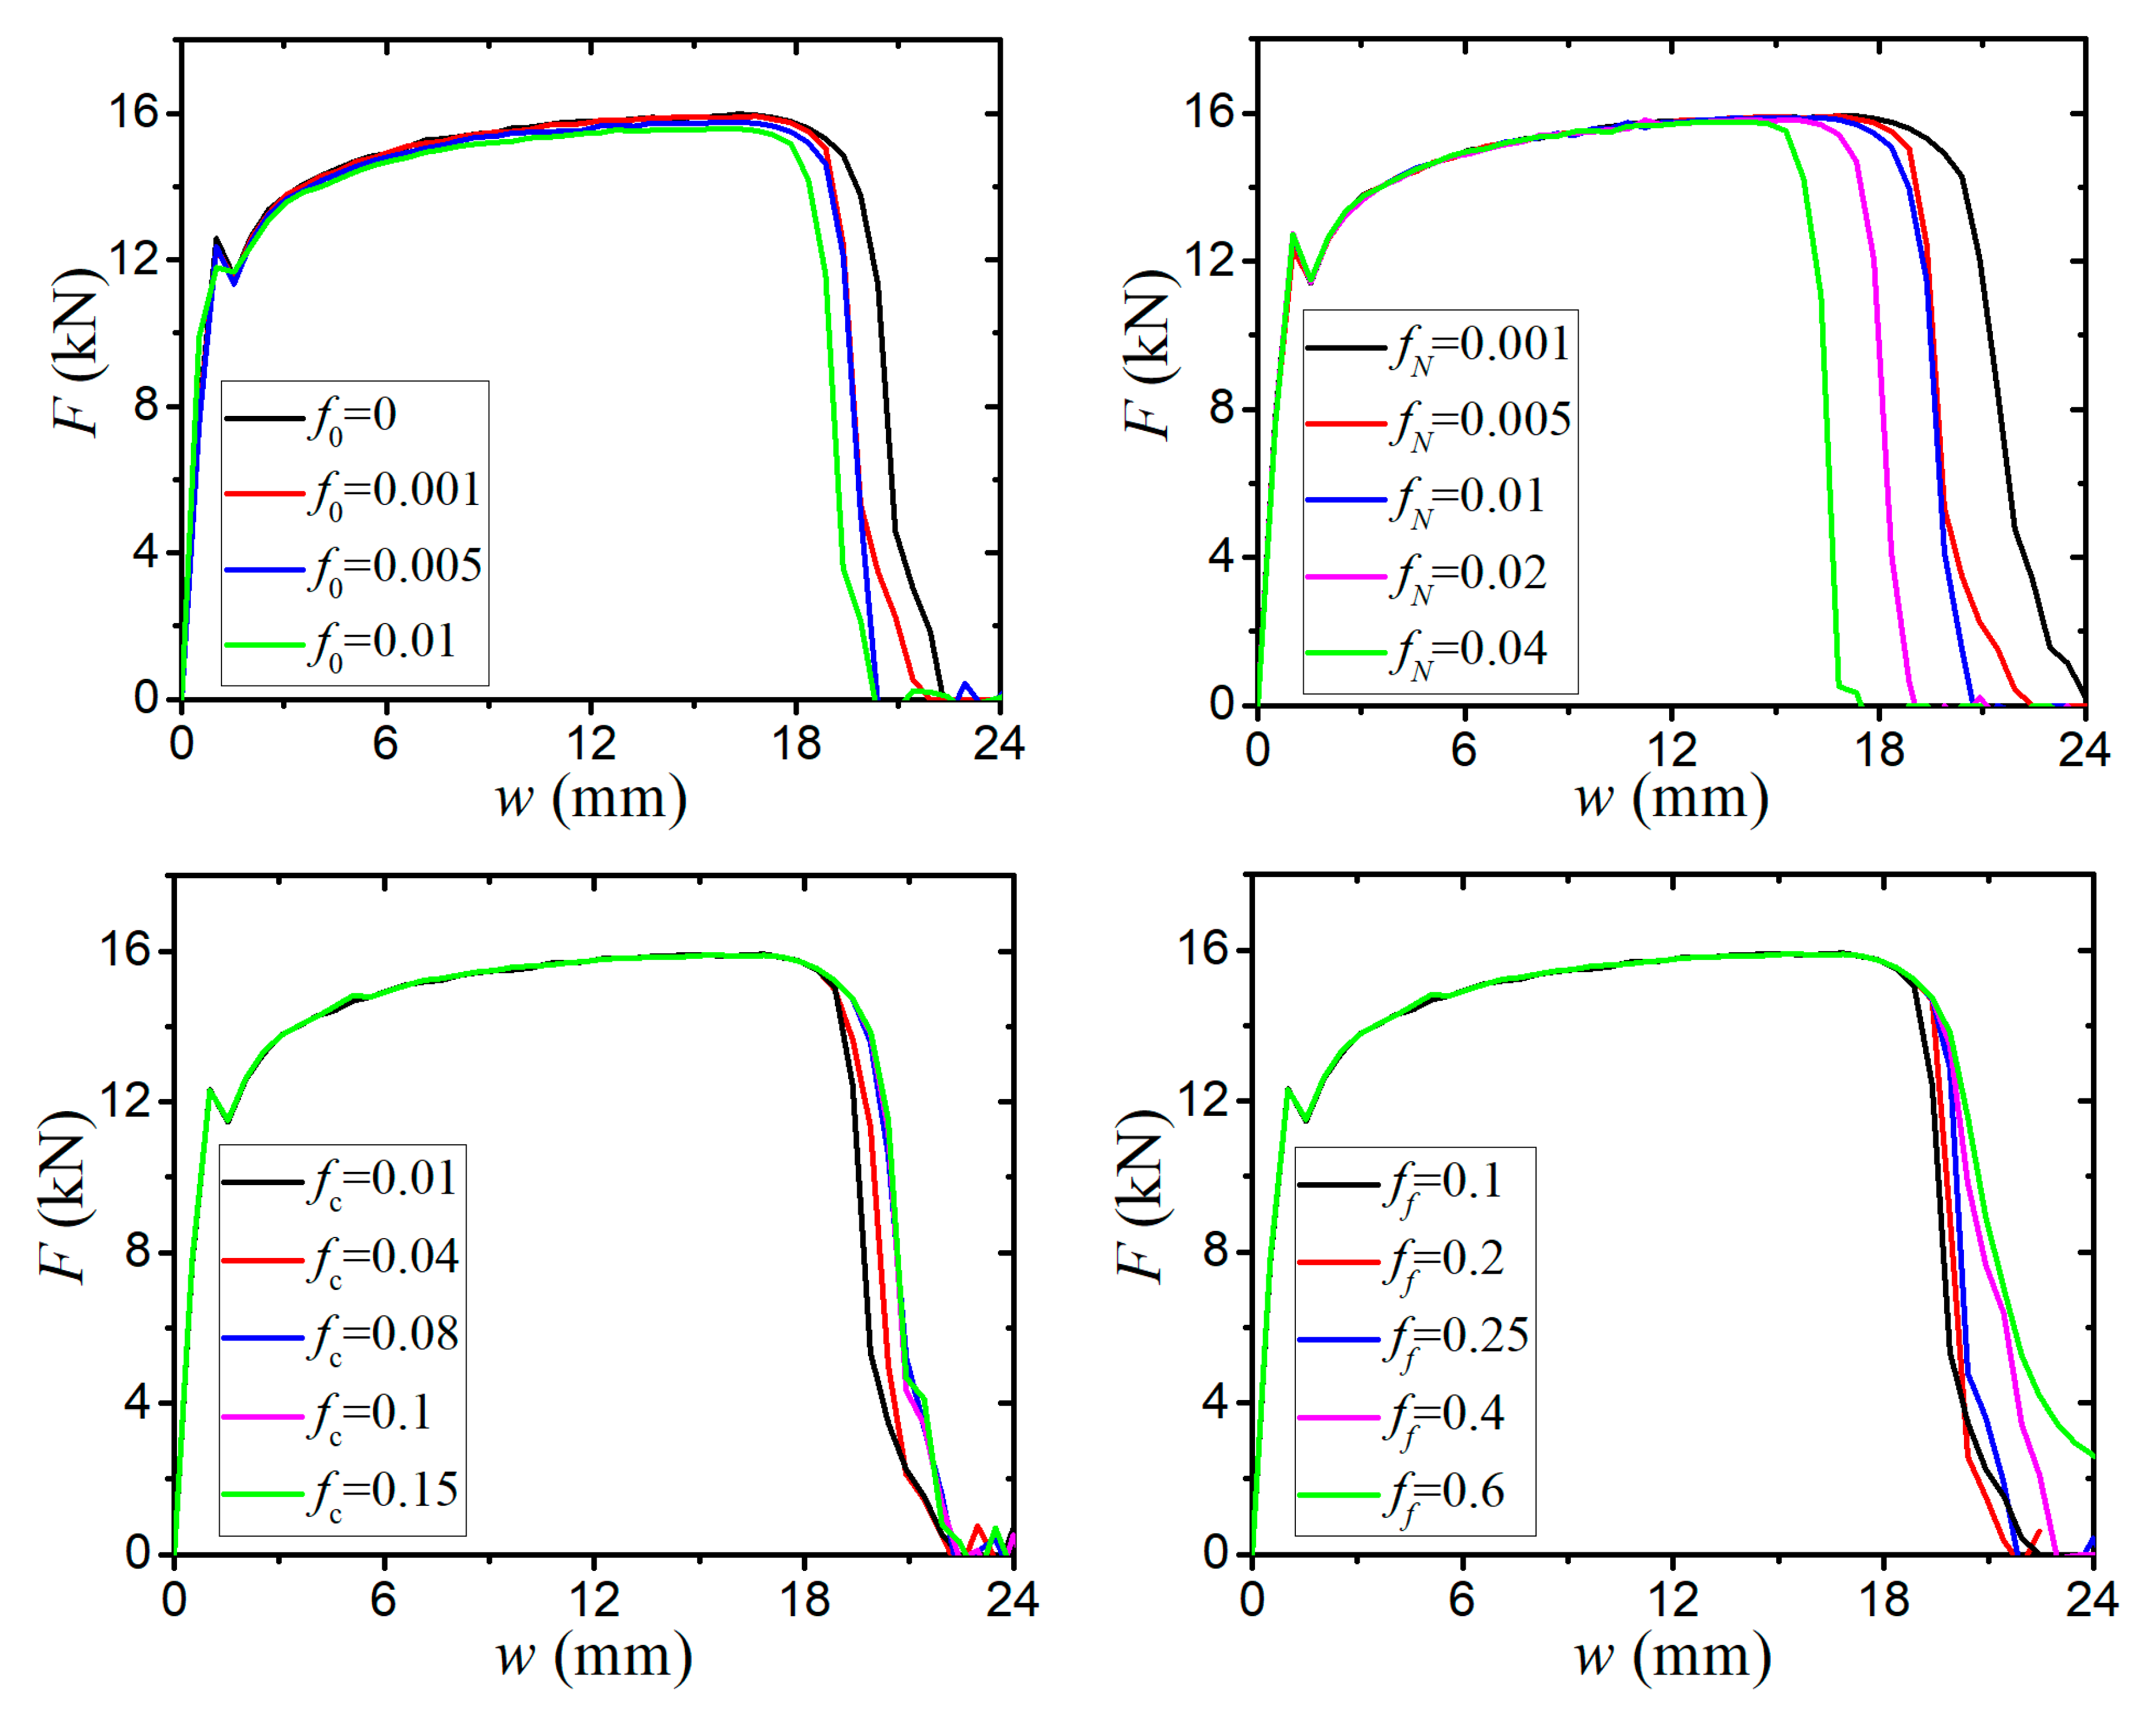
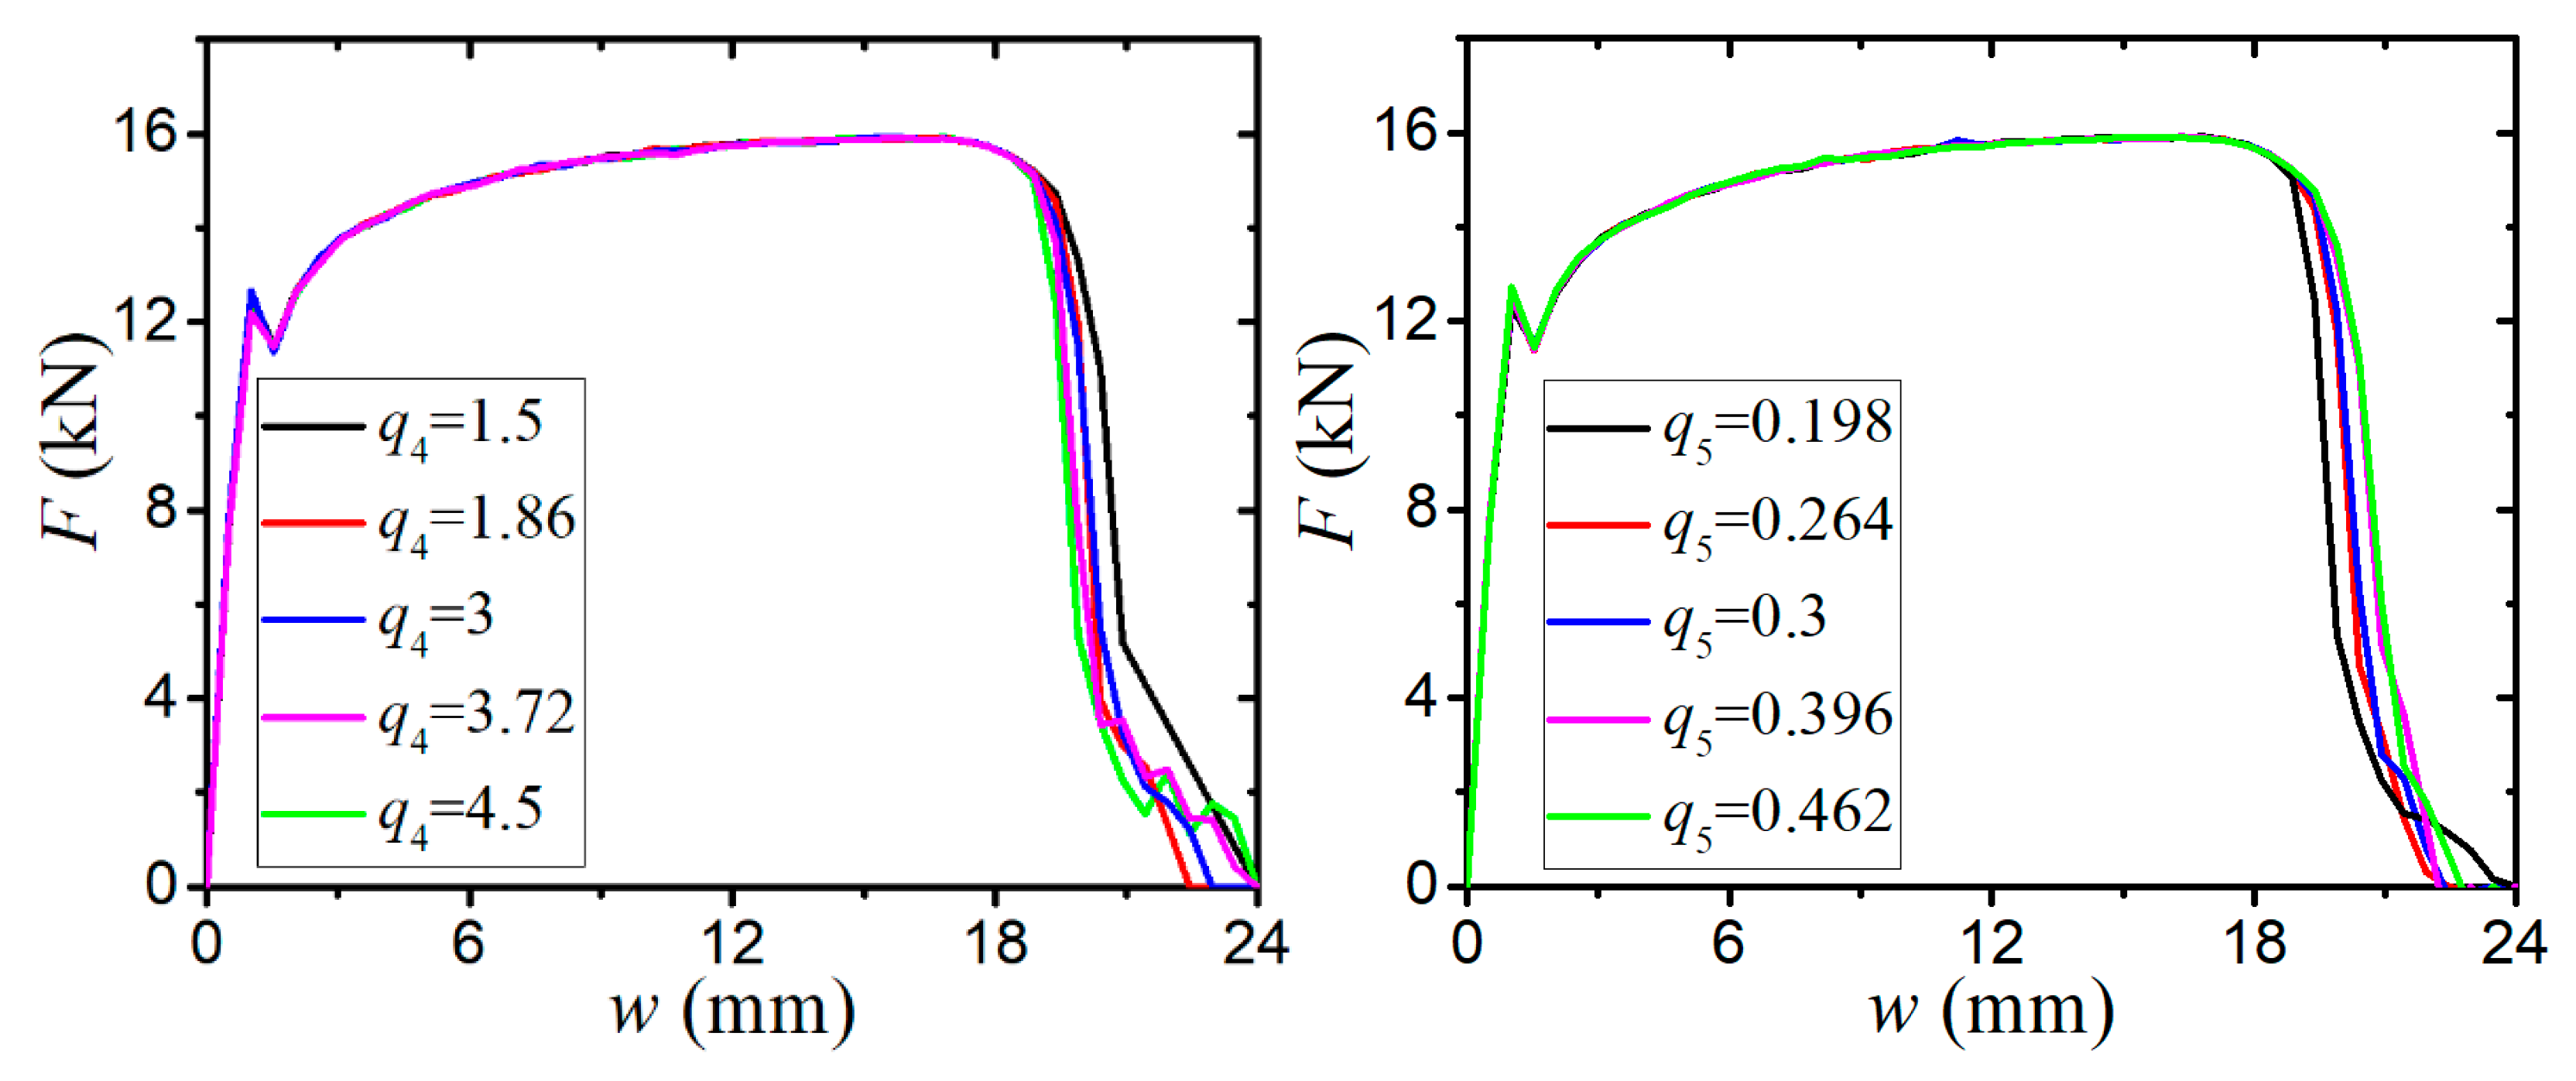
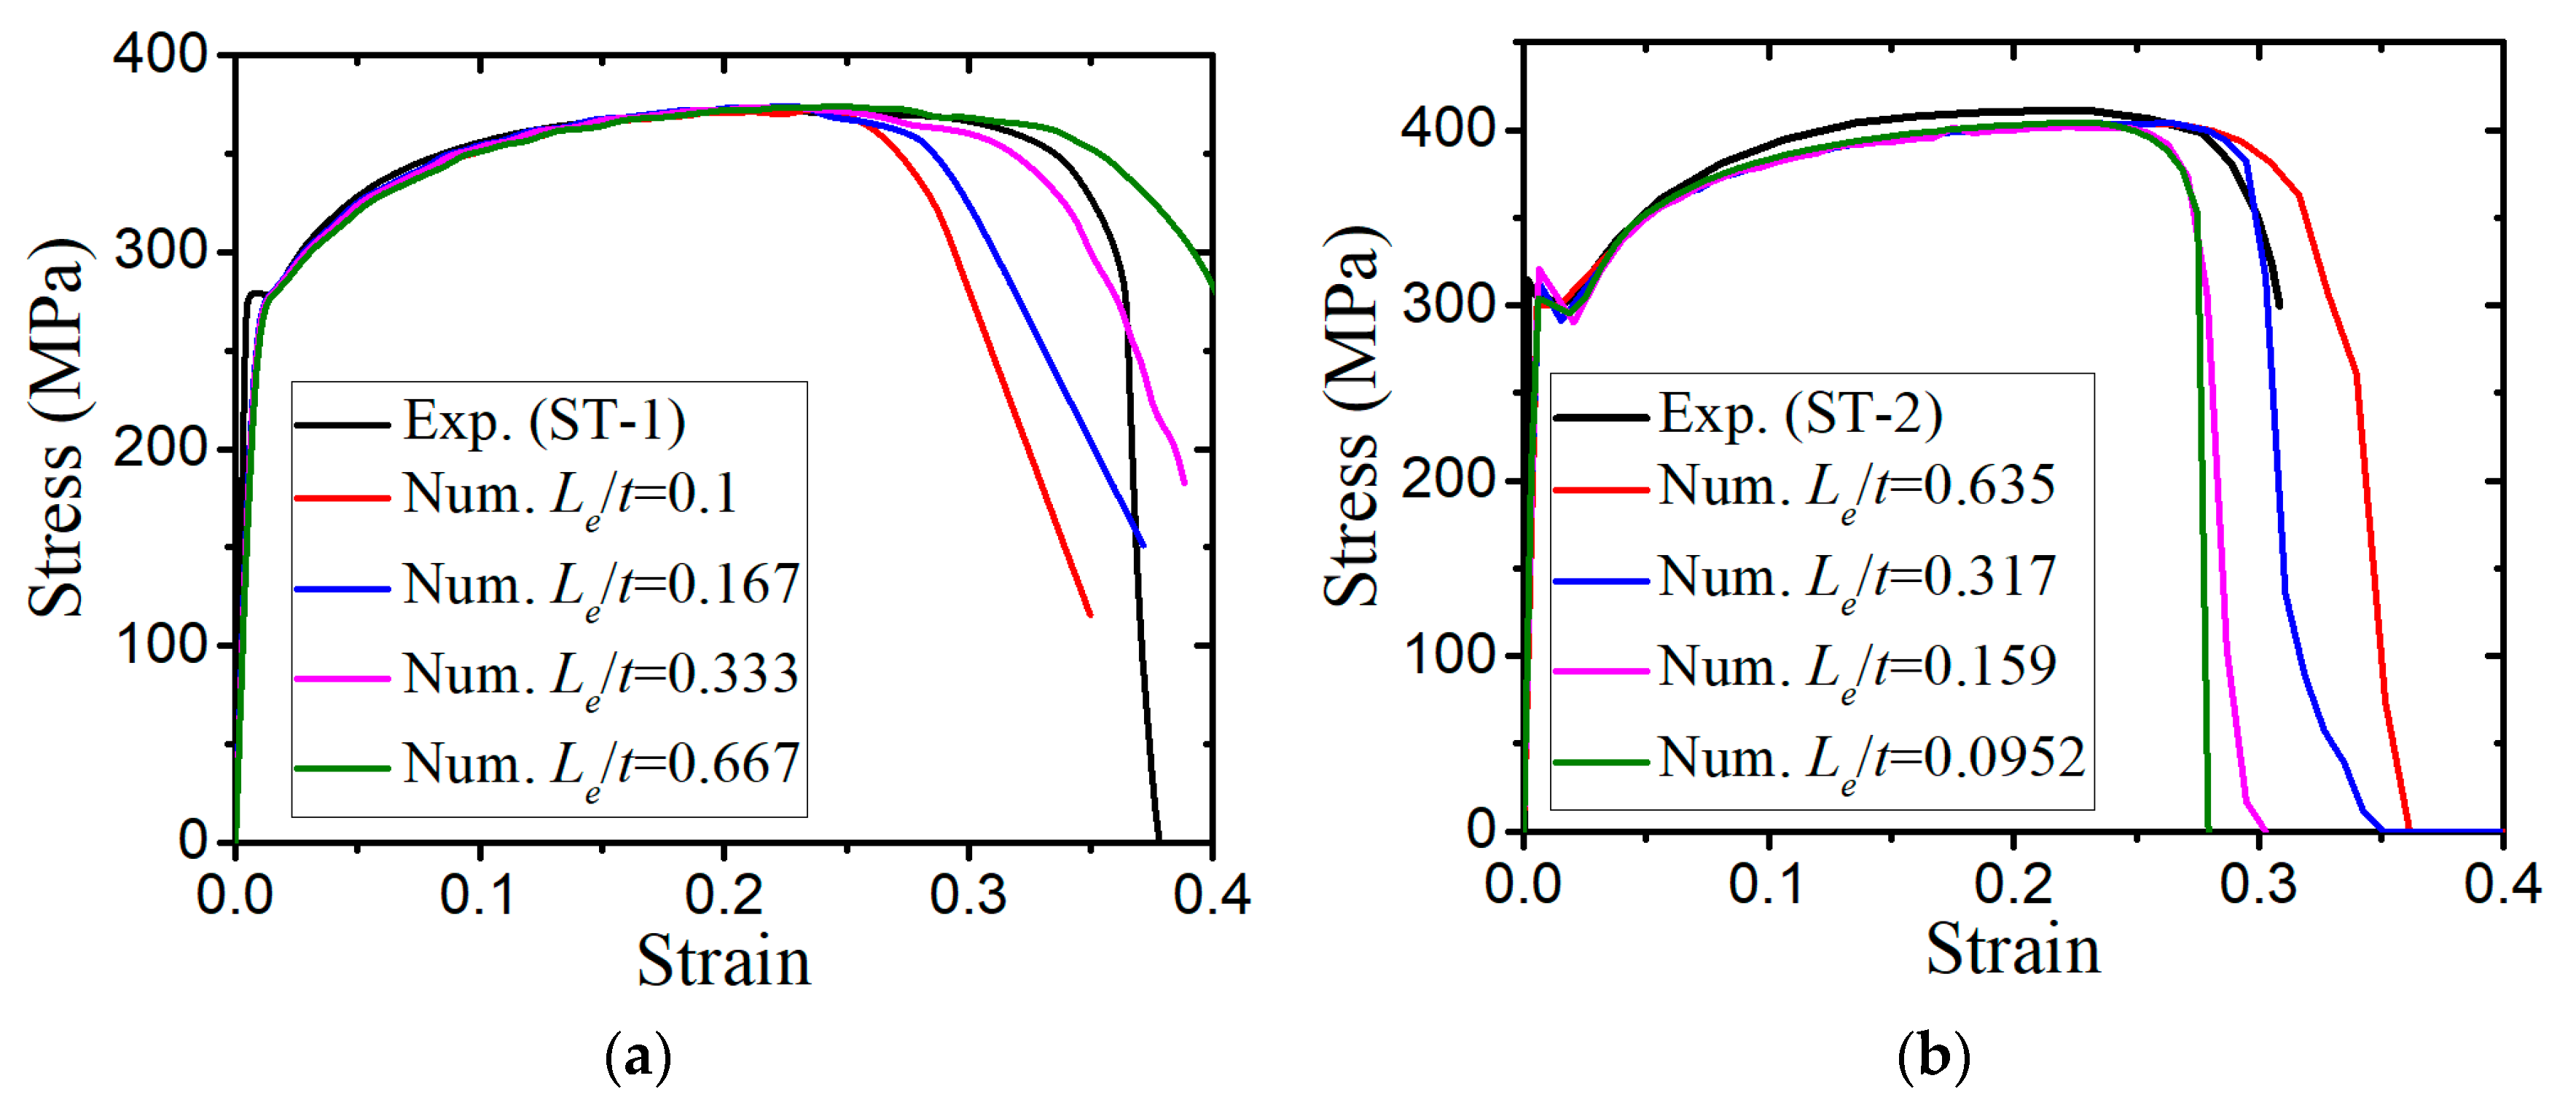
3.2. Parameter Calibration of the Modified GTN Model
4. Steel-Plated Structures under Quasi-Static Punch Loading
4.1. Simulations of Non-Stiffened Plate Penetration Test
4.2. Simulations of Laser-Welded Stiffened Plate Penetration Test
5. Concluding Remarks
- (1)
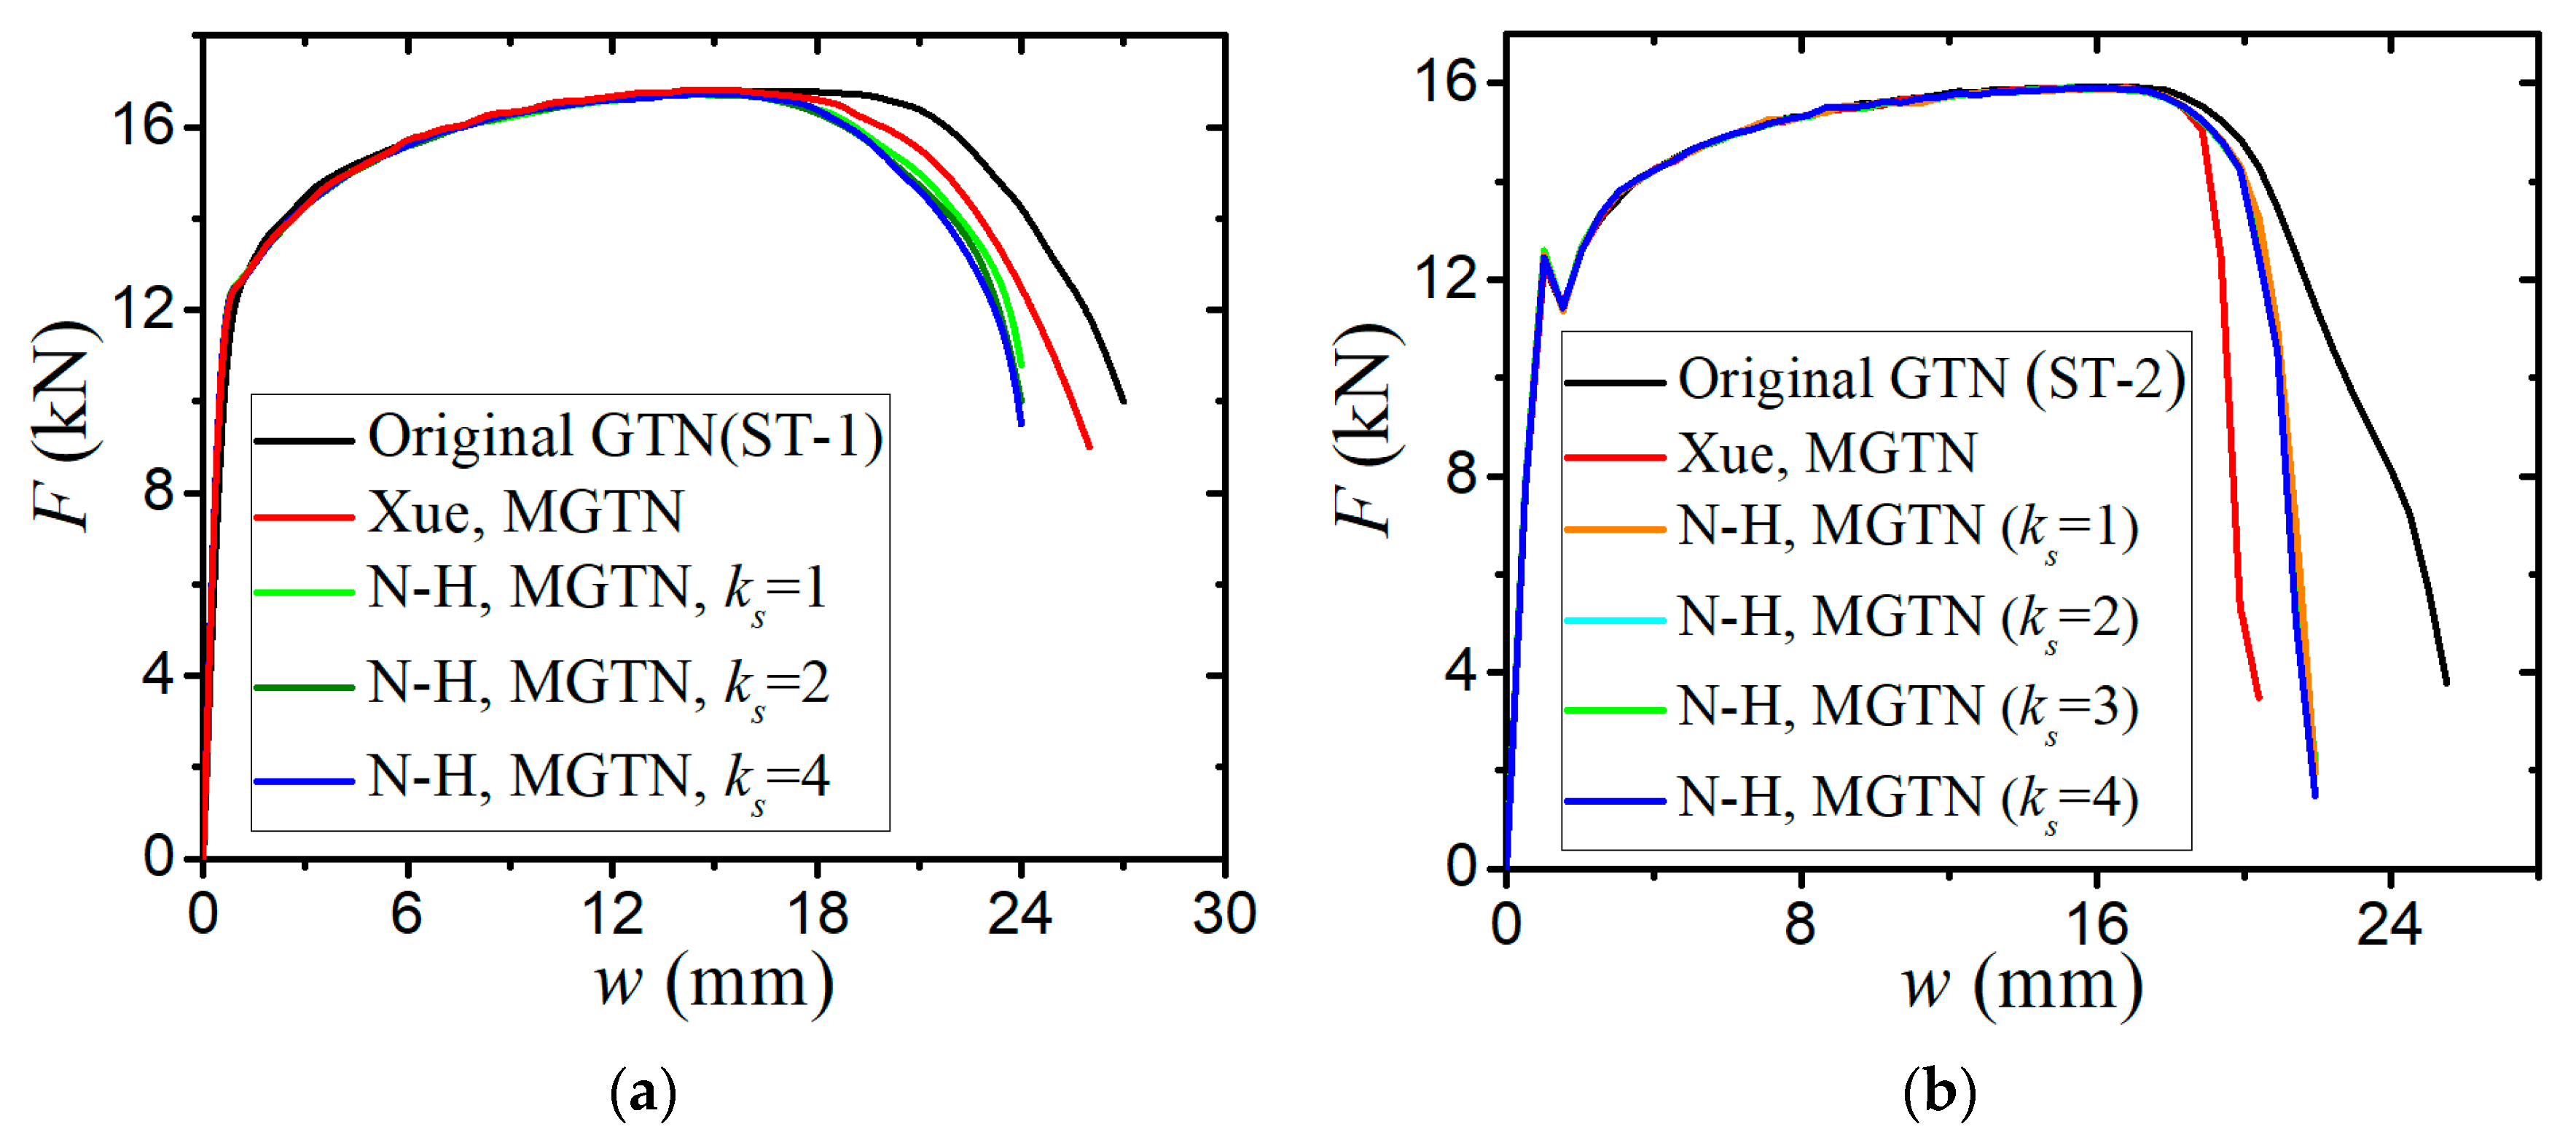
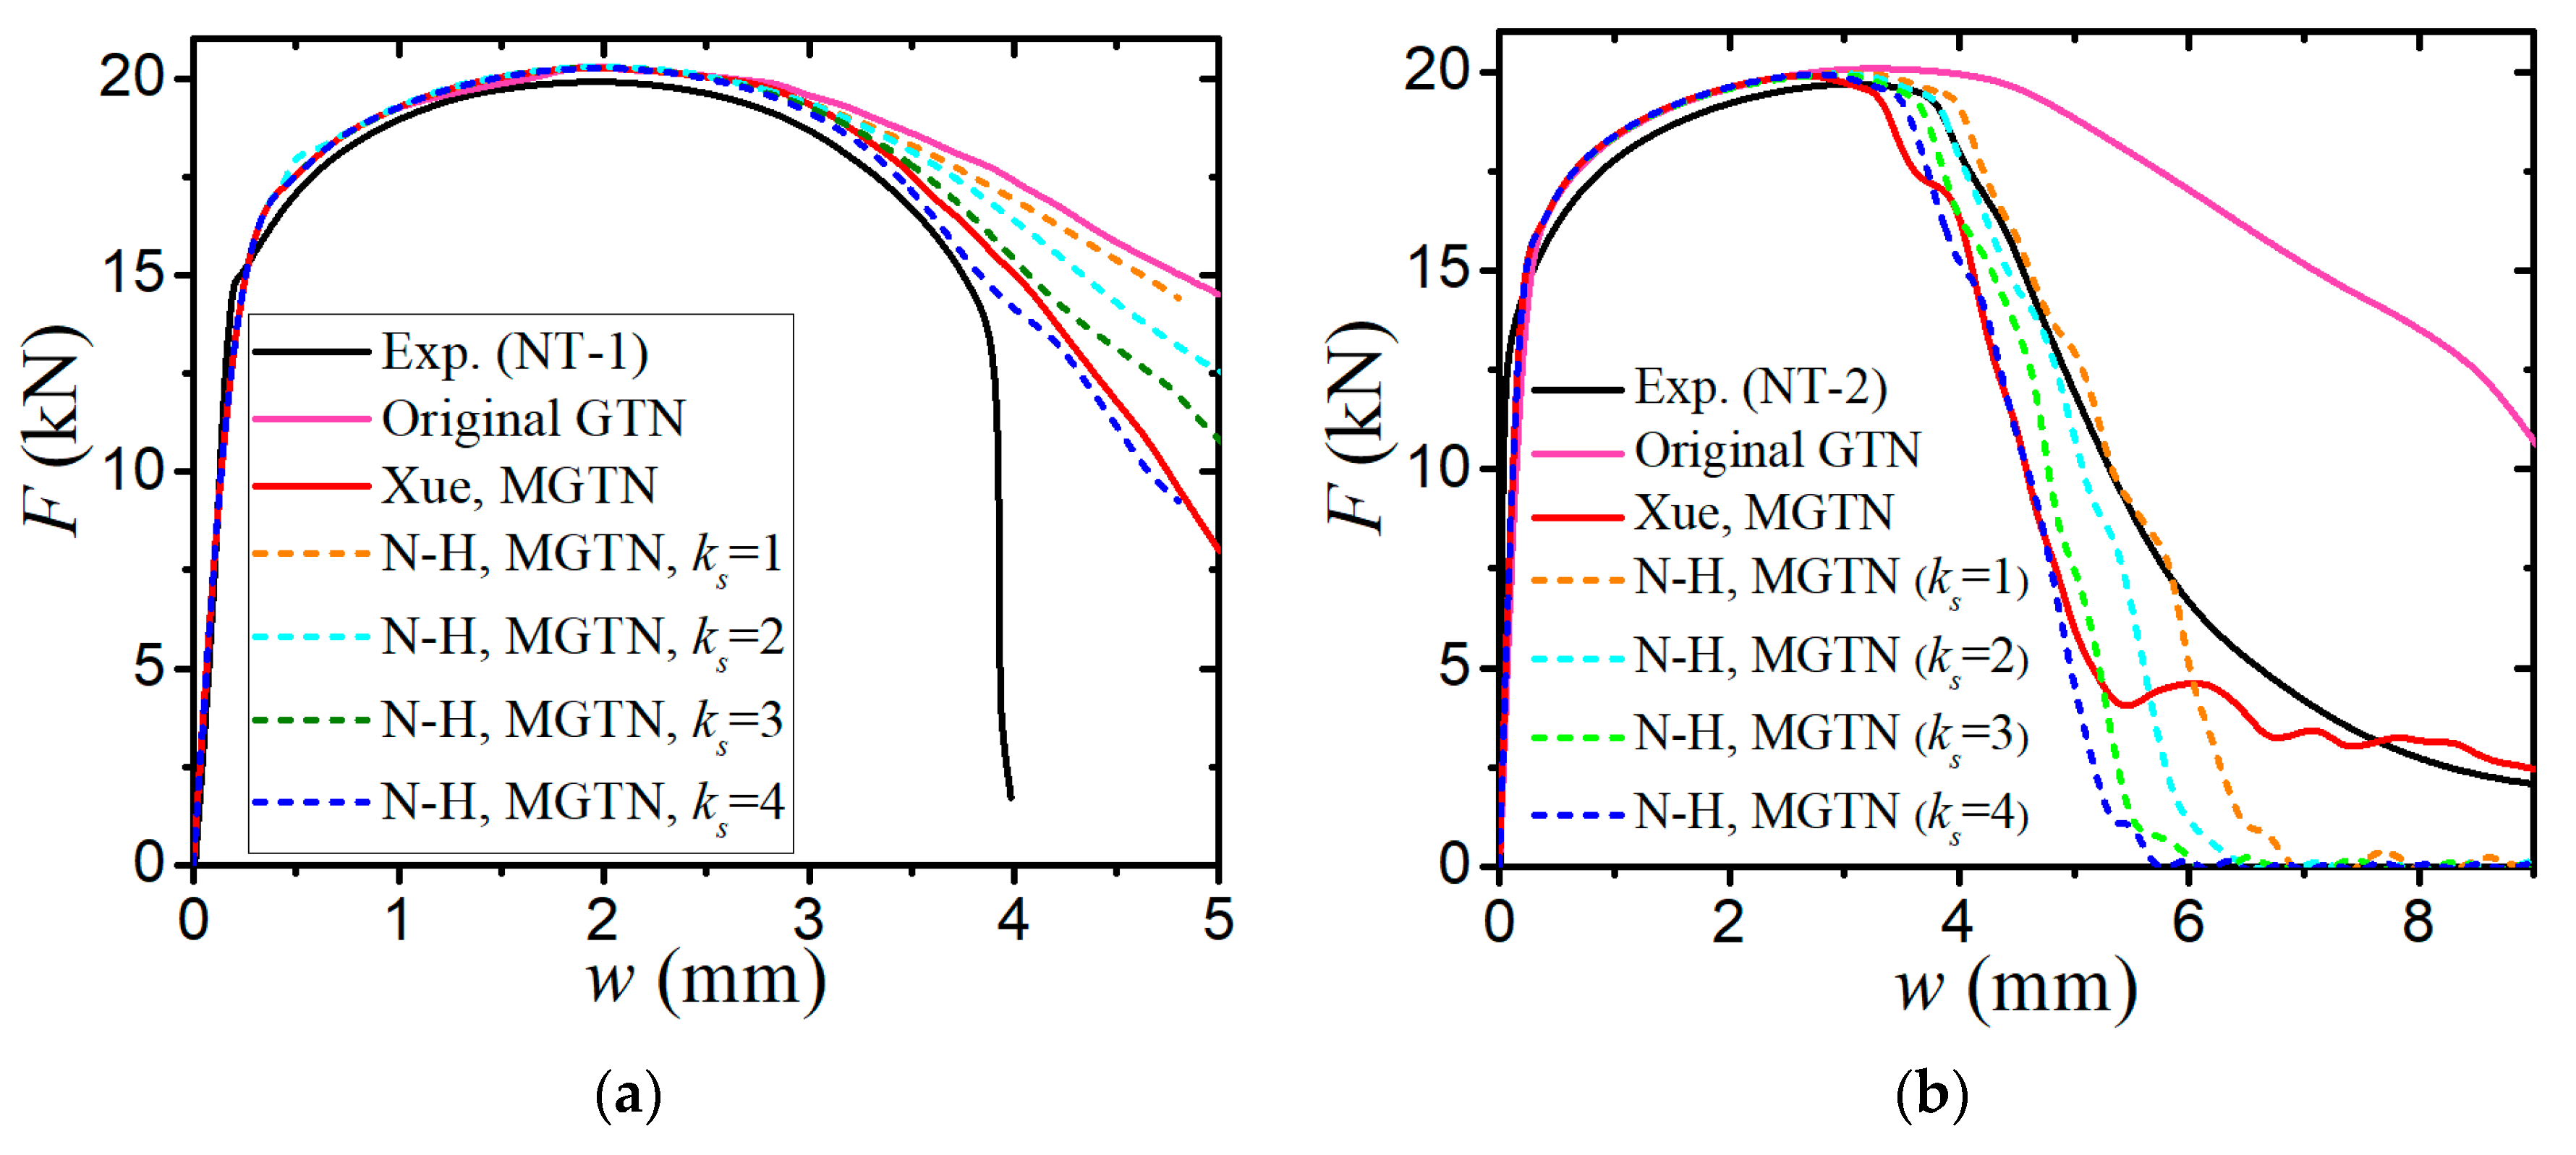
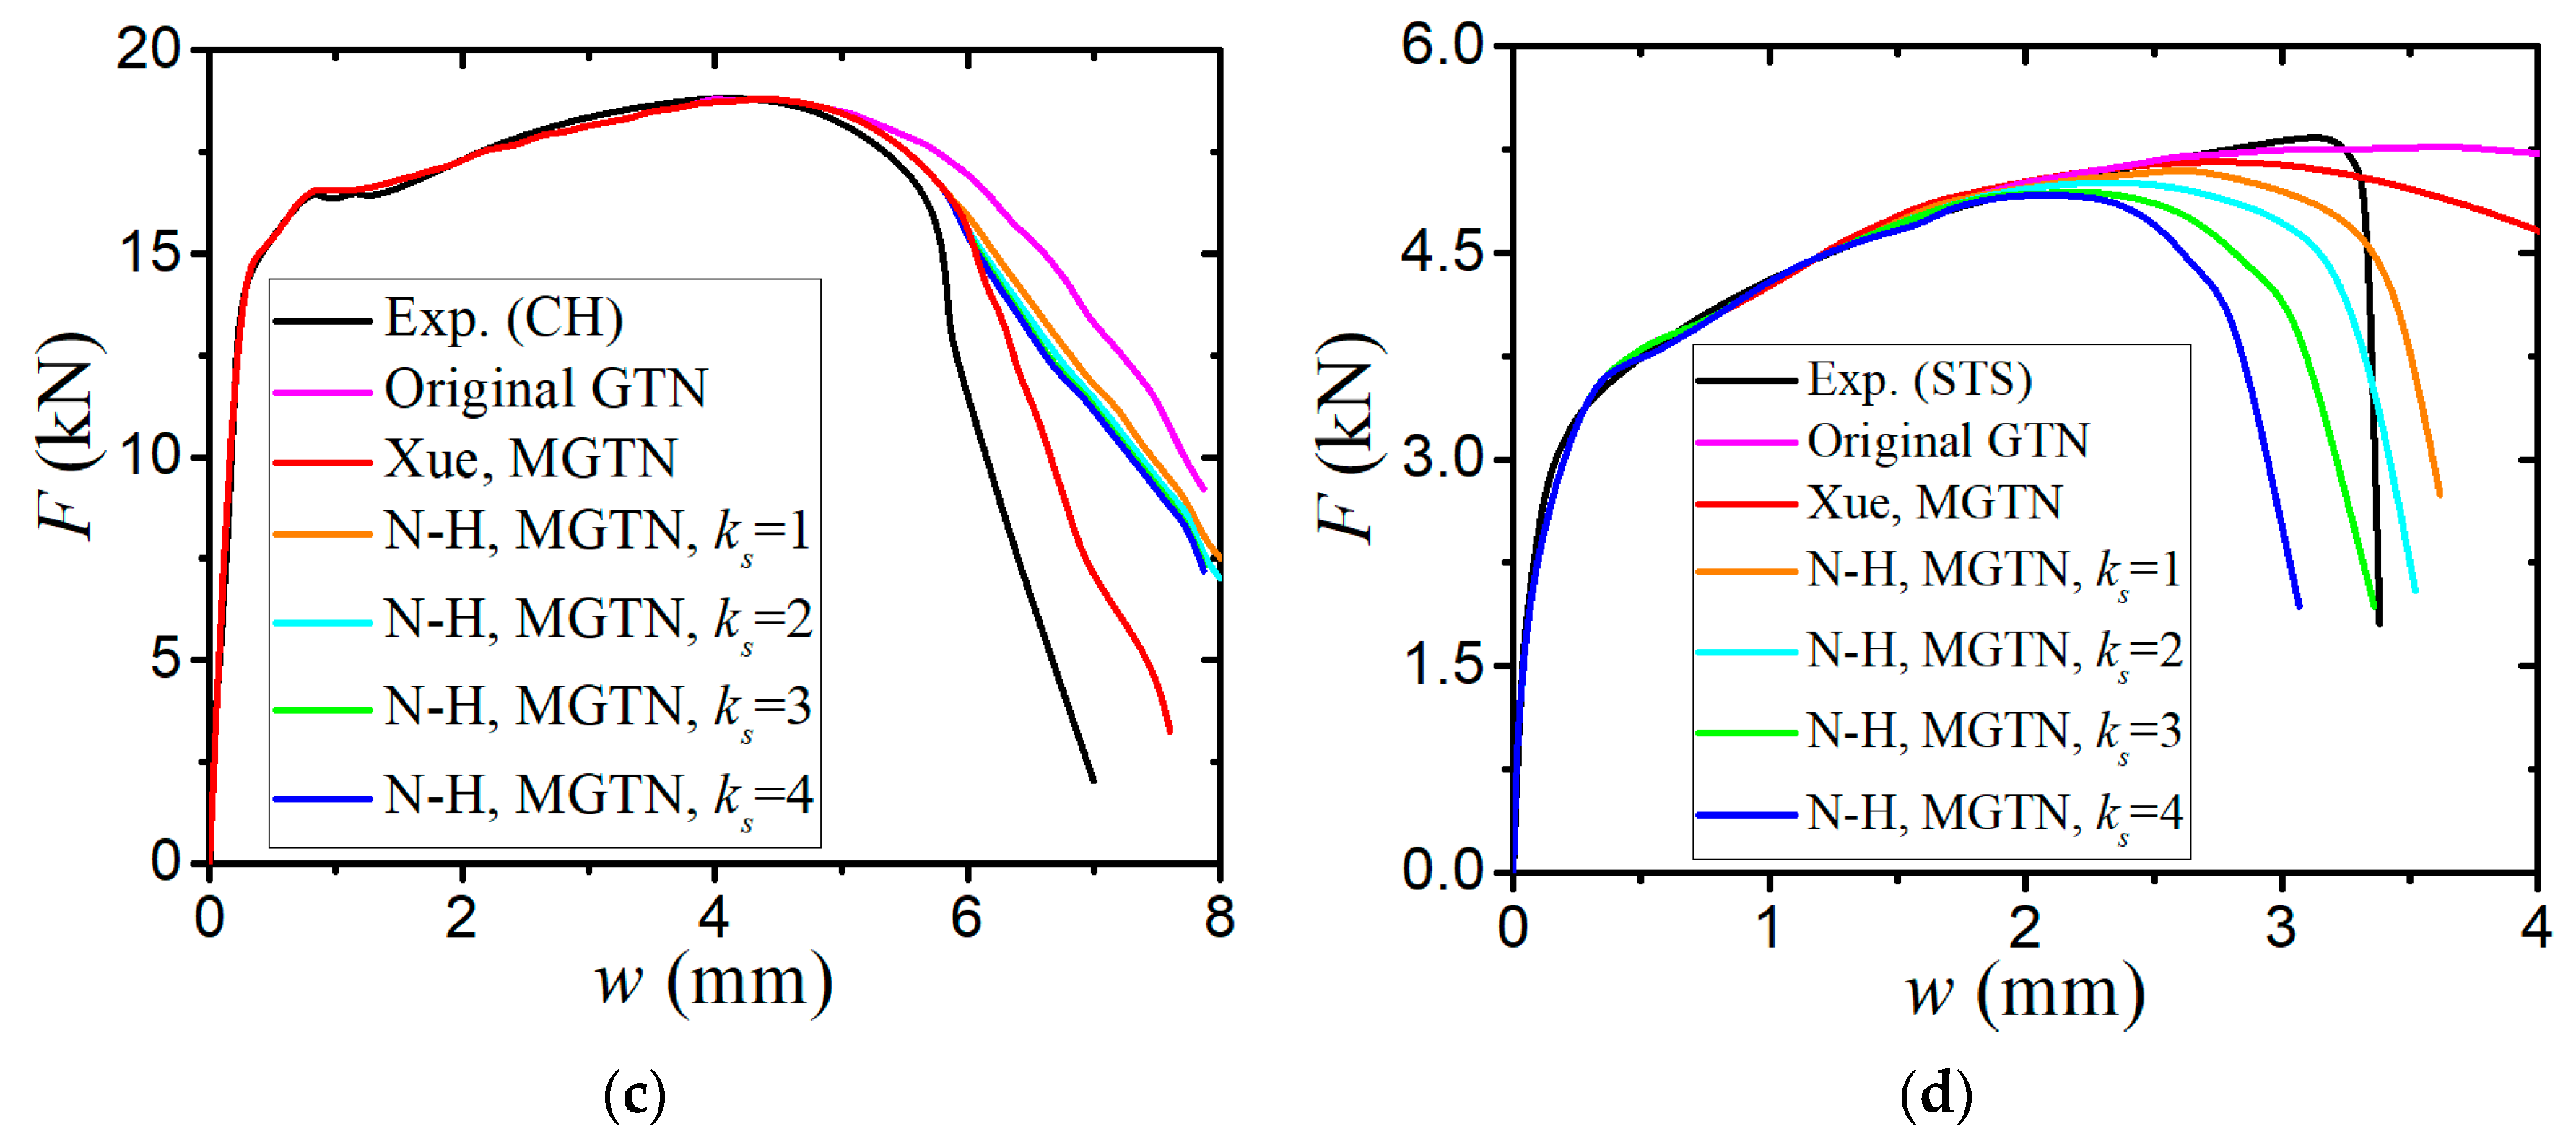
- The sensitivity analysis of void-related parameters (q1, q2, f0, fN, fc, ff) and shear damage parameters (q4, q5, ks) indicate different levels of effects on the force–displacement responses for a standard tensile laboratory material test. The parameters (q1, q2, fN, fc, ff) have negligible effects on the force–displacement curves before necking occurs, whereas the parameter of the initial void volume fraction f0 affects the force–displacement relation before necking because a nonzero f0 leads to a shrink in the material yield surface. The parameters of q1, q2, f0, fN, and q4 have a negative correlation and the parameters of fc, ff, and q5 have a positive correlation with the tension displacement at the onset of fracture. The shear damage parameter ks of the N-H modified GTN model has a very minor effect on the force–displacement response in uniaxial tension.
- (2)
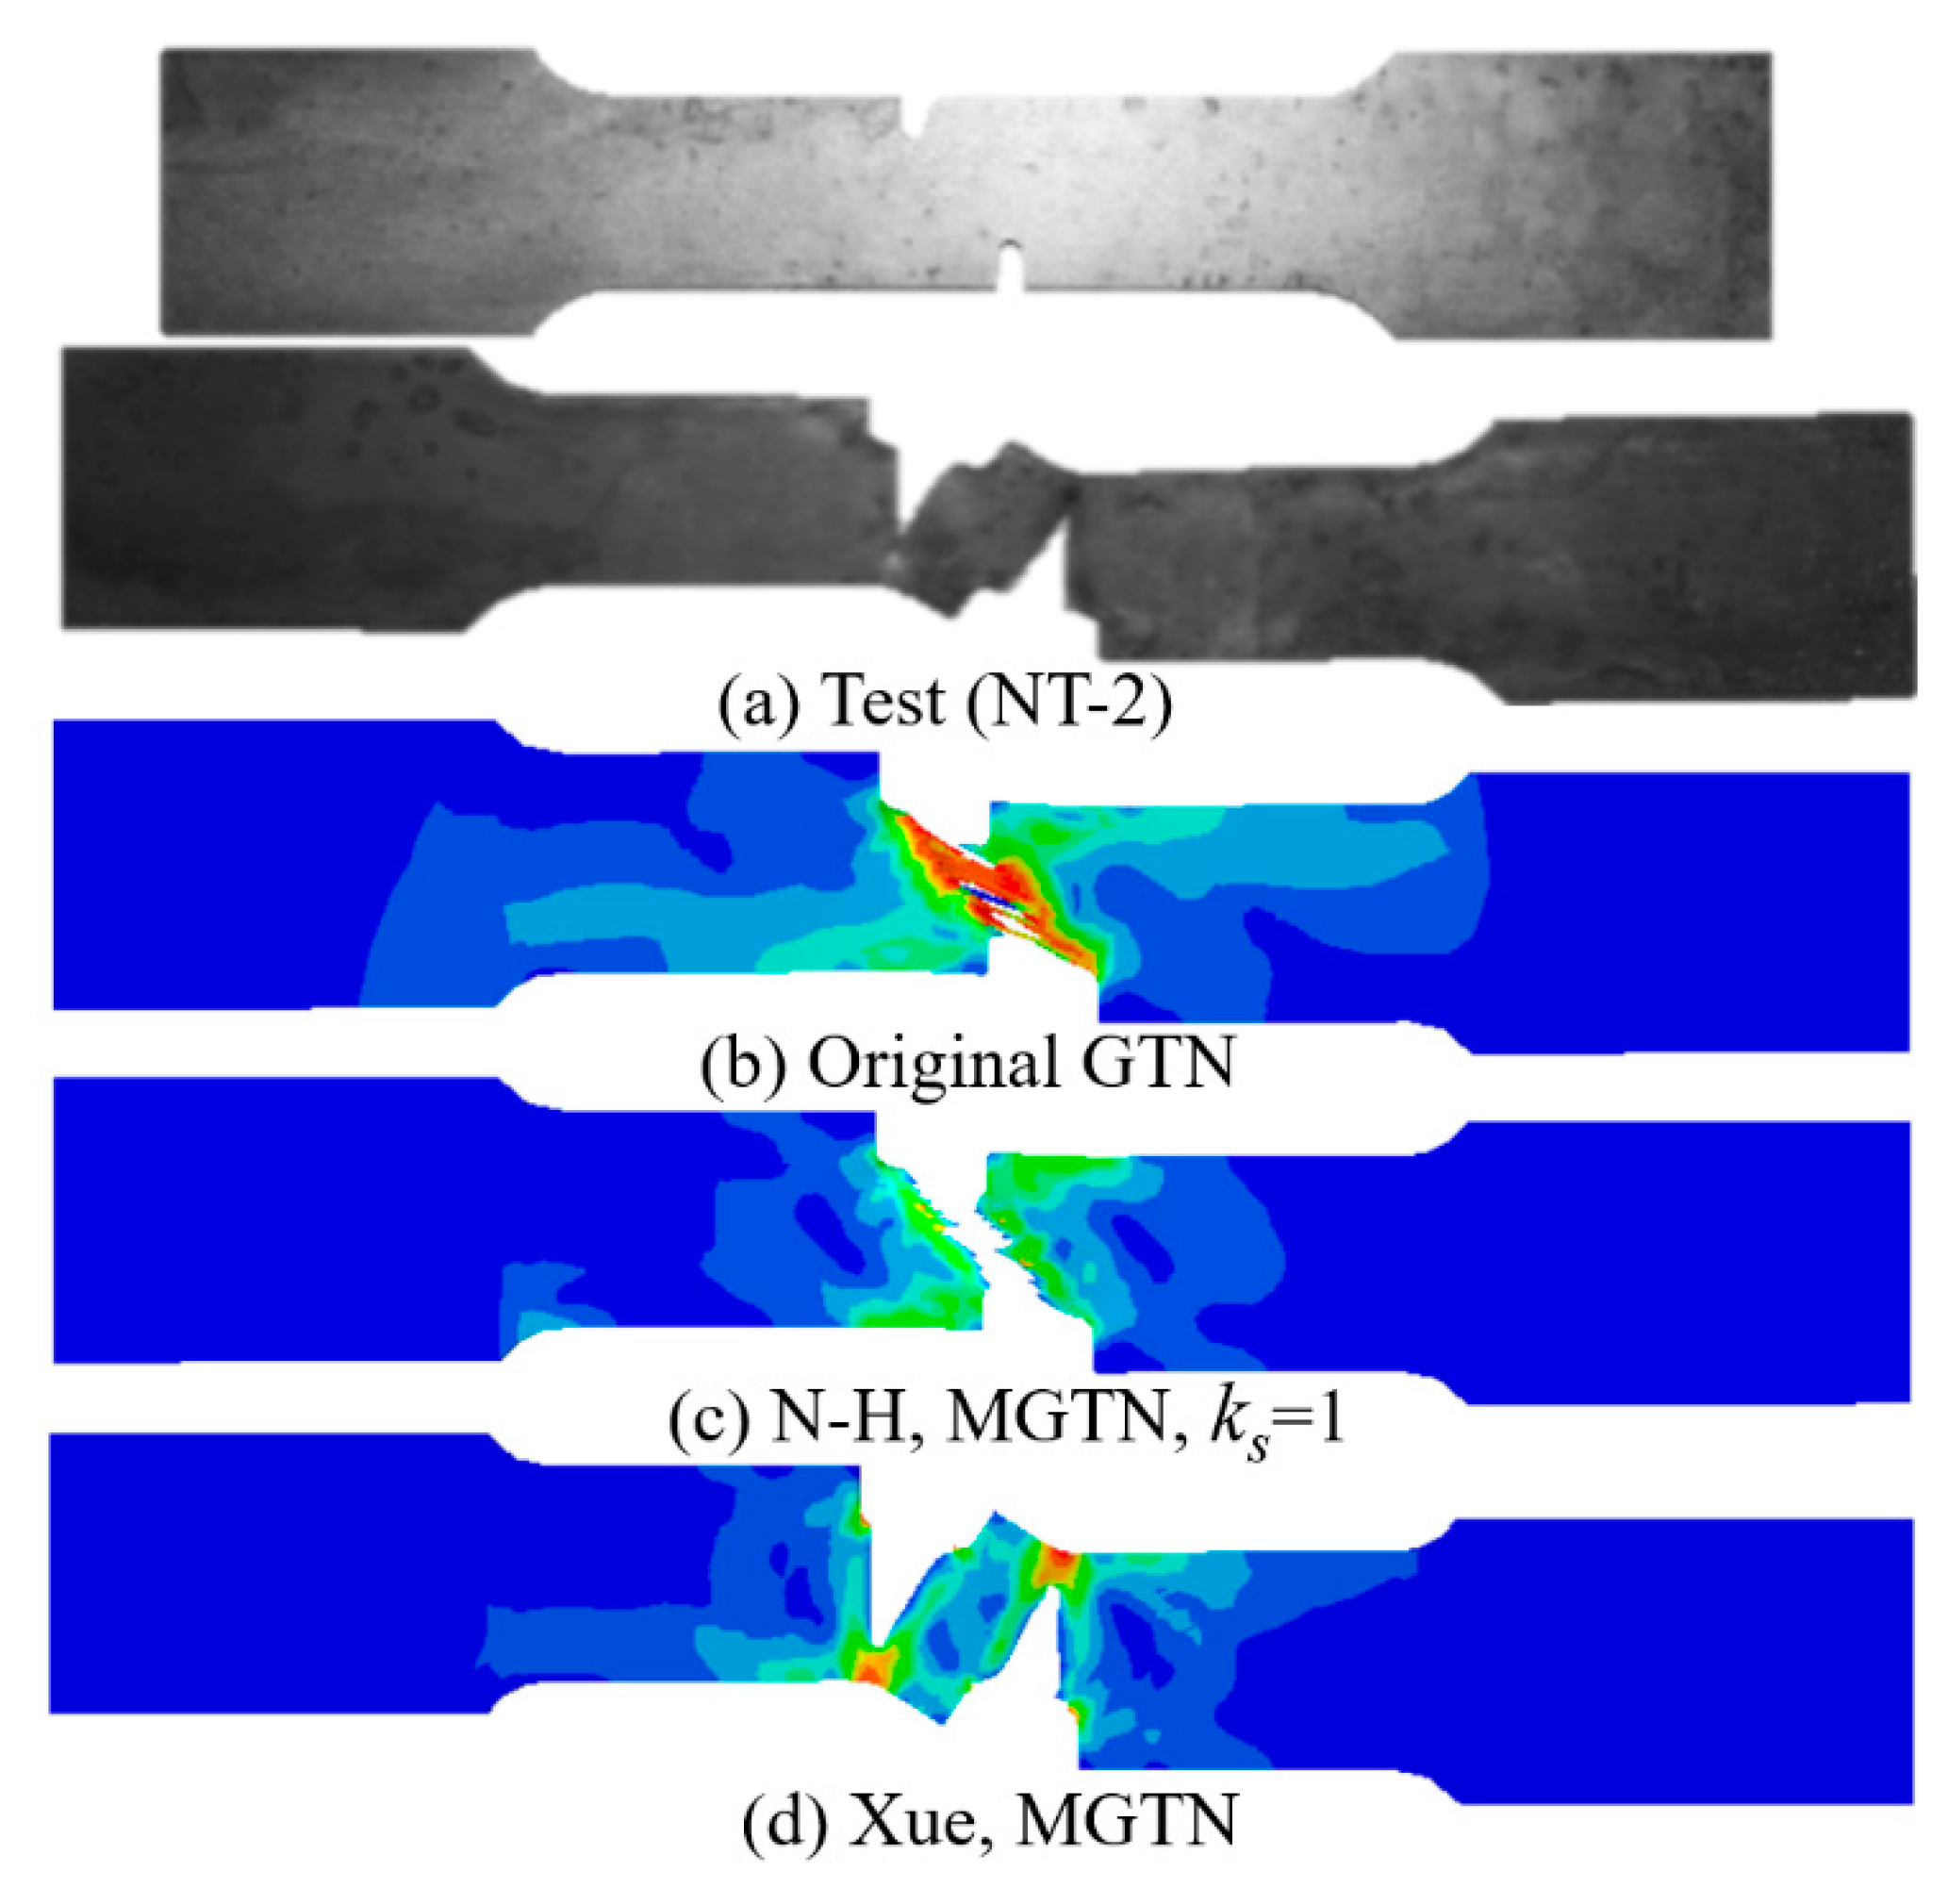
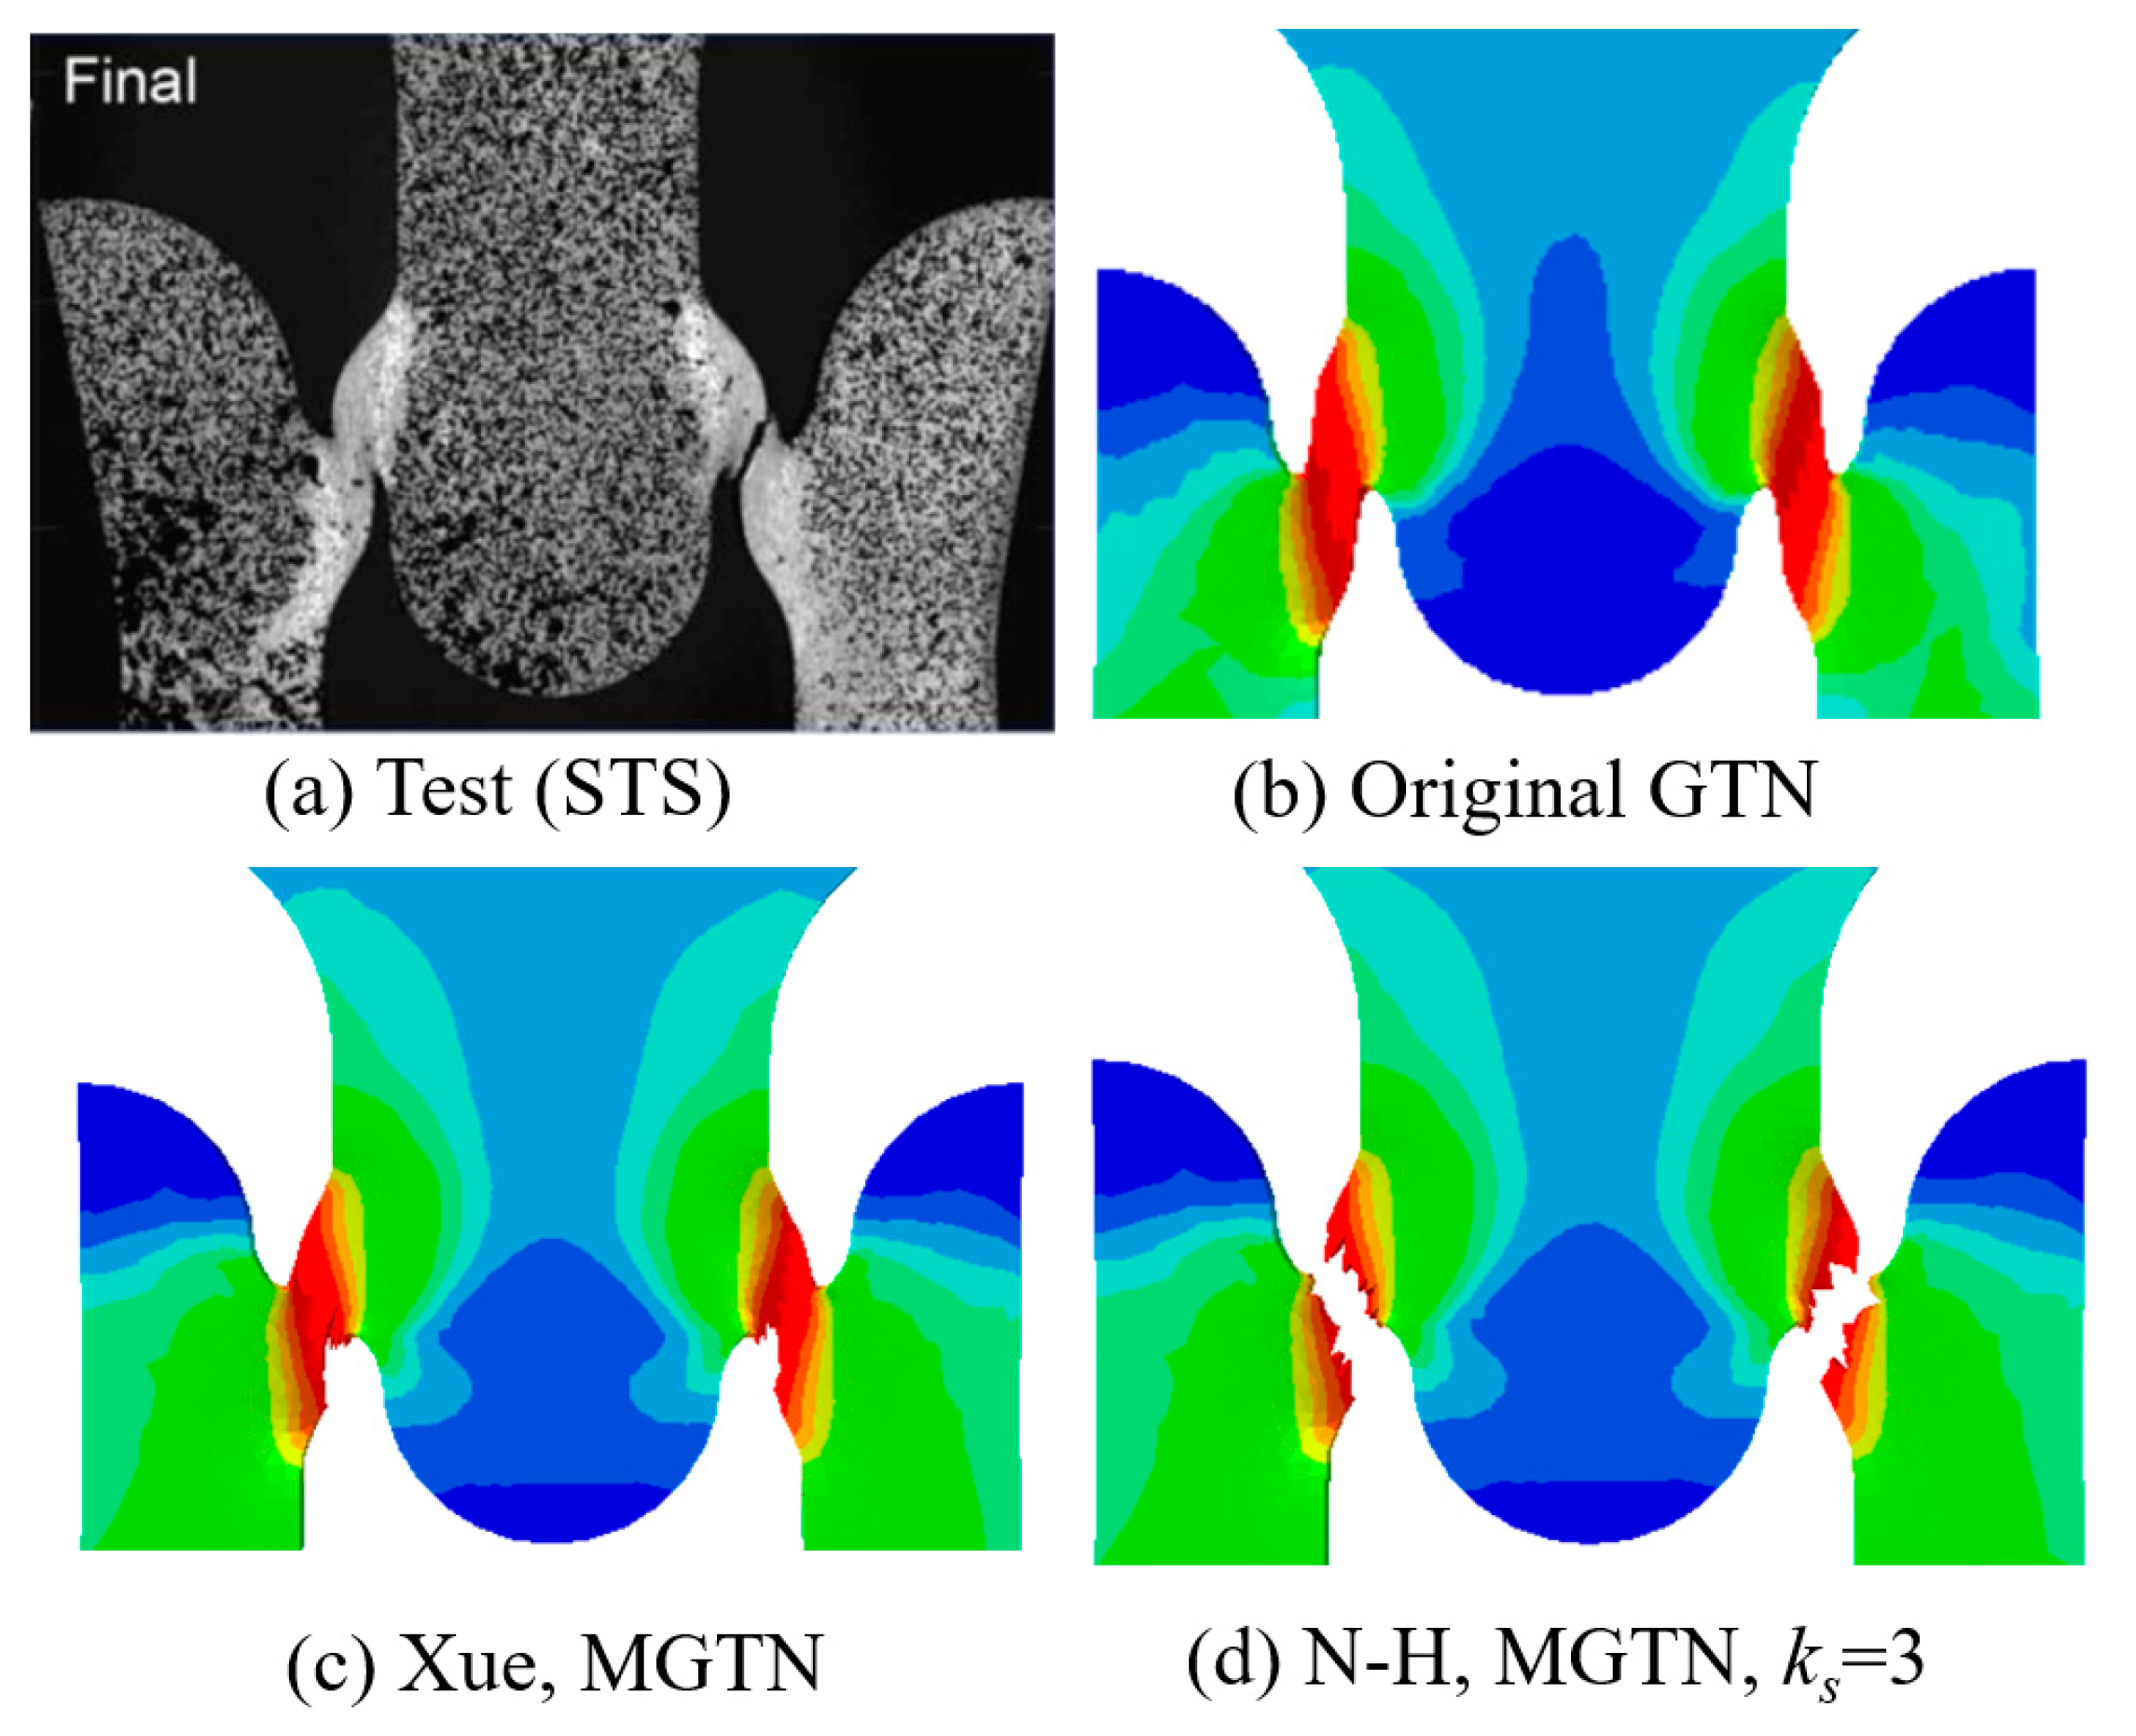
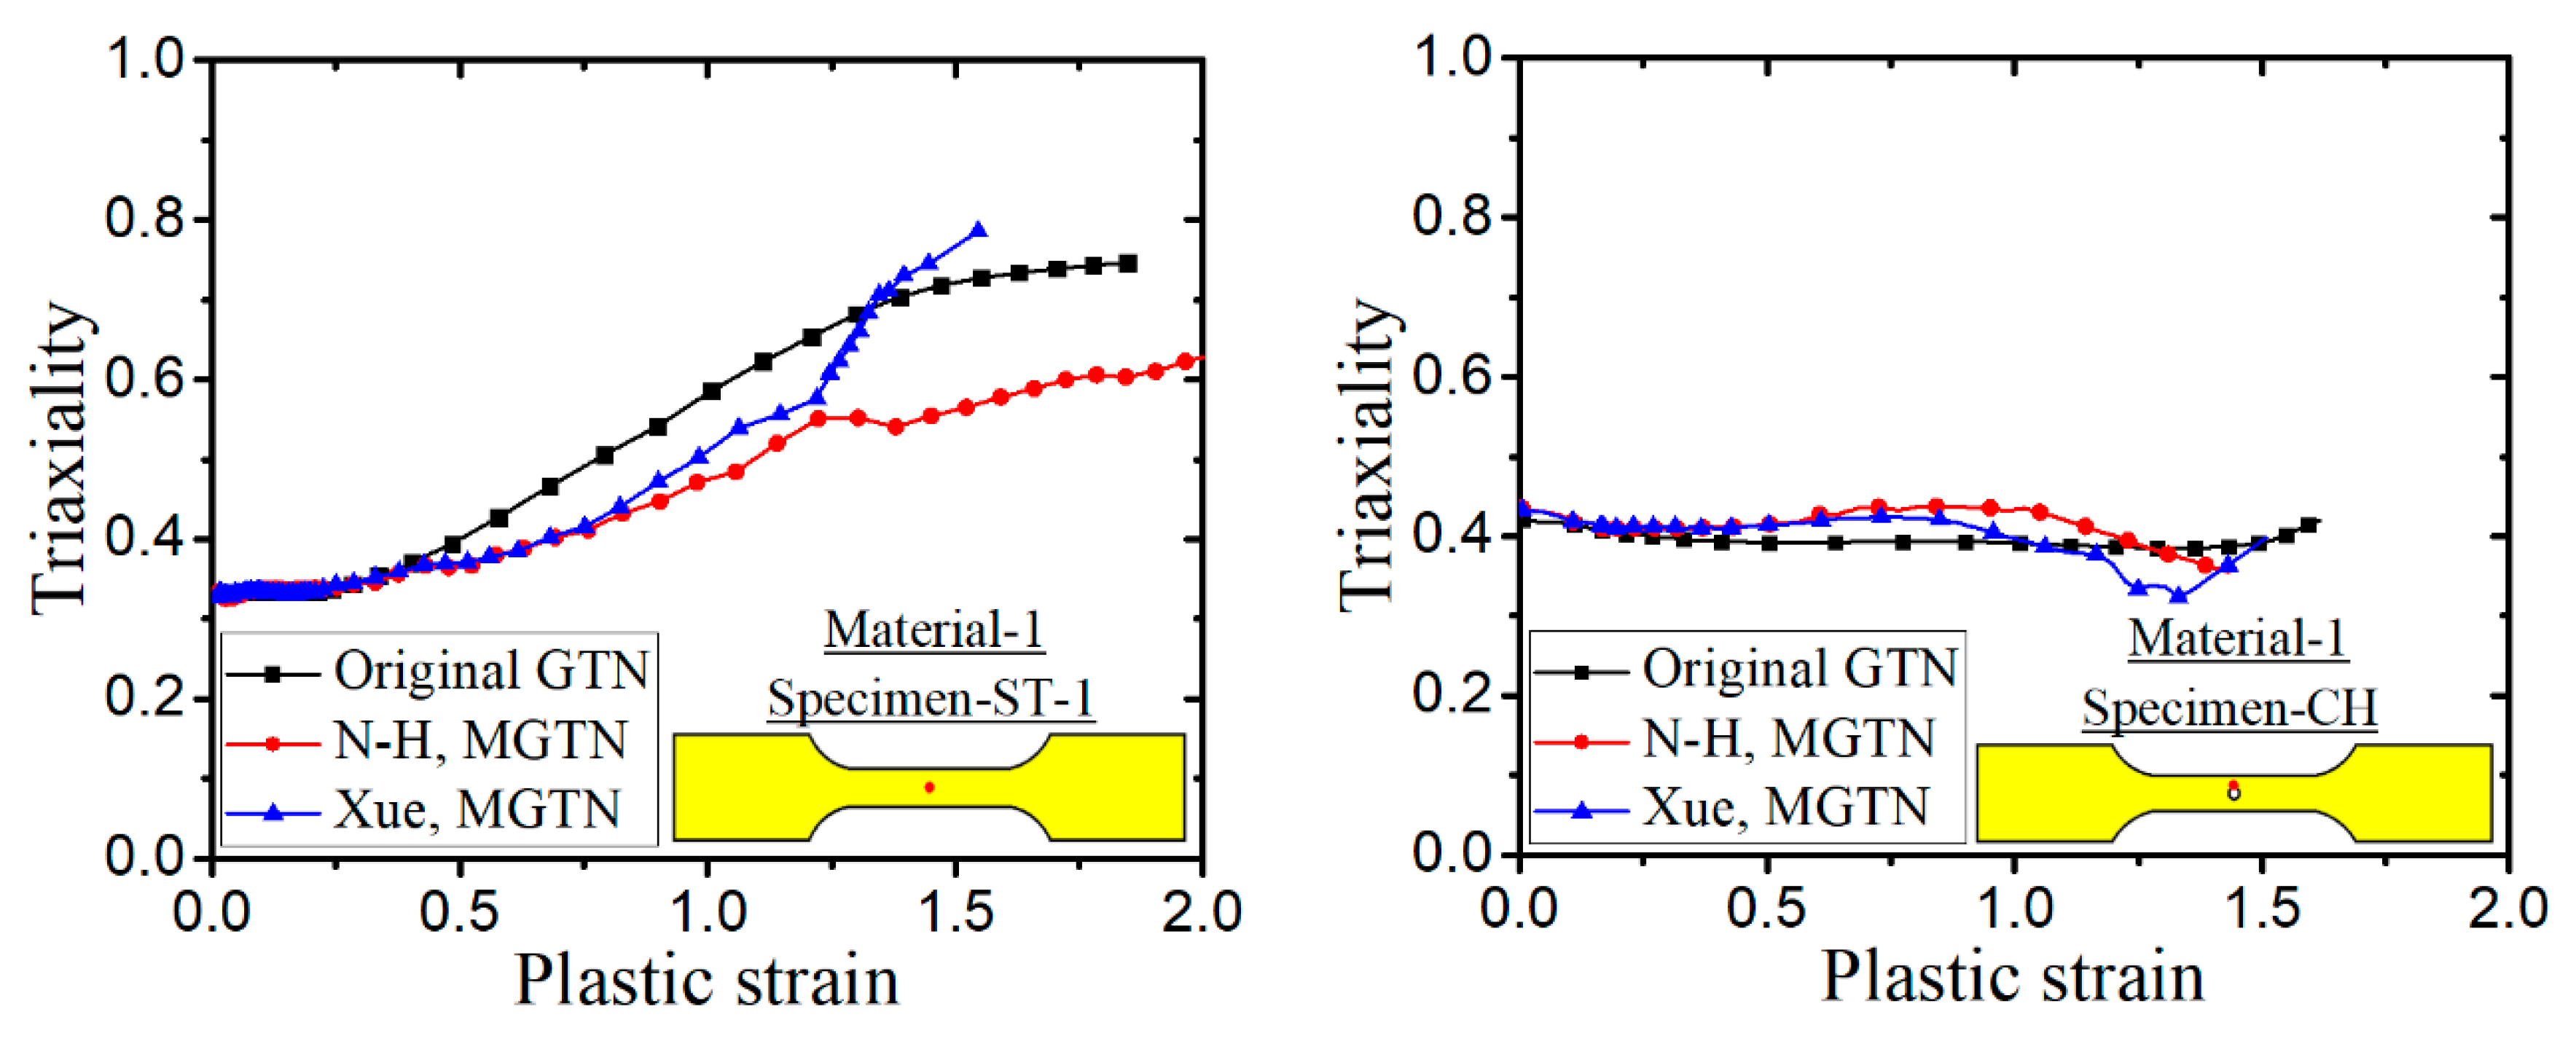
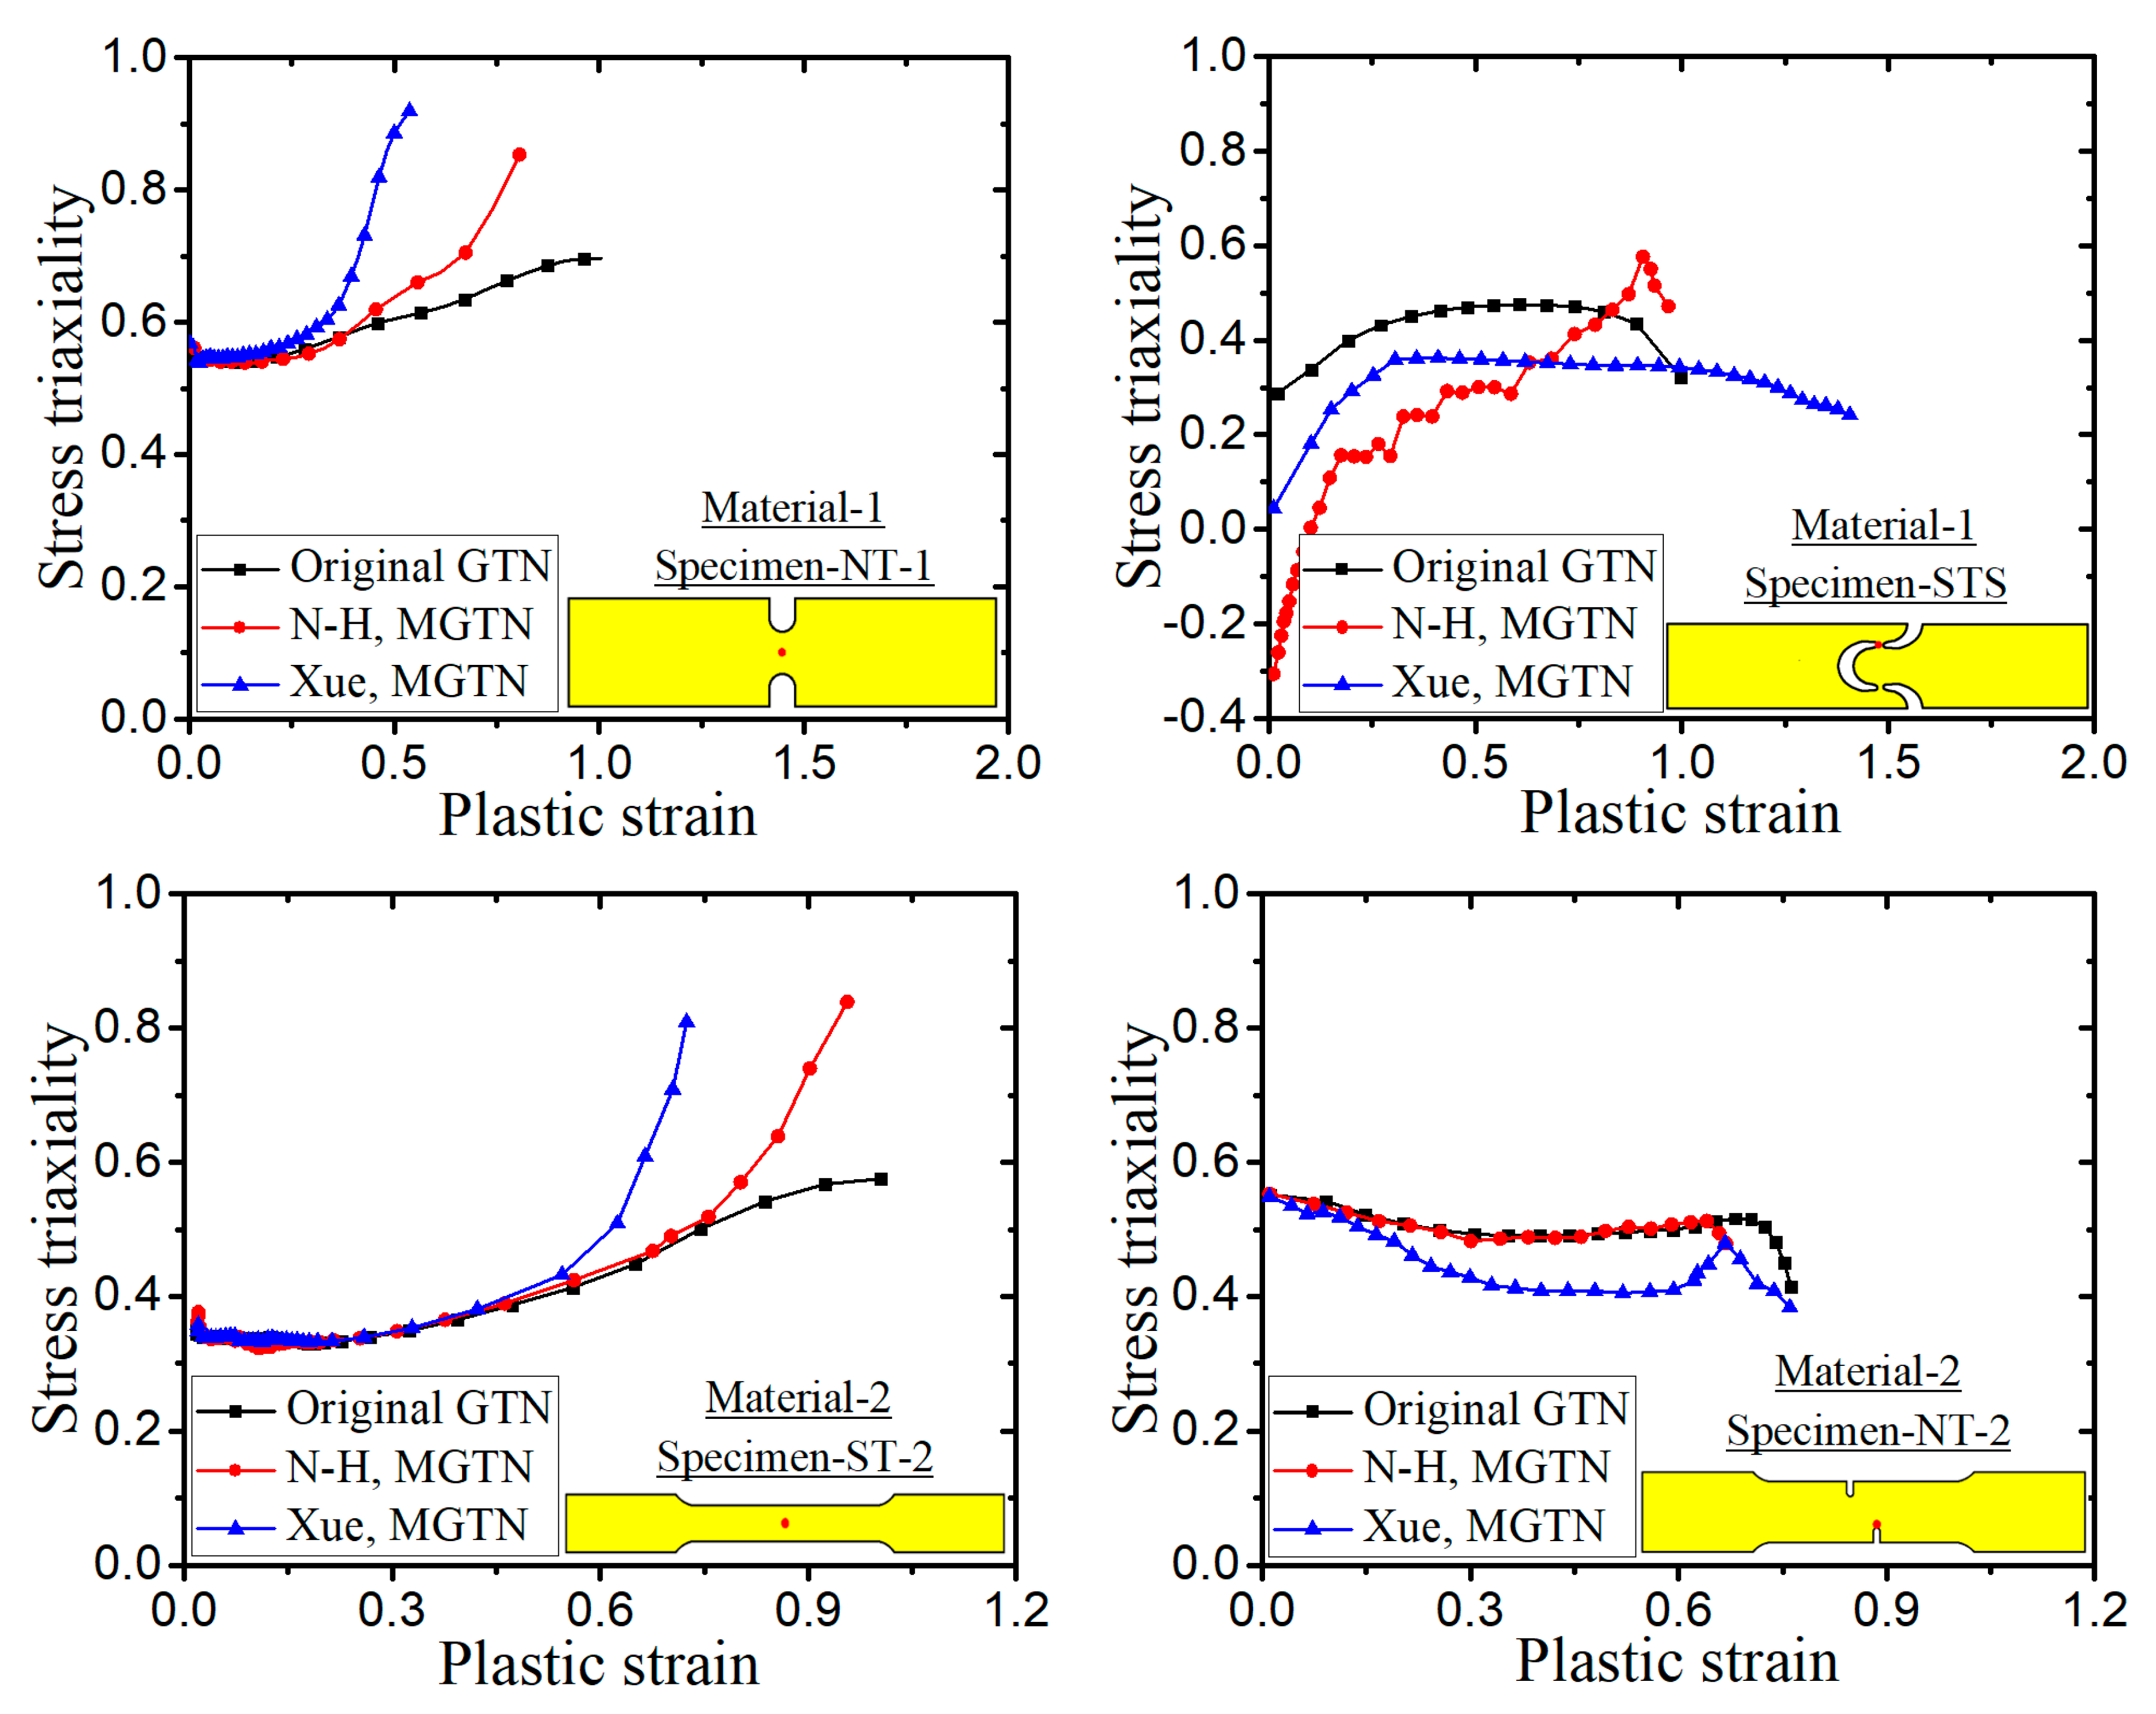
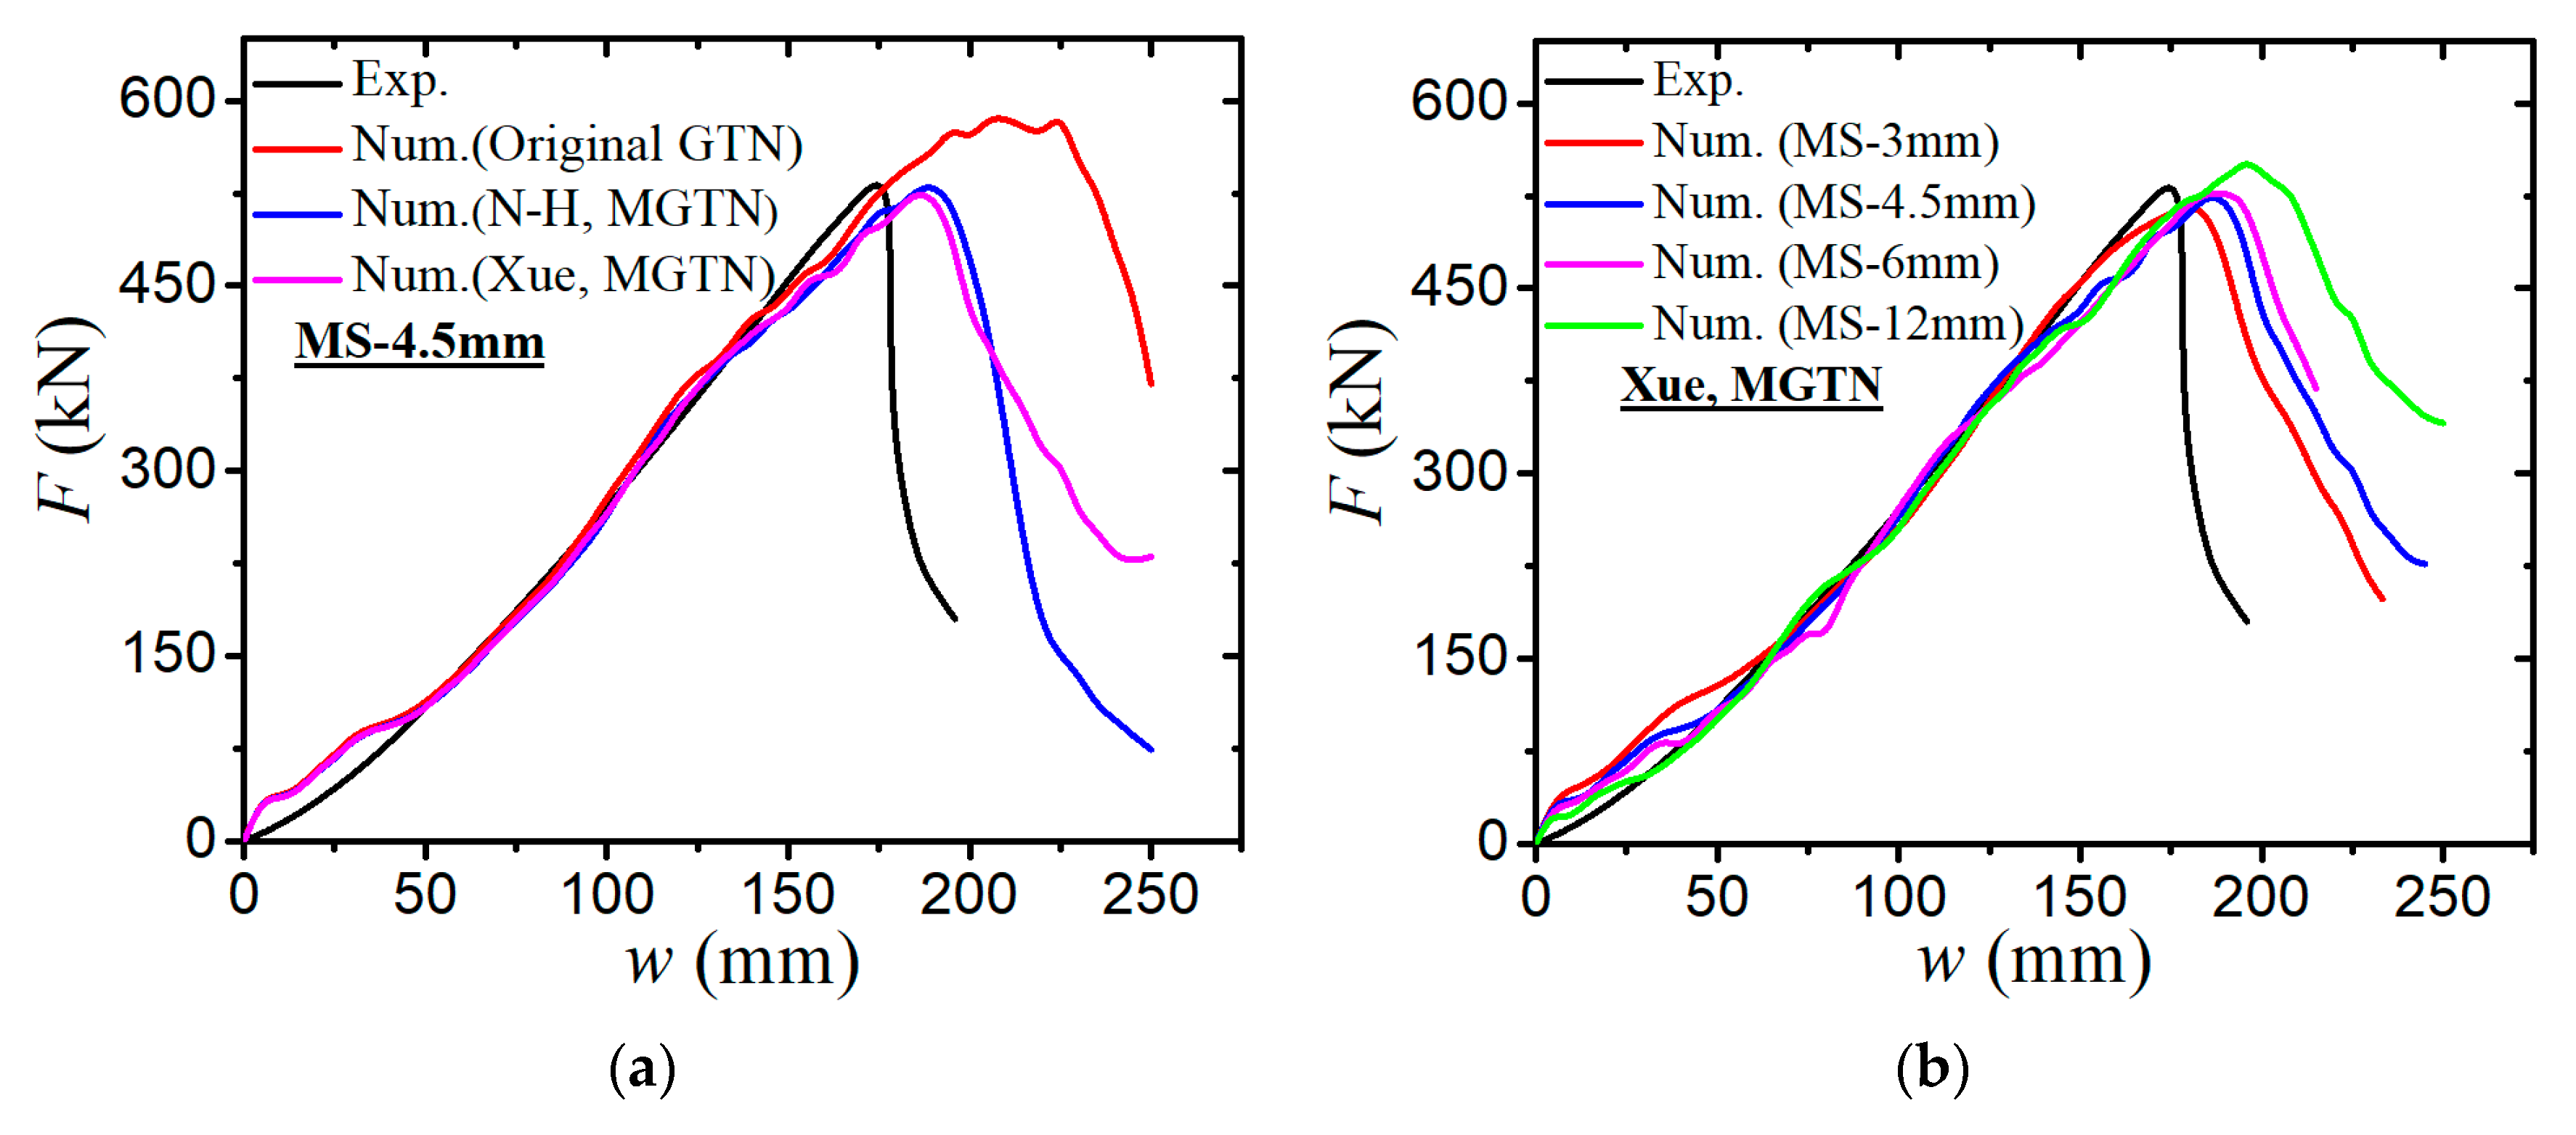
- The numerical prediction based on Xue’s or the N-H modified GTN models provides closer estimations on the crack initiation and the load–displacement relationships observed from the tensile tests with various geometries and stress triaxialities and shearing conditions. The damage evolution associated with the shearing of voids has strong influences on the stress triaxiality versus equivalent plastic strain under complex stress states, especially for the shear-driven fracture failure. A strong mesh sensitivity to the failure criterion of the modified GTN model exists in the necking and fracture initiation stages of tests. The differences between the load–displacement curves become more pronounced when the mesh size increases.
- (3)
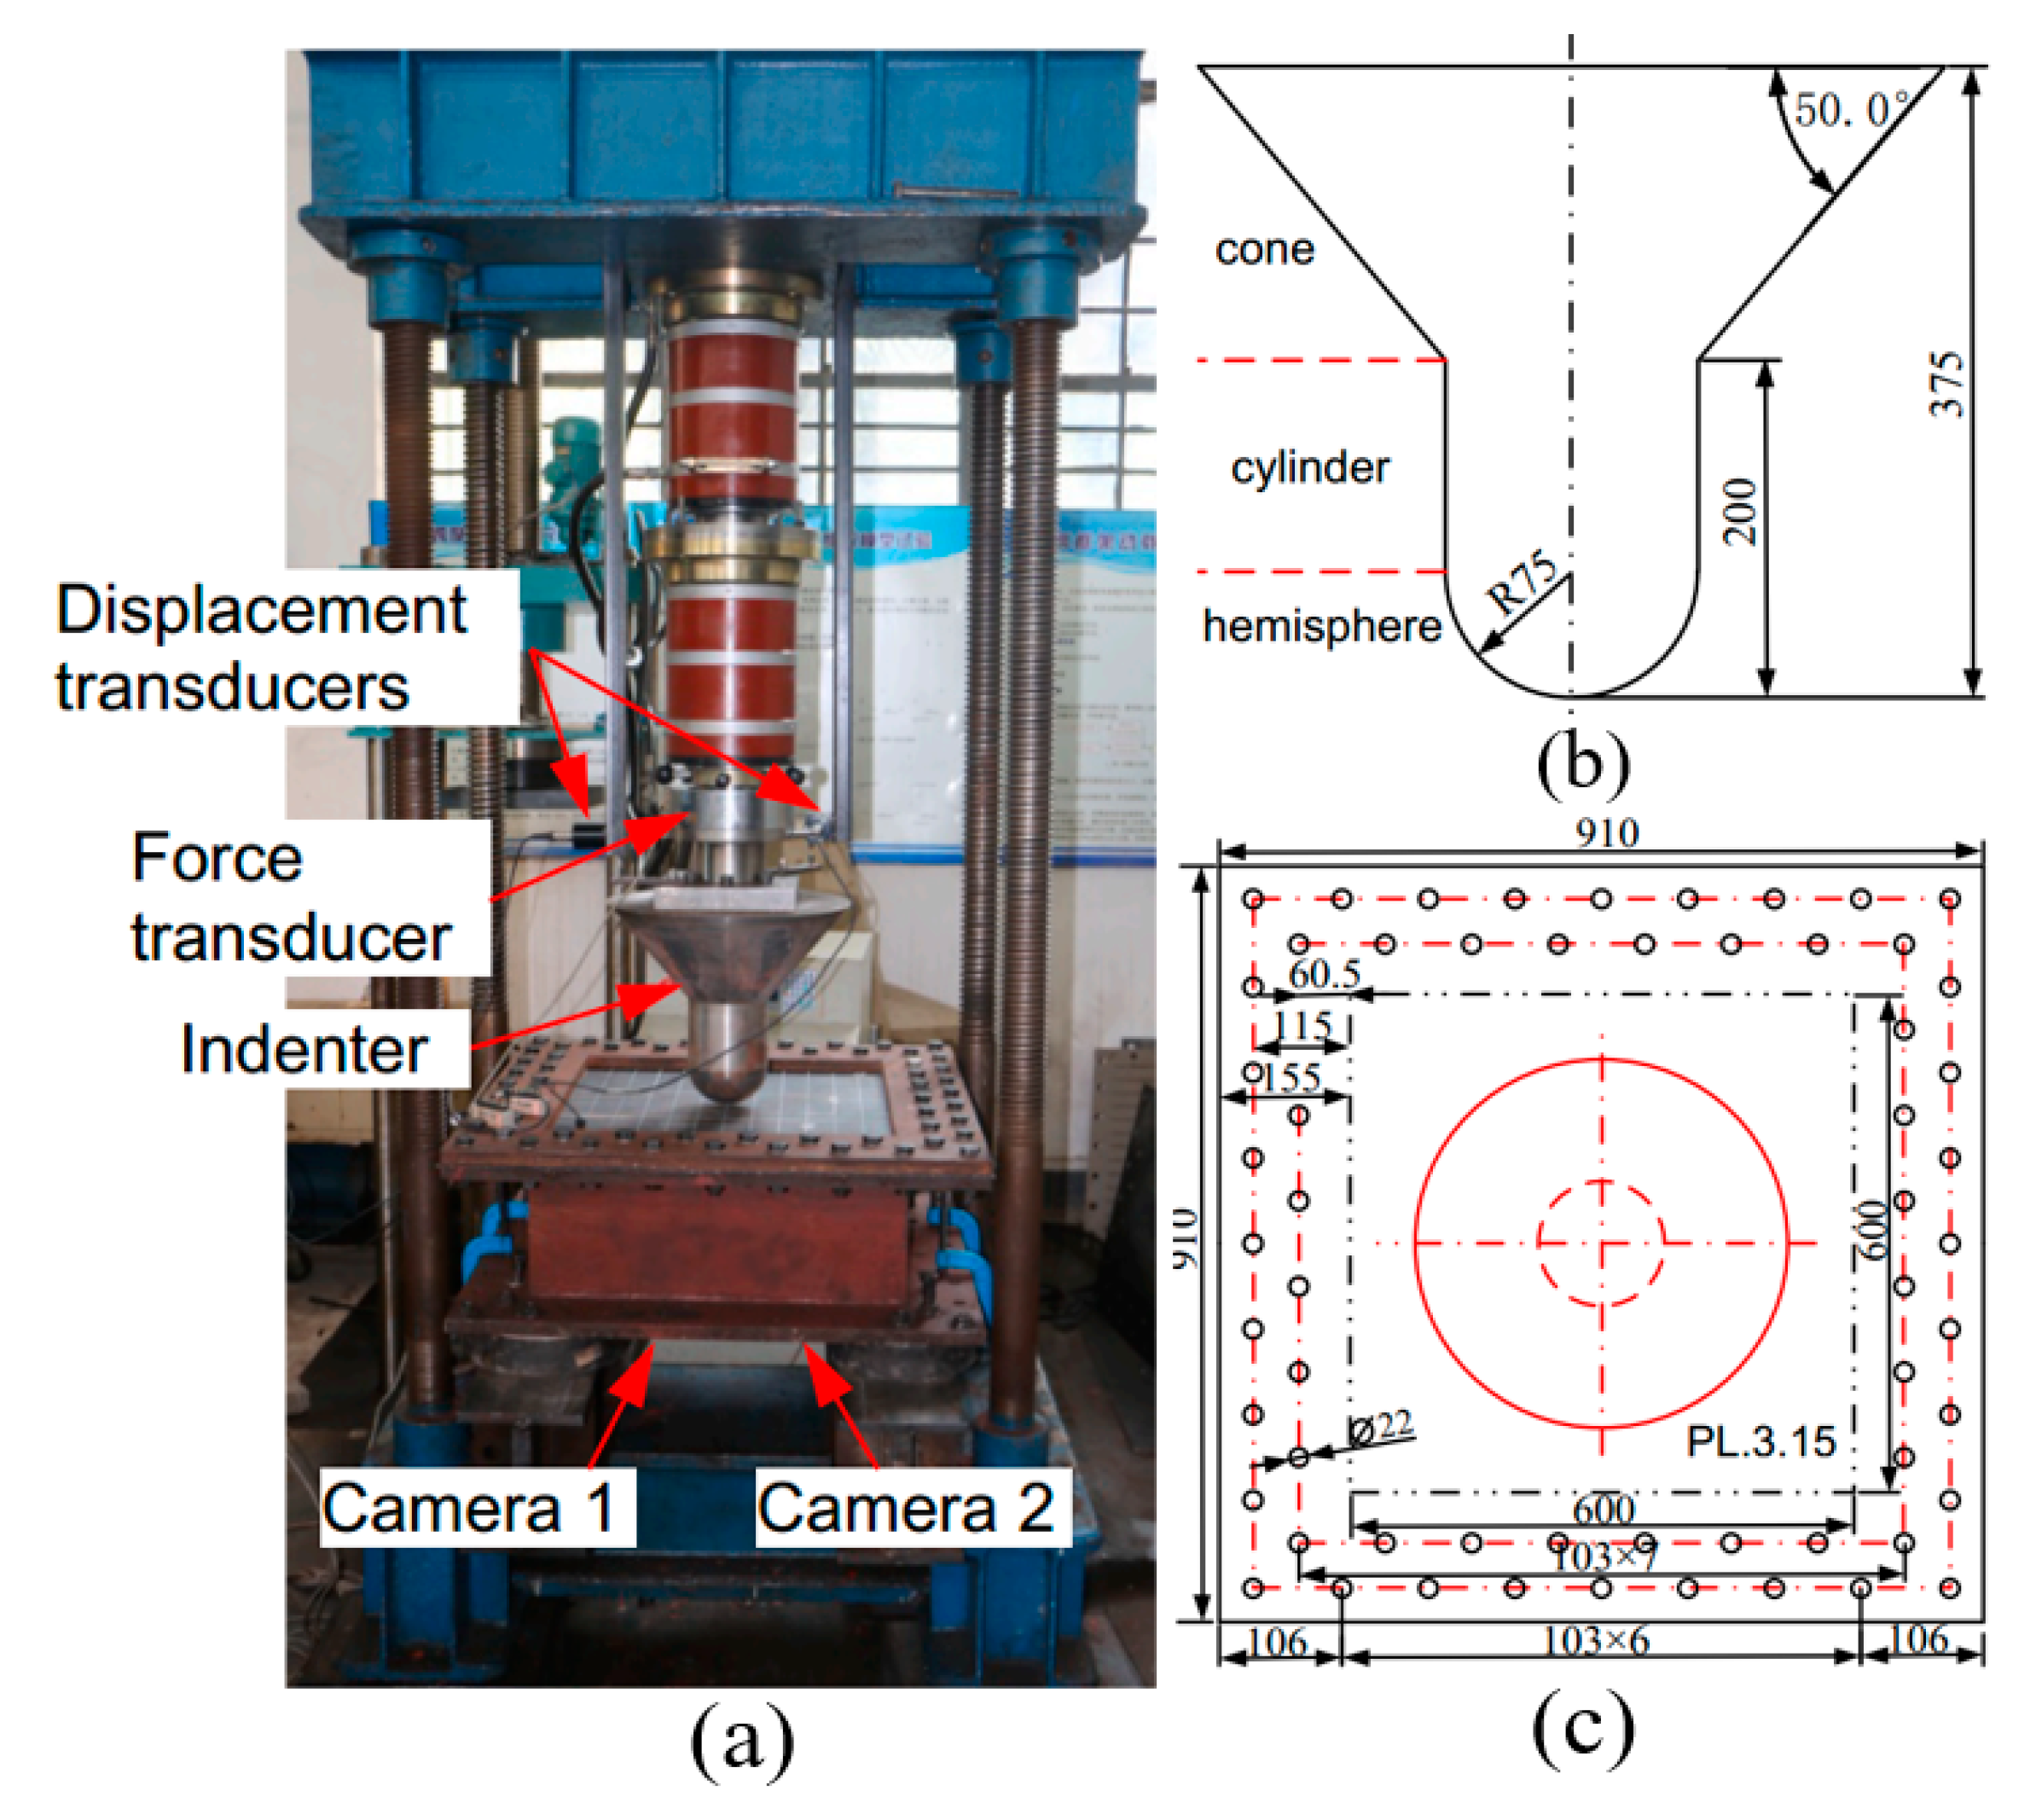
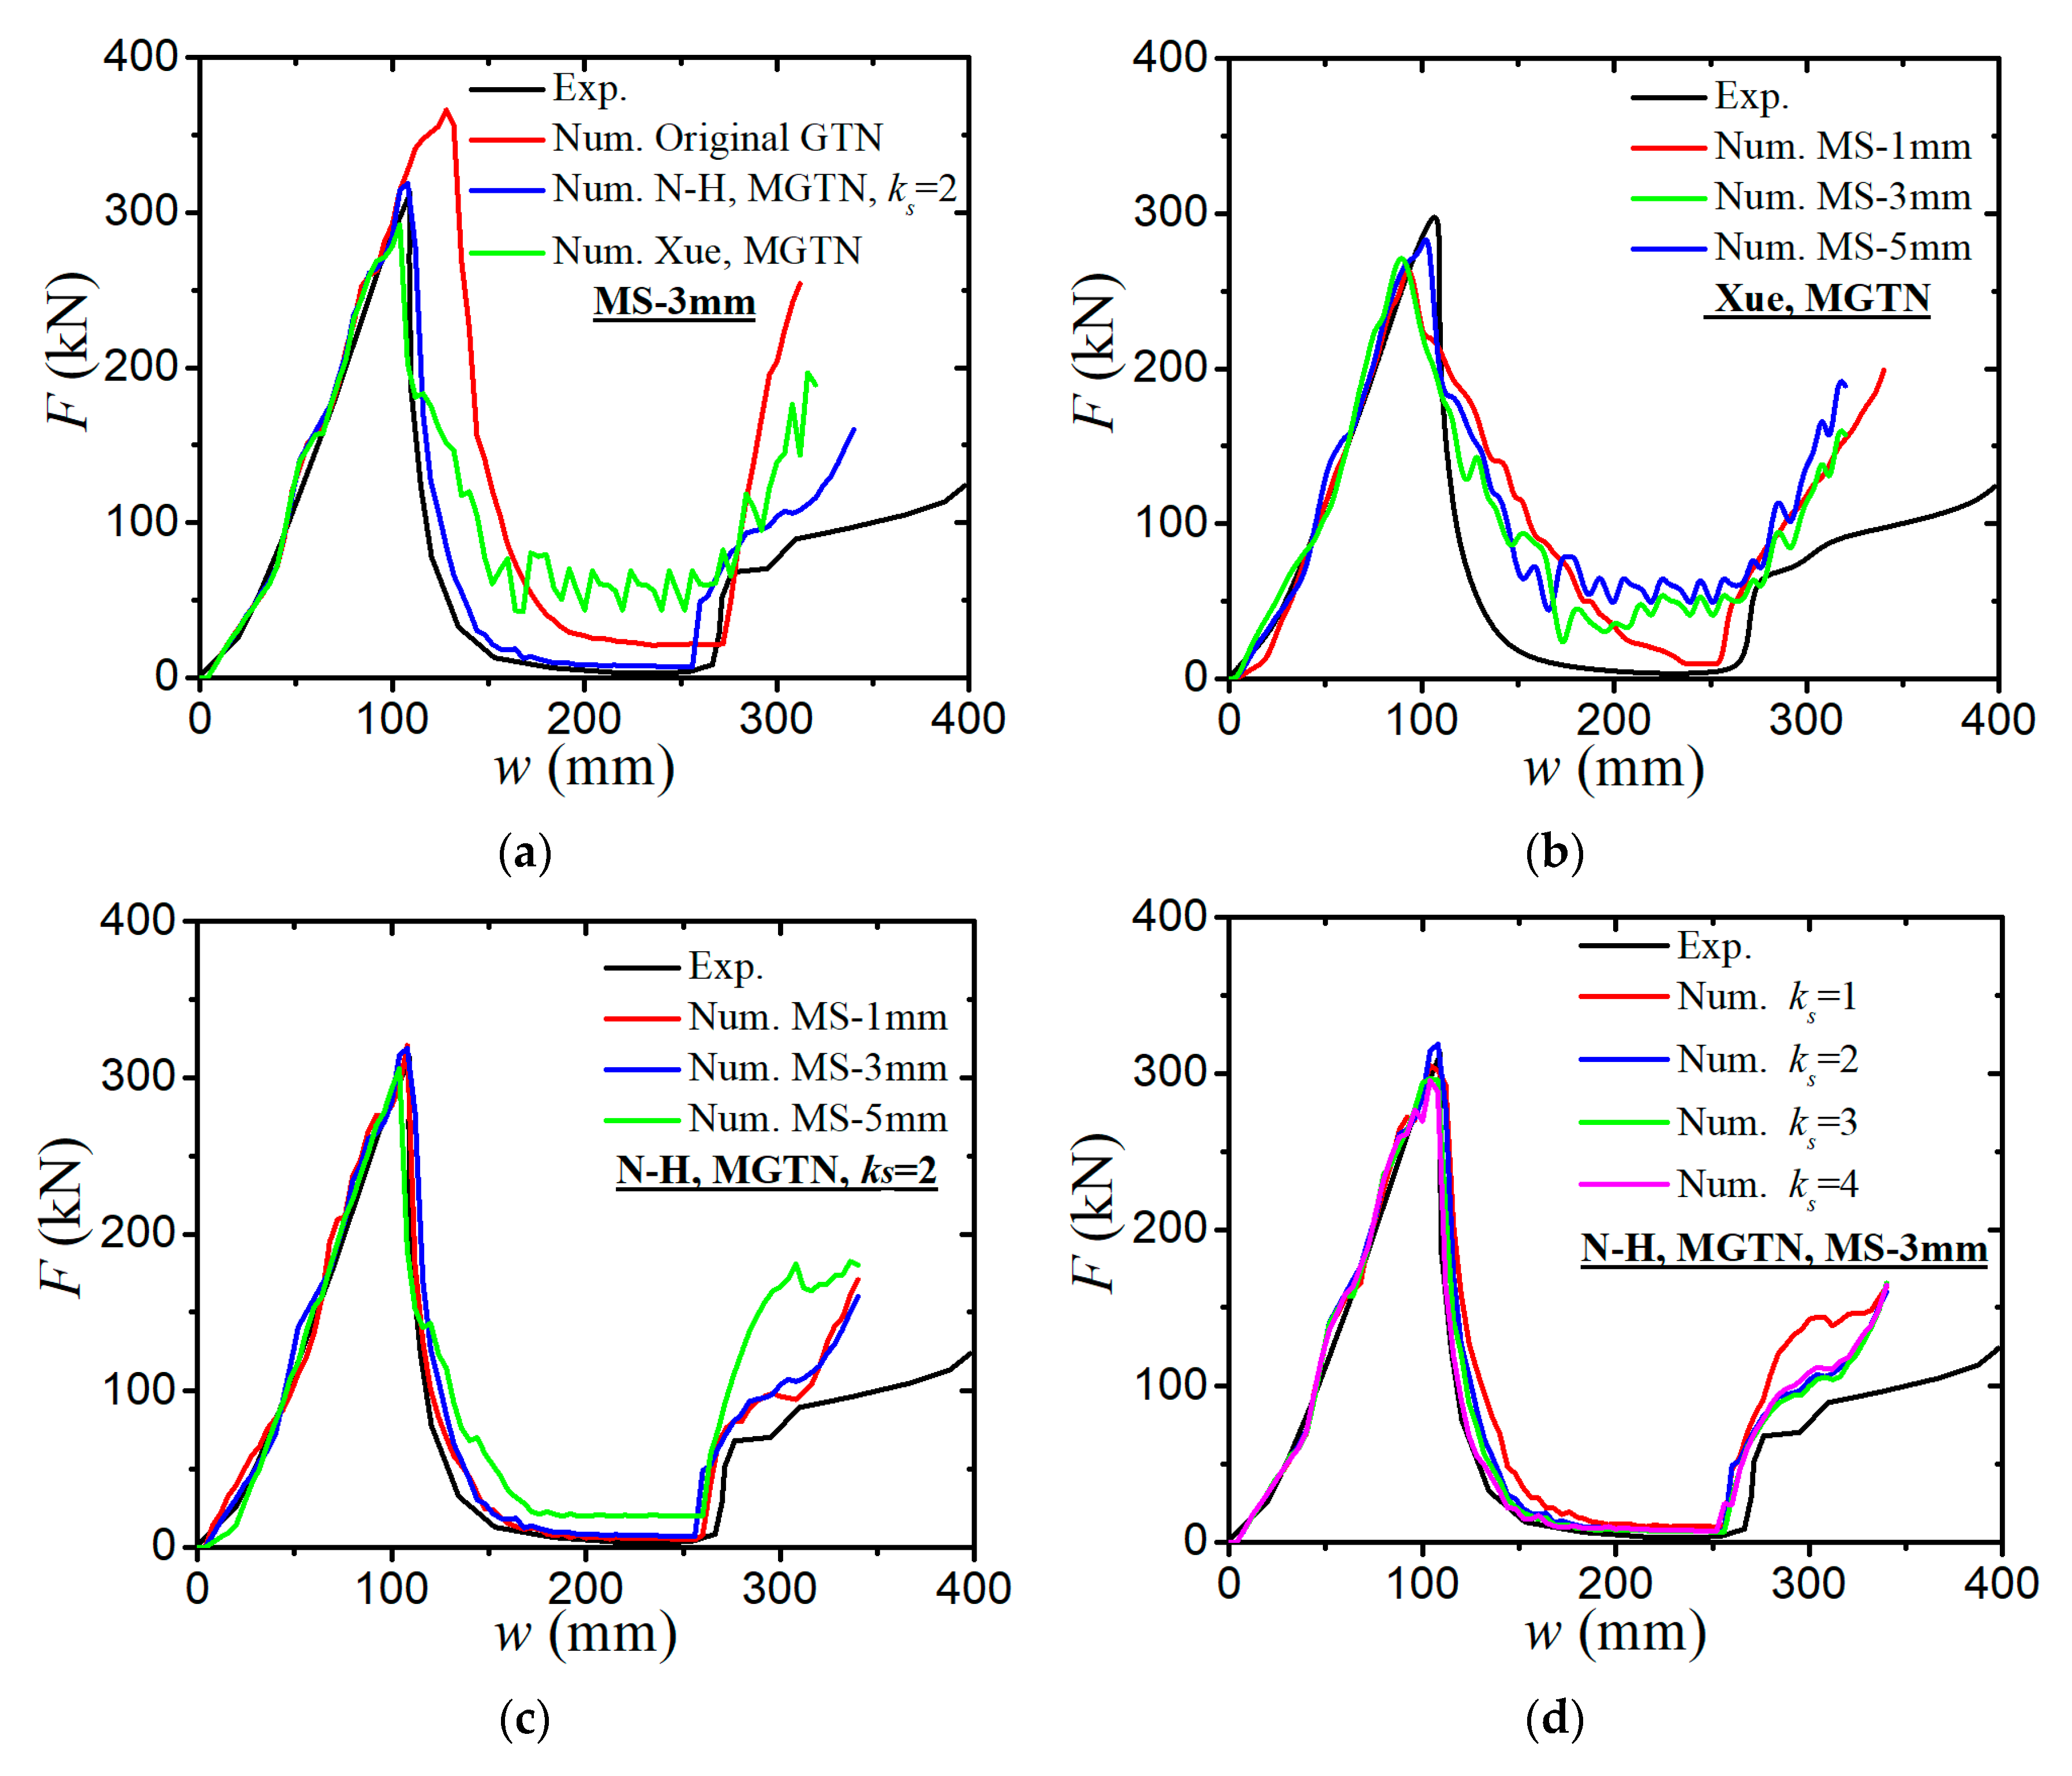
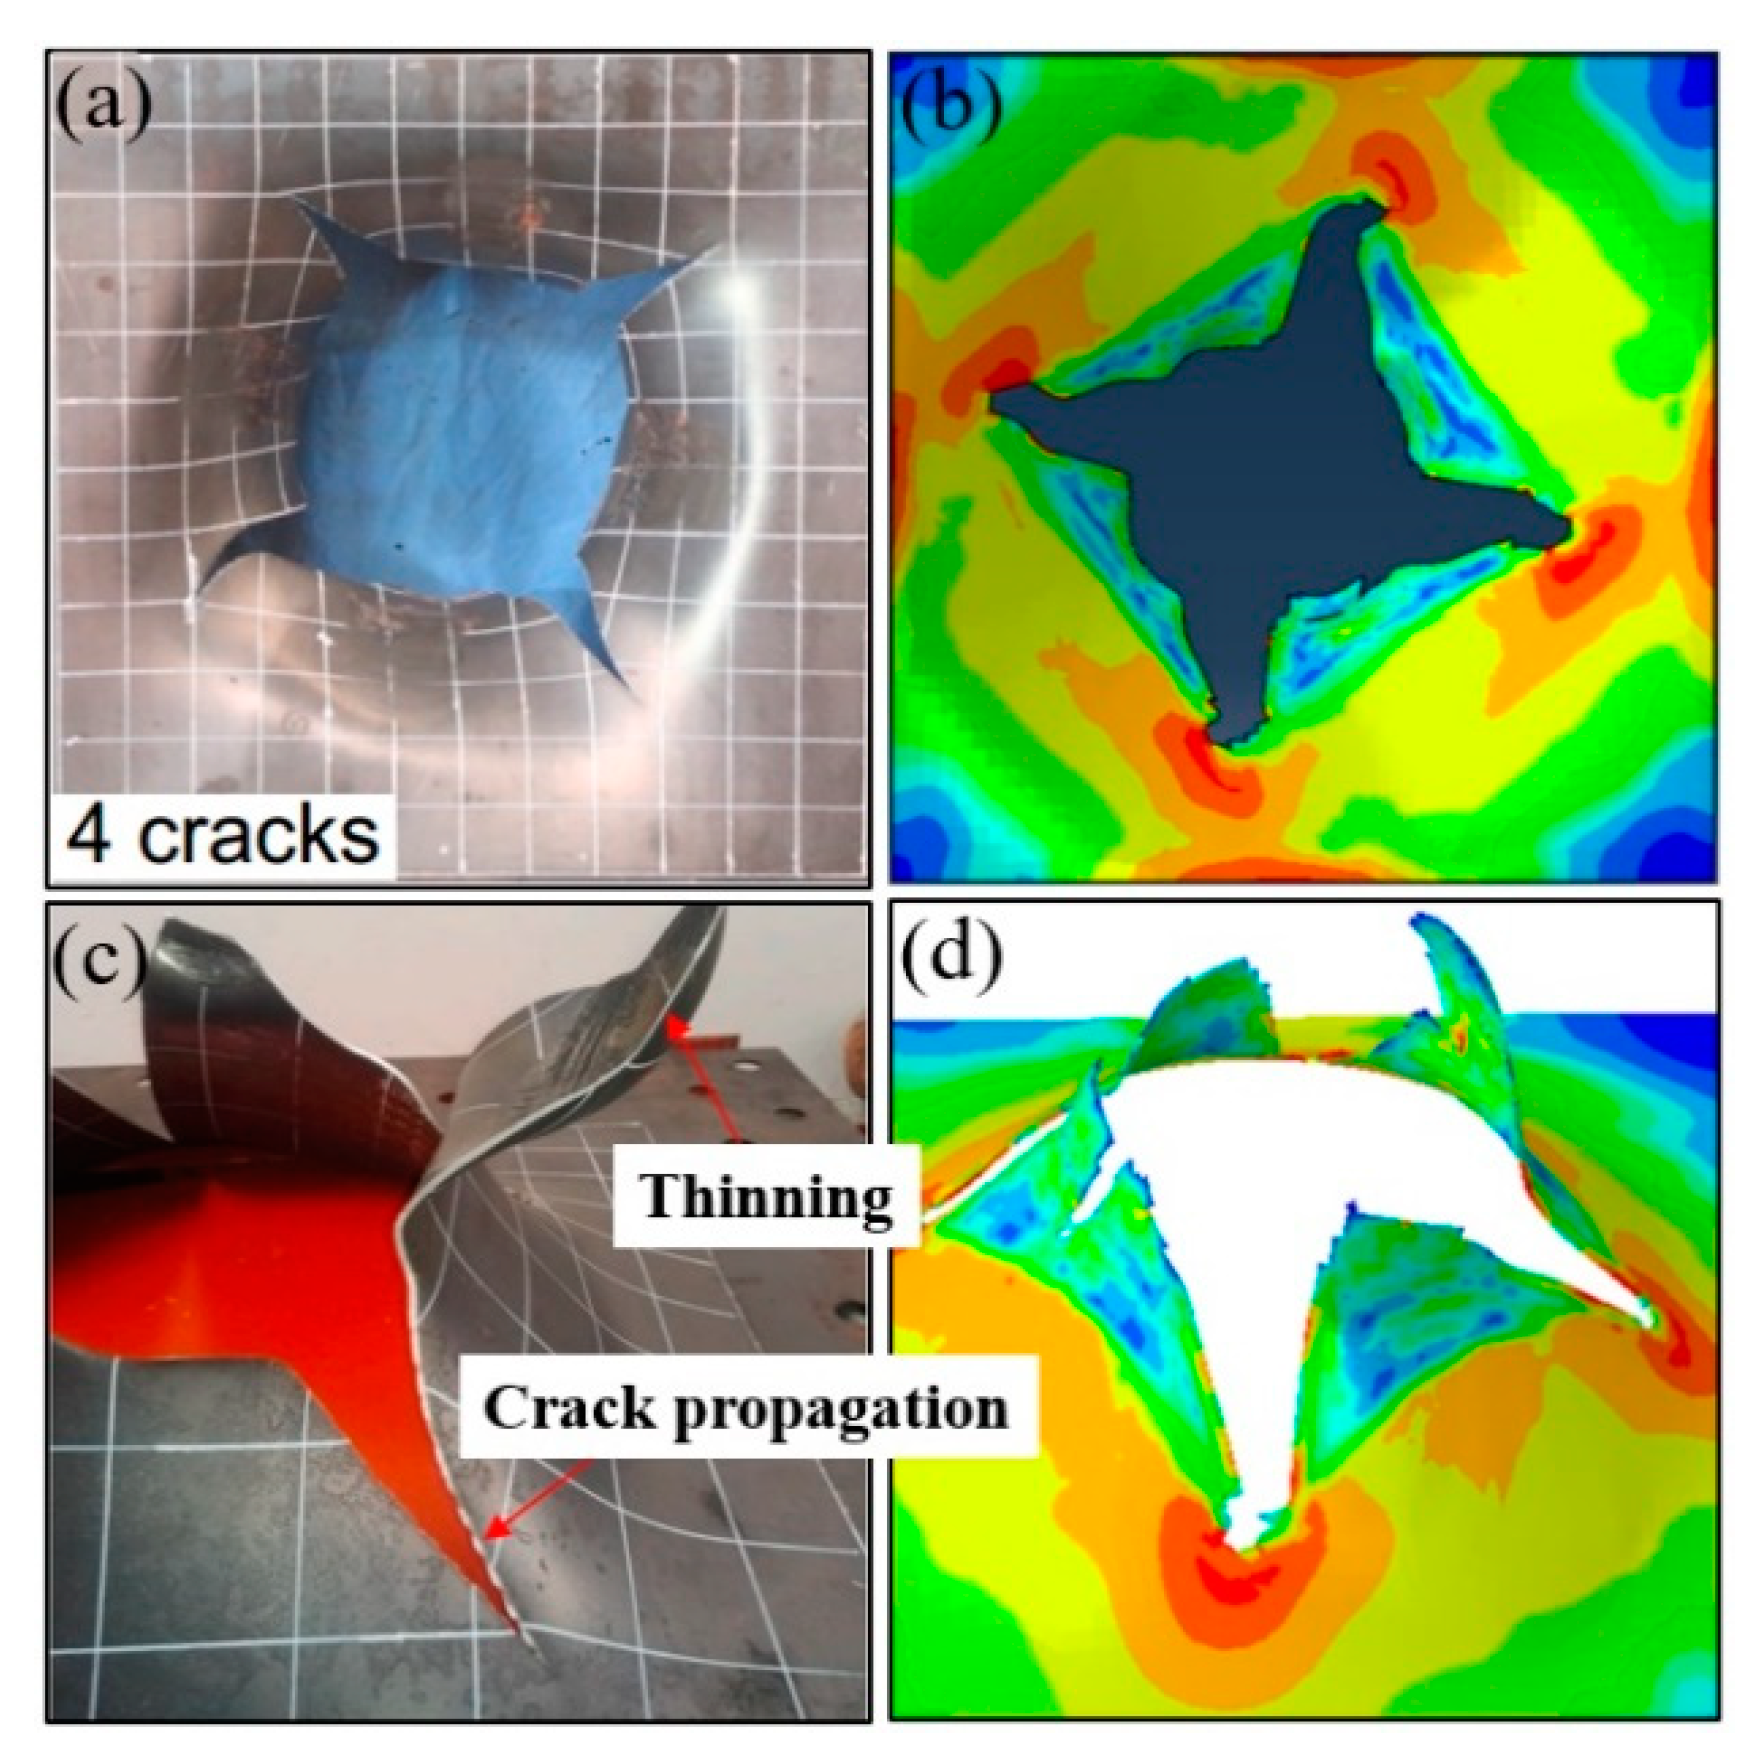
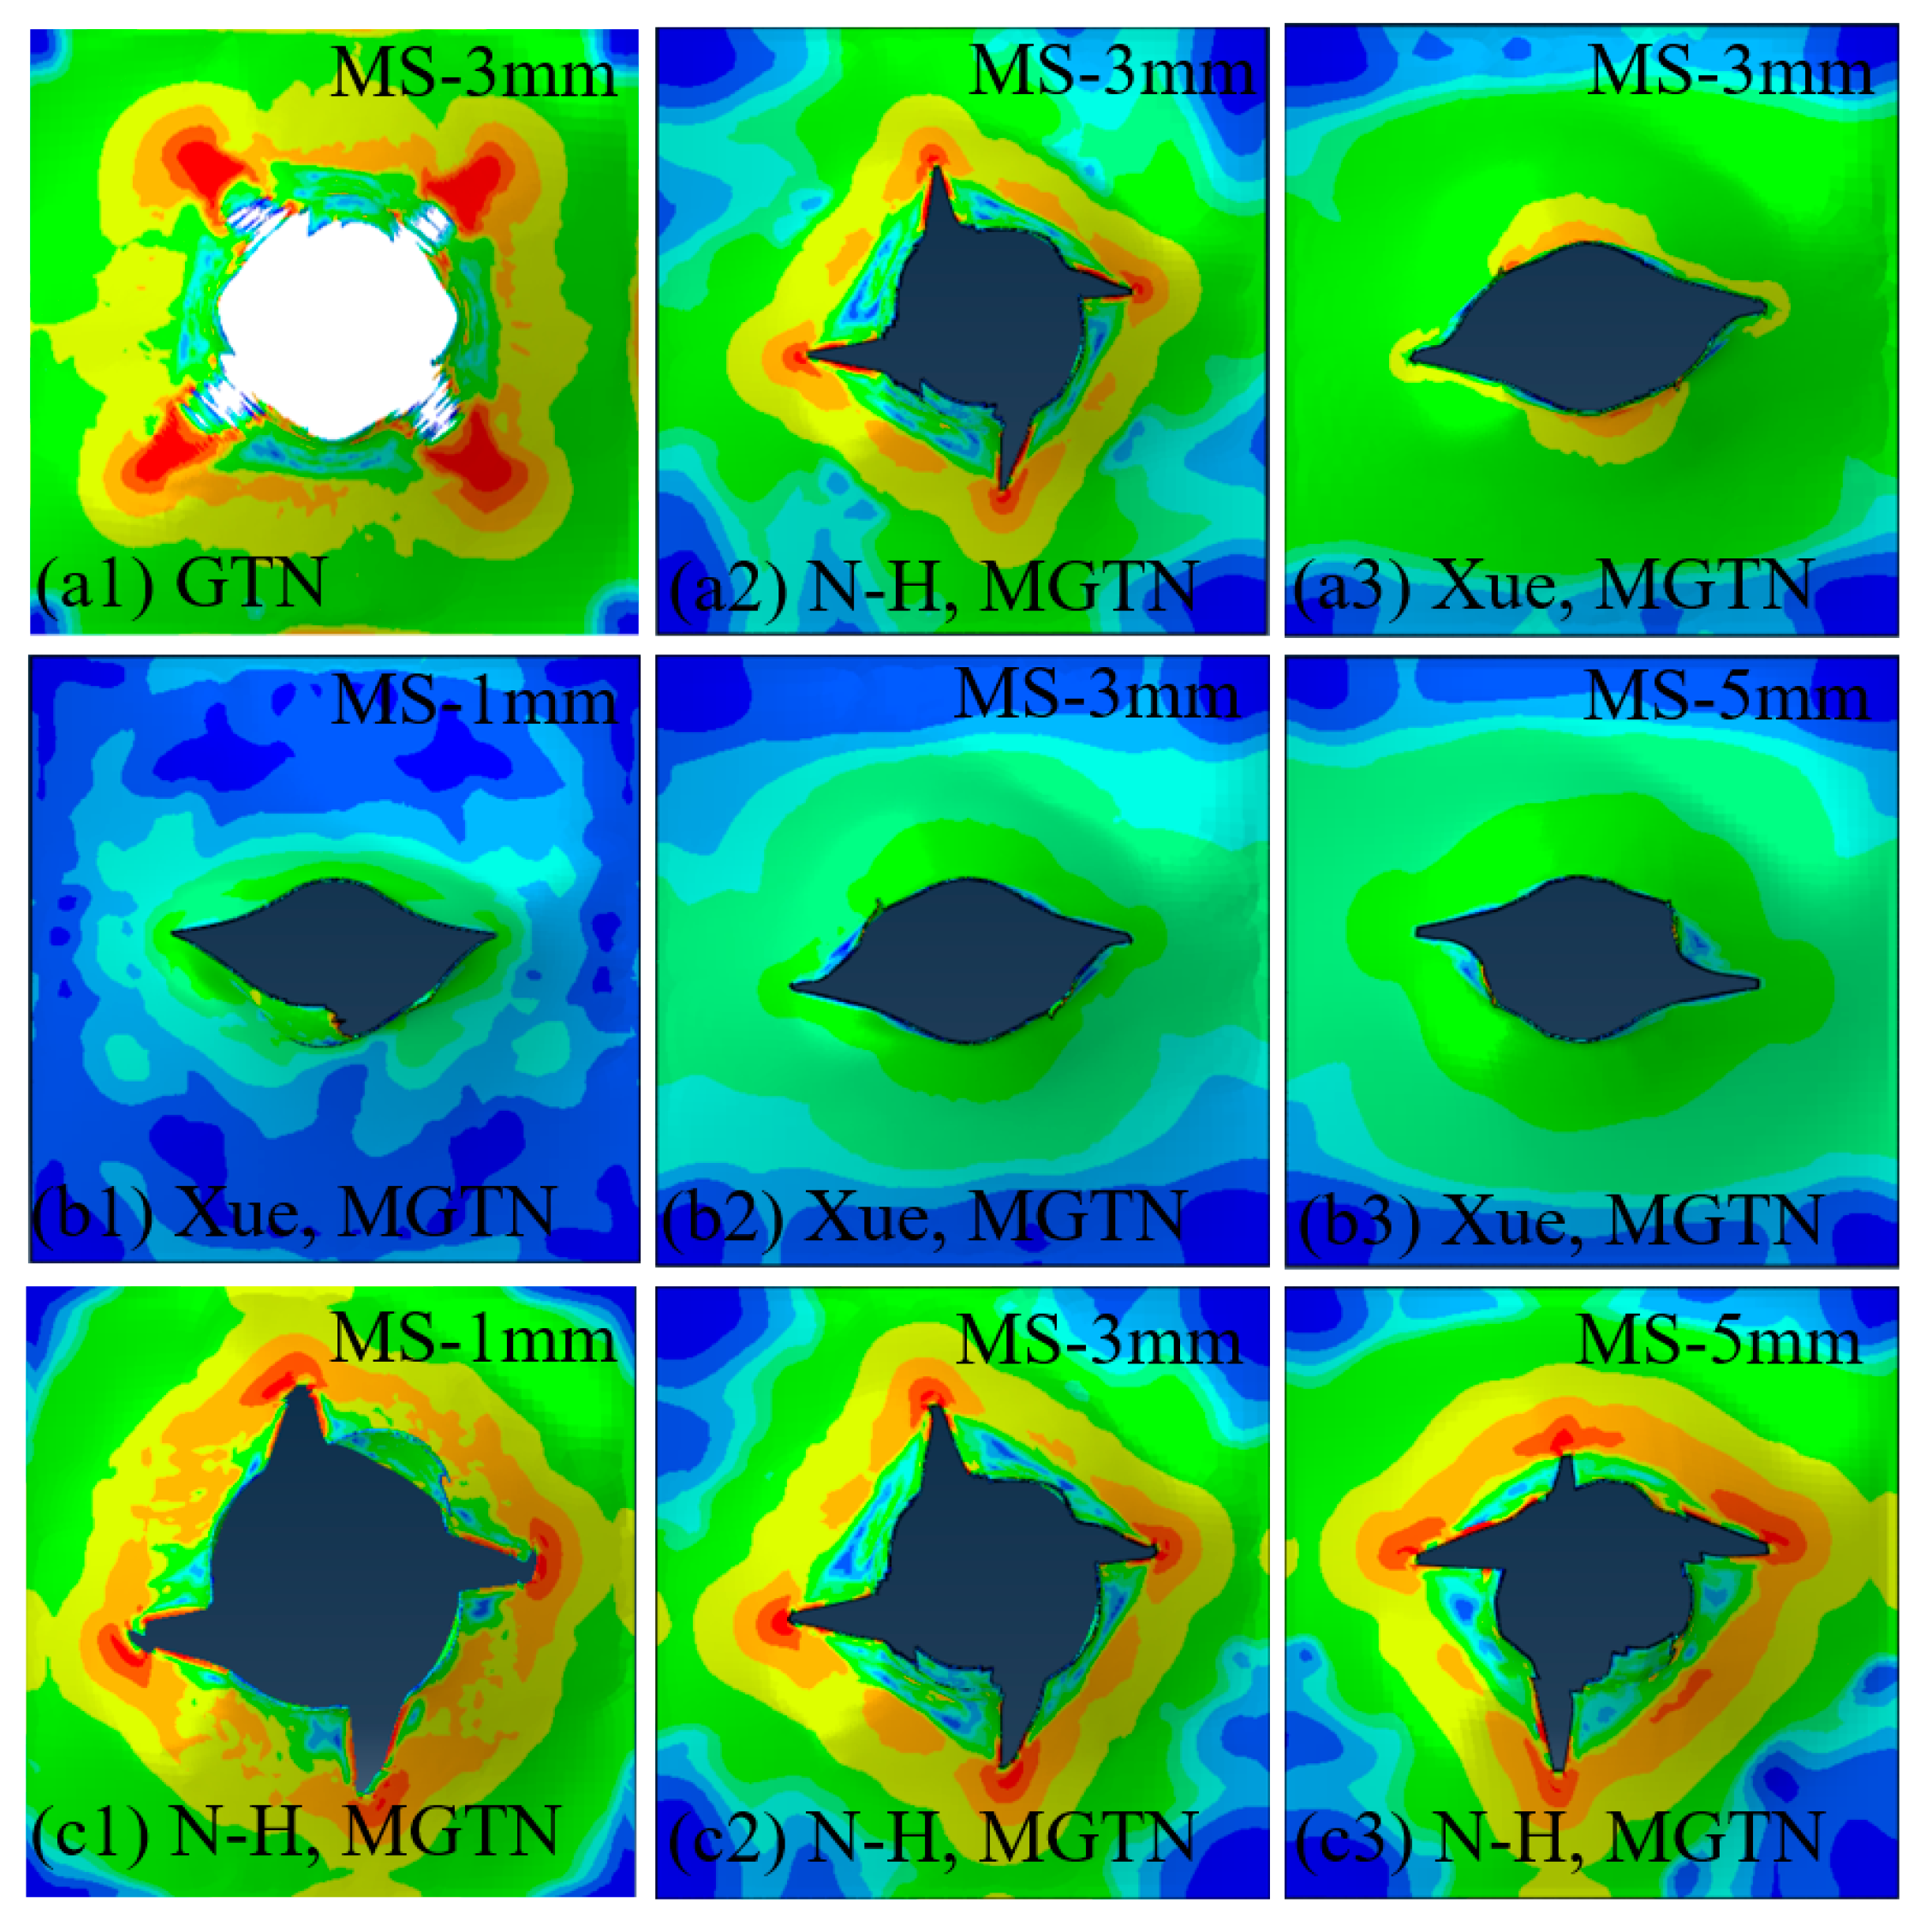
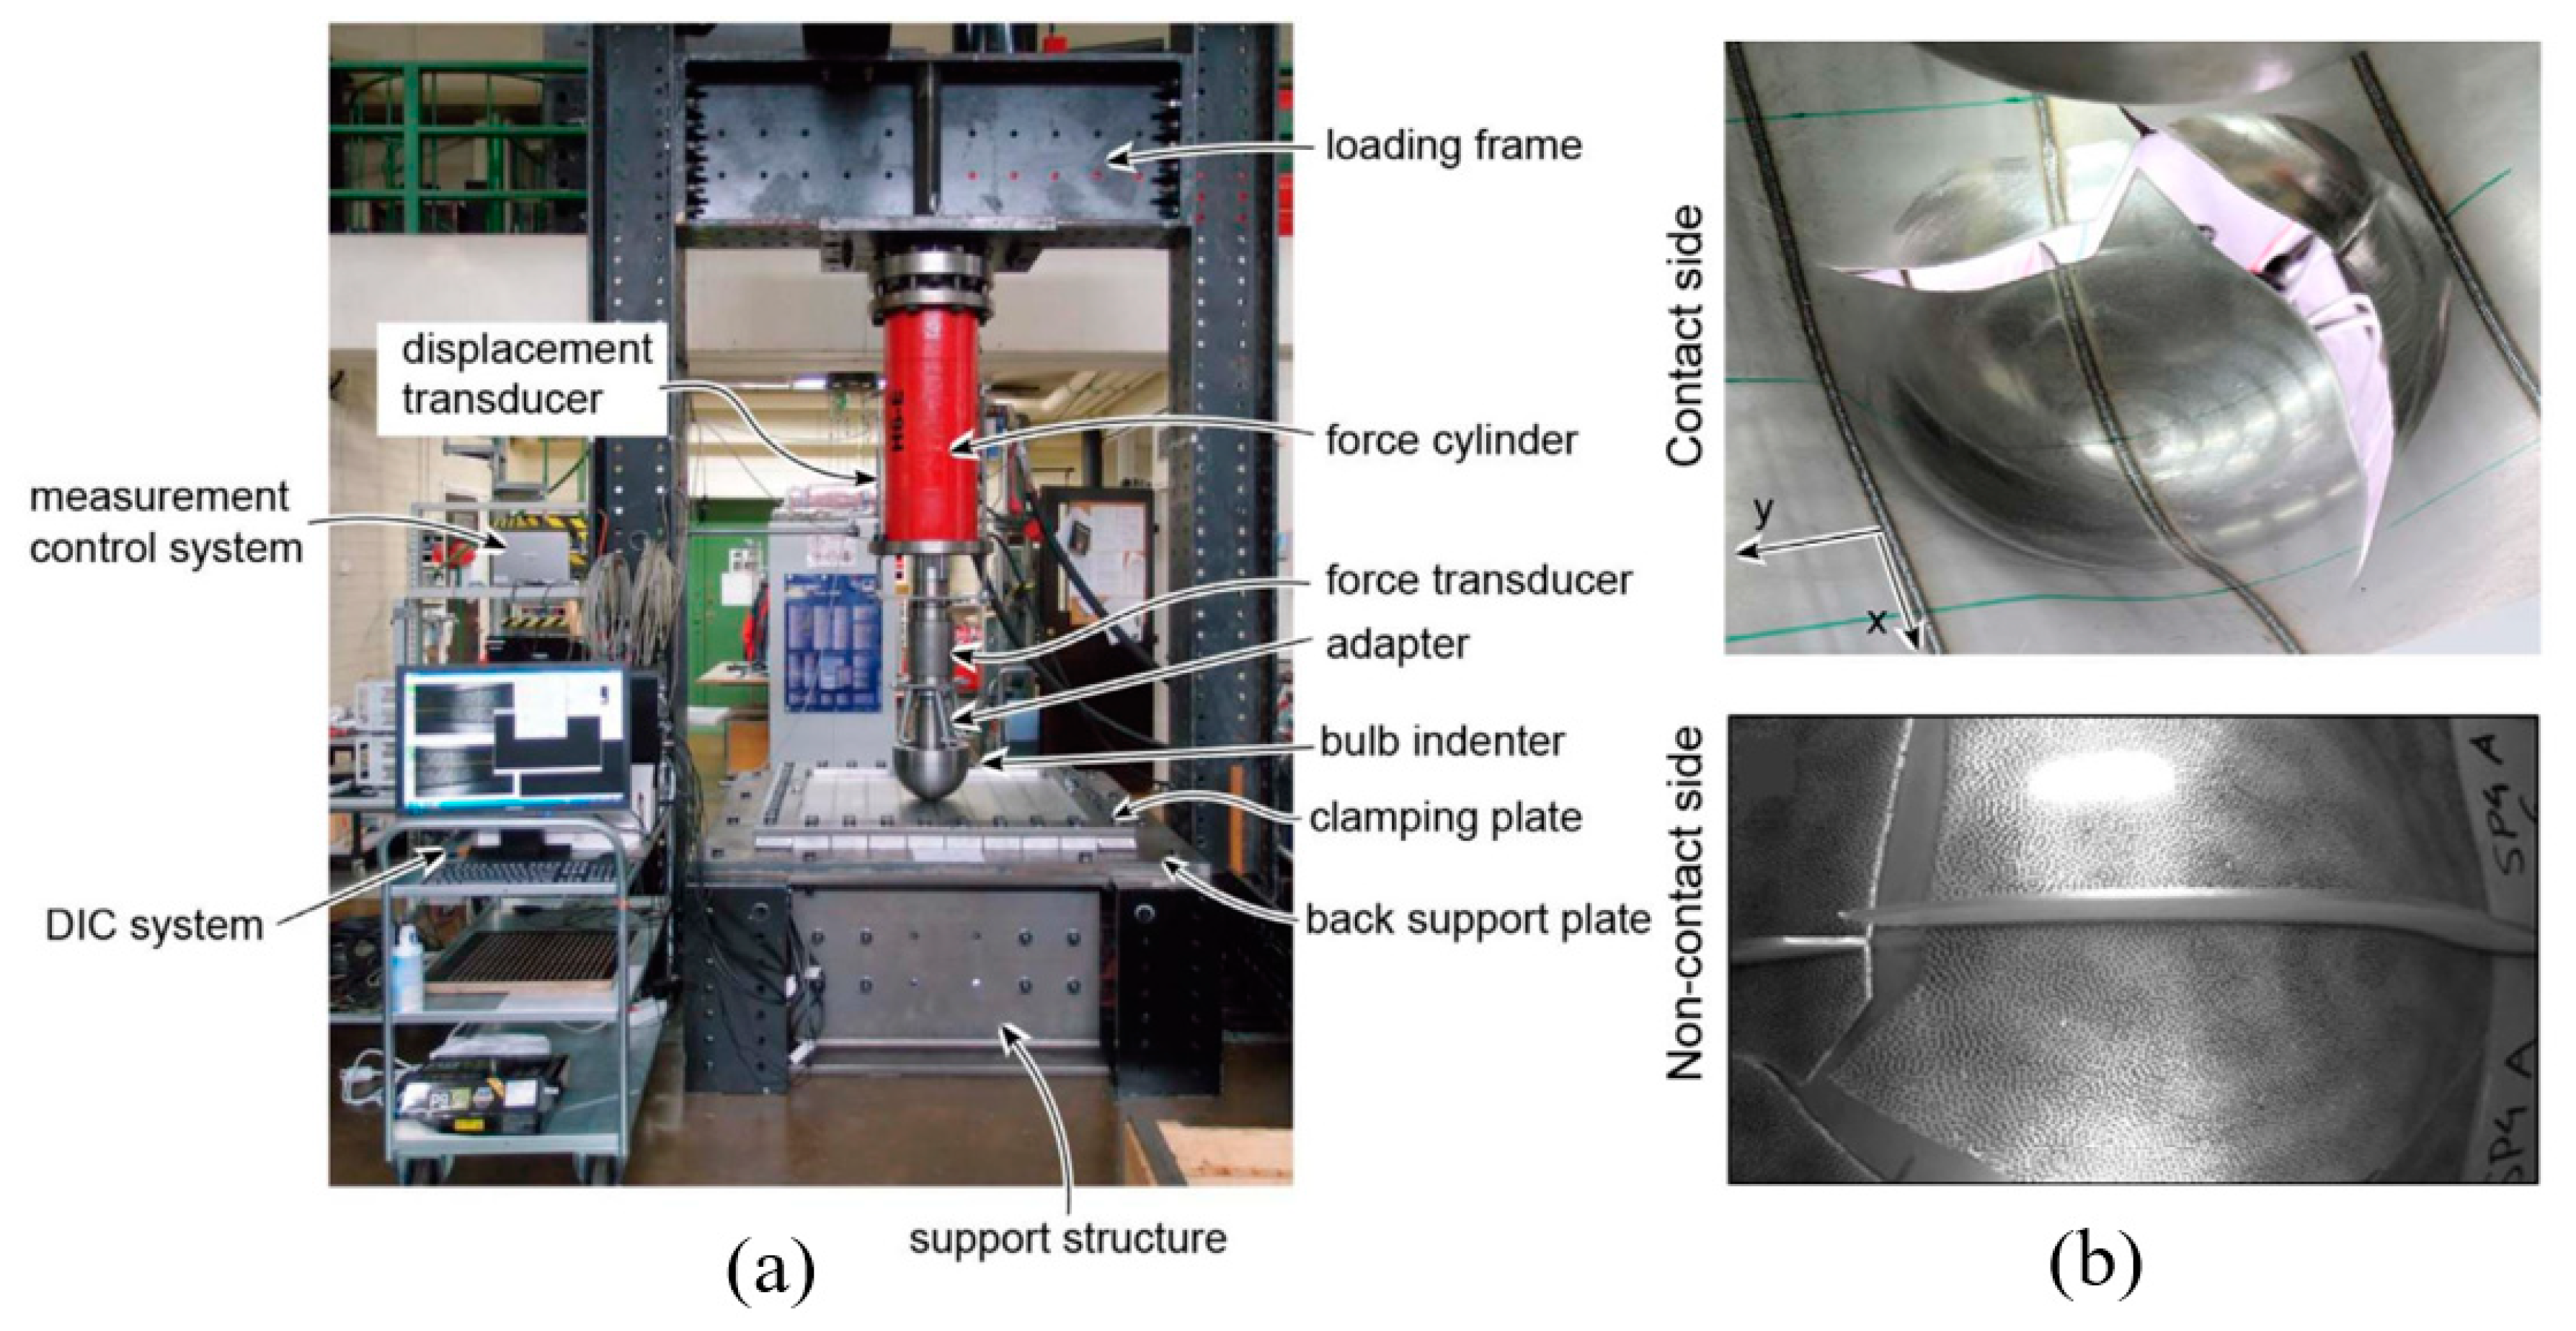
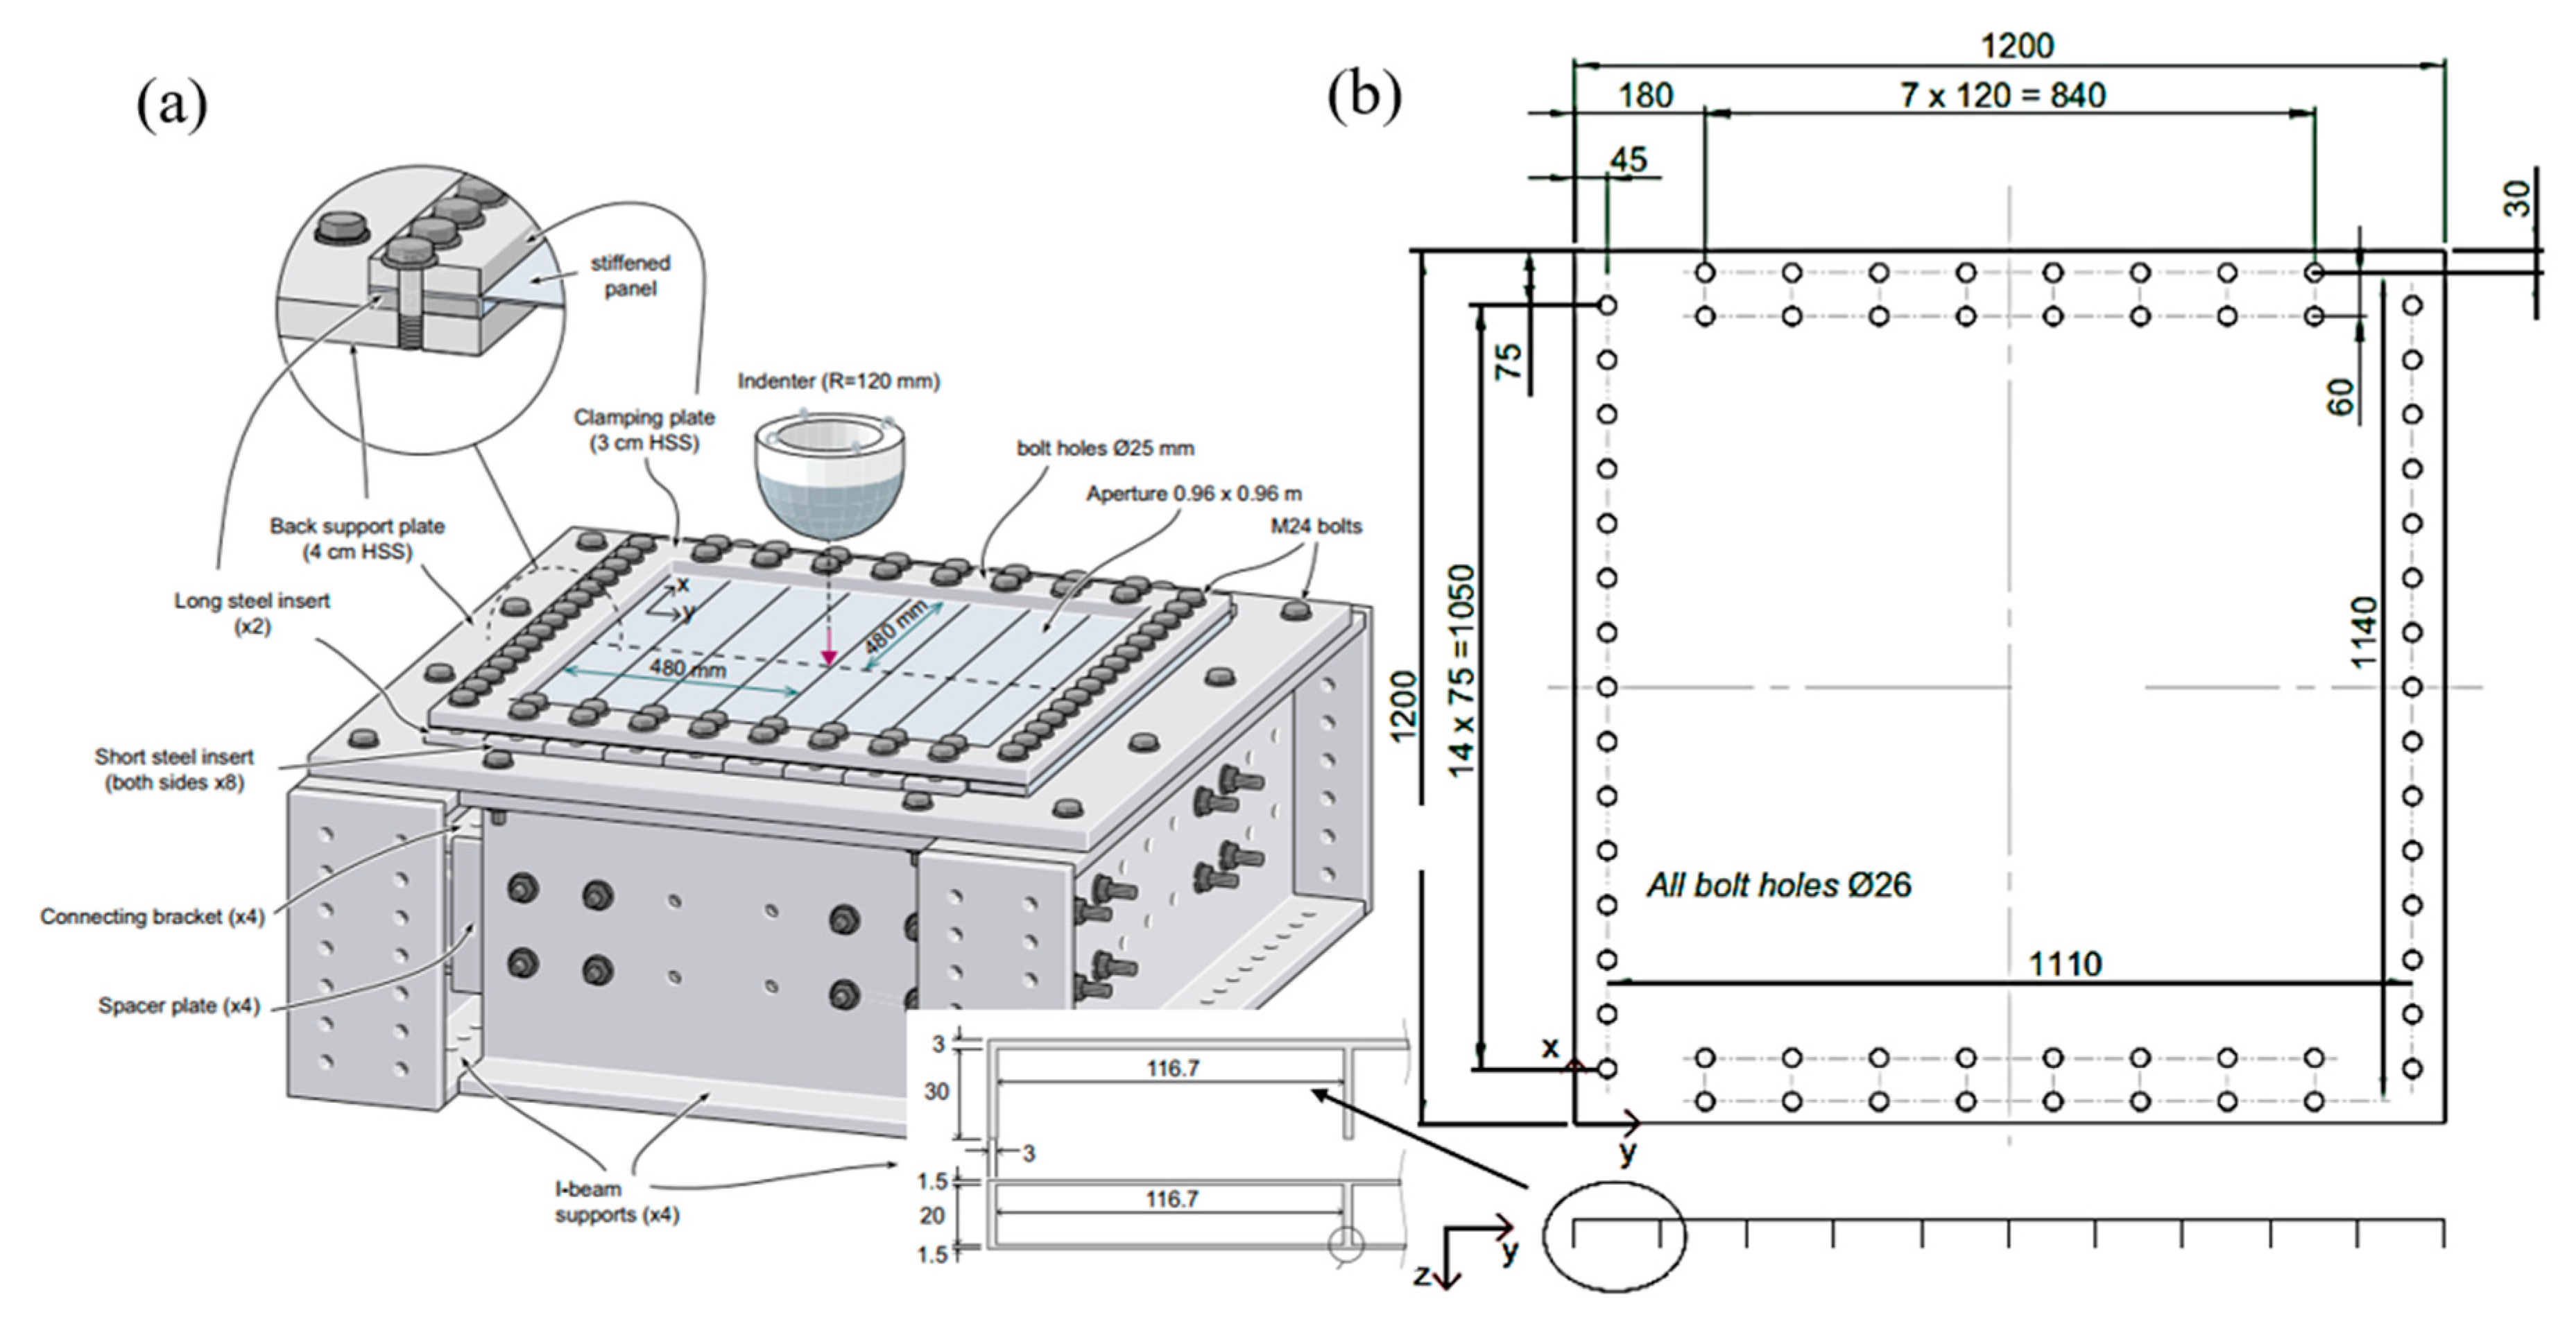
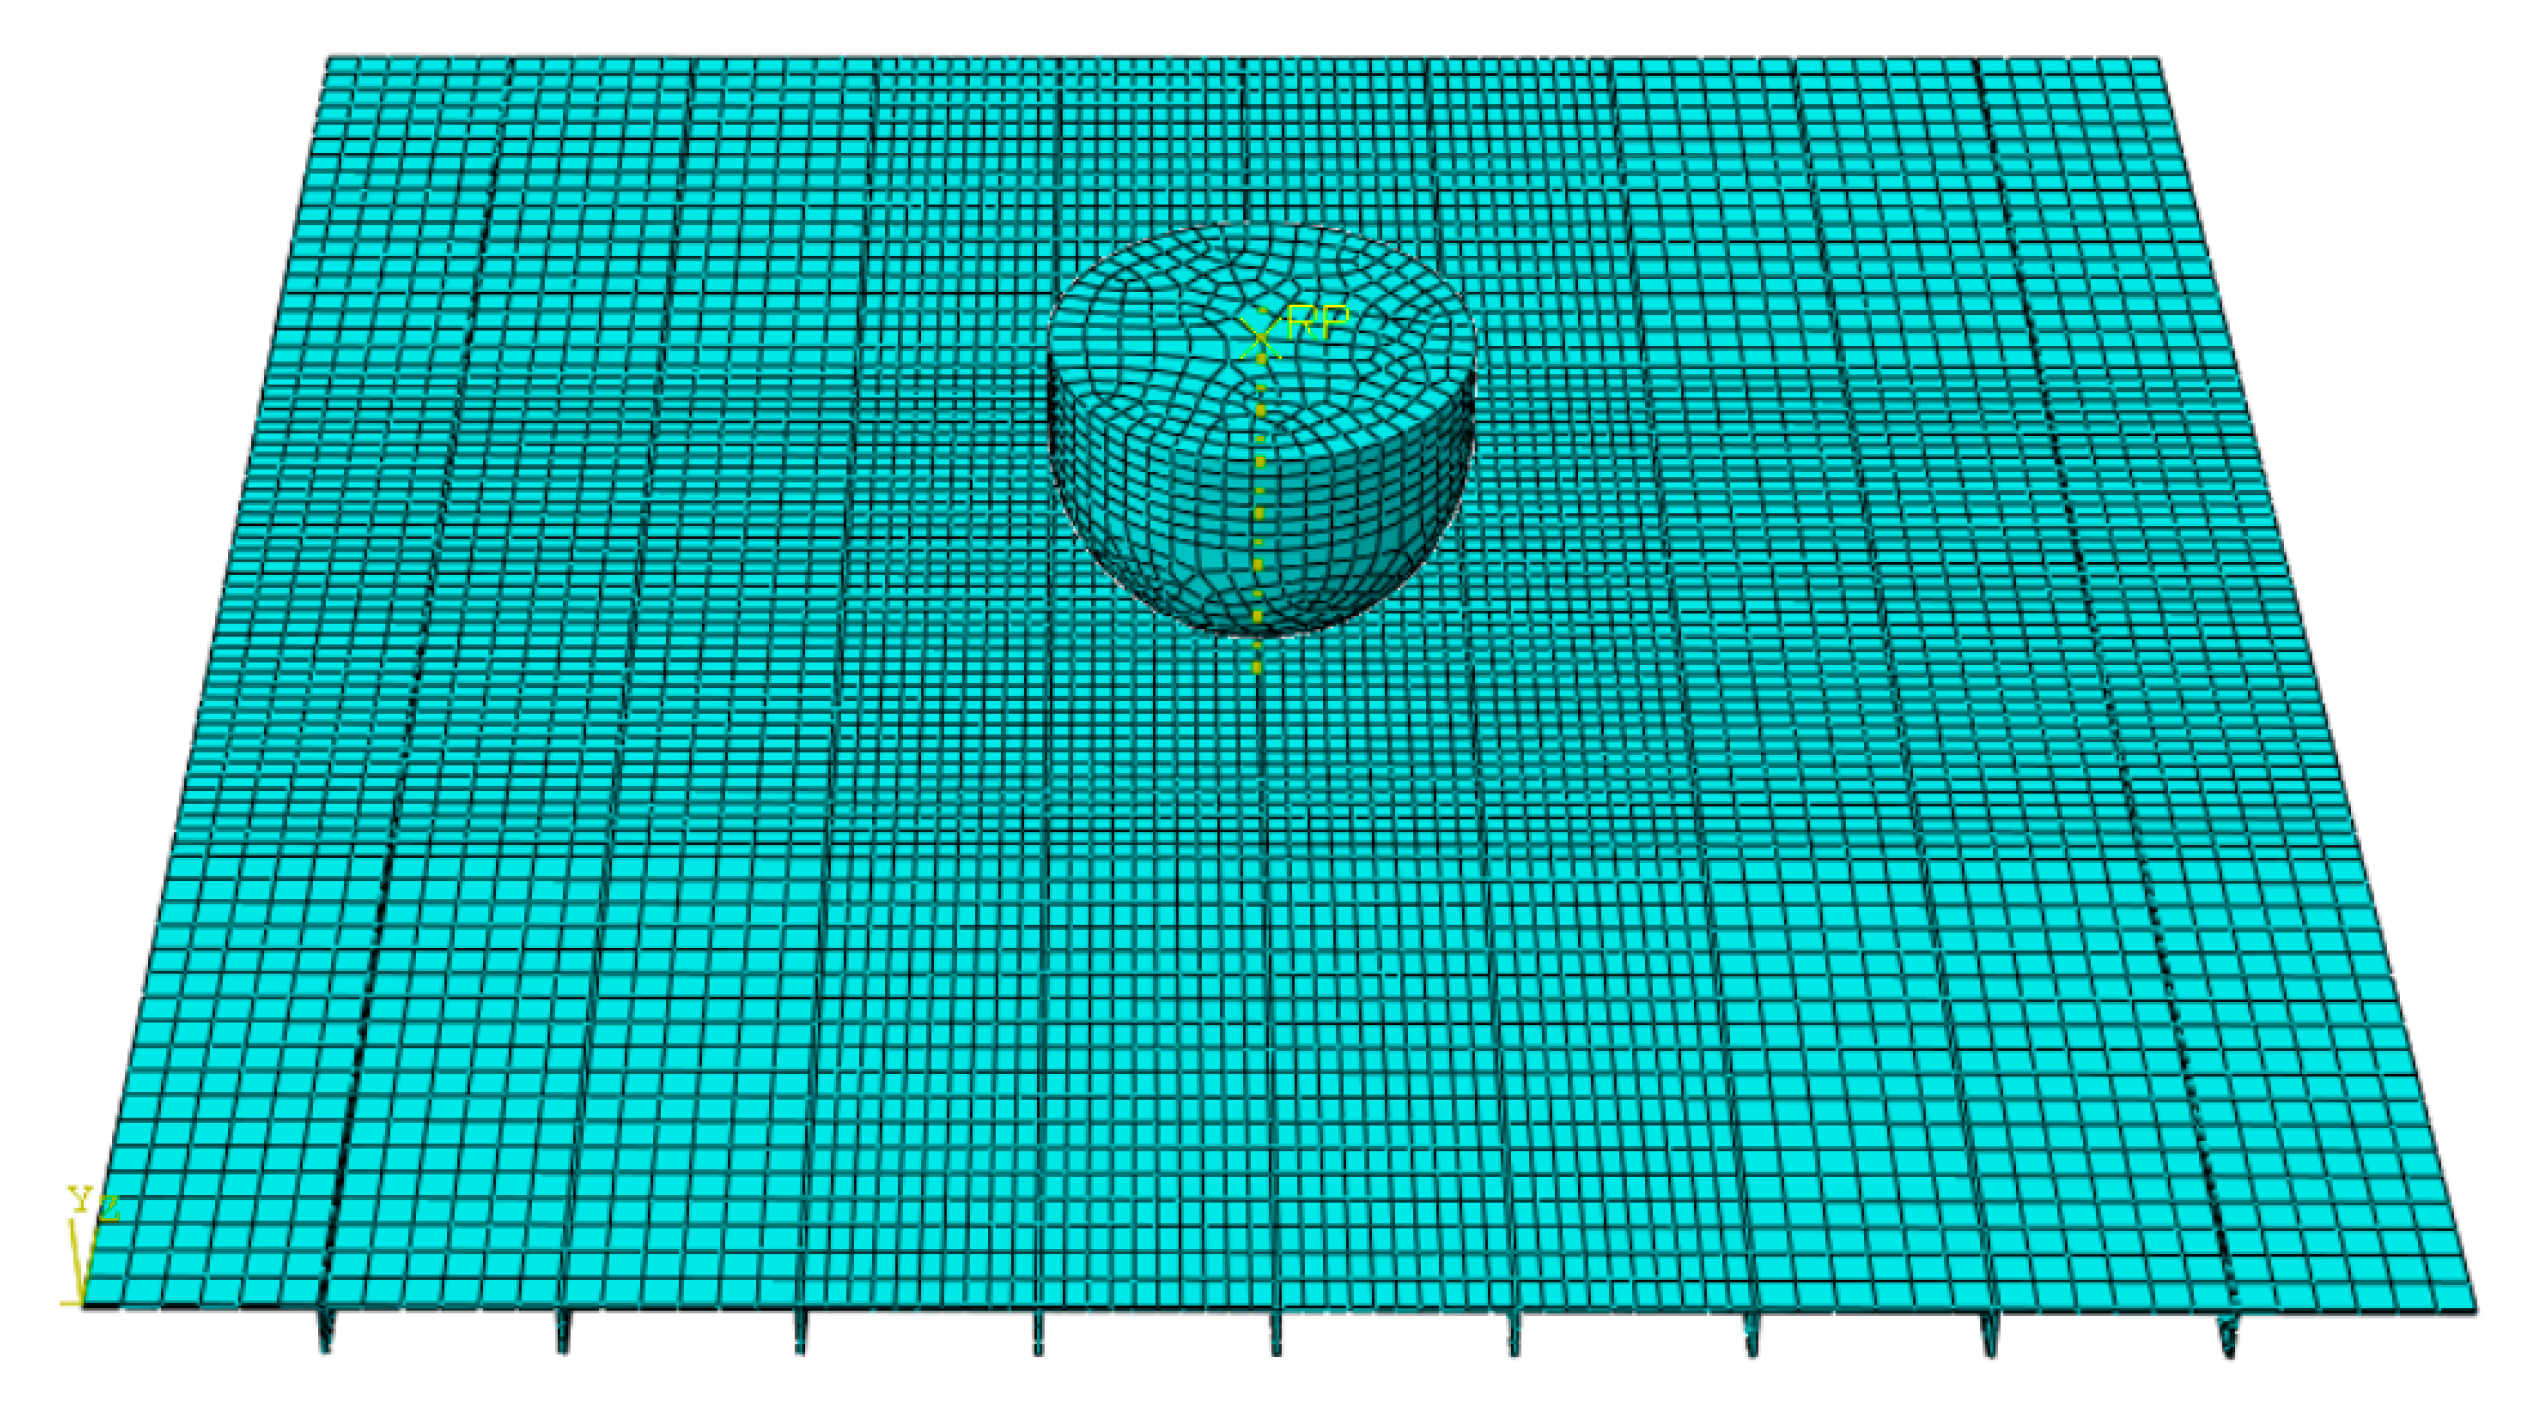
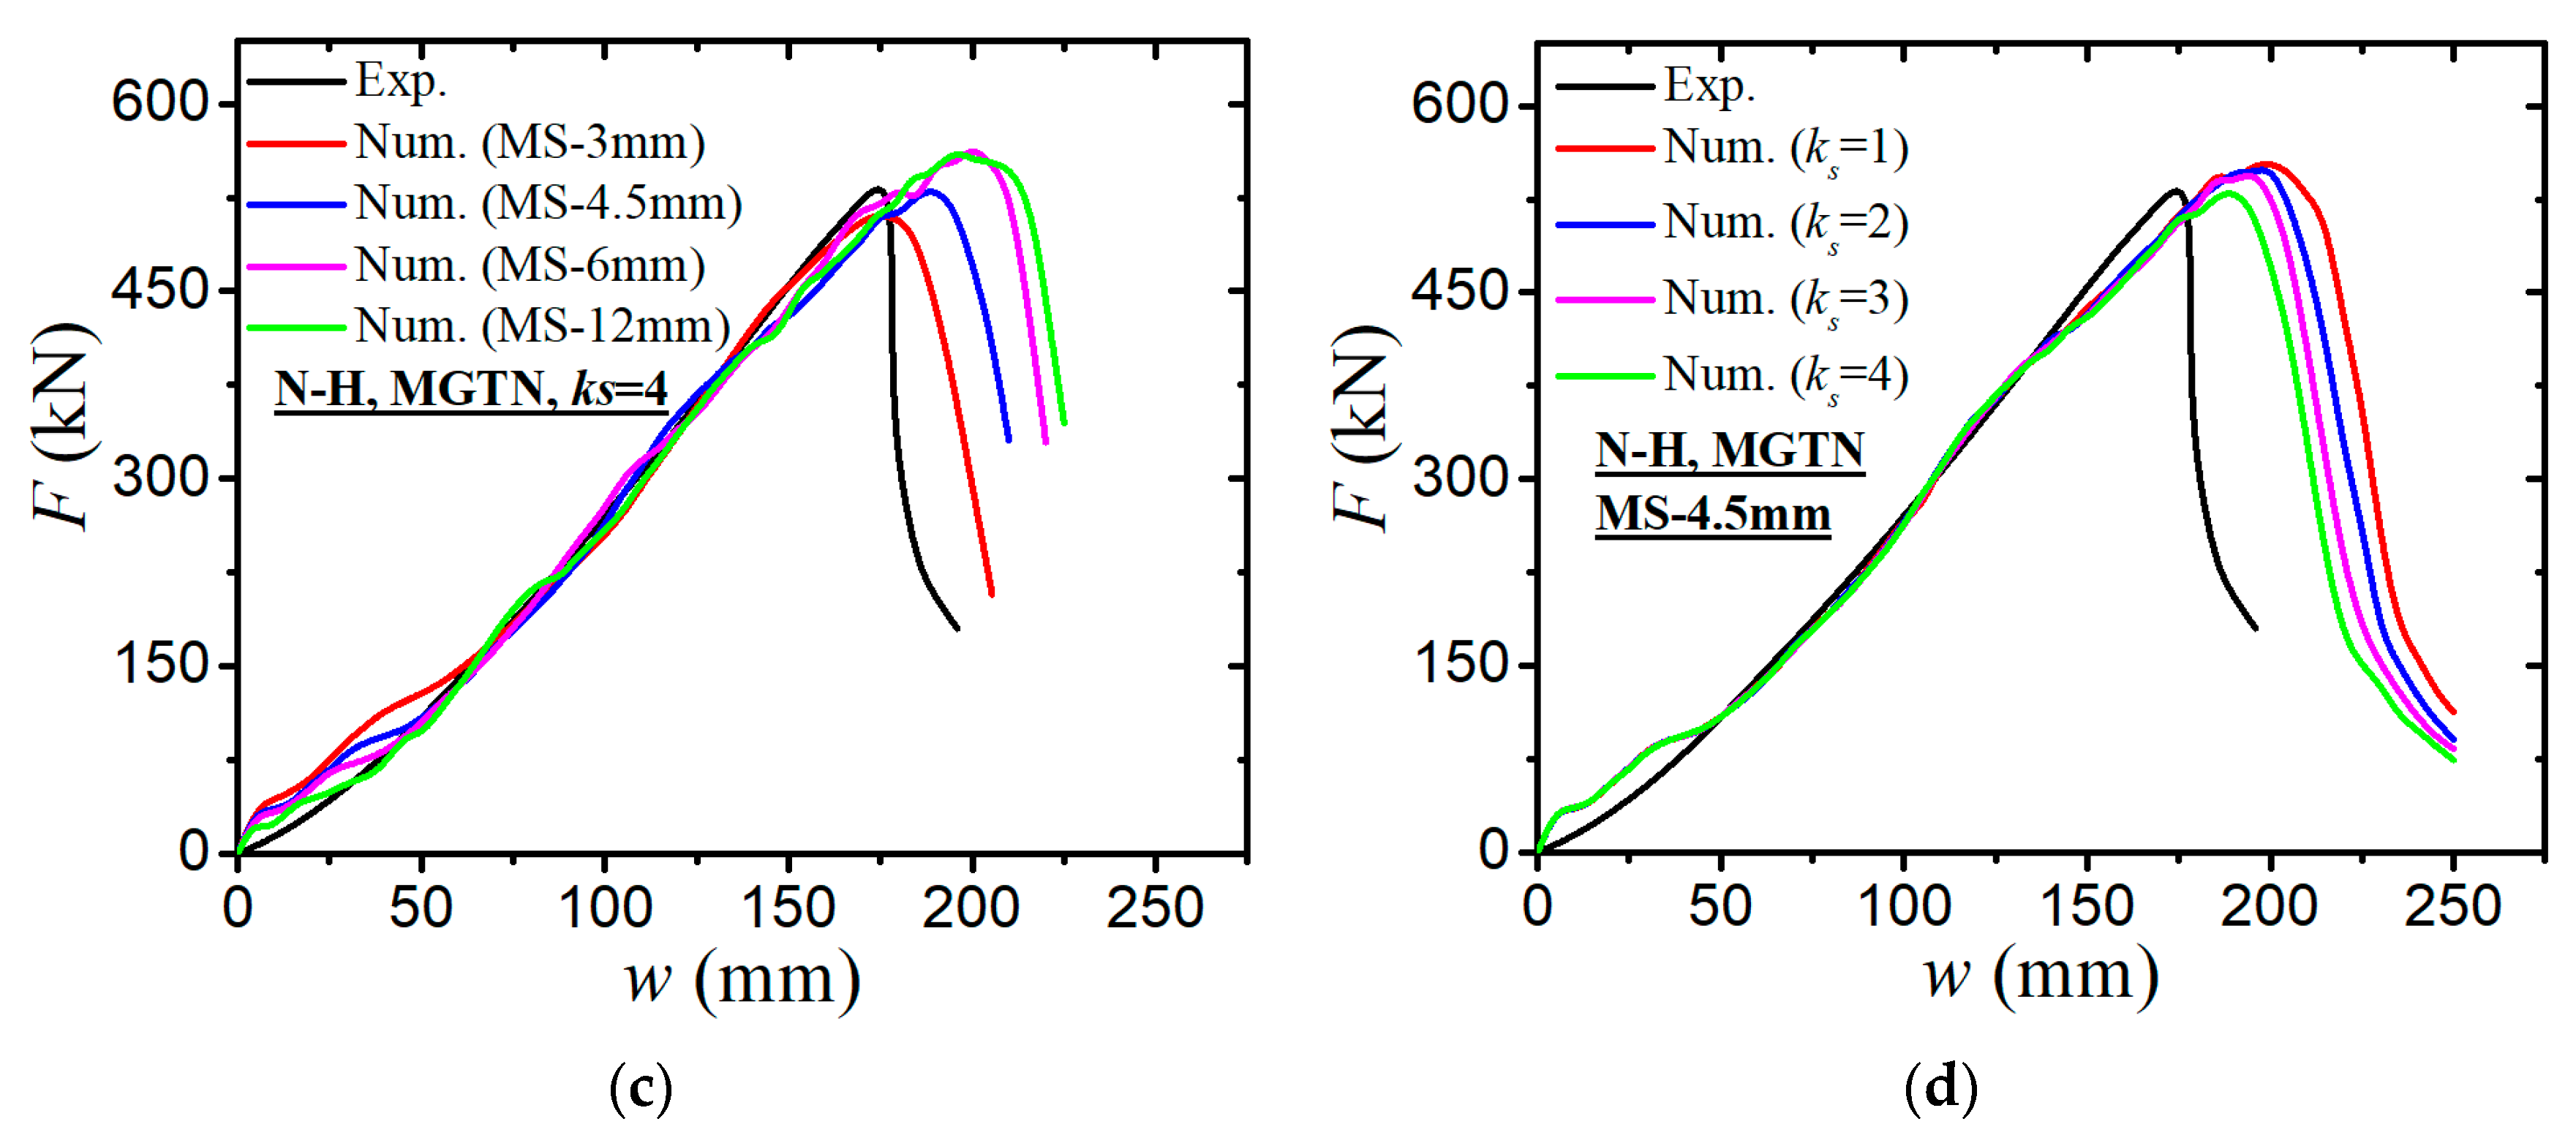
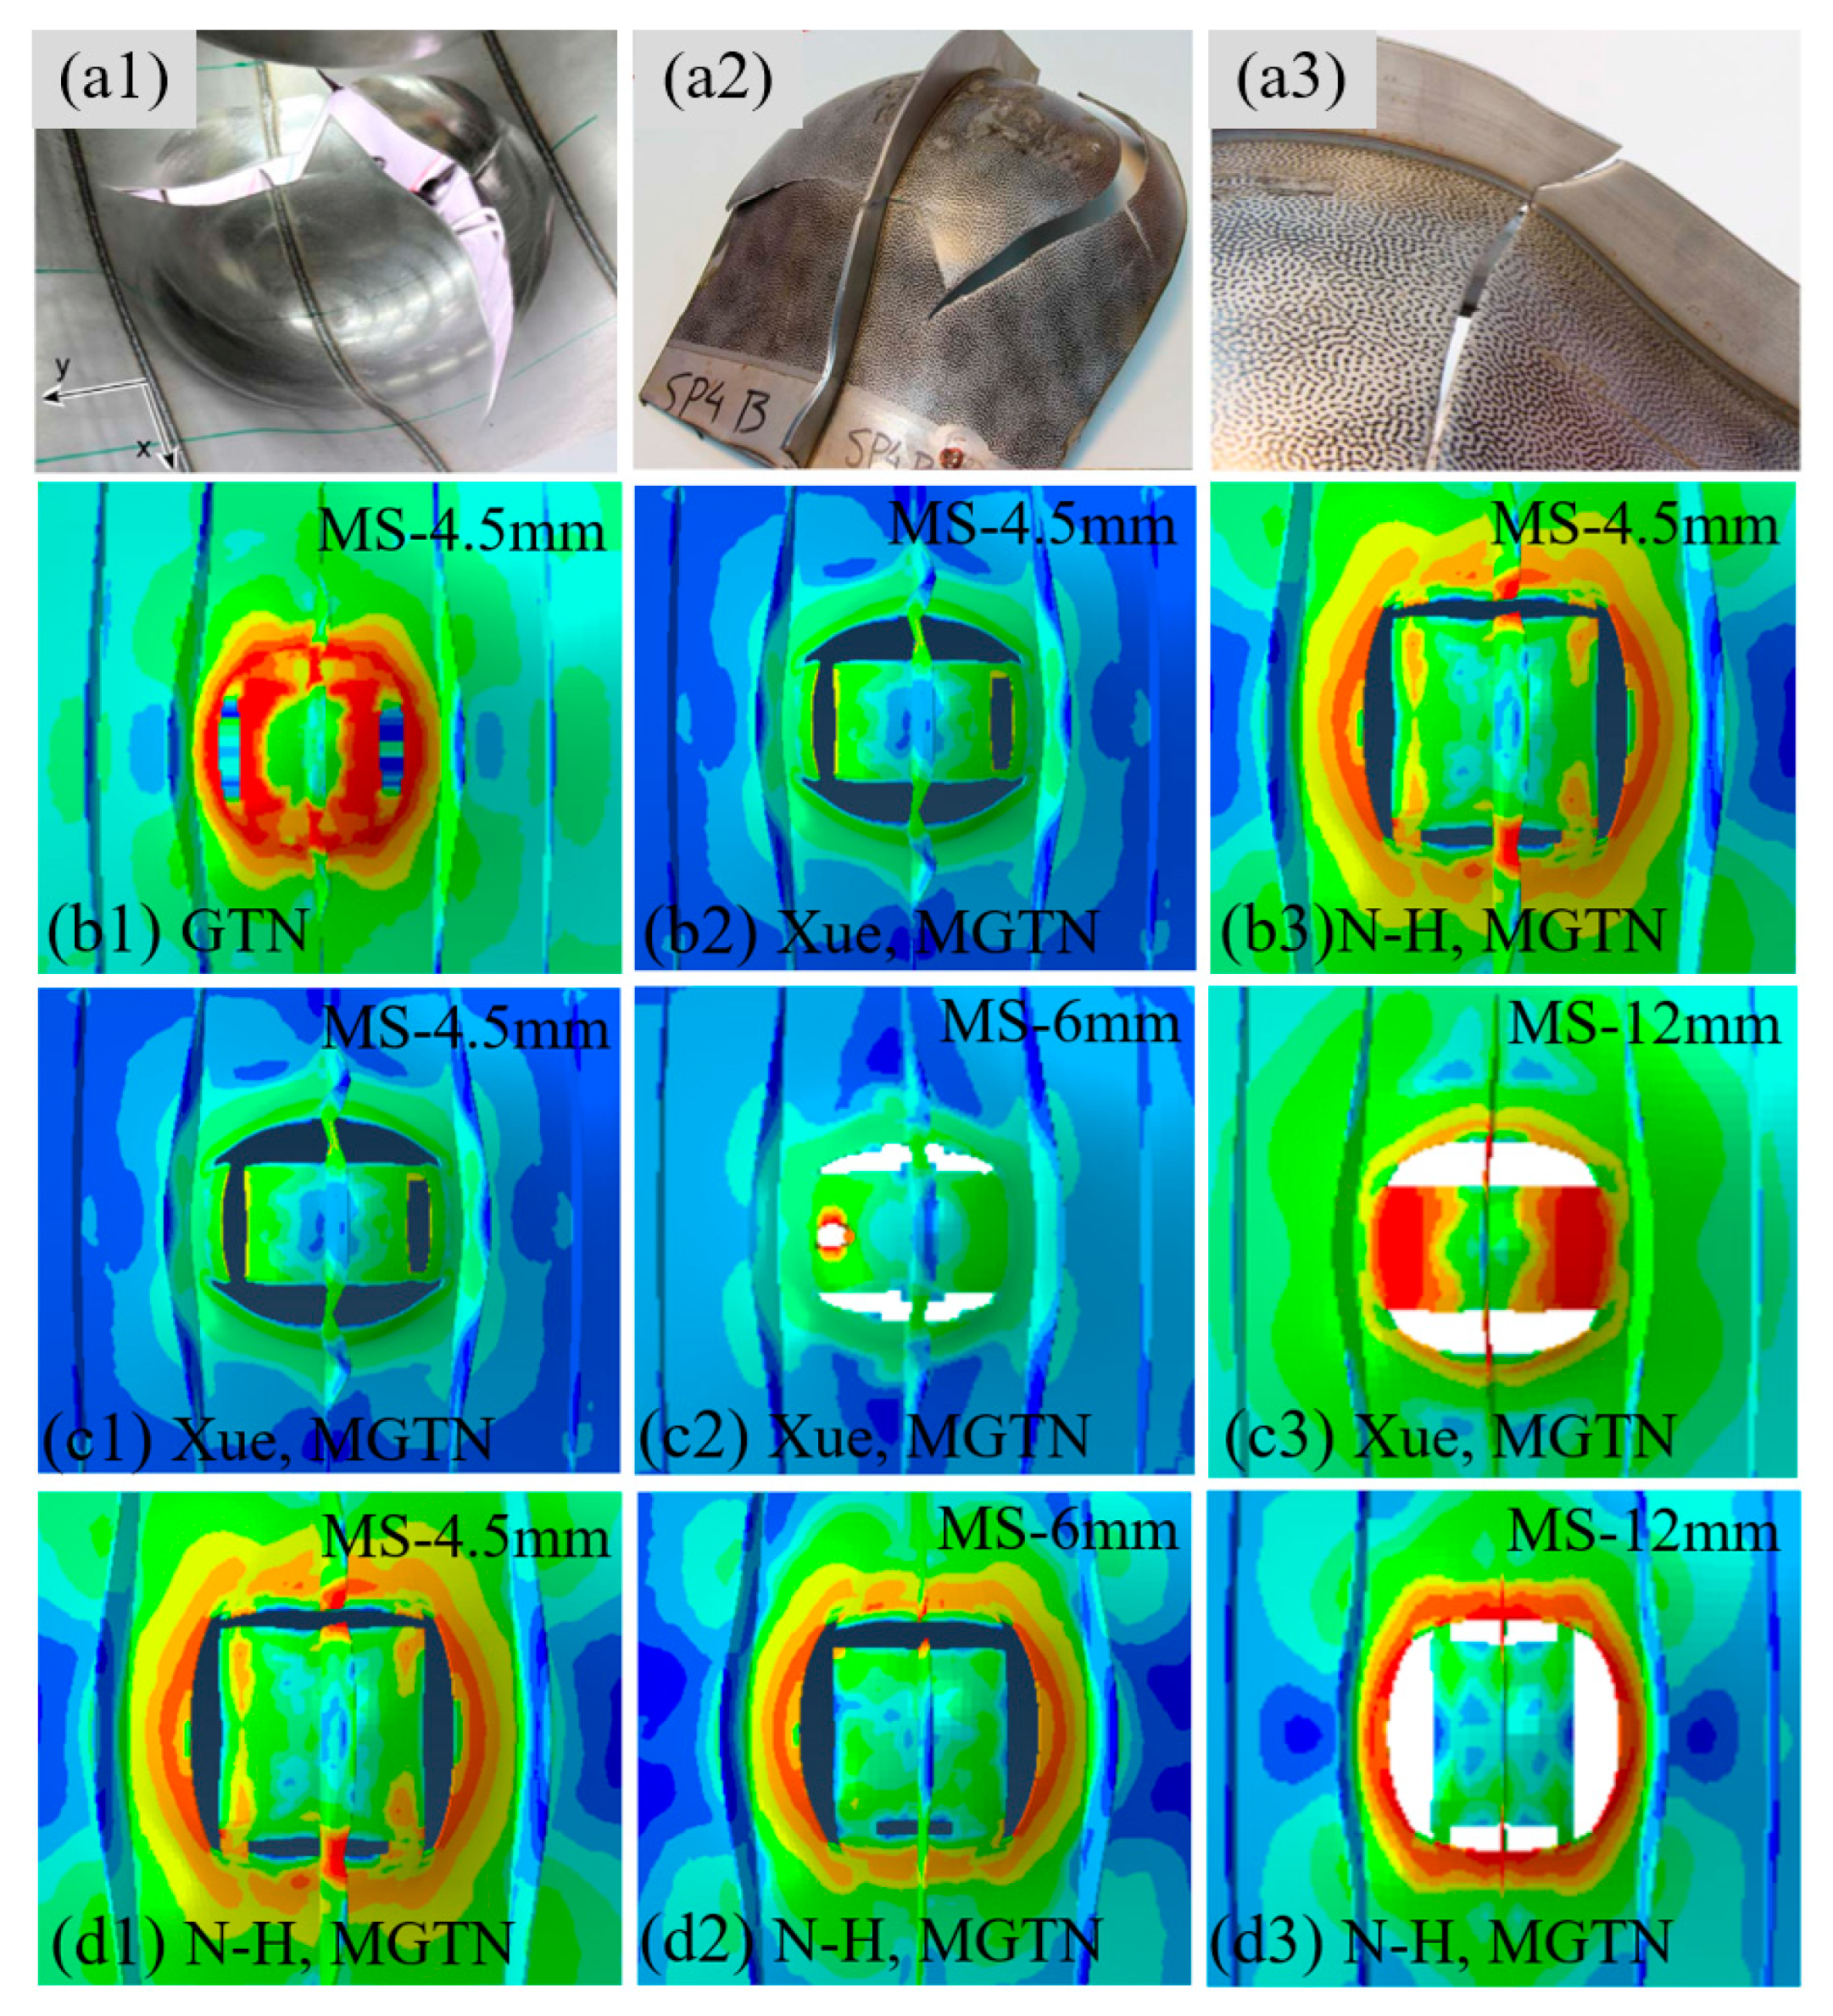
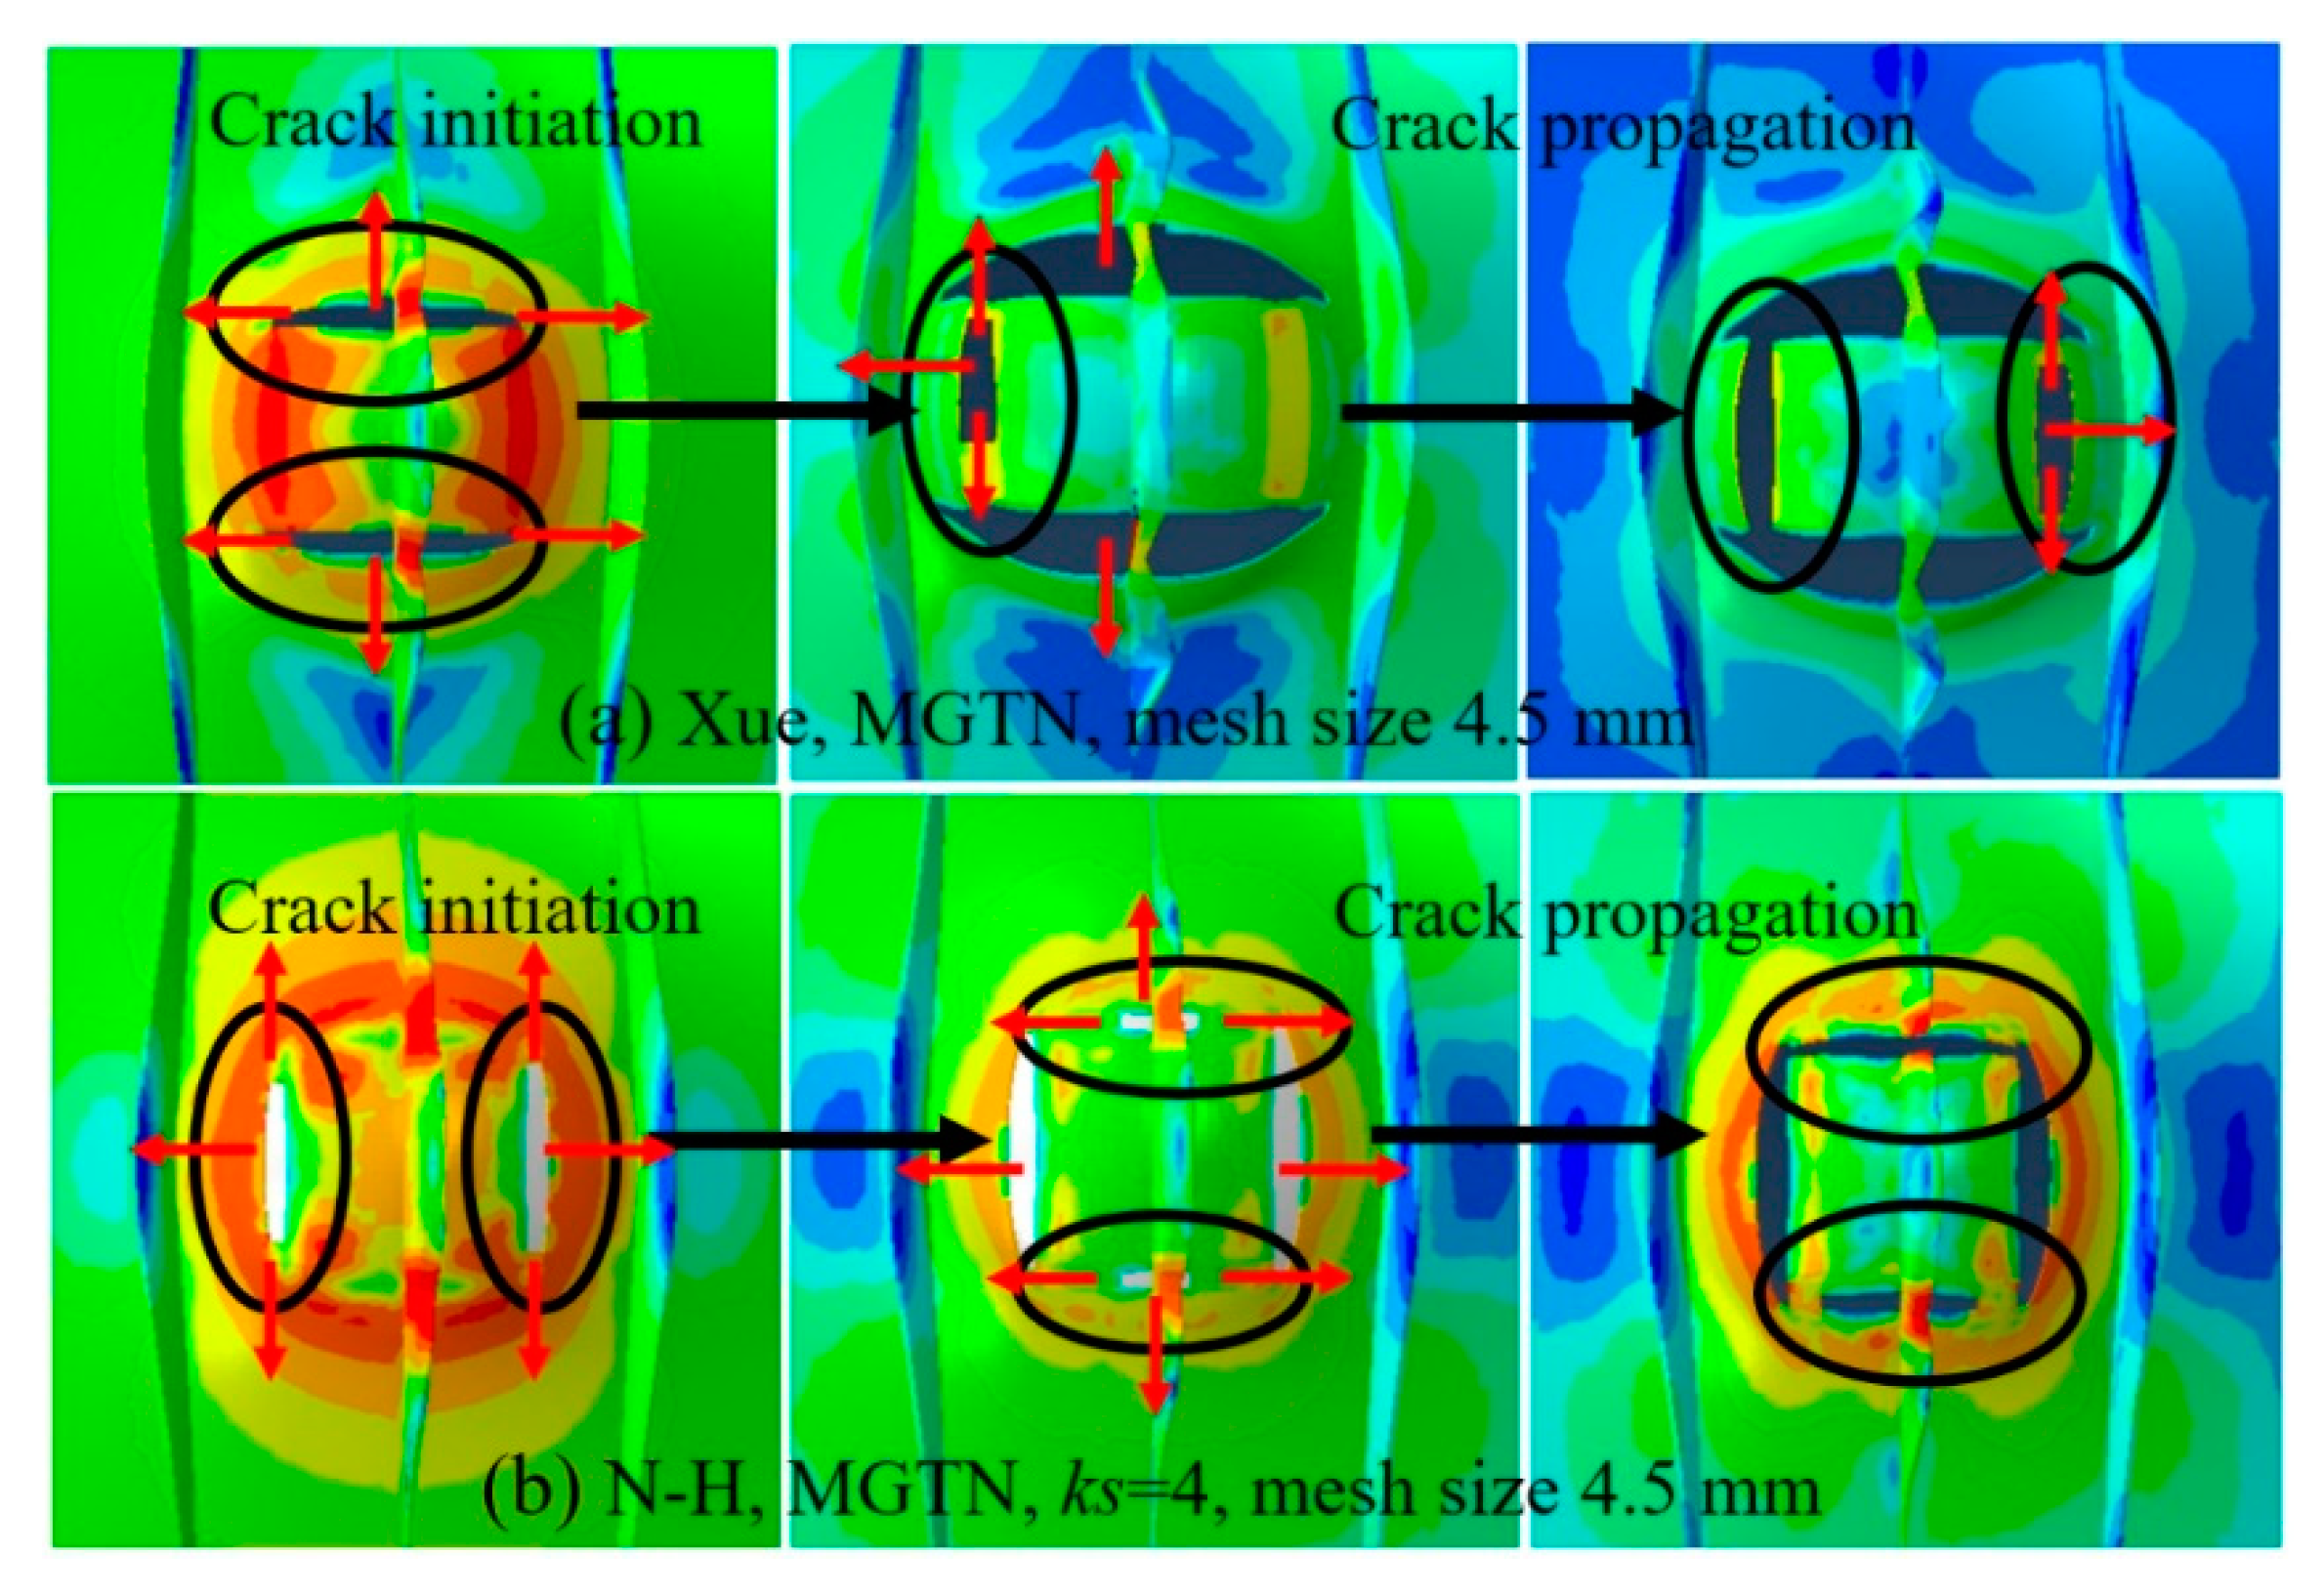
- The modified GTN model considering the shear effect with calibrated parameters is applied to simulate steel plate structures under quasi-static punch loading. The experimental results captured from non-stiffened plate and stiffened plate penetration tests are compared well with numerical results based on the N-H modified GTN models. The N-H modified model with ks = 4 provides much better prediction to the experimental observations compared with the original GTN model and Xue’s modified model. The results demonstrated that the evolution law for the shear failure of voids in the modified GTN model is very important for simulating the ductile fracture of structures under punch loading.
Author Contributions
Funding
Institutional Review Board Statement
Informed Consent Statement
Data Availability Statement
Conflicts of Interest
References
- Zhu, L.; James, P.; Zhang, S. Statistics and damage assessment of ship grounding. Mar. Struct. 2002, 15, 515–530. [Google Scholar] [CrossRef]
- Ehlers, S.; Broekhuijsen, J.; Alsos, H.S.; Biehl, F.; Tabri, K. Simulating the collision response of ship side structures: A failure criteria benchmark study. Int. Shipbuild. Prog. 2008, 55, 127–144. [Google Scholar]
- Simonsen, B.C.; Törnqvist, R. Experimental and numerical modelling of ductile crack propagation in large-scale shell structures. Mar. Struct. 2004, 17, 1–27. [Google Scholar] [CrossRef]
- Tornqvist, R. Design of Crashworthy Ship Structures. Ph.D. Thesis, Department of Naval Architecture and Offshore Engineering, Technical University of Denmark, Kongens Lyngby, Denmark, 2003. [Google Scholar]
- Gurson, A.L. Continuum theory of ductile rupture by void nucleation and growth: Part I-Yield criteria and flow rules for porous ductile media. J. Eng. Mater. Technol. 1977, 99, 2–15. [Google Scholar] [CrossRef]
- Tvergaard, V. Influence of voids on shear band instabilities under plane strain conditions. Int. J. Fract. 1981, 17, 389–407. [Google Scholar] [CrossRef]
- Tvergaard, V. On localization in ductile materials containing spherical voids. Int. J. Fract. 1982, 18, 237–252. [Google Scholar] [CrossRef]
- Tvergaard, V.; Needleman, A. Analysis of the cup-cone fracture in a round tensile bar. Acta Metall. 1984, 32, 157–169. [Google Scholar] [CrossRef]
- Alsos, H.S.; Hopperstad, O.S.; Tornqvist, R.; Amdahl, J. Analytical and numerical analysis of local necking using a stress based instability criterion. Int. J. Solids Struct. 2008, 45, 42–55. [Google Scholar] [CrossRef]
- Zhu, L.; Atkins, A.G. Failure Criteria for Ship Collision and Grounding. In Proceedings of the 7th International Symposium on Practical Design of Ship and Mobile Units, Hague, The Netherlands, 28 September 1998; pp. 141–147. [Google Scholar]
- Stoughton, T.B. A general forming limit criterion for sheet metal forming. Int. J. Mech. Sci. 2000, 42, 1–27. [Google Scholar] [CrossRef]
- Alsos, H.S.; Amdahl, J.; Hopperstad, O.S. On the resistance to penetration of stiffened plates, Part II: Numerical analysis. Int. J. Impact Eng. 2009, 36, 875–887. [Google Scholar] [CrossRef]
- Faleskog, J.; Gao, X.; Shih, C.F. Cell model for nonlinear fracture analysis–I. Micromechanics calibration. Int. J. Fract. 1998, 89, 355–373. [Google Scholar] [CrossRef]
- Kim, J.; Gao, X.; Srivatsan, T.S. Modeling of void growth in ductile solids: Effects of stress triaxiality and initial porosity. Eng. Fract. Mech. 2004, 71, 379–400. [Google Scholar] [CrossRef]
- Qian, X.; Choo, Y.S.; Liew, J.Y.; Wardenier, J. Simulation of ductile fracture of circular hollow section joints using the Gurson model. J. Struct. Eng. 2005, 131, 768–780. [Google Scholar] [CrossRef]
- Qian, X. An out-of-plane length scale for ductile crack extensions in 3-D SSY models for X65 pipeline materials. Int. J. Fract. 2011, 167, 249–265. [Google Scholar] [CrossRef]
- Gholipour, H.; Biglari, F.R.; Nikbin, K. Experimental and numerical investigation of ductile fracture using GTN damage model on in-situ tensile tests. Int. J. Mech. Sci. 2019, 164, 105170. [Google Scholar] [CrossRef]
- Yan, R.; Xin, H.; Veljkovic, M. Ductile fracture simulation of cold-formed high strength steel using GTN damage model. J. Constr. Steel Res. 2021, 184, 106832. [Google Scholar] [CrossRef]
- McClintock, F.A.; Kaplan, S.M.; Berg, C.A. Ductile fracture by hole growth in shear bands. Int. J. Fract. Mech. 1966, 2, 614–627. [Google Scholar] [CrossRef]
- Xue, L. Constitutive modeling of void shearing effect in ductile fracture of porous materials. Eng. Fract. Mech. 2008, 75, 3343–3366. [Google Scholar] [CrossRef]
- Xue, L. Ductile Fracture Modelling-Theory, Experimental Investigation and Numerical Verification. Ph.D. Thesis, Massachusetts Institute of Technology, Cambridge, MA, USA, 2007. [Google Scholar]
- Nahshon, K.; Hutchinson, J.W. Modification of the Gurson model for shear failure. Eur. J. Mech. A Solids 2008, 27, 1–17. [Google Scholar] [CrossRef]
- Butcher, C.; Chen, Z.; Bardelcik, A.; Worswick, M. Damage-based finite-element modeling of tube hydroforming. Int. J. Fract. 2009, 155, 55–65. [Google Scholar] [CrossRef]
- Zhou, J.; Gao, X.; Sobotka, J.C.; Webler, B.A.; Cockeram, B.V. On the extension of the Gurson-type porous plasticity models for prediction of ductile fracture under shear-dominated conditions. Int. J. Solids Struct. 2014, 51, 3273–3291. [Google Scholar] [CrossRef]
- Malcher, L.; Reis, F.J.P.; Pires, F.M.A.; de Sá, J.C. Evaluation of shear mechanisms and influence of the calibration point on the numerical results of the GTN model. Int. J. Mech. Sci. 2013, 75, 407–422. [Google Scholar] [CrossRef]
- Li, W.T.; Cai, Z.Y.; Li, H.; Peng, L.F.; Lai, X.M.; Fu, M.W. The modified GTN-Thomason criterion for modelling of ductile fracture considering shear factor and size effect in micro-scaled plastic deformation. Int. J. Mech. Sci. 2021, 204, 106540. [Google Scholar] [CrossRef]
- He, Z.; Zhu, H.; Hu, Y. An improved shear modified GTN model for ductile fracture of aluminium alloys under different stress states and its parameters identification. Int. J. Mech. Sci. 2021, 192, 106081. [Google Scholar] [CrossRef]
- Zhang, M.; Liu, J.; Hu, Z.; Zhao, Y. Experimental and numerical investigation of the responses of scaled tanker side double-hull structures laterally punched by conical and knife edge indenters. Mar. Struct. 2018, 61, 62–84. [Google Scholar] [CrossRef]
- Koplik, J.; Needleman, A. Void growth and coalescence in porous plastic solids. Int. J. Solids Struct. 1988, 24, 835–853. [Google Scholar] [CrossRef]
- Tho, N.C.; Cong, P.H.; Zenkour, A.M.; Doan, D.H.; Van Minh, P. Finite element modeling of the bending and vibration behavior of three-layer composite plates with a crack in the core layer. Compos. Struct. 2023, 305, 116529. [Google Scholar]
- Duc, D.H.; Van Minh, P.; Tung, N.S. Finite element modelling for free vibration response of cracked stiffened FGM plates. Vietnam. J. Sci. Technol. 2020, 58, 119–129. [Google Scholar]
- Kõrgesaar, M.; Romanoff, J.; Remes, H.; Palokangas, P. Experimental and numerical penetration response of laser-welded stiffened panels. Int. J. Impact Eng. 2018, 114, 78–92. [Google Scholar] [CrossRef]
- Zhang, M.; Sun, Q.; Liu, J.; Hu, Z.; Zhang, S. A study of the rupture behavior of a ship side plate laterally punched by a full-shape bulbous bow indenter. Ocean Eng. 2019, 182, 48–60. [Google Scholar] [CrossRef]
- Skallerud, B.; Zhang, Z.L. A 3D numerical study of ductile tearing and fatigue crack growth under nominal cyclic plasticity. Int. J. Solids Struct. 1997, 34, 3141–3161. [Google Scholar] [CrossRef]
- Hambli, R. Comparison between Lemaitre and Gurson damage models in crack growth simulation during blanking process. Int. J. Mech. Sci. 2001, 43, 2769–2790. [Google Scholar] [CrossRef]
- Rachik, M.; Roelandt, J.M.; Maillard, A. Some phenomenological and computational aspects of sheet metal blanking simulation. J. Mater. Process. Technol. 2002, 128, 256–265. [Google Scholar] [CrossRef]
- Springmann, M.; Kuna, M. Identification of material parameters of the Gurson-Tvergaard-Needleman model by combined experimental and numerical techniques. Comput. Mater. Sci. 2005, 33, 501–509. [Google Scholar] [CrossRef]
- Lemiale, V.; Chambert, J.; Picart, P. Description of numerical techniques with the aim of predicting the sheet metal blanking process by FEM simulation. J. Mater. Process. Technol. 2009, 209, 2723–2734. [Google Scholar] [CrossRef]
- Marouani, H.; Ismail, A.B.; Hug, E.; Rachik, M. Numerical investigations on sheet metal blanking with high speed deformation. Mater. Des. 2009, 30, 3566–3571. [Google Scholar] [CrossRef]
- Kossakowski, P.G. Simulation of ductile fracture of S235JR steel using computational cells with microstructurally-based length scales. J. Theor. Appl. Mech. 2012, 50, 589–607. [Google Scholar]
- Kiran, R.; Khandelwal, K. Gurson model parameters for ductile fracture simulation in ASTM A992 steels. Fatigue Fract. Eng. Mater. Struct. 2014, 37, 171–183. [Google Scholar] [CrossRef]
- Zhao, P.J.; Chen, Z.H.; Dong, C.F. Experimental and numerical analysis of micromechanical damage for DP600 steel in fine-blanking process. J. Mater. Process. Technol. 2016, 236, 16–25. [Google Scholar] [CrossRef]

| Material Type | Material 1 [32] | Material 2 [33] |
|---|---|---|
| Specimen | ST-1, CH, NT-1, SHS | ST-2, NT-2 |
| Thickness (mm) | 3 | 3.15 |
| Density (kg/m3) | 7850 | 7850 |
| Young’s modulus (GPa) | 200 | 207 |
| Poisson’s ratio | 0.3 | 0.3 |
| (MPa) | 275 | 302.8 |
| Strength coefficient k (MPa) | 630 | 690.2 |
| Strain-hardening index n | 0.21 | 0.2 |
| Plateau strain | 0.012 | 0.0189 |
| Source | Material | q1 | q2 | q3 | SN | f0 | fN | fc | ff | |
|---|---|---|---|---|---|---|---|---|---|---|
| Tvergaard et al. (1984) [8] | - | 1.5 | 1 | 2.25 | 0.3 | 0.1 | 0 | 0.04 | 0.15 | 0.25 |
| Skallerud and Zhang (1997) [34] | CMn steel | 1.5 | 1 | 2.25 | 0.3 | 0.1 | 0.0003 | 0.006 | 0.026 | 0.15 |
| Hambli (2001) [35] | Carbon steel | 1.5 | 1 | 2.25 | 0.3 | 0.1 | - | 0.04 | - | - |
| Rachik et al. (2002) [36] | Steels DD13, X6Cr17 | 1.5 | 1 | 2.25 | 0.3 | 0.1 | - | 0.04 | 0.1 | 0.101 |
| Springmann et al. (2005) [37] | Steel | 1.5 | 1 | 2.25 | 0.3 | 0.1 | 0.001 | 0.01 | 0.01 | 0.15 |
| Lemiale et al. (2009) [38] | Mild steel XES | 1.5 | 1 | 2.25 | 0.2 | 0.1 | - | 0.04 | 0.15 | 0.25 |
| Marouani et al. (2009) [39] | FeSi (3 wt.%) steel | 1.5 | 1 | 2.25 | 0.3 | 0.1 | - | 0.04 | 0.11 | 0.12 |
| Kossakowshi et al. (2012) [40] | S235JR steel | 1.91 | 0.79 | 3.65 | 0.3 | 0.05 | 0.0017 | 0.04 | 0.06 | 0.6 |
| Kiran et al. (2014) [41] | ASTM A992 steel | 1.5 | 1 | 2.25 | 0.45 | 0.05 | 0 | 0.02 | 0.03 | 0.5 |
| Zhao et al. (2016) [42] | DP600 steel | 1.5 | 1 | 2.25 | 0.2 | 0.1 | 0.0008 | 0.02 | 0.028 | 0.09 |
| Gholipour et al. (2019) [17] | SAE 1010 steel | 1.5 | 1 | 2.25 | 0.3 | 0.1 | 0.00107 | 0.00716 | 0.01 | 0.15 |
| Parameter | q1 | q2 | f0 | fN | fc | ff | q4 | q5 | ks |
|---|---|---|---|---|---|---|---|---|---|
| Range | 1–2 | 0.8–1.2 | 0–0.01 | 0.001–0.04 | 0.01–0.15 | 0.1–0.6 | 1.5–4.5 | 0.198–0.462 | 1–4 |
| Material Type | q1 | q2 | q3 | SN | f0 | fN | fc | ff | q4 | q5 | |
|---|---|---|---|---|---|---|---|---|---|---|---|
| Material-1 | 1.2 | 0.8 | 1.44 | 0.3 | 0.1 | 0.001 | 0.005 | 0.02 | 0.35 | 3.72 | 0.33 |
| Material-2 | 1.5 | 1 | 2.25 | 0.3 | 0.1 | 0.001 | 0.005 | 0.04 | 0.25 | 3.72 | 0.33 |
| Results | Test | Simulation Value (Original GTN) | Simulation Value (N-H GTN) | Simulation Value (Xue GTN) |
|---|---|---|---|---|
| Maximal force (kN) | 311.6 | 365.82 | 319.52 | 291.45 |
| Prediction error of maximal force | - | 17.4% | 2.54% | −6.47% |
| Displacement corresponding to peak load (mm) | 110.25 | 128.31 | 108.16 | 103.69 |
| Prediction error of displacement | - | 16.38% | −1.90% | −5.95% |
| Results | Test | Simulation Value (Original GTN) | Simulation Value (N-H GTN) | Simlation Value (Xue GTN) |
|---|---|---|---|---|
| Maximal force (kN) | 533.39 | 582.31 | 526.95 | 524.38 |
| Prediction error of maximal force | - | 9.17% | −1.21% | −1.69% |
| Displacement corresponding to peak load (mm) | 174.18 | 224.40 | 188.73 | 186.97 |
| Prediction error of displacement | - | 28.83% | 8.35% | 7.34% |
Disclaimer/Publisher’s Note: The statements, opinions and data contained in all publications are solely those of the individual author(s) and contributor(s) and not of MDPI and/or the editor(s). MDPI and/or the editor(s) disclaim responsibility for any injury to people or property resulting from any ideas, methods, instructions or products referred to in the content. |
© 2023 by the authors. Licensee MDPI, Basel, Switzerland. This article is an open access article distributed under the terms and conditions of the Creative Commons Attribution (CC BY) license (http://creativecommons.org/licenses/by/4.0/).
