Preprint
Article

Lionfish Diet Composition in Three Study Sites in the Aegean Sea (Southern Crete, and Kastellorizo and Nysiros Islands): An Invasive Generalist?

Altmetrics

Downloads

176

Views

99

Comments

0

A peer-reviewed article of this preprint also exists.

Submitted:

15 May 2023

Posted:

16 May 2023

You are already at the latest version

Alerts
Abstract
The diet of the lionfish (Pterois miles), an invasive species in the Aegean Sea, was examined by collecting stomach content data from fish collected in three study sites in the Aegean Sea (southern Crete, Kastellorizo and Nysiros islands). Prey composition in terms of numerical abundance and frequency of occurence was used to compare lionfish’s diet between these sites. Lionfish largely preyed upon teleosts (5% to 83% numerical abundance and 16% to 59% frequency of occurrence depending on the site) and crustaceans (12% to 95% numerical abundance and 15% to 91% frequency of occurrence). The most important teleost families in lionfish’s diet were Gobiidae, Labridae, and Scorpaenidae, while decapods and especially the family Scyllaridae and the genus Plesionika were the dominant crustacean prey items. The lionfish was found to be an especially successful generalist across the study sites, an opportunistic, predatory species overall, and at the same time, at a local level, it seems to be an equally successful specialist that could increase the predation mortality of already stressed prey populations, and can be a serious threat to endemic, critically endangered, and/or commercially important species.
Keywords: 
Subject: Biology and Life Sciences  -   Aquatic Science

1. Introduction

The Mediterranean Sea has become a hotspot for alien species, with an increase of established taxa of 40% the last decade, with approximately 1,000 of non-indigenous species being recorded till the end of 2021 [1]. Amongst them, fish is the group that attracted the highest attention as their settlement has raised serious concerns because of their short migration rate [2,3].The successful establishment into their newly invaded ecosystems could be attributed to their generalist nature [4,5], which has fundamental effects on local food web dynamics [6,7]. The invasive lionfish Pterois miles (Bennett 1828) is one of the most successful invaders [8], with increased predation rates on native fauna, resulting in altered community structure [9,10,11,12,13,14,15]. Its presence can reduce recruitment of native species, drive declines in populations [13,16], and subsequently have serious implications on marine ecosystem functioning [17].
Since the first documented appearance of Pterois miles in the Mediterranean Sea [18], the species has been extremely successful in establishing populations in new marine ecosystems [19]. Its range is constantly updated in the Mediterranean Sea [20,21], confirming its successful introduction and progressive invasion of the basin. Moreover, the biological characteristics of the species [11] promote its range expansion, which has not been interrupted by eradication programs [20]. Particularly, lionfifish diet composition has exhibited a large variability among different locations [22], rendering important location-based diet assessments to better inform local management regimes.
The species exhibits an opportunistic, generalist feeding behaviour, whose diet habits are directly connected to prey availability [23,24]. Differences in diet have been reported in the Mediterranean basin, where sampling (spear gun, boat-seining, long lines, video recordings) and identifification approaches (macroscopic examination and visual-video records) revealed that various fish species were among its main prey in Rhodes Island [25], whereas fish or benthic invertebrates were found in stomachs from Cyprus [26,27]. Given that regional differences in its diet are already confirmed, identification of new prey species should be expected with the investigation of its trophic preferences across its invaded geographic range. Therefore, new studies are required to evaluate lionfish diet habits and its effects as a predator of the native fauna. This study aims to provide first-time insights on lionfish diet composition in three study sites in the Aegean Sea (southern Crete, and Kastellorizo and Nysiros islands) and verify the species’ generalist strategy as a consumer across sites and individuals.

2. Materials and Methods

2.1. Ethics Statement

No ethical approval was required for fish provided by local fishermen dead.

2.2. Sample collection

Individuals of P. miles were collected between November 2021 to September 2022 from three areas in Greece (southern Crete, Kastellorizo and Nisyros Islands; Figure 1). Specimens were measured in length (TL) and weighed to the nearest 0.01 mm and 0.01 g, respectively. The sex of each specimen was determined and individuals were grouped in three categories (female, male, and unknown). Individuals were also grouped in two size classes, small and large. TL of 17.5 cm was arbitrarily chosen as a threshold value for the separation of the size classes. This TL value equals the length at maturity (L50) for P. miles females estimated by Morris [28] based on pooled samples from worldwide locations.

2.3. Lab work

Each individual was dissected and its stomach was excised, weighed and its state (empty or non-empty) was determined. The contents of non-empty (= “full”) stomachs were removed, weighed with an OHAUS Adventurer precision scale and visually examined in a Petri dish under a stereomicroscope (Olympus SZ65). Prey items were identified to the lowest possible taxonomic level and counted. Hard diagnostic parts (i.e., fish bones, otoliths, shrimp rostra, molluscan shells) were used for taxa identification. Otolith species identification was based on the otolith atlas [29]. Prey remains of the same taxonomic group were grouped together. Stomachs with unidentifiable material (because of advanced digestion) were excluded from further analysis regarding prey items but do not consider empty. Prey taxa were classified in three broad groups: fish, crustaceans and benthic invertebrates (excluding crustaceans).

2.4. Data analysis

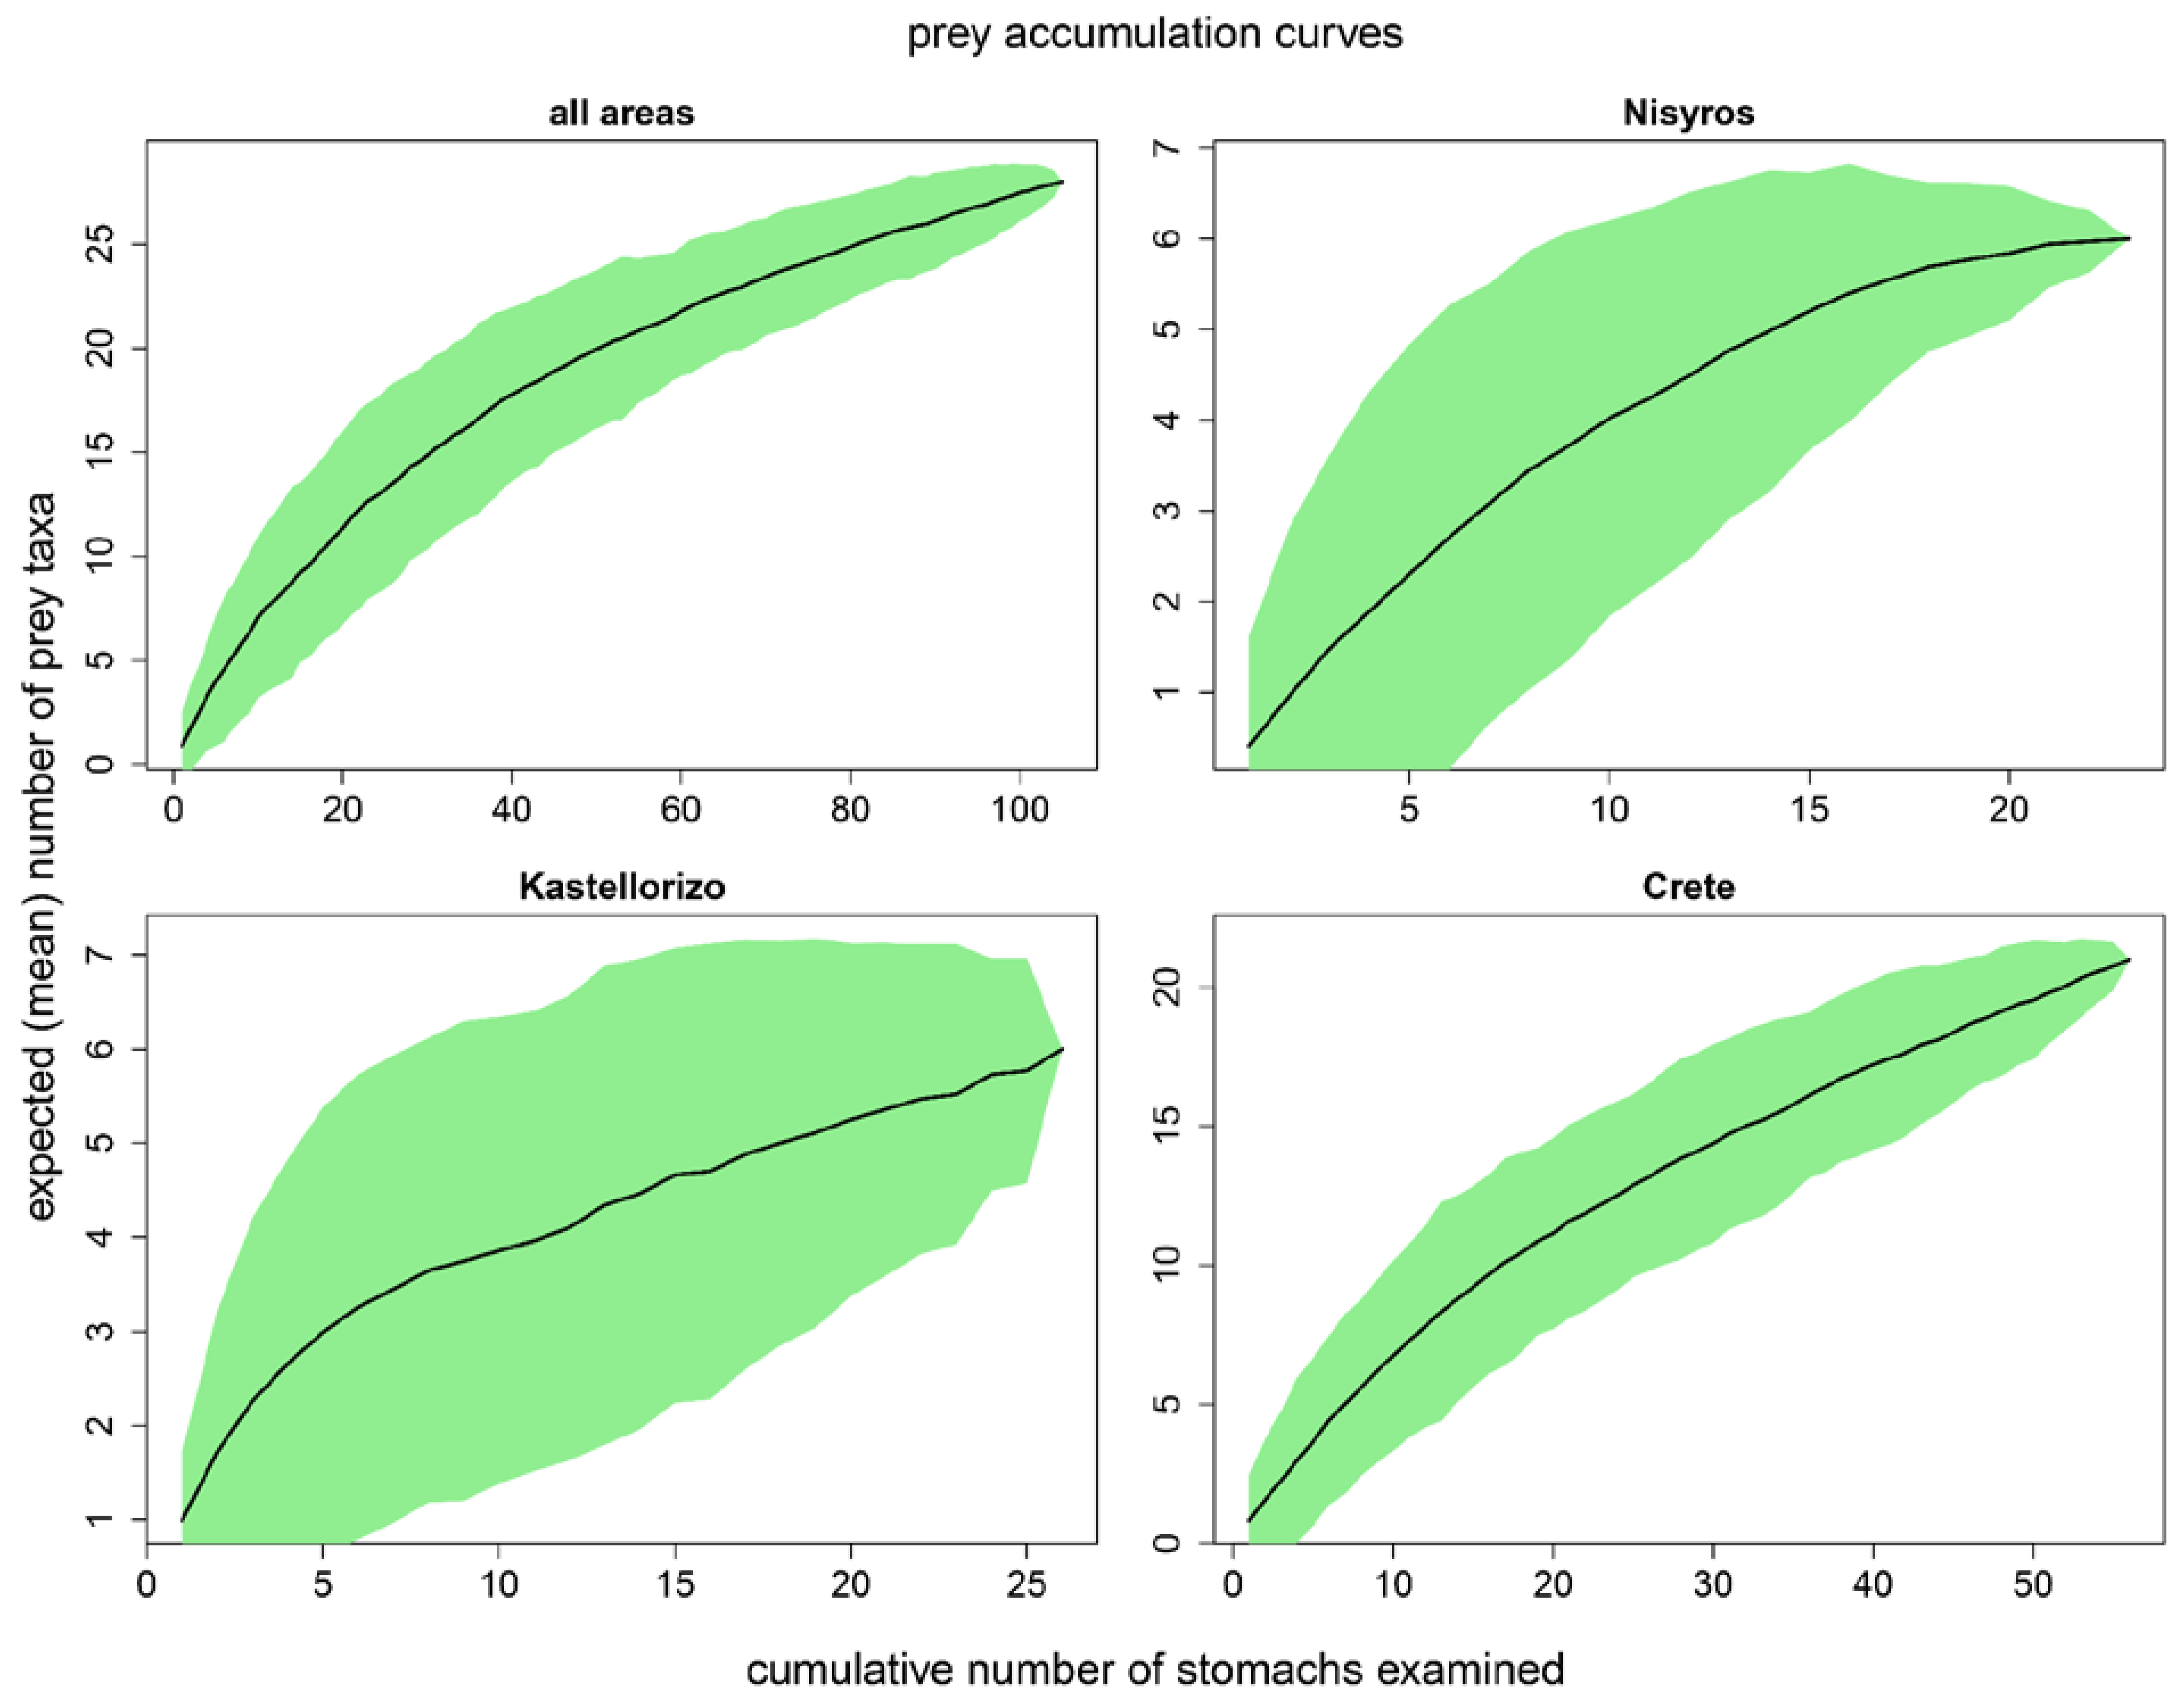
To evaluate whether the number of fish stomachs examined was adequate for a valid description of the species’ diet, prey accumulation curves [30,31] were computed with the vegan R package [32] for the whole dataset and each study area. The estimated (mean) number of prey groups and associated 95% confidence intervals were plotted against the cumulative number of stomachs examined. Stomach order was randomized as suggested by Ferry and Cailliet [30]. Proportions of empty (vacuity index, VI) and full stomachs were estimated as a percentage of the total number of the examined stomachs for each area, sex, and size class. The proportions of empty and full stomachs were tested for significant differences between areas, sexes, and size classes using the Pearson’s χ2 test of independence. Feeding intensity was also estimated with the ratio of (wet) food weight to total body weight (in 0/00) (repletion index, RI). RI values were tested for significant differences between areas, sexes, and size classes by means of the Kruskal-Wallis test.
The contribution of each prey taxon i in P. miles diet was estimated with the following methods [33]:
(i) Frequency of occurrence:
%F = Si * 100 / Sf
where F% is the frequency of occurrence of prey taxon i in the analysed stomachs, Si is the number of stomachs in the analysis containing items of prey taxon i and Sf is the total number of stomachs in the analysis.
(ii) Numerical:
%N = ni * 100 / Σni
where N% is the relative numerical abundance of prey taxon i, ni is the total number of prey i items and Σni the total number of all prey items in all stomachs in the analysis.
Visualization of the variations of the relative numerical abundances of prey taxa and groups between areas was carried out using the treemap R package [34].
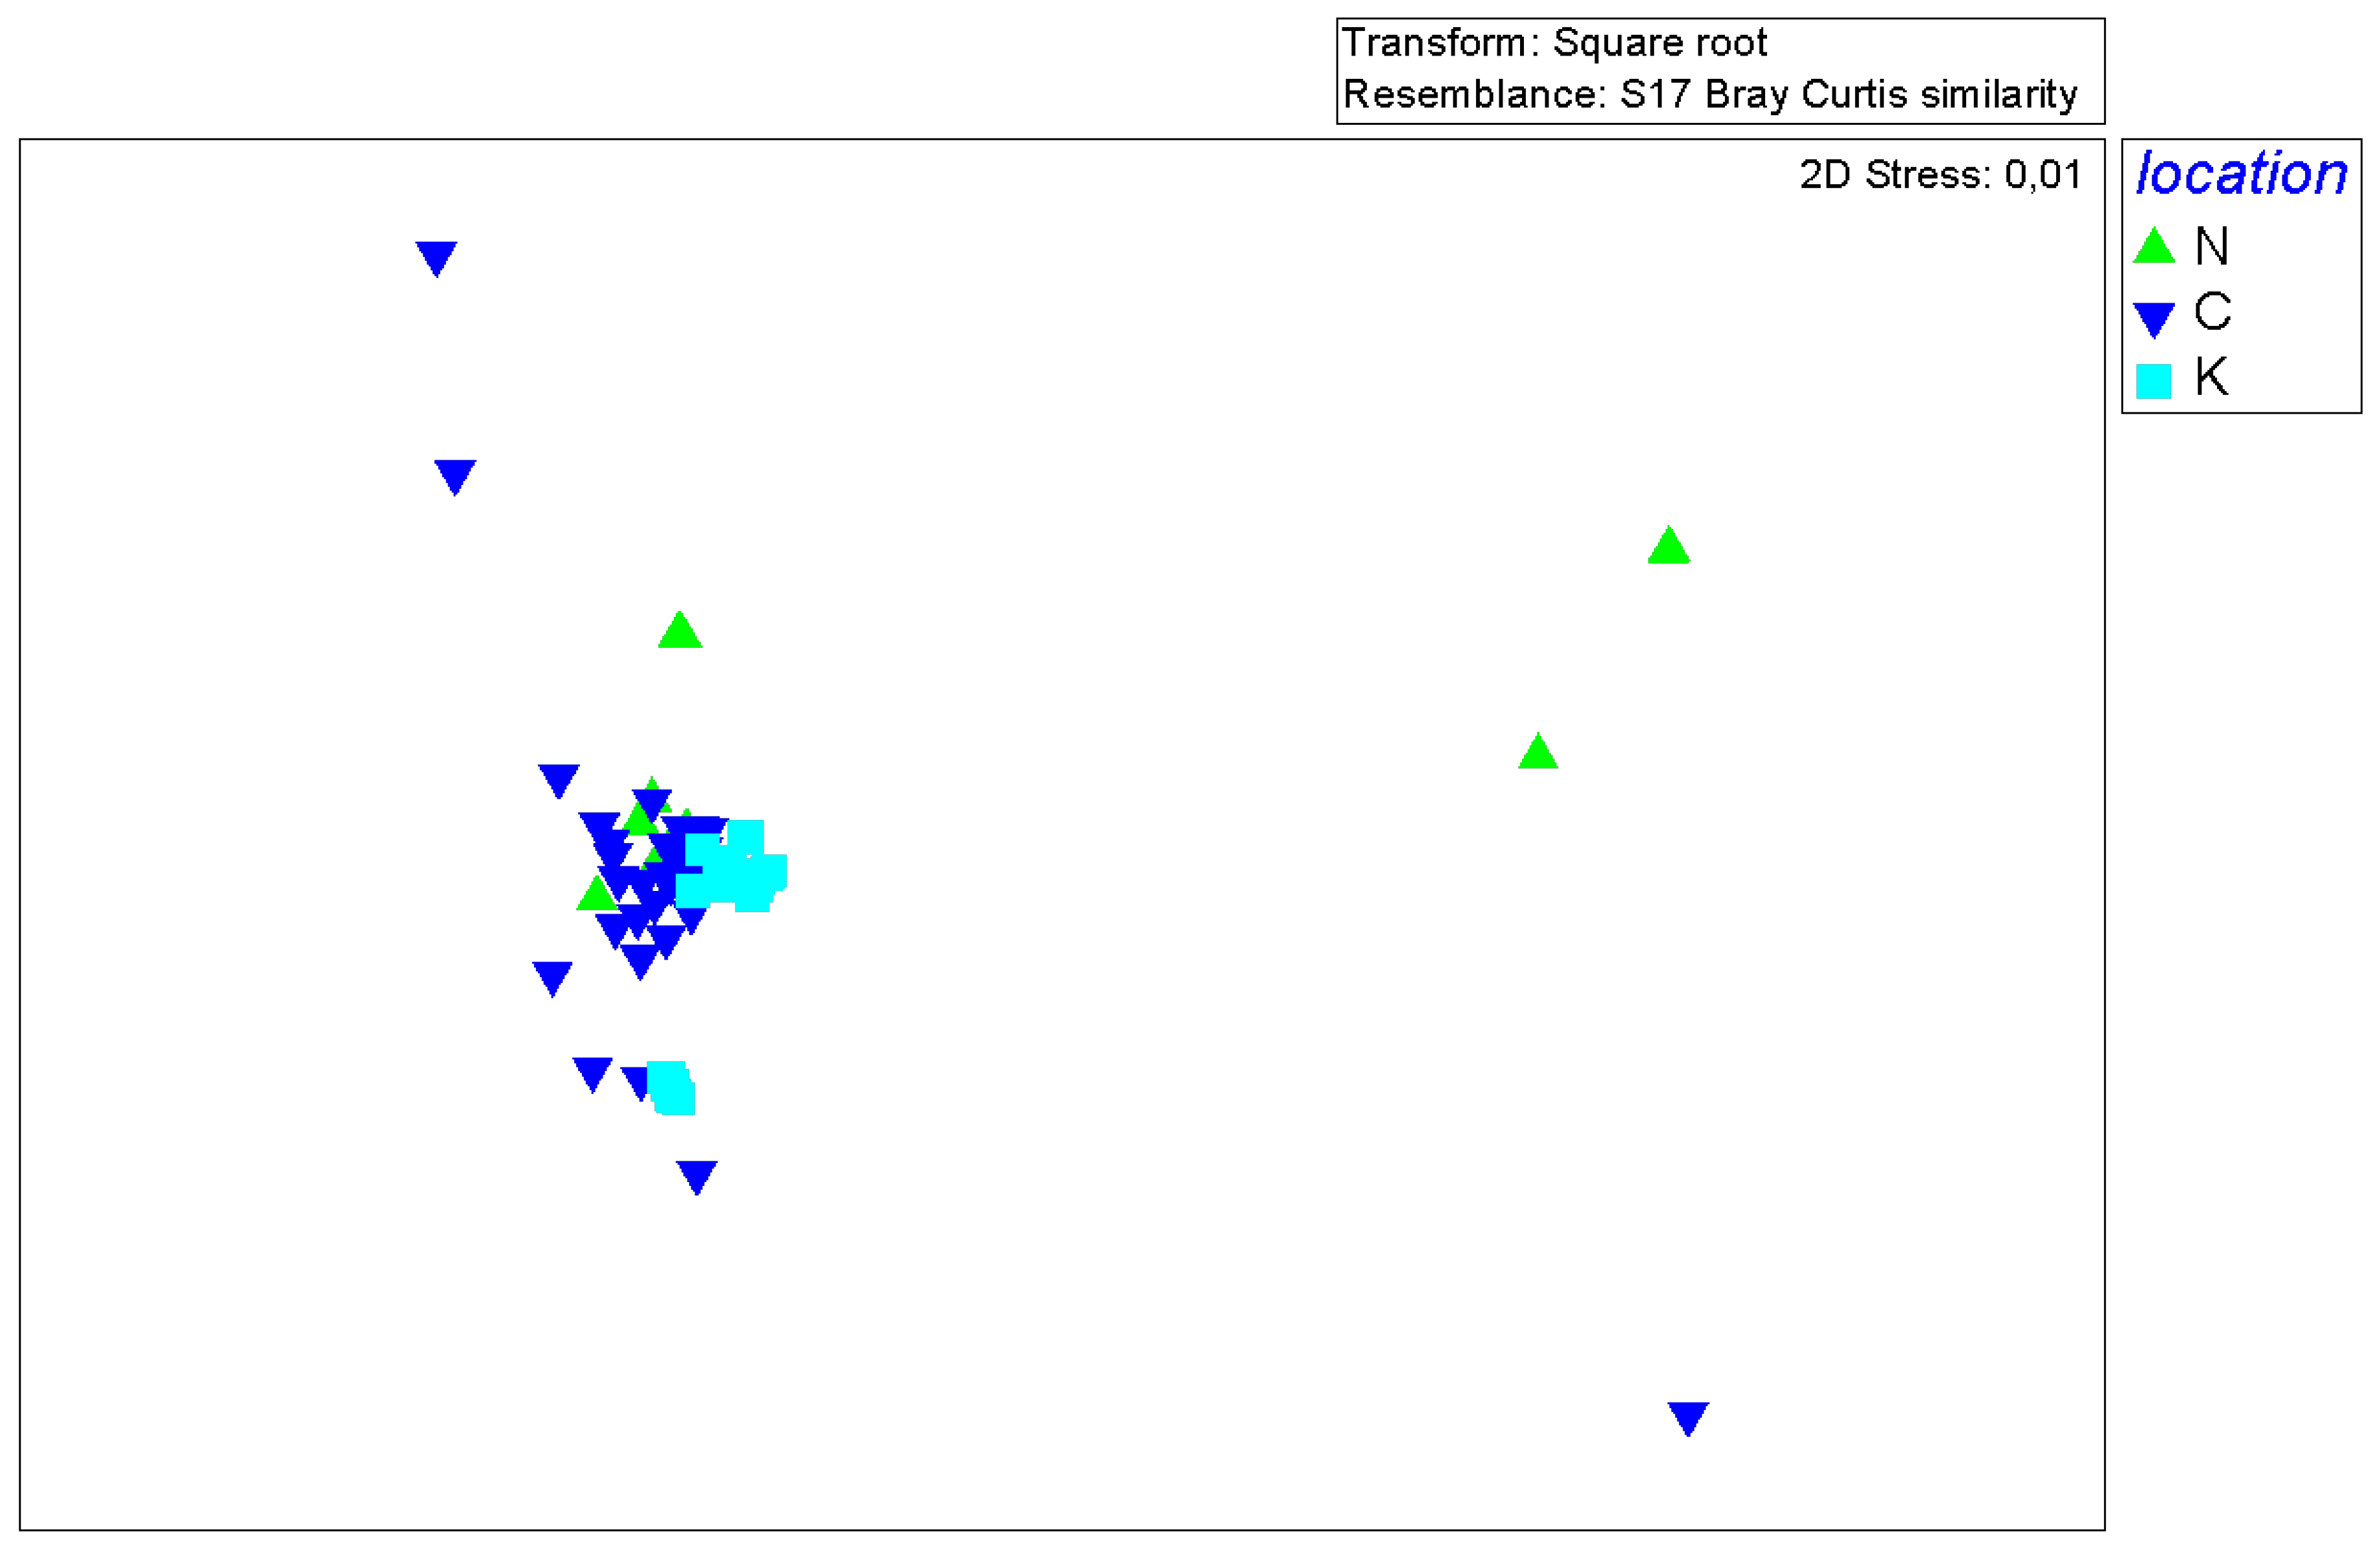
Non-metric Multi-Dimensional Scaling, nMDS [35], was used to ordinate samples on a 2-D plot for the visualization and exploration of the Bray–Curtis similarity matrix, that was calculated based on square root-transformed prey numerical abundance data across all the analysed stomachs. Permutational multivariate analysis of variance, PERMANOVA [36], was run on the same similarity matrix to test for statistically significant differences in stomach contents composition between areas, sexes, and size classes. All factors were set in the analysis design as fixed, the sums of squares type selected was Type III (partial), the permutation method was permutation of residuals under a reduced model, and the number of permutations selected was 9999.
One-way similarity percentage analysis, SIMPER [37], was also run on the similarity matrix to detect the prey taxa responsible for the between-areas dissimilarities (discriminating taxa) and within-area similarities (typifying taxa) regarding the P. miles stomach contents prey composition.
Diet overlap by area, sex, and size class was estimated with the Schoener index, Cxy [38]:
Cxy = 1 – 0.5 * (∑|pxi − pyi|)
where pxi and pyi are the proportions of prey category i (in terms of numerical abundance) in the diet of the species in area, sex or class size x and y, respectively. Cxy ranges from 1 (same prey items in the same proportions) to 0 (no common prey items).
The species feeding strategy was graphically depicted using a 2-D representation, where the relative abundance of prey taxon i (pi) was plotted against its frequency of occurrence (%F) in the analysed stomachs. This method is a modified Costello graphical analysis [39], and it assesses simultaneously the prey importance, the feeding strategy and the inter- and intra-individual components of trophic niche width.
Diet breadth was calculated for each area, sex and size class using the standardised Levins [40] niche breadth measure [41]:
BA = (Σpi^2 - 1) / (N - 1)
where pi is the relative abundance of prey taxon i and N is the total number of prey taxa. The values that this index may take range between 0 and 1, with low values indicating a specialist predator and high values a generalist one. Prey taxa with relative abundance values < 3% and unidentifiable remains were excluded from the analysis.
All analyses were performed using the R Statistical Software (v4.2.2; R Core Team 2022) [42], except the NMDS and SIMPER, which were implemented in PRIMER 6.1.18 [43,44] and the PERMANOVA test, which was carried out in PERMANOVA 1.0.8 [45].

3. Results

3.1. Sample size adequacy

A total of 141 P. miles individuals were collected from the three areas (Table 1). More than half of them (73) were collected in Crete, whereas similar numbers were gathered from Kastellorizo (31) and Nisyros (37) islands. The majority of the individuals were females (55%), while it was not possible to determine the sex of several fish (34%) due to early developmental stage of the gonads. The two size classes were comparable in numbers of individuals (S = 68, L = 73). The prey accumulation curves that were computed for each area (Figure 2) revealed upon visual examination that the numbers of stomachs collected were rather sufficient for Nisyros, less so for Kastellorizo, whereas for Crete the stomachs sample size was apparently not adequate. However, the estimate uncertainty was high in the cases of Nisyros and Kastellorizo.

3.2. Pterois miles feeding intensity

Overall, 105 of the collected stomachs had prey items inside and 36 stomachs were empty (Table 1). Empty stomachs were more numerous in individuals from Nisyros and in males, whereas their numbers were similar between small and large individuals. However, the results of the Pearson’s χ2 test did not reveal significant differences of the VI values between areas, sexes, or size classes at a significance level of 0.05. The Kruskal-Wallis test revealed that only area had a significant effect on RI (χ2=29.561, p=3.809 10-7). The highest mean values of the repletion index were calculated in individuals from Kastellorizo and the lowest in individuals from Nisyros (Table 2).

3.3. Contribution of prey taxa to P. miles diet

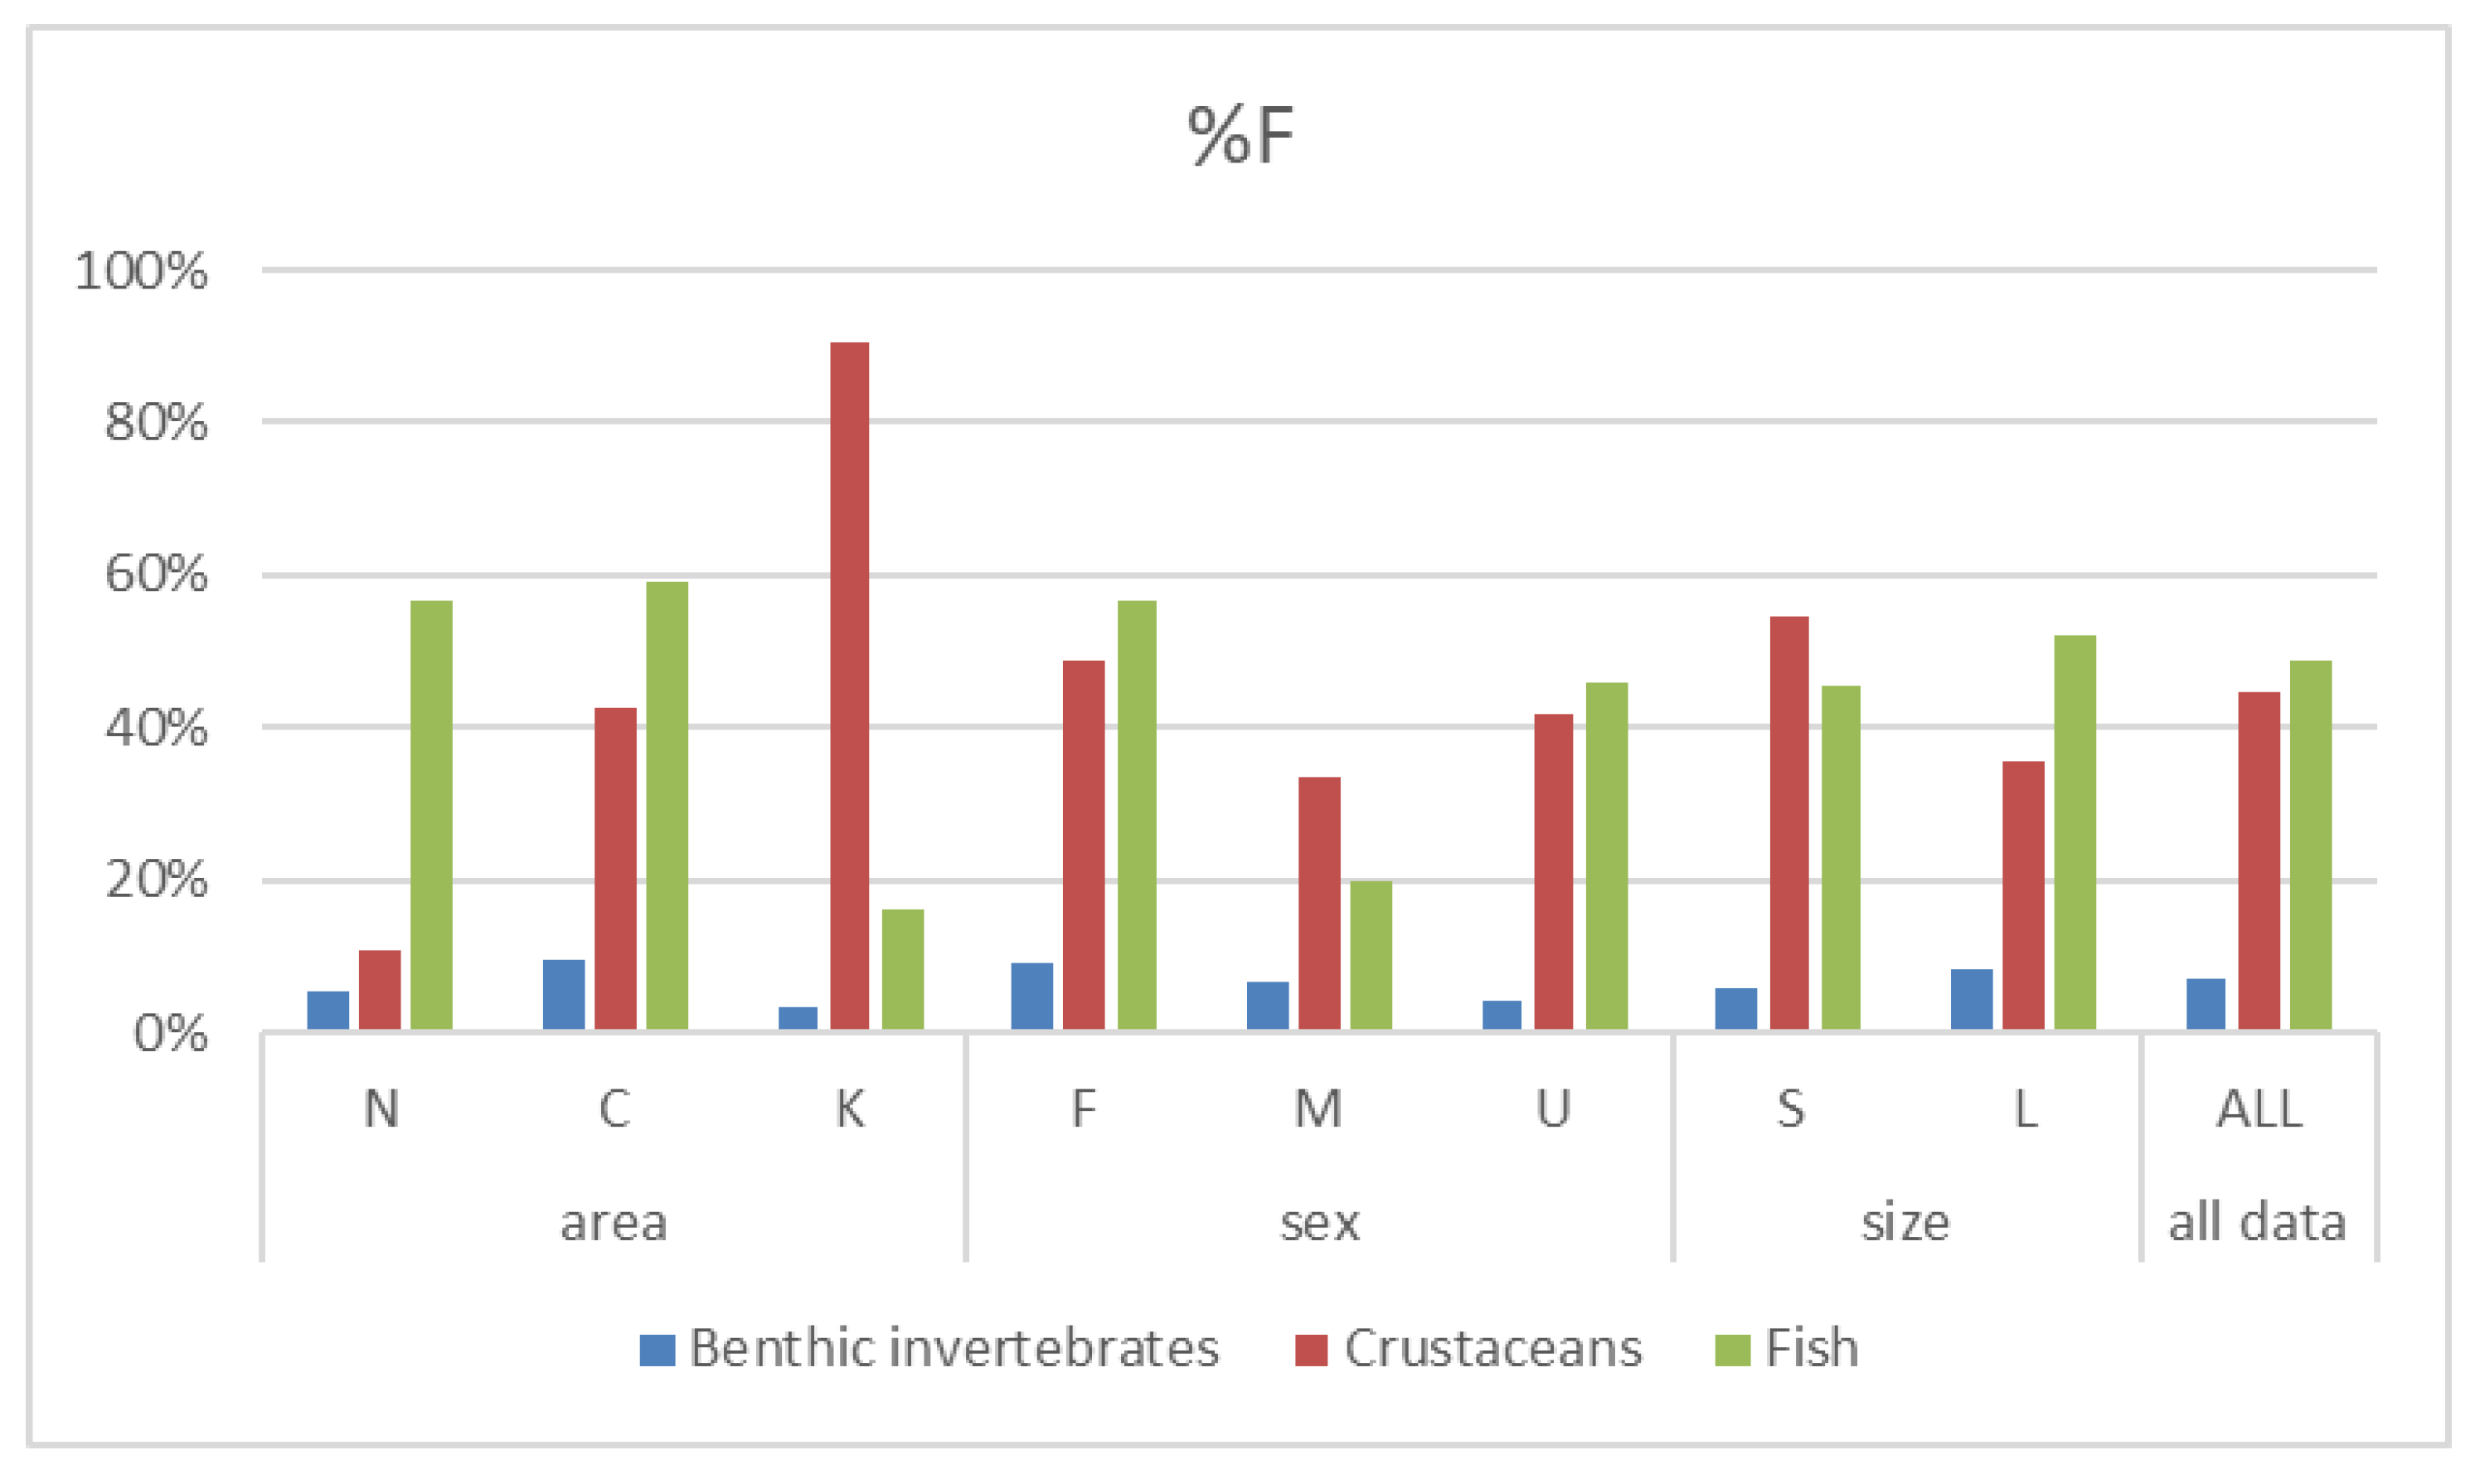
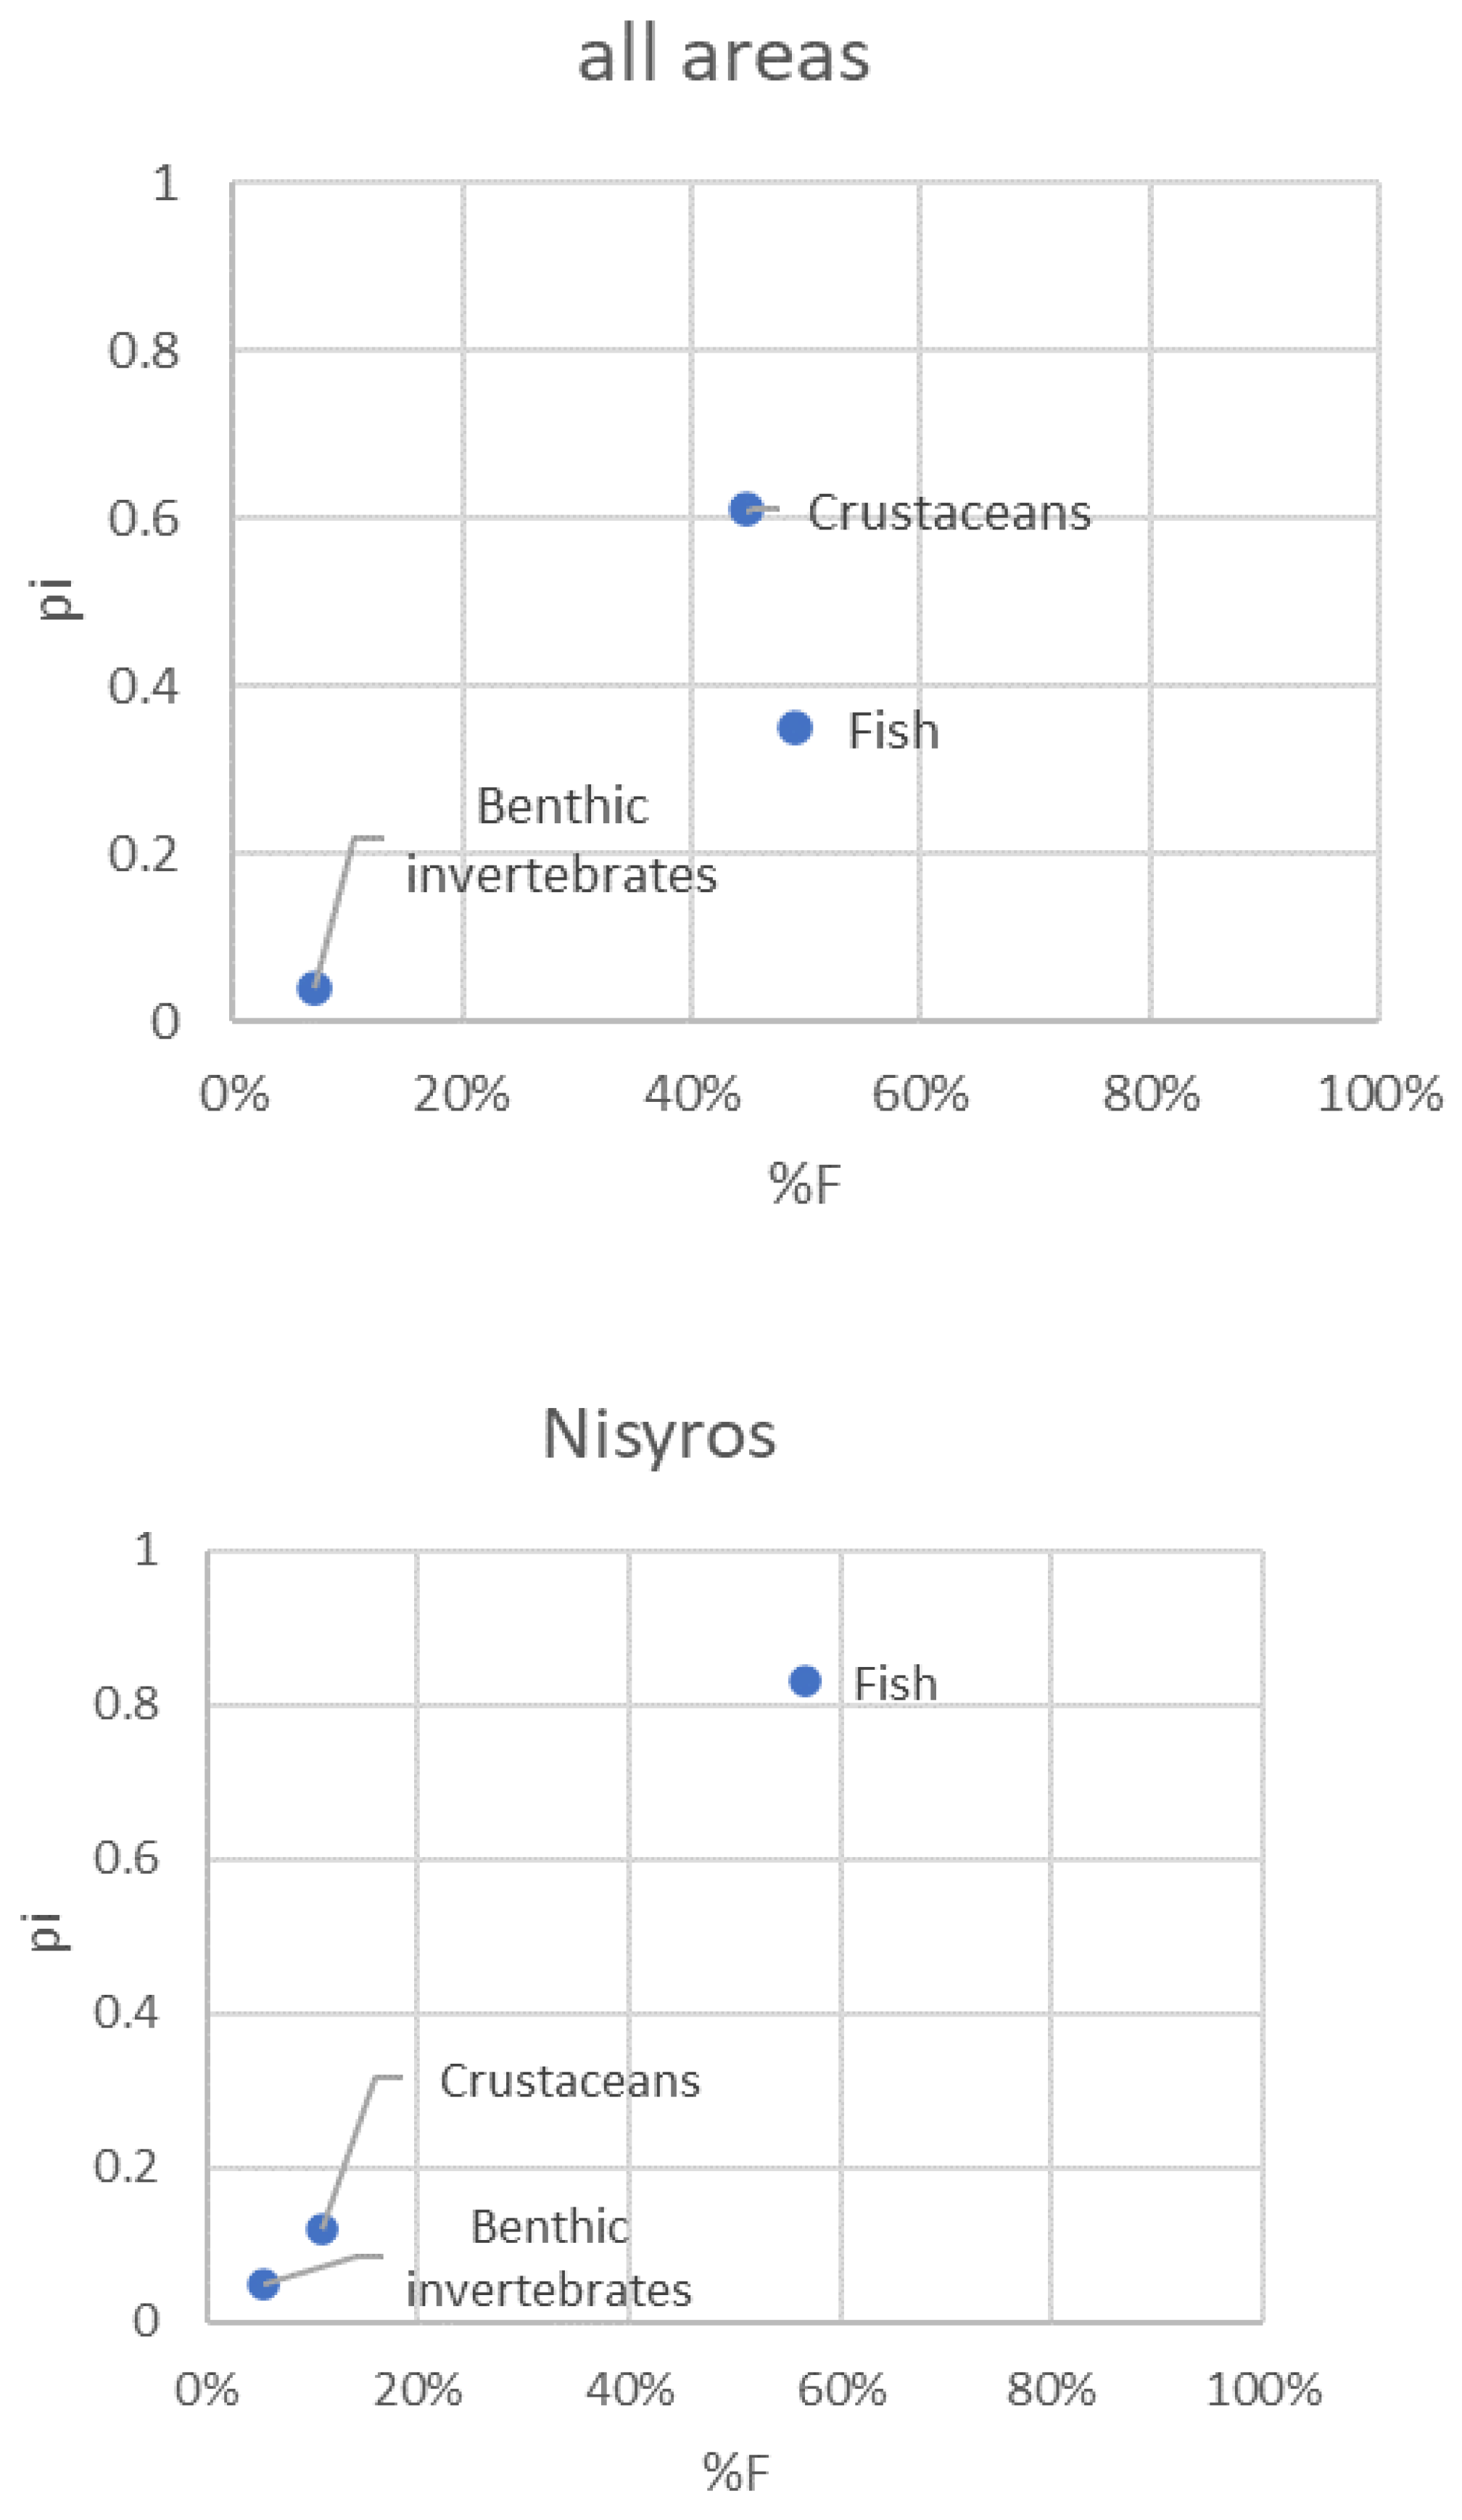
Overall, the contributions of fish and crustaceans were comparable in the diet of the species in the study area (%F = 49 and 45, respectively) and much higher than that of benthic invertebrates (%F = 7, Table S1, Figure 3).
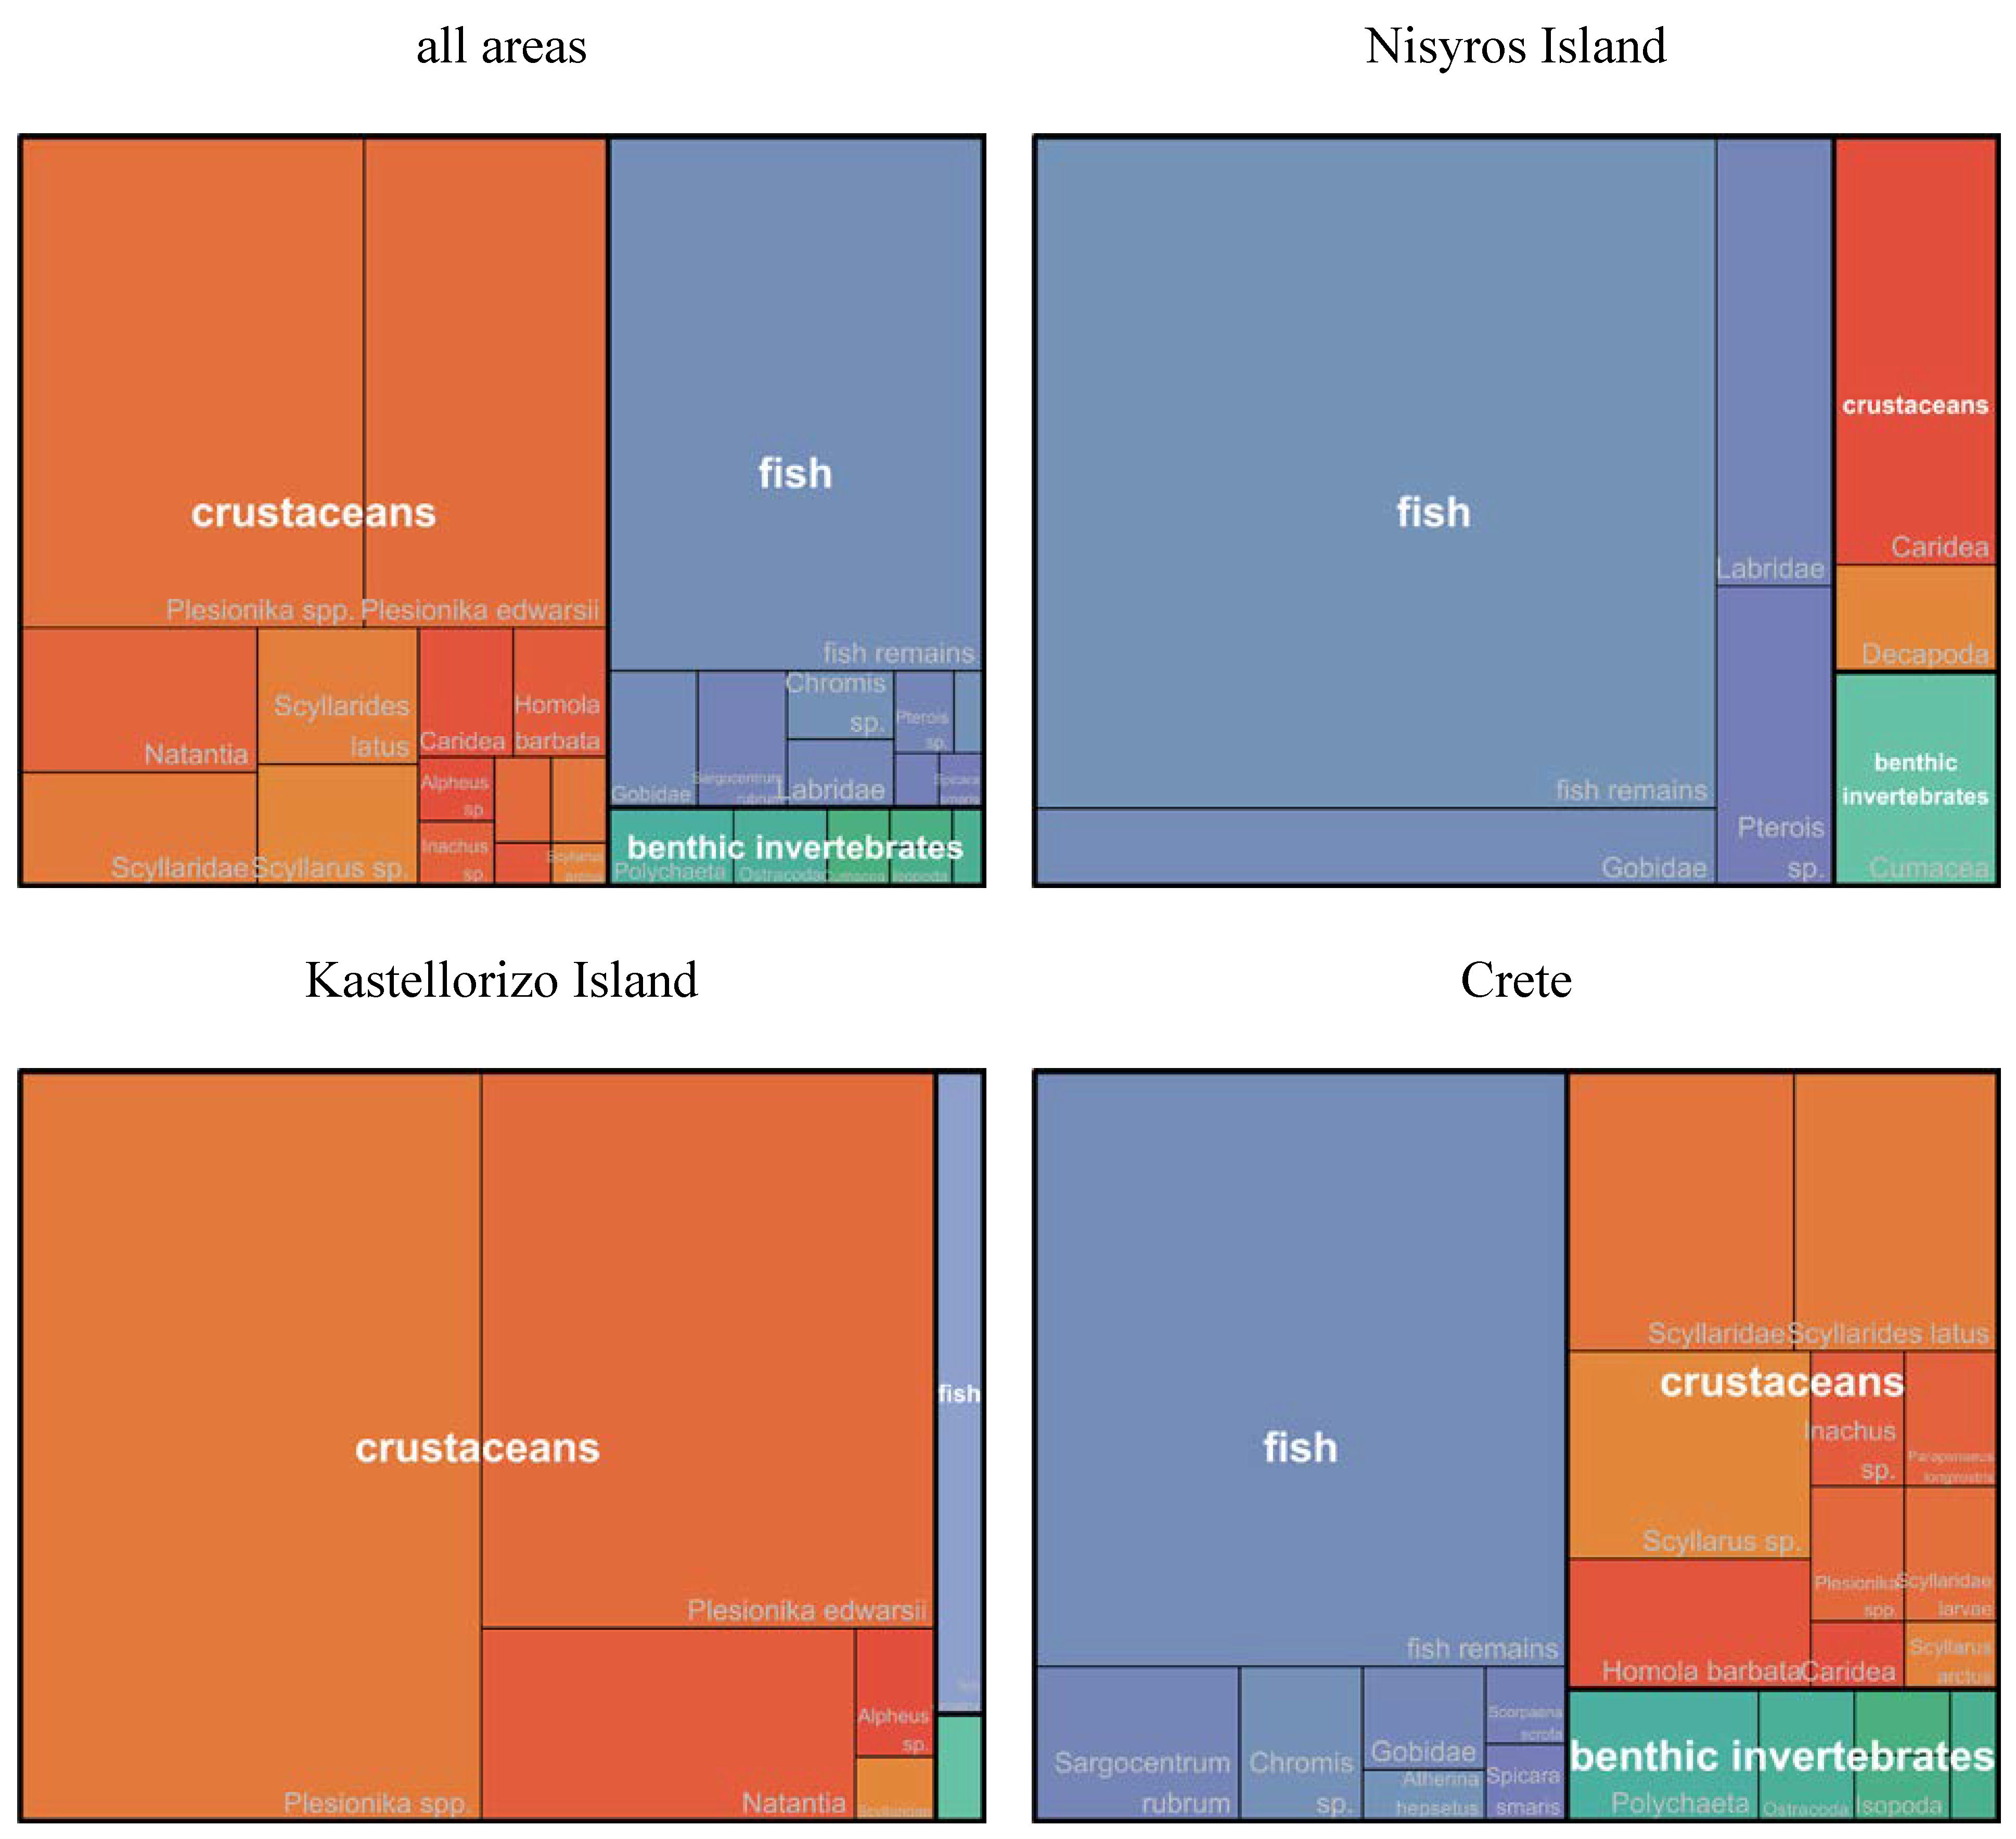
Fish remains, Plesionika edwardsii, Plesionika spp., Scyllaridae and Scyllarus sp. were the prey items most frequently found in the stomach contents of P. miles (%F >= 5). In terms of relative numerical abundance, the contribution of crustaceans (%N = 61) was higher than that of fish (%N = 35), whereas the relative numerical abundance of benthic invertebrates was small (%N = 4, Table S2, Figure 4). Fish remains, Plesionika spp. and Plesionika edwardsii were numerically the most abundant prey items in the stomach contents of the species (%N >= 5).

3.3. Multivariate analysis of P. miles diet composition

Stomach samples from a particular area were in most cases clustered together on the nMDS ordination plot, implying differences between areas in P. miles diet composition (Figure 5). No clear separation between groups was discerned on the nMDS plot according to sex or size class. Indeed, the PERMANOVA main test revealed that the diet composition of the species differed significantly between areas [Pseudo-F = 5.0894, p (perm) = 0.0001]. Moreover, the PERMANOVA pairwise tests showed that P. miles stomach contents differed significantly in composition between Kastellorizo and Nisyros and also between Kastellorizo and Crete (t=2.1535, p (perm) = 0.0005 and t=3.2464, p (perm) = 0.0001, respectively). However, the difference in P. miles diet composition between Nisyros and Crete was marginally insignificant (PERMANOVA: t=1.4544, p (perm) = 0.0506). No statistically significant differences in the trophic preferences of the species between sexes or size classes were found.
According to the one-way SIMPER analysis results (Table 3), fish remains was the trophic item that was characteristic of the stomach samples from Nisyros and Crete, whereas for Kastellorizo, the typifying trophic items were the crustacean taxa Plesionika edwardsii and Plesionika spp. Fish remains was the main discriminating prey item responsible for the Nisyros and Crete samples in terms of diet composition (contributing 37% of their dissimilarity), while several other prey taxa also contributed to the dissimilarity of the two areas, albeit to a lesser degree. Plesionika edwardsii, Plesionika spp. and fish remains cumulatively contributed 75.43% and 69.44% of the dissimilarity in the diet composition of P. miles between Nisyros and Kastellorizo and Crete and Kastellorizo, respectively.

3.4. Pterois miles diet overlap between areas, sexes and size classes

Pterois miles diet overlap was moderate between Nisyros and Crete (Cxy = 0.46) and very low between Kastellorizo and Nisyros or Crete (Cxy = 0.04 and 0.07, respectively). Moreover, diet overlap was considerable between sexes (Cxy = 0.67) and between size classes (Cxy = 0.69).

3.5. Pterois miles feeding strategy

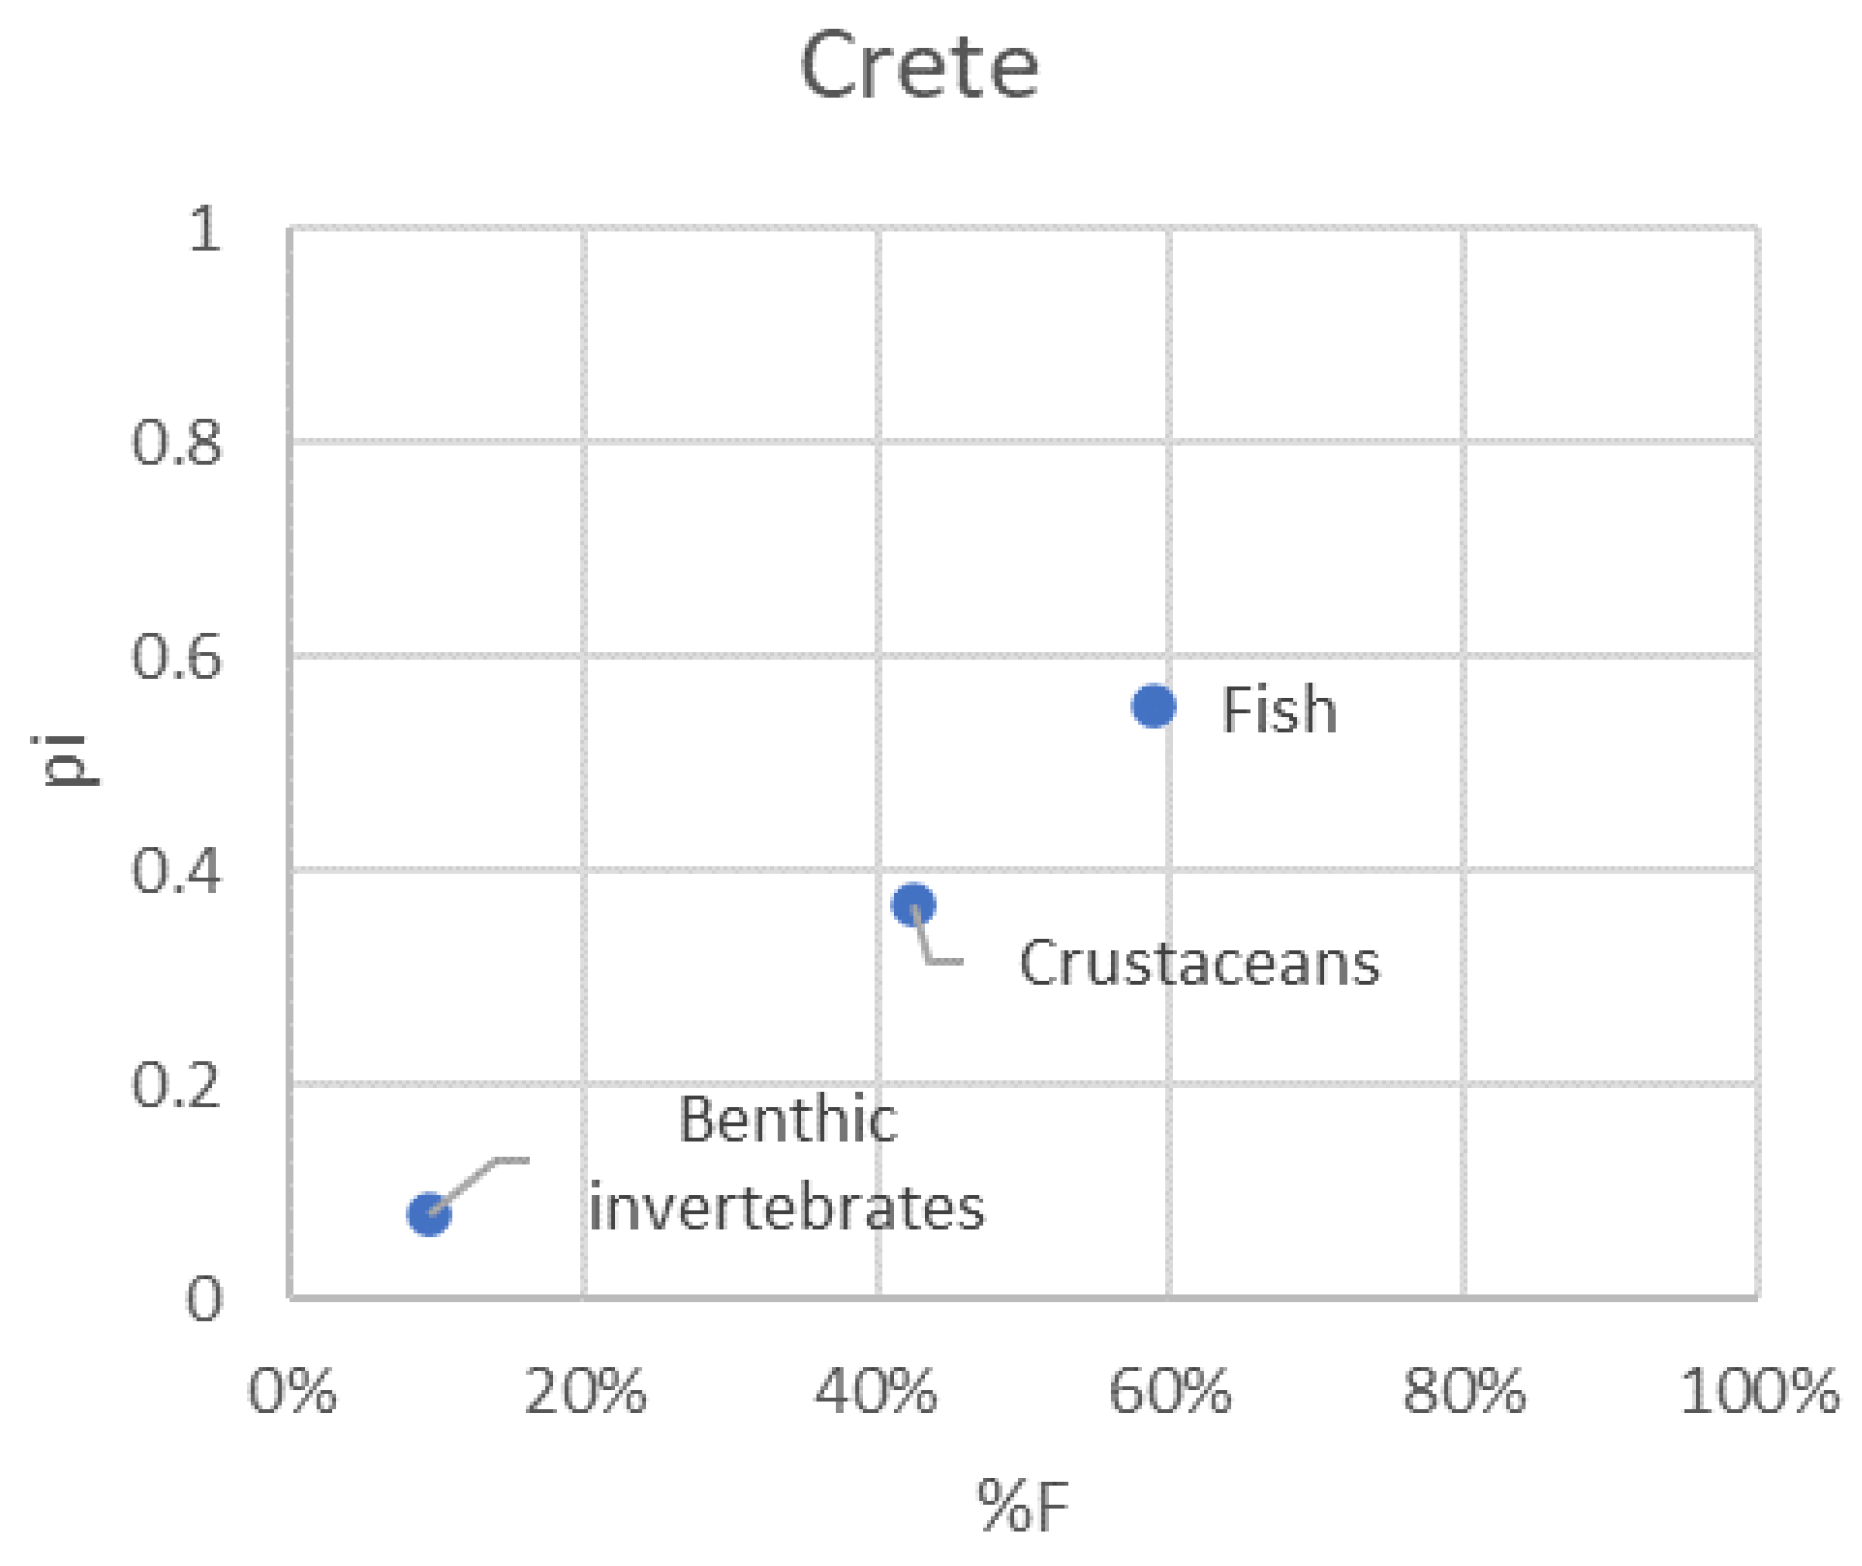
The feeding strategy plots depicted well the preference of P. miles for either fish or crustaceans, depending on the area (Figure 6). Benthic invertebrates were apparently rarely targeted by P. miles, as their frequency of occurrence and relative numerical abundance were low in the diet of the species in all areas.

3.6. Pterois miles diet breadth

Levins’ index values indicated a rather large trophic niche breadth in all areas (BA = 0.68 - 0.85), with the maximum value of the index calculated for Nisyros. Diet breadth was similar between sexes (BA = 44 and 42 for females and males, respectively) and higher in small (BA = 59) than in large individuals (BA = 44).

4. Discussion

The lionfish (P. miles) is a scorpaenid fish endemic in the Red Sea and the Gulf of Aqaba, where it preys on a big variety of benthic fishes and decapods [46,47]. This study provides a first comparative assessment of its diet composition in three different study areas located in southern Greece (Southern Aegean Sea) and highlights the similarities and differences in its feeding habits. It is, to our knowledge, the first study in Greece to describe the species’ diet composition and feeding patterns at a regional scale and to compare them among different areas.
The diet of P. miles was dominated either by fish or by decapods, depending on the area. The contribution of other benthic invertebrate groups in the species diet was comparatively low across all areas. At the same time, the lionfish diet composition and the relative contributions of prey varied considerably among study areas. Decapods were by far the primary prey in numerical abundance (95%) and frequency of occurrence (90.3%), followed by fish (4.3% and 16,1%, respectively) in Kastelorizo Island. Conversely, the main prey were fish (82.9% numerical abundance and 56.8% frequency of occurrence respectively), followed by decapods (12.2% numerical abundance and 10.8% frequency of occurrence, respectively) in Nisyros Island. A similar lionfish prey composition was reported by Morris Jr and Akins [48], who stated that 71.8 % numerical abundance and 61.6% frequency of occurrence of the prey species of lionfish in the Bahamas were teleosts and crustaceans. The dominant presence of these taxa as prey items in lionfish’s diet noted in other studies as well [14,22,25,49,50,51].
Pterois miles seems to behave as a specialist predator in both sites, targeting specific food items. Almost all 71%F and 83%N of its diet comprised of Plesionika spp. in Kastelorizo Island, whereas in the island of Nisyros, most prey (40.5%F and 63.4%N) were unidentified fish remains, whilst the families Gobidae (5.4%F and 7.3%N) and Labridae (5.4%F and 7.3%N) dominated the identified fish prey (5.4%F and 4.88%N). Additionally, almost all the decapod prey items belonged to caridean shrimp (8.11%F and 9.76%N) in Nisyros Island. Similarly, the diet of P. miles was composed predominantly of bony fish (78.5%N), with the majority of prey belonging to the family Gobidae, followed by Pomacentridae and Labridae in Rhodes Island,southeastern Aegean Sea, [25]. Fish prey that belongs to the aforementioned families were also reported in the Caribbean Sea, such as the Mexican Caribbean [49,50], Costa Rica [51], and Puerto Rico [14]. These findings support the hypothesis that lionfish can be dietary specialists [17]. Specialization in diet may largely depend on local prey assemblages’ composition and thus, it is more likely to be observed locally [17,52].
Fish and decapods were also the main prey categories for the lionfish (%N = 55.3 and 36.8 and %F = 58.9% and 42.5%, respectively) in southern Crete. In this site, the lionfish exhibited a relatively more balanced diet with one noticeable exception. Interestingly, a large proportion of the decapod prey belonged to the family Scyllaridae (26.3%N out of 36.8%N and 28.8%F out of 42.5%F). The specialist behaviour appeared here as well, but at a lesser degree than in Kastelorizo Island. Thus, the lionfish could pose a threat to the endangered Mediterranean slipper lobsters species (Scyllaridae), at least at the local level. Native Mediterranean scorpionfish species may prey on slipper lobsters, but only in one study to our knowledge S. latus and S. arctus were both listed amongst the prey items of S. scrofa [53].
It is difficult to properly assess the actual fisheries pressure on threatened and/or protected decapods when relying on official data [54,55]. The degree of uncertainty increases in species with limited or no commercial value, such as the slipper lobsters of the genus Scyllarus. The addition of the pressure caused by the lionfish predation along with the uncertainty level of the fisheries pressure, may further reduce Scyllarus populations.
Native Mediterranean fish species of the Scorpanidae family exhibit several ecological similarities with P. miles, such as from being a generalist to a specialist strategy at a local level. For instance, Scorpaena maderensis Valenciennes, 1833 prefers epibenthic crustaceans, [56] and Scorpaena loppei Cadenat, 1943 prefers mysids and decapods [57].. Studies regarding the feeding ecology of S. porcus, showed similar specialist feeding strategy [58,59,60,61] and in some cases endangered seahorses species were preyed upon [62]. However, in all studies investigating the feeding habits of P. miles, it is suggested that many factors such as prey availability, habitat complexity and season could affect the feeding ecology of the species.
In conclusion, the lionfish is an especially successful generalist, opportunistic, predatory species at a regional scale [17,22,48,52,63], and as such it feeds on the most abundant and common prey species [22]. At the same time, at a local level, it seems to be an equally successful specialist and it could increase the predation mortality of already stressed prey populations, depending on local predator communities [22]. It can have high ecological impact on native Mediterranean communities [64], similar to the detrimental impacts on native fish fauna and the food web in the Caribbean ecosystem [11,19,65,66,67] and can be a serious threat to endemic, critically endangered [16,68,69], and/or commercially important species [50].
However, in order to reveal individual- and population-level specializations in lionfish diet and whether these can cause negative effects on native and/or endangered prey populations, robust large-scale studies of the species diet composition in association with prey availability are needed.

Supplementary Materials

The following supporting information can be downloaded at the website of this paper posted on Preprints.org.

Acknowledgments

This work has been financed by the Operational Programme of Fisheries and Sea 2014-2020, Greece (MIS 5049543). We are very grateful to local fishermen for providing samples.

References

  1. Zenetos, A. , Albano, P. G., Lopez Garcia, E., Stern, N., Tsiamis, K., & Galanidi, M. (2022). Established non-indigenous species increased by 40% in 11 years in the Mediterranean Sea. Mediterranean Marine Science, 23(1). [CrossRef]
  2. Katsanevakis S, Rilov G, Edelist D (2018) Impacts of marine invasive alien species on European fisheries and aquaculture–plague or boon? 1: CIESM Monograph 50.
  3. Tsirintanis K, Azzurro E, Crocetta F, Dimiza M, Froglia C, Gerovasileiou V, Langeneck J, Mancinelli G, Rosso A, Stern N, Triantaphyllou M, Tsiamis K, Turon X, Verlaque M, Zenetos A, Katsanevakis S (2022) Bioinvasion impacts on biodiversity, ecosystem services, and human health in the Mediterranean Sea. 3: Aquatic Invasions 17(3). [CrossRef]
  4. Olden, J. , & Poff, N., Douglas, M., Douglas, M., & Fausch, K. (2004). Ecological and evolutionary consequences of biotic homogenization. Trends in ecology & evolution. 19. 18-24. [CrossRef]
  5. South, J. , Dick, J. T., McCard, M., Barrios-O’Neill, D., & Anton, A. (2017). Predicting predatory impact of juvenile invasive lionfish (Pterois volitans) on a crustacean prey using functional response analysis: effects of temperature, habitat complexity and light regimes. Environmental Biology of Fishes, 100, 1155-1165. [CrossRef]
  6. Fanelli, E. , Azzurro, E., Bariche, M., Cartes, J. E., & Maynou, F. (2015). Depicting the novel Eastern Mediterranean food web: a stable isotopes study following Lessepsian fish invasion. 2163; 17. [Google Scholar]
  7. Bezerra, L. A. V. , Angelini, R. I. ( 817, 475–489. [CrossRef]
  8. Côté, I.M. & Smith N.S. (2018). The lionfish Pterois sp. invasion: Has the worst-case scenario come to pass? Fish Biology. 92(3):660-689. [CrossRef]
  9. Lesser, M. P. , Slattery, M., 2011. Phase shift to algal dominated communities at mesophotic depths associated with lionfish (Pterois volitans) invasion on a Bahamian coral reef. Biological Invasions, 13 (8), 1855-1868. [CrossRef]
  10. Green SJ, Akins JL, Cote IM (2011). Foraging behaviour and prey consumption in the Indo-Pacific lionfish on Bahamian coral reefs. Mar Ecol Prog Ser 433:159–167. [CrossRef]
  11. Côté, I.M. , Green S.J., Hixon M.A. 2013. Predatory fish invaders: Insights from Indo-Pacific lionfish in the western Atlantic and Caribbean. Biological Conservation 164: 50–61. [CrossRef]
  12. Dahl, K.A. & Patterson III, W.F. (2014) Habitat-specific density and diet of rapidly expanding invasive red lionfish, Pterois volitans, populations in the Northern Gulf of Mexico. PLoS ONE 9(8): e105852. [CrossRef]
  13. Green SJ & Coˆte’ IM (2014). Trait-based diet selection: prey behaviour and morphology predict vulnerability to predation in reef fish communities. J Anim Ecol 83(6):1451–1460. [CrossRef]
  14. Harms-Tuohy, C. , Schizas, N.V., & Appeldoorn, R.S. 2016. Use of DNA metabarcoding for stomach content analysis in the invasive lionfish Pterois volitans in Puerto Rico. Marine Ecology Progress Series 558: 181-191. [CrossRef]
  15. Dahl, K.A. , Patterson III, W.F., Robertson, A., & Ortmann, A.C. 2017. DNA barcoding significantly improves resolution of invasive lionfish diet in the Northern Gulf of Mexico. Biological Invasions 19(6): 1917-1933. [CrossRef]
  16. Green SJ, Akins JL, Maljkovi A, & Coˆte’ IM. 2012. Invasive lionfish drive Atlantic coral reef fish declines. PLoS ONE 7(3):e32596. [CrossRef]
  17. Layman CA, & Allgeier JE. 2012. Characterizing trophic ecology of generalist consumers: a case study of the invasive lionfish in The Bahamas. Mar Ecol Prog Ser 448:131–141. [CrossRef]
  18. Golani, D. & Sonin, O., 1992. New records of the Red Sea fishes, Pterois miles (Scorpaenidae) and Pteragogus pelycus (Labridae) from the eastern Mediterranean Sea. Japanese Journal of Ichthyology, 39 (2), 167-169. [CrossRef]
  19. Albins, M.A. , & Hixon, M.A. (2008) Invasive Indo-Pacific lionfish Pterois volitans reduce recruitment of Atlantic coral-reef fishes. Marine Ecology Progress Series 367: 233-238. [CrossRef]
  20. Bariche, M. Torres, M., & Azzurro, E. (2013). The Presence of the invasive Lionfish Pterois miles in the Mediterranean Sea. Mediterranean Marine Science. 14(2), 292–294. [CrossRef]
  21. Dimitriadis, C. , Galanidi, M., Zenetos, M., Corsini-Foka, M., Giovos, I., Karachle, P.K., Fournari-Konstantinidou, I., Kytinou, E., Issaris, Y., Azzurro, E., Castriota, L., Falautano, M., Kalimeris, A., & Katsanevakis, S. (2020). Updating the occurrences of Pterois miles in the Mediterranean Sea, with considerations on thermal boundaries and future range expansion. Mediterranean Marine Science, 21(1), 62–69. [CrossRef]
  22. Peake, J. , Bogdanoff A.K., Layman C.A., Castillo B., Reale-Munroe K., Chapman J., Dahl K., Patterson W.F.III, Eddy C., Ellis R.D., Faletti M., Higgs N., Johnston M.A., Muñoz R.C., Sandel V., VillasenorDerbez J.C., Morris J.A.jr. 2018. Feeding ecology of invasive lionfish (Pterois volitans and Pterois miles) in the temperate and tropical western Atlantic. Biological Invasions 20 (9): 2567–2597. [CrossRef]
  23. Côté, I.M. , Maljković A. 2010. Predation rates of IndoPacific lionfish on Bahamian coral reefs. Marine Ecology Progress Series 404: 219–225. [CrossRef]
  24. Ritger, A. L. Fountain, C. T., Bourne, K., Martín-Fernández, J. A., & Pierotti, M. E. (2020). Diet choice in a generalist predator, the invasive lionfish (Pterois volitans/miles). Journal of Experimental Marine Biology and Ecology, 524. [CrossRef]
  25. Zannaki, K.; Corsini-Foka, M.; Kampouris, T.E.; Batjakas, I.E. 2019. First results on the diet of the invasive Pterois miles (Actinopterygii: Scorpaeniformes: Scorpaenidae) in the Hellenic waters. Acta Ichthyol. Piscat. 2019, 49(3), 311–317. [CrossRef]
  26. D’Agostino, D.; Jimenez, C.; Reader, T.; Hadjioannou, L.; Heyworth, S.; Aplikioti, M.; Argyrou, M.; Feary, D.A. Behavioural traits and feeding ecology of Mediterranean lionfish and naiveté of native species to lionfish predation. Mar. Ecol. Prog. Ser. 2020, 638, 123–135. [Google Scholar] [CrossRef]
  27. Savva, I.; Chartosia, N.; Antoniou, C.; Kleitou, P.; Georgiou, A.; Stern, N.; Hadjioannou, L.; Jimenez, C.; Andreou, V.; Hall-Spencer, J.M.; Kletou, D. They are here to stay: the biology and ecology of lionfish (Pterois miles) in the Mediterranean Sea. Fish Biol. 2020, 97(1), 148–162. [Google Scholar] [CrossRef] [PubMed]
  28. Morris Jr, JA. 2009. The biology and ecology of invasive Indo–Pacific lionfish. PhD Thesis, North Carolina State University, USA. 168 pp.
  29. Tuset VM, Lombarte A, & Assis CA. 2008. Otolith atlas for the western Mediterranean, north and central eastern Atlantic. Sci Mar 72:7–198. https://doi. org/ 10. 3989/ scimar. 2008.
  30. Ferry LA, & Cailliet GM. 1996. Sample size and data analysis: are we characterizing and comparing diet properly? In: Shearer KD, MacKinlay DD (eds) (1996) GUTSHOP ‘96. Feeding Ecology and Nutrition in Fish. International Congress on the Biology of Fishes. San Francisco State University, USA, -18, 1996. 14 July.
  31. Tiralongo F, Messina G, Cazzolla Gatti R, Tibullo D, & Lombardo BM. 2018. Some biological aspects of juveniles of the rough ray, Raja radula Delaroche, 1809 in Eastern Sicily (central Mediterranean Sea). 1: Journal of Sea Research 142. [CrossRef]
  32. Oksanen J, Blanchet FG, Friendly M, Kindt R, Legendre P, McGlinn D, Minchin PR, O’Hara RB, Simpson GL, Solymos P, Stevens MHH, Szoecs E, & Wagner H. 2019. vegan: Community Ecology Package. R package version 2.6-4. https://CRAN.R-project. 4 December.
  33. Hyslop, EJ. 1980. Stomach contents analysis—a review of methods and their application. J Fish Biol 17(4):411–429. [CrossRef]
  34. Tennekes M (2021). treemap: Treemap Visualization. R package version 2.4-3. https://CRAN.R-project. 4 December.
  35. Kruskal, J.B. , 1964. Nonmetric multidimensional scaling: a numerical method. Psychometrika 29: 115-129.
  36. Anderson, M. , 2001. A new method for non-parametric multivariate analysis of variance. Austral Ecol 26: 32-46.
  37. Clarke KR (1993) Non-parametric multivariate analyses of changes in community structure. Austral Ecol 18:117–143.
  38. Schoener TW (1970) Nonsynchronous spatial overlap of lizards in patchy habitats. 4: Ecology 51(3).
  39. Amundsen, P.-A. , Gabler, H.-M., & Staldvik, F. J. 1996. A new method for graphical analysis of feeding strategy from stomach contents data. 48.
  40. Levins, R. 1968. Evolution in changing environments. Princeton Univ. Press, Princeton, N. J. 120 p.
  41. Krebs, C.J. 2014. Ecological Methodology, 3nd ed. Addison-Wesley Educational Publishers, Inc.
  42. R Core Team (2022). R: A language and environment for statistical computing. R Foundation for Statistical Computing, Vienna, Austria. https://www.R-project.
  43. Clarke, K.R. , & Warwick, R.M. 2001. Change in Marine Communities: An Approach to Statistical Analysis and Interpretation. Second edition.
  44. Clarke, Κ.Ρ. & Gorley, R.N., 2006. PRIMER v6: User Manual/Tutorial.
  45. Anderson, M.J. , Gorley, R.N. & Clarke, K.R., 2008. PERMANOVA+ for PRIMER: Guide to Software and Statistical Methods.
  46. Fishelson, L. 1975. Ethology and reproduction of pteroid fishes found in the Gulf of Aqaba (Red Sea), especially Dendrochirus brachypterus (Cuvier), (Pteroidae, Teleostei). Pubblicazioni della Stazione Zoologica di Napoli 39 (Suppl.): 635–656.
  47. Khalaf MA, Disi AM (1997) Fishes of the Gulf of Aqaba.
  48. Morris JA, & Akins JL 2009. Feeding ecology of invasive lionfish (Pterois volitans) in the Bahamian archipelago. Environ Biol Fishes 86(3):389–398. [CrossRef]
  49. Arredondo-Chávez, A.F. , Sánchez-Jimenez, J.A., Ávila-Morales, O.G., TorresChávez, P., Herrerias-Diego, Y., Medina-Nava, M., Madrigal-Guridi, X., Campos-Mendoza, A., Domínguez- Domínguez, O., & Caballero-Vázquez, J.A. 2016. Spatio-temporal variation in the diet composition of red lionfish, Pterois volitans, (Actinopterygii: Scorpaeniformes: Scorpaenidae), in the Mexican Caribbean: insights into the ecological effect of the alien invasion. Acta Ichthyologica et Piscatoria 46(3): 185-200.
  50. Valdez-Moreno, M.; Quintal-Lizama, C.; Gómez-Lozano, R.; & del Carmen García-Rivas, M. 2012. Monitoring an Alien Invasion: DNA Barcoding and the Identification of Lionfish and Their Prey on Coral Reefs of the Mexican Caribbean. PLoS ONE 2012, 7(6), e36636. [CrossRef]
  51. Sandel V, Martinez-Fernandez D, Wangpraseurt D, & Sierra L 2015. Ecology and management of the invasive lionfish Pterois volitans/miles complex (Perciformes: Scorpaenidae) in Southern Costa Rica. 2: Rev Biol Trop 63(1).
  52. Mun˜oz RC, Currin CA, & Whitfield PE. 2011. Diet of invasive lionfish on hard bottom reefs of the Southeast USA: insights from stomach contents and stable isotopes. Mar Ecol Prog Ser 432:181–193. [CrossRef]
  53. Šantić, M.; Pallaoro, A.; Stagličić, N.; Markov-Podvinski, M. Feeding Habits of the red scorpionfish, Scorpaena scrofa (Osteichthyes: Scorpaenidae) from the eastern central Adriatic Sea. Cah. Biol. Mar. 2011, 52(2), 217–226. [Google Scholar] [CrossRef]
  54. Kampouris, T.E.; Koutsoubas, D.; Milenkova, D.; Economidis, G.; Tamvakidis, S.; & Batjakas, I.E. 2020. New Data on the Biology and Fisheries of the Threatened Palinurus elephas (Fabricius, 1787) (Decapoda, Achelata, Palinuridae) from the North-West Aegean Sea, Greece. Water 2020, 12(9), 2390. [CrossRef]
  55. Kleiven, A.R. , Olsen, E. M. & Vølstad, J.H. 2012. Total catch of a red-listed marine species is an order of magnitude higher than official data. PLoS ONE 2012, 7, e31216. [Google Scholar] [CrossRef]
  56. La Mesa, G. , La Mesa, M. , & Tomassetti, P.2007. Feeding habits of the Madeira rockfish Scorpaena maderensis from central Mediterranean Sea. Mar. Biol. 2007, 150, 1313–1320. [Google Scholar] [CrossRef]
  57. Ordines, F.; Valls, M.; Gouraguine, A. Biology, feeding and habitat preferences of Cadenat’s rockfish, Scorpaena loppei (Actinopterygii: Scorpaniformes: Scorpanidae), in the Balearic Islands (western Mediterranean). Acta Ichthyol. Piscat. 2012, 42(1), 21-30. Acta Ichthyol. Piscat. 2012, 42(1), 21–30. [Google Scholar] [CrossRef]
  58. Demirhan, S.A. & Can, M. F. 2009. Age, growth and food composition of Scorpaena porcus (Linnaeus, 1758) in the southeastern Black Sea. J. Appl. Ichthyol. 2009, 25, 215–218. [Google Scholar] [CrossRef]
  59. Compaire, J.C.; Casademont, P.; Cabrera, R.; Gómez-Cama, C.; & Soriguer, M.C. 2018. Feeding of Scorpaena porcus (Scorpaenidae) in intertidal rock pools in the Gulf of Cadiz (NE Atlantic). J. Mar. Biolog. Assoc. U.K. 2018, 98(4), 845-853. [CrossRef]
  60. Omri, N.; Derbal, F.; & Kara, M.H. 2019. Diet of the black scorpionfish Scorpaena porcus (Scorpaenidae) of the gulf of Annaba, Algeria. Cybium 2019, 43(2), 179-186. [CrossRef]
  61. Aydin, M.; & Mazlum, R.E. ; & Mazlum, R. E. 2020. Feeding ecology of black scorpion fish (Scorpaena porcus Linnaeus, 1758) in SE Black Sea region, (Ordu) Turkey. J. Mar. Biolog. Assoc. U.K. 2020, 100, 435–444. [Google Scholar] [CrossRef]
  62. Sahin, C.; Erbay, M.; Kalayci, F.; Ceylan, Y.; & Yesilcicek, T. 2019. Life-History Traits of the Black Scorpionfish (Scorpaena porcus) in Southeastern Black Sea. Turk. J. Fish. & Aquat. Sci. 2019, 19(7), 571-584. [CrossRef]
  63. Eddy C, Pitt J, Morris JA Jr, Smith S, Goodbody-Gringley G, & Bernal D. 2016. Diet of invasive lionfish (Pterois volitans and P. miles) in Bermuda. Mar. Ecol. Prog. Ser. 2016, 558, 193–206. [CrossRef]
  64. Galanidi, M. , Zenetos A., Bacher S. 2018. Assessing the socio-economic impacts of priority marine invasive fishes in the Mediterranean with the newly proposed SEICAT methodology. Mediterranean Marine Science 19 (1): 107–123. [CrossRef]
  65. Albins, M.A. & M.A. Hixon. 2011. Worst case scenario: potential long—term effects of invasive predatory lionfish (Pterois volitans) on Atlantic and Caribbean coral—reef communities. [CrossRef]
  66. Morris, J.A., Jr. L. Akins, A. Barse, D. Cerino, D.W. Freshwater, S.J. Green, R.C. Muñoz, C. Paris, and P.E. Whitfield. 2009. Biology and ecology of the invasive lionfishes, Pterois miles and Pterois volitans. Proceedings of the Gulf and Caribbean Fisheries Institute 61:409—414.
  67. Arias—González, J.E., C. González—Gándara, J.L. Cabrera, & V.Christensen. 2011. Predicted impact of the invasive lionfish Pterois volitans on the food web of a Caribbean coral reef. Environmental Research 111:917—925. [CrossRef]
  68. Rocha, L.A. , Rocha C.R., Baldwin C.C., Weigt L.A., & McField M. 2015. Invasive lionfish preying on critically endangered reef fish. Coral Reefs 34 (3): 803–806. [CrossRef]
  69. Ballew NG, Bacheler NM, Kellison GT, & Schueller AM. 2016. Invasive lionfish reduce native fish abundance on a regional scale. Sci Rep 6:32169. [CrossRef]
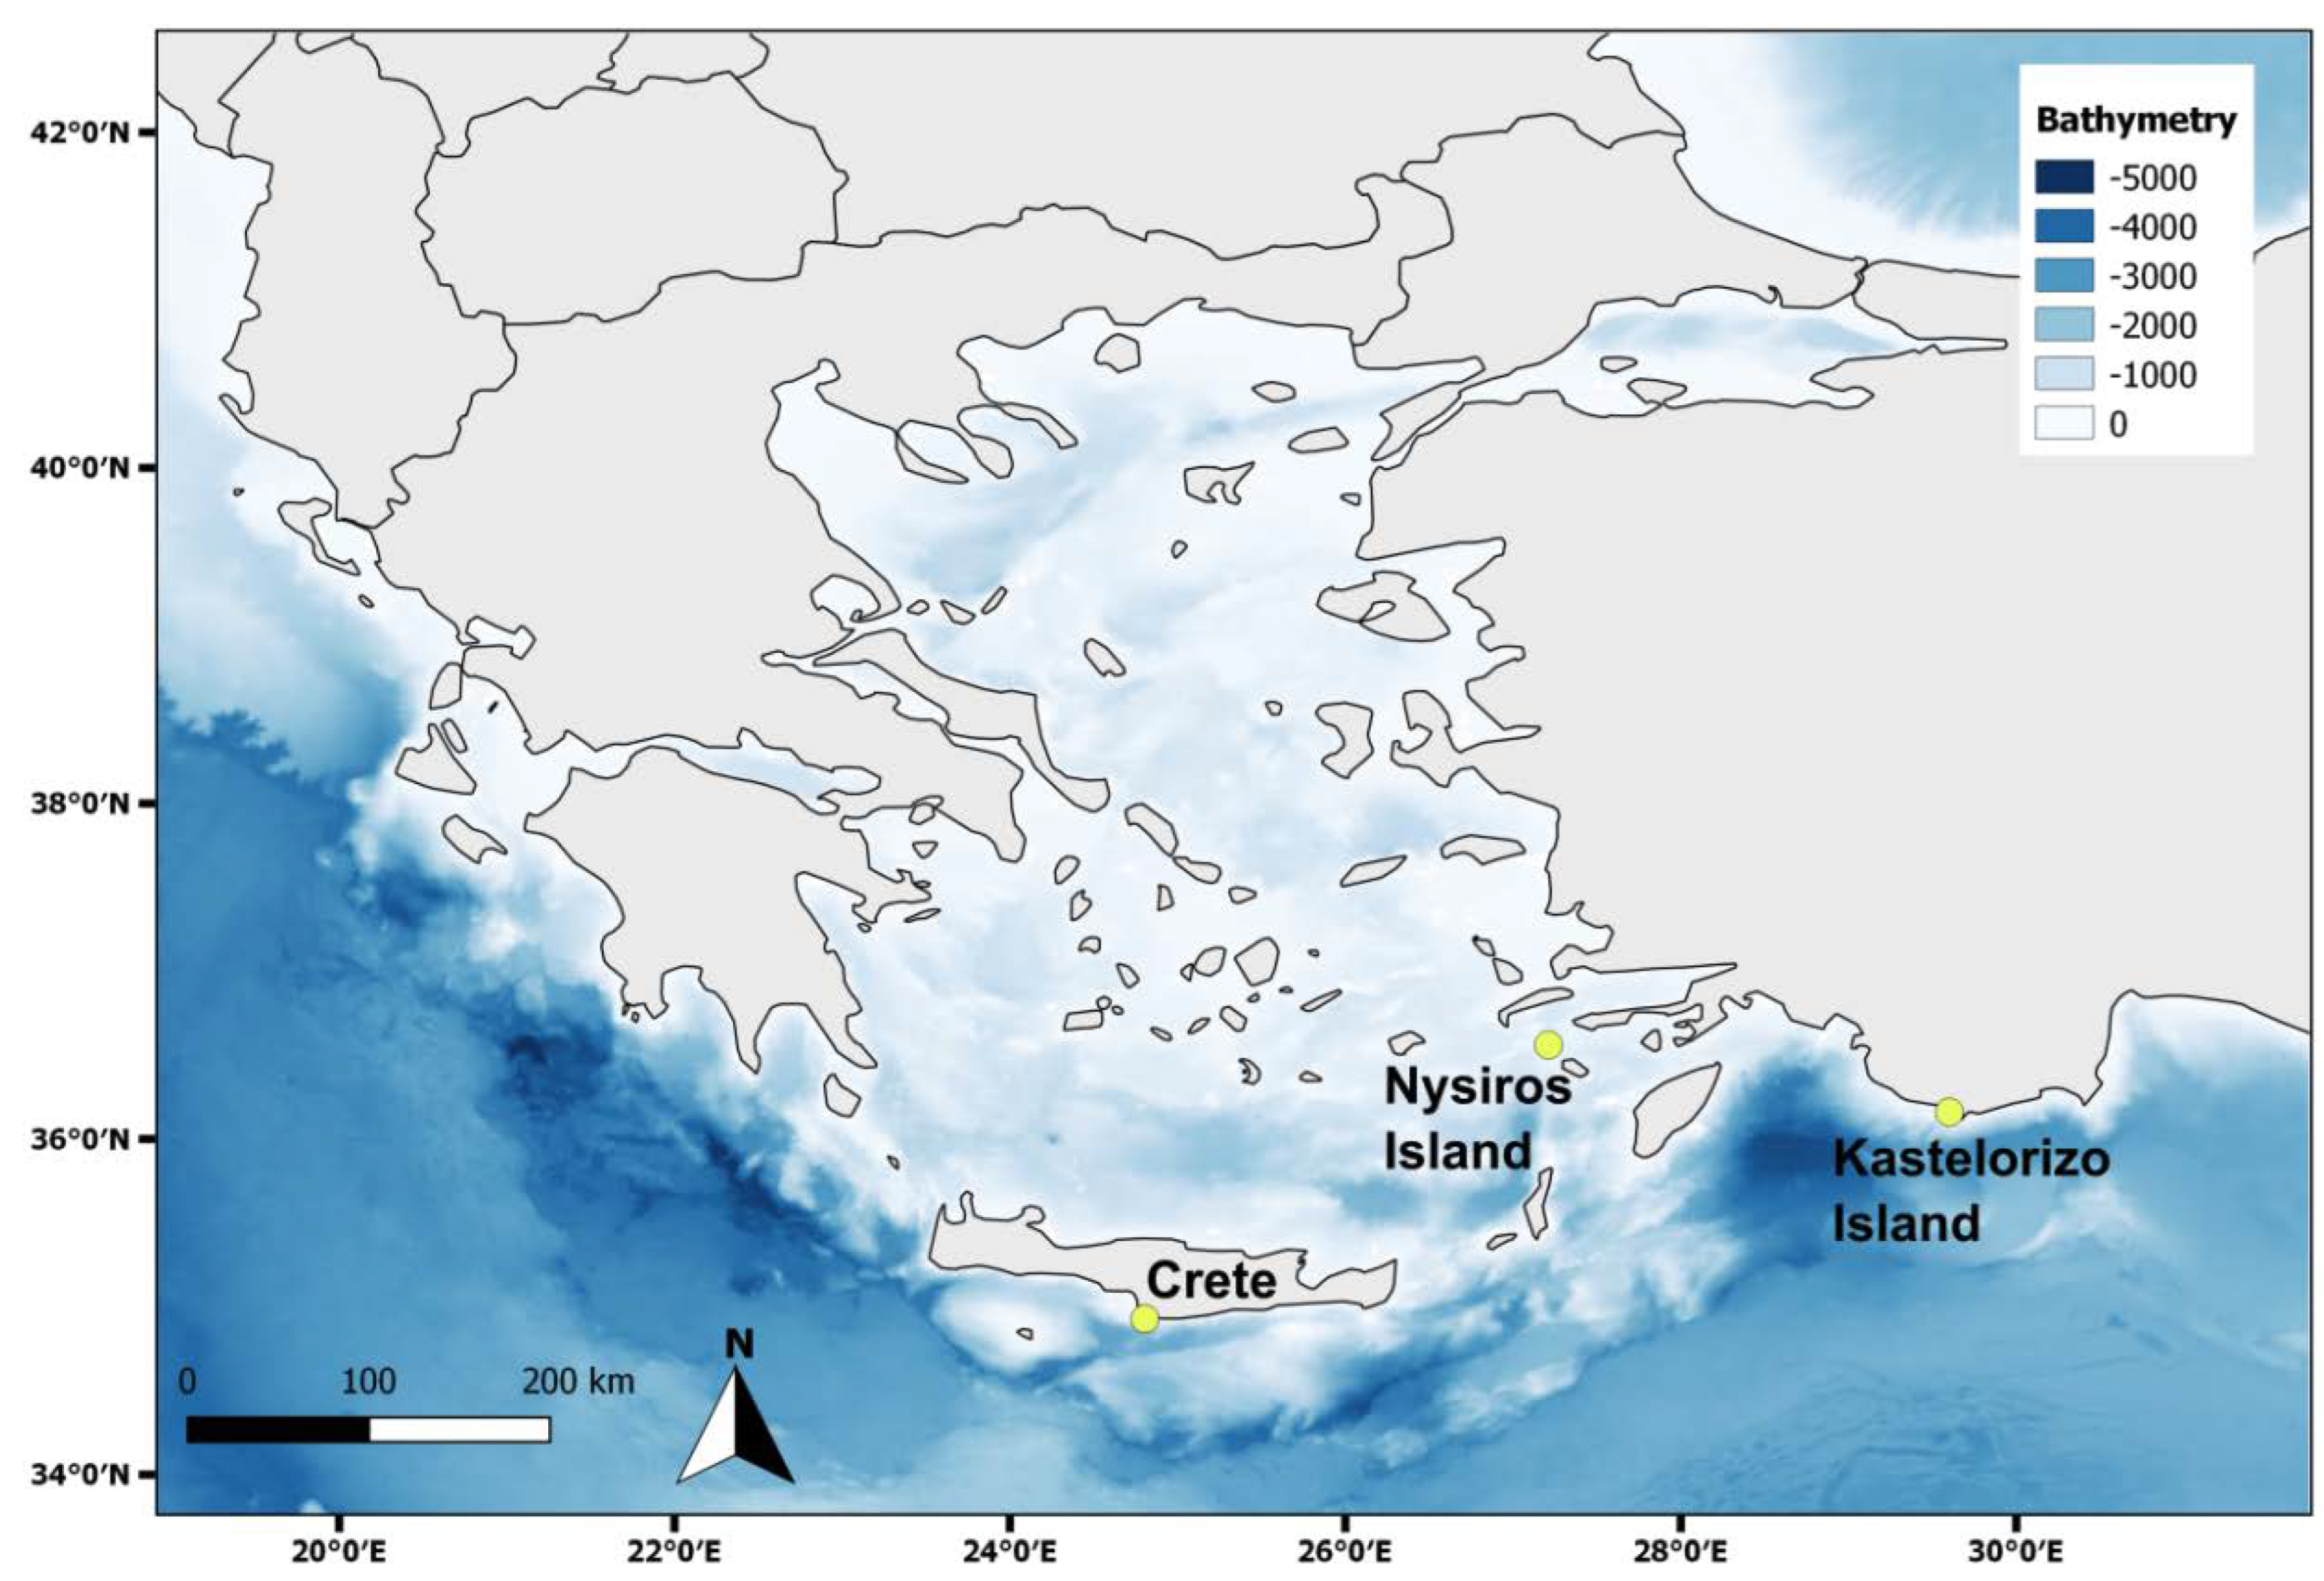
Figure 1. Approximate sampling location of Pterois miles in southern Greece.
Preprints 73668 g001
Figure 2. Plots of the expected (mean) number of prey taxa as a function of the cumulative number of P. miles stomachs examined (prey accumulation curves) for the whole dataset and separately for Nisyros, Kastellorizo and Crete.
Preprints 73668 g002
Figure 3. Variations of the frequency of occurrence (%F) of the P. miles prey groups between areas, sex and size classes, and for the whole dataset. Σε τι αντιστοιχούν τα N, C, K, F, M, U, S, L;.
Preprints 73668 g003
Figure 4. Treemap plots presenting the variations of the relative numerical abundance (%N) of the P. miles prey taxa and groups between areas.
Preprints 73668 g004
Figure 5. nMDS ordination plot of the P. miles stomach samples, colored by area (N = Nisyros Island, K = Kastellorizo Island, C = Crete).
Preprints 73668 g005
Figure 6. Modified Costello graphical analysis of the P. miles diet for the whole dataset and separately for each area. Relative abundance of prey taxon i (pi) is plotted in the charts against its frequency of occurrence (%F).
Preprints 73668 g006aPreprints 73668 g006b
Table 1. Total number of stomachs and percentages of full and empty stomachs (= VI) of P. miles for each area, sex (Female, Male, Unknown) and size class (Small, Large).
Factor Levels Total Full % Empty % (= VI)
Area Crete 73 77% 23%
Kastellorizo 31 84% 16%
Nisyros 37 62% 38%
Sex F 78 78% 22%
M 15 60% 40%
U 48 73% 27%
Size S 68 76% 24%
L 73 73% 27%
Grand Total 141 74% 26%
Table 2. Mean values of the P. miles repletion index (0/00) for each area, sex and size class.
Sex Size Nisyros Kastellorizo Crete
F 31.83 315.07 171.12
S 27.66 294.77 210.83
L 32.66 330.30 103.39
M 27.19 187.33
S 126.32
L 27.19 614.39
U 96.94 230.66 83.19
S 23.50 166.26 100.78
L 121.42 311.17 61.20
Area 52.07 257.60 138.60
Table 3. Results of the one-way SIMPER analysis comparing areas in terms of the P. miles diet composition. The table presents area typifying species and species contributing most to the between areas dissimilarities up to a 90% cut-off value.
One-way SIMPER analysis
Group N (Average similarity: 34,59)
Species Av.Abund Av.Sim Sim/SD Contrib% Cum.%
fish remains 0,80 32,91 0,79 95,14 95,14
Group C (Average similarity: 29,05)
Species Av.Abund Av.Sim Sim/SD Contrib% Cum.%
fish remains 0,73 27,19 0,74 93,60 93,60
Group K (Average similarity: 26,60)
Species Av.Abund Av.Sim Sim/SD Contrib% Cum.%
Plesionika edwarsii 0,91 15,56 0,53 58,51 58,51
Plesionika spp. 0,91 9,28 0,35 34,90 93,41
Groups N & C (Average dissimilarity = 69,17)
Group N Group C
Species Av.Abund Av.Abund Av.Diss Diss/SD Contrib% Cum.%
fish remains 0,80 0,73 23,30 1,09 33,69 33,69
Caridea 0,15 0,02 5,05 0,39 7,30 40,98
Scyllarus sp. 0,00 0,13 4,02 0,35 5,81 46,80
Scyllaridae 0,00 0,14 3,89 0,37 5,63 52,42
Pterois sp. 0,09 0,00 3,53 0,30 5,10 57,52
Cumacea 0,09 0,00 3,53 0,30 5,10 62,63
Gobidae 0,10 0,04 2,96 0,34 4,29 66,91
Scyllarides latus 0,00 0,12 2,89 0,29 4,18 71,09
Labridae 0,10 0,00 2,79 0,29 4,04 75,13
Homola barbata 0,00 0,08 2,11 0,26 3,04 78,18
Decapoda 0,04 0,00 1,76 0,21 2,55 80,73
Polychaeta 0,00 0,06 1,65 0,23 2,39 83,12
Chromis sp. 0,00 0,04 1,50 0,18 2,18 85,29
Parapenaeus longirostris 0,00 0,04 1,29 0,18 1,87 87,16
Inachus sp. 0,00 0,04 1,19 0,18 1,72 88,88
Ostracoda 0,00 0,03 0,95 0,13 1,38 90,26
Groups N & K (Average dissimilarity = 93,62)
Group N Group K
Species Av.Abund Av.Abund Av.Diss Diss/SD Contrib% Cum.%
Plesionika edwarsii 0,00 0,91 26,14 0,91 27,92 27,92
Plesionika spp. 0,00 0,91 23,09 0,71 24,67 52,59
fish remains 0,80 0,21 21,39 1,12 22,84 75,43
Natantia 0,00 0,27 6,06 0,40 6,48 81,91
Caridea 0,15 0,00 3,72 0,37 3,97 85,88
Pterois sp. 0,09 0,00 2,86 0,29 3,06 88,94
Cumacea 0,09 0,00 2,86 0,29 3,06 92,00
Groups C & K (Average dissimilarity = 93,68)
Group C Group K
Species Av.Abund Av.Abund Av.Diss Diss/SD Contrib% Cum.%
Plesionika edwarsii 0,00 0,91 24,18 0,90 25,81 25,81
Plesionika spp. 0,03 0,91 21,79 0,72 23,26 49,08
fish remains 0,73 0,21 19,08 1,07 20,37 69,44
Natantia 0,00 0,27 5,63 0,40 6,00 75,45
Scyllaridae 0,14 0,04 3,57 0,40 3,81 79,26
Scyllarus sp. 0,13 0,00 3,14 0,35 3,35 82,61
Scyllarides latus 0,12 0,00 2,35 0,29 2,51 85,12
Homola barbata 0,08 0,00 1,68 0,26 1,79 86,91
Polychaeta 0,06 0,00 1,33 0,23 1,42 88,33
Ostracoda 0,03 0,04 1,27 0,21 1,36 89,69
Chromis sp. 0,04 0,00 1,16 0,18 1,24 90,93
Disclaimer/Publisher’s Note: The statements, opinions and data contained in all publications are solely those of the individual author(s) and contributor(s) and not of MDPI and/or the editor(s). MDPI and/or the editor(s) disclaim responsibility for any injury to people or property resulting from any ideas, methods, instructions or products referred to in the content.
Copyright: This open access article is published under a Creative Commons CC BY 4.0 license, which permit the free download, distribution, and reuse, provided that the author and preprint are cited in any reuse.
Prerpints.org logo

Preprints.org is a free preprint server supported by MDPI in Basel, Switzerland.

Subscribe

© 2024 MDPI (Basel, Switzerland) unless otherwise stated