Submitted:
15 May 2023
Posted:
16 May 2023
You are already at the latest version
Abstract
Keywords:
1. Introduction
2. Results and Discussion
2.1. Methodology of Hydrogen Peroxide Assay
2.2. Hydrogen Peroxide is Generated in Herbal Infusions
2.3. Mechanism of Hydrogen Peroxide Generation
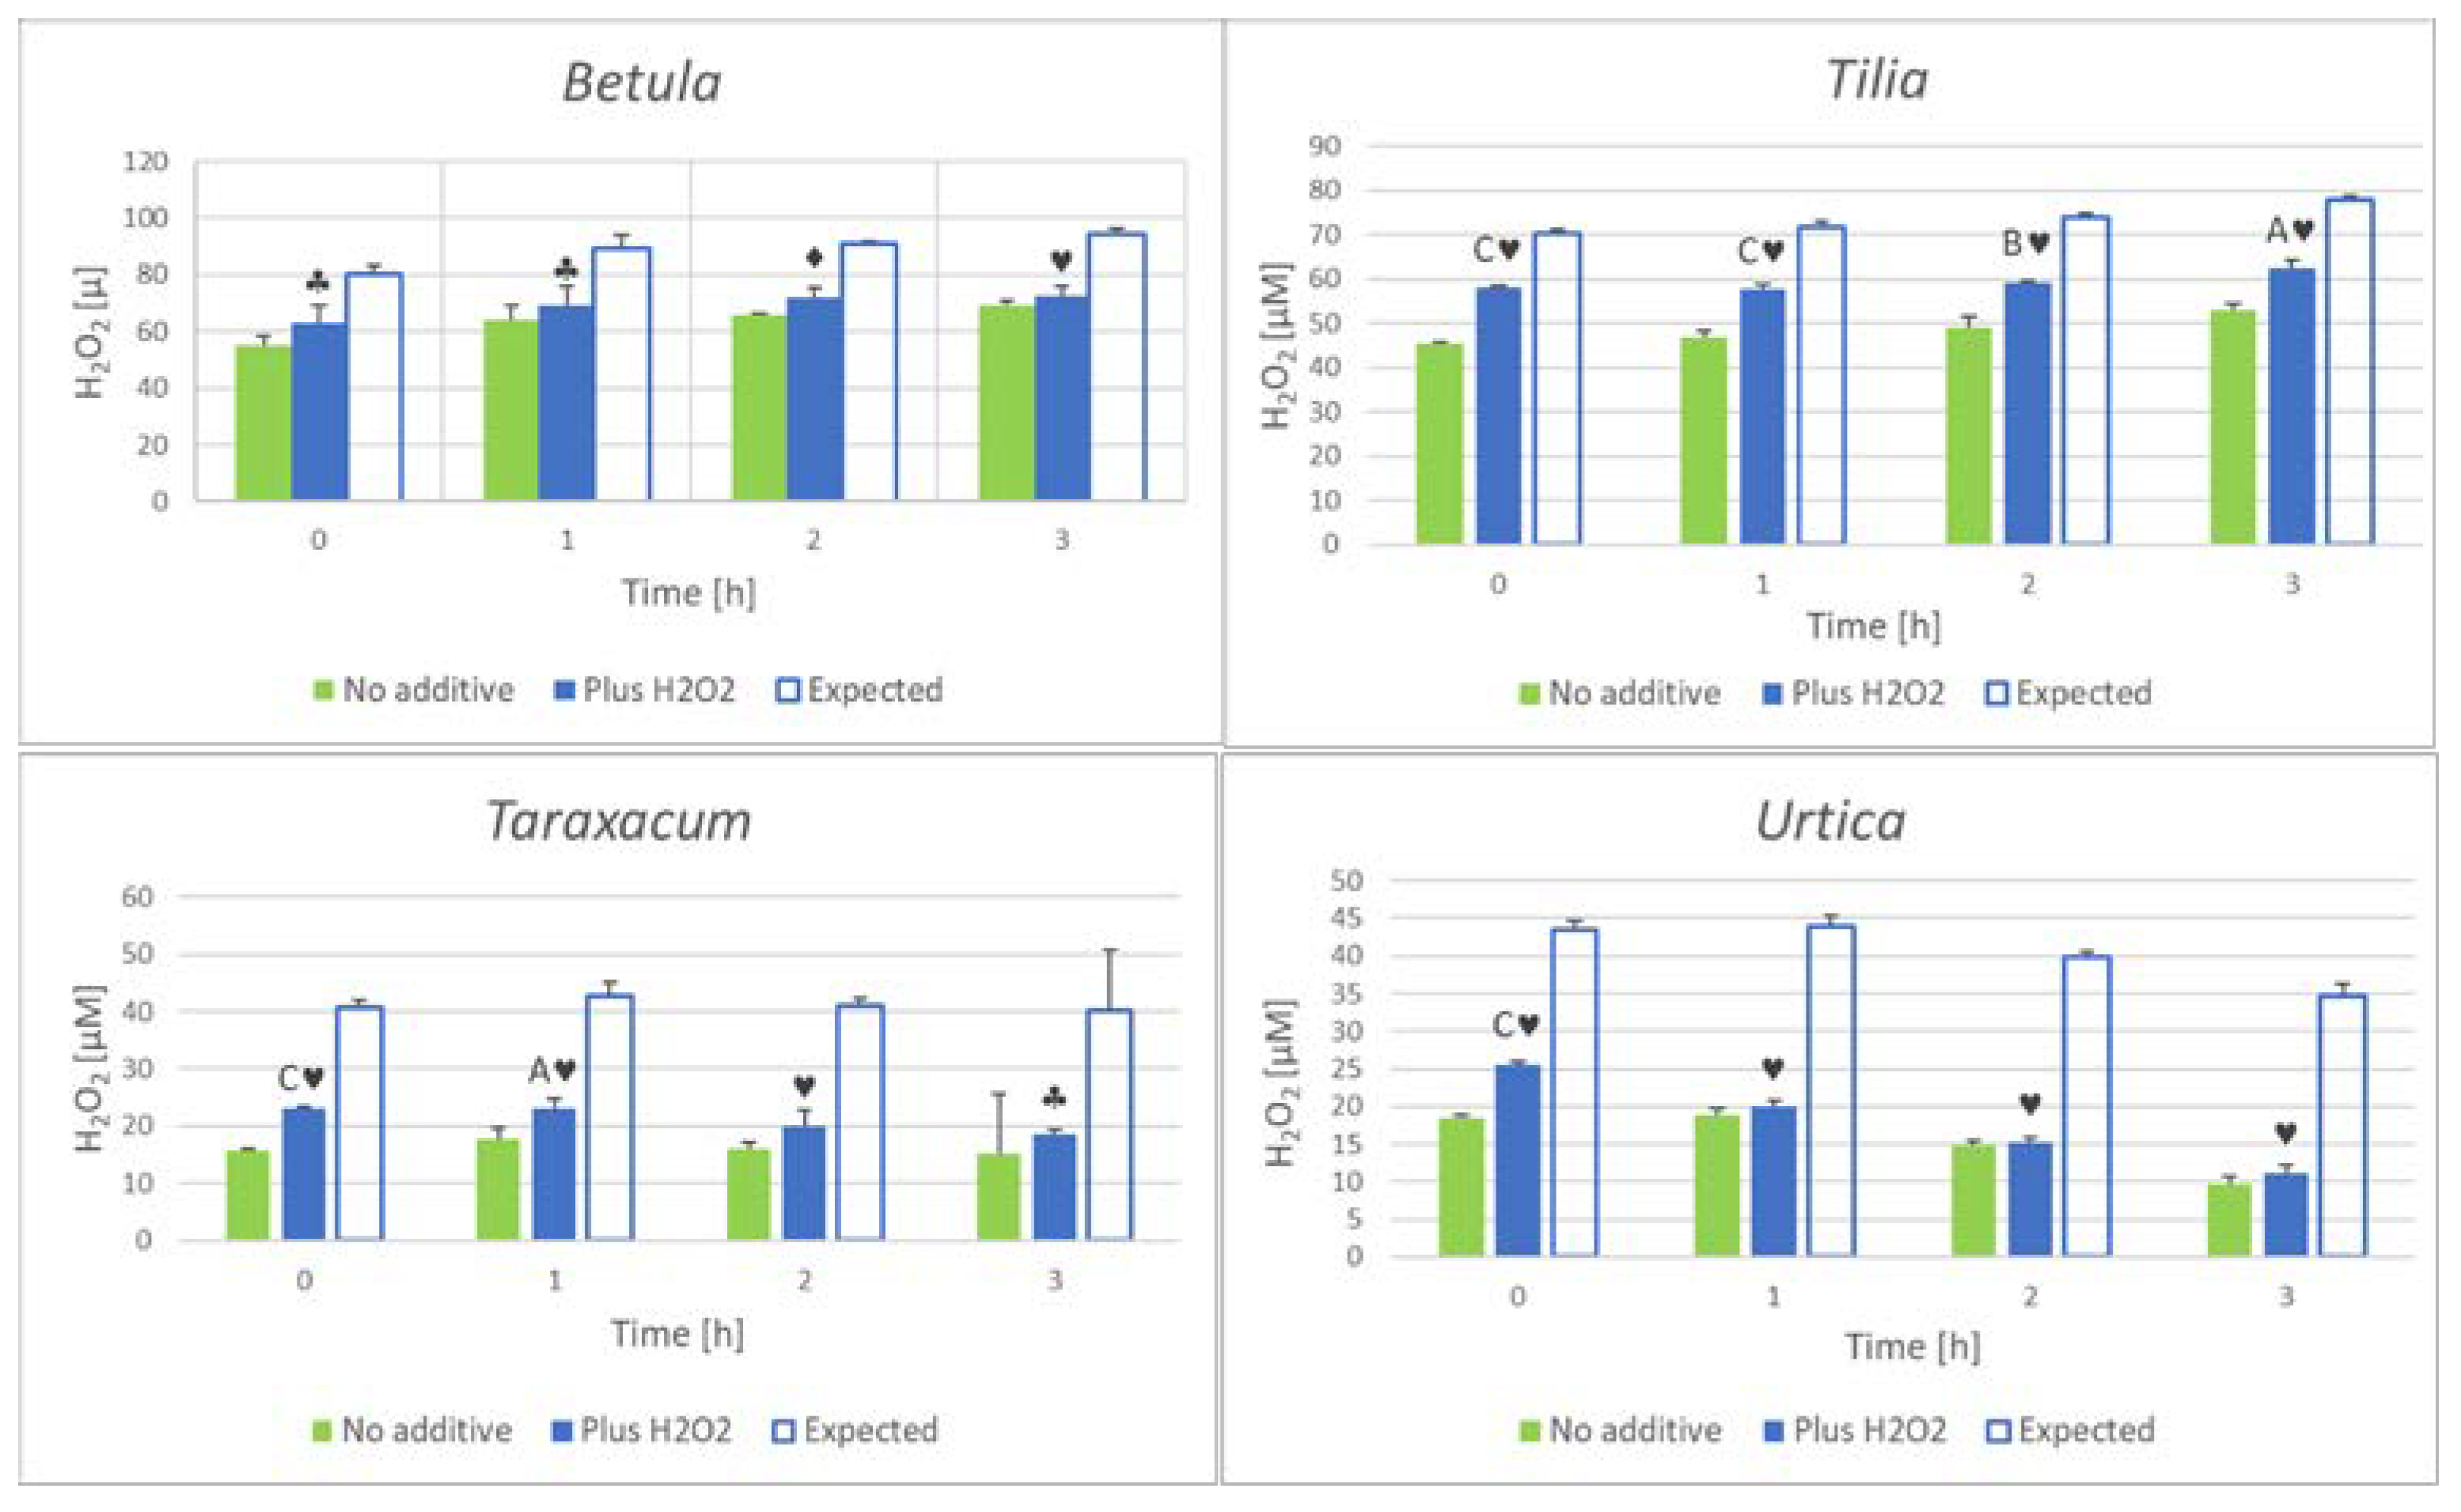
3.3. Herbal Infusions Scavenge Hydrogen Peroxide
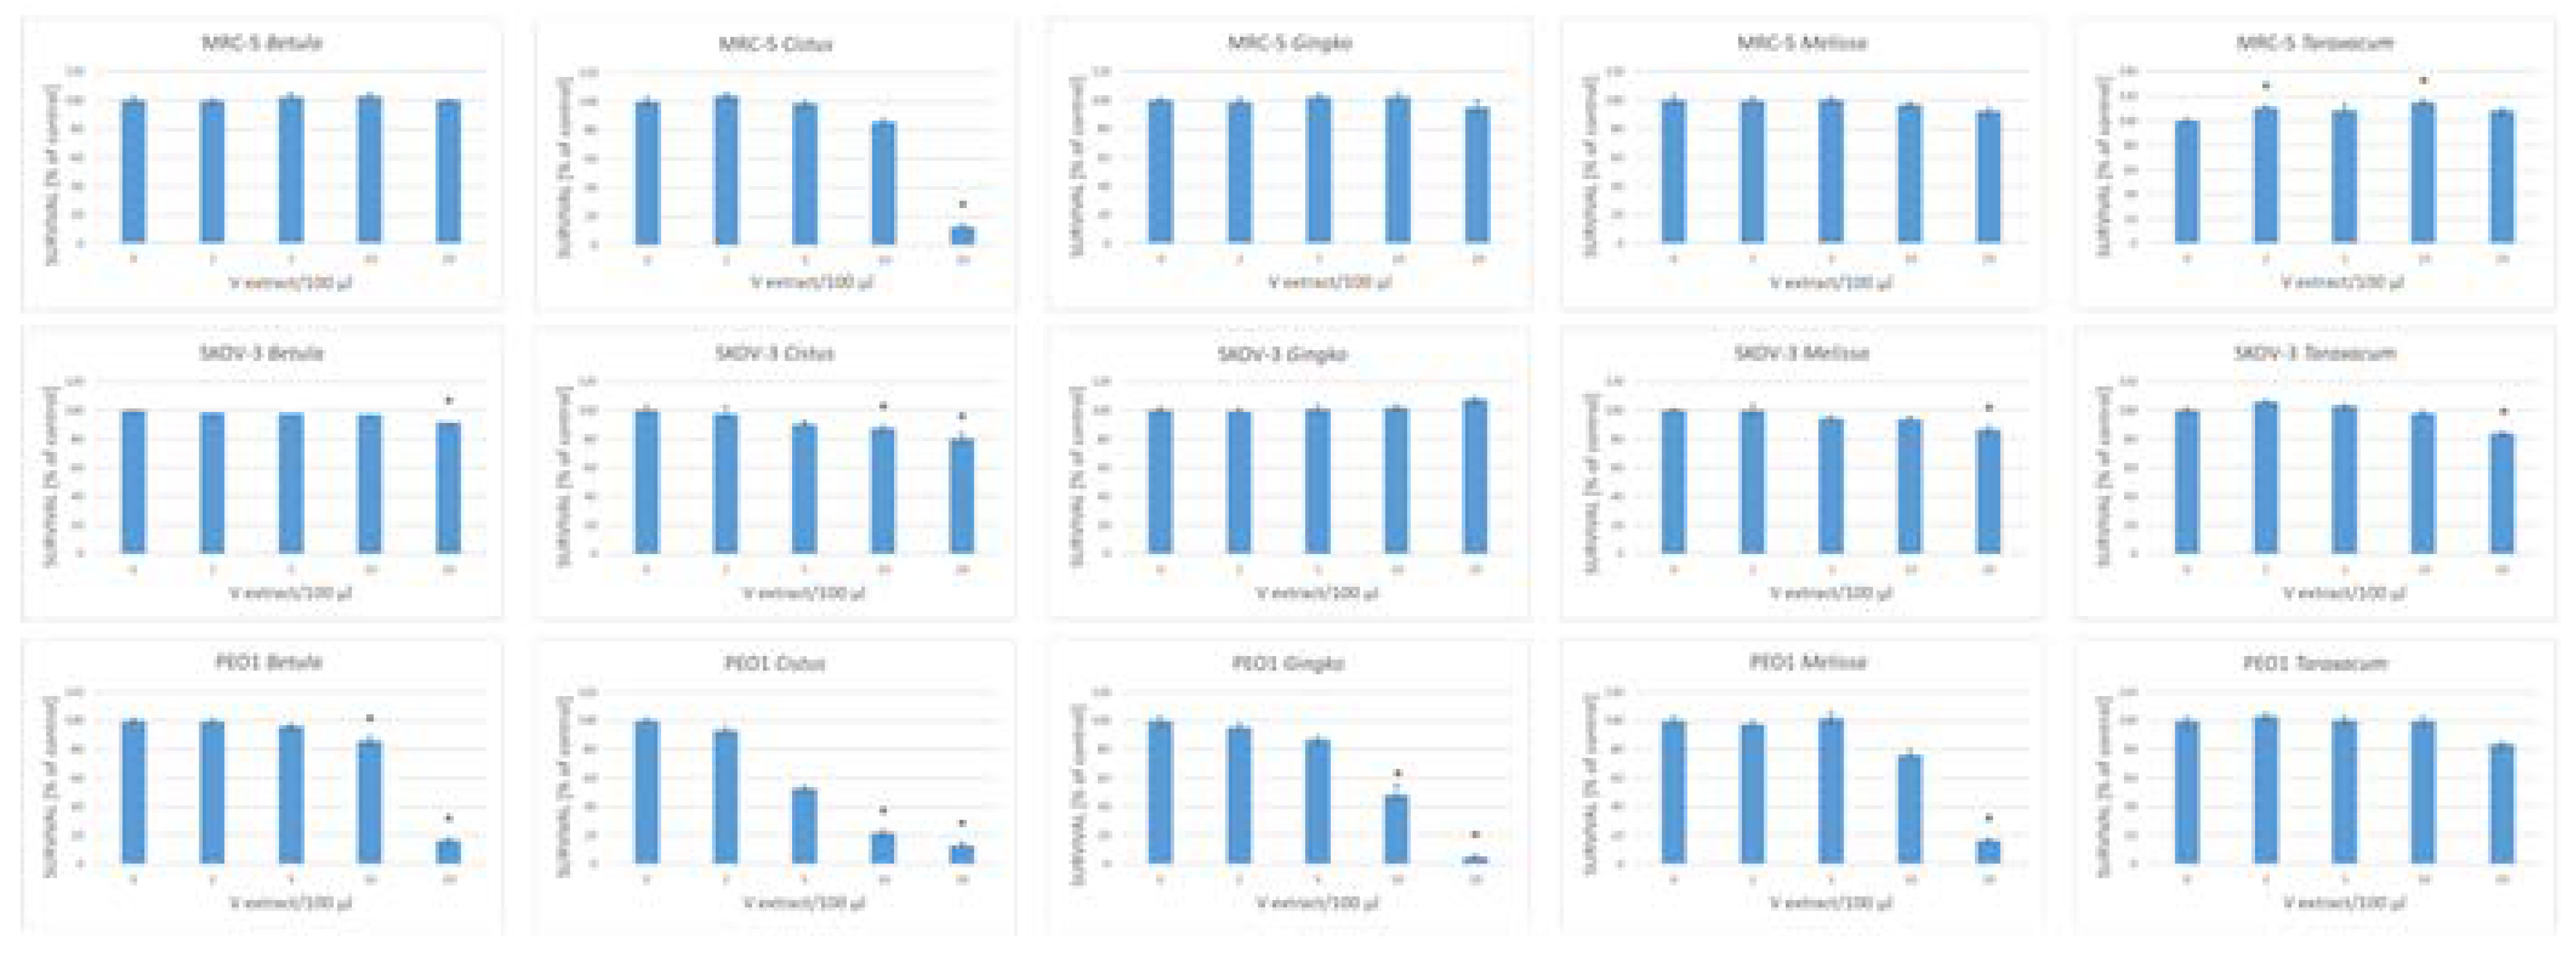
2.4. Hydrogen Peroxide Contributes to the Cytotoxic Action of Herbal Infusions
3. Materials and Methods
3.1. Materials
3.2. Plant Material
3.3. Preparation of Infusions
3.4. Determination of Hydrogen Peroxide
3.5. Detection of Semiquinone Radicals
3.6. Detection of Superoxide Generation
3.7. Cell Culture
3.8. Estimation of Cytotoxicity of Herbal Infusions
3.9. Effect of Catalase on the Cytotoxicity of Herbal Infusions
3.10. Statistical Analysis
4. Conclusions
Author Contributions
Funding
Institutional Review Board Statement
Informed Consent Statement
Data Availability Statement
Acknowledgments
Conflicts of Interest
References
- Akagawa, M.; Shigemitsu, T.; Suyama, K. Production of hydrogen peroxide by polyphenols and polyphenol-rich beverages under quasi-physiological conditions. Biosci. Biotechnol. Biochem. 2003, 67(12), 2632–2640. [Google Scholar] [CrossRef] [PubMed]
- Arakawa, H.; Maeda, M.; Okubo, S.; Shimamura, T. Role of hydrogen peroxide in bactericidal action of catechin. Biol. Pharm. Bull. 2004, 27(3), 277–281. [Google Scholar] [CrossRef]
- Grzesik, M.; Bartosz, G.; Stefaniuk, I.; Pichla, M.; Namieśnik, J.; Sadowska-Bartosz, I. Dietary antioxidants as a source of hydrogen peroxide. Food Chem. 2019, 278, 692–699. [Google Scholar] [CrossRef] [PubMed]
- Wang, J.Q.; Gao, Y.; Long, D.; Yin, J.F.; Zeng, L.; Xu, Y.Q.; Xu, Y.Q. Effects Effects of Hydrogen Peroxide Produced by Catechins on the Aroma of Tea Beverages. Foods, 2022, 11(9), 1273.
- Hegele, J.; Münch, G.; Pischetsrieder, M. Identification of hydrogen peroxide as a major cytotoxic component in Maillard reaction mixtures and coffee. Mol. Nutr. Food Res. 2009, 53(6), 760–769. [Google Scholar] [CrossRef]
- Fujita, Y.; Wakabayashi, K.; Nagao, M.; Sugimura, T. Implication of hydrogen peroxide in the mutagenicity of coffee. Mut. Res. Lett. 1985, 144(4), 227–230. [Google Scholar] [CrossRef] [PubMed]
- Nagao, M.; Fujita, Y.; Wakabayashi, K.; Nukaya, H.; Kosuge, T.; Sugimura, T. Mutagens in coffee and other beverages. Environ. Health Perspect. 1986, 67, 89–91. [Google Scholar] [CrossRef]
- Bartosz, G.; Baran, S.; Grzesik-Pietrasiewicz, M.; Sadowska-Bartosz, I. The antioxidant capacity and hydrogen peroxide formation by black and orange carrots. Agric. Food Sci. 2022, 31(2), 71–77. [Google Scholar] [CrossRef]
- Bartosz, G.; Rajzer, K.; Grzesik-Pietrasiewicz, M.; Sadowska-Bartosz, I. Hydrogen peroxide is formed upon cooking of vegetables. Acta Biochim. Pol. 2022, 69(2), 471–474. [Google Scholar] [CrossRef]
- Chai, P.C.; Long, L.H.; Halliwell, B. Contribution of hydrogen peroxide to the cytotoxicity of green tea and red wines. Biochem. Biophys. Res. Commun. 2003, 304(4), 650–654. [Google Scholar] [CrossRef]
- Tama, A.; Bartosz, G.; Sadowska-Bartosz, I. Is hydrogen peroxide generated in wine? Food Biosci. 2022, 45, 101487. [Google Scholar] [CrossRef]
- Sies, H.; Jones, D.P. Reactive oxygen species (ROS) as pleiotropic physiological signalling agents. Nat. Rev. Mol. Cell Biol. 2020, 21(7), 363–383. [Google Scholar] [CrossRef]
- Sies, H.; Belousov, V.V.; Chandel, N.S.; Davies, M.J.; Jones, D.P.; Mann, G.E.; Murphy, M.P.; Yamamoto, M.; Winterbourn, C. (2022). Defining roles of specific reactive oxygen species (ROS) in cell biology and physiology. Nat. Rev. Mol. Cell Biol. 2022, 23(7), 499-515.
- Ali, S.S.; Kasoju, N.; Luthra, A.; Singh, A.; Sharanabasava, H.; Sahu, A.; Bora, U. Indian medicinal herbs as sources of antioxidants. Food Res. Int. 2008, 41(1), 1–15. [Google Scholar] [CrossRef]
- Dragland, S.; Senoo, H.; Wake, K.; Holte, K.; Blomhoff, R. Several culinary and medicinal herbs are important sources of dietary antioxidants. J. Nutr. 2003, 133(5), 1286–1290. [Google Scholar] [CrossRef]
- Matkowski, A.; Jamiołkowska-Kozlowska, W.; Nawrot, I. Chinese medicinal herbs as source of antioxidant compounds-where tradition meets the future. Curr. Med. Chem. 2013, 20(8), 984–1004. [Google Scholar]
- Wojcikowski, K.; Stevenson, L.; Leach, D.; Wohlmuth, H.; Gobe, G. Antioxidant capacity of 55 medicinal herbs traditionally used to treat the urinary system: a comparison using a sequential three-solvent extraction process. J. Altern. Complement. Med. 2007, 13(1), 103–109. [Google Scholar] [CrossRef]
- Gay, C.A.; Gebicki, J.M. Measurement of protein and lipid hydroperoxides in biological systems by the ferric-xylenol orange method. Anal. Biochem. 2003, 315(1), 29–35. [Google Scholar] [CrossRef]
- Perron, N.R.; Wang, H.C.; Deguire, S.N.; Jenkins, M.; Lawson, M.; Brumaghim, J.L. Kinetics of iron oxidation upon polyphenol binding. Dalton Trans. 2010, 39(41), 9982–9987. [Google Scholar] [CrossRef]
- Krych, J.; Gebicka, L. Catalase is inhibited by flavonoids. Int. J. Biol. Macromol. 2013, 58, 148–153. [Google Scholar] [CrossRef]
- Durak, I.; Ormeci, N.; Akyol, O.; Canbolat, O.; Kavutçu, M.; Bülbül, M. Adenosine deaminase 5'-nucleotidase xanthine oxidase superoxide dismutase and catalase activities in gastric juices from patients with gastric cancer ulcer and atrophic gastritis. Dig. Dis. Sci. 1994, 39(4), 721–728. [Google Scholar] [CrossRef]
- Toczewska, J.; Konopka, T. Activity of enzymatic antioxidants in periodontitis: A systematic overview of the literature. Dent. Med. Probl. 2019, 56(4), 419–426. [Google Scholar] [CrossRef]
- Caruso, A.A.; Del Prete, A.; Lazzarino, A.I. Hydrogen peroxide and viral infections: A literature review with research hypothesis definition in relation to the current covid-19 pandemic. Med. Hypoth. 2020, 144, 109910. [Google Scholar] [CrossRef] [PubMed]
- Hernandez, P.; Sager, B.; Fa, A.; Liang, T.; Lozano, C.; Khazzam, M. Bactericidal efficacy of hydrogen peroxide on Cutibacterium acnes. Bone Joint Res. 2019, 8(1), 3–10. [Google Scholar] [CrossRef] [PubMed]
- Di, J.; Zhang, J.; Cao, L.; Huang, T.T.; Zhang, J.X.; Mi, Y.N.; Xiao, X.; Yan, P.P.; Wu, M.L.; Yao, T.; Liu, D.Z.; Liu, J.; Cao, Y.X. Hydrogen Peroxide-Mediated Oxygen Enrichment Eradicates Helicobacter pylori In Vitro and In Vivo. Antimicrob. Agents Chemother. 2020, 64(5), e02192–e02219. [Google Scholar] [CrossRef]
- Fajardo, A.F.; Sobchak, C.; Shifrin, Y.; Pan, J.; Gonska, T.; Belik, J. Hydrogen peroxide promotes gastric motility in the newborn rat. Ped. Res. 2018, 84(5), 751–756. [Google Scholar] [CrossRef] [PubMed]
- Craven, P.A.; Pfanstiel, J.; DeRubertis, F.R. Role of reactive oxygen in bile salt stimulation of colonic epithelial proliferation. J. Clin. Invest. 1986, 77, 850–859. [Google Scholar] [CrossRef] [PubMed]
- Wolff, S.P.; Dean, R.T. Fragmentation of proteins by free radicals and its effect on their susceptibility to enzymic hydrolysis. Biochem. J. 1986, 234(2), 399–403. [Google Scholar] [CrossRef]
- Morsy, M.A.; Khaled, M.M. Novel EPR characterization of the antioxidant activity of tea leaves. Spectrochim. Acta A Mol. Biomol. Spectrosc. 2002, 58(6), 1271–1277. [Google Scholar] [CrossRef]
- Polovka, M.; Brezová, V.; Stasko, A. Antioxidant properties of tea investigated by EPR spectroscopy. Biophys. Chem. 2003, 106(1), 39–56. [Google Scholar] [CrossRef]
- Polat, M.; Korkmaz, M. Detection of irradiated black tea (Camellia sinensis) and rooibos tea (Aspalathus linearis) by ESR spectroscopy. Food Chem. 2008, 107(2), 956–961. [Google Scholar] [CrossRef]
- Çam, S.T.; Engin, B. Identification of irradiated sage tea (Salvia officinalis L.) by ESR spectroscopy. Radiat. Phys. Chem. 2010, 79(4), 540-544.
- Bournonville, C.F.; Díaz-Ricci, J.C. Quantitative determination of superoxide in plant leaves using a modified NBT staining method. Phytochem. Anal. 2011, 22(3), 268–271. [Google Scholar] [CrossRef]
- Wohlgemuth, H.; Mittelstrass, K.; Kschieschan, S.; Bender, J.; Weigel, H.J.; Overmyer, K.; Kangasjärvi, J.; Sandermann, H.; Langebartels, C. Activation of an oxidative burst is a general feature of sensitive plants exposed to the air pollutant ozone. Plant Cell Env. 2002, 25(6), 717–726. [Google Scholar] [CrossRef]
- Fink, B.; Laude, K.; McCann, L.; Doughan, A.; Harrison, D.G.; Dikalov, S. Detection of intracellular superoxide formation in endothelial cells and intact tissues using dihydroethidium and an HPLC-based assay. Am. J. Physiol. Cell Physiol. 2004, 287(4), C895–C902. [Google Scholar] [CrossRef] [PubMed]
- Zielonka, J.; Kalyanaraman, B. Hydroethidine- and MitoSOX-derived red fluorescence is not a reliable indicator of intracellular superoxide formation: another inconvenient truth. Free Radic. Biol. Med. 2010, 48(8), 983–1001. [Google Scholar] [CrossRef] [PubMed]
- Nazarewicz, R.R.; Bikineyeva, A.; Dikalov, S.I. Rapid and specific measurements of superoxide using fluorescence spectroscopy. J. Biomol. Screen. 2013, 18(4), 498–503. [Google Scholar] [CrossRef] [PubMed]
- Sroka, Z.; Cisowski, W. Hydrogen peroxide scavenging antioxidant and anti-radical activity of some phenolic acids. Food Chem. Toxicol. 2003, 41(6), 753–758. [Google Scholar] [CrossRef]
- Ozyürek, M.; Bektaşoğlu, B.; Güçlü, K.; Apak, R. Hydroxyl radical scavenging assay of phenolics and flavonoids with a modified cupric reducing antioxidant capacity (CUPRAC) method using catalase for hydrogen peroxide degradation. Anal. Chim. Acta 2008, 616(2), 196–206. [Google Scholar] [CrossRef]
- Babich, H.; Ackerman, N.J.; Burekhovich, F.; Zuckerbraun, H.L.; Schuck, A.G. Gingko biloba leaf extract induces oxidative stress in carcinoma HSC-2 cells. Toxicol. In Vitro. 2009, 23(6), 992–999. [Google Scholar] [CrossRef]
- Mohamed, I.K.; Osama, M.A.; Samiha, M.; Zahrat, E.M. Biochemical studies on Plantago major L. and Cyamopsis tetragonoloba L. Int. J. Biodivers. Conserv. 2011, 3, 83–91. [Google Scholar]
- Rezadoost, M.H.; Kumleh, H.H.; Ghasempour, A. Cytotoxicity and apoptosis induction in breast cancer, skin cancer and glioblastoma cells by plant extracts. Mol. Biol. Rep. 2019, 46(5), 5131–5142. [Google Scholar] [CrossRef]
- Oritani, T.; Fukuhara, N.; Okajima, T.; Kitamura, F.; Ohsaka, T. Electrochemical and spectroscopic studies on electron-transfer reaction between novel water-soluble tetrazolium salts and a superoxide ion. Inorgan. Chim. Acta 2004, 357(2), 436–442. [Google Scholar] [CrossRef]


Disclaimer/Publisher’s Note: The statements, opinions and data contained in all publications are solely those of the individual author(s) and contributor(s) and not of MDPI and/or the editor(s). MDPI and/or the editor(s) disclaim responsibility for any injury to people or property resulting from any ideas, methods, instructions or products referred to in the content. |
© 2023 by the authors. Licensee MDPI, Basel, Switzerland. This article is an open access article distributed under the terms and conditions of the Creative Commons Attribution (CC BY) license (http://creativecommons.org/licenses/by/4.0/).


