Submitted:
12 May 2023
Posted:
16 May 2023
You are already at the latest version
Abstract
A variety of factors ranging from ethnicity and occupants’ lifestyles to local climatic characteristics of any studied location and people’s age factors can affect thermal comfort assessment globally. Due to the detrimental impact of climate change, the building industry has started to implement energy efficiency schemes while considering the thermal comfort of vulnerable population both for the society and any sphere of economy. Although, considering human-based approaches have been neglected by other scholars in thermal comfort studies. This paper reviews energy effectiveness of state-of-the-art passive systems in providing neutral adaptive thermal comfort for elderly people, through exploring passive design strategies in four distinct climates namely, Canada, India, Abu Dhabi and the South-eastern Mediterranean basin. The aim of the study is to analyze the available data provided by the ASHRAE Global Thermal Comfort Database II version record 2.1. The main objective of the study is to develop an effective methodological framework for the on-going development of adaptive thermal comfort theory. To this extend, this study presents a comprehensive review on the assessment of energy effectiveness of passive design systems. To accomplish this, the impact of climate change factor in passive design systems was investigated. The meta-analysis method was adopted to determine the input variables for the statistical analysis. Cramer’s V and Fisher’s Exact tests were used to assess occupants’ thermal sensation votes (TSVs). The findings revealed that there are discrepancies detected between the in-situ field experiments and the data recorded in the ASHRAE Global Thermal Comfort Database II. According to the Köppen-Geiger climate classification, it was found from the study that the slightly high temperature fluctuations were identified in India where the weather is dry and savanna climate. The study findings contribute to the development of adaptive thermal comfort theory by reviewing the existing methodologies globally. Furthermore, a critical review on the significance of occupants’ age differences should be conducted in the identification of neutral adaptive thermal comfort.
Keywords:
ASHRAE
; climate change
; passive cooling
; thermal comfort
; thermal sensation
1. Introduction
The provision of thermal comfort in buildings to improve the health and overall well-being of elderly people has led to the development of advanced and economically viable building design systems, through energy saving targets (Mirrahimi et al., 2016). The vulnerable elderly people contribute to the balance of a technical assessment in the development of adaptive thermal comfort worldwide. Improving energy efficiency of building stock provides knowledge and learning experience to any affluent society therefor it is important to consider vulnerable elderly people’s health needs (Altomonte et al., 2020). Recent data indicates that the total population of the elderly in India increased by 2,7 % from 2001 to 2021 and this figure is expected to further increase by 3,0 % by 2031 due to the necessity for better living conditions and better medical care (Rawal et al., 2022). As a result, this steady increase has led to a rising demand for allocating vulnerable elderly population in nursery homes (Forcada et al., 2021). Awareness of climate change and future energy projections represent a foundation for the evolution of better heating and cooling designs in buildings (Dabaieh & Serageldin, 2020). Hence climate analysis and classification tools have been developed and are gradually modified to identify human thermal comfort ranges of people at different ages (Geronazzo et al., 2018).
Giamalaki and Kolokotsa (2019) investigated the thermal experience and adaptive thermal preference behaviors of the elderly people in Crete and Greece through a questionnaire survey. It was observed that the heating energy demand was higher than the cooling demand, indicating the preference of heat for elderly people. On the contrary, Baquero and Forcada (2022) highlighted that the experimental analysis is the utmost important to identify differences in thermal comfort perceptions for elderly people in different climates in five nursing homes in Spain. Although there was no difference in the neutral adaptive temperature of the elderly in different climates. Notably, it was found that thermal comfort ranges have shown differences. An in-depth study conducted by Zheng et al. (2022) was found that three different age groups have shown the possibility to reduce energy consumption while indoor air parameters were selected by considering different age groups in the population sample. In this regard, development of an adaptive model with a criterion for identifying thermal comfort parameters with different age groups is fundamental in thermal comfort studies.
According to the Center of the Built Environment (CBE) climate tool in 2022, Canada climate is identified with Köppen–Geiger climate classification type as humid continental, with no dry season and warm summer (Tartarini et al., 2020). The hottest yearly temperature is approximately 26,4 °C while the coldest yearly temperature is estimated at -27,6 °C, as shown in Figure 1 (a). The need for heating energy in Canada is therefore high, especially considering people of age 65 years or above. Application of passive systems in building design for insulation is necessary, however, performance of the system is crucial for meeting the thermal comfort range expectations for the elderly. The tropical wet and dry/savanna climate of India, with the hottest yearly temperature estimated at 37,0 °C and coldest yearly temperature of approximately 20,5 °C on average which is different from the subtropical desert climate of Abu Dhabi, as shown in Figure 1 (b) (Tartarini & Schiavon, 2020). It should be noted that Abu Dhabi experiences hot summers with the hottest temperatures reaching 43,0 °C on average while the lowest average temperature is approximately 12,0 °C, as shown in Figure 1(c) (c).
It should be noted that effective thermal comfort evaluation considers the moisture content of the air (Song et al., 2018). Several pilot studies also highlighted the importance of relative humidity, wet bulb-, and dry bulb- temperatures within the building space (Haldi & Robinson, 2010; Halawa & Van Hoof, 2012; Ozarisoy & Altan, 2021a). Hence the implementation of passive system designs must not only be economically feasible, but it should reflect thermally comfortable indoor air-quality. This study analyses three different climates’ impact on the development of adaptive thermal comfort. It also reviews the application of passive systems to aid for developing climate responsive nursing homes for vulnerable elderly population. This paper was set to execute the state-of-the-art methodological framework to identify knowledge gap in four lay terms namely, thermal comfort, indoor air quality assessment; passive heating and cooling and energy saving, as presented in Section 2. To this extend, the methodological framework was adopted to determine the data extracted from the American Society of Heating, Refrigerating and Air-Conditioning Engineers (ASHRAE) Global Thermal Comfort Database version record 2.1 in Section 3. Parametric data analysis was presented in conjunction with the field measurements in the South-eastern Mediterranean basin in Section 4. Discussion was delineated to provide an evidence-based roadmap to the on-going adaptive thermal comfort assessment in Section 5. Conclusions were drawn to demonstrate significance of research outputs in Section 6.
2. Systematic Literature Review
2.1. Thermal Comfort
In a field study conducted by Li et al. (2022) highlighted the importance of universal design approach to outline a baseline for the design and construction principles of thermally comfortable nursery homes for elderly people in Mongolia. According to the Li et al. (2022) adaptive thermal comfort model was identified in line with the Mongolian winter season for elderly people by considering subject respondents age differences factor. This pilot study was also investigated vulnerable elderly people’s thermal sensation votes (TSVs), thermal preference votes (TPVs) and their adaptive thermal comfort behavior to the occupied spaces in both naturally- and mechanically- ventilated buildings. Indoor thermal conditions of existing nursery homes were investigated through a long-term on-site environmental monitoring. In a pilot study conducted by Li et al. (2022) indoor thermal comfort satisfaction of 162 elderly people was questioned to determine the neutral adaptive thermal comfort in Mongolian climate.
The results indicated that age and clothing insulation level (clo) affect the thermal sensitivity of the human body. This could result in changes on the physiological adaptive behavior of subject respondents. It was also found that subject respondent’s clothing insulation level (clo) is the most determinant factor due to the tropical and subtropical steppe climate (BSk) characteristics of Mongolia. This pilot study was also found that there is a direct correlation between the clothing value and the thermal sensation votes of elderly people in the survey. However, the results presented in this pilot study indicated that the 80% acceptable temperature range of the elderly was found to be between 15,48–25,56 °C, and the thermal expectation temperature was identified at 21,09 °C which is extensively lower than the recommended winter thermal comfort ranges by the 2021 ASHRAE Handbook Fundamentals. Li et al. (2022) concluded that the standard deviation (SD) might has been a result of the discrepancies in the datasets due to the small size of the rural area population and fewer participants in the survey. Furthermore, the use of coal for heating in the rural areas of Mongolia might have affected the results of the study since the health effects of smoke and CO2 concentration cause other diseases which could alter thermal comfort expectations (Li et al., 2022).
Most recently, the development of adaptive ‘neutral’ thermal comfort of multi-family residential buildings in South-eastern Mediterranean Europe has been accredited by the University of California Berkeley which is the research output of the entitled ‘Assessing the Domestic Energy Use and Thermal Comfort of Occupants in a Post-war Social Housing Development Estate in Famagusta, Northern Cyprus’ (Ozarisoy, 2022). This approved research output to the ASHRAE Global Thermal Comfort Database II – records by country in version 2.1 of the database has been released. It combines sets of objective indoor environmental measurements with accompanying “right-here-right-now” subjective evaluations by occupants from buildings around the world. The database is intended to support diverse inquiries about thermal comfort in field settings. In this pilot study, it was found that the occupants’ thermal sensation votes’ findings that the “neutral” temperature was 28,5 °C and the upper limit of the comfort range in warm indoor air temperature conditions was 31,5 °C. The field study in the South-eastern Mediterranean climate of Cyprus is a unique context and a noteworthy addition to this public source. Anecdotally, the newly released ASHRAE dataset record provides significant contribution to this review paper while investigating the available extant methodological framework on the adaptive thermal comfort development. Hence, Table 1 demonstrates the global overview of thermal comfort studies.
The longitudinal field study conducted by Li et al. (2022) demonstrated that the neutral adaptive thermal comfort level was found to be at 20,52 °C for the vulnerable elderly people in Mongolia in the winter where the weather is tropical and subtropical steppe climate. Additionally, Yuan et al. (2022), conducted a similar study in the rural areas of China and discovered the adaptive thermal comfort temperature was at 16,74 °C in the cold climate of China. The study highlighted that there are distinct temperature variations identified for the development of neutral adaptive thermal comfort between Mongolian and Chinese climates. This deterministic factor could be related with the subject respondent’s cultural and lifestyle differences and their physiological body temperature adaptations to the local environmental conditions (ibid). To this extend, Yuan et al. (2022) suggested that the optimization of the building envelope could be achieved by increasing wall thickness and implementing appropriate fenestration design on those opaque window surfaces. These strategies are aimed to reduce excessive heat gains on building envelopes which are directly linked to reduce overheating risk in the summer.
Forcada et al. (2021) was selected 881 sample size to conduct the questionnaire survey. In this pilot study, an experimental analysis was conducted on studying the adaptive thermal comfort assessment of nursing homes in heated environments. The study findings indicated that the neutral adaptive thermal comfort was found to be at 21,6 °C for elderly people in the Mediterranean climate where the weather is subtropical (Cfa) and partially semi-arid (Bsh). This finding could be related with thermal preference differences of subject respondents recruited during the survey. It should be noted that the subject respondents’ have different day-to-day activities and health conditions which are linked with the identification of neutral adaptive thermal comfort. Notably, a greater energy demand was found for heating of nursing homes during the winter season (Forcada et al., 2021). The research findings highlighted the necessity for sustainable energy systems such as implementation of passive systems to reduce energy use and optimize occupants’ thermal comfort in nursing homes. Furthermore, elderly people are adaptive to different seasons with the help of supplementary clothing which provides insulation during the winter season. Although, this pilot study was found to be that clothing insulation level (clo) factor is not effective in extreme weather conditions so that the further field measurements should be conducted to fill this research gap in thermal comfort studies.
In India, the importance of climate is noticeable throughout thermal comfort studies, particularly naturally ventilated buildings due to the low indoor quality conditions were observed in existing buildings (Dhaka et al., 2015). To support this argument, Sharma et al. (2021) suggested that India’s tropical climate has shown variations throughout the country because of its large continental coverage. Hence, there is not only single thermal model applicable to identify neutral adaptive thermal comfort model and more field measurements are required.
Many researchers are decided to focus only one climate zone to investigate subject respondents’ TSVs with on-site or in-situ field measurements in order to validate the questionnaire survey findings (Indraganti et al., 2014; Djamila, 2017; De Dear et al., 2018). To avoid discrepancies on the development of adaptive thermal comfort, researchers should consider four other Indian climatic zones in their experimental analyses (Sharma et al., 2021). Baquero-Larriva et al. (2022) performed an analysis on the climate change effect on thermal comfort for elderly people in two different Mediterranean climates. The study was found that there is neither natural ventilation nor heating required to maintain thermally comfortable level in the oceanic climate type. The results also indicated that humidity has significant effect on thermal comfort in the South-eastern Mediterranean basin.
On the contrary, most researchers focused on the inclusion of operative air temperature into the statistical dataset rather than considering the significance of moisture content as a factorial analysis effect (Kaynakli & Kilic, 2005; Kim et al., 2018a; Li et al., 2019). Although Mukhopadhyay and Weitz (2022) studied the symptoms of heat exposure among elderly residents of urban slums and rural villages in West India to develop accurate adaptive thermal assessment in the summer. The study highlighted the heat exposure risk is the most deterministic factor on the identification of subject respondents’ TSVs. This is the reason that the effective cooling systems should be installed to mitigate with heat stress risk factor and the further studies should focus on exploring revival applicability of passive cooling systems in India (Mukhopadhyay & Weitz, 2022).
2.2. Indoor Thermal Comfort Parameters
The Web of Science Core Collection was used to highlight the significance of adaptive thermal comfort in buildings. A total of 306 publications were gathered from the Web of Science database platform. To this extend, both original research paper and review articles were selected to explore correlations between indoor air quality and subject respondents’ thermal comfort satisfaction globally. In the database analysis, the study only examined last 10 years of publications in line with the development of adaptive thermal comfort theory. The key word selection criteria were used and three lay terms were identified namely, operative air temperature (OP), relative humidity (RH) and heat stress index (HIS) factor to fulfil the knowledge gap in thermal comfort studies. The Vos viewer visualization tool was used to illustrate the findings. Figure 2 delineates the network visualization of determinant input variables. It can be seen that the air velocity is the most determinant factor in any type of thermal comfort research. The findings also demonstrate that subject respondents’ health condition is the most influential input parameter while assessing occupants’ thermal sensation votes.
Djamila (2017) indicated that adaptive thermal comfort models were scrutinized into two models namely predicted mean votes (PMVs) and thermal sensation votes (TSVs). Although, the PMV model is not included in the identification of differences between physiological, psychological adaptive and behavioral factors in naturally ventilated buildings. One of the main reasons is that it is difficult to identify occupants’ behavior on window opening habits so that this could result in controlling the air infiltration rate for the experimental analyses. To avoid any research bias in thermal comfort studies, predicting the thermal comfort has been validated by most scientists (De Dear et al., 2013; Duarte Roa et al., 2020; He et al., 2022). Implementation of adaptive thermal comfort models were highlighted the novel advancements in thermal comfort studies such as innovative state-of-the-art climate chambers or laboratory environments in order to provide accurate statistical findings (Kim et al., 2017). These conditions have shown variation with the location of any research context and climatic conditions of case study locations worldwide (Li et al., 2018b). For example, the PMV models are commonly used in cold climate zones to provide constant thresholds whereas adaptive models are mostly applied for warm climate conditions in order to generalize the research outputs effectively.
Rana et al. (2013) investigated the importance of humidity index factor and operative air temperature for the optimisation of occupants’ thermal comfort in different climate zones in Canada, India and Abu Dhabi. In this pilot study, both the operative air temperature and relative humidity were integrated into the climate chamber to develop psychometric chart for each selected case study location. The humidity index factor was chosen as control variable to measure the indoor air quality of the replicated local environment conditions in the climate chamber. The study was also evaluated the impact of climate change on the temperature fluctuations annually. This has led to predict the indoor thermal comfort by measuring its performance against the on-site monitored environmental conditions. However, Rana et al. (2013) indicated that the humidity index factor is commonly used to predict the outdoor thermal comfort. One of the main reasons is that it provides more feasible calculation methods for the regression analysis in thermal comfort studies. With this regard ASHRAE RP-884 database and ASHARE Likert scale assessment were adopted to optimize thermally comfortable indoor environments globally. Figure 3 (a)-(c) show the criteria of determining the range of humidity index factor, including the operative air temperatures which are aided to develop neutral adaptive thermal comfort. It must be stressed that the limitation of this criteria is that it does not consider the effect of wind velocity while assessing occupants’ TSVs.
Djamila (2017) emphasised that there is a lack of data to identify the accuracy of on-site environmental monitoring data in line with the adaptive thermal comfort theory which has been developed by Fanger in the 1970s. Many researchers proposed a new criterion to determine the thermal comfort ranges by considering the operative air temperature as control input variable (Ko et al., 2018; Landsman et al., 2018; Parkinson et al., 2020). Additionally, different criteria and methods were used in analyzing the ASHRAE RP-884 database. To accomplish this, operative air temperature and relative humidity were selected to conduct the statistical analysis (Ozarisoy & Altan, 2021b). It should be noted that the effect of air movement should be considered to measure the infiltration rate of occupied spaces, but many thermal comfort studies have been neglected to consider this aspect in their experimental analysis in the climate chamber (Rana et al., 2013; Parkinson et al., 2019a; Rupp et al., 2022). It must be highlighted that air velocity is an important parameter because it helps to identify the discrepancies detected in different climate conditions.
Djamila (2017) also stated that occupants’ TSVs have shown distinct differences between the local climate conditions and the physical parameters of buildings. Many studies highlighted that there is a direct link between air velocity and clothing insulation level (clo) to identify neutral adaptive thermal comfort (Yang et al., 2016; Sánchez-García et al., 2018; Wang et al., 2018). In these studies, it was observed with an average clothing insulation of 0.6 (clo) required for the air velocity between 0,15–0,2 m/s. However, the clothing insulation level for indoor temperatures below 16 °C varied among subject participants hence these results could require to be validated by using a climate chamber. Djamila (2017) conducted a meta-analysis to develop a novel method for the identification of neutral adaptive thermal comfort. Hence the meta-analysis results are based on the integration of different types of thermal assessment criteria which has led to many discrepancies on the research outputs (ibid). Djamila (2017) stressed that the dataset should be adjusted in line with the power analysis method to calculate the sample size. The study also highlighted that subject participants age differences should also be taken into account because of the human body adaption to different local climate conditions.
In a study conducted by Rawal et al. (2022), the India Model for Adaptive Comfort (IMAC) was proposed for residential buildings and the study findings were compared with the predicted mean vote (PMV). Furthermore, there are several discrepancies identified between the proposed model and the ASHRAE-55-2020 and EN 16798-1 thermal comfort assessment models. According to Rawal et al., (2022) the proposed model should be between 2 °C and 0,3 °C respectively. Although, both the ASHRAE-55 and EN 16798-1 models should be slightly warmer than the proposed models. Parameters included indoor air- temperature and velocity, relative humidity and globe temperature by considering subject participants’ age and gender, as shown in Table 2.
Rawal et al. (2022) indicated that thermal properties of buildings have had impact on households’ energy use, but this factor is not only limited with the physical condition of buildings, but it also has direct correlation with local climate conditions to identify neutral adaptive thermal comfort. This study also highlighted that buildings with operational Heating, Ventilation and Air Conditioning (HVAC) systems offer optimum thermal comfort at a high energy cost. Although, naturally ventilated buildings may optimise occupants’ thermal comfort while considering energy conservation concurrently. It should be noted that adaptation of human body to extreme thermal conditions is important but there is a lack of experimental analysis to provide guidance to the future scholars on this matter.
Yi et al. (2022a) concluded that Indian occupants are more tolerable to the warmer conditions than the predicted thermal adaptation thresholds recommended by ASHRAE-55-2020 and EN 16798 thermal comfort assessment models. To this extend, Yi et al. (2022a) proposed an adaptive model for mixed mode and naturally ventilated residential buildings in different Indian climate zones. This pilot study was predominantly assessed subject respondents’ psychological parameters. In conjunction with the experimental analysis, air velocity, operative air temperature, global temperature and relative humidity were included for the development of neutral adaptive thermal comfort thresholds. Additionally, subject respondent’s clothing insulation level (clo) and their metabolic rate (met) activity were determined by a longitudinal field survey and the weather data collected from the closest weather station. Notably, air velocity is the deterministic factor on the thermal comfort studies so that the wind rose diagrams were gathered to highlight the impact of local climate conditions on thermal comfort studies. As shown in Figure 4 (a), the wind velocity for Canada, depicted by the wind rose is higher than in comparison to India in Figure 4 (b) and Abu Dhabi in Figure 4 (c).
Kaynakli and Kilic (2005) developed a mathematical model to analyze the effect of clothing insulation level (clo) and air velocity on the human thermal comfort. The mathematical model was used as an innovative approach for dividing the human body into 16 clothed segments in the statistical dataset. The study was also analysed the subject respondents’ TSVs and the recorded environmental parameters (ibid). The study findings were highlighted the steady increase on the air infiltration rate and the evaporative heat transfer coefficient ratio which have led to increase heat losses. It should be noted that human body reaction to the air velocity rates is the mostly known deterministic factors. One of the main disadvantages of mathematical model is the data mining and selection of exclusion criteria in the dataset. Both these factors could impact on the occupants’ TSVs. Yuan et al. (2022) indicated that the human body is complex to tolerate with changing environmental conditions such as extreme heat in the summer. This has led to the development of phyton script or mathematical equations to reduce the bias for the statistical analysis (ibid).
2.3. Passive Heating and Cooling
The previous section introduced the main determinant parameters to identify neutral adaptive thermal comfort. It scrutinised the importance of the ASHRAE Global Thermal Comfort Database version record 2.1 and its impact on the development of adaptive thermal comfort theory globally. This section introduces passive-cooling design strategies and establishes a definition for the optimization of thermal comfort. It also identifies and explains traditional cooling systems implemented in vernacular buildings that consider different climatic characteristics of the built environment. As was previously explained, adaptive thermal comfort theory is directly linked with the effectiveness of passive cooling systems can be applied to modern residential building envelopes in order to diminish indoor air ambient temperatures in the summer. Many researchers highlighted that passive systems could help to increase the infiltration rate of which is a modification of the micro-climate and changes in the conditions of the immediate surroundings (Givoni, 1994; Mirahmadi & Altan, 2018). In the presents study, several of the studies are analysed in the following subsections prove that combining strategies on a larger scale can affect the climate of an entire area.
Recent studies indicated that passive heating and cooling systems and their implementation on building envelope is gaining momentum (Fernandez-Antolin et al., 2019; Huang et al., 2020). However, all these studies predominantly focused on energy consumption reduction and optimizing occupants’ thermal comfort has been neglected. Table 3 delineates a collection of different studies conducted on passive heating and cooling strategies.
Ozarisoy (2022) identified the percentage people dissatisfaction (PPD) level of social housing residents in the South-Eastern Mediterranean basin. In this study, it was found that elderly people are more vulnerable to extreme heat conditions in the summer which could result in demand on using their cooling devices such as domestic air-conditioning (A/C) systems or portable fans to maintain optimum thermal comfort at home. According to Ozarisoy (2022), the passive cooling systems could contribute up to 81% energy consumption reduction in the hot and humid climate of Famagusta, Cyprus. The study highlighted that implementation of window-to-wall ratio (WWR), operable pinewood external shutters on the opaque window surfaces, skylight and wind catcher systems are the most effective passive design strategies to penetrate natural ventilation into the occupied spaces, as shown in Figure 5. In study conducted by Ozarisoy (2022), wind catcher systems have led to avoid heat accumulation on the south-facing occupied spaces and reduce the impact of overheating risk in the summer. It should be noted that there is wealth of experimental research conducted on overheating risk assessment of buildings but most of the researchers did not focus on optimising occupants’ thermal comfort (De Vecchi, 2012 et al., 2012; Mishra & Ramgopal, 2015; Tuck et al., 2019). Although, the study was concluded that relying on passive cooling systems would be not provided the expected optimum thermal comfort level without considering energy-efficient building materials (Toe & Kubota, 2013). Additionanly, Mohamed et al. (2021) evaluated the impact of state-of-the-art passive wall system on the adaptive thermal comfort of its residents. This wall system both combines natural ventilation and evaporative cooling in the Sudan’s climate where the weather is semi-arid. The study explored those indoor environmental conditions such as operative air temperature was compared against outdoor air temperature after the implementation of trombe wall system. It was found that indoor air temperature was reduced from 30,3–44,8 °C to 18,9–26,5 °C.
Pastore and Andersen (2019) indicated that air velocity and air temperature were the main variables integrated with the building simulation tools such as Integrated Environmental Solutions Virtual Environment (IES-VE), Design Builder, Environmental Design Solutions (EDSL-TAS). Although, Gustin et al., (2019) stressed that existing methodologies did not emphasis on the importance of relative humidity index factor while assessing occupants’ thermal comfort in any simulation engines. Taleb (2014) used two different simulation software programs to validate the occupants’ TSVs with on-site recorded environmental parameters in Abu Dhabi’s climate. The study was found that the standard deviation is the most determinant factor to identify thermal comfort due to the fact that there are discrepancies detected in the dataset and the sample size is relatively small in comparison to the data analysed by Yao et al. (2009). The study was also found that 23,6% energy consumption reduction was achievable after the implementation of passive cooling design strategies.
Belmonte et al. (2021) conducted an experimental analysis to explore the influences of occupants’ thermal sensitivity in both cold and warm climates. The purpose of this study was to anaylse the simulation set-input parameters for improving energy efficiency of multi-family residential buildings. In this study, ten passive design strategies were proposed to undertake optimization studies. It was found that compactness of building form was the main determinant variable to be considered during the initial stages of a building. The study was recommended that more compactness of the building form was more desirable for the cold climate zone which has led to maintain heating at home. Additionally, orientation of a building and appropriate fenestration design should be considered for the warm climate zone.
Huang et al. (2020) indicated that the local climate conditions should be the main priority before implementing any type of passive cooling systems on a building. For example, four different climatic zones were classified namely hot-dry, hot-humid, temperate, cold and composite in Indian context. This climate variation was analyzed to evaluate passive cooling potential of existing building stock (Bhamare et al., 2020). In this study, the India Model for Adaptive Comfort (IMAC) was adopted to assess occupants’ TSVs which were aided to develop evidence-based passive cooling design strategies. The findings were highlighted that the effective natural ventilation could be achieved because of evaporative cooling in the composite climate of Indian context. Notably, night-time effective natural ventilation is the utmost important to provide thermally comfortable indoor air environment at the night-time in the hot-dry climate. In conjunction with the adaptive thermal comfort theory, many researchers highlighted the importance of night-time ventilation strategies in the hot and humid climates across worldwide (Olesen & Brager, 2004; Kim et al., 2018b; Parkinson et al., 2019a). To sum up, this study argues the significance of climate classification type through development of passive cooling design strategies. It also highlights the use of existing thermal comfort models which have been accredited by the ASHRAE Global Thermal Comfort database version record 2.1 in order to propose hybrid methodological framework in thermal comfort studies.
2.3.1. Overhanging Balcony Projection with Wooden Frame Shutter System
Passive evaporative cooling systems can mostly be found in hot–dry and hot–humid climate regions of the world (Givoni, 1994). This is a traditional Middle Eastern building-system pattern that stretches from India to Cyprus and is often applied to residential buildings in order to optimise indoor thermal comfort under severe summer temperature conditions (Mirahmadi & Altan, 2018). Figure 6 (a) and (b) demonstrate the application of these systems, which are directly related to the building typology and the architectural and urban characteristics of the region that have evolved for centuries. For example, wind-catcher systems, top-window openings and overhanging balconies with shading elements have been shown to be the most efficient passive strategies for such cooling systems, and these strategies are used and embedded in the culture according to different requirements and local traditions (Case, 2017). Most of the frontier examples that highlight these indigenous technologies are based on limited, local use of energy and construction materials that work in harmony with the natural environment, which have been assimilated, if not actually suppressed, during the rapid growth of the industrial world (Sahebzadeh et al., 2017).
As was previously stated, passive-evaporative cooling systems were the subject of this investigation; from this point onward, these systems will be tailored with the integration of porous ceramic material intended for natural ventilation of indoor environments in residential retrofitting efforts. This is a low-tech passive-cooling design solution that facilitates the circulation of humid, hot air from the outdoors, and the system must be placed adjacent to the perimeter walls, or alternately in contact with the roof (Al Tawayha et al., 2019). Several pilot studies have tested the applicability of implementing porous ceramic in inefficiently constructed residential structures; in newly built residential buildings, however, only the rooms with access to external walls can use this particular cooling technique (Bencheikh & Bederina, 2019; Schiano-Phan, 2004); these studies are also highlighted mitigation techniques and effective low-tech passive-cooling design solutions that must be adopted in service areas, such as corridors, lobbies and general circulation spaces.
In order to investigate the integrity of porous ceramic systems into a residential building retrofitting scheme, as is shown in Figure 7 (a) and (b), a recent study that was undertaken by Schiano-Phan in 2008 to test the implementation of porous ceramic materials onto building envelopes discussed the low-tech design solution systems and the impact thereof on optimising occupant thermal comfort at home. To prove the hypothesis developed by previous scholars, it can therefore be asserted that in apartment blocks, the floor level has a direct bearing on the size of the porous ceramic system that is needed (Schiano-Phan, 2012). Certain floor-plan layout designs on the ground floors that are affected by heat gains because of high-albedo asphalt surfaces can potentially benefit from the installation of a porous ceramic system as a façade on the outer skin (Schiano-Phan, 2009).
Figure 7 (a) demonstrates the ingress of fresh air through a wet-cavity wall system, which induces particles to be filtered and circulates water into the occupied space. In the intermediate floors, as well as on the ground floor, the reduced availability of perimeter space is compensated by reduced envelope gains and reduced indoor cooling requirements. In order to identify the workflow of the wet-cavity wall system in the top floor apartments, where the roof can be used as an additional surface for the integration of the porous ceramic system to acclimatisation of indoor air environment (Ibraheem & Ford, 2012). Studies conducted by Schiano-Phan in 2010 (Schiano-Phan, 2010) and Golzari in 2014 (Golzari, 2014) concluded that mitigation techniques, such as night-time ventilation, solar control and improvements in the building envelope, resulted in a significant reduction of the cooling loads that can often be exclusively observed by a wall-integrated porous ceramic system.
2.3.2. Mashrabiya and Muscates Window System
In 1986, Fathy tested and investigated the modern applicability of a type of opening that is typically used as an external window in the vernacular architecture of Egypt and as traditional indoor partition elements in Saudi Arabia, as shown in Figure 8 (a). Many scholarly articles have been discussed the concept of mashrabiya, which has been extensively used in hot–arid and hot–humid regions, particularly in the Middle East and North Africa. Similar evaporative cooling strategies can also be seen in Mediterranean regions, as well as in Cyprus, as shown in Figure 8 (b) (Al Azri et al., 2013; Golzari, 2014).
Figure 8 (a) shows that the mashrabiya is an opening with a wooden lattice screen, which performs different functions in order to provide privacy, ventilation, solar control and glare reduction and to cool the air by evaporation, consequently, decreases the relative humidity of the indoor spaces. Figure 8 (b) depicts a cantilevered space with a lattice opening in which small water jars are placed, so the area is cooled by evaporation as air moves through the opening. Several exemplar studies were carried out by Gupta (2017) in the mid-1970s in the hot, arid region of Oman; the findings revealed the role of this traditional window-cooling method, which incorporates an evaporative cooling system through the use of porous water jars.
Figure 9 (a) and (b) illustrate the three parts of the window detail: a lower part where a lattice screen allows an uncontrolled air flow, a middle part where a cantilevered lattice structure holds a porous ceramic water jar and internal wooden shutters are used to control air movement and an upper part where horizontal louvres allows hot air to escape. In principle, the window provides cooling air movement and solar control in one system, in much the same way that a modern air-conditioning unit would. In order to provide sufficient ventilation through indoor spaces and optimise the thermal comfort of occupants, especially in hot and humid regions, the above-mentioned traditional passive evaporative strategies would be applicable to test low-tech passive design systems in a residential building retrofitting scheme.
2.3.3. Wind Tower System
In hot–arid and hot–humid regions, wind towers are the most commonly known passive design systems that provide natural circulation and cool the ambient air throughout the indoor spaces. The most well-known exemplar passive-cooling systems are Iranian wind towers, which have openings at the top that face in all directions, or in some cases, only in the direction whence the wind is predominant (Jomehzadeh et al., 2017). Traces of this vernacular building system can also be seen in residential building designs in Cyprus, as shown in Figure 10 (a) and (b). Many scholarly articles have described the different types of wind towers; these can vary according to tower height, openings and different cross-sections for air-flow passages. Furthermore, the designs also vary according to the desired airflow rate, heat-transfer area, sensible heat-storage capacity and evaporative cooling surfaces.
Figure 10 (b) illustrates a cross-section of a wind tower system detail in the Dowlat Abad Garden in Yazd. This case-study building was extensively documented by Bahadori in 1979. In this wind tower, a small pool with a foundation is situated directly under the tower shaft; the high velocity wind speed allows air coming down the tower to initially be cooled, then evaporatively cooled by the pool and the fountain systems before collecting in indoor spaces (Fernandes et al., 2019). At the same time, Figure 10 (b) shows another effective passive design strategy, which has access to an underground water stream: In principle, the underground water is usually cold, and this scheme can produce a cooling rate more effectively than other exemplar wind towers; the cooled natural ventilation is accessed by the underground stream through the shaft, and the wind tower was effectively built with respect to this shaft, as illustrated in Figure 10 (b).
As was stated above, natural ventilation and passive cooling measures are based on efficient traditional exemplar building systems. However, the applicability of the concrete-built residential buildings challenge determinant factors to translate interpretation between past and current efficiency systems in residential building retrofitting efforts. For this reason, the present study highlights the role of designing the provision of effective natural ventilation under the local wind direction as a major factor that is dependent on the orientation of modern high-rise residential buildings. Experimental base-case ventilation strategies were also tested by Giovanni et al. in 1991; their findings demonstrated that oblique winds at angles between 30° and 120° to the wall can provide effective cross-ventilation if there are openings in the windward and leeward walls. Determining a building’s relationship to the prevailing wind direction should be a major consideration in order to properly decide upon the location of the main rooms, the living room and sleeping rooms during the early design stage of residential buildings. As such, the above-mentioned findings could also be applicable to minimise or avoid the overheating risks of occupied spaces while measuring the existing energy performance of a residential building.
2.4. Application of Passive Heating and Cooling Systems
The traditional residents of Abu Dhabi used to design cooler buildings from clay and mudbrick to tolerate with hot temperatures and the modern designs are incorporating some of the traditional cooling methods as passive cooling systems (Day & Gunderson, 2015). Figure 11 shows traditional building materials which were used to optimise thermal comfort in heritage buildings.
Ozarisoy and Altan (2021a) analysed energy effectiveness of passive cooling design strategies by using the IES simulation tool to undertake dynamic thermal simulations. In this study, optimization approach was adopted to assess thermal performance of each passive cooling design strategy, as shown in Figure 12. To accomplish this, thermal performance of the building was evaluated after implementing step-by-step development of effective cooling strategies such as fenestration design, shading and glazed opaque surfaces, improving insulation of external walls, installation of radiant cooling systems and light-colored coating techniques to reduce overheating risk in the summer. Vishnubhotla et al., (2022) also adopted building simulation approach to optimise thermal comfort by using passive cooling strategies in two Indian cities namely Tiruchirappalli and Coimbatore. In this study, archetype housing stock was chosen to develop stochastic model. The study was found that window-to-wall ratio aspect could help to alleviate with extreme heat during the daytime and excessive relative humidity index factor at night.
Zirnhelt and Richman (2015) proposed passive heating strategies which are applicable in Canadian climate. Energy modeling approach was undertaken to develop baseline thermal comfort model in the Twin Houses at the Canadian Centre for Housing Technology (CCHT). In this study, eight passive cooling strategies were tested in two different prototype houses. The purpose of this study was to reduce energy consumption and avoid overheating risk in the summer since the long-term heatwaves observed in the Canadian climate. Building energy simulation approach was used to conduct the thermal performance analysis. The climate data was gathered from the Canadian Weather for Energy Calculations (CWEC) weather data. The simulation set input parameters were included thermal mass, orientation of window openings and the glazing type which were directly correlated with the optimization parameters.
Zirnhelt and Richman (2015) modelled different fenestration design scenarios, considering with spectral average values for solar transmittance, front and rear solar reflectance, and front and rear infrared hemispherical emissivity for each individual glazing layer in Energy Plus software suite. In this experiment, Zirnhelt and Richman (2015) included the effect of ground temperature by modelling and simulating 3D ground contact heat transfer in Energy Plus to replicate actual environmental conditions. Niza et al. (2022) reported that it is possible to achieve thermal comfort while reducing energy consumption if buildings are initially designed in line with local climate conditions. The study findings reported that rising global temperatures have had an impact on the development of reliable adaptive thermal comfort model. This could result in technical difficulties to determine stochastic models in thermal comfort studies. Additionally, this paper discusses the revival applicability of passive heating and cooling systems in different climate zones. One of the main reasons is that adaptive thermal comfort models are solely reliant on the data gathered from the ASHRAE Global Thermal Comfort Database version record 2.1 and there is very little research conducted to consider correlations between adaptive thermal comfort and passive cooling design strategies. To sum up, comprehensive methodological review is fundamental to provide a road map on the thermal comfort assessment which are discussed in Section 3.
3. Methodology
3.1. Conceptual Framework
This section reviews different adaptive thermal comfort models which were used by previous scholars. The objective of this study is to explore the climate variations on occupants’ TSVs by considering the necessity of passive cooling design strategies during the decision-making process. Mixed method design approach was adopted. First, the systematic literature review was conducted in four key terms to identify the knowledge gap. Second, the ASHRAE Global Thermal Comfort Database version record 2.1 was chosen. This data provides the global overview to identify baseline thresholds in selected case study locations namely Canada, India, Abu Dhabi and the South-Eastern Mediterranean basin. Third, the secondary data gathered from the field measurements in Cyprus to validate the study findings and interpret the statistical findings with the literature review. In this study, the data collection methods were investigated to outline an effective adaptive thermal comfort assessment. Additionally, the impact of disregarded data and non-inclusion of other factors are also presented.
This paper also reviews the methods used in the selection of passive heating and cooling techniques according to the climatic characteristics of three different countries, sub-tropical dessert climate of Abu Dhabi, tropical wet and dry/savanna climate of India and the humid continental climate of Canada. To this extend, thermal comfort models were classified based on the qualities, application and limitation of thermoregulatory models and adaptive thermal comfort models included in the ASHRAE Global Thermal Comfort Database version record 2.1. Figure 13 demonstrates the step-by-step development of methodological workflow for the present study.
3.2. Adaptive Thermal Comfort Models
Availability of different thermal comfort models could determine thermally acceptable thresholds (Parkinson et al., 2019a). However, the technical specifications of each tool have shown variations so that this could led in discrepancies to identify accuracy in the dataset (Parkinson et al., 2021). It must be stressed that there is an urgent need to identify the most accurate adaptive thermal comfort model while assessing subject respondents’ TSVs (Parkinson & Schweiker, 2022). Figure 14 (a) and (b) highlight the differences between the American standard – ASHRAE-55-2020 and European standard – EN-16798. In these graphs, the input variables selected were the mean outdoor temperature of 25 °C, operative temperature of 25 °C and air velocity of 0.3m/s. It can be seen that in Figure 14 (a) the 80% acceptability operative temperature of the American standard ranges from 21,1 to 29,1°C while the 90% American standard acceptability operative temperature ranges from 23,1 to 28,1°C, as shown in Figure 14 (b).
To accomplish this, the same input variables resulted in different adaptive operative temperature ranges, as shown in Table 4. The differences of certain thermal comfort models, scales and indexes can be attributed to the differences in climate, lifestyle and human body activities (Parkinson et al., 2021a). One of the main reasons that these two models were predicted individual thermal preferences. Hence, the European norm EN-16798 has been set to classify thermal satisfaction in three categories, as shown in Table 4.
He et al. (2022) indicated that a clear definition of adaptive thermal comfort theory and the simplification of assessment methods are fundamental while assessing subject respondents’ TSVs. To avoid any research bias, many researchers applied to the traditional convention identified by the ASHRAE and European standards in thermal comfort studies. Table 5 delineates a description of thermal comfort categories. According to the ASHRAE-55-2020 and EN-16798, the Fanger’s adaptive thermal comfort model has been accepted for the statistical analysis. It should be not noted that the application of zone conditioning in thermal comfort analysis is not applicable for the ASHRAE-55-2020. Hence, thermal comfort analysis has been accepted only for naturally ventilated buildings in the ASHRAE-55-2020 assessment criteria.
Many researchers developed different thermoregulatory models to assess subject respondents’ TSVs by considering only physiological parameters such as metabolic rate activity (met) level, subject respondents’ body mass index factor, gender and their skin thicknesses (Cheung et al., 2019; Kent et al., 2021; Kim et al., 2019). Thermoregulatory models are predominantly reliant on heat transfer of human body and skin thickness in order to tolerate with extreme environmental conditions. Kim et al. (2018) identified the determinant parameters for personal comfort models. In this study, commonly used adaptive models developed from the data gathered during field measurements, inclusion of on-site recorded environmental conditions in order to identify the adaptive thermal comfort. Additionally, other external variables were also included into the data set such as subject respondents’ heart rate, metabolic rate activity (met) and clothing insulation level (clo) value to develop stochastic adaptive thermal comfort models. Table 6 summarizes some of the adaptive thermal comfort models which were gathered from field studies.
Yi et al. (2022a) studied three different thermal comfort models to assess elderly people’s thermal dissatisfaction level. In this study, the subject respondent’s PMVs were examined, and the questionnaire survey data was validated with the infrared radiometer thermography (IRT) survey. It should be noted that the IRT survey was conducted in communal areas in order to generalize the findings. In this field study, indoor air temperature, relative humidity and air speed were recorded. A weighted evaluation criteria was applied to measure clothing insulation level (clo) factor. Notably, body temperature was measured using adaptive-scan device (Yi et al., 2022b).
Additionally, Yi et al. (2022b) used a micro-bolometer detector (model A-600 series, FLIR, T ̈aby, Sweden, image resolution 640 × 320 pixels) to perform the IRT survey. It should be noted that the priority was given to the subject participants a resting period of 15-minutes intervals in order to avoid body temperature fluctuations. The clothing insulation was estimated using equation 1.
where (clo) represents the clothing insulation while (W) is the weight of the garment. The effect of clothing insulation is complicated to assess because of non-uniform structure of clothes and some body parts warm quickly compared to others due to blood flow and skin thickness (Ko et al., 2020) therefore body parameters should be included when analyzing clothing effect (ibid). Table 7 delineates the factors affecting both the physical and environmental parameters during the longitudinal field surveys.
1clo = 0.00103W−0.0253
Zhang et al. (2017) carried out a comparative study to develop an evidence-based adaptive thermal comfort model in different climate regions. Table 8 demonstrates the input variables of a dataset conducted in two Canadian cities, Montreal and Ottawa. It should be noted that the limitation of the study was the unavailability and incompleteness of data for certain parameters such as the subject respondents’ age information.
Halawa and Van Hoof (2012) indicated that thermal comfort evaluation based on different adaptive models to- assess and compare the results with the field measurements. Many researchers adopted different thermal comfort index scales which is listed in Table 9. Coley et al. (2017) highlighted that Likert scale assessment is important to determine the thermal- sensitivity and acceptability by considering the climate classification type of each research context.
The impact of the missing information can be further analyzed, and the evaluation of the disregarded parameters should be conducted by using secondary data. Figure 15 (a) and (b) present missing data in a field study conducted in the eastern Mediterranean region in North Cyprus (see Data A). Figure 15 (a) highlights that most of the data was collected and only 2,8% of the variables data was incomplete. 17,87% cases and 16% values were missing. Missing cases and values are a matter of concern as the percentage of incomplete data is considerable. In such cases, secondary data can be used to conduct for the validation of sample size, as shown in Figure 15 (b).
An extensive analysis of missing data was conducted for the present study (see Data B). The results and recommendations are presented. In Figure 15 (a) the three pie charts summaries the frequency and percentage of missing data in the dataset by variable, case/observation and individual values. The third pie chart represents the full data matrix and was used to evaluate the 5% threshold of the proportion of missing values in the data matrix that was discussed above. It was found that the data was missing completely at random (MCAR). After preparing the data for analysis, it was observed that out of 100 recorded cases, 98 cases contained missing data (98.0%) and out of 53 variables, 2 variables contained missing data (2.8%), which amounted to a total of 0.04% missing information in the dataset. To assess whether the pattern of missing values was MCAR, Little’s MCAR test (Little, 1988) was conducted. The null hypothesis of Little’s MCAR test is that the pattern of the data is MCAR and follows a chi-square distribution.
Using an expectation-maximization algorithm, the MCAR test estimates the univariate means and correlations for each of the variables. The results revealed that the pattern of missing values in the data was MCAR: χ² (104) = 121,645, p = 0,114. Even though the proportion of the total missing data is less than 5% and the data is MCAR, the final sample size may still be affected by listwise or pairwise deletion when the analysis is run. Listwise deletion removes a case if a case has any missing value for any of the variables used in an analysis. This is also known as complete-case analysis. Pairwise deletion better maximises all the data available in the data analysis and is preferred over listwise deletion for increasing the statistical power of the study (Newman, 2014). The missing values of data allow flexibility when addressing missing data because the proportion of missing data in the sample is less than 5% and the pattern of missing data is MCAR. Based upon these two findings, the data should be fine using either pairwise or listwise deletion methods. Listwise and pairwise deletion are unbiased techniques when data is MCAR; however, pairwise deletion increases power (Newman, 2014). Given the sufficient sample size for the present study, the proportion of missing data and the pattern of missing data, listwise or pairwise deletion is recommended.
3.3. Database Analysis
This paper reviews the extant literature on the state-of-the-art studies on the adaptive thermal comfort. Hence, passive heating and cooling implementations have been subject of interests to improve indoor air quality while optimizing occupants’ thermal comfort; therefore, this study aims to highlight the importance of revival applicability of passive design systems for the development of adaptive thermal comfort approach globally. To this extend, the Vos viewer visualization tool was used to identify key terms for the present study. Figure 16 demonstrates the network visualization to demonstrate correlations between passive design systems and thermal comfort. First, the data gathered from the Web of Science database. Original research papers and review articles were retrieved from the database. 122 published research were identified and exported in ‘plain text file’. To prepare these datasets, full record and cited references were selected from the content box before exporting the data into the Vos viewer software suite. Additionally, a visualization map was generated by selecting ‘create a map based on text data’ option. This was followed by selecting the ‘bibliographic database files’ which was aided to conduct the data mining process.
With regards to the identification of neutral adaptive thermal comfort, worldwide investigation on thermal comfort assessment methods were carried out, as shown in Figure 17. In key word analysis, 20 counties were identified from the ASHRAE Global Thermal Comfort Database version record 2.1. In this database, most of the datasets were gathered from Chinese cities due to the availability of large sample size. A total of 372 were included to assess occupant’s thermal comfort both in winter and summer seasons from China. As shown in Figure 17, worldwide studies were targeted to highlight the significance of thermal comfort assessment. Although, different methods were also investigated to analyze energy effectiveness of passive cooling systems in thermal comfort studies.
3.4. Data Acquisition
This section details the importance of basic assumption testing in inferential analyses, as well as how basic assumptions were assessed, the summary of the data preparation process, and options for coding data prior to conducting analysis, as shown in Table 10. Before any inferential analyses are conducted, basic assumptions must be met to avoid bias in a study’s findings. The validity of conclusions drawn from a statistical analysis depend on the validity of any assumptions made. Where data is lacking, assumption testing may have to be restricted to simply making a judgment about whether an assumption is reasonable. In addition, scholars may have to judge what effect the violation of an assumption might have on the findings. The effect of violating any of the assumptions is a change in the probability of making a Type I or a Type II error, and the researchers won’t usually know whether the change has made it more or less likely to commit an inferential error. Basic assumptions are also accompanied by analysis-specific assumptions. Analysis-specific assumptions are tested during the analysis phase of the project.
As shown in Table 10, a general rule for sample sizes is that group sizes are approximately equal if n of the largest group is no more than about twice n of the smallest group. Another general rule for sample sizes is at least 10% of the sample should be in each group. Categorical variables with very uneven splits between categories present problems for several multivariate analyses (Tabachnick & Fidell, 2007). The following variables were recoded to reflect the conceptualization of statistically representative findings in accordance with the research hypotheses.
4. Analysis and Results
4.1. Adaptive Thermal Comfort Assessment
Taleb (2014) analysed the accuracy of the subject respondents’ TSVs to develop an evidence-based adaptive thermal comfort assessment approach and the study was validated with the IRT survey. Although, the TSVs of elderly people with dementia were excluded from the dataset in order to avoid any research bias but this could result in inaccuracies in the assessment criteria (ibid). Luo et al. (2018) indicated that the subject respondents’ clothing insulation (clo) level and their metabolic rate (met) activity were two important determinant factors during the field studies on thermal comfort assessment. Table 11 delineates adaptive thermal comfort models based on the subject respondents’ TSVs, clothing insulation level (clo) factor and the on-site monitored outdoor environmental conditions.
Gaetani et al. (2016) also highlighted the importance of passive design systems which are aided to penetrate fresh air into the occupied spaces. The study was recommended that effective fenestration design, window-to-wall ratio (WWR) and orientation of opaque glazed surfaces are required to provide optimum thermal conditions in summer. Cheung et al. (2019) proposed alternative models to assess elderly people’s thermal comfort. In this study, the main emphasis was given to explore correlations between outdoor environmental parameters and subject respondents’ TSVs. One of the limitations of this study was to assess elderly people’s behavior on window opening habits and their record of metabolic activity level (met) indicators. Hence Fabi et al., (2012) highlighted the importance of operative air temperature on the elderly people’s TSVs. These two important debates demonstrated that there is a contradiction between the PMVs and TSVs approaches. To avoid any research bias, Bonte et al. (2014) proposed using the thermoregulatory models could avoid discrepancies in the statistical dataset. The study was also highlighted that considering human body reaction to extreme weather conditions could require an evidence-based adaptive behavioral analysis and development of feed-forward questionnaire surveys with subject respondents in order to gather accurate data and optimise occupants’ thermal comfort thoroughly.
According to Singh and Chani (2018) the subject respondents’ TSVs’ results were shown that 80% of the Indian participants experienced the adaptive thermal comfort threshold level between temperature ranges from 20,5 to 29,5 °C. However, these results may have been affected by using air conditioners and heaters during the field study. It should be noted that A difference between the PMV and TSV results was calculated by using the Center of the Built Environment’s (CBEs) open-access Thermal Comfort tool to predict subject respondents’ PMVs accurately. Furthermore, a difference of 5,2 °C was noticed between the predicted and observed neutral temperature. To conclude, Singh and Chani (2018) indicated that elderly people’s thermal acceptability has shown slightly different findings than the adaptive thermal comfort convention model which was proposed by Fanger in 1973 (Fanger, 1973). On the other hand, Indraganti et al. (2014) also indicated that the standard deviation is the determinant factor to avoid discrepancies in any type of statistical data gathered from field measurements in thermal comfort studies.
There is very little research conducted to investigate Canadian households’ thermal comfort. However, Zhang et al. (2017) conducted a comparative study considering with North American households. The study was found that Canadian residents were more adaptable to extreme cold conditions than North American households while selecting outdoor daily mean temperature as control variable for the statistical analysis. Zhang et al. (2017) indicated that indoor air temperature is usually maintained within the range between 20–25 °C in Canada. The study also was explored the indoor temperature variations between Canadian and North American resident’s occupied spaces in the winter. The findings highlighted that in Canada, the indoor air temperature fluctuations were more stable due to high airtightness level and good quality of insulation materials on external walls in newly built homes. According to Zhang et al. (2017) the thermally comfortable operative air temperature was found to be between 22–26 °C in North America. The study was also found that multi-family residents’ thermal acceptability was found between 22–26 °C in naturally ventilated residential buildings in Canada.
Furthermore, the effects of psychological, physiology, psychology and behavior adaptation factors were analyzed by using the households’ TSVs (Zhang et al., 2017). In this study, it was found that thermal acceptability was the lowest amongst three regions in North America, which was found at 4,6 °C. The results indicated that Canadian residents’ energy consumption for space heating was significantly higher than India and Abu Dhabi. This could result into effect on the PMV model by considering occupants’ TSVs in developing an evidence based neutral adaptive thermal comfort model globally. The following section is described the purpose of using the ASHRAE Global Thermal Comfort database version record 2.1 in order to prove the necessity of passive design strategies while developing different adaptive thermal comfort thresholds worldwide.
4.2. ASHRAE Global Thermal Comfort Database II
This section presents the data gathered from the ASHRAE Global Thermal Comfort database version record 2.1. The aim was to explore correlations between the environmental conditions and subject respondents’ TSVs in order to provide an evidence-based adaptive thermal comfort approach. As shown in Figure 18 (a) the Canadian residents’ TSVs were gathered to demonstrate sample size for the database analysis approach. The present study was found that Canadian residents’ TSVs were very less with a sample size of 864 out of the global sample size of 52,723. On the other hand, United Kingdom, China and India have shown the highest sample size into the database, as shown in Figure 18 (b).
In Figure 18 I and (d) the occupants’ TSVs were examined by considering indoor air, outdoor air- and monthly mean outdoor temperatures to identify 80% of thermal acceptability. It should be noted that 19,022 datapoints were used to determine adaptive thermal comfort level between 21 °C and 28 °C. This is noted as the largest sample size included into the dataset so that the results are presented reliable research outputs. The present study was found that the participants’ overall thermal comfort level was showed higher people discomfort dissatisfaction level than Canadian occupants because of the cold climate characteristics of Canadian context. One of the limitations was the lack of availability related with occupants’ behavior on their window opening patterns and the parameters of thermostat settings of their heating systems in winter. This has led to conduct further research on validating the data by using optimization models to predict the adaptive thermal comfort. To prove this argument, Sánchez-García et al. (2018) conducted on thermal comfort analysis in naturally ventilated multi-family buildings to assess percentage people dissatisfaction (PPD) level with valid on-site field measurements.
There is an uncertainty on the identification of appropriate adaptive thermal comfort model for each field study. To avoid research bias, the ASHRAE Global Thermal Comfort visualization tool is provided parametric analysis approach to determine thermally acceptable threshold levels. The scatter plot which is shown in Figure 19 (a) represents the thermal sensation scale of Canadian residents. In the present study, it was found that neutral adaptive thermal comfort was between 20 °C and 30 °C ranges, by considering indoor air temperature. Figure 19 (b) shows the scatter plot of clothing insulation level (clo) factor against relative humidity. The present study was found that the moisture transfer could be reduced by inclusion of slightly higher clothing insulation level. The study has proven that the clothing insulation level plays significant determinant factor on the thermal comfort assessment. To this extend, very low relative humidity index is required a considerable clothing insulation level in Canada while higher relative humidity levels are required less clothing insulation level than India and Abu Dhabi. It should be noted that the participants are predominantly reliant on using the HVAC systems for cooling purposes in the summer therefore it is difficult to keep the relative humidity index factor at a constant level.
Figure 19 (c) shows the elevated velocity profile plot for India. It highlights strong correlation between air speed and indoor air temperature in naturally ventilated buildings. Additionally, Figure 19 (d) depicts moderate correlations between indoor air temperature and occupants’ TSVs in India. The present study was found that air speed is fundamental for the adaptive thermal comfort assessment, but this determinant factor is not only limited with field measurements, but climate chamber tests should also be considered to validate the occupants’ TSVs. With regards to the identification of adaptive thermal comfort thresholds, further research is required to consider participants’ psychological adaptation to local climate conditions, particularly during the frequently occurred long heatwaves in Canada. To sum up, there is not any data available in the newly released ASHRAE Global Thermal Comfort database version record 2.1 related with the impact of heatwaves on occupants’ thermal comfort in Canada so this is the research gap should be addressed.
4.3. Thermal Comfort Assessment in the South-Eastern Mediterranean basin
In this study, a dataset related to occupants’ thermal sensation votes (TSVs) was designed in accordance with the thermal comfort assessment convention recommended by Wang et al. (2018). As presented in Section 4.2, in accordance with Wang et al. (2018), the thermal sensation scale was set out in two conceptual assessment criteria in order to undertake the statistical analysis accurately (see Data C).
First, Wang et al. (2018) recommend a 7-point discrete thermal sensation scale that can be applied to assess occupants’ TSVs. In this case, the TSV was set as an ordinal variable, thus enabling researchers to undertake Cramér’s V test for the statistical analysis and apply the statistical findings whenever it is appropriate at the time of developing an evidence-based adaptive thermal comfort. In the present study, the dataset was coded as follows: 0 = -3, 1 = -2, 2 = -1, 3 = 0, 4 = +1, 5 =+2, 6 = +3. Notably, the [-3, +3] scale band represents the outcome of occupants’ thermal sensation as an ordinal measure used to accurately conduct the Cramér’s V test. This type of coding was applied to determine households’ TSVs gathered through a questionnaire survey, as shown in Table 12. In the questionnaire survey, questions related to households’ thermal sensation were ranked on 7-point Likert scale that could be used as an ordinal measure. In this dataset, to provide consistency of the interpretation of households’ TSVs [0 to 6], a coding range representation of thermal sensation scale band at [-3, +3] was used, which was developed by Fanger in the 1970s and was commonly used by thermal comfort scholars between 1990 and 2000.
Second, Wang et al. (2018) recommend a 7-point continuous thermal sensation scale that can be applied to assess occupants’ TSVs. With the TSV set as a continuous variable, researchers can undertake Pearson’s correlation analysis. This method of design is commonly applied by thermal comfort researchers to identify “neutral” adaptive thermal comfort thresholds. Using occupants’ TSVs as continuous variables is the most well-known method for reporting field survey findings concurrently with in-situ measurements or on-site environmental monitoring findings. In this dataset, to provide consistency of the interpretation of households’ TSVs, the [-3, +3] coding range represents the [Cold to Hot] thermal sensation scale, which was recommended by Fanger in the 1970s and further developed by de Dear in 1998 and 2001 (see Data D).
As shown in Table 12, weekday cooling consumption patterns were significantly and strongly related to weekend heating consumption patterns on weekend (χ² = 54,59, p < 0,001, Cramer’s V = 0,522). Specifically, longer duration of heating consumption was related to longer duration of cooling consumption. Similar result was also found between weekend cooling consumption patterns and weekend heating consumption patterns (χ² = 99,69, p < 0,001, Cramer’s V = 0,706), between weekday cooling consumption patterns and weekday heating consumption patterns (χ² = 74,57, p < 0,001, Cramer’s V = 0,611), and weekend cooling consumption patterns and weekday heating consumption patterns (Fisher’s exact = 49,70, p < 0,001, Cramer’s V = 0,504). For heating patterns, weekday consumption was moderately associated with weekend consumption (χ² = 27,89, p < 0,001, Cramer’s V = 0,373). For cooling patterns, weekday consumption was strongly associated with weekend consumption (χ² = 119,77, p < 0,001, Cramer’s V = 0,774). Occupation was only significantly and moderately related to weekly heating consumption (Fisher’s exact = 12,49, p = 0,042, Cramer’s V = 0,253), but it was not significant related to any other cooling or heating consumption patterns. Notably, the relationships between household occupation and cooling and heating energy consumption patterns were examined using crosstabulations with chi-square tests or Fisher’s Exact tests if over 25% of cells had less than 5 expected counts, as shown in Table 12.
In this study, whilst correlations are indicative of association, there is scope with the data to perform hypothesis testing of significant differences between variables that would add weight to the results (see Data E). To provide a clear representation of the study findings and report research outcomes in accordance with the research questions, which were set out to develop a novel methodological framework for adaptive thermal comfort assessment worldwide.
Additionally, this study presents the contingency tables that support the findings of the statistical analysis presented in Figure 18 (a)-(d) and Figure 19 (a)-(d). These findings are presented to provide guidance on the applied statistical method in order to comply with the convention of supporting research outcomes. Figure 20 (a) and (b) present the identification of a “neutral” adaptive thermal comfort threshold by conducting statistical analysis with in-situ measurements, on-site environmental monitoring, and a thermal comfort assessment questionnaire survey to develop benchmarking criteria for the South-eastern Mediterranean climate of Cyprus. These contingency tables are presented because, according to the conventions of thermal comfort studies, representation of households’ thermal sensation by using descriptive statistics, frequencies, Cramér’s V test, Pearson’s correlations and further ordinal logistic regression analysis methods could provide a valid background for the development of reliable thermal comfort thresholds.
It must be stressed that the contingency tables were produced to understand households’ socio-demographic characteristics and their habitual adaptive behavior on thermal comfort assessment. The relevant Cramer’s V tests are presented in Table 12. At the same time, in the literature review recommended that reliable representativeness of sampling size within the variables identified to develop the concept of statistical convention plays an important role at the time of developing an evidence-based adaptive thermal comfort threshold. It can be seen that household thermal sensation is represented by the terminology of “thermal feeling” indicators to provide a clear understanding to readers about household thermal sensation, as shown in Figure 20 (b). It must be stressed that, in the dataset, the TSV code was set to [0 to 6] which represents the [-3, +3] thermal sensation band according to thermal comfort convention. Hence, the researcher decided to report the findings by using the terminology of each thermal feeling at the time of undertaking the statistical analysis for the contingency analyses, which are presented in Figure 20 (a) and (b).
5. Discussions
This section summarises the main findings and discusses the implications of passive cooling strategies and its impact on the development of new adaptive thermal comfort assessment worldwide. Several pilot studies indicated that elderly people’s thermal comfort has been neglected and there is very limited data available for the elderly people’s TSVs (Taleghani et al., 2013; Hawighorst et al., 2016; Carlucci et al., 2018). Although, many researchers conducted on thermal efficiency of passive cooling design strategies, but these studies have not been highlighted the significance of thermal comfort assessment in any type of adaptive thermal comfort assessment criteria (Schweiker & Wagner, 2015; Vellei et al., 2017; Lu et al., 2019). Hence, different adaptive thermal comfort models have been developed by using the ASHRAE Global Thermal Comfort databases I and II to explore correlations between subject respondents’ TSVs and local climate conditions. In this review article, the main objective is to the on-going development of adaptive thermal comfort models in different climate zones in Canada, India, Abu Dhabi and the South-eastern Mediterranean basin, which is discussed in Section 5.1 and Section 5.2.
5.1. Global Thermal Comfort Assessment
It is evident that most of the field measurements were conducted to avoid discrepancies in the statistical datasets at the time of conducting liner regression analysis (Ozarisoy & Altan 2021b). According to Zhao et al. (2021) the Indian Model of Adaptive Comfort (IMAC) approved by the Bureau of Indian Standards in 2016. This has been accepted the most commonly used adaptive thermal comfort model in India (ibid). However, many researchers claimed that some assessment models were overestimated the neutral adaptive thermal comfort thresholds while the IMAC model was also identified discrepancies in the thermal comfort assessment criteria (van Hoof & Hensen, 2007; Kumareswaran et al., 2021). It should be noted that searching a new method of design for the thermal comfort assessment is utmost important (Dong et al., 2014). Recent studies indicated that using the machine learning methods could help to reduce bias in the statistical dataset in thermal comfort studies (Cao et al., 2011; De dear et al., 2020; Parker, 2020). To prove the statistical appropriateness of statistical findings, novel mathematical models have been developed and analyzed (Nikolopoulou & Lykoudis, 2006). One of the main constrains of this mathematical model is the exclusion criteria of local parameters such as heat stress index factor but further studies should be conducted to simplify the python script language in thermal comfort studies (Parkinson et al., 2020).
It should be noted that human body is complex and there is a necessity on the development of evidence-based mathematical equations to perform parametric statistical analyses such as Cramer’s V test. Additionally, many different adaptive models are available into the ASHRAE Global Thermal Comfort database version record 2.1. This tool is fundamental open-access platform to provide background information for any type of field measurements related with thermal comfort assessment globally. Földváry Ličina et al. (2018) provided a guidance on the using occupants’ TSV assessment by adopting both the ASHRAE-55-2020 and EN-16798 standards which are aided to simplify the parametric statistical analyses. Although, in-depth investigation of the ASHRAE Global Database II highlighted the important aspects on the identification neutral adaptive thermal comfort thresholds by using Fanger’s model. The present study was found that 34% optimization could be achievable while considering the PMV model based on the observed thermal satisfaction of occupants in field studies.
Cheung et al. (2019) highlighted that subject respondent’s age is the most determinant factor in thermal comfort studies. In this experimental analysis, it was found that it is difficult to optimise elderly people’s thermal comfort because of their health conditions and behavior on using thermostat settings for heating purposes during the winter. Zhao et al. (2021) indicated that elderly people are less sensitive to temperature changes. One of the main reasons that subject respondents’ metabolism differences have led to bring discrepancies in their TSVs’ assessment and their human body reaction against warming climate conditions. The study also was found that elderly people have lower metabolism rate which has affected their TPVs (ibid). This is the reason that elderly occupants preferred slightly warmer indoor air environment conditions in comparison to younger people.
Many studies indicated that thermoregulatory models are linked with participant’s age factor, but these are also correlated with the subject respondents’ metabolism and their skin thickness (Bush, 1992; Nicol et al., 2006; Encinas & De Herde, 2013) To this extend, human body is vulnerable to extreme heat conditions which has led difficulties to identify adaptive thermal comfort thresholds (Sanchez-Guevara, 2019). Wang et al. (2018) conducted a review on thermal comfort studies for elderly people. In this study, it was found that there is no correlation between subject respondents’ gender and their TSVs. Several studies highlighted the significance of occupants’ socio-demographic characteristics impact on the identification of adaptive thermal comfort assessment (Humphreys et al., 2002; Romero et al., 2013; Nicol, 2017). On the contrary, many studies are still considered the significance of occupants’ age factor in the development of PMV models globally. Figure 21 (a)-(d) demonstrate the output of a questionnaire survey to gather occupants’ socio-demographic characteristics while assessing their thermal comfort in the South-eastern Mediterranean basin.
Additionally, field studies should be conducted predominantly considering elderly participants and in-situ measurements also should be recorded to reduce research bias risk. It should be noted that there is a lack of research on the thermal comfort of elderly people with dementia so that further scholars should pay attention to gather more reliable findings in the care settings globally.
Liu et al. (2012) recommended that assumptions have been made on the lifestyle of elderly people while assessing the percentage of people dissatisfaction level, but their clothing insulation (clo) level also should be taken into account for the deterministic adaptive thermal comfort models. Yao et al. (2009) found that elderly occupants primarily considered their thermal comfort by increasing their clothing insulation level in order to feel thermally warm during the winter. Although younger people give priority to their physical appearance rather than adapting their human body to the extreme weather conditions, particularly in the winter.
Heidari and Sharples (2002) highlighted those occupants; lifestyle choices play deterministic role on the TSV’s assessment amongst other factors such as body mass index, age and their health conditions. Assessing subject respondents’ habitual adaptive behavior could provide more accurate TSV assessment criteria rather than solely focusing on the field measurements (Bouden & Ghrab, 2005). A relationship between occupants' indoor thermal experience and occupants` thermal comfort perception was found by (Luo et al., 2018). The study was recommended that current thermal comfort standards may not comply with the reliable assessment criteria to provide effective guidance on the indoor air quality assessment. To conclude, this review paper recommends that longitudinal field studies should be conducted to include subject respondents’ in-vivo experience in the TSV assessment. This could provide more reliability to the ASHRAE Global Thermal Comfort Database’s open-access interface in the following years.
5.2. Passive Design Strategies and its Implications on Adaptive Thermal Comfort
Improving energy efficiency of existing housing stock is crucial to optimise occupants’ thermal comfort but many studies are not considered the impact of climate change on the thermal comfort assessment, and this should be addressed by future scholars thoroughly. Many studies indicated that implementation of energy efficient materials could reduce energy consumption and improve indoor air quality (De Dear & Brager, 2001; Nicol et al., 2009 Nicol & Humphreys, 2010). Although, these studies are totally neglected to consider occupant’s habitual adaptive behaviour on their window opening patterns which could directly effect on their TSVs. On the contrary, Lu et al (2019) recommended the necessity on the implementation of passive cooling design strategies to optimise occupants’ thermal comfort because of lack of infiltration rate of naturally ventilated residential buildings. The study was also highlighted that there is a contradiction between the occupants’ TSVs and their home energy use so that the study was recommended that further studies should give priority on the households’ behavioral patterns rather than recording only the environmental parameters in the field studies.
In the systematic literature analysis, it was found that passive design systems are not highly effective in providing elderly occupants’ thermal comfort in Canada. Few studies have been conducted on passive strategies to consider the discrepancies of adaptive thermal comfort thresholds during extreme cold wintery conditions in Canada (Tetelbaum et al., 2020; Ryu et al., 2020). It was found that active heating systems were considered to keep warmer indoor environment conditions; therefore, it was difficult to adjust human body for changing indoor air temperatures (Wang et al., 2018). Furthermore, the study was recommended passive heating systems should be investigated to reduce energy cost and optimise thermal comfort in Canada (ibid). On the contrary, high airtightness of buildings could avoid air leakages in order to maintain the optimum indoor environmental conditions both in the summer and winter (Kanteh-Sakiliba et al, 2020).
It was found that moisture content tends to be an issue in fully airtight mixed-mode buildings (Jeong et al., 2016). Although, energy efficient heat pump systems could allow to dissipate fresh air in order to improve the air quality, but the high up-front cost of heat pumps were not found to be economically viable option by the investors during the decision-making process therefore, their long-term viability is not considered (Santangelo et al., 2018). The study was recommended that effective humidity control systems should be implemented to optimise indoor thermal conditions because of the condensation issues related with buildings’ construction materials (ibid). Santangelo and Tondelli (2017) indicated that window-to-wall-ratio (WWR) and orientation of opaque glazed surfaces have caused overheating risk in the summer. To this extend, Day and Gunderson (2015) recommended that avoiding thermal bridges and implementation of energy efficient insulation materials could provide thermally comfortable conditions in the winter, but these retrofitting principles could lead to make buildings’ warmer in the summer. Notably, excessive sun radiation can be harnessed in south facing buildings but both appropriate fenestration design and shading systems are required to reduce overheating risk factor (Porritt et al., 2011).
In the ASHRAE Global Thermal Comfort Database, it was found that thermal comfort can be achieved through subject respondents’ clothing insulation level (clo) factor included into the phyton script, as shown in Figure 22 (a) and (b). Candido et al. (2010) indicated that the installation of HVAC systems has caused to reduce the air movement acceptability thresholds. With regards to maintain optimum thermal comfort mixed-mode ventilation strategies are recommended to reduce high energy cost of buildings (ibid). Nicol (2004) indicated that occupants’ thermal comfort adaptation is important but considering their psychological behavior could bring significant impact on the development of adaptive models globally.
Han et al. (2009) stressed that the importance of humidity index factor in the tropical wet and dry/savanna climate of India. Although, none of the studies have been explored the humidity index factor on the identification of elderly peoples’ adaptive thermal comfort. To accomplish this, a total of 42 original research papers were reviewed by selection three main keywords namely, thermal comfort, passive heating and cooling strategies. It was found that considerable number of studies were considered energy effectiveness of passive cooling strategies in the composite climate of India but there is very little research undertaken in the tropical and dry/savannah climate regions. It was also found that there are many discrepancies in the ASHRAE Global Thermal Comfort Database II because of the uncertainty of field measurements.
In the present study, it was found that thermal comfort assessment was difficult in the hot and arid climate of Abu Dhabi. In this study, it was recommended that passive cooling strategies could optimise the excessive solar radiation in the summer. This has been accepted the most effective optimization strategy which could help to reduce energy energy consumption up to 81% in naturally ventilated multifamily social housing estates (Ozarisoy & Altan, 2021a). Ayyad (2011) also recommended that implementation of wind-catcher systems onto the north-south orientation is the most appropriate decision to avoid direct sunlight exposure. Fernandez-Aguera (2019) stressed that providing appropriate shading strategies is an important in the south-facing social housing blocks in Spain because of the long duration of solar radiation in the summer. This study was recommended that high thermal mass could help to optimise indoor air thermal comfort of each occupied spaces at home (ibid).
D'Souza (2014) indicated that implementation of green roof design principles also is appropriate for hot and arid regions such as Abu Dhabi. Therefore, this study was noted that water leakages, plant loos and water drainage issues have led difficulties to the users so that green roofs have not been accepted technically viable option in order to optimise occupants’ thermal comfort. Francis (2013) highlighted that wind catcher systems have been accepted the most effective strategy which has led stack effect to cool down indoor occupied spaces. It should be noted that integration of wind tower systems is a traditional technique used for space cooling in naturally ventilated buildings in Abu Dhabi. Recently, most buildings are adopted western standards to optimise thermal comfort in Abu Dhabi and revival applicability of wind-catcher systems have been neglected.
Luo et al. (2018) indicated that there is a strong correlation between occupants’ thermal comfort and their habitual adaptive behaviour on window opening patterns. To conclude, further studies should pay attention on the development of adaptive thermal comfort models by exploring occupants’ attitudes. It was found that recommended adaptive thermal comfort thresholds are not reliable because of mechanical ventilation systems have led an overcooling issue for the Abu Dhabi climate. The study findings demonstrated that excessively lower temperatures were identified in the inclusion of historic datasets from the ASHRAE Global Thermal Comfort Database I. Furthermore, climate change impact also has been accepted as an indicator while assessing occupants’ TSVs. Recent studies indicated that relying on using A/C systems will be risen exponentially in the next decades because of occupants are still required to maintain thermal comfort in their occupied spaces. Elessawy (2020) stressed that high immigration rate is also considerable factor to determine the adaptive thermal comfort thresholds in Abu Dhabi. One of the main reasons that immigrants’ habits and thermal perception have shown differences. This could result in many discrepancies in the statistical datasets while assessing the subject respondents’ TSVs by considering the PMV model.
To sum up, passive cooling design strategies can be added by considering the local climate conditions depending on further studies. This evidence-based framework can be used to inform future design guidelines, regulations for the development of adaptive thermal comfort theory to mitigate future extreme heat events.
5.3. Limitations
This systematic review article comprehensively analysed different adaptive thermal comfort models and revival applicability of passive cooling design strategies to provide an evidence-based adaptive thermal comfort model. In the meta-analysis, it was found that gender is the most determinant factor on the elderly people’s TSVs’ assessment. This has been attributed to the identification of their health conditions which has direct impact on the PMV model. In field measurements, it was found that wide range of classification criteria has caused difficulties to determine thermal acceptability level.
This present study has revealed that both physiological and psychological thermal adaptation parameters could attribute to the influences on overall TSVs. The greater extant literature was conducted to explore participants’ in-vivo experiences with field measurements but there is very little research undertaken considering their gender and lifestyle. This is mainly due to the limited of field studies were conducted to identify deterministic factors such as clothing insulation level (clo), metabolic activity rate (met) and body mass index on the development of an adaptive thermal comfort globally. This knowledge gap should be addressed, and further scholars should donate their field studies to the ASHRAE Global Thermal Comfort Database in order to provide more reliable data in the TSVs’ assessment.
The present study was found that there is wealth amount of data was conducted on the thermal comfort assessment but most of the research outputs has shown contradictory results while considering the local climate conditions. Many scholars expressed that participants’ both subjective and personal experiences should be considered to identify neutral adaptive thermal comfort. This could help to reduce research bias and develop an evidence-based deterministic models for the TSV assessment. It also was found that there is a misinterpretation of the TSV findings because of language barriers of subject participants while responding to the questionnaire survey. Additionally, many studies have been focused to evaluate energy effectiveness of passive cooling design strategies in line with considering different climate zones but none of these studies were investigated occupants, thermal comfort within the field measurements.
It was found that using the open-access available datasets should require careful attention to determine the appropriateness of each data for the adaptive thermal comfort assessment. In this review article, the study was aimed to analyse four different climate zones namely Canada, India, Abu Dhabi and the South-eastern Mediterranean basin to provide background for the development of passive cooling design strategies hence the identification of adaptive thermal comfort models should require more research based on field measurements. It should be noted that behavioral patterns were found the most difficult parameters which could directly linked with the TSV assessment. Studies recommended that households’ lifestyles and their habitual adaptive behavior should be considered with local parameters in the statistical analysis. To sum up, this review article demonstrates the significance of climate differences on the adaptive thermal comfort development therefore the lack of users’ experiences on the window opening and closing patterns are the limitations. Notably, the study was also found that there is also very little research conducted on the implementation of passive heating and cooling systems and its impact on the adaptive thermal comfort in Canada and this aspect should be addressed by further scholars.
6. Conclusions
This article reviewed energy effectiveness of state-of-the-art passive systems in providing neutral adaptive thermal comfort for elderly people, through exploring passive design strategies in four distinct climates namely, Canada, India, Abu Dhabi and the South-eastern Mediterranean basin. In addition, available data provided by the ASHRAE Global Thermal Comfort Database II record version 2.1 was analyzed in the present study. The development of an effective methodological framework for the on-going development of adaptive thermal comfort theory was accomplished first by analyzing the impacts of climate change in passive system design strategies and adopting the meta-analysis method to determine the input variables for the statistical analysis. Occupants’ thermal sensation votes (TSVs) were assessed by using Cramer’s V and Fisher’s Exact tests and the results showed some discrepancies between the in-situ field experiments and the data recorded in the ASHRAE Global Thermal Comfort Database II.
The meta-analysis findings revealed that age bands were significantly related to the health conditions, and this relationship was strong (χ² = 73,739, p < 0,001, Cramer’s V = 0,496). Younger age appeared to report better health condition (good or very good) than older age. Household occupations were also significantly associated with age with a moderate-strong relationship (χ² = 44,810, p < 0,001, Cramer’s V = 0,399). Of the surveyed flats, 73% had owner-occupiers whose ages ranged between 55 and 65 or were 65 and older; these age bands were in the high-income group, and the energy consumption of these households was higher than the national average, all of which demonstrates an association between age and level-of-income factors, which suggests that household socio-demographic characteristics should be evaluated before any type of adaptive thermal comfort model is developed.
Funding
The work presented is the outcome of the SEES 586: Environmental design and engineering course’s research output as part of the MSc in Sustainable Environment and Energy Systems (SEES) Graduate Program at the Middle East Technical University Northern Cyprus Campus.
Acknowledgments
The lead author (Mrs Nyasha Bema) primarily thanks to Assoc. Prof. Ceren Ince Derogar, Civil Engineering Program, Center for Sustainability, Middle East Technical University Northern Cyprus Campus, North Cyprus. The lead author would also like to acknowledge the Sustainable Environment and Energy Systems (SEES) Graduate Program at the Middle East Technical University Northern Cyprus Campus.
Conflicts of Interest
The authors declare no known competing financial interests or personal relationships that could have appeared to influence the work reported in this paper.
Graphical Abstract
The methodological workflow developed for the empirical study.
Data set in Mendeley
Data set to this article can be found online at –
Data set A
List of variables for the statistical analysis.
Data set B
Descriptive statistics for all variables.
Data set C
Normality test outcomes.
Data set D
Outliers test outcomes.
Data set E
Contingency tables in APA style formatting.
Nomenclature
| Nomenclature | |
| °C | Celsius |
| p | Significant level |
| r | Number of elementary effects per parameter |
| R2 | R-squared (%) |
| Ta | Indoor air temperature |
| To | Outdoor air temperature |
| Abbreviations | |
| A/C | Air-Conditioning |
| ASHRAE | American Society of Heating, Refrigerating and Air-conditioning Engineers |
| BS | British Standards |
| CBE | Center of the Built Environment |
| CCHT | Canadian Centre for Housing Technology |
| CIBSE | Chartered Institution of Building Services Engineers |
| CWEC | Canadian Weather for Energy Calculations |
| EAHE | Earth Air Heat Exchanger |
| EDSL | Environmental Design Solutions |
| EN | European Norm |
| FLIR | Forward-Looking Infrared Thermometer |
| GHG | Greenhouse Gases |
| HIS | Heat Stress Index Factor |
| HVAC | Heating Ventilation and Air-Conditioning |
| IES | Integrated Environmental Solution |
| IMAC-R | India Model for Adaptive Comfort |
| IRT | Infrared Radiometer Thermography |
| OP | Operative Air Temperature |
| MCAR | Missing Completely at Random |
| PPD | Predicted Percentage of Dissatisfied |
| PMD | Predicted Mean Vote |
| RH | Relative Humidity |
| SD | Standard Deviation |
| SPSS | Statistical Package for the Social Sciences |
| SCAT | European Survey Research Project Database |
| TPV | Thermal Preference Votes |
| TSV | Thermal Sensation Votes |
| WWR | Window-to-Wall Ratio |
Appendix A
Figure A1.
Subject respondents’ thermal sensation votes by considering orientation factor. Sources: https://repository.uel.ac.uk/item/8q774 (accessed on 20/01/2023).
Figure A1.
Subject respondents’ thermal sensation votes by considering orientation factor. Sources: https://repository.uel.ac.uk/item/8q774 (accessed on 20/01/2023).
Figure A2.
Operative air temperature findings by considering orientation factor. Sources: https://repository.uel.ac.uk/item/8q774 (accessed on 20/01/2023).
Figure A2.
Operative air temperature findings by considering orientation factor. Sources: https://repository.uel.ac.uk/item/8q774 (accessed on 20/01/2023).
References
- Al-Azri, N., Zurigatb, YH. & Al-Rawahia, N., 2013. Selection and assessment of passive cooling techniques for residential buildings in Oman using a bioclimatic approach. The Journal of Engineering Research, 10(2), 53-65.
- Al Tawayha, F., Braganca, L., & Mateus, R. (2019). Contribution of the vernacular architecture to the sustainability: A comparative study between the contemporary areas and the old quarter of a Mediterranean city. Sustainability (Switzerland), 11(3). [CrossRef]
- Altomonte, S., Allen, J., Bluyssen, P. M., Brager, G., Heschong, L., Loder, A., Schiavon, S., Veitch, J. A., Wang, L., & Wargocki, P. (2020). Ten questions concerning well-being in the built environment. Building and Environment, 180. [CrossRef]
- Bencheikh, D., & Bederina, M. (2019). Assessing the duality of thermal performance and energy efficiency of residential buildings in hot arid climate of Laghouat, Algeria. International Journal of Energy and Environmental Engineering. [CrossRef]
- Bonte, M., Thellier, F., & Lartigue, B. (2014). Impact of occupant’s actions on energy building performance and thermal sensation. Energy and Buildings, 76, 219–227. [CrossRef]
- Bouden, C., & Ghrab, N. (2005). An adaptive thermal comfort model for the Tunisian context: A field study results. Energy and Buildings, 37(9), 952–963. [CrossRef]
- Brager, G. S., & de Dear, R. (n.d.). Climate, Comfort & Natural Ventilation: A new adaptive comfort standard for ASHRAE Standard 55.
- Brager ’i, G. S., & de Dear ’, R. J. (1998). Thermal adaptation in the built environment: a literature review. In ELSEVIEK Energy and Building\ (Vol. 17).
- Busch, J.F. (1992). A tale of two populations: thermal comfort in air-conditioned and naturally ventilated offices in Thailand. Energy and Buildings, 18(3–4), 235–249. [CrossRef]
- Cândido, C., de Dear, R. J., Lamberts, R., & Bittencourt, L. (2010). Air movement acceptability limits and thermal comfort in Brazil’s hot humid climate zone. Building and Environment, 45(1), 222–229. [CrossRef]
- Cao, B., Zhu, Y., Ouyang, Q., Zhou, X., & Huang, L. (2011). Field study of human thermal comfort and thermal adaptability during the summer and winter in Beijing. In Energy and Buildings (Vol. 43, pp. 1051–1056). [CrossRef]
- Carlucci, S., Bai, L., de Dear, R., & Yang, L. (2018). Review of adaptive thermal comfort models in built environmental regulatory documents. Building and Environment. Elsevier Ltd. [CrossRef]
- Case, C. (2017). Performance of Passive Design Architecture Application in Hot and Dry Performance of Passive Design Architecture Application in Hot and Dry Climate. Case study: Cairo, Egypt, (July).
- Chen, S., Liu, C., Lin, G., Hänninen, O., Dong, H., & Xiong, K. (2021). The role of absolute humidity in respiratory mortality in Guangzhou, a hot and wet city of South China. Environmental Health and Preventive Medicine, 26(1). [CrossRef]
- Cheung, T., Schiavon, S., Parkinson, T., Li, P., & Brager, G. (2019). Analysis of the accuracy on PMV – PPD model using the ASHRAE Global Thermal Comfort Database II. Building and Environment, 153, 205–217. [CrossRef]
- Coley, D., Herrera, M., Fosas, D., Liu, C., & Vellei, M. (2017). Probabilistic adaptive thermal comfort for resilient design. Building and Environment, 123, 109–118. [CrossRef]
- Dabaieh, M., & Serageldin, A. A. (2020). Earth air heat exchanger, Trombe wall and green wall for passive heating and cooling in premium passive refugee house in Sweden. Energy Conversion and Management, 209, 112555. [CrossRef]
- Day, J.K., & Gunderson, D. E. (2015). Understanding high performance buildings: The link between occupant knowledge of passive design systems, corresponding behaviors, occupant comfort and environmental satisfaction. Building and Environment, 84, 114–124. [CrossRef]
- De Dear, R., & Brager, G. S. (2001). The adaptive model of thermal comfort and energy conservation in the built environment. International Journal of Biometeorology, 45(2), 100–108. [CrossRef]
- De Dear, R. J., Akimoto, T., Arens, E. A., Brager, G., Candido, C., Cheong, K. W. D., Li, B., Nishihara, N., Sekhar, S. C., Tanabe, S., Toftum, J., Zhang, H., & Zhu, Y. (2013). Progress in thermal comfort research over the last twenty years. In Indoor Air (Vol. 23, Issue 6, pp. 442–461). [CrossRef]
- De Dear, R., Kim, J., & Parkinson, T. (2018). Residential adaptive comfort in a humid subtropical climate—Sydney Australia. Energy and Buildings, 158, 1296–1305. [CrossRef]
- De Dear, R., Xiong, J., Kim, J., & Cao, B. (2020). A review of adaptive thermal comfort research since 1998. Energy and Buildings. Elsevier Ltd. [CrossRef]
- De Vecchi, R., Cândido, C., & Lamberts, R. (2012). Thermal history and its influence on occupants’ thermal acceptability and cooling preferences in warm-humid climates: A new desire for comfort. In Proceedings of 7th Windsor Conference: The Changing Context of Comfort in an Unpredictable World.
- Dhaka, S., Mathur, J., Brager, G., & Honnekeri, A. (2015). Assessment of thermal environmental conditions and quantification of thermal adaptation in naturally ventilated buildings in composite climate of India. Building and Environment, 86, 17–28. [CrossRef]
- Djamila, H. (2017). Indoor thermal comfort predictions: Selected issues and trends. Renewable and Sustainable Energy Reviews, 74, 569–580.
- Dong, X., Soebarto, V., & Griffith, M. (2014). Achieving thermal comfort in naturally ventilated rammed earth houses. Building and Environment, 82, 588–598. [CrossRef]
- D’souza, U. (2013). The thermal performance of green roofs in a hot, humid microclimate. Transactions on Ecology and The Environment, 173, 1743–3541. [CrossRef]
- D’Souza, U. (2014). Measuring green roof performance, a solution to sustainable urban development in the uae. International Journal of Sustainable Development and Planning, 9(3), 376–388. [CrossRef]
- Duarte Roa, C., Schiavon, S., & Parkinson, T. (2020). Targeted occupant surveys: A novel method to effectively relate occupant feedback with environmental conditions. Building and Environment, 184. [CrossRef]
- Elessawy, F. M. (2020). The Consequences of Population Growth on the Demographic Characteristics of Abu Dhabi City in the United Arab Emirates. Advances in Economics and Business, 8(5), 268–276. [CrossRef]
- Encinas, F., & De Herde, A. (2013). Sensitivity analysis in building performance simulation for summer comfort assessment of apartments from the real estate market. Energy and Buildings, 65, 55–65. [CrossRef]
- Fabi, V., Andersen, R. V., Corgnati, S., & Olesen, B. W. (2012). Occupants’ window opening behaviour: A literature review of factors influencing occupant behaviour and models. Building and Environment, 58, 188–198. [CrossRef]
- Fanger, P.O. (1973). Assessment of man’s thermal comfort in practice. [CrossRef]
- Fernandez-Antolin, M. M., del Río, J. M., Costanzo, V., Nocera, F., & Gonzalez-Lezcano, R. A. (2019). Passive design strategies for residential buildings in different Spanish climate zones. Sustainability (Switzerland), 11(18). [CrossRef]
- Fernandes, J., Mateus, R., Gervásio, H., Silva, S. M., & Bragança, L. (2019). Passive strategies used in Southern Portugal vernacular rammed earth buildings and their influence in thermal performance. Renewable Energy, 142, 345–363. [CrossRef]
- Földváry, V., Bekö, G., Langer, S., Arrhenius, K., & Petráš, D. (2017). Effect of energy renovation on indoor air quality in multifamily residential buildings in Slovakia. Building and Environment, 122, 363–372. [CrossRef]
- Földváry Ličina, V., Cheung, T., Zhang, H., de Dear, R., Parkinson, T., Arens, E., Chun, C., Schiavon, S., Luo, M., Brager, G., Li, P., Kaam, S., Adebamowo, M. A., Andamon, M. M., Babich, F., Bouden, C., Bukovianska, H., Candido, C., Cao, B., … Zhou, X. (2018). Development of the ASHRAE Global Thermal Comfort Database II. Building and Environment, 142, 502–512. [CrossRef]
- Forcada, N., Gangolells, M., Casals, M., Tejedor, B., Macarulla, M., & Gaspar, K. (2021). Field study on thermal comfort in nursing homes in heated environments. Energy and Buildings, 244. [CrossRef]
- Fountain, M., Brager, G., & de Dear, R. (1996). E IE GY AHD BUILDIPIG Expectations of indoor climate control. In Energy and Buildings (Vol. 24).
- Francis, M. (2013). Network for Comfort and Energy Use in Buildings A ventilation system for Abu Dhabi using a Solar Chimney, an Earth Tube and a Desiccant Wheel.
- Gaetani, I., Hoes, P. J., & Hensen, J. L. M. (2016). Occupant behavior in building energy simulation: Towards a fit-for-purpose modeling strategy. Energy and Buildings, 121, 188–204. [CrossRef]
- Geronazzo, A., Brager, G., & Manu, S. (2018). Making sense of building data: New analysis methods for understanding indoor climate. Building and Environment, 128, 260–271. [CrossRef]
- Givoni B. (1994). In Passive and Low Energy Cooling of Buildings, p. 33, Van Nostrand Reinhold.
- Golzari, N. (2014). Re-reading affordable technologies: the role of techno cultural elements and invisible technologies in sustainable design for the middle east. PhD thesis, University of Westminster.
- Gupta, N. (2017). Exploring passive cooling potentials in Indian vernacular architecture. Journal of Buildings and Sustainability, 2(1), 1–11.
- Gustin, M., McLeod, R. S., & Lomas, K. J. (2019). Can semi-parametric additive models outperform linear models, when forecasting indoor temperatures in free-running buildings? Energy and Buildings, 193, 250–266. [CrossRef]
- Halawa, E., & Van Hoof, J. (2012). The adaptive approach to thermal comfort: A critical overview. Energy and Buildings. [CrossRef]
- Haldi, F., & Robinson, D. (2010). On the unification of thermal perception and adaptive actions. Building and Environment, 45(11), 2440–2457. [CrossRef]
- Hawighorst, M., Schweiker, M., & Wagner, A. (2016). Thermo-specific self-efficacy (specSE) in relation to perceived comfort and control. Building and Environment, 102, 193–206. [CrossRef]
- He, Y., Parkinson, T., Arens, E., Zhang, H., Li, N., Peng, J., Elson, J., & Maranville, C. (2022). Creating alliesthesia in cool environments using personal comfort systems. Building and Environment, 209, 108642. [CrossRef]
- Heidari, S., & Sharples, S. (2002). A comparative analysis of short-term and long-term thermal comfort surveys in Iran. Energy and Buildings, 34(6), 607–614. [CrossRef]
- Huang, H., Binti Wan Mohd Nazi, W. I., Yu, Y., & Wang, Y. (2020). Energy performance of a high-rise residential building retrofitted to passive building standard – A case study. Applied Thermal Engineering, 181, 115902. [CrossRef]
- Ibraheem, O. and Ford, B. (2012). The feasibility of passive down-draught evaporative cooling for high-rise office buildings in Cairo. Architectural Science Review, 55(4), 315-327.
- Indraganti, M., Ooka, R., Rijal, H. B., & Brager, G. S. (2014). Adaptive model of thermal comfort for offices in hot and humid climates of India. Building and Environment, 74, 39–53. [CrossRef]
- Jara-Baeza, F., Rajagopalan, P., & Andamon, M. M. (2023). A holistic assessment of indoor environmental quality perception in Australian high-rise social housing. Energy and Buildings, 284. [CrossRef]
- Jeong, B., Jeong, J. W., & Park, J. S. (2016). Occupant behavior regarding the manual control of windows in residential buildings. Energy and Buildings, 127, 206–216. [CrossRef]
- Jin, X., Zhang, C., Xiao, F., Li, A., & Miller, C. (2023). A review and reflection on open datasets of city-level building energy use and their applications. Energy and Buildings, 285, 112911. [CrossRef]
- Jomehzadeh, F., Nejat, P., Calautit, J. K., Yusof, M. B. M., Zaki, S. A., Hughes, B. R., & Yazid, M. N. A. W. M. (2017). A review on windcatcher for passive cooling and natural ventilation in buildings, Part 1: Indoor air quality and thermal comfort assessment. Renewable and Sustainable Energy Reviews. Elsevier Ltd. 1. [CrossRef]
- Kalmár, F. (2016). Investigation of thermal perceptions of subjects with diverse thermal histories in warm indoor environment. Building and Environment, 107, 254–262. [CrossRef]
- Kanteh Sakiliba, S., Bolton, N., & Sooriyabandara, M. (2020). The Energy Performance and Techno-Economic Analysis of Zero Energy Bill Homes. Energy and Buildings, 228. [CrossRef]
- Kaynakli, O., & Kilic, M. (2005). Investigation of indoor thermal comfort under transient conditions. Building and Environment, 40(2), 165–174. [CrossRef]
- Kent, M., Parkinson, T., Kim, J., & Schiavon, S. (2021). A data-driven analysis of occupant workspace dissatisfaction. Building and Environment, 205. [CrossRef]
- Kim, J., de Dear, R., Parkinson, T., & Candido, C. (2017). Understanding patterns of adaptive comfort behaviour in the Sydney mixed-mode residential context. Energy and Buildings, 141, 274–283. [CrossRef]
- Kim, J., de Dear, R., Tartarini, F., Parkinson, T., & Cooper, P. (2019). Ventilation mode effect on thermal comfort in a mixed mode building. IOP Conference Series: Materials Science and Engineering, 609(4). [CrossRef]
- Kim, J., Schiavon, S., & Brager, G. (2018). Personal comfort models – A new paradigm in thermal comfort for occupant-centric environmental control. Building and Environment, 132, 114–124. [CrossRef]
- Kim, J., Tartarini, F., Parkinson, T., Cooper, P., & de Dear, R. (2019). Thermal comfort in a mixed-mode building: Are occupants more adaptive? Energy and Buildings, 203. [CrossRef]
- Kim, J., Zhou, Y., Schiavon, S., Raftery, P., & Brager, G. (2018). Personal comfort models: Predicting individuals’ thermal preference using occupant heating and cooling behavior and machine learning. Building and Environment, 129, 96–106. [CrossRef]
- Ko, W. H., Schiavon, S., Brager, G., & Levitt, B. (2018). Ventilation, thermal and luminous autonomy metrics for an integrated design process. Building and Environment, 145, 153–165. [CrossRef]
- Ko, W. H., Schiavon, S., Zhang, H., Graham, L. T., Brager, G., Mauss, I., & Lin, Y. W. (2020). The impact of a view from a window on thermal comfort, emotion, and cognitive performance. Building and Environment, 175. [CrossRef]
- Kumareswaran, K., Rajapaksha, I., & Jayasinghe, G. Y. (2021). Energy poverty, occupant comfort, and wellbeing in internally displaced people’s residences in Sri Lanka. Energy and Buildings, 236. [CrossRef]
- Landsman, J., Brager, G., & Doctor-Pingel, M. (2018). Performance, prediction, optimization, and user behavior of night ventilation. Energy and Buildings, 166, 60–72. [CrossRef]
- Li, H., Xu, G., Chen, J., & Duan, J. (2022). Investigating the Adaptive Thermal Comfort of the Elderly in Rural Mutual Aid Homes in Central Inner Mongolia. Sustainability (Switzerland), 14(11). [CrossRef]
- Li, P., Froese, T. M., & Brager, G. (2018). Post-occupancy evaluation: State-of-the-art analysis and state-of-the-practice review. In Building and Environment (Vol. 133, pp. 187–202). Elsevier Ltd. [CrossRef]
- Li, P., Parkinson, T., Brager, G., Schiavon, S., Cheung, T. C. T., & Froese, T. (2019). A data-driven approach to defining acceptable temperature ranges in buildings. Building and Environment, 153, 302–312. [CrossRef]
- Liu, J., Yao, R., & McCloy, R. (2012). A method to weight three categories of adaptive thermal comfort. Energy and Buildings, 47, 312–320. [CrossRef]
- Little, R. J. A. (1988). A test of missing completely at random for multivariate data with missing values. Journal of the American Statistical Association, 83, 1198–1202.
- Lu, S., Wang, W., Lin, C., & Hameen, E. C. (2019). Data-driven simulation of a thermal comfort-based temperature set-point control with ASHRAE RP884. Building and Environment, 156, 137–146. [CrossRef]
- Luo, M., Wang, Z., Brager, G., Cao, B., & Zhu, Y. (2018). Indoor climate experience, migration, and thermal comfort expectation in buildings. Building and Environment, 141, 262–272. [CrossRef]
- Luo, M., Zhang, H., Raftery, P., Zhou, L., Parkinson, T., Arens, E., He, Y., & Present, E. (2021). Detailed measured air speed distribution in four commercial buildings with ceiling fans. Building and Environment, 200. [CrossRef]
- Mishra, A.K., & Ramgopal, M. (2015). An adaptive thermal comfort model for the tropical climatic regions of India (Köppen climate type A). Building and Environment, 85, 134–143. [CrossRef]
- Mirahmadi, F., & Altan, H. (2018). A solution for future designs using techniques from vernacular architecture in southern Iran. Sustainable Buildings, 3, 1. [CrossRef]
- Newman, D. A. (2014). Missing Data: Five Practical Guidelines. Organizational Research Methods, 17(4), 372–411. [CrossRef]
- Nicol, F. (2004). Adaptive thermal comfort standards in the hot-humid tropics. In Energy and Buildings (Vol. 36, pp. 628–637). [CrossRef]
- Nicol, F., Wilson, M., & Chiancarella, C. (2006). Using field measurements of desktop illuminance in European offices to investigate its dependence on outdoor conditions and its effect on occupant satisfaction, and the use of lights and blinds. Energy and Buildings, 38(7), 802–813. [CrossRef]
- Nicol, F., & Humphreys, M. (2010). Derivation of the adaptive equations for thermal comfort in free-running buildings in European standard EN15251. Building and Environment, 45(1), 11–17. [CrossRef]
- Nicol, J.F and Humphreys M.A. (2010). Derivation of the equations for comfort in free- running buildings in CEN Standard EN15251, Buildings and Environment 45(1) 11-17 for more detail of the two standards and their similarities and differences.
- Nicol, F. (2017). Temperature and adaptive comfort in heated, cooled and free-running dwellings. Building Research & Information, 45(7), 730–744. [CrossRef]
- Nicol, F., Bahadur Rijal, H., Imagawa, H., & Thapa, R. (2020). The range and shape of thermal comfort and resilience. Energy and Buildings, 224. [CrossRef]
- Nikolopoulou, M., & Lykoudis, S. (2006). Thermal comfort in outdoor urban spaces: Analysis across different European countries. Building and Environment, 41(11), 1455–1470. [CrossRef]
- Niza, I. L., Luz, I. M. da, Bueno, A. M., & Broday, E. E. (2022). Thermal Comfort and Energy Efficiency: Challenges, Barriers, and Step towards Sustainability. Smart Cities, 5(4), 1721–1741. [CrossRef]
- Olesen, B. W., & Brager, G. S. (2004). UC Berkeley Indoor Environmental Quality (IEQ) Title Publication Date. https://escholarship.org/uc/item/2m34683k.
- Ozarisoy, B., & Altan, H. (2021a). A novel methodological framework for the optimisation of post-war social housing developments in the South-eastern Mediterranean climate: Policy design and life-cycle cost impact analysis of retrofitting strategies, Solar Energy, 225. [CrossRef]
- Ozarisoy, B., & Altan, H. (2021b). Regression forecasting of ‘neutral’ adaptive thermal comfort: A field study investigation in the south-eastern Mediterranean climate of Cyprus. Building and Environment, 202. [CrossRef]
- Ozarisoy, B. (2022). Assessing the Domestic Energy Use and Thermal Comfort of Occupants in a Post-war Social Housing Development Estate in Famagusta, Northern Cyprus. [CrossRef]
- Parker, J. (2020). The Leeds urban heat island and its implications for energy use and thermal comfort. Energy and Buildings. [CrossRef]
- Parkinson, T., de Dear, R., & Brager, G. (2020). Nudging the adaptive thermal comfort model. Energy and Buildings, 206. [CrossRef]
- Parkinson, T., Parkinson, A., & de Dear, R. (2019a). Continuous IEQ monitoring system: Context and development. Building and Environment, 149, 15–25. [CrossRef]
- Parkinson, T., Parkinson, A., & de Dear, R. (2019b). Continuous IEQ monitoring system: Performance specifications and thermal comfort classification. Building and Environment, 149, 241–252. [CrossRef]
- Parkinson, T., Schiavon, S., de Dear, R., & Brager, G. (2021). Overcooling of offices reveals gender inequity in thermal comfort. Scientific Reports, 11(1). [CrossRef]
- Parkinson, T., & Schweiker, M. (2022). New Approaches to Modelling Occupant Comfort. In Buildings (Vol. 12, Issue 7). MDPI. [CrossRef]
- Parkinson, T., Zhang, H., Arens, E., He, Y., de Dear, R., Elson, J., Parkinson, A., Maranville, C., & Wang, A. (2021). Predicting thermal pleasure experienced in dynamic environments from simulated cutaneous thermoreceptor activity. Indoor Air, 31(6), 2266–2280. [CrossRef]
- Pastore, L., & Andersen, M. (2019). Building energy certification versus user satisfaction with the indoor environment: Findings from a multi-site post-occupancy evaluation (POE) in Switzerland. Building and Environment, 150, 60–74. [CrossRef]
- Porritt, S., Shao, L., Cropper, P., & Goodier, C. (2011). Adapting dwellings for heat waves. Sustainable Cities and Society, 1(2), 81–90. [CrossRef]
- Rana, R., Kusy, B., Jurdak, R., Wall, J., & Hu, W. (2013). Feasibility analysis of using humidex as an indoor thermal comfort predictor. Energy and Buildings, 64, 17–25. [CrossRef]
- Rawal, R., Shukla, Y., Vardhan, V., Asrani, S., Schweiker, M., de Dear, R., Garg, V., Mathur, J., Prakash, S., Diddi, S., Ranjan, S. V., Siddiqui, A. N., & Somani, G. (2022). Adaptive thermal comfort model based on field studies in five climate zones across India. Building and Environment, 219. [CrossRef]
- Romero, R. A., Bojórquez, G., Corral, M., & Gallegos, R. (2013). Energy and the occupant’s thermal perception of low-income dwellings in hot-dry climate: Mexicali, México. Renewable Energy, 49, 267–270. [CrossRef]
- Ryu, J., Kim, J., Hong, W., & de Dear, R. (2020). Quantifying householder tolerance of thermal discomfort before turning on air-conditioner. Energy and Buildings, 211. [CrossRef]
- Rupp, R. F., Parkinson, T., Kim, J., Toftum, J., & de Dear, R. (2022). The impact of occupant’s thermal sensitivity on adaptive thermal comfort model. Building and Environment, 207. [CrossRef]
- Saber, H. H., Hajiah, A. E., & Maref, W. (2020). Impact of reflective roofs on the overall energy savings of whole buildings. E3S Web of Conferences, 172. [CrossRef]
- Sahebzadeh, S., Heidari, A., Kamelnia, H., & Baghbani, A. (2017). Sustainability features of Iran’s vernacular architecture: A comparative study between the architecture of hot-arid and hot-arid-windy regions. Sustainability (Switzerland), 9(5). [CrossRef]
- Sánchez-García, D., Rubio-Bellido, C., Pulido-Arcas, J. A., Guevara-García, F. J., & Canivell, J. (2018). Adaptive comfort models applied to existing Dwellings in Mediterranean climate considering globalwarming. Sustainability (Switzerland), 10(10). [CrossRef]
- Sanchez-Guevara, C., Núñez Peiró, M., Taylor, J., Mavrogianni, A., & Neila González, J. (2019). Assessing population vulnerability towards summer energy poverty: Case studies of Madrid and London. Energy and Buildings, 190, 132–143. [CrossRef]
- Santangelo, A., & Tondelli, S. (2017). Occupant behaviour and building renovation of the social housing stock: Current and future challenges. Energy and Buildings, 145, 276–283. [CrossRef]
- Santangelo, A., Yan, D., Feng, X., & Tondelli, S. (2018). Renovation strategies for the Italian public housing stock: Applying building energy simulation and occupant behaviour modelling to support decision-making process. Energy and Buildings, 167, 269–280. [CrossRef]
- Schiano-Phan, R. (2004). The development of passive downdraught evaporative cooling systems using porous ceramic evaporators and their application in residential buildings. PhD thesis, British Library, London.
- Schiano-Phan, R. (2009). The use of porous ceramic for passive evaporative cooling in buildings. Available from: http://www.phdc.eu/uploads/media/PHDC_Cooling_with_porous_ceramic_01-06-09.pdf.
- Schiano-Phan, R. (2010). Environmental retrofit: building integrated passive cooling in housing, Architectural Research Quarterly, Volume 14, Issue 02, pp 139-151. http://journals.cambridge.org/abstract_S1359135510000758.
- Schianao-Phan, R. (2012). Post-occupancy evaluation of non-domestic buildings using passive downdraught evaporative cooling in south-west USA. Architectural Science Review, 55(4), 1-21.
- Schweiker, M., & Wagner, A. (2015). A framework for an adaptive thermal heat balance model (ATHB). Building and Environment, 94(P1), 252–262. [CrossRef]
- Singh, S., & Chani, P. S. (2018). Thermal comfort analysis of Indian subjects in multi-storeyed apartments: An adaptive approach in composite climate. Indoor and Built Environment, 27(9), 1216–1246. [CrossRef]
- Singh, M. K., Mahapatra, S., & Atreya, S. K. (2011). Adaptive thermal comfort model for different climatic zones of North-East India. Applied Energy, 88(7), 2420–2428. [CrossRef]
- Song, Y., Sun, Y., Luo, S., Tian, Z., Hou, J., Kim, J., Parkinson, T., & de Dear, R. (2018). Residential adaptive comfort in a humid continental climate – Tianjin China. Energy and Buildings, 170, 115–121. [CrossRef]
- Taleghani, M., Tenpierik, M., Kurvers, S., & Van Den Dobbelsteen, A. (2013). A review into thermal comfort in buildings. Renewable and Sustainable Energy Reviews. [CrossRef]
- Tartarini, F., & Schiavon, S. (2020a). pythermalcomfort: A Python package for thermal comfort research. SoftwareX, 12. [CrossRef]
- Tartarini, F., Schiavon, S., Cheung, T., & Hoyt, T. (2020b). CBE Thermal Comfort Tool: Online tool for thermal comfort calculations and visualizations. SoftwareX, 12. [CrossRef]
- Teitelbaum, E., Jayathissa, P., Miller, C., & Meggers, F. (2020). Design with Comfort: Expanding the psychrometric chart with radiation and convection dimensions. Energy and Buildings, 209. [CrossRef]
- Tetteh, M. O., Darko, A., Chan, A. P. C., Jafari, A., Brilakis, I., Chen, W., Nani, G., & Kwame Yevu, S. (2022). Scientometric mapping of global research on green retrofitting of existing buildings (GREB): Pathway towards a holistic GREB framework. In Energy and Buildings (Vol. 277). Elsevier Ltd. [CrossRef]
- Toe, D. H. C., & Kubota, T. (2013). Development of an adaptive thermal comfort equation for naturally ventilated buildings in hot-humid climates using ASHRAE RP-884 database. Frontiers of Architectural Research, 2(3), 278–291. [CrossRef]
- Tuck, N. W., Zaki, S. A., Hagishima, A., Rijal, H. B., Zakaria, M. A., & Yakub, F. (2019). Effectiveness of free running passive cooling strategies for indoor thermal environments: Example from a two-storey corner terrace house in Malaysia. Building and Environment, 160. [CrossRef]
- Van Hoof, J., & Hensen, J. L. M. (2007). Quantifying the relevance of adaptive thermal comfort models in moderate thermal climate zones. Building and Environment, 42(1), 156–170. [CrossRef]
- Vellei, M., Herrera, M., Fosas, D., & Natarajan, S. (2017). The influence of relative humidity on adaptive thermal comfort. Building and Environment, 124, 171–185. [CrossRef]
- Yao, R., Li, B., & Liu, J. (2009). A theoretical adaptive model of thermal comfort - Adaptive Predicted Mean Vote (aPMV). Building and Environment, 44(10), 2089–2096. [CrossRef]
- Yang, J., Nam, I., & Sohn, J. R. (2016). The influence of seasonal characteristics in elderly thermal comfort in Korea. Energy and Buildings, 128, 583–591. [CrossRef]
- Yi, C. yoon, Childs, C., Peng, C., & Robinson, D. (2022a). Thermal comfort modelling of older people living in care homes: An evaluation of heat balance, adaptive comfort, and thermographic methods. Building and Environment, 207, 108550. [CrossRef]
- Yuan, J., Cong, Y., Yao, S., Dai, C., & Li, Y. (2022). Research on the thermal comfort of the elderly in rural areas of cold climate, China. Advances in Building Energy Research, 16(5), 612–642. [CrossRef]
- Wang, Z., de Dear, R., Luo, M., Lin, B., He, Y., Ghahramani, A., & Zhu, Y. (2018). Individual difference in thermal comfort: A literature review. In Building and Environment (Vol. 138, pp. 181–193). Elsevier Ltd. [CrossRef]
- Wang, Z., Parkinson, T., Li, P., Lin, B., & Hong, T. (2019). The Squeaky wheel: Machine learning for anomaly detection in subjective thermal comfort votes. Building and Environment, 151, 219–227. [CrossRef]
- Zhang, N., Cao, B., Wang, Z., Zhu, Y., & Lin, B. (2017). A comparison of winter indoor thermal environment and thermal comfort between regions in Europe, North America, and Asia. Building and Environment, 117, 208–217. [CrossRef]
- Zhao, Q., Lian, Z., & Lai, D. (2021). Thermal comfort models and their developments: A review. In Energy and Built Environment (Vol. 2, Issue 1, pp. 21–33). KeAi Communications Co. [CrossRef]
Figure 1.
(a) Average monthly temperature of Canada; (b) Average monthly temperature of India; (c) Average monthly temperature of Abu Dhabi. Sources: https://clima.cbe.berkeley.edu (accessed on 20/01/2023); maps were extracted from the ArcGIS Pro Version 2021.01 software suite, which was developed by Esri (UK).
Figure 2.
Correlations between air velocity and occupants’ thermal sensation votes. Source: https://www.vosviewer.com (accessed on 25/01/2023).
Figure 2.
Correlations between air velocity and occupants’ thermal sensation votes. Source: https://www.vosviewer.com (accessed on 25/01/2023).
Figure 3.
Humidity index criteria for (a) Canada; (b) India and (c) Abu Dhabi. Source: https://comfort.cbe.berkeley.edu (accessed on 25/01/2023).
Figure 3.
Humidity index criteria for (a) Canada; (b) India and (c) Abu Dhabi. Source: https://comfort.cbe.berkeley.edu (accessed on 25/01/2023).
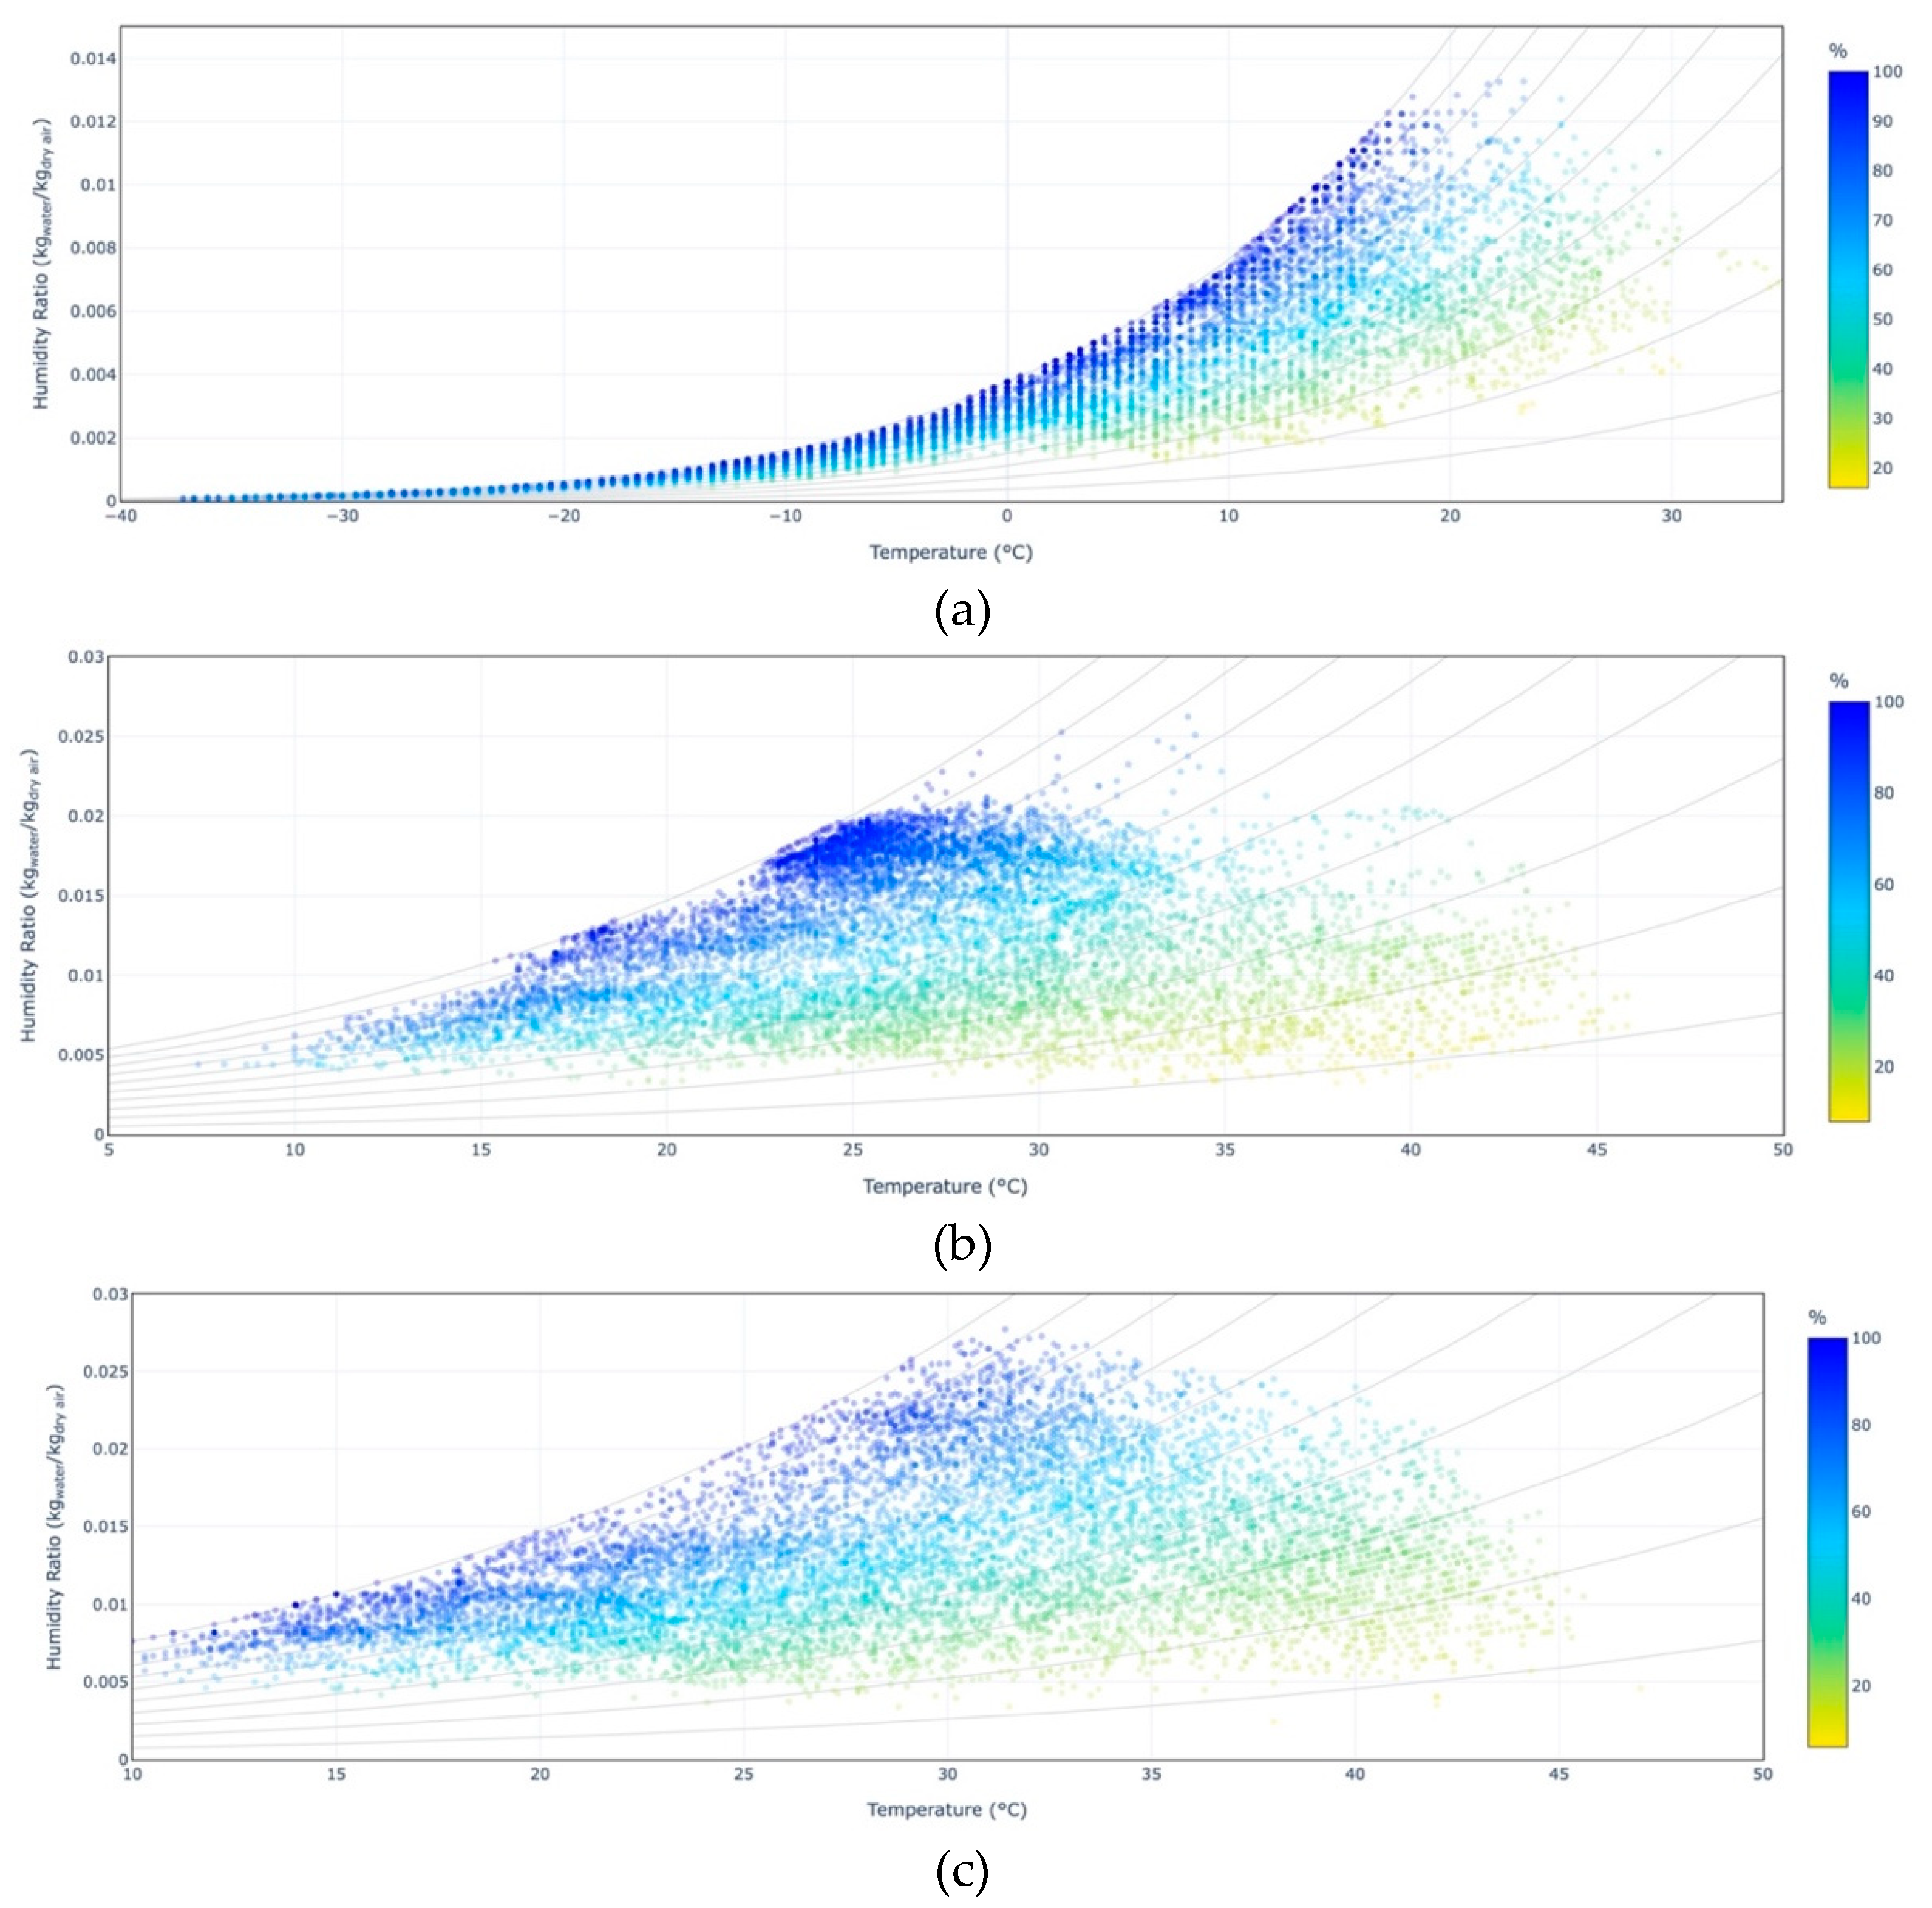
Figure 4.
Climate classification for (a) Canada; (b) India; (c) Abu Dhabi; (d) Wind frequency diagram for (e) Canada; (f) India; (e) Abu Dhabi. Sources: Climate classification maps were extracted from http://koeppen-geiger.vu-wien.ac.at (accessed on 15/01/2023); climate data was extracted from https://clima.cbe.berkeley.edu (accessed on 15/01/2023).
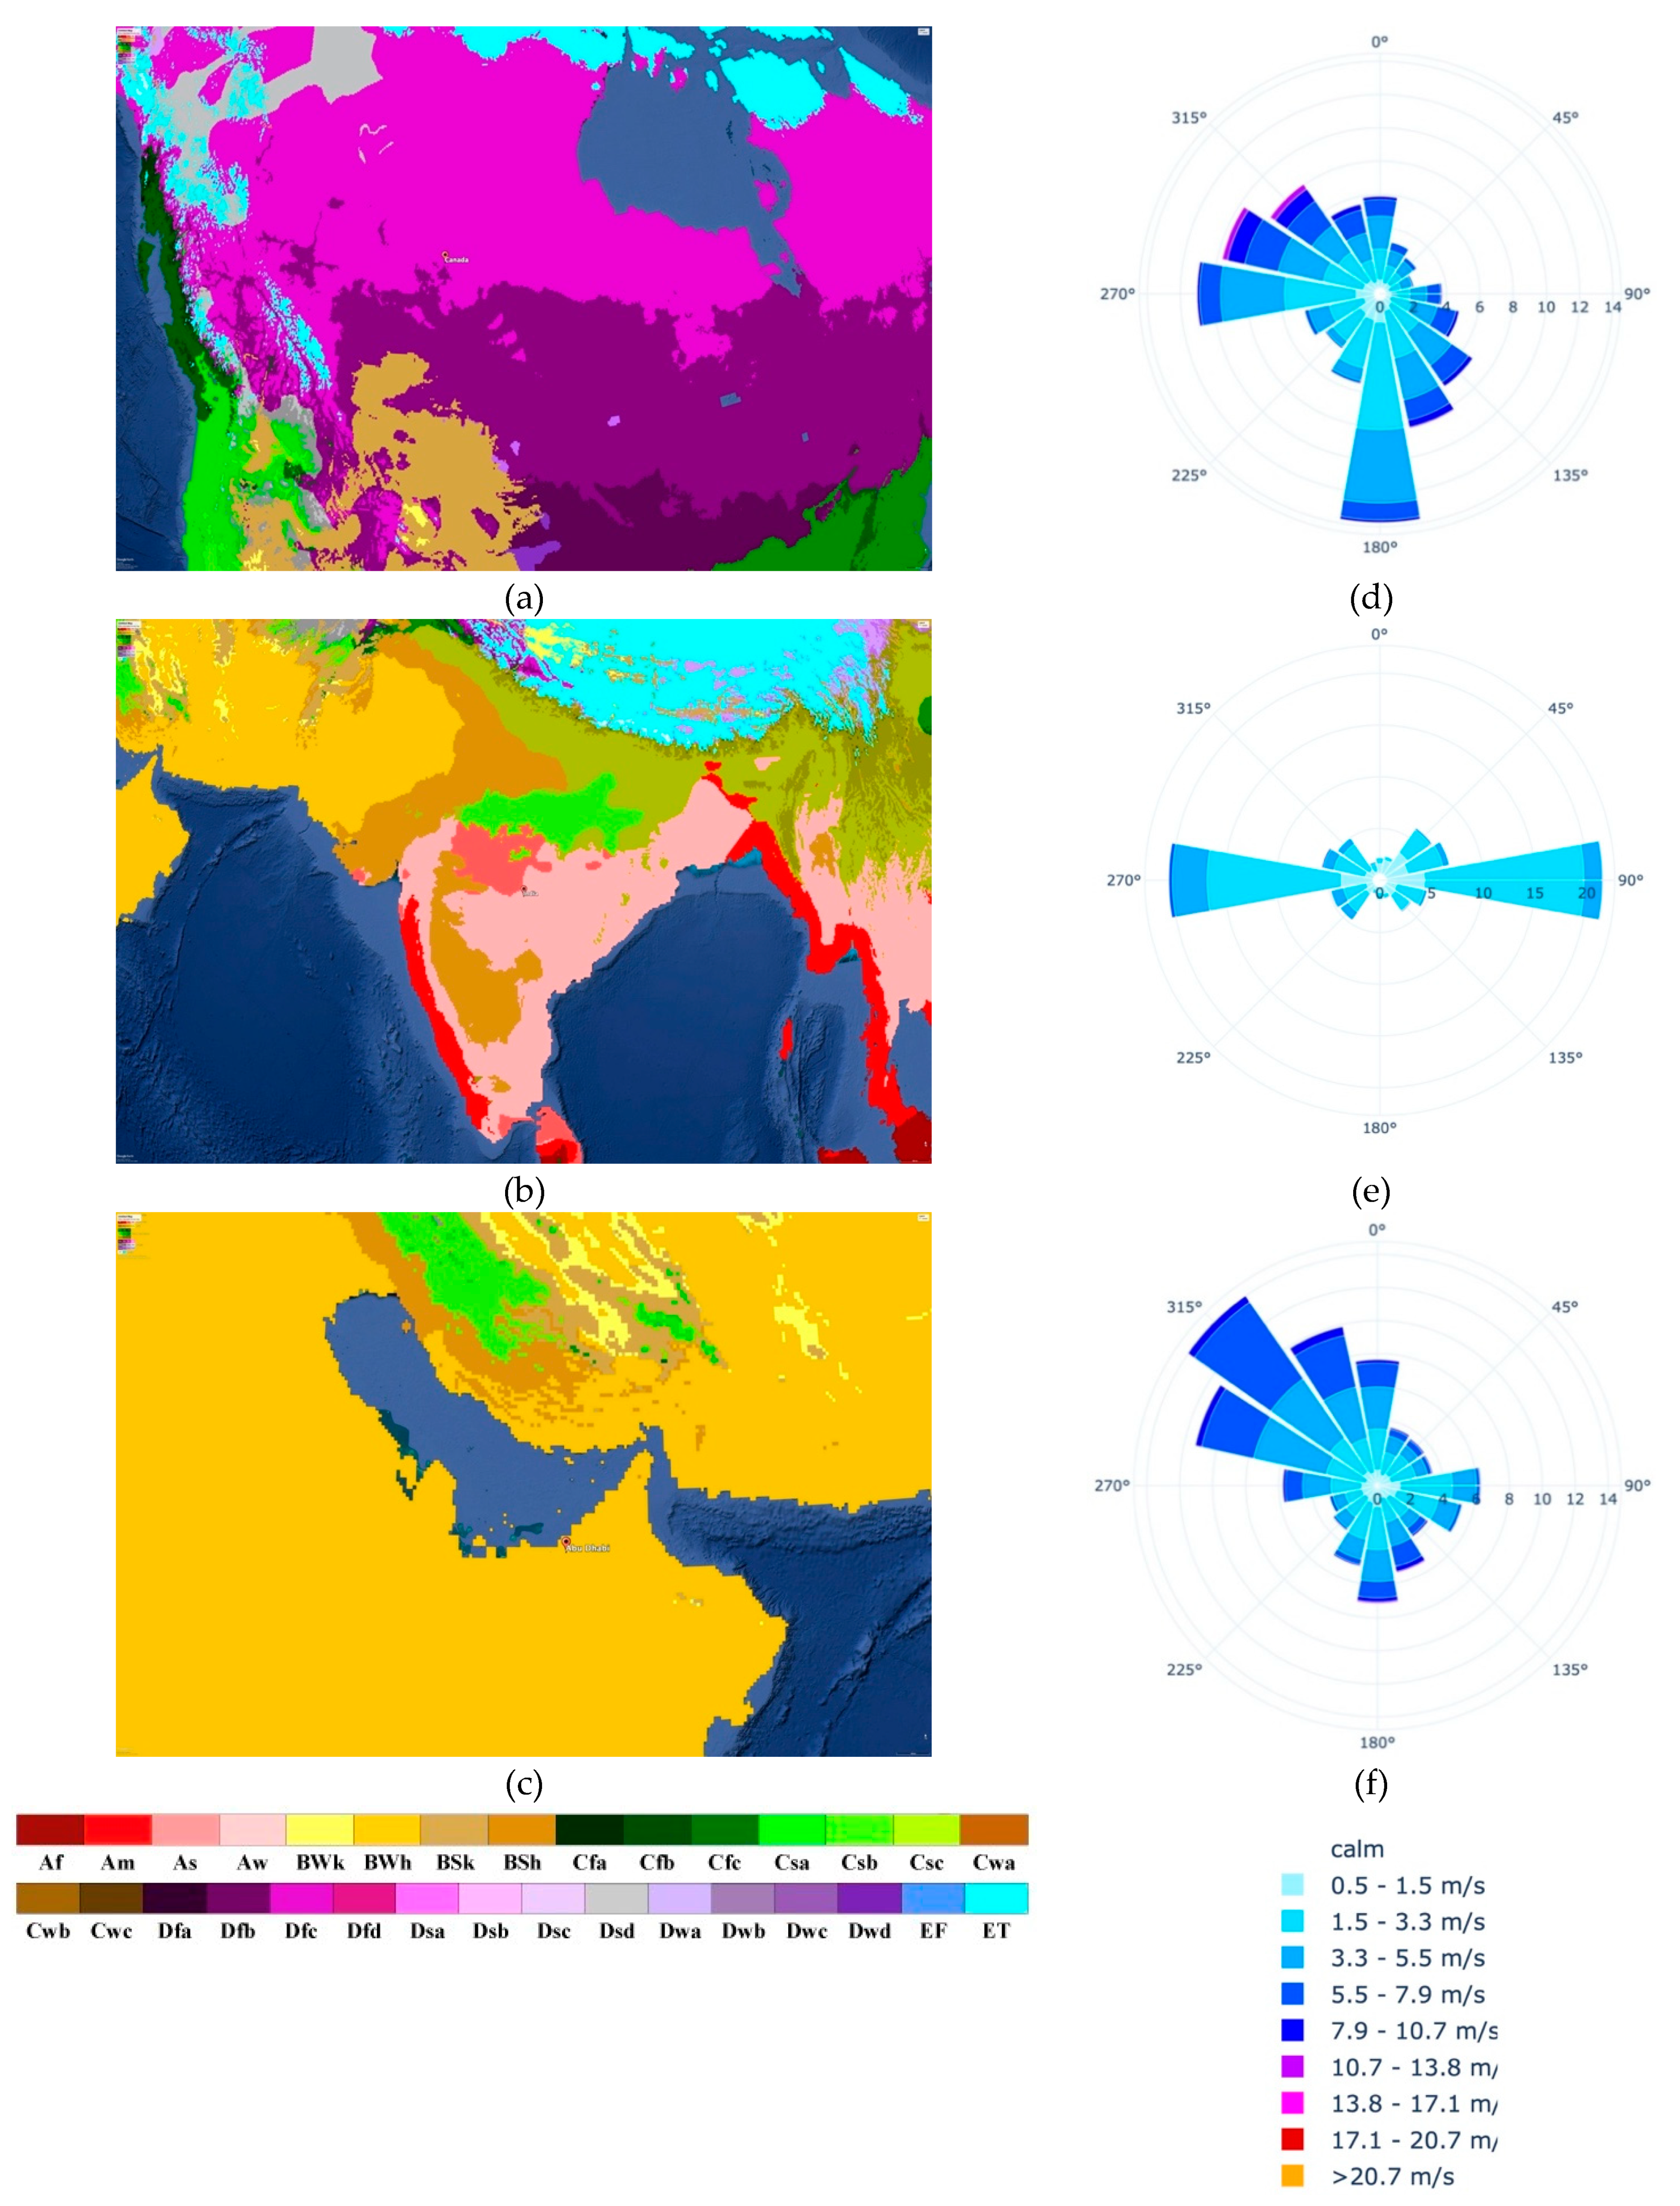
Figure 5.
Passive cooling design strategies implemented in the Eastern Mediterranean basin. Image Credit: Diagram was conceptualised by Ozarisoy, (2023).
Figure 5.
Passive cooling design strategies implemented in the Eastern Mediterranean basin. Image Credit: Diagram was conceptualised by Ozarisoy, (2023).
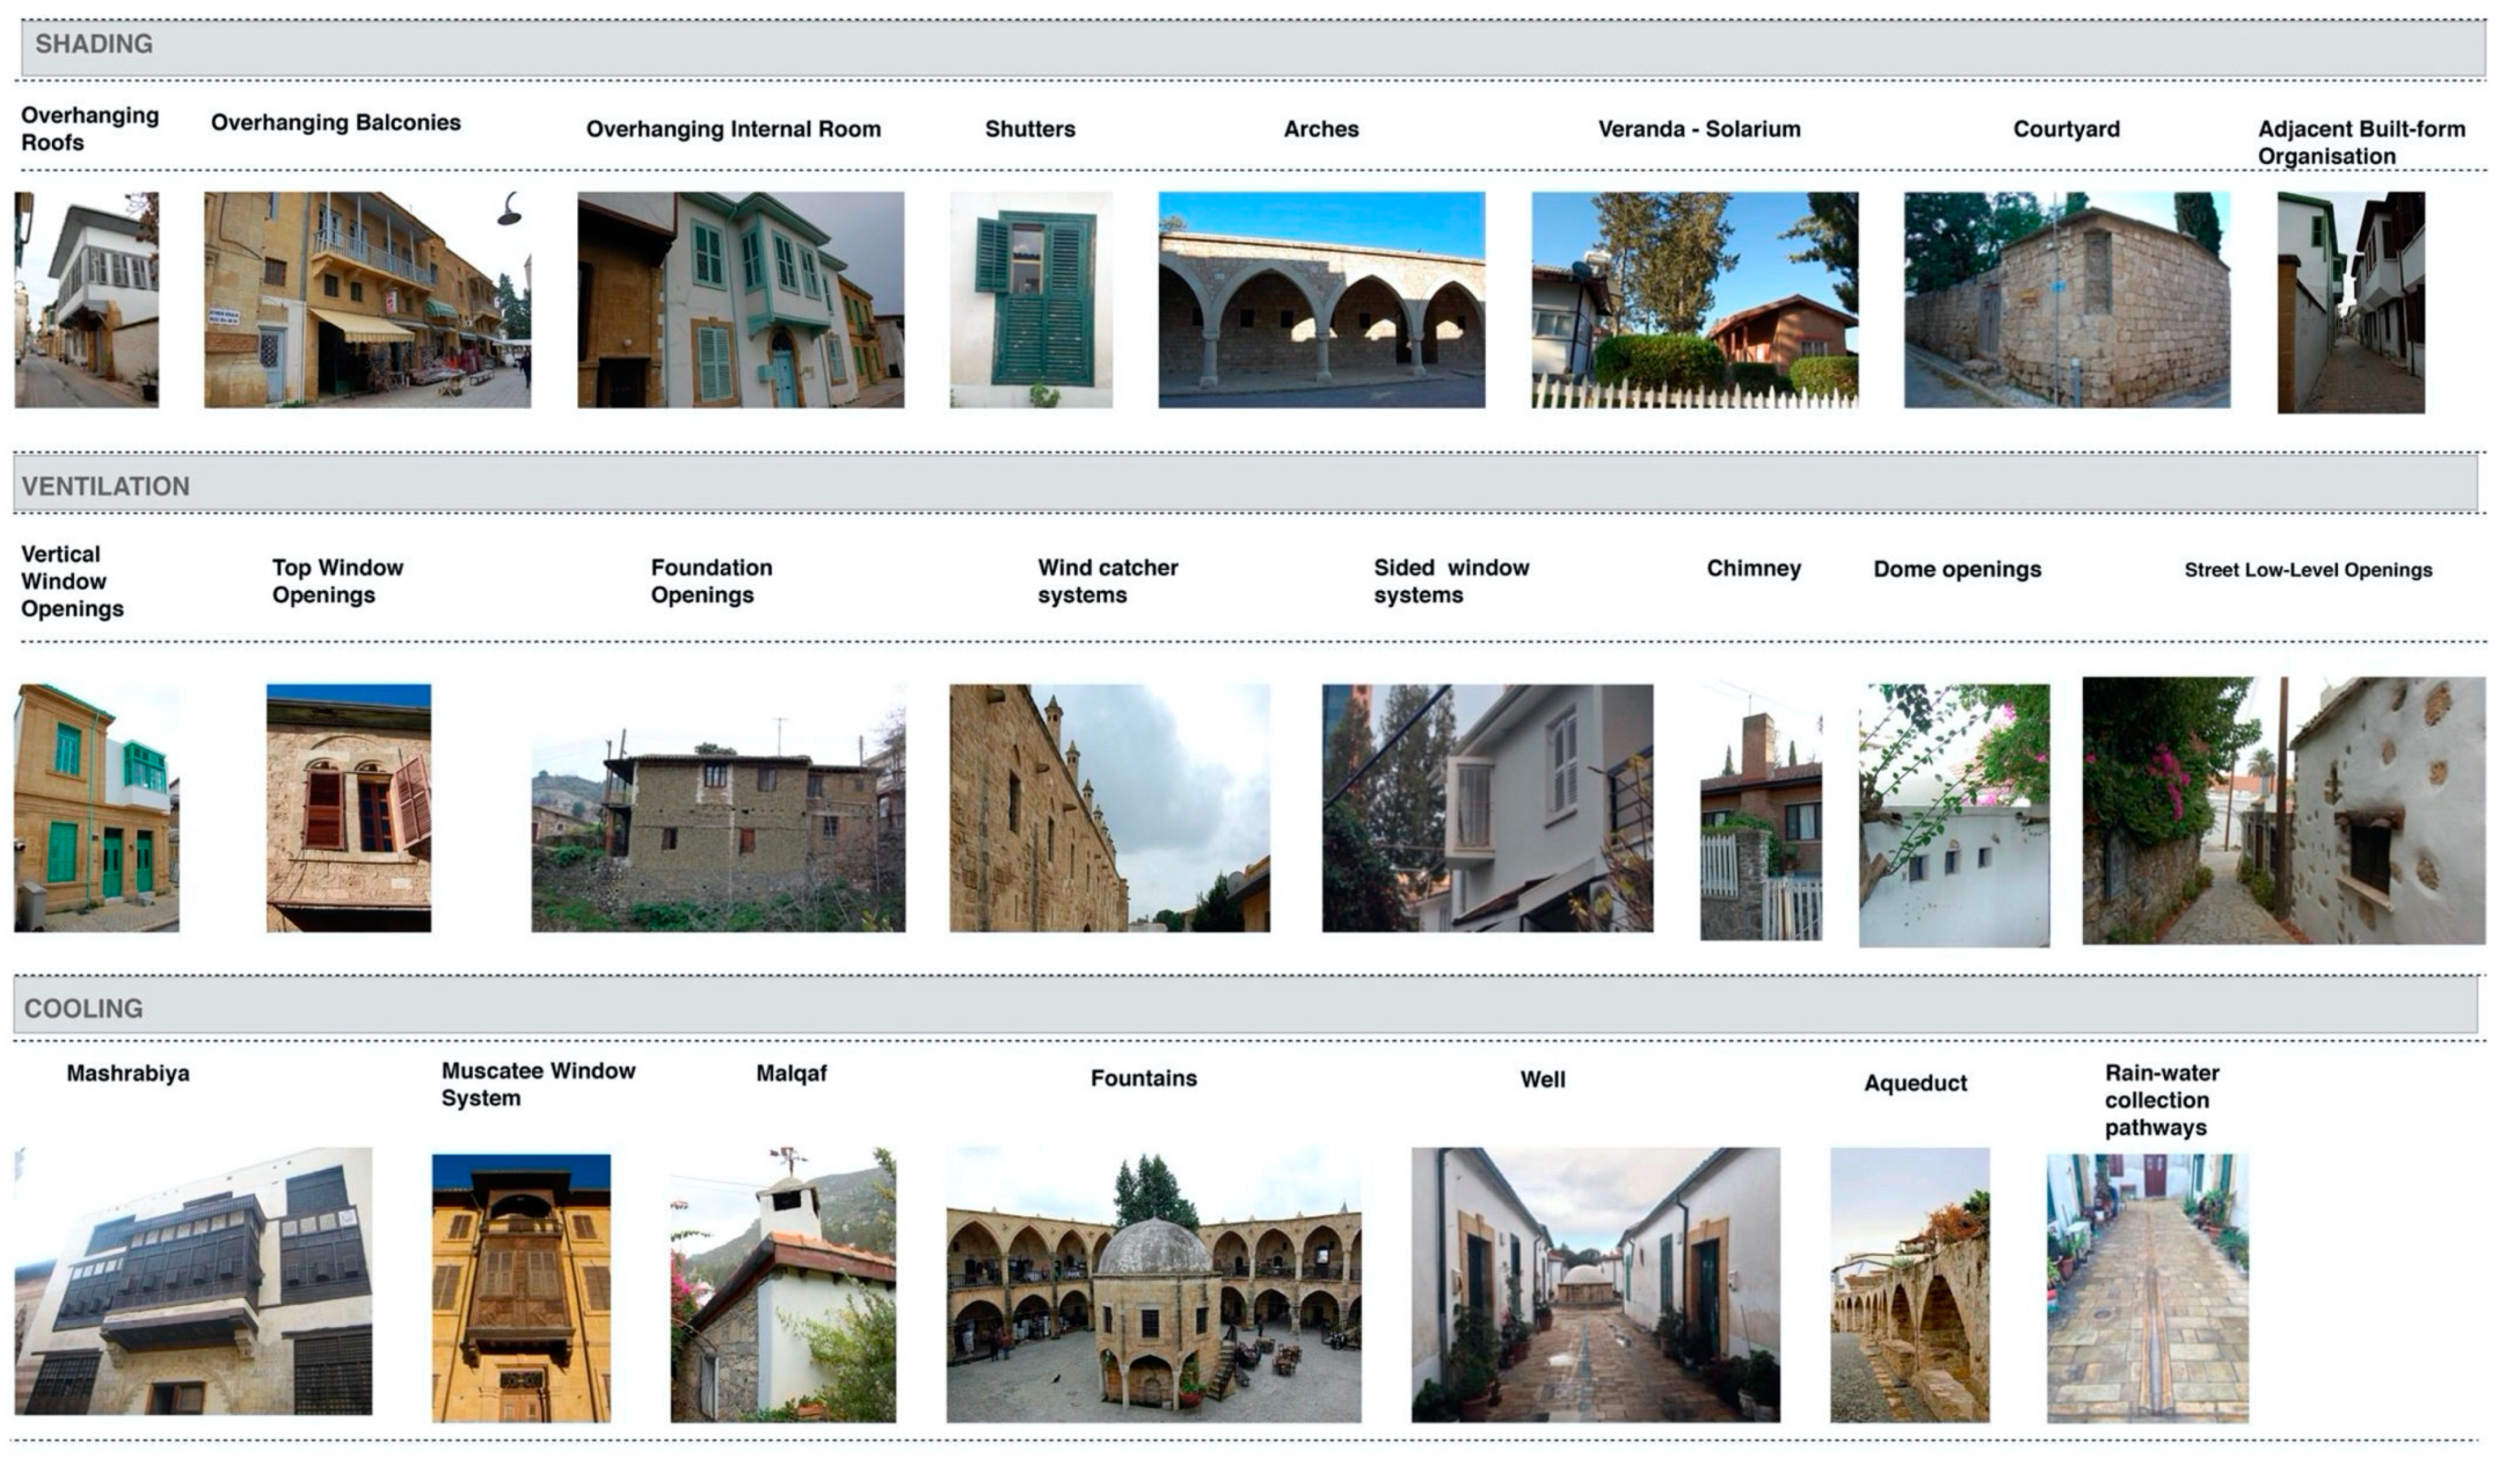
Figure 6.
(a) Facade of a vernacular building that shows how porous ceramic and wind-escape produce internal air movement; the arrows indicate the direction of airflow, and arrow length corresponds with airspeed (b) Mashrabiya element for passive-cooling in a vernacular house in Cyprus. Images Credit: Ozarisoy, (2023).
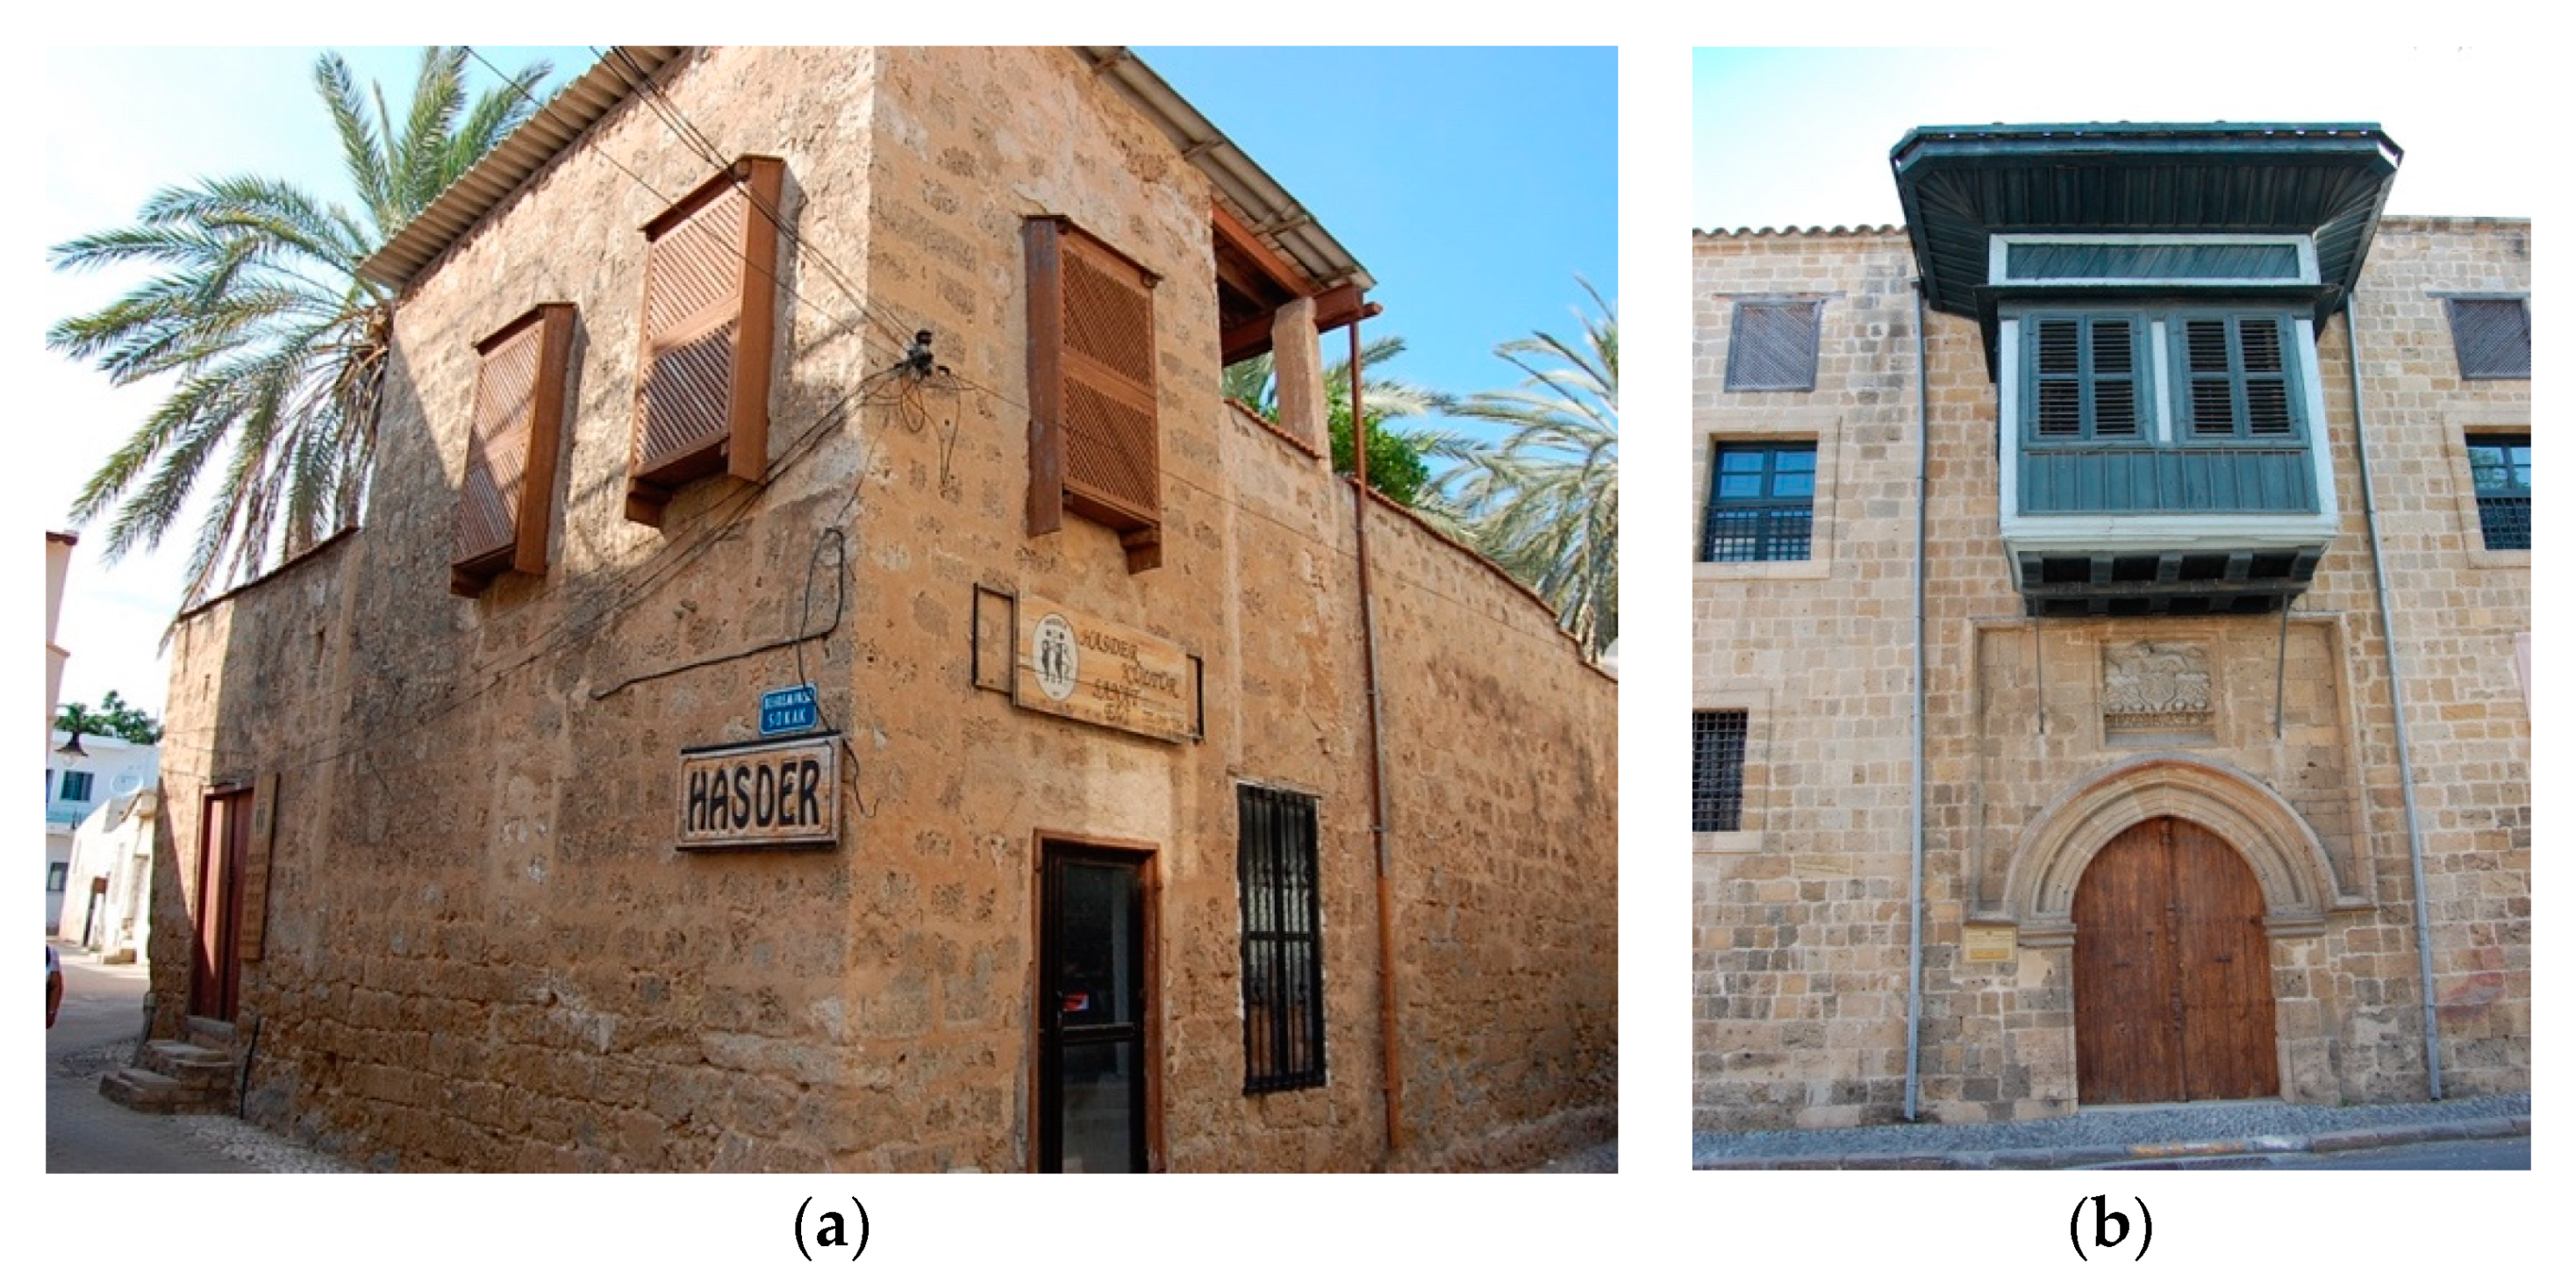
Figure 7.
(a) Principles of operating the porous ceramic systems; (b) diagrams showing the integration of a porous ceramic system with a substitution of an existing perimeter wall: before (left) and after (right). Images credit: Schiano-Phan, (2008).
Figure 7.
(a) Principles of operating the porous ceramic systems; (b) diagrams showing the integration of a porous ceramic system with a substitution of an existing perimeter wall: before (left) and after (right). Images credit: Schiano-Phan, (2008).
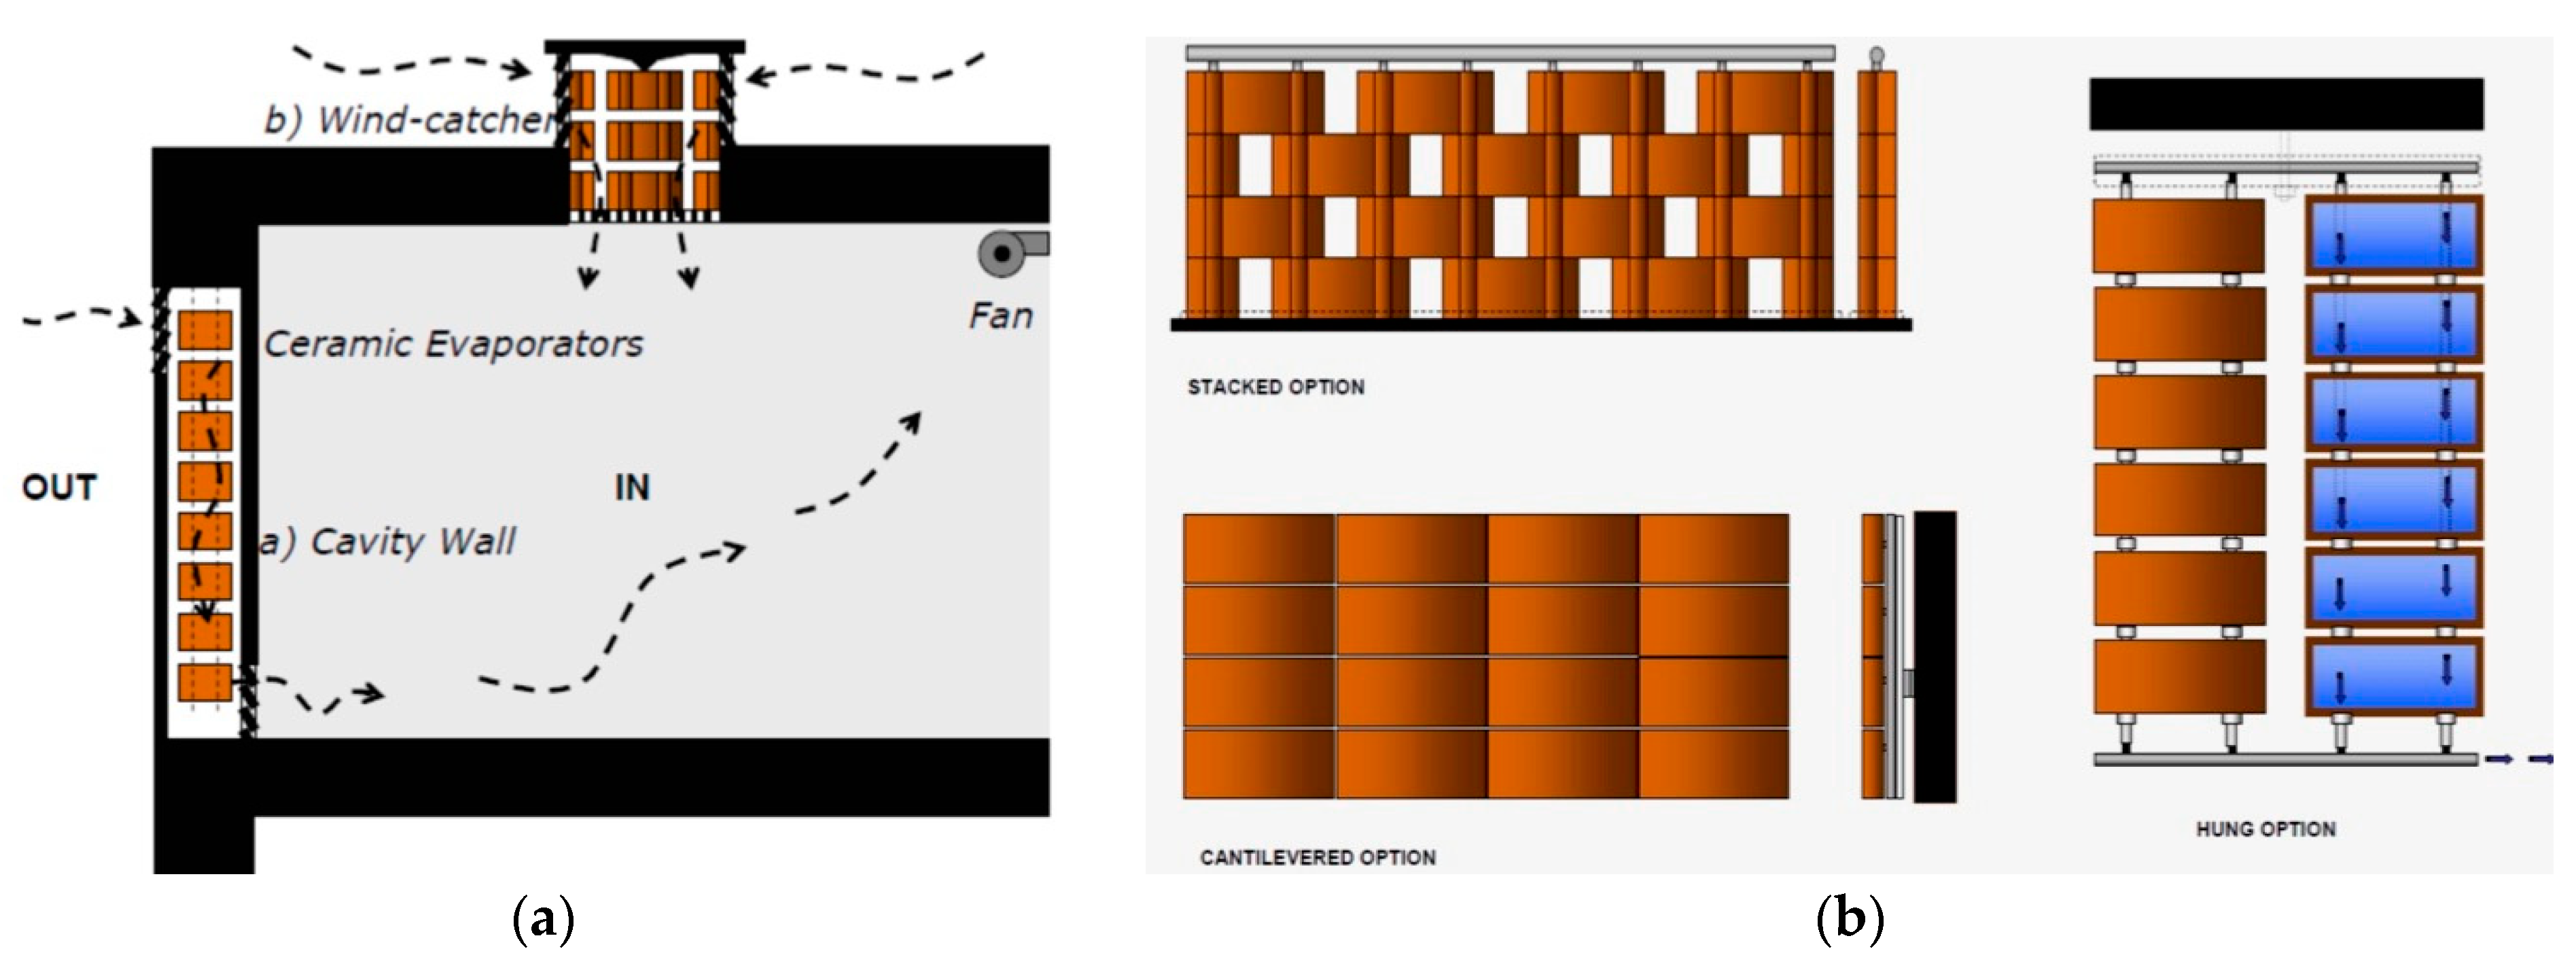
Figure 8.
Figure 8. (a) Elevation of the sunken room of a modern villa, which illustrates the use of mashrabiya, a design that incorporates a complete climatic system, including malqaf (b) Malqaf element for passive-cooling in a vernacular house in Cyprus. Images Credit: Ozarisoy, (2023).
Figure 8.
Figure 8. (a) Elevation of the sunken room of a modern villa, which illustrates the use of mashrabiya, a design that incorporates a complete climatic system, including malqaf (b) Malqaf element for passive-cooling in a vernacular house in Cyprus. Images Credit: Ozarisoy, (2023).
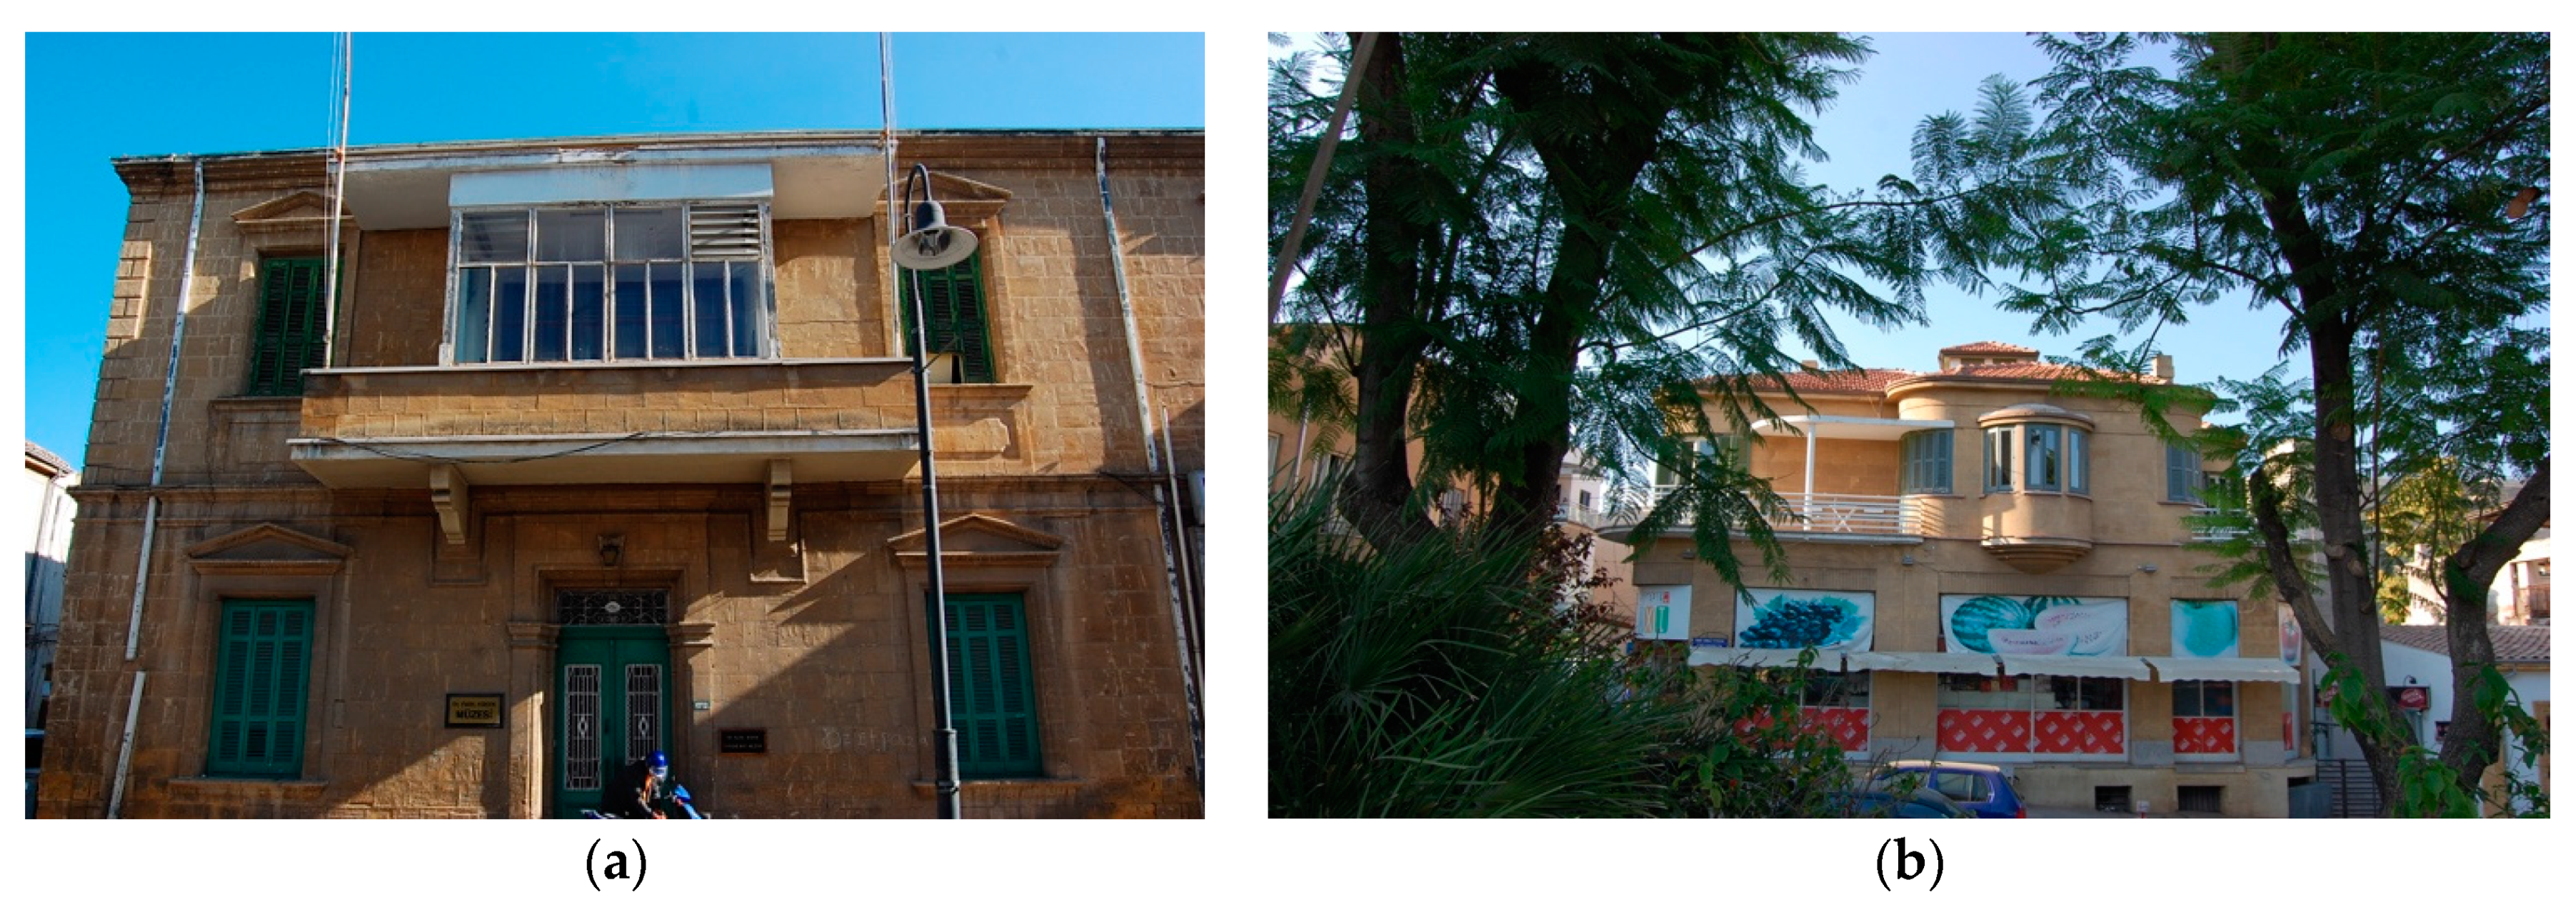
Figure 9.
(a) The arcaded colonnades are a transitional space that generates ventilation between the indoor spaces and the courtyard; (b) malqaf element for passive cooling in a vernacular house in Cyprus.Images Credit: Ozarisoy, (2023).
Figure 9.
(a) The arcaded colonnades are a transitional space that generates ventilation between the indoor spaces and the courtyard; (b) malqaf element for passive cooling in a vernacular house in Cyprus.Images Credit: Ozarisoy, (2023).
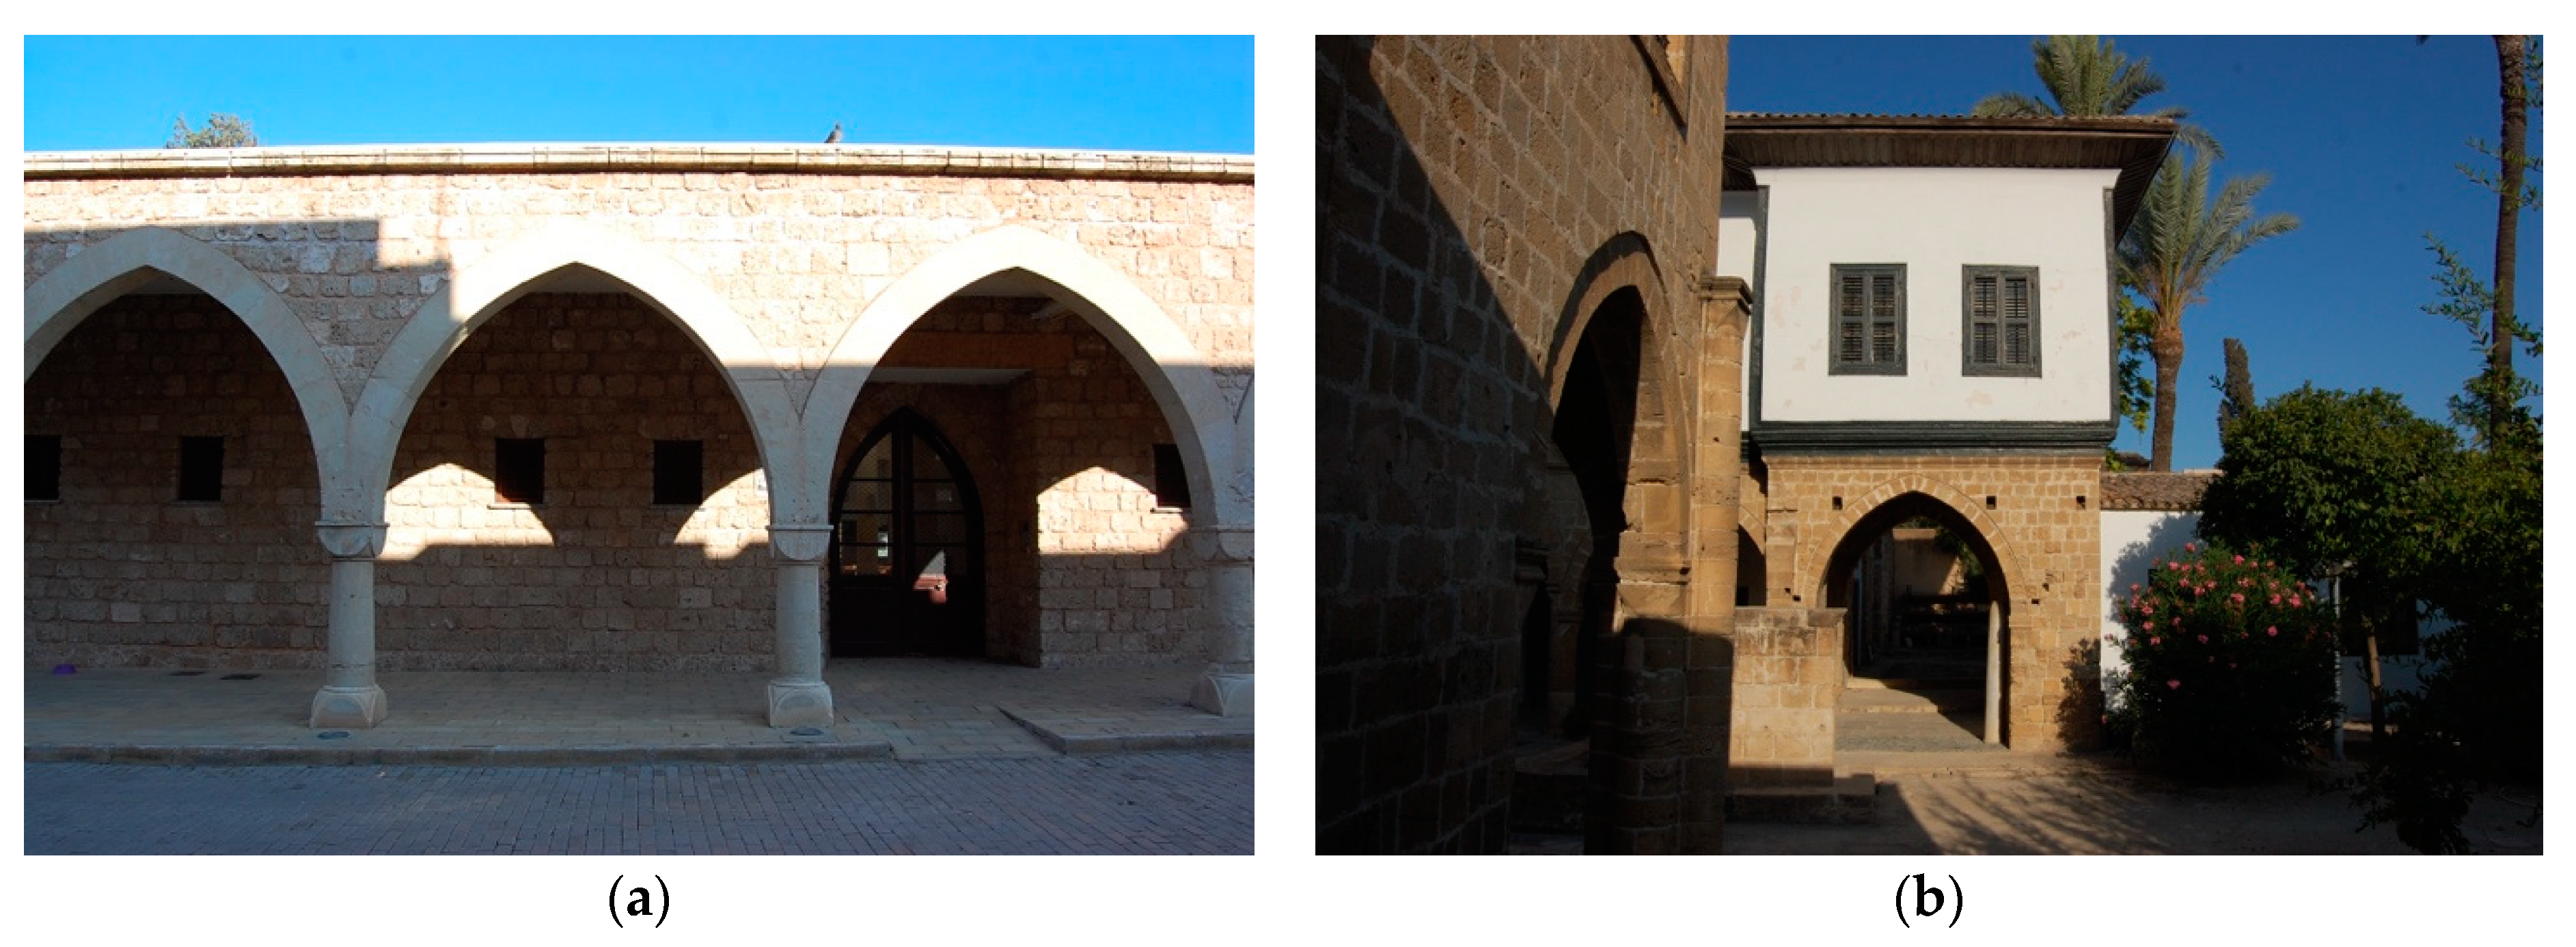
Figure 10.
(a) Overhang balcony space projection that shows ventilation generated by wind escape; (b) wind-catcher system in a vernacular house in Cyprus. Images Credit: Ozarisoy, (2023).
Figure 10.
(a) Overhang balcony space projection that shows ventilation generated by wind escape; (b) wind-catcher system in a vernacular house in Cyprus. Images Credit: Ozarisoy, (2023).
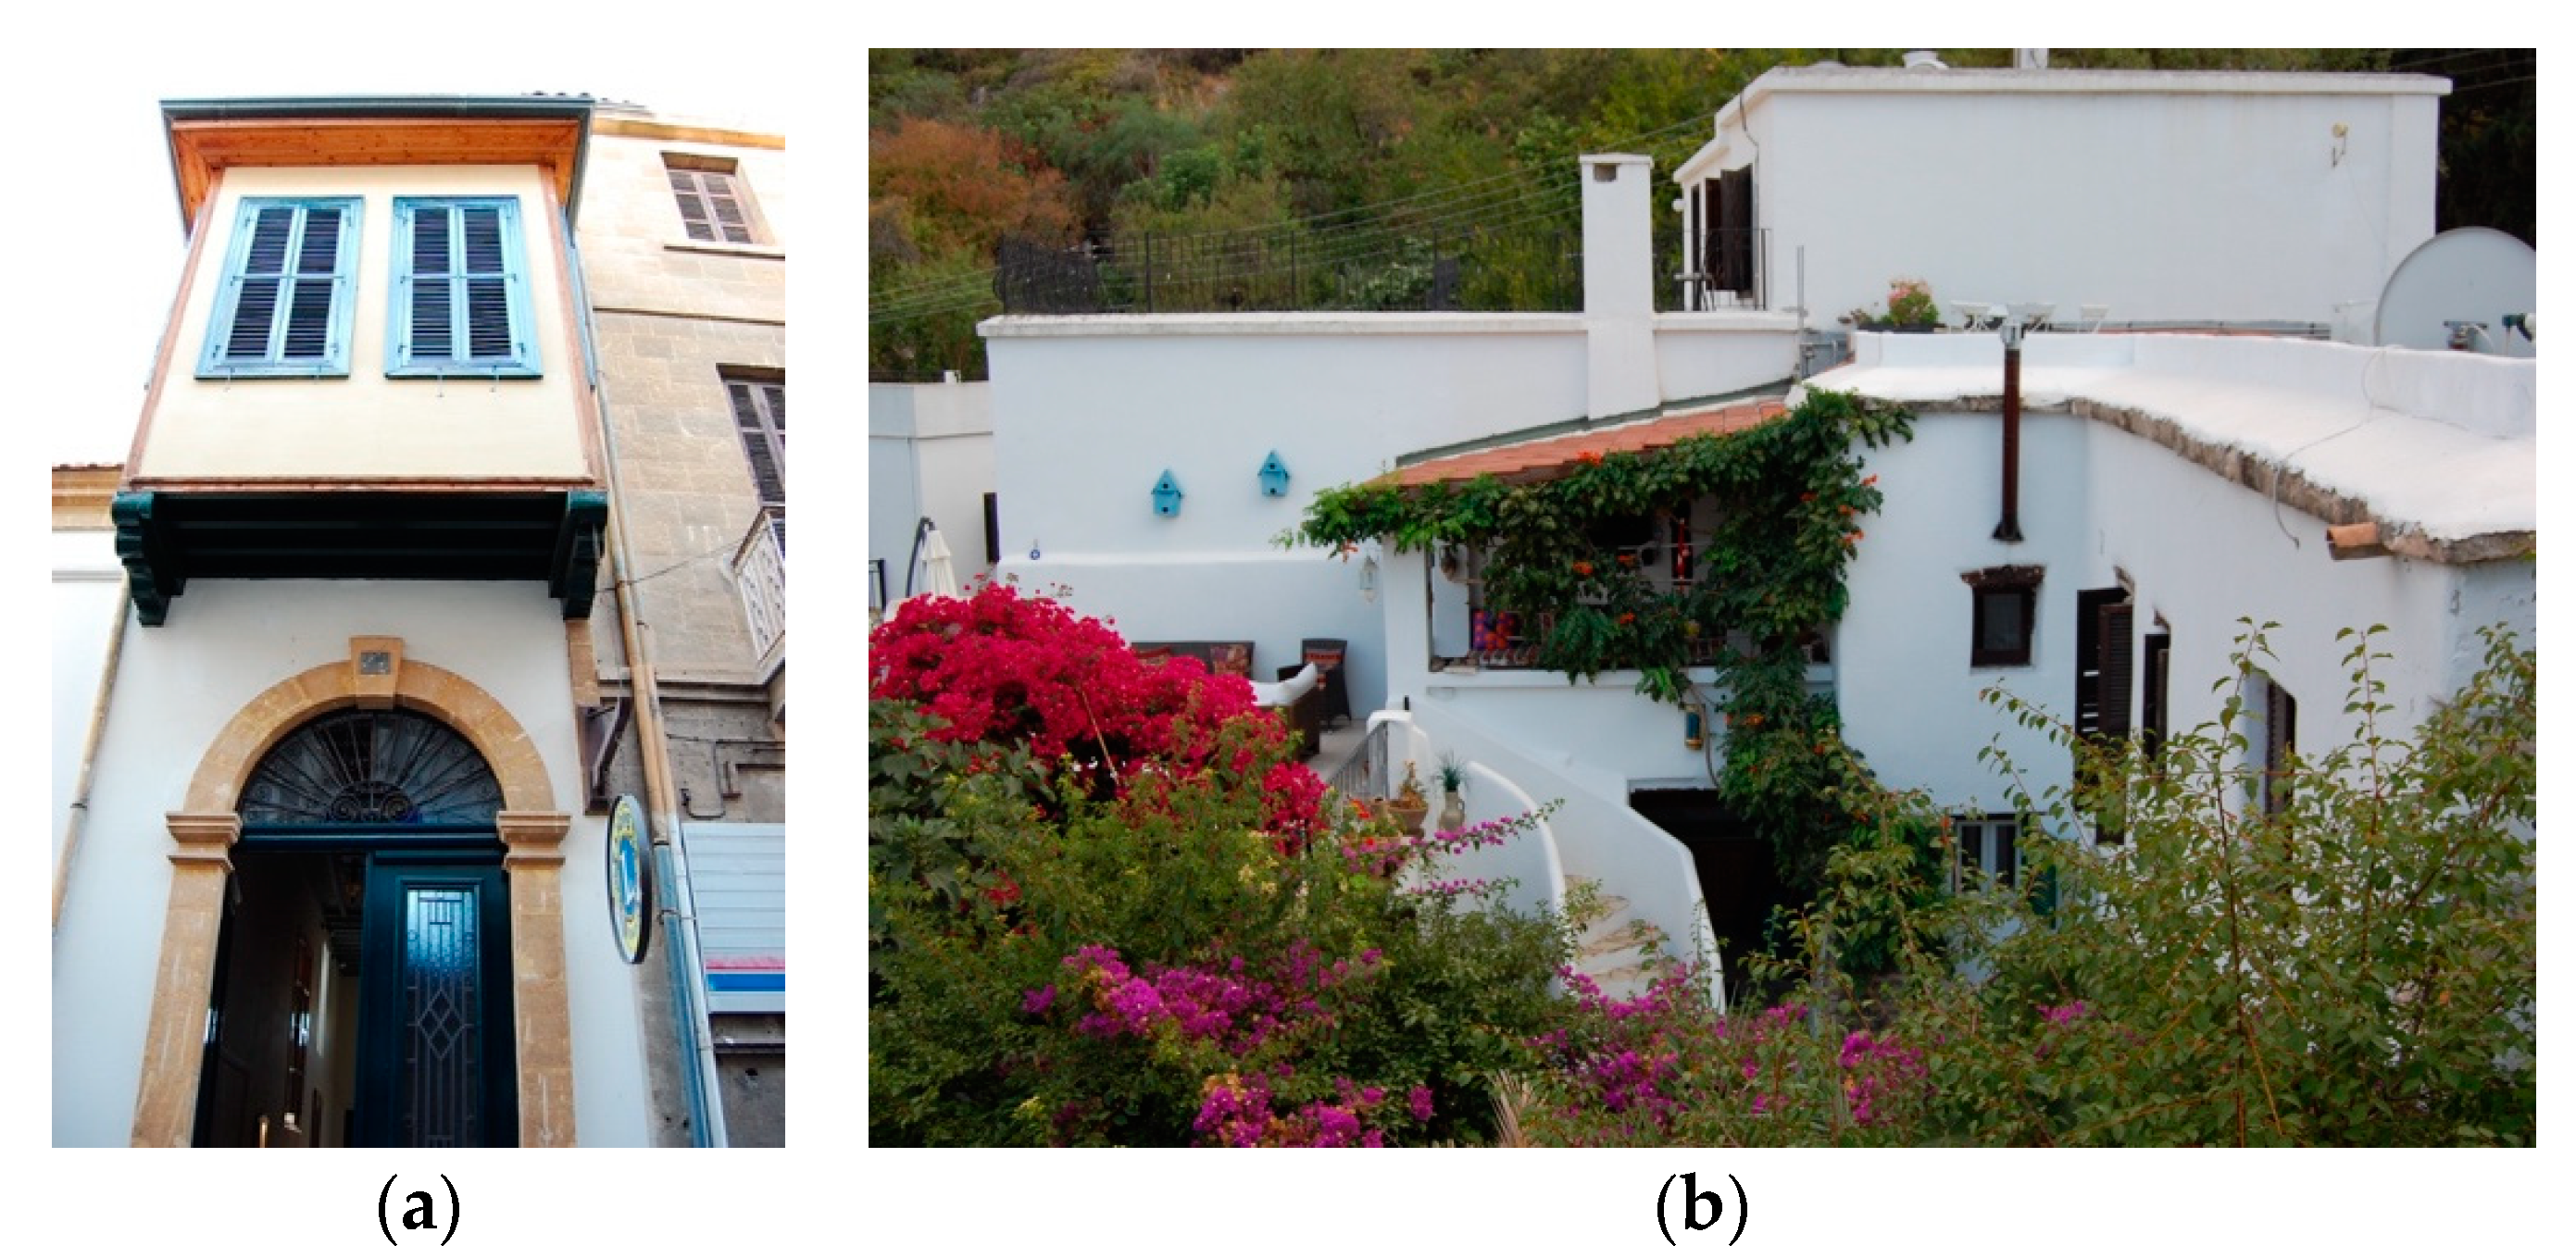
Figure 11.
(a) Limestone; (b) masonry; and (c) clay. Images Credit: Ozarisoy, (2023).
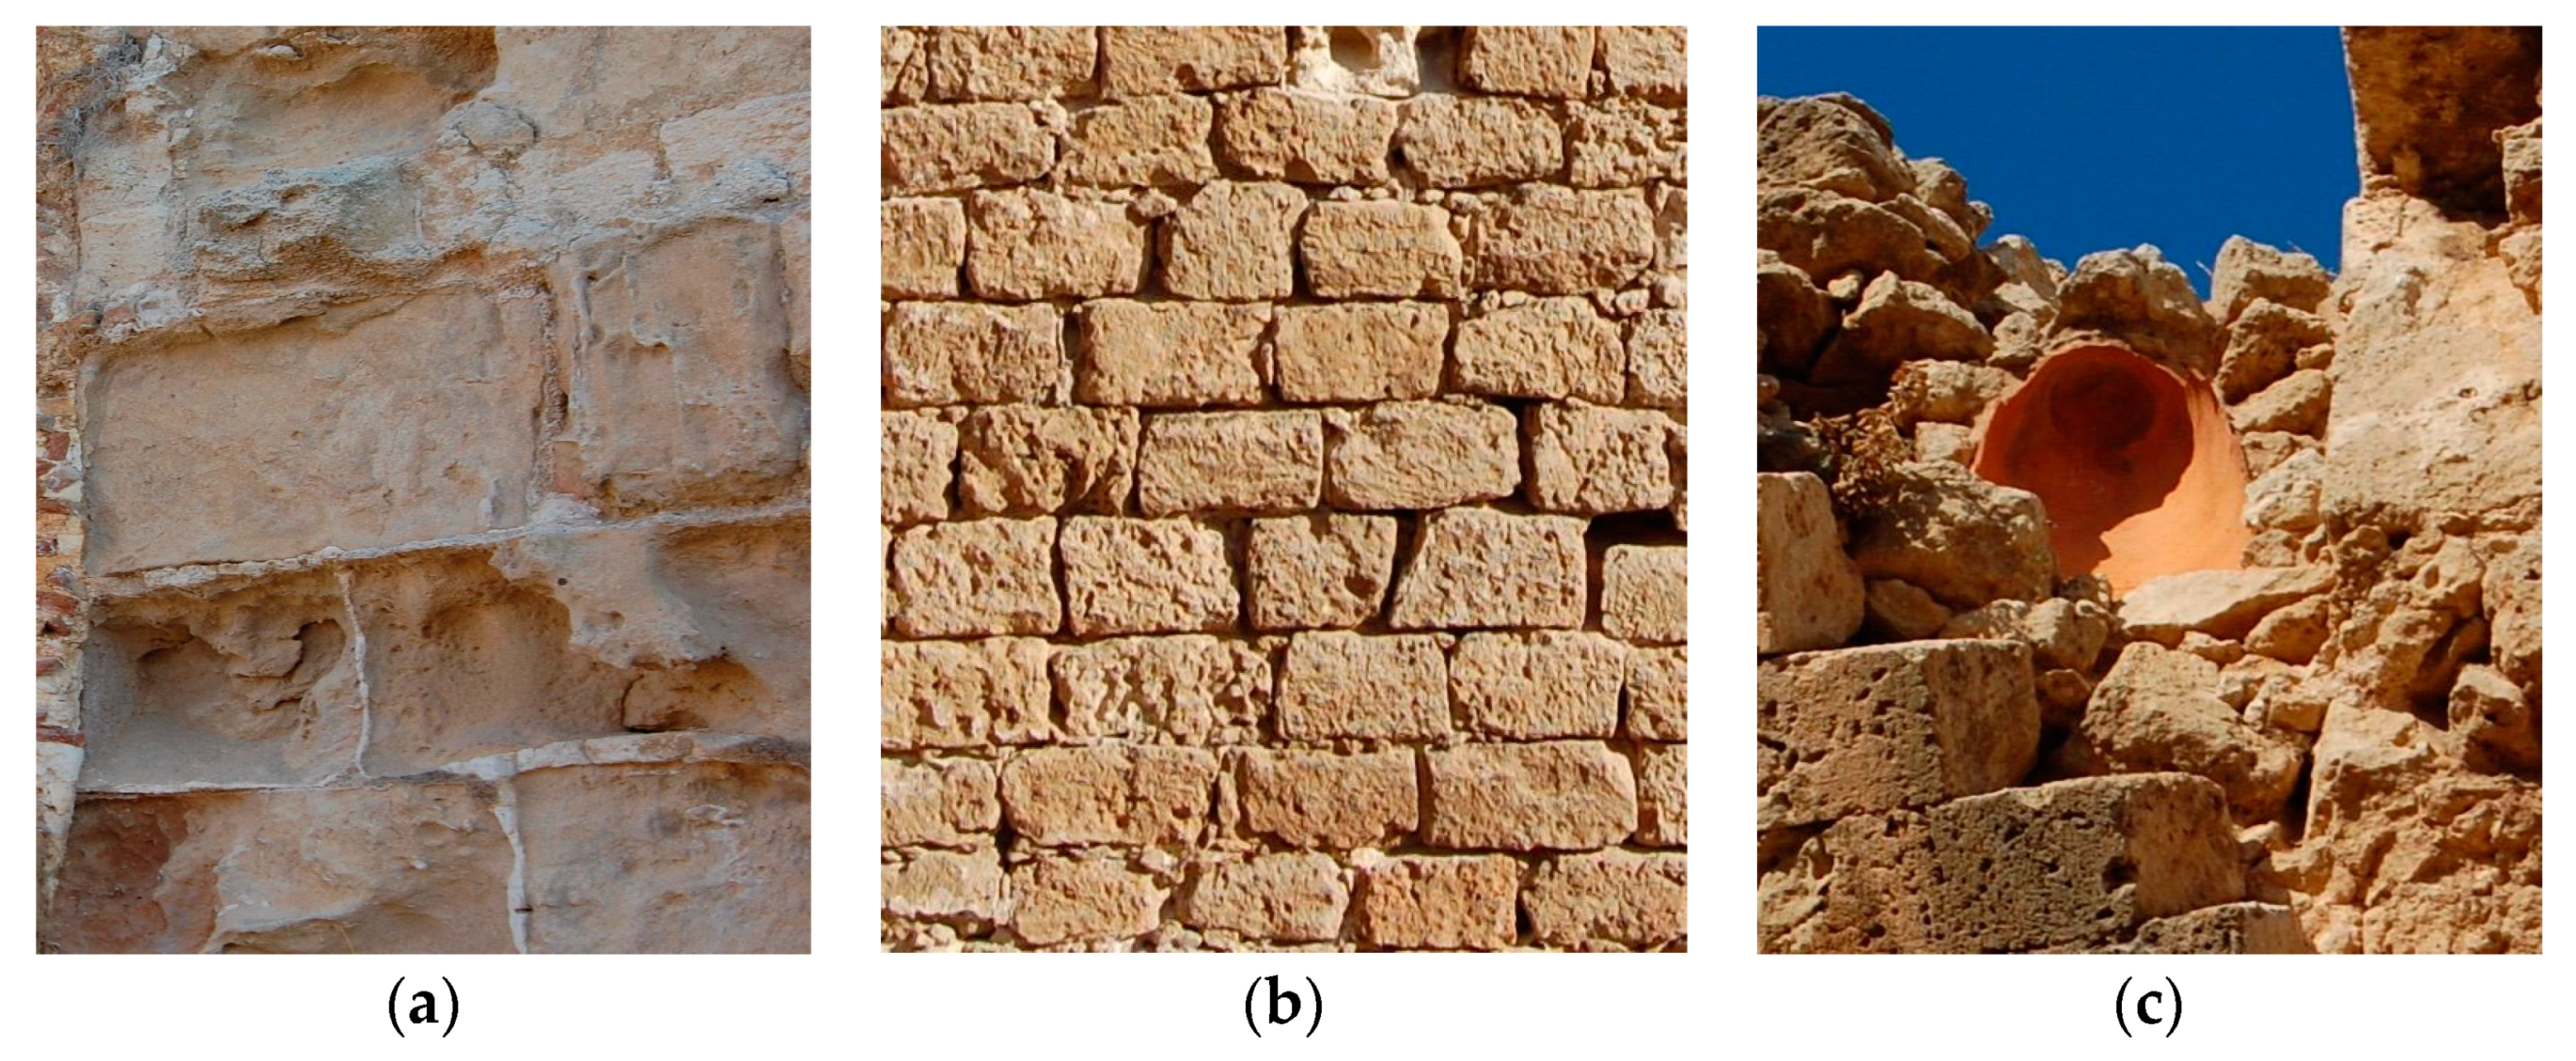
Figure 12.
Passive cooling design strategies implemented in the Eastern Mediterranean basin.Image Credit: Diagram was conceptualised by Ozarisoy & Altan (2021a).
Figure 12.
Passive cooling design strategies implemented in the Eastern Mediterranean basin.Image Credit: Diagram was conceptualised by Ozarisoy & Altan (2021a).
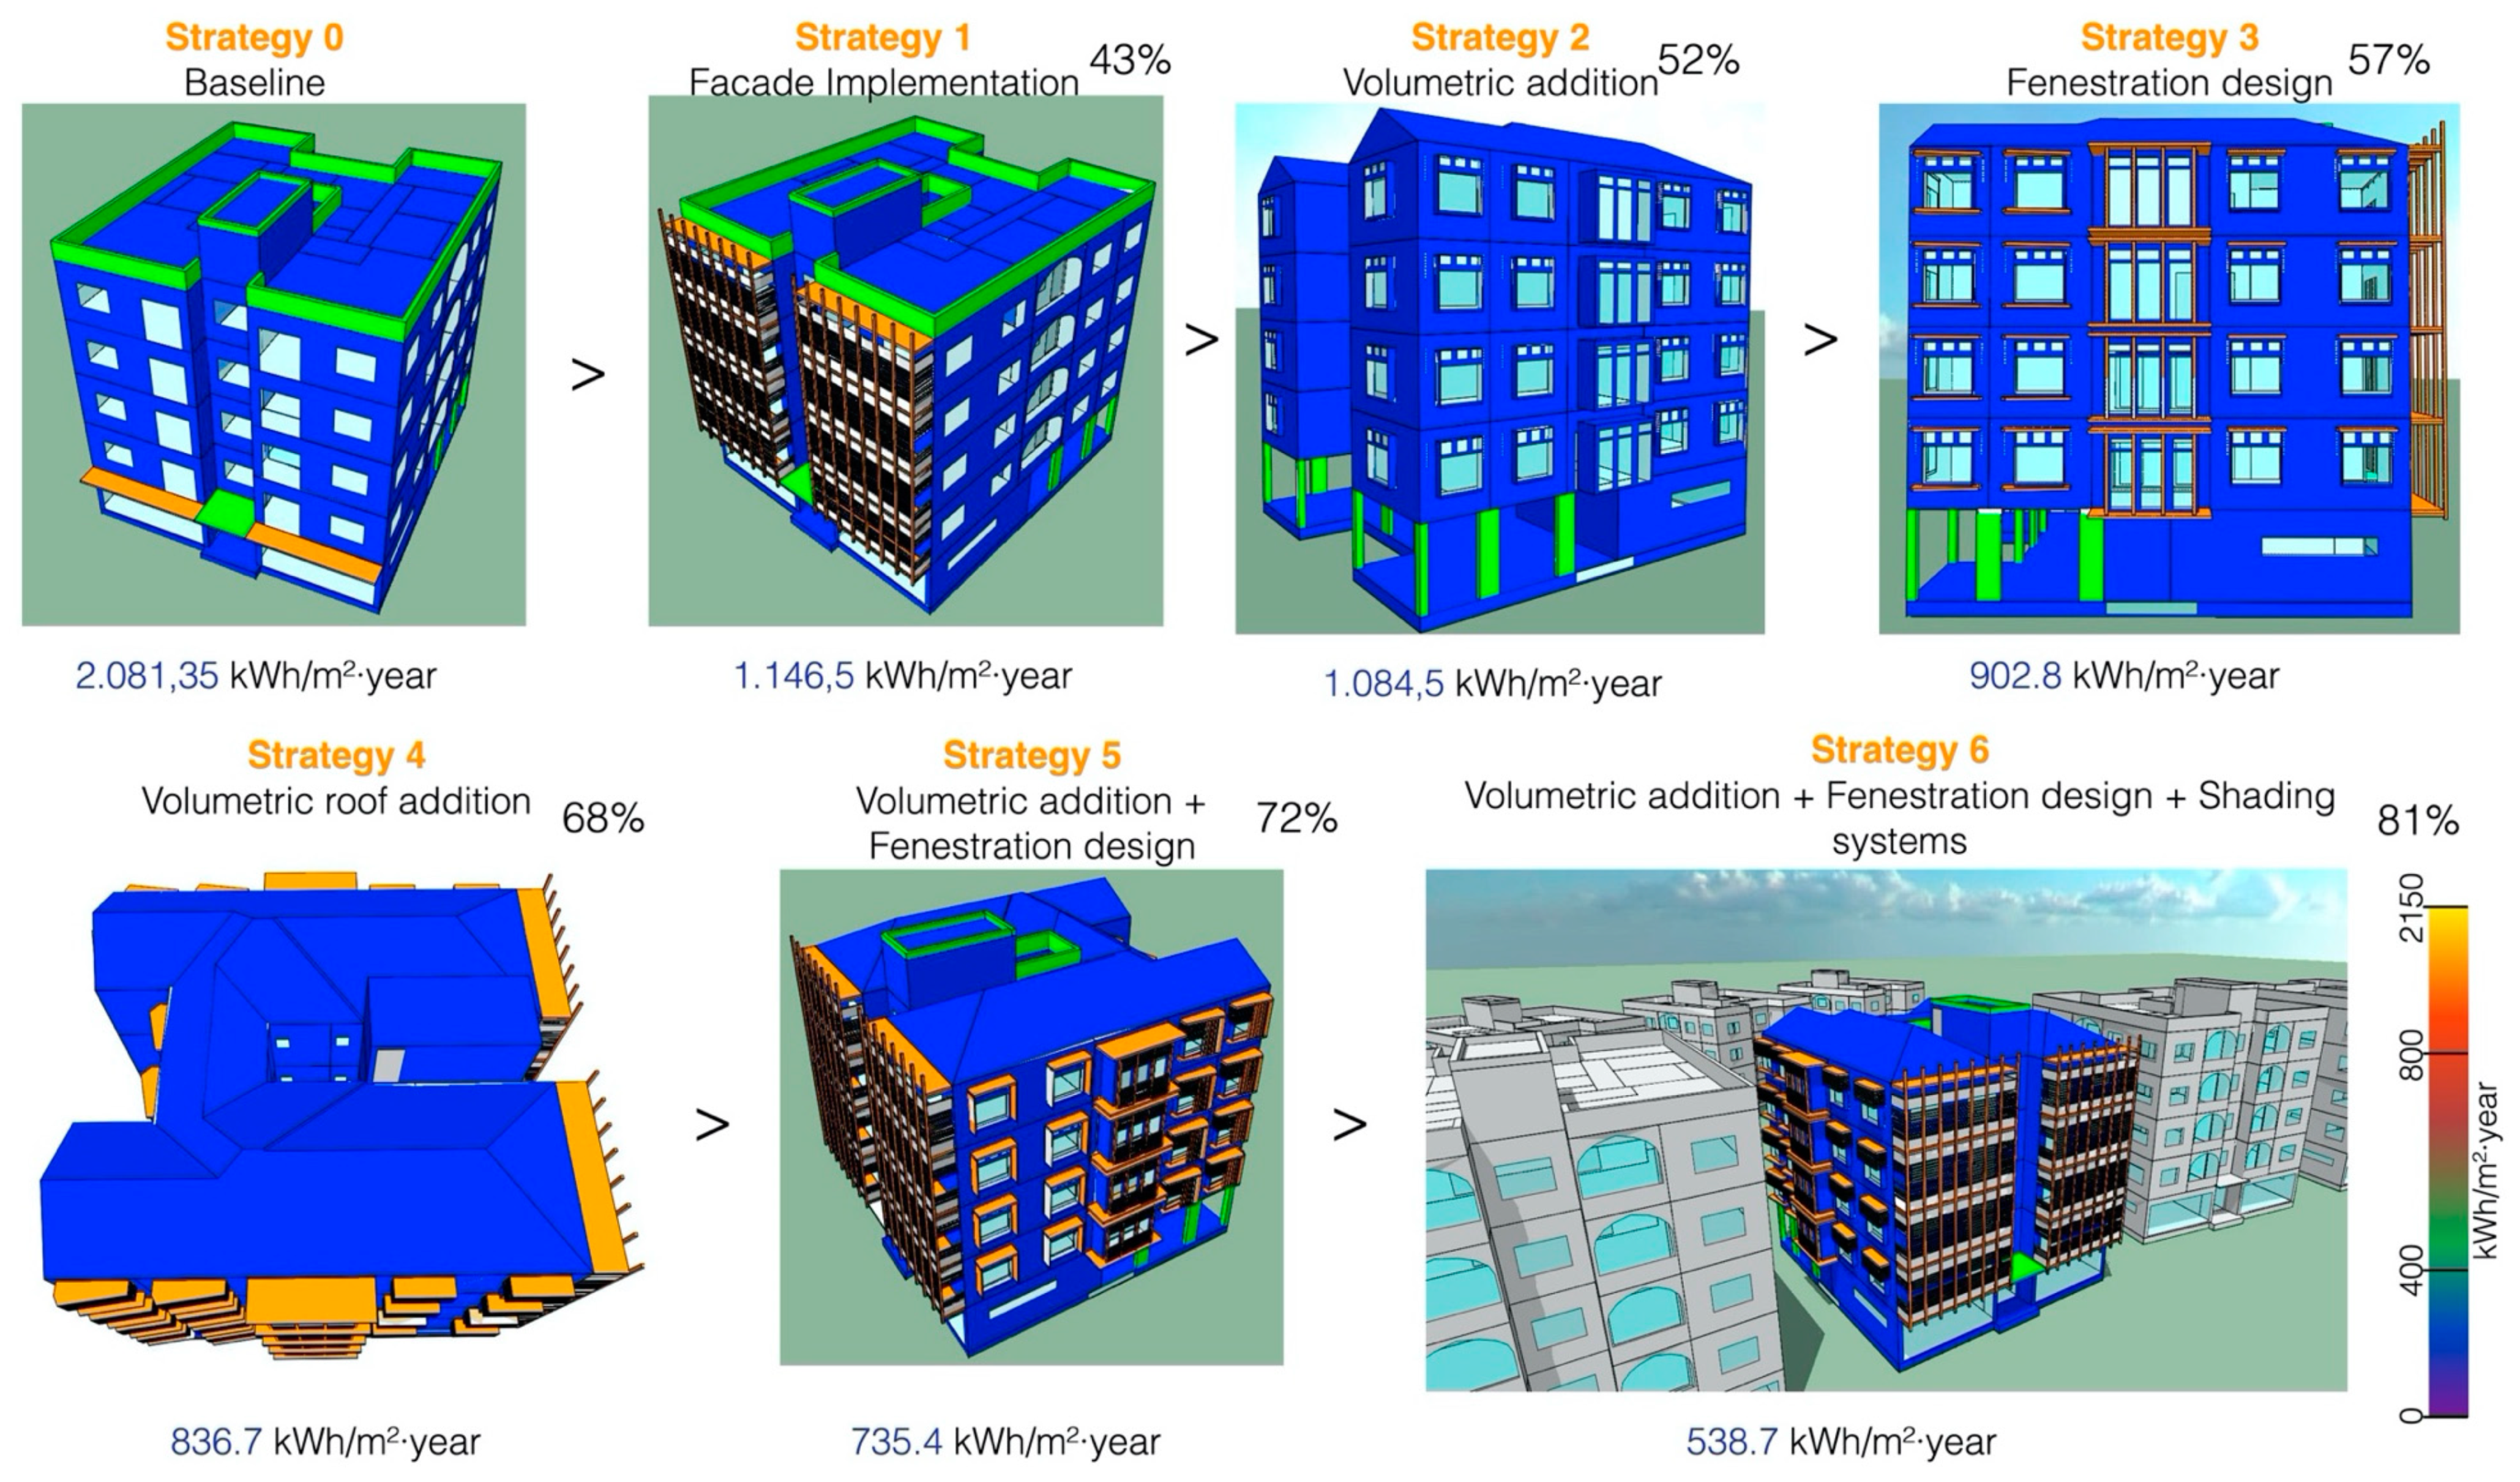
Figure 13.
Methodological workflow for the present study. Image Credit: Diagram was daptive lized by Bema, (2023).
Figure 13.
Methodological workflow for the present study. Image Credit: Diagram was daptive lized by Bema, (2023).
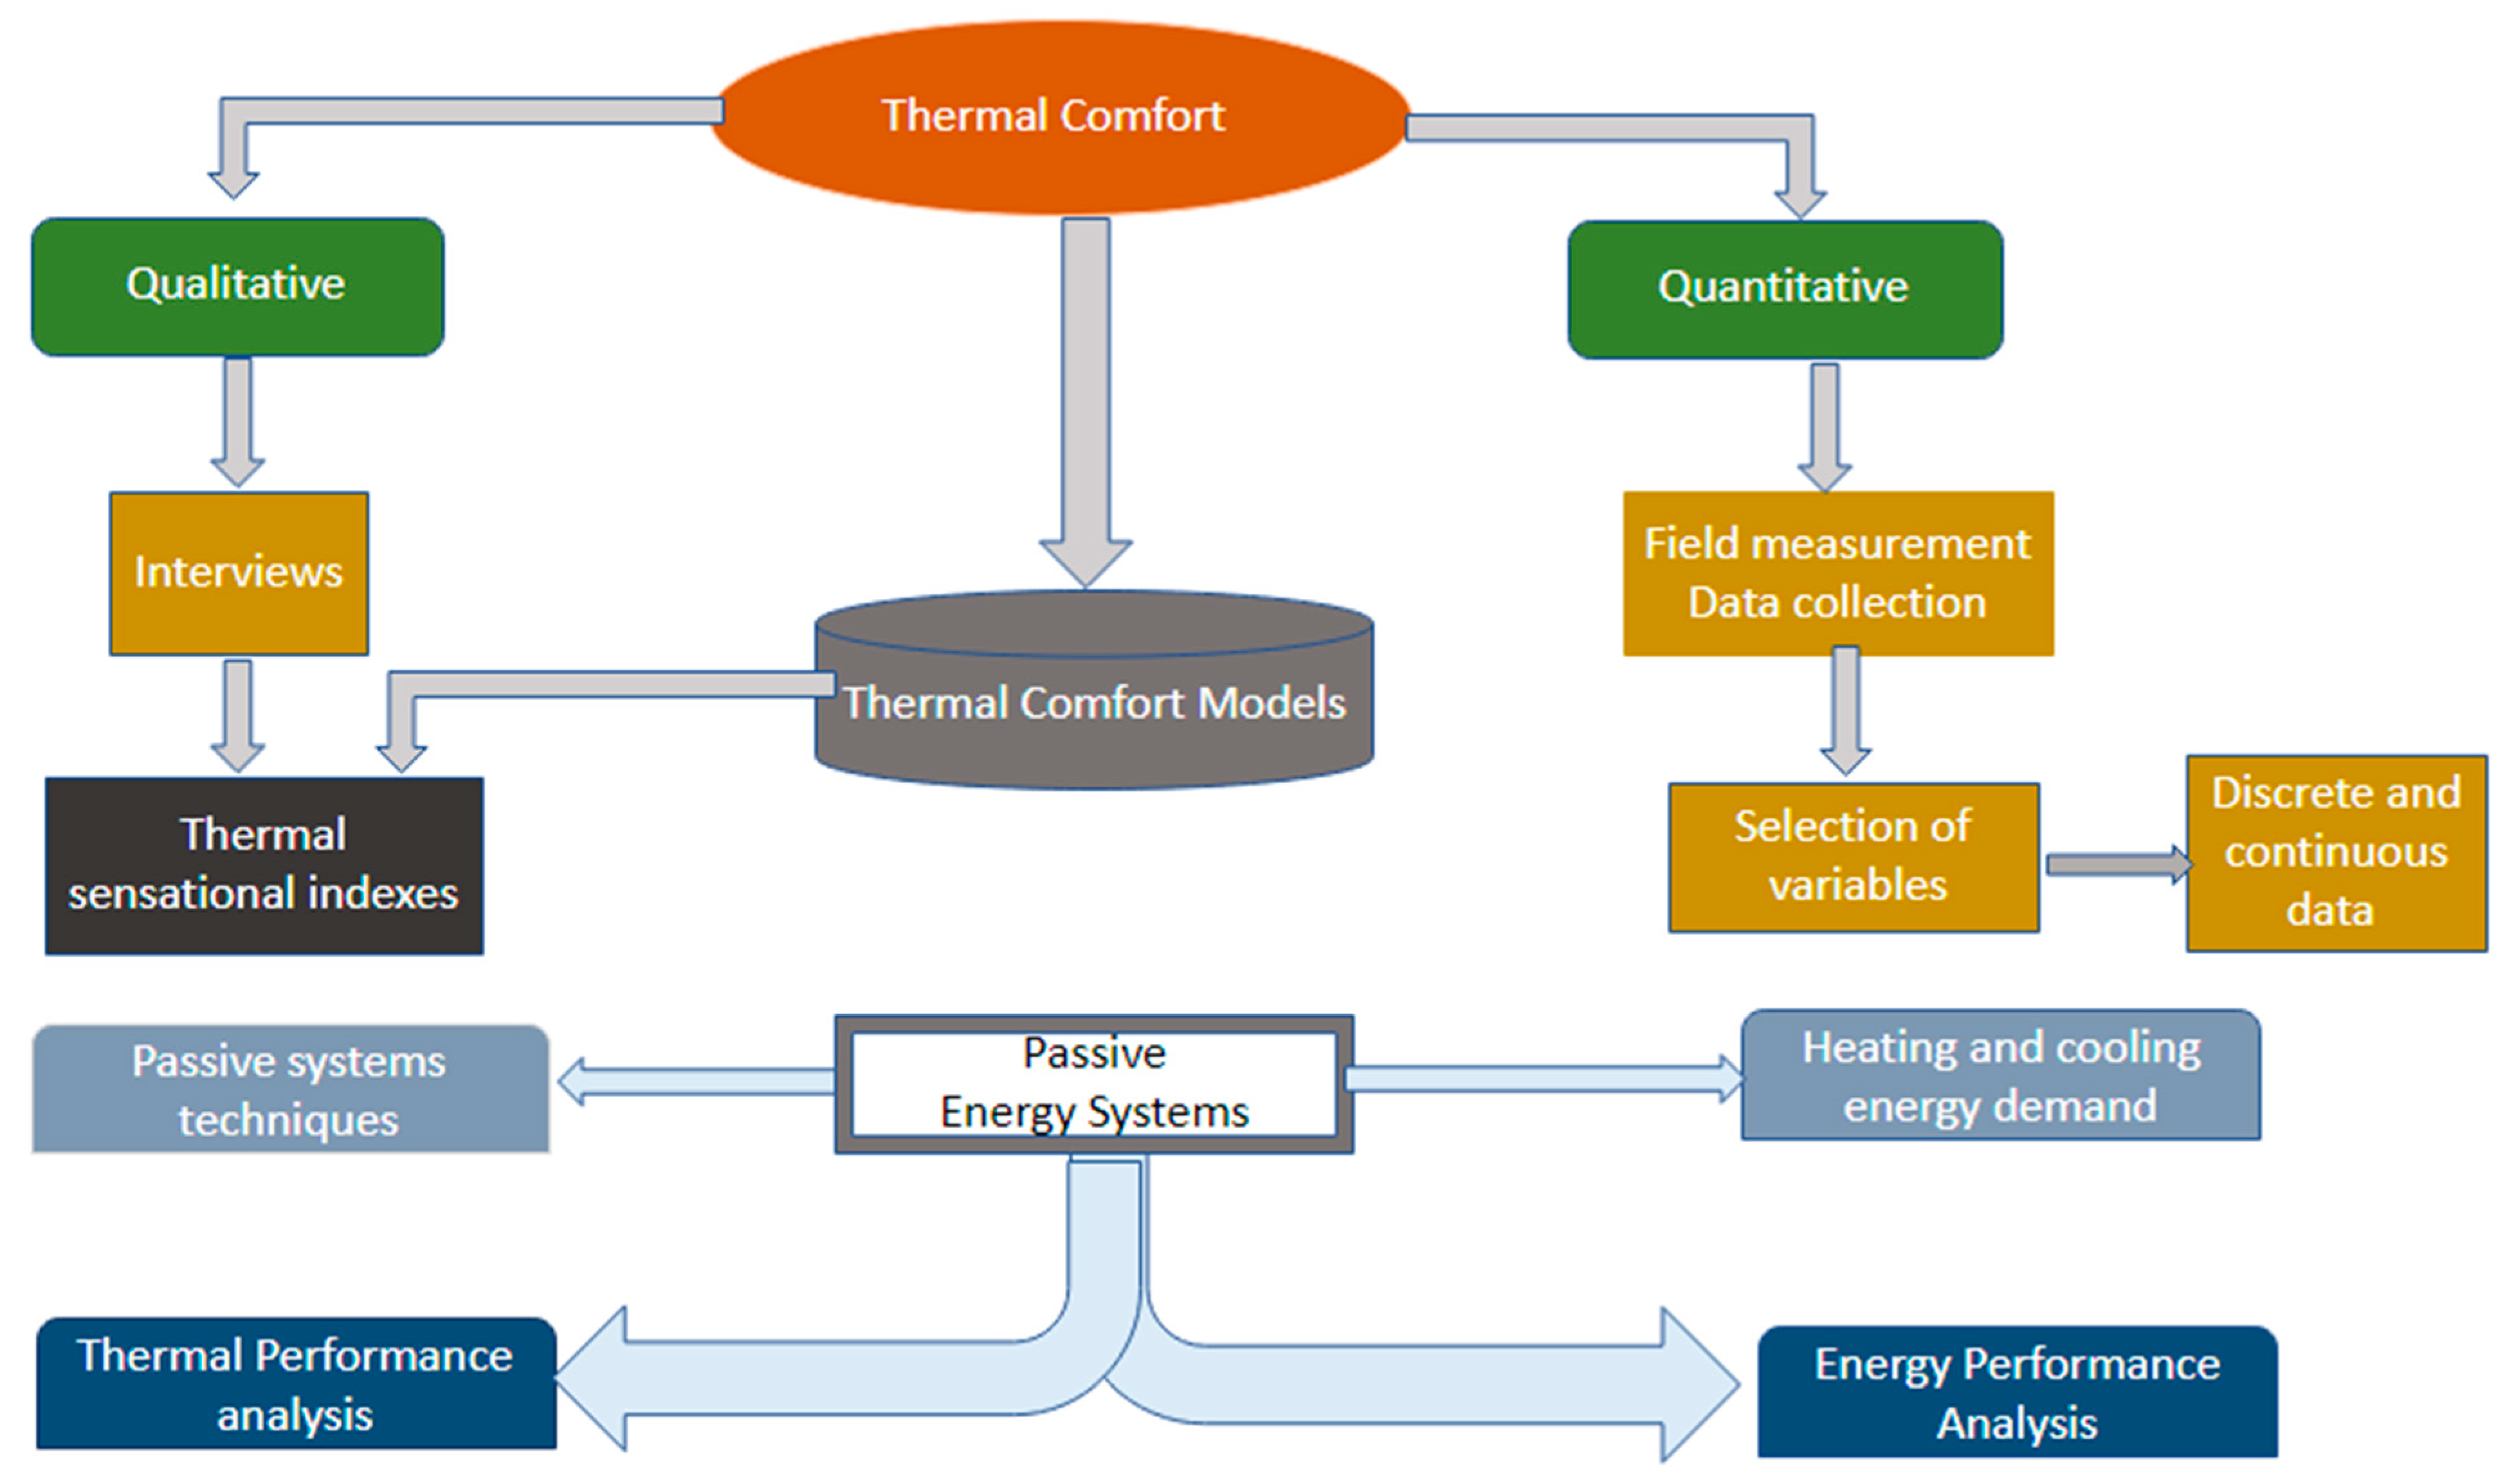
Figure 14.
Adaptive thermal comfort assessment by using the criteria (a) ASHRAE-55-2020 – Operative air temperature; (b) European Norm (EN-16798) – Operative air temperature. Sources: https://comfort.cbe.berkeley.edu (accessed on 20/01/2023).
Figure 14.
Adaptive thermal comfort assessment by using the criteria (a) ASHRAE-55-2020 – Operative air temperature; (b) European Norm (EN-16798) – Operative air temperature. Sources: https://comfort.cbe.berkeley.edu (accessed on 20/01/2023).
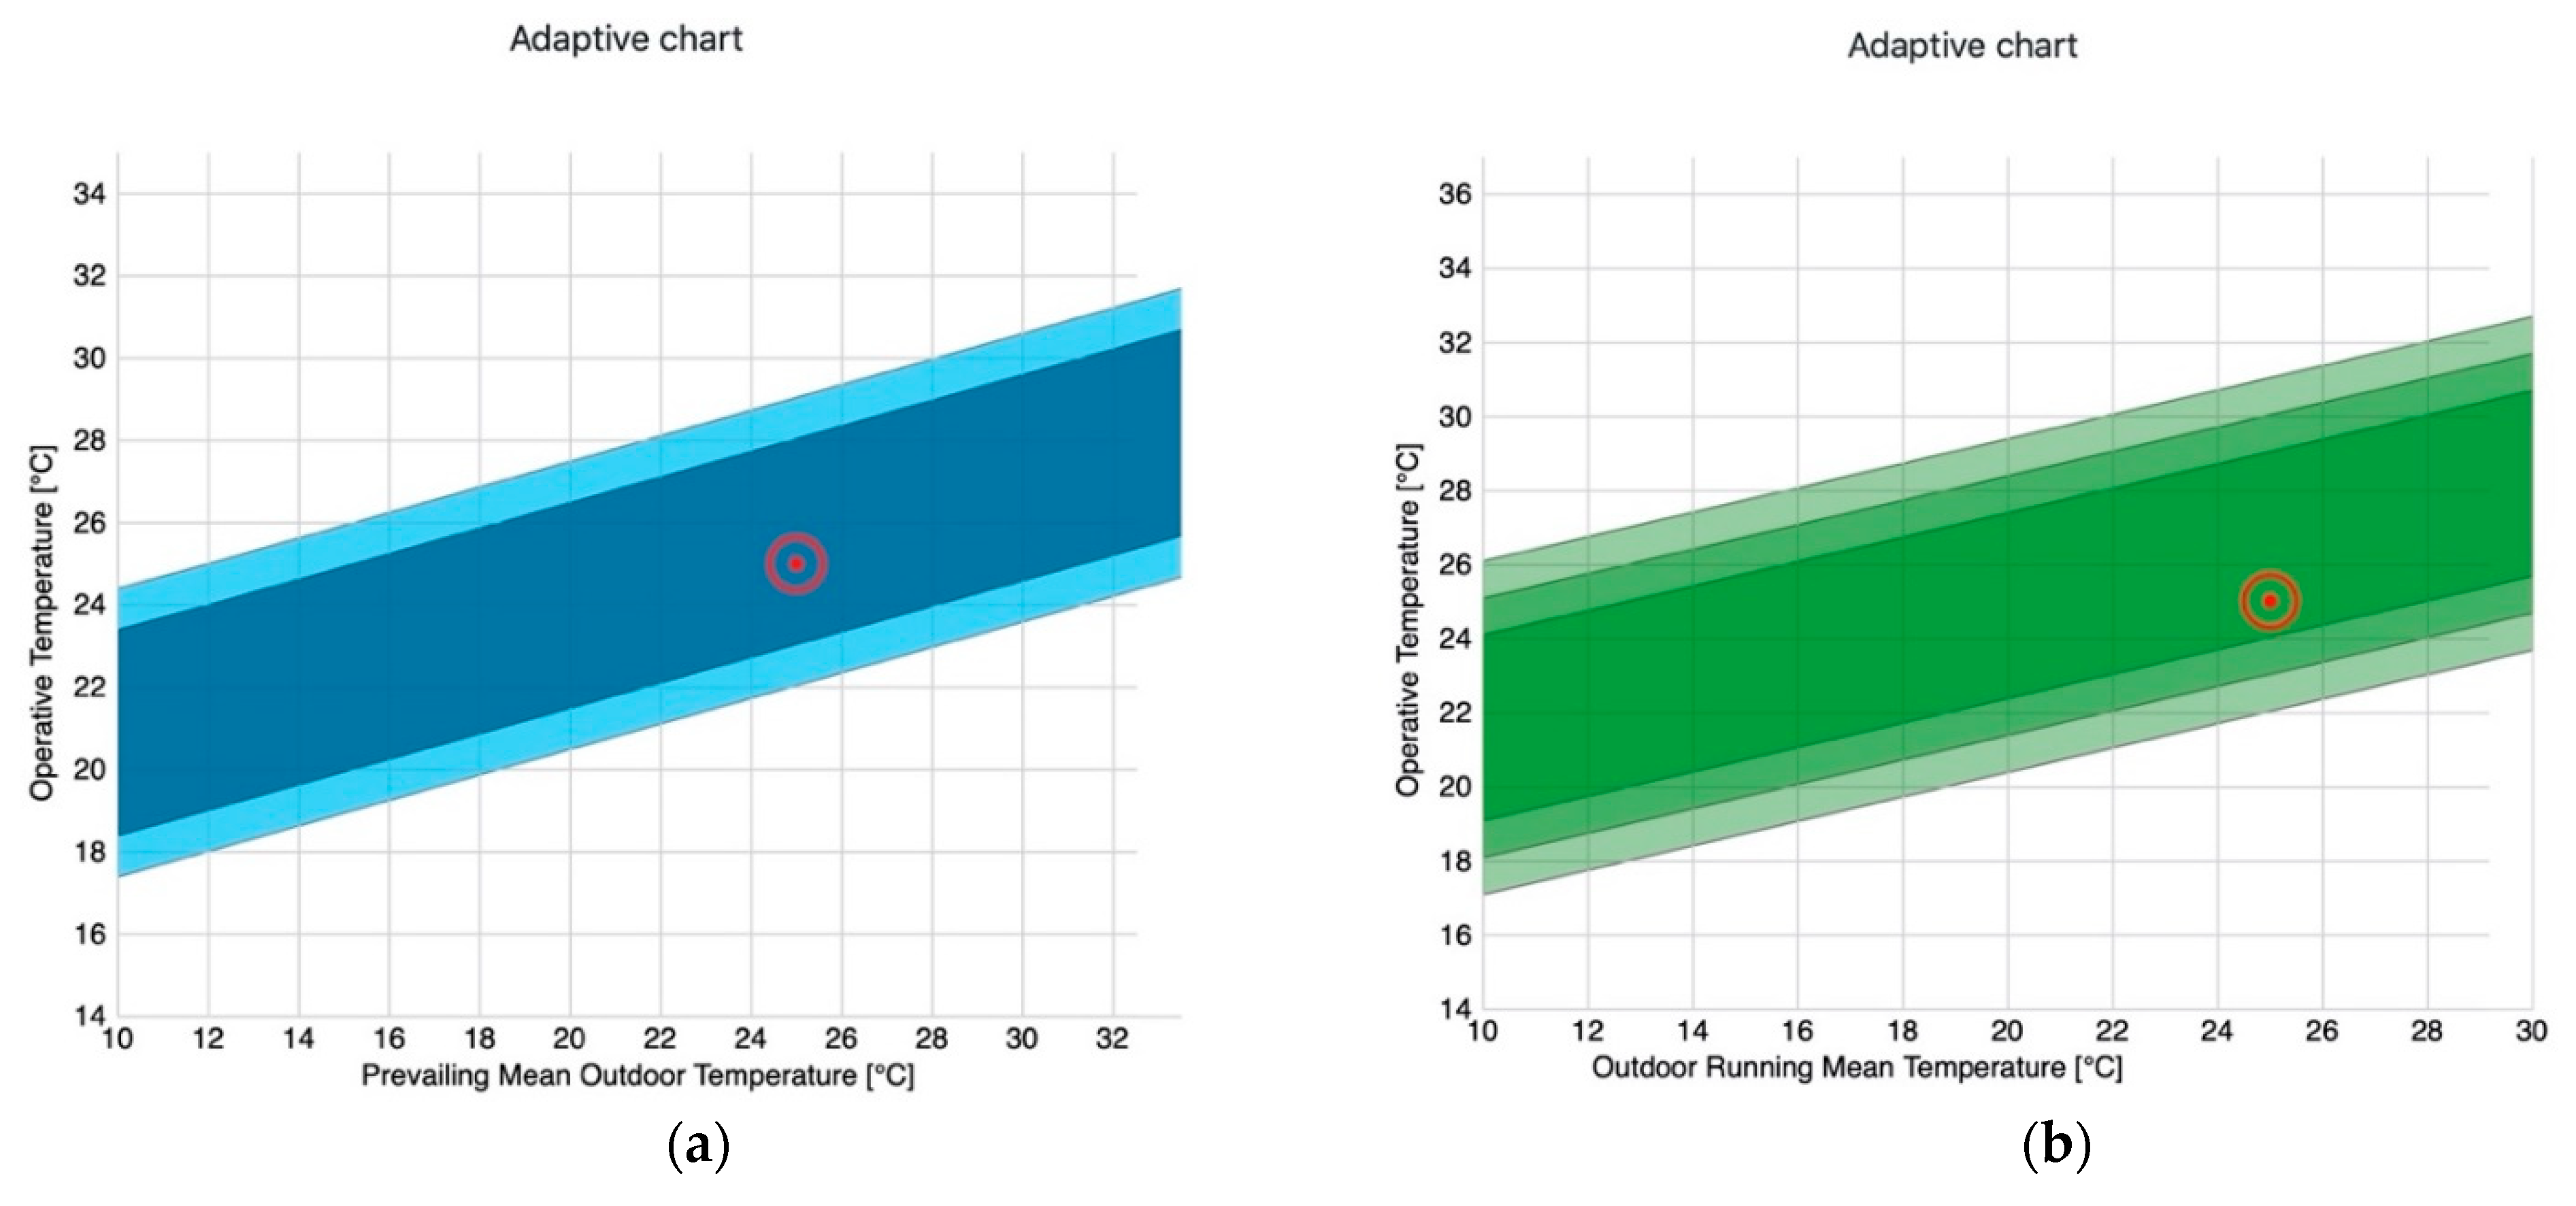
Figure 15.
(a) Percentage distribution of a field study data in North Cyprus; (b) The mostly frequently occurring patterns in the dataset selected for the present study. Sources: https://repository.uel.ac.uk/item/8q774 (accessed on 20/01/2023).
Figure 15.
(a) Percentage distribution of a field study data in North Cyprus; (b) The mostly frequently occurring patterns in the dataset selected for the present study. Sources: https://repository.uel.ac.uk/item/8q774 (accessed on 20/01/2023).
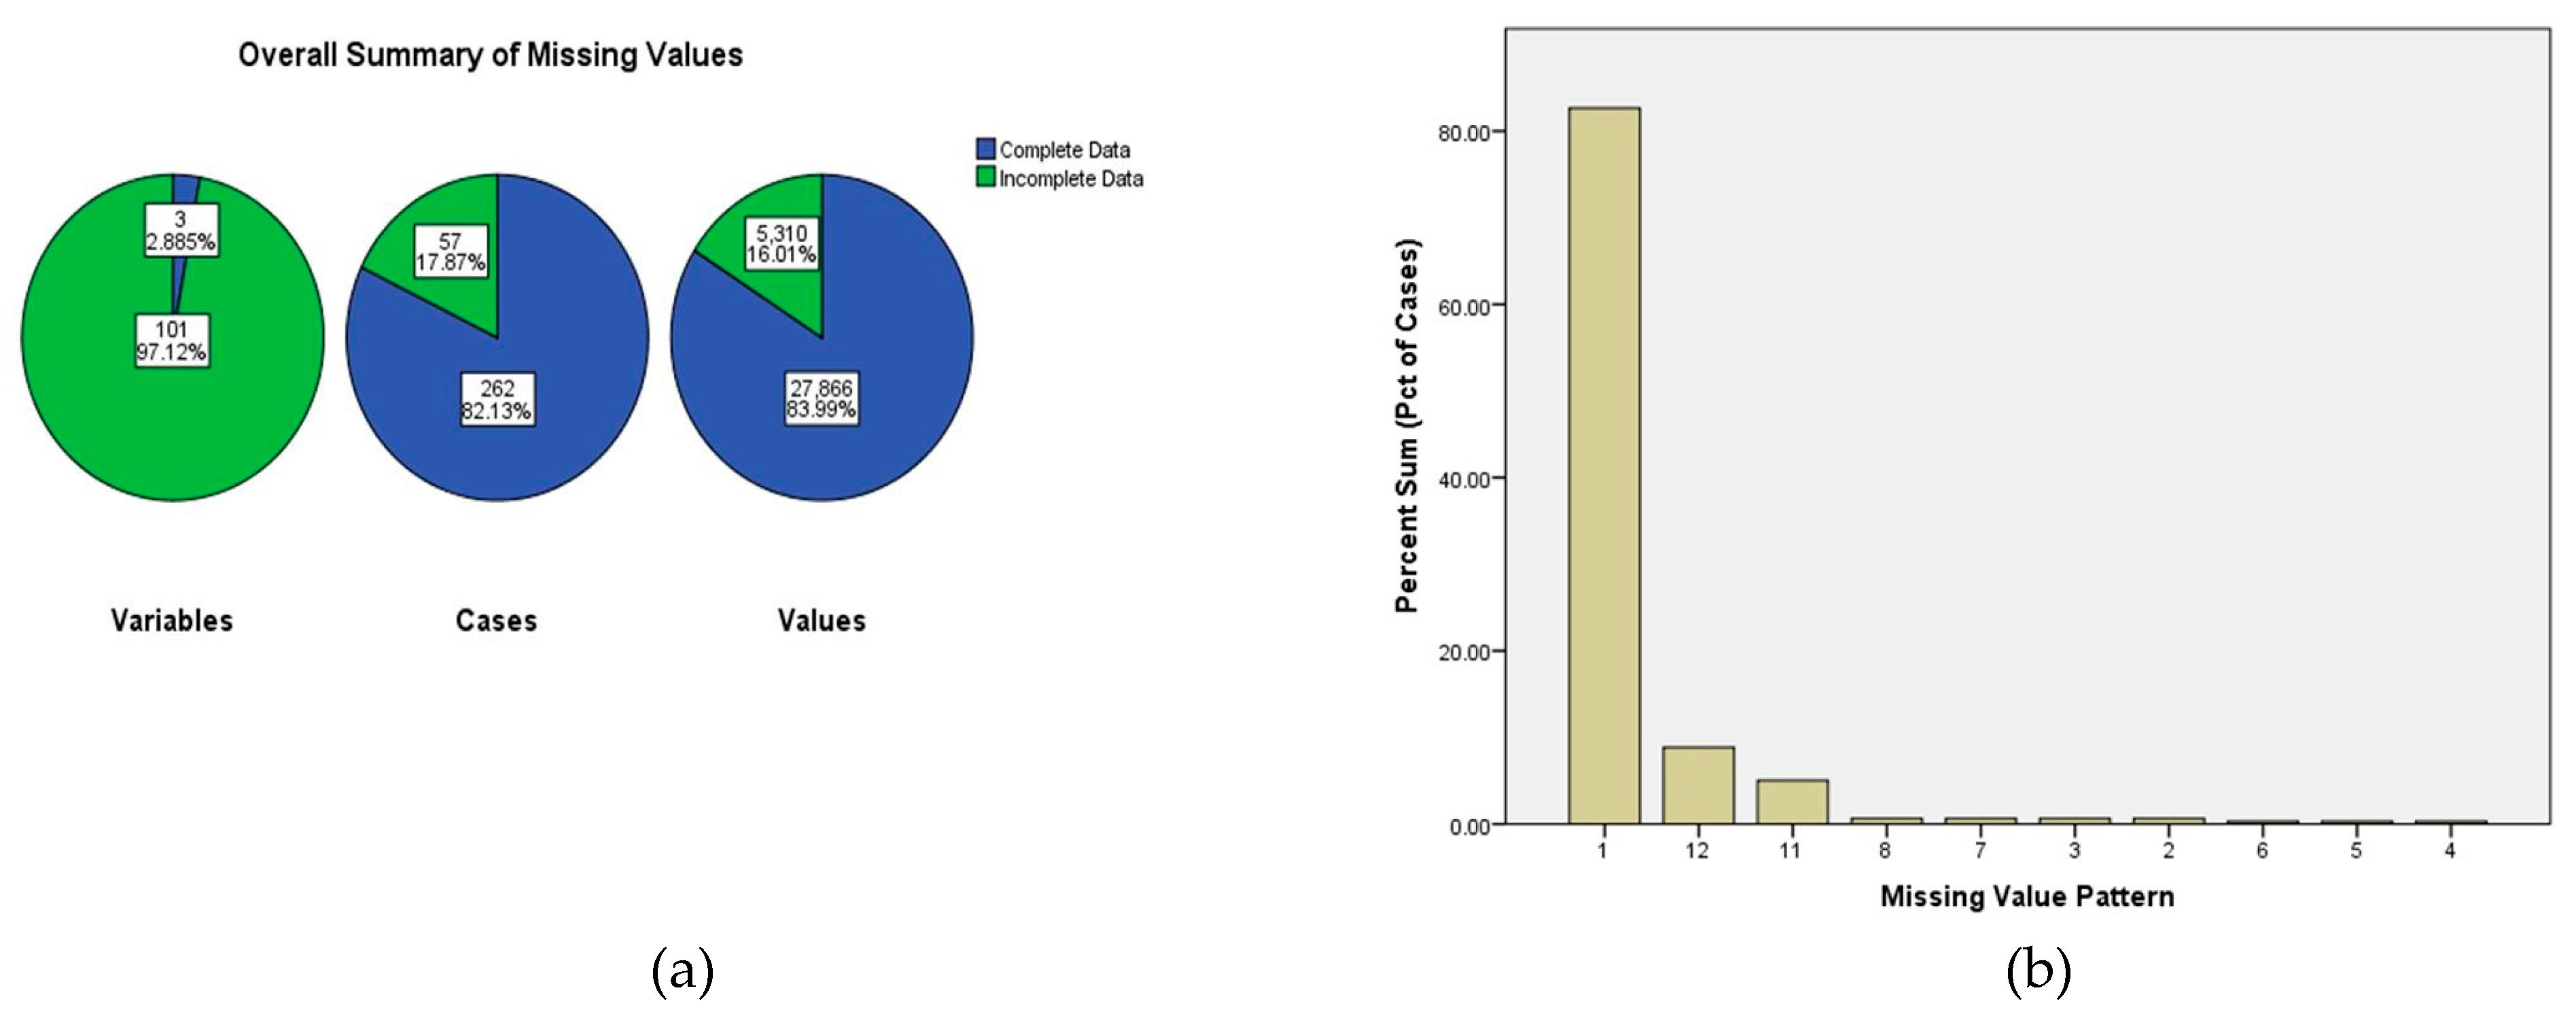
Figure 16.
Network visualization was conducted to explore correlations between thermal comfort and field measurement methods globally. Source: https://www.vosviewer.com (accessed on 25/01/2023)
Figure 16.
Network visualization was conducted to explore correlations between thermal comfort and field measurement methods globally. Source: https://www.vosviewer.com (accessed on 25/01/2023)
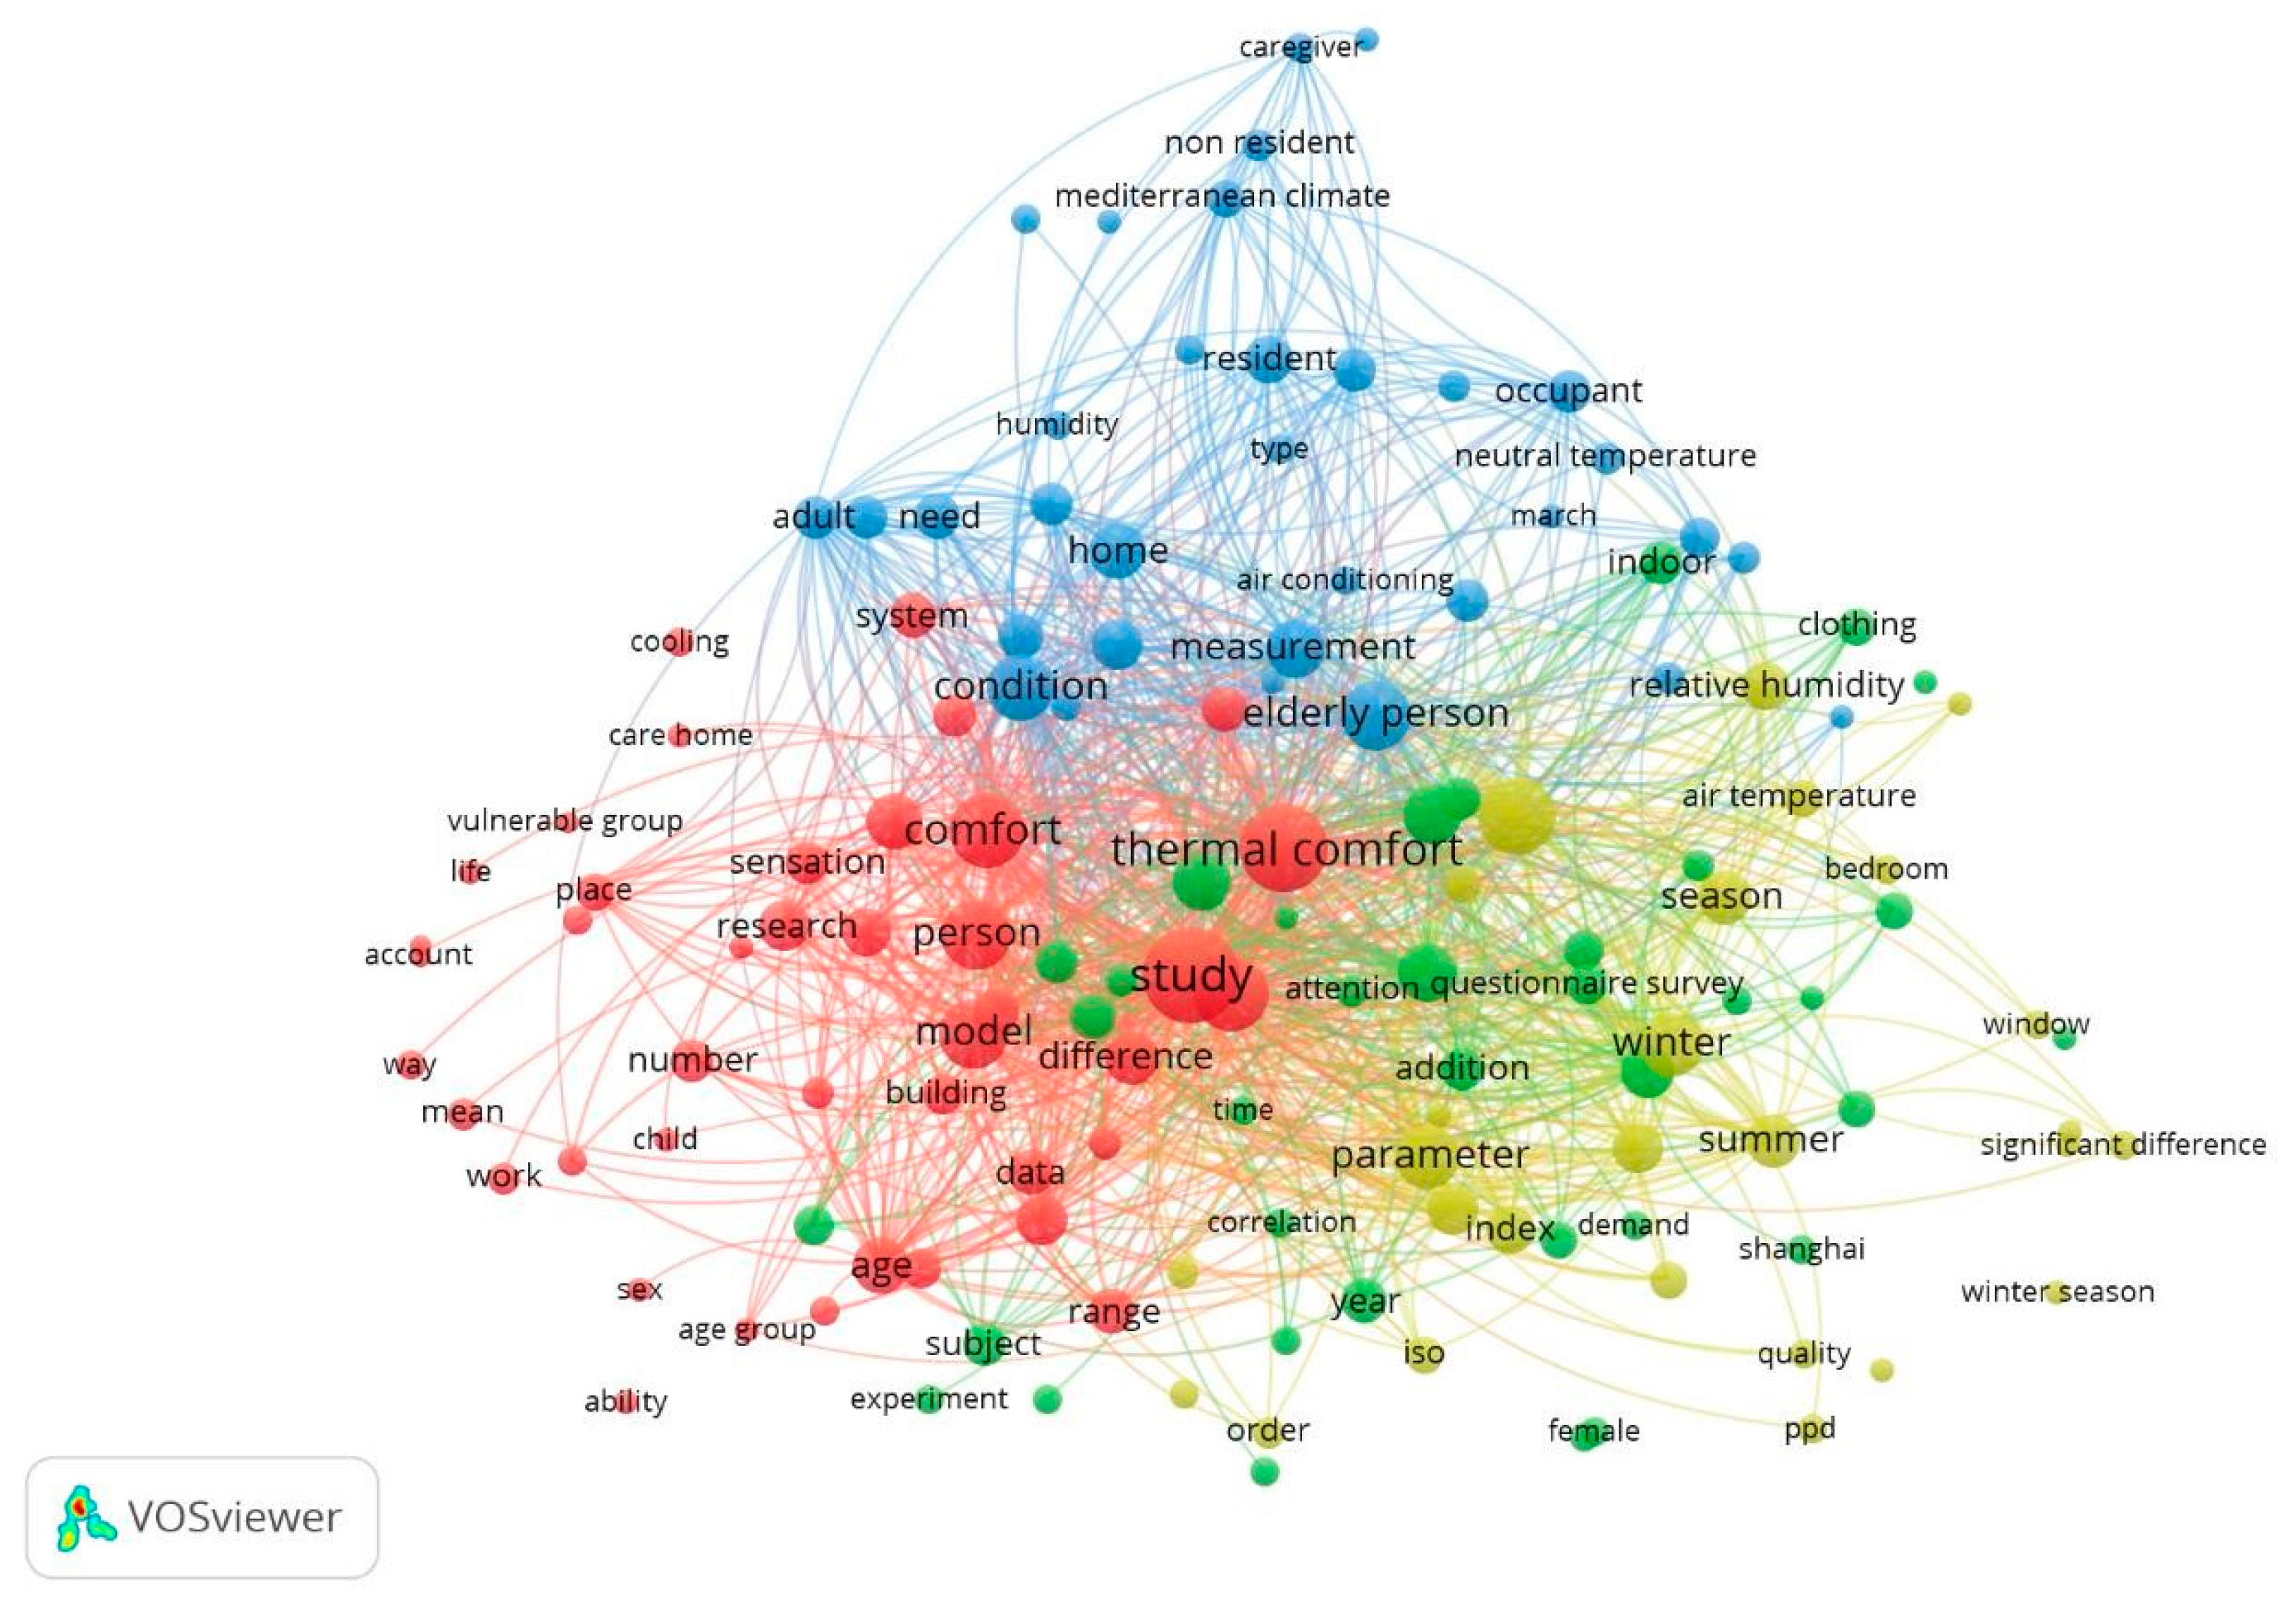
Figure 17.
Published review and original research papers considering elderly people’s thermal comfort globally. Image Credit: Bema, (2023).
Figure 17.
Published review and original research papers considering elderly people’s thermal comfort globally. Image Credit: Bema, (2023).
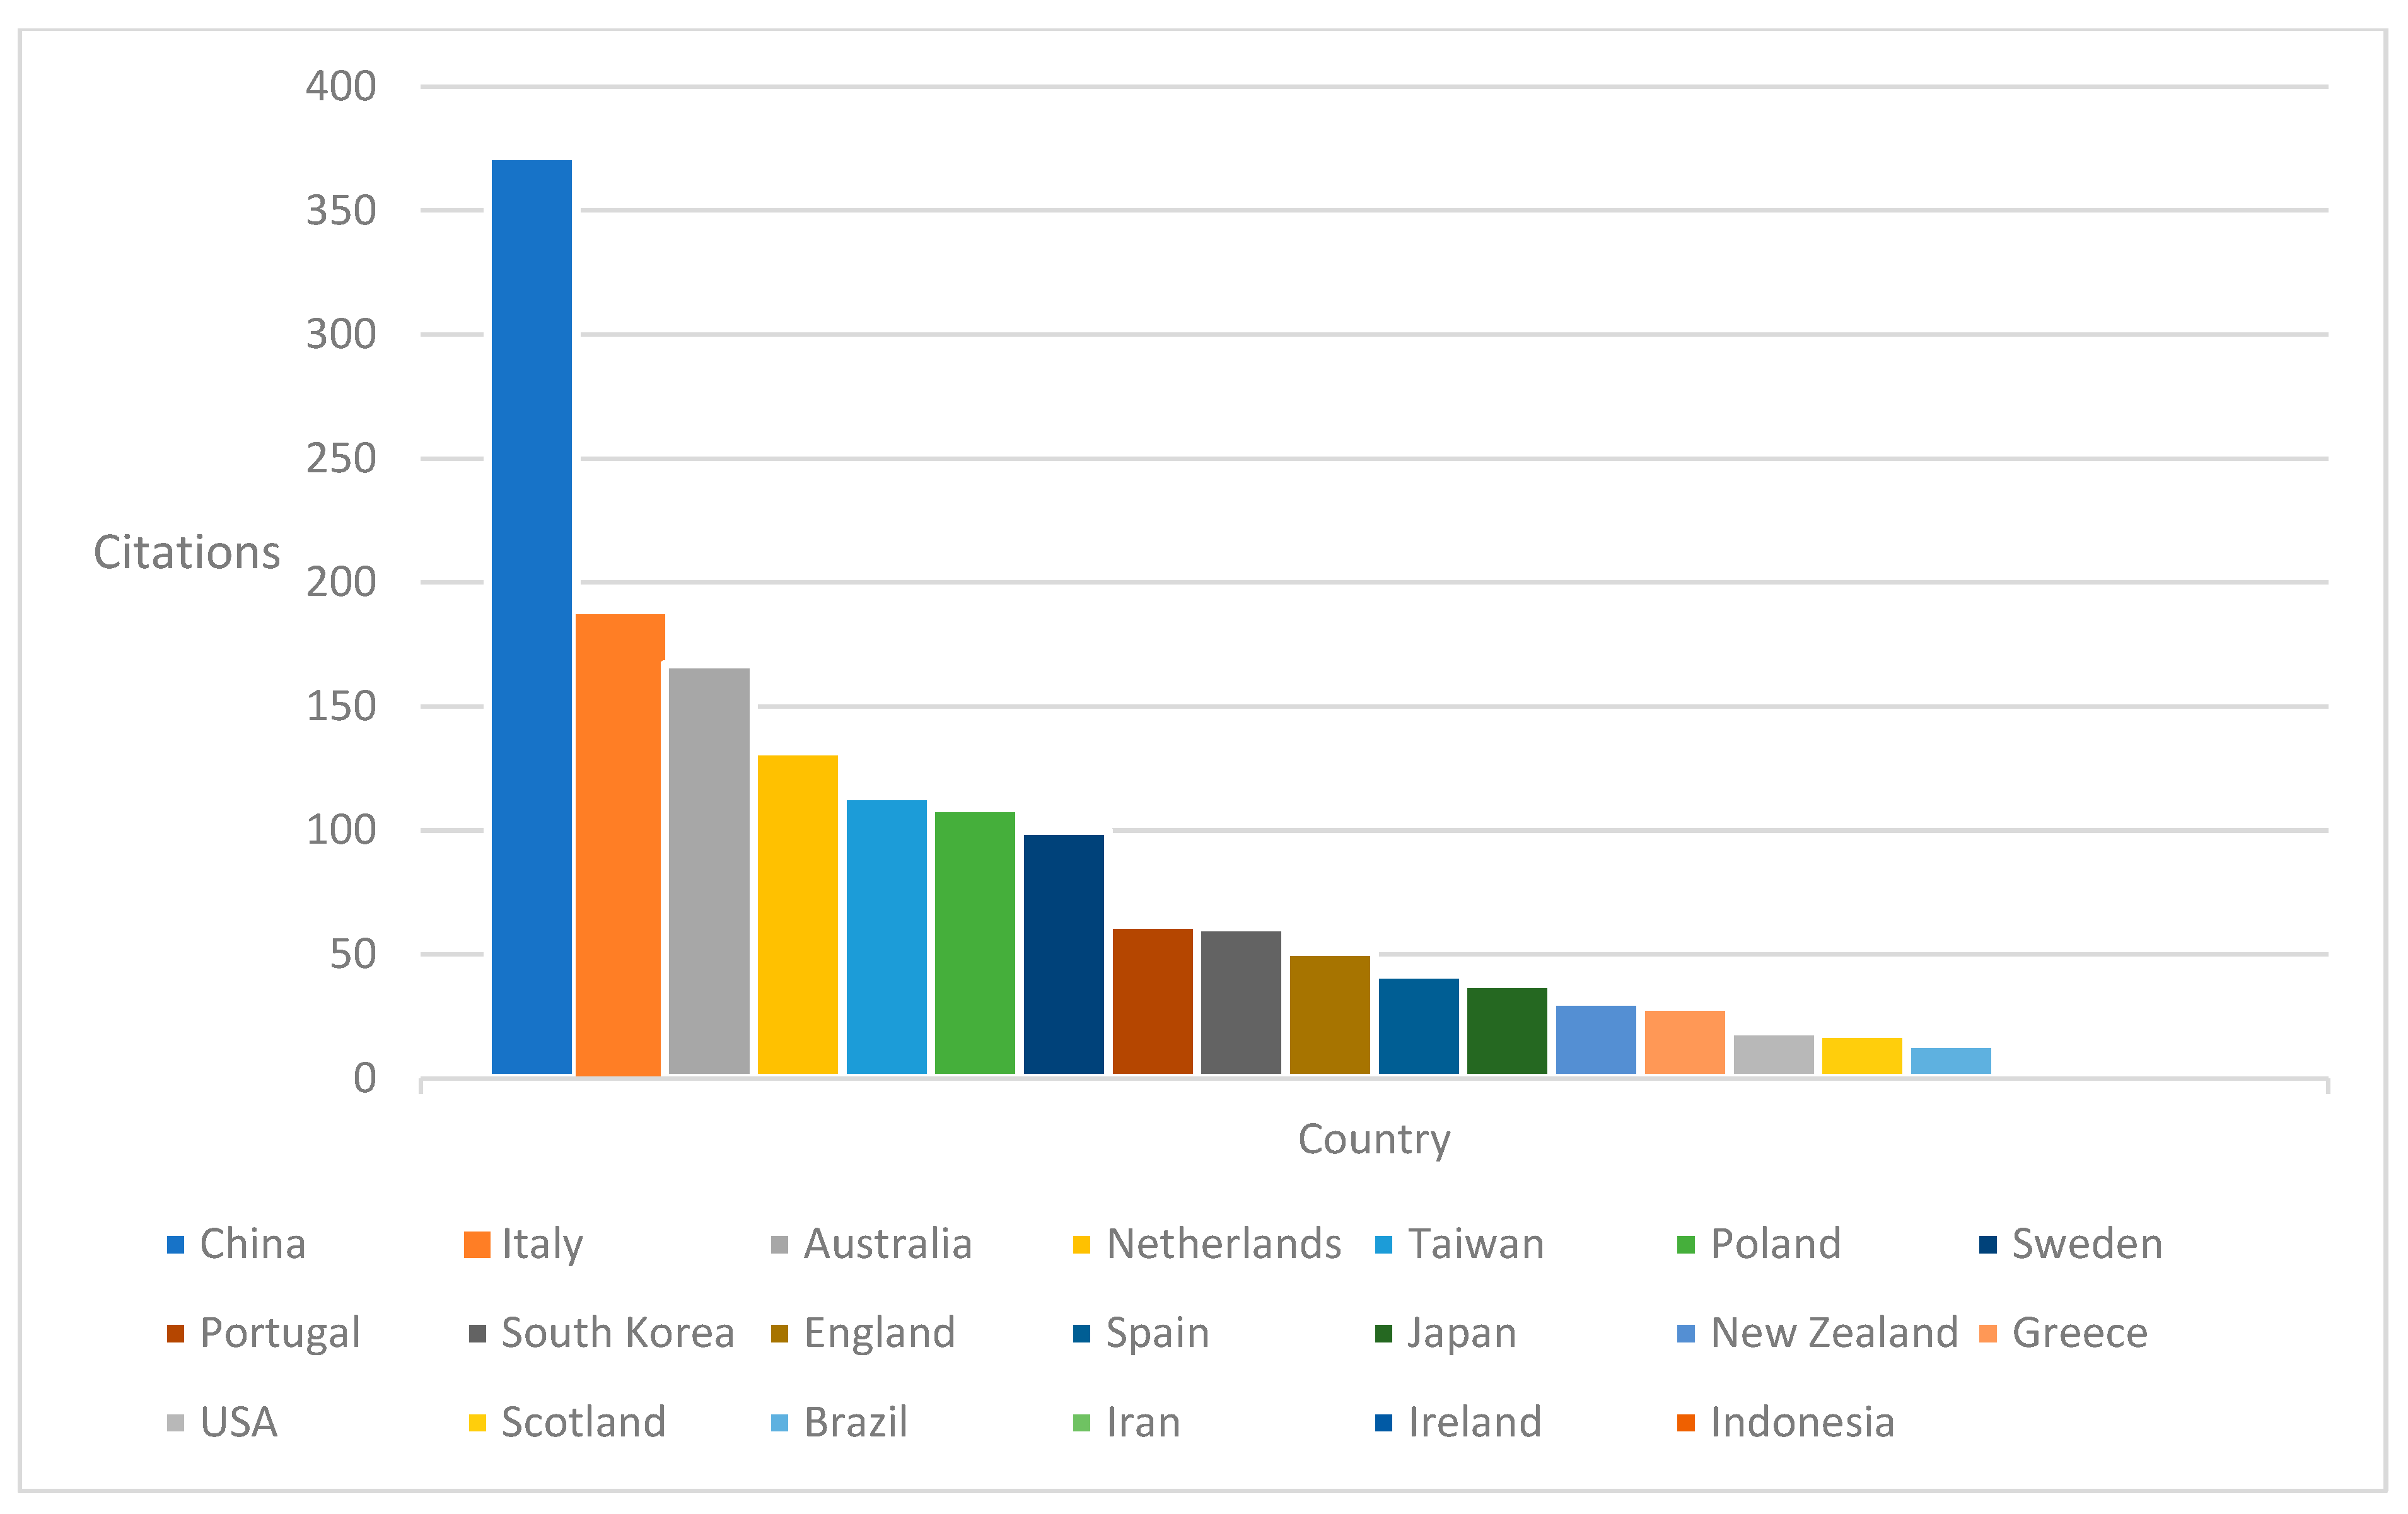
Figure 18.
(a) Probit plot for percentage dissatisfied; (b) Bar chart distribution for filtered sample statistics; (c) Overall thermal comfort for Canadian climate by considering indoor air temperature; (d) Overall thermal comfort by considering operative air temperature.Source: Thermal comfort data was extracted from https://cbe-berkeley.shinyapps.io/comfortdatabase/ (accessed on 15/01/2023).
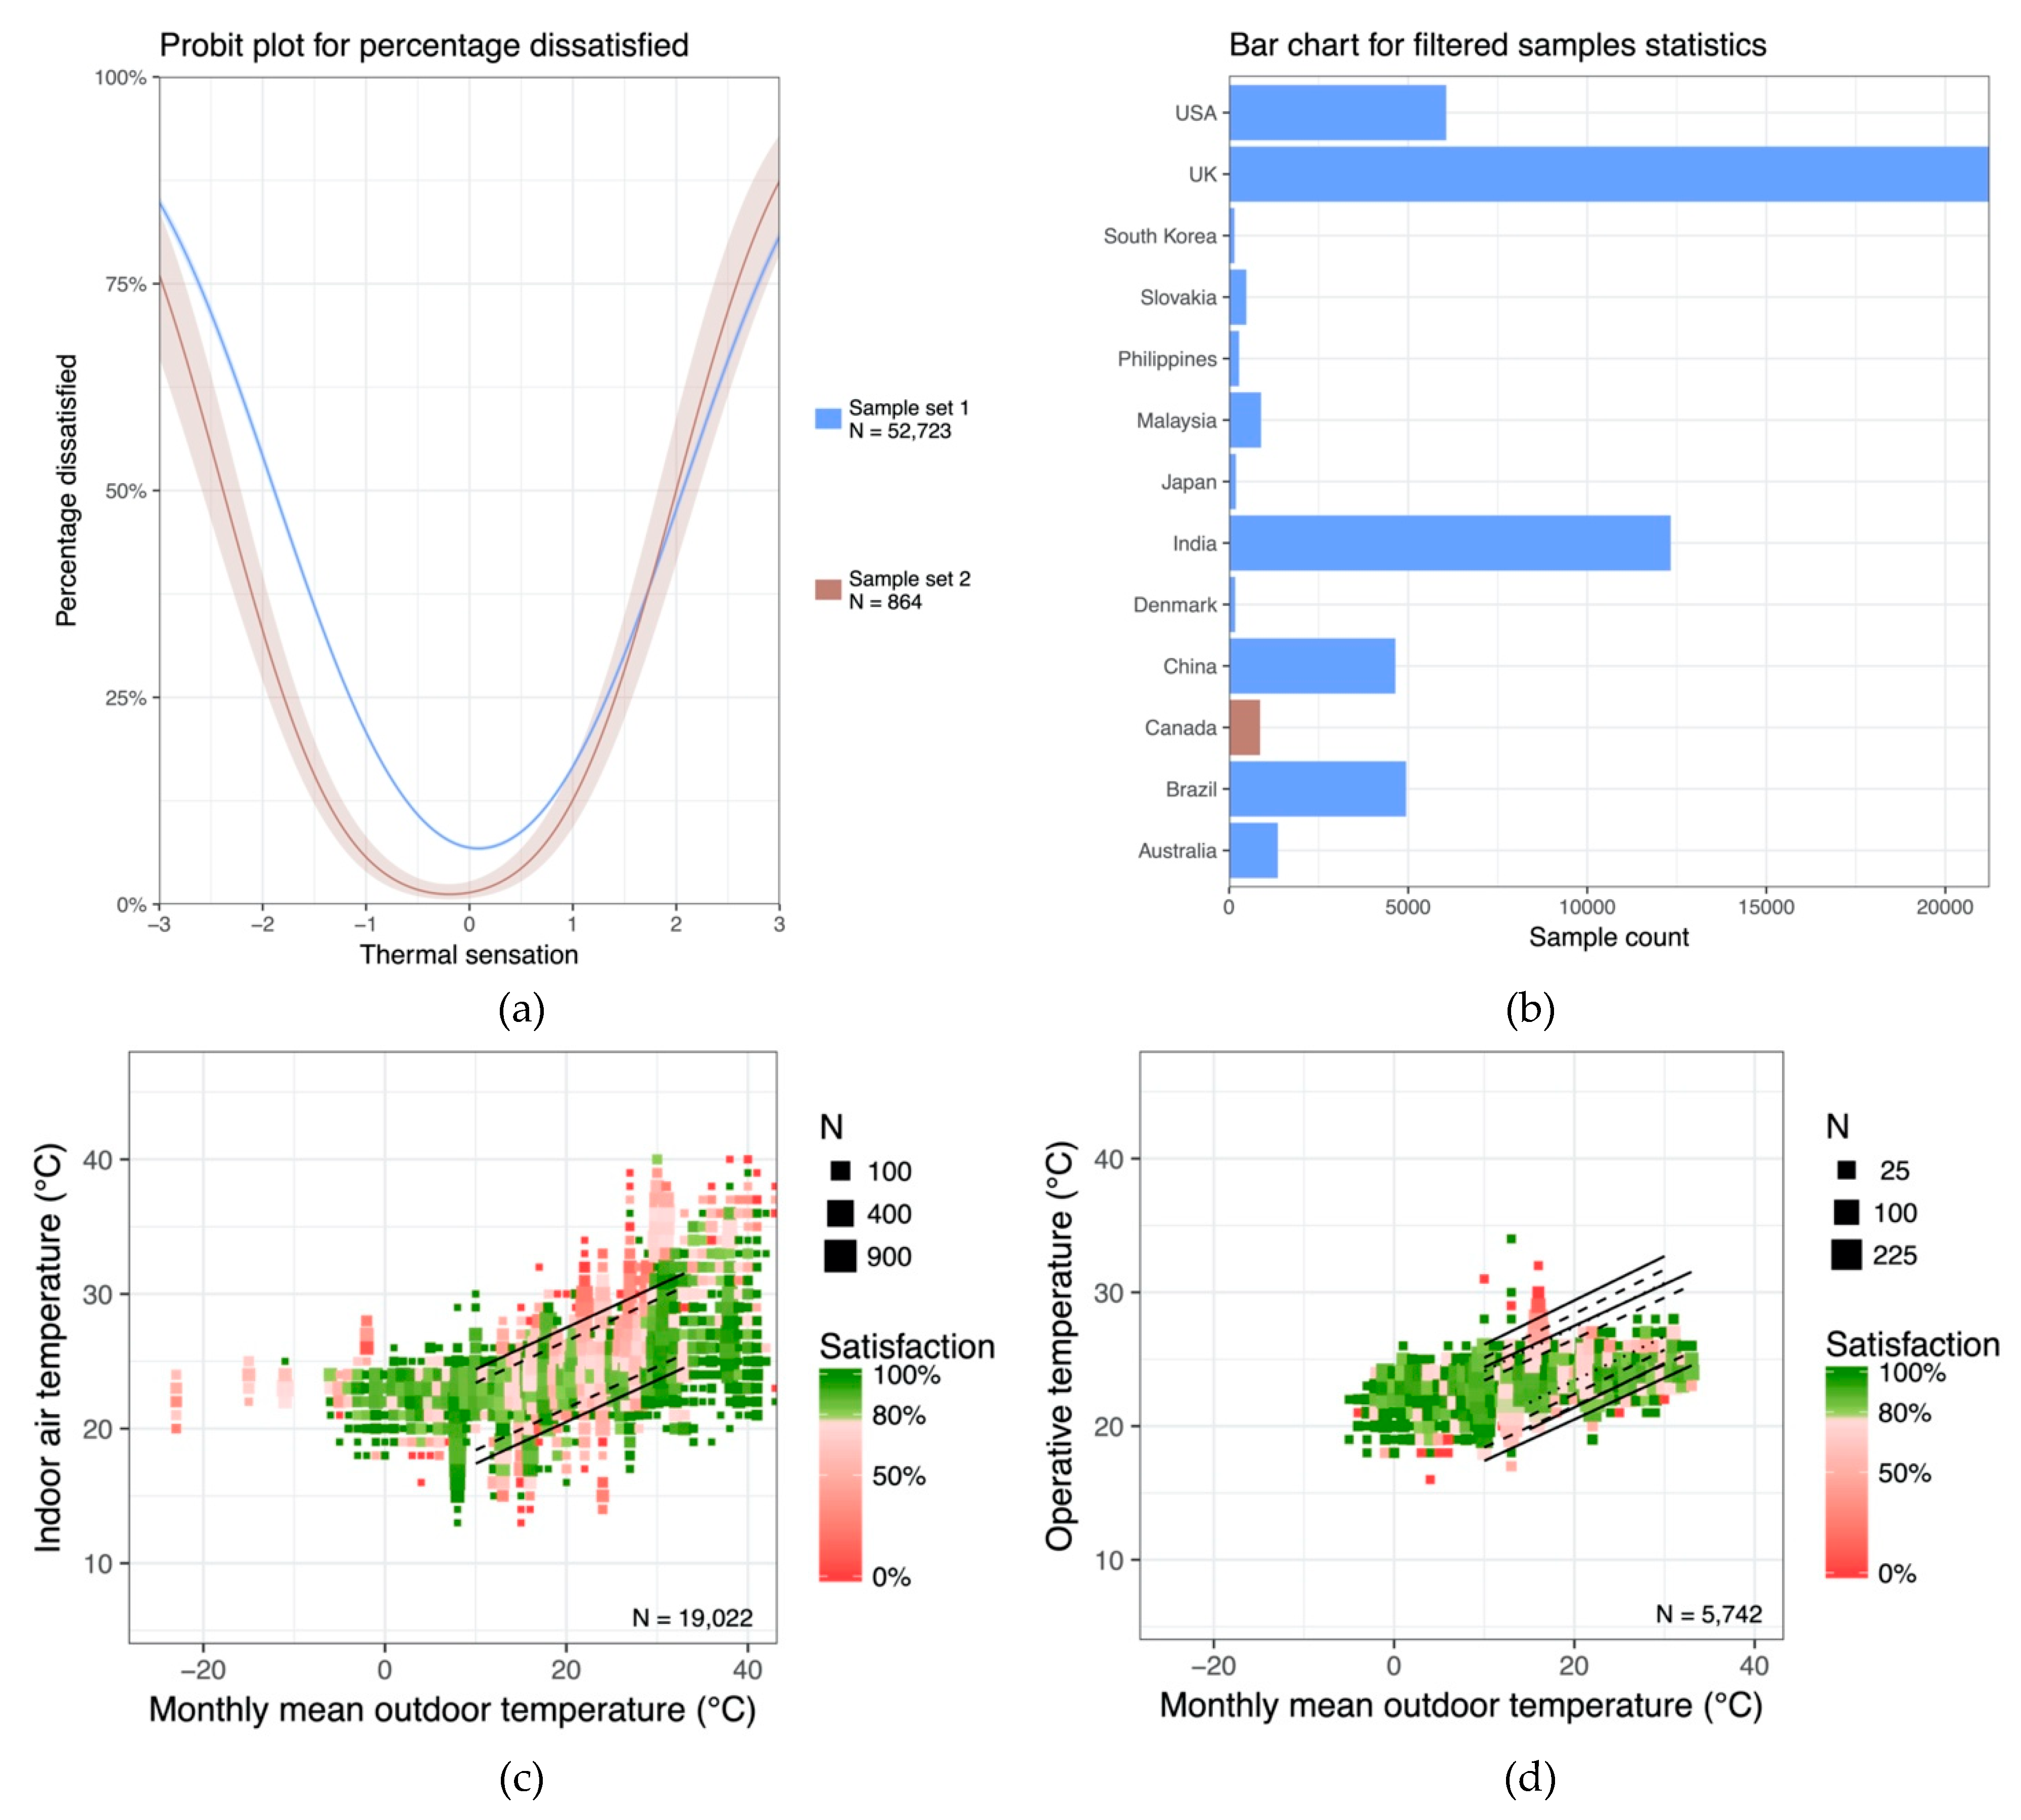
Figure 19.
(a) Correlations between thermal sensation indicator and indoor air temperature; (b) Overall thermal comfort for Canada by considering subject respondents’ clothing insulation level factor; (c) Elevated velocity model plot for Indian climate zone; (d) Thermal sensation for Indian climate zone.Source: Thermal comfort data was extracted from https://cbe-berkeley.shinyapps.io/comfortdatabase/ (accessed on 15/01/2023).
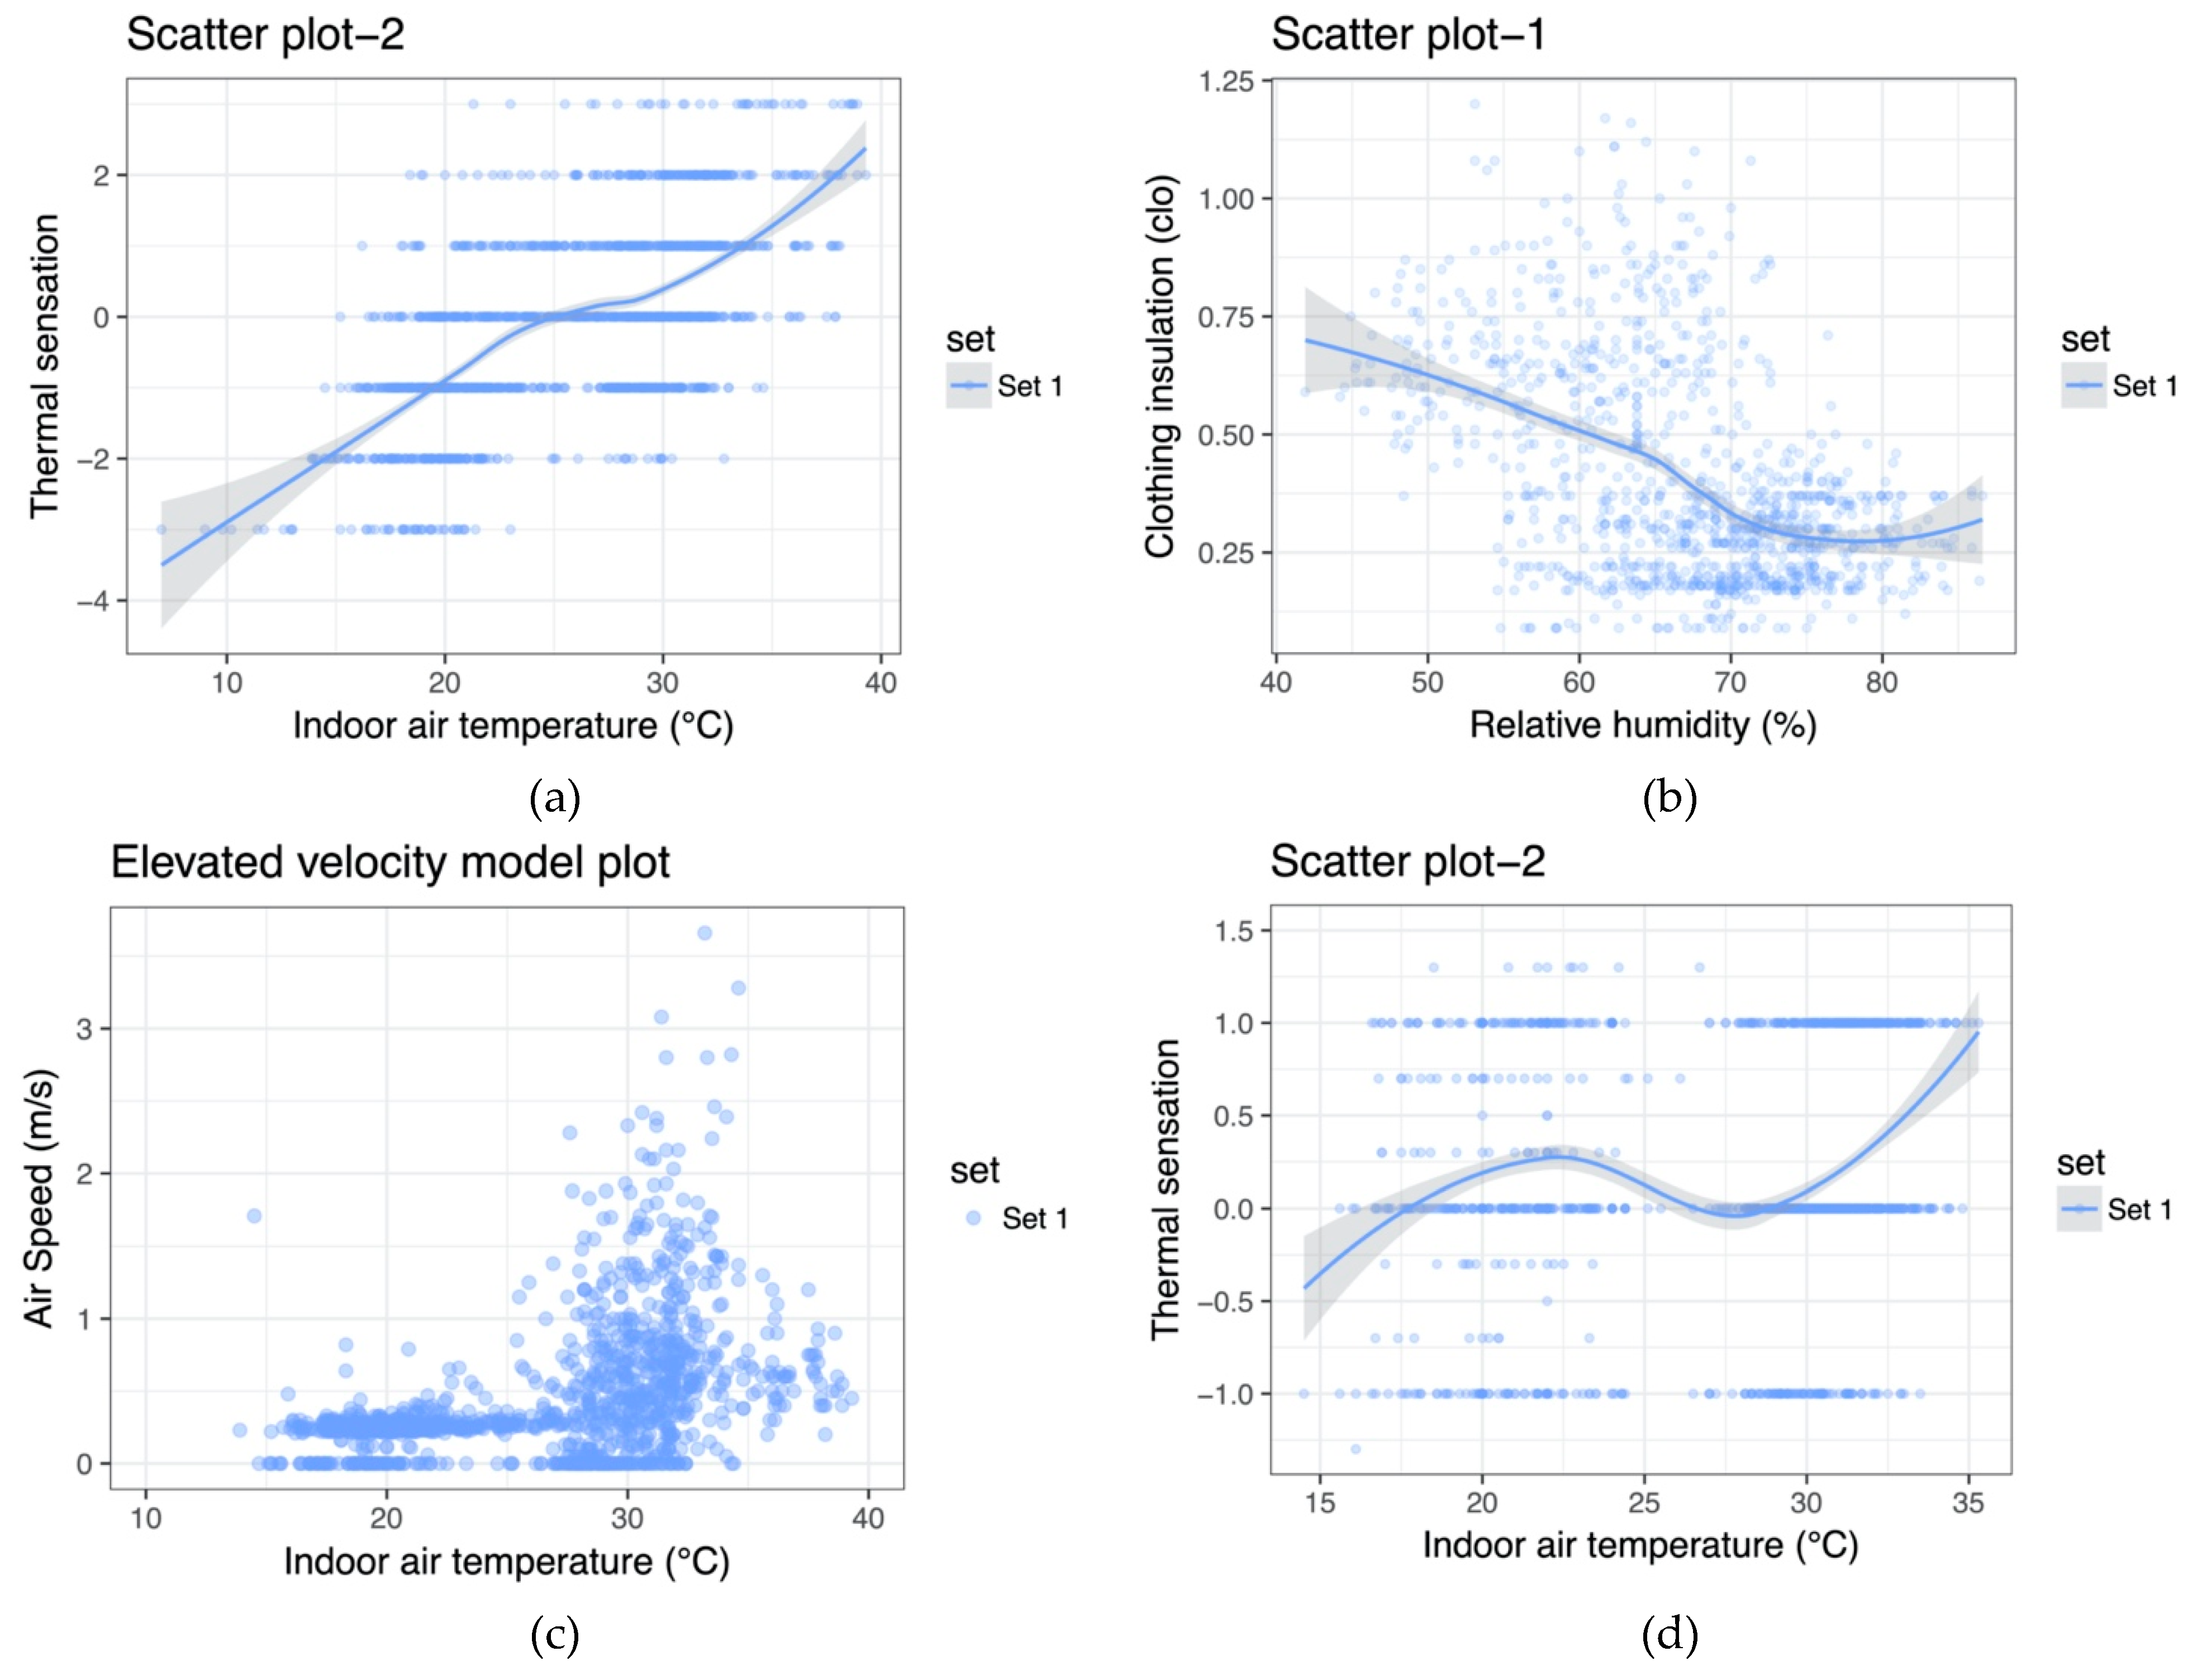
Figure 20.
(a) Subject respondents’ thermal sensation votes by considering orientation factor. Sources: https://repository.uel.ac.uk/item/8q774 (accessed on 20/01/2023). (b) Subject respondents’ thermal sensation votes by considering orientation factor (Continued). Sources: https://repository.uel.ac.uk/item/8q774 (accessed on 20/01/2023).
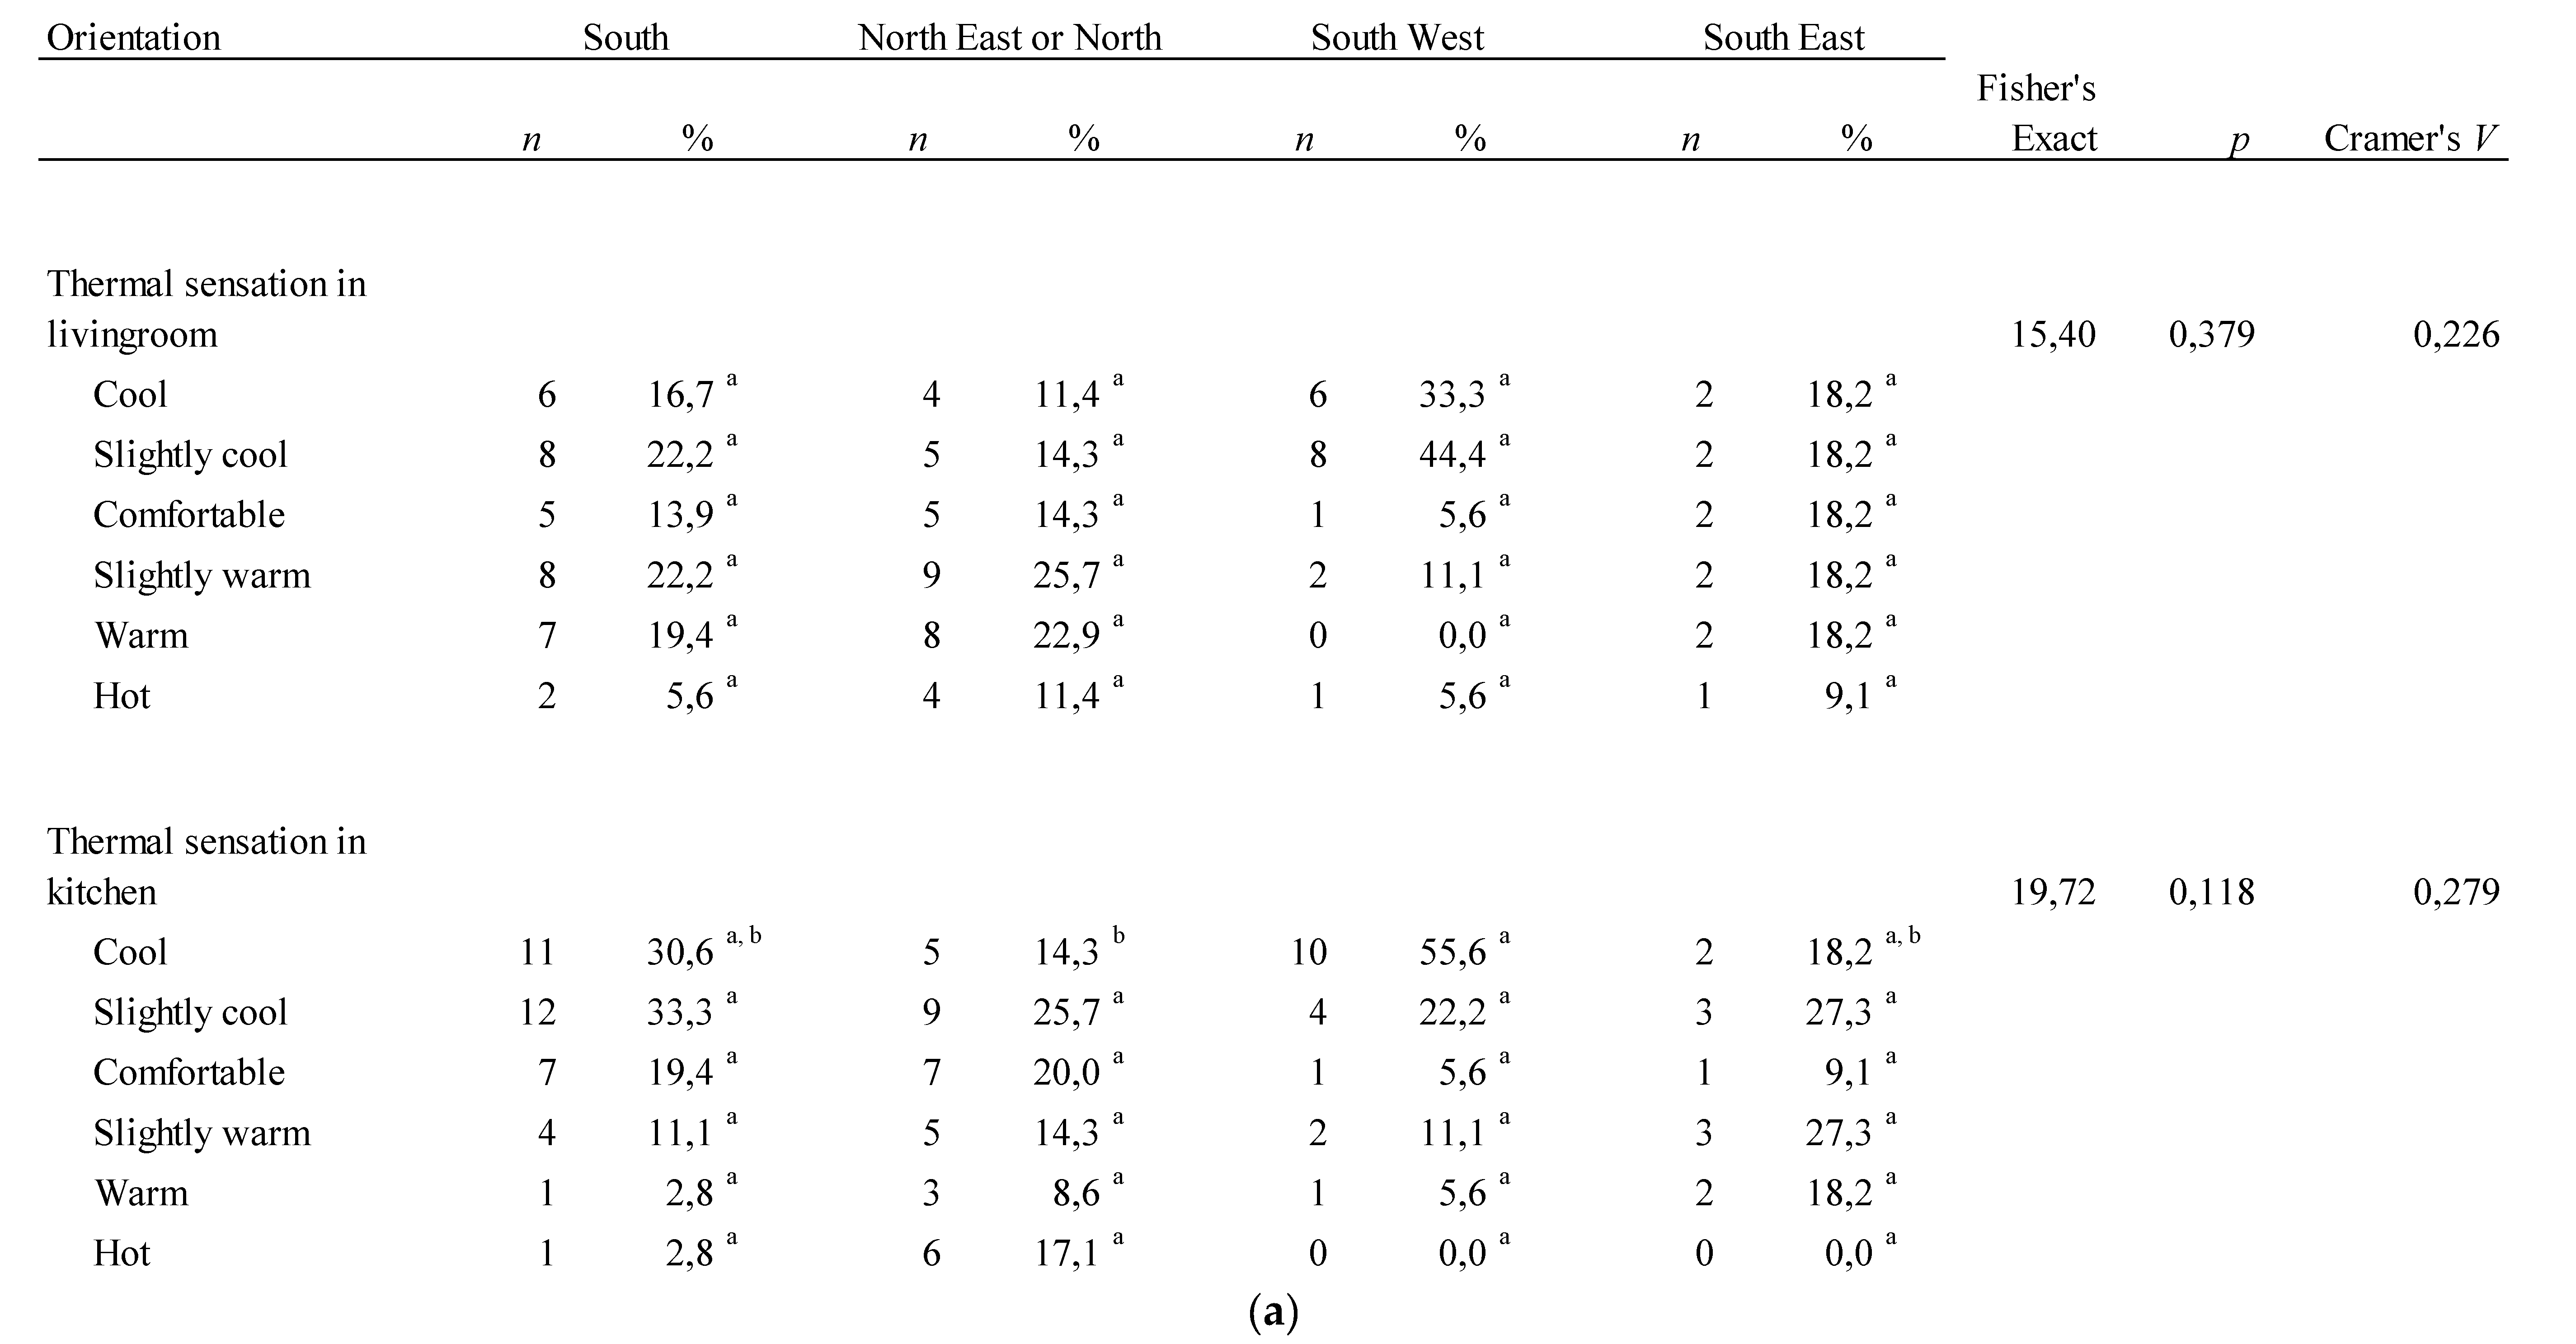
Figure 21.
Meta-analyis (a) Age group factor with the participants’ TSVs; (b) Outdoor heat stress index factor with the participants’ TSVs; (c) Outdoor relative humidity factor with the participants’ TSVs; (d) Clothing insulation level factor with the participants’ TSVs.Source: Thermal comfort data was extracted from https://repository.uel.ac.uk/item/8q774 (accessed on 20/01/2023).
Figure 22.
Meta-analysis (a) Energy efficiency awareness factor with the participants’ thermal preference; (b) Correlations between subject participants’ metabolic rate activity and health condition.Source: Thermal comfort data was extracted from https://repository.uel.ac.uk/item/8q774 (accessed on 20/01/2023).
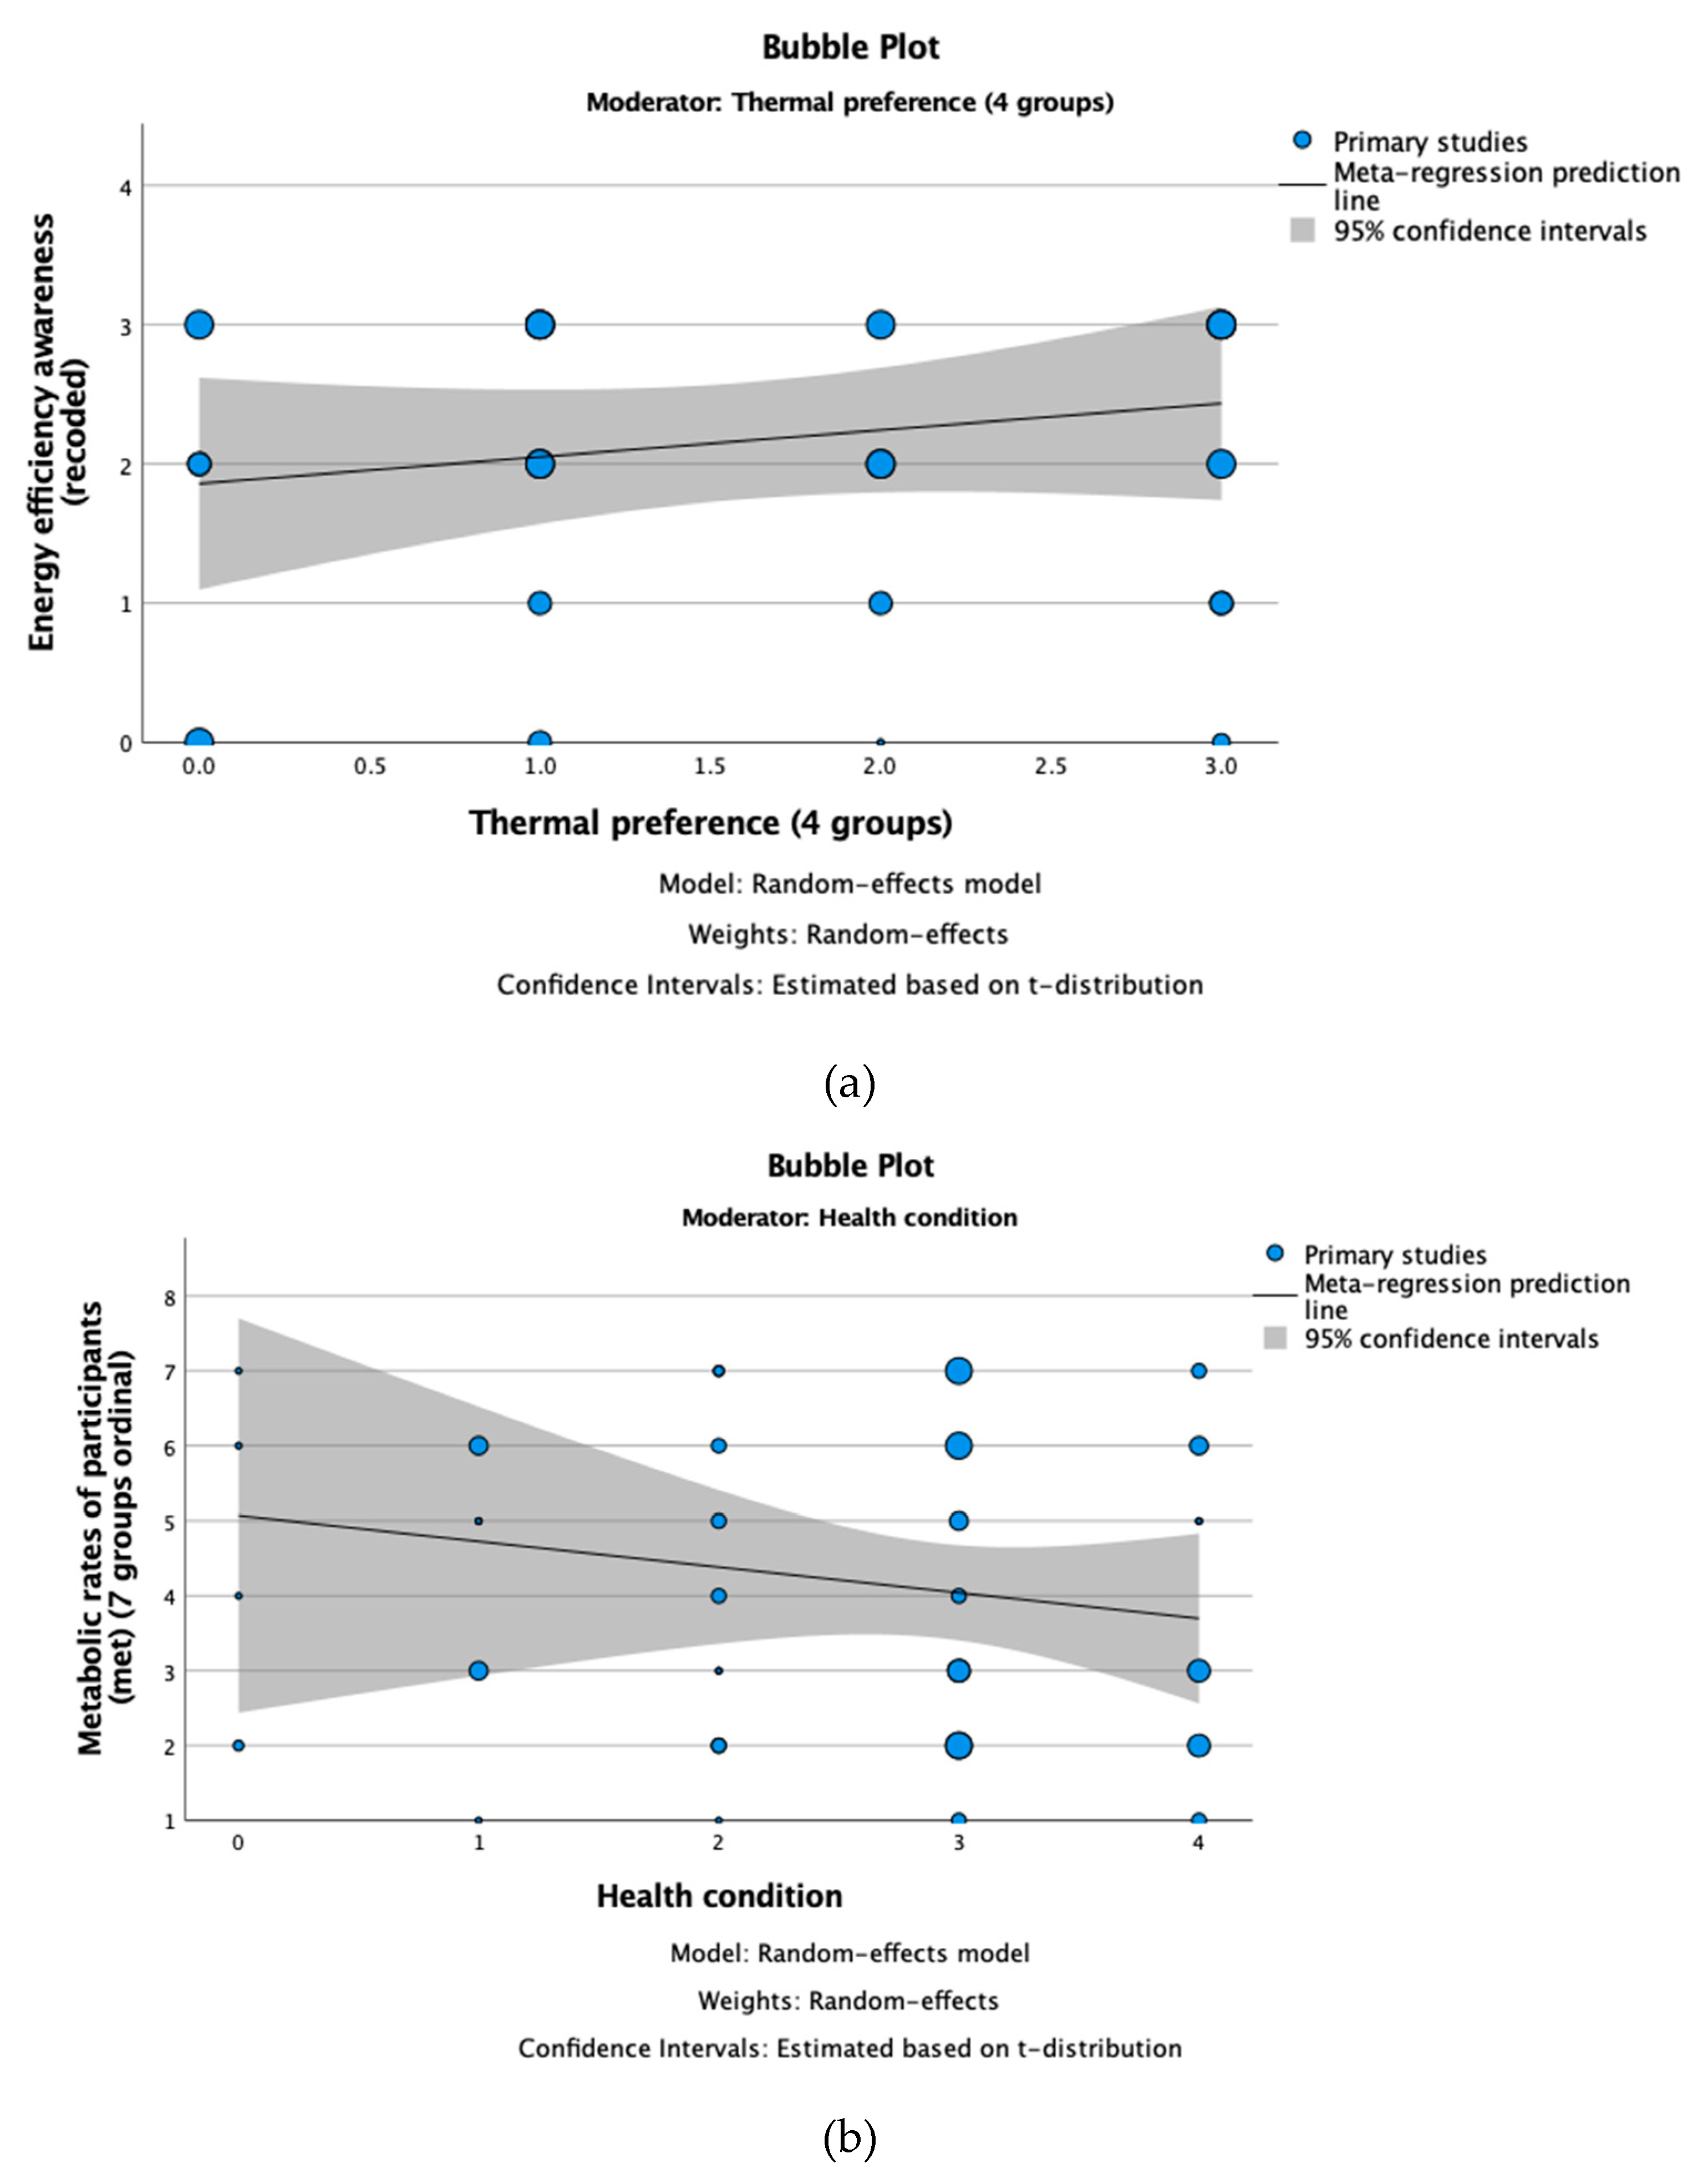

Table 1.
State-of-the-art field studies to investigate occupants’ thermal sensation.
| References | Study Location | Objective (s) | Methodology | Main findings |
|---|---|---|---|---|
|
Li et al., (2022) |
Mongolia | To observe the thermal behavior of the elderly people in terms of their thermal sensation, preference and their thermal adaptive behavior to the winter climate conditions. | Using the in-situ environmental recording devices to measure the indoor air quality of the buildings. Longitudinal field survey was conducted to gather subject respondents’ thermal sensation votes. Questionnaire survey was conducted. Field measurements were recorded. |
Adaptive temperature range for the elderly people was found to be between 15,48 and 25,56 °C . The neutral adaptive thermal comfort temperature was found to be at 20,52 °C. |
|
Yuan et al., (2022) |
China | To study the significant impact of thermal properties of buildings and thermal comfort preference of elderly people in naturally ventilated residential buildings. | Subject respondents’ thermal sensation votes were gathered through a questionnaire survey. 152 elderly people were recruited for the study. |
The study was found to be that the thermally acceptable level has reached at 16,74 °C for the elderly people in cold climates. Although, elderly people were more vulnerable to temperature below 16,74 °C and less sensitive to temperatures above 15,67 °C. |
|
Yang et al., (2016) |
Korea | To- explore the impact of different seasonal variations on elderly people’s thermal sensation in nursery homes and to- assess the indoor air quality of occupied spaces in nursery homes. | Software simulation was used to optimize the building envelope by using different thermal parameters, including effective fenestration design principles were applied. | According to the findings of a longitudinal survey, metabolism rate remained constant. At the same time, clothing insulation level (clo) factor had an impact on the adaptive thermal comfort assessment. |
|
Forcada et al., (2021) |
Eastern Mediterranean basin |
To identify the discrepancies in the thermal sensation votes and to-assess subject respondents’ thermal preference in conjunction with the in-situ environmental measurements which were conducted at the time of undertaking the questionnaire survey in nursery homes in the winter. |
In-situ environmental monitoring was applied. 25 representative nursery homes were selected for the study. |
Therapists and caregivers indicated different thermal sensation votes. This deterministic factor has proven that clothing insulation level is the major indictor for the adaptive thermal comfort assessment. |
Source: Bema, (2022).
Table 2.
Factors affecting occupants’ thermal sensation to identify neutral adaptive thermal comfort.
Table 2.
Factors affecting occupants’ thermal sensation to identify neutral adaptive thermal comfort.
| References | Indoor Temp (°C) |
Relative Humidity (%) |
Air Velocity (m/s) |
Clothing (clo) |
Outdoor Temp (°C) |
Age (years) |
Metabolic rate (met) |
|---|---|---|---|---|---|---|---|
| Djamila, (2017) | 22-24,1 | <5% | 0-1 | 0,02-2 | - | 18-75 | 0,8-1,3 |
| 50 | 0.1 | 0,5-1 | |||||
|
Yi et al., (2022a) |
-10-60 | 5-95 | |||||
| Rawal et al., (2022) | 25–35 | 30 | 0-1 | - | - | - | - |
Source: Bema, (2022).
Table 3.
Passive heating and cooling techniques applied in recent studies.
| References | Strategy | Heating load |
Cooling load |
Energy performance improvement | Thermal comfort improvement | Location |
|---|---|---|---|---|---|---|
| Dabaieh & Serageldin, (2020a) |
|
7,9 kWh/m2 | 2,8 kWh/m2 | Achieved annual surplus energy of 180 kWh/m2/annum | Achieved 88% of thermal comfort needs | Sweden |
| Dabaieh & Serageldin, (2020b) |
|
20 kWh/m2 | 99,2 kWh/m2 | Annual electrical energy savings of 42,9 kWh/m2/year |
|
Hot arid areas (Egypt) |
| Cellat et al., (2020) | Micro-encapsulated phase change materials (PCM) in concrete | - | - | 13% energy savings. | 2 °C indoor temperature gain was achieved | Adana, Turkey |
| Fernandez-Antolin et al., (2019) |
|
70,11 kWh/m2 | 18,43 kWh/m2 | Design was able to meet the Passivhaus Standard Building threshold | Not considered | Spain |
| Huang et al., (2020) | Cylindrical PCM-assisted Earth Air Heat Exchanger (EAHE) | 96% energy consumption reduction | 8,7% energy consumption reduction daily maximum cooling capacity of EAHE was increased by 28,55%–39,74% | Electrical Energy consumption reduced by 78,9% cooling output of the system increased by 20,05% | Not considered | China |
Source: Bema, (2022).
Table 4.
Both the (ASHRAE-55-2020) and (EN-16798) thermal acceptability results obtained from the CBE thermal comfort tool.
Table 4.
Both the (ASHRAE-55-2020) and (EN-16798) thermal acceptability results obtained from the CBE thermal comfort tool.
| Inputs | Adaptive Thermal Comfort Assessment Criteria | ||||
|---|---|---|---|---|---|
| Variables | ASHRAE-55-2020 80% acceptable limits |
EN-16798 acceptable comfort limits | |||
| Mean outdoor air temperature | 25°C | Comfortable Operative air temperature: | 22,1 to 29,1 °C | Class III | 22,1 to 31,1 °C |
| Operative air temperature | 25°C | 90% acceptable limits | Class II | 23,1 to 30,1 °C | |
| air velocity | 3m/s | Comfortable Operative air temperature: | 23,1 to 28,1 °C | Class I | 24,1 to 29,1 °C |
Source: Adapted from https://comfort.cbe.berkeley.edu (accessed on 20/01/2023).
Table 5.
Theoretical framework of thermal comfort categories according to ASHRAE 55-2020.
| ASHRAE 55 (%) | Suitability | PPD (%) | Fanger (PMV) | Adaptive (K) |
|---|---|---|---|---|
| 90 | Suitable for high standard thermal comfort | < 10 | -0,5<PMV<+ 0,5 | +2,5 |
| 80 | Suitable for typical applications when certain parameters are unavailable | < 20 | 0,85<PMV<0,85 | +3,5 |
Source: Adapted from Nicol et al., (2020).
Table 6.
Adaptive thermal comfort models developed by other researchers.
| Model | Region | Age | Outdoor Parameter(s) | Thermal Response |
|---|---|---|---|---|
| Yang et al., (2016) | Korea | > 65 | 4-days weighted running mean of outdoor air temperature | Clothing insulation |
|
Wang et al., (2018) |
Shanghai, | > 65 | 7-days weighted running mean of outdoor air temperature |
Neutral temperature |
| Yuan et al, (2022) | China | > 70 | Prevailing mean outdoor temperature air |
Neutral temperature |
| Zhang et a.l, (2017) | China | > 70 | Outdoor air temperature | Clothing insulation, Thermal sensation vote, Proportion of air-conditioned |
| Zhao et al. (2021) | Chongqing, China |
> 60 | Outdoor air temperature | Proportion of windows opened; Proportion of fans used |
Source: Adapted from Cheung et al., (2019).
Table 7.
Both the physical and personal variables measured and the instrument type, description and personal variable evaluation criteria.
Table 7.
Both the physical and personal variables measured and the instrument type, description and personal variable evaluation criteria.
| Physical and environmental variables (Indoor) | Instruments used |
|---|---|
| Air temperature (Ta) & Relative Humidity (RH) | SIKA’MH 3350 (Digital Thermo-hygrometer) with TFS 0100E (sensor) temperature probe measurement |
| Range/resolution: Temperature: -40 °C to +120 °C /0,1 °C; Relative humidity: 0–100% RH/0.1% | |
| Accuracy: Temperature: ±0,5 °C; Relative humidity: ±0,1% | |
| Globe temperature (Tg) | K Type Thermocouple temperature probe TP-101 whose probe was inserted in a black-painted table tennis ball (40 mm diameter) (Measurement range: -50 °C to 600 °C; Accuracy: ±2,5 °C) |
| Air velocity | UNITEST Vane Thermo-anemometer 93460 (Measurement range: 0,3 m/s -45 m/s; Tolerance: ±3%) |
| Personal variables | |
| Metabolic activity (met) & Clothing insulation level (clo) | Estimated using checklist from the ASHRAE 55-2020 for corresponding activities & clothing insulation level |
Source: Adapted from Zhang et al., (2017).
Table 8.
Environmental monitoring data and other external parameters recorded for the thermal comfort assessment.
Table 8.
Environmental monitoring data and other external parameters recorded for the thermal comfort assessment.
| Parameter(s) | Ottawa | Montreal |
|---|---|---|
| Dry bulb indoor air temperature | Complete | Complete |
| Wet dry bulb indoor air temperature | Incomplete | Complete |
| Relative humidity | Complete | Complete |
| Air velocity | Incomplete | Complete |
| Clothing insulation | Complete | Complete |
| Outdoor air temperature | Complete | Complete |
| Outdoor relative humidity | Complete | Complete |
| Metabolic rate | Complete | Complete |
| Gender | Complete | Complete |
| Age | Not recorded | Complete |
Source: Adapted from Nicol & Humphreys (2010).
Table 9.
Variation of thermal comfort index scales.
| Scale | Thermal Sensation Vote (TSV) |
Thermal Comfort Vote (TCV) |
Thermal Acceptability (TA) |
Thermal Preference (TP) |
|---|---|---|---|---|
| 4 | - | Unbearable | - | - |
| 3 | Hot | Very uncomfortable | - | - |
| 2 | Warm | Uncomfortable | Very unacceptable | - |
| 1 | Slightly warm | Slightly uncomfortable | Just acceptable | Warmer |
| 0 | Neutral | Uncomfortable | - | No change |
| -1 | Slightly cool | - | Just acceptable | Cooler |
| -2 | Cool | - | Very acceptable | - |
| -3 | Cold | - | - | - |
Source: Adapted from Zhang et al., (2017).
Table 10.
Coded Variables During the Data Preparation Stage.
| Age band | Cooling energy consumption in August 2015 | Floor level |
|---|---|---|
| Cooling consumption on weekdays | Cooling energy consumption in summer 2015 | Health condition |
| Clothing insulation levels of participants | Heating energy consumption in winter 2015 | Occupation |
| Type of cooling control in home | Cooling energy consumption in August 2016 | Heating consumption on the weekend |
| Ethnicity | Cooling energy consumption in summer 2016 | Household density |
| Thermal preference | Heating energy consumption in winter 2016 | Income |
| Interviewed room condition | Metabolic rates of participants | Length of residency |
| Orientation | Reasons for thermal discomfort | Space conditioning |
| Overall thermal satisfaction in summer | Thermal sensation in bedrooms 1, 2, 3 and living room | Type of cooling system |
| Window closing reasons | Window opening patterns in winter | Type of heating system |
|
Note:Additionally, all categorical variables were recorded in ordinal sequence where possible (e.g., metabolic rate) Variables related to occupants’ thermal preferences were recoded from very cold to very hot All variables were recoded from smallest value to largest value All dichotomous variables were recoded to 1 = yes, 0 = no | ||
Source: Ozarisoy, (2022).
Table 11.
Distribution of the 80% thermal acceptability of subject respondents which were gathered from a field measurement.
Table 11.
Distribution of the 80% thermal acceptability of subject respondents which were gathered from a field measurement.
| Comparative studies | 80% acceptability |
|---|---|
| Kalmár (2016) | 25 -30 °C |
| Indraganti et al., (2014) | 27,5 -30 °C |
| Singh et al., (2011) | 2,8 -31 °C |
| Singh & Chani, (2018) | 22,5 -29,8 °C |
| 21,91 -29,3 °C |
Source: Adapted from Singh & Chani, (2018).
Table 12.
Relationships between household occupation and cooling and heating energy consumption patterns.
Table 12.
Relationships between household occupation and cooling and heating energy consumption patterns.
| Research Questions | Occupation | Weekday Heating- Consumption Patterns |
Weekend Heating- Consumption Patterns |
Weekday Cooling- Consumption Patterns |
Weekend Cooling- Consumption Patterns |
|
|---|---|---|---|---|---|---|
| Q 1: What is your occupation? | 1 | 0,253* | 0,109 | 0,098 | 0,167 | |
| — | 0,042 | 0,896 | 0,955 | 0,579 | ||
| Q 2: When do you turn on heating device(s) on weekdays? | 0,253* | 1 | 0,373* | 0,611* | 0,504* | |
| 0,042 | — | <0,001 | <0,001 | <0,001 | ||
| Q 3: When do you turn on heating device(s) on the weekend? | 0,109 | 0,373* | 1 | 0,522* | 0,706* | |
| 0,896 | <0,001 | — | <0,001 | <0,001 | ||
| Q 4: When do you turn on cooling device(s) on weekdays? | 0,098 | 0,611* | 0,522* | 1 | 0,774* | |
| 0,955 | <0,001 | <0,001 | — | <0,001 | ||
| Q 5: When do you turn on cooling device(s) on the weekend? | 0,167 | 0,504* | 0,706* | 0,774* | — | |
| 0,579 | <0,001 | <0,001 | <0,001 | 1 | ||
| Occupation – Weekend heating consumption, Fisher’s exact = 2,41, p = 0,896, Cramer’s V = 0,109 Occupation – Weekday heating consumption, Fisher’s exact = 12,49, p = 0,042, Cramer’s V = 0,253 Occupation – Weekend cooling consumption, Fisher’s exact = 7,63, p = 0,579, Cramer’s V = 0,167 Occupation – Weekday cooling consumption, Fisher’s exact = 1,76, p = 0,955, Cramer’s V = 0,098 Weekday cooling consumption – Weekend heating consumption, χ²(4) = 54,59, p < 0,001, Cramer’s V = 0,522 Weekday cooling consumption – Weekday heating consumption, χ²(4) = 74,57, p < 0,001, Cramer’s V = 0,611 Weekday cooling consumption – Weekend cooling consumption, χ²(6) = 119,77, p < 0,001, Cramer’s V = 0,774 Weekend cooling consumption– Weekend heating consumption, χ²(6) = 99,69, p < 0,001, Cramer’s V = 0,706 Weekend cooling consumption– Weekday heating consumption, Fisher’s exact = 49,70, p < 0,001, Cramer’s V = 0,504 Weekday heating consumption– Weekend heating consumption, χ²(4) = 27,89, p < 0,001, Cramer’s V = 0,373 | ||||||
Disclaimer/Publisher’s Note: The statements, opinions and data contained in all publications are solely those of the individual author(s) and contributor(s) and not of MDPI and/or the editor(s). MDPI and/or the editor(s) disclaim responsibility for any injury to people or property resulting from any ideas, methods, instructions or products referred to in the content. |
© 2023 by the authors. Licensee MDPI, Basel, Switzerland. This article is an open access article distributed under the terms and conditions of the Creative Commons Attribution (CC BY) license (http://creativecommons.org/licenses/by/4.0/).
Copyright: This open access article is published under a Creative Commons CC BY 4.0 license, which permit the free download, distribution, and reuse, provided that the author and preprint are cited in any reuse.


