1. Introduction
Power line communication (PLC) is a widely used communication method in recent times. PLC, which makes use of the system’s existing power connections to enable data transmission capabilities, is one of the most widely utilised methodologies for smart-meter applications in smart-grid and micro-grid environments [
1].
PLC technology is defined as the realization of data communication while executing generation, transmission and distribution operations over the existing electricity network. With the development and gaining importance of high frequency applications, PLC has started to be used for remote control and network monitoring in electricity generation transmission and distribution processes [
2].
PLC has been a subject of interest from the past to the present and has been researched and continues to be researched from different perspectives. The first study on PLC was used to remotely measure the voltage level of the batteries in the telegraph system in England in 1838. At the end of the 1890s and the beginning of the 1900s, the foundations of PLC technologies used today were laid with the patents obtained in England, Germany and America [
3,
4].
At the beginning of the 2000s, the importance of communication technologies for data exchange has increased as a result of the widespread use of the concept of smart grid throughout the world, and in this direction, studies on PLC have increased.
PLC results in lower initial investment and ongoing maintenance costs since it uses existing power connections for data transfer. The narrowband PLC used by smart meters is in accordance with European Norm (EN) 50065, which was created by CENELEC in 1992 [
5]. While the PRIME Alliance has published the industry standard PRIME (Power-line Related Intelligent Metering Evolution), several industries start the development of a PLC solution based on the regulation G3-PLC that has been established by the G3-PLC Alliance [
6,
7]. However, a variety of issues might affect how well the PLC performs. In fact, the majority of switching-mode power converters use a switching frequency between 9 and 150 kHz in the International Special Committee on Radio Interference (CISPR) A band. As a result, the produced EMI is located in the same frequency region of the PLC as that of the CENELEC (between 3 and 150 kHz) [
5,
8]. There is a parasitic coupling channel between the power circuit and the communication circuit, which allows EMI to be coupled from the power circuit (the source of EMI) to the communication circuit (the victim). Data transmission errors and occasionally communication failure result from EMI because it lowers the signal-to-noise ratio (SNR) below the level required for noise-free communication [
9].
This wired communication link can be a victim of EMI in state-of-the-art grids for common electrical installations such as DC and AC distribution grids, especially in DC micro grids where converters generate low and high frequency harmonics and noise, which may interrupt the data transmission capability of PLC system and finally can affect the micro grid control operation [
10].
The recent techniques to mitigate Electromagnetic Interference (EMI) from a known source, i.e. a power converter, is applying filtering strategies [
11] or modulation techniques for the switching frequency as presented in [
12]. The latter has demonstrated well-known advantages due to the straightforward methods in which additional components or modifications to the original devices are not required. Considering the application of these techniques based on frequency modulation from the EMI source the term Spread Spectrum has been used widely as a method to control and limit the interference generated by the converter at the exact point of EMI generation and it can even be used to selectively decrease the interference of a certain harmonic peak [
13].
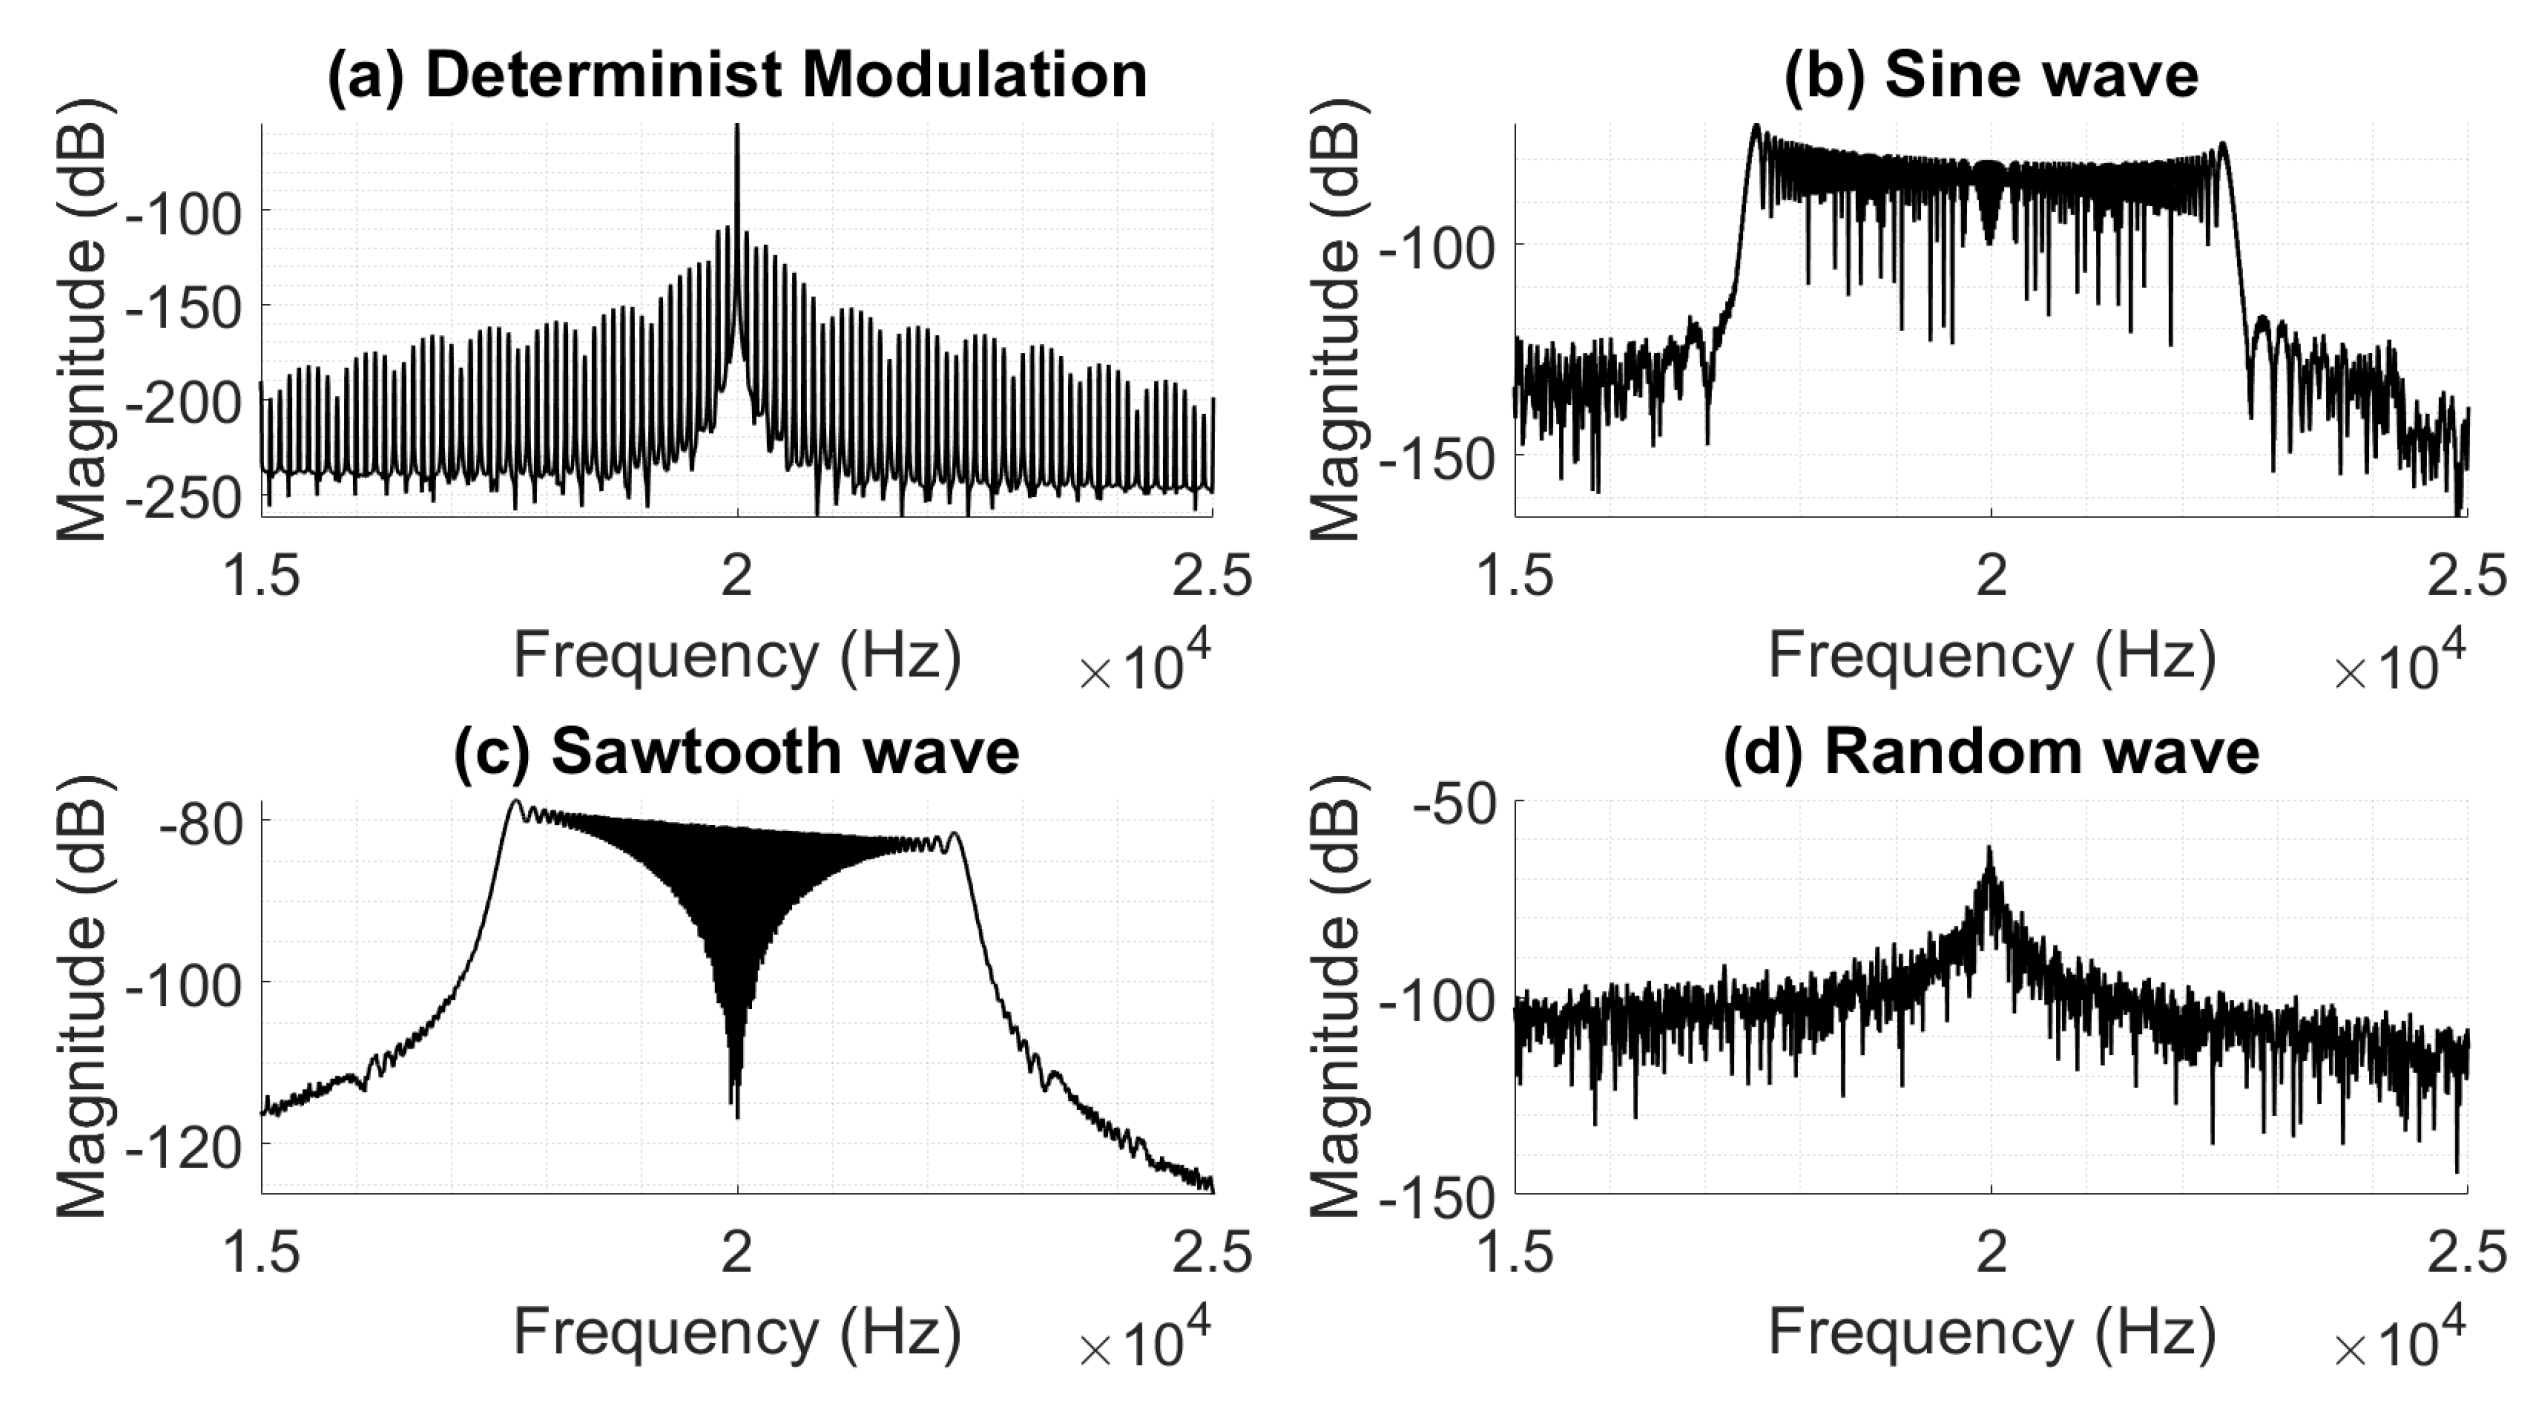
Spread Spectrum Modulation, with its different variations, Sine, Sawtooth and Random are used as a valid method to decrease EMI at the very moment of its generation. This represents an important advantage to complying with the limits of the current standards of different countries. However, the representation of the signal in time-domain will generate a particular shape in the frequency-domain as was demonstrated by Pareschi, et al in [
14]. To show the effect of such signals, a simulation in Matlab was developed considering 3 signals being modulated with a baseline frequency of 20 kHz. An example of this behavior for different signals, a) Deterministic, b) Sine, c) Sawtooth and d) Random are shown in
Figure 1, respectively.
2. G3-PLC
G3-PLC is a power line communication technology designed for use in smart grid applications.It enables long-distance, extremely dependable, high-speed communication over the current powerline system. The G3-PLC’s characteristics and capabilities were created to meet the complex requirements of powerline communications. Although earlier methods were a good start, they don’t fulfill the technical and dependability standards needed in the challenging PLC context [
15]. G3-PLC is based on the OFDM (Orthogonal Frequency Division Multiplexing) modulation scheme and operates in the frequency range of 3 kHz to 490 kHz. It uses the existing power grid infrastructure to enable communication between smart grid devices, such as smart meters, sensors, and other grid assets.
Narrow Band (NB)-PLC is known as a PLC type with intensive processing volume, which is used to obtain smart meter data remotely, especially in the electricity network. In this direction, organizations named CENELEC to [
16] of European origin, FCC of American origin and ARIB of Japanese origin have determined the frequency bands that will establish their own standards for the NB-PLC level.
Table 1 shows these frequency ranges.
CENELEC, which regulates European standards, has divided the 3 kHz – 148.5 kHz operating frequency range into four sub-frequency bands to ensure efficient and trouble-free operation, taking into account the diversity of operations. CENELEC frequency bands cover Band A, Band B, Band C and CENELEC frequency Band D. It can be seen in
Table 2.
The equipment used for the experimental tests is given by Microchip Atmel AT360. The main parameters of this communication link are shown in
Table 3. More information can be found in the datasheet [
17].
Data transfer between transmitter and receiver points with PLC method, It is carried out over the traditional electricity grid, but the conventional electrical grid is designed to carry power, not to provide data communication between two points. For this reason, the signal carrying the data must be adapted to the PLC channel where the data is carried. In this direction, the transformation of the characteristic of one of the phase, amplitude or frequency parameters of the data-carrying signal according to the regulating signal is defined as modulation. With the modulation process, the signal carrying data between two points is made suitable for the PLC channel. With modulation, the use of a single carrier for the signal to be transmitted is known as single carrier modulation. The cases where modulation types use more than one carrier for signal transmission are expressed as multi-carrier modulation. The most well-known structure of multi-carrier modulation is the OFDM technique called orthogonal frequency division multiplexing. In the PLC channel, OFDM is used for multi-carrier modulation.
3. Orthogonal Frequency Division Multiplexing
In Orthogonal Frequency Division Multiplexing system, without changing the transmission rate, the high bit rate data is divided into several parallel low bit rate data, extending the symbol time, and the frequency selective channel becomes a flat fading channel [
18] By creating more than one carrier within a PLC channel, the signal multiplexing methods have been developed to protect it from interference and increase its robustness. The method created by dividing the operating frequency range of the PLC channel into sub-frequency ranges for multiple carriers is frequency division multiplexing. High spectral efficiency is achieved in the OFDM system by dividing the frequency band used into perpendicular narrowband sub-channels [
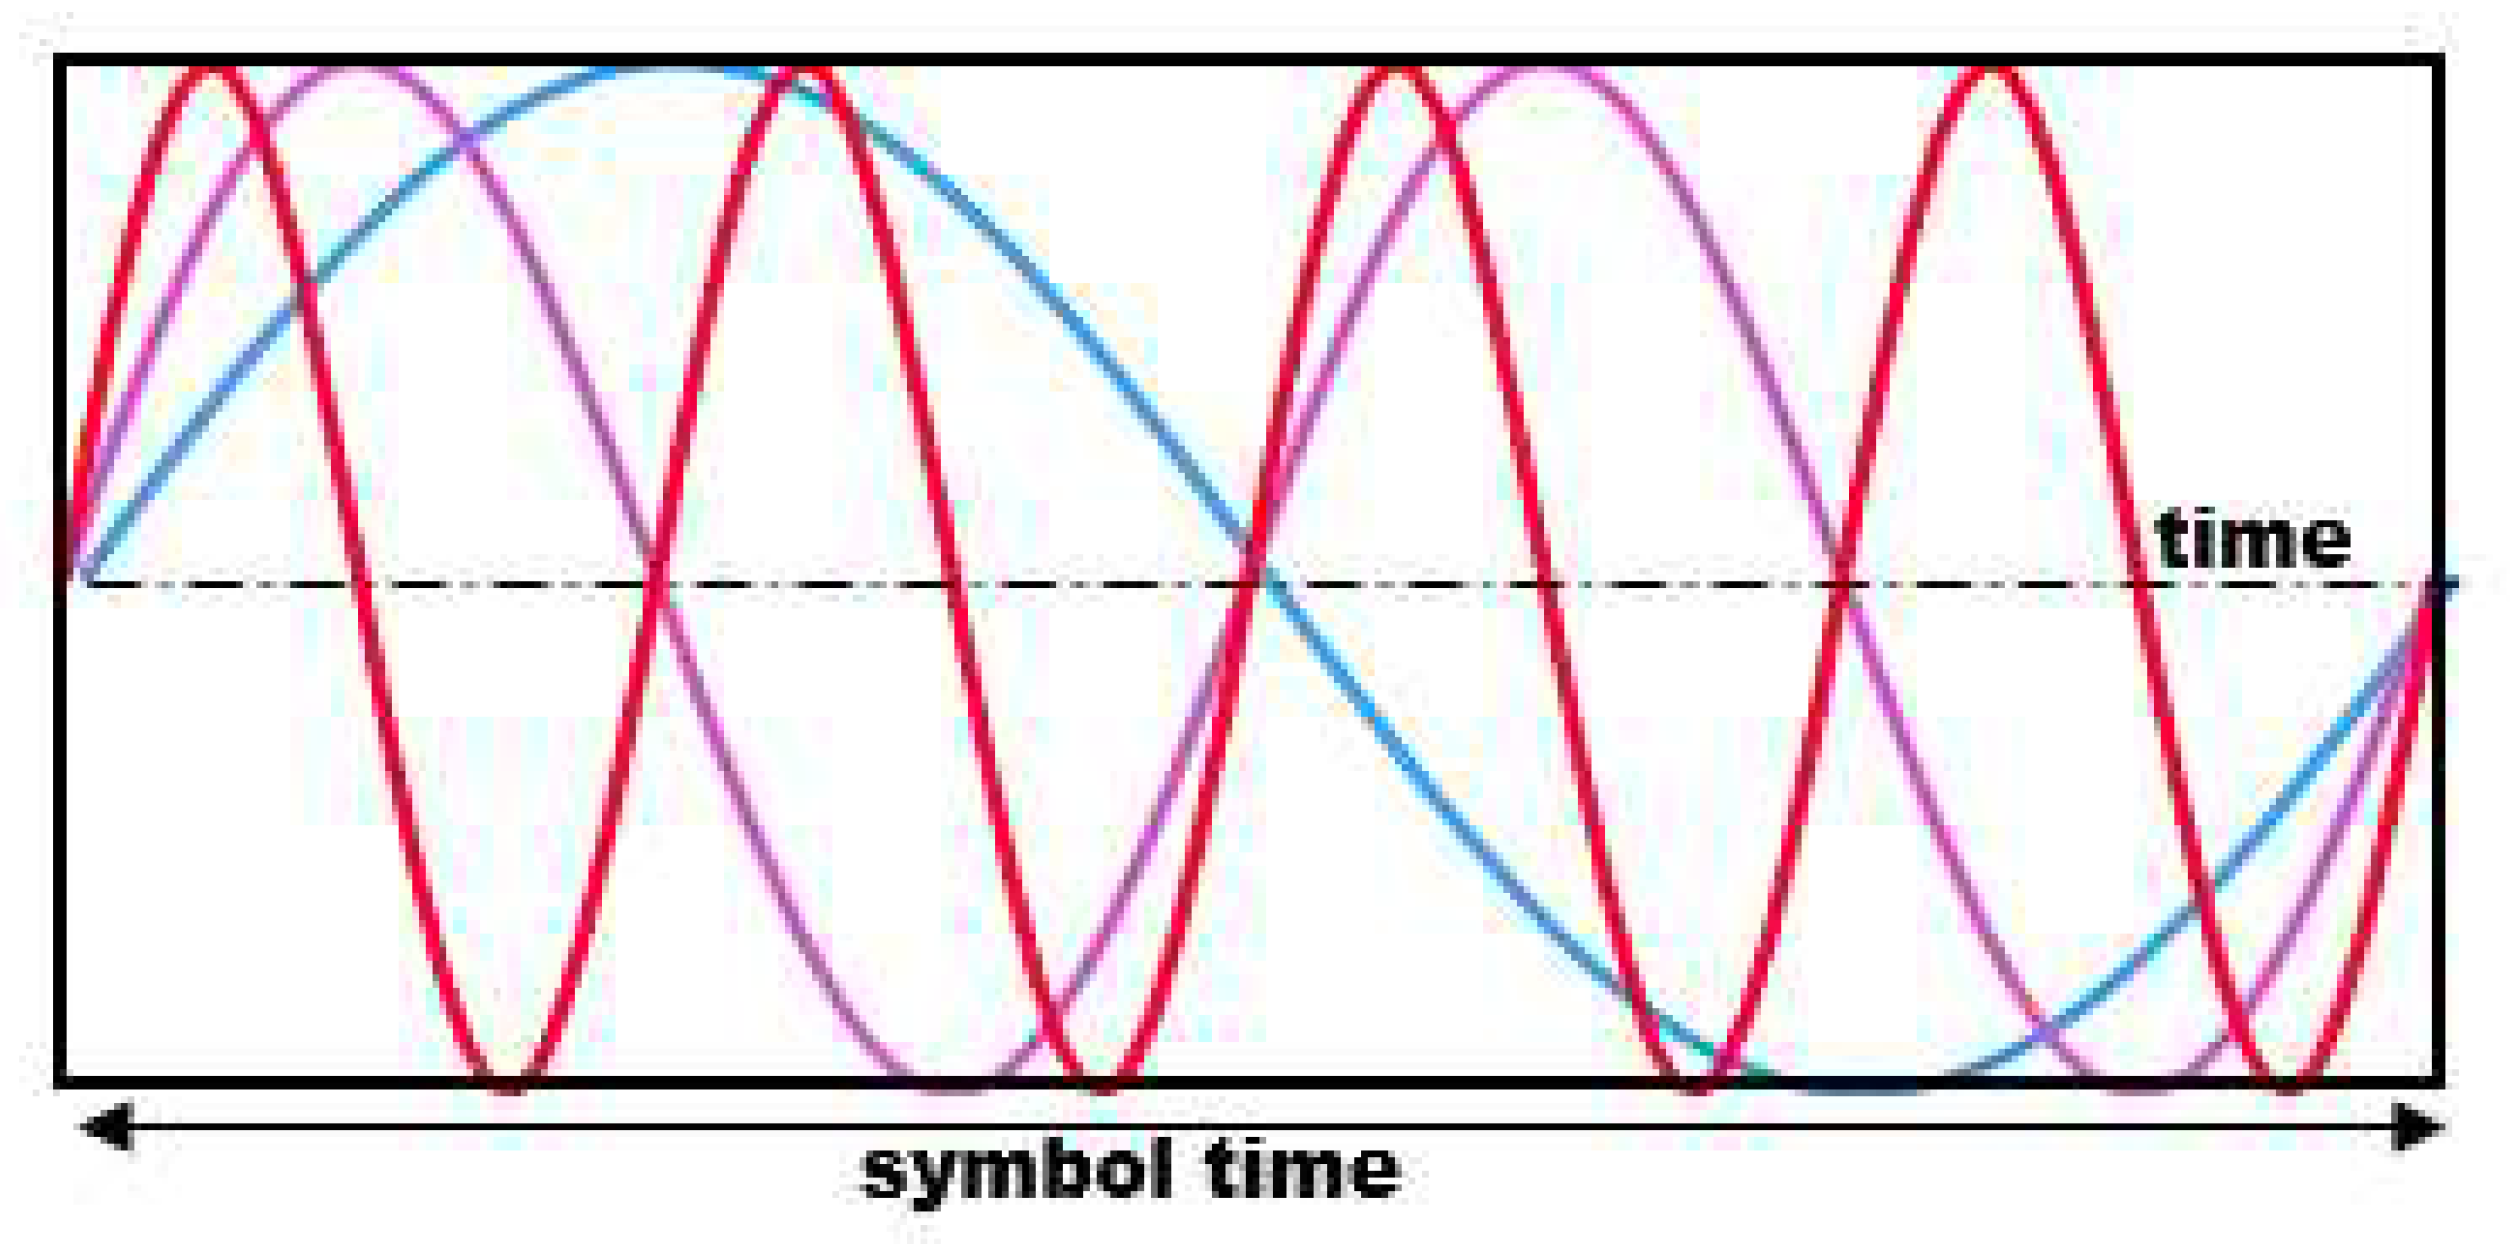
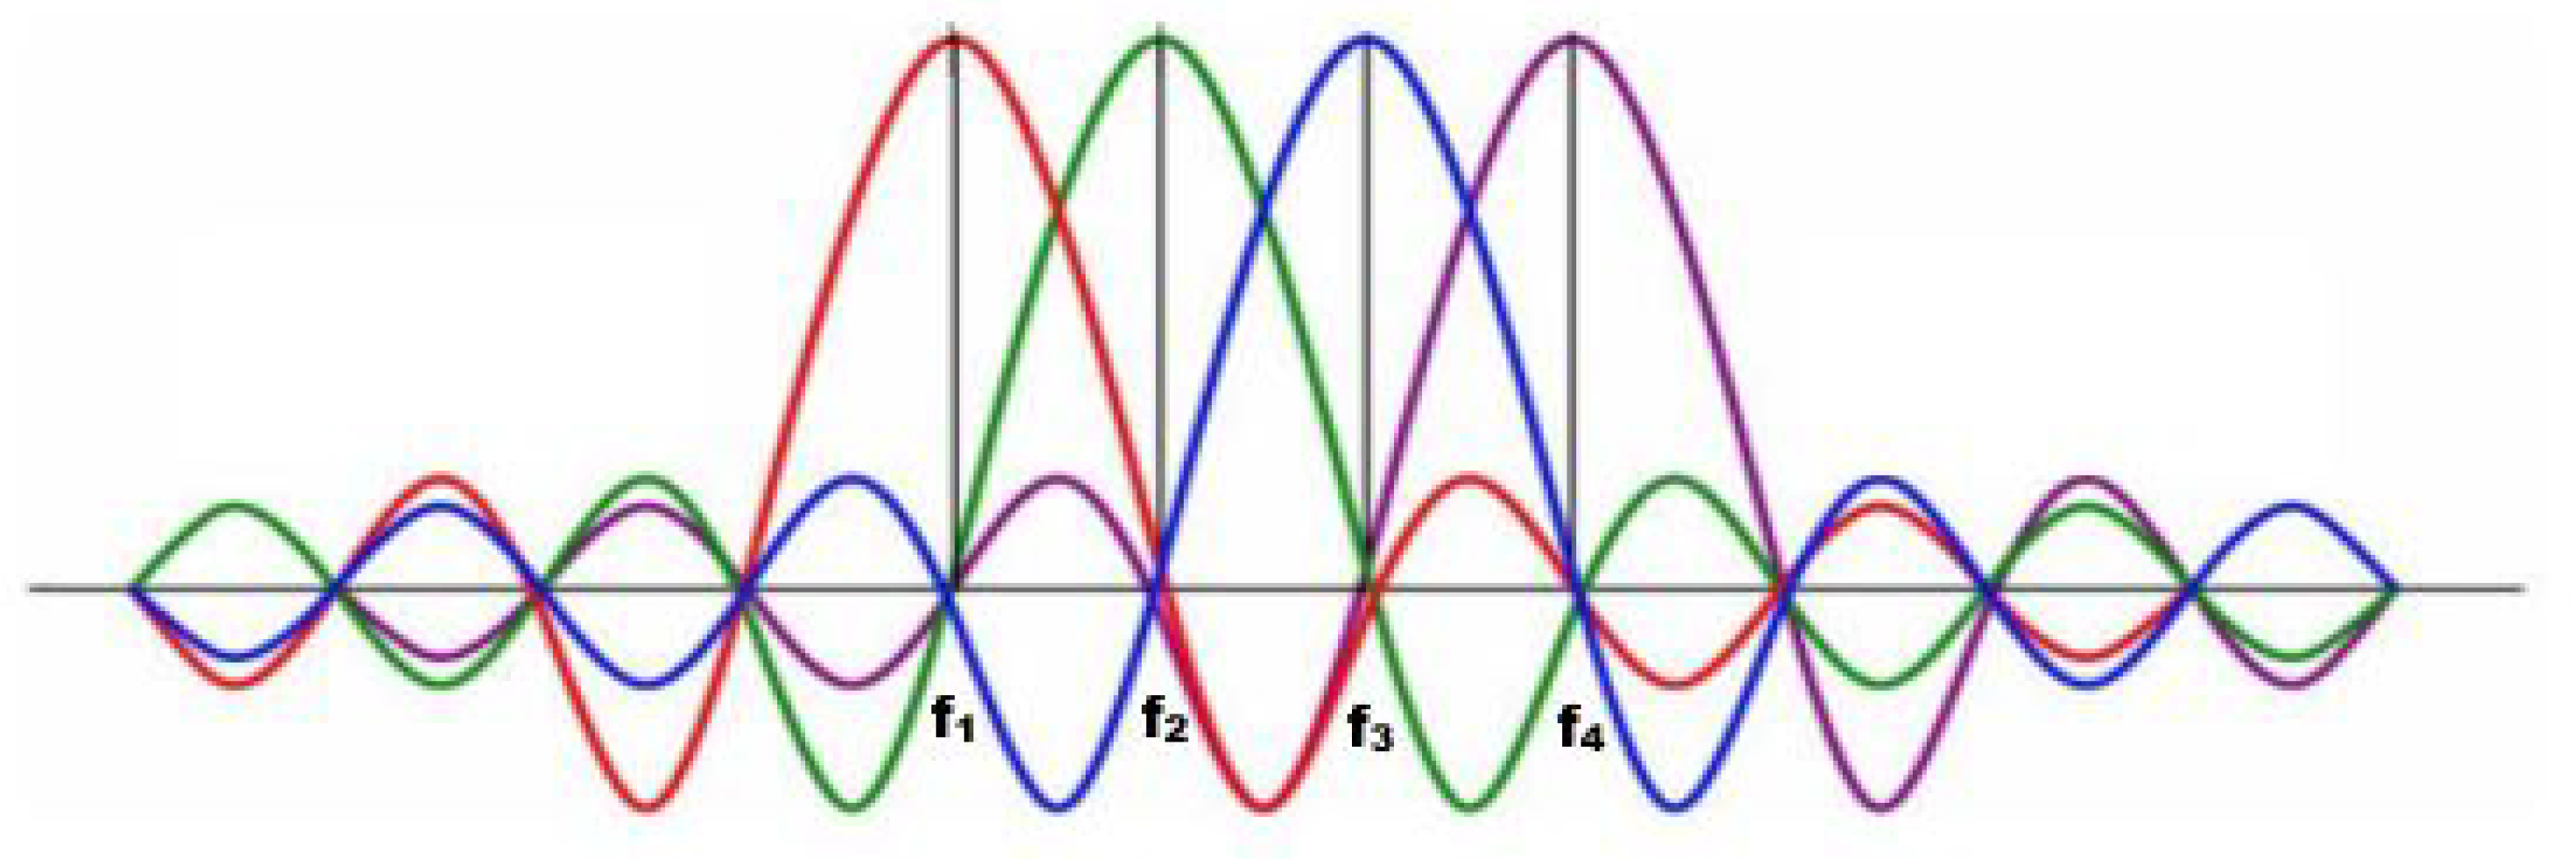
19]. Since the bandwidth is partitioned separately for the sub-carriers in the FDM method, different signals can be carried without interacting with each other, but since the segmented frequency bands are assigned to a single carrier, it prevents the channel from being used efficiently. With OFDM, spectral efficiency of approximately 50% is achieved by overlapping the sub-channels across the frequency spectrum, unlike the traditional multi-carrier system. The spectral efficiency is increased by choosing one of the subcarriers to be mathematically orthogonal to the other. For lower speed parallel subcarriers, the distortion in time due to the echo channel increases as the symbol duration will increase. As seen in
Figure 2 and
Figure 3 orthogonality in the time domain is that each subcarrier has an integer number of periods during a symbol, orthogonality in the frequency plane is that each carrier spectrum has zero value at the center frequency of the other carriers in the system. As a result, although the carriers overlap spectrally, no interference occurs [
20].
In order to eliminate the efficiency problem here, the concept of OFDM has emerged. With this concept, the subcarriers in the channel are converted to orthogonal form, reducing the bandwidth used, provided to be used effectively.
4. Spread spectrum modulation
Many studies have been conducted on Spread Spectrum Modulation (SSM) as a method to lower measured EMI from power converters [
14,
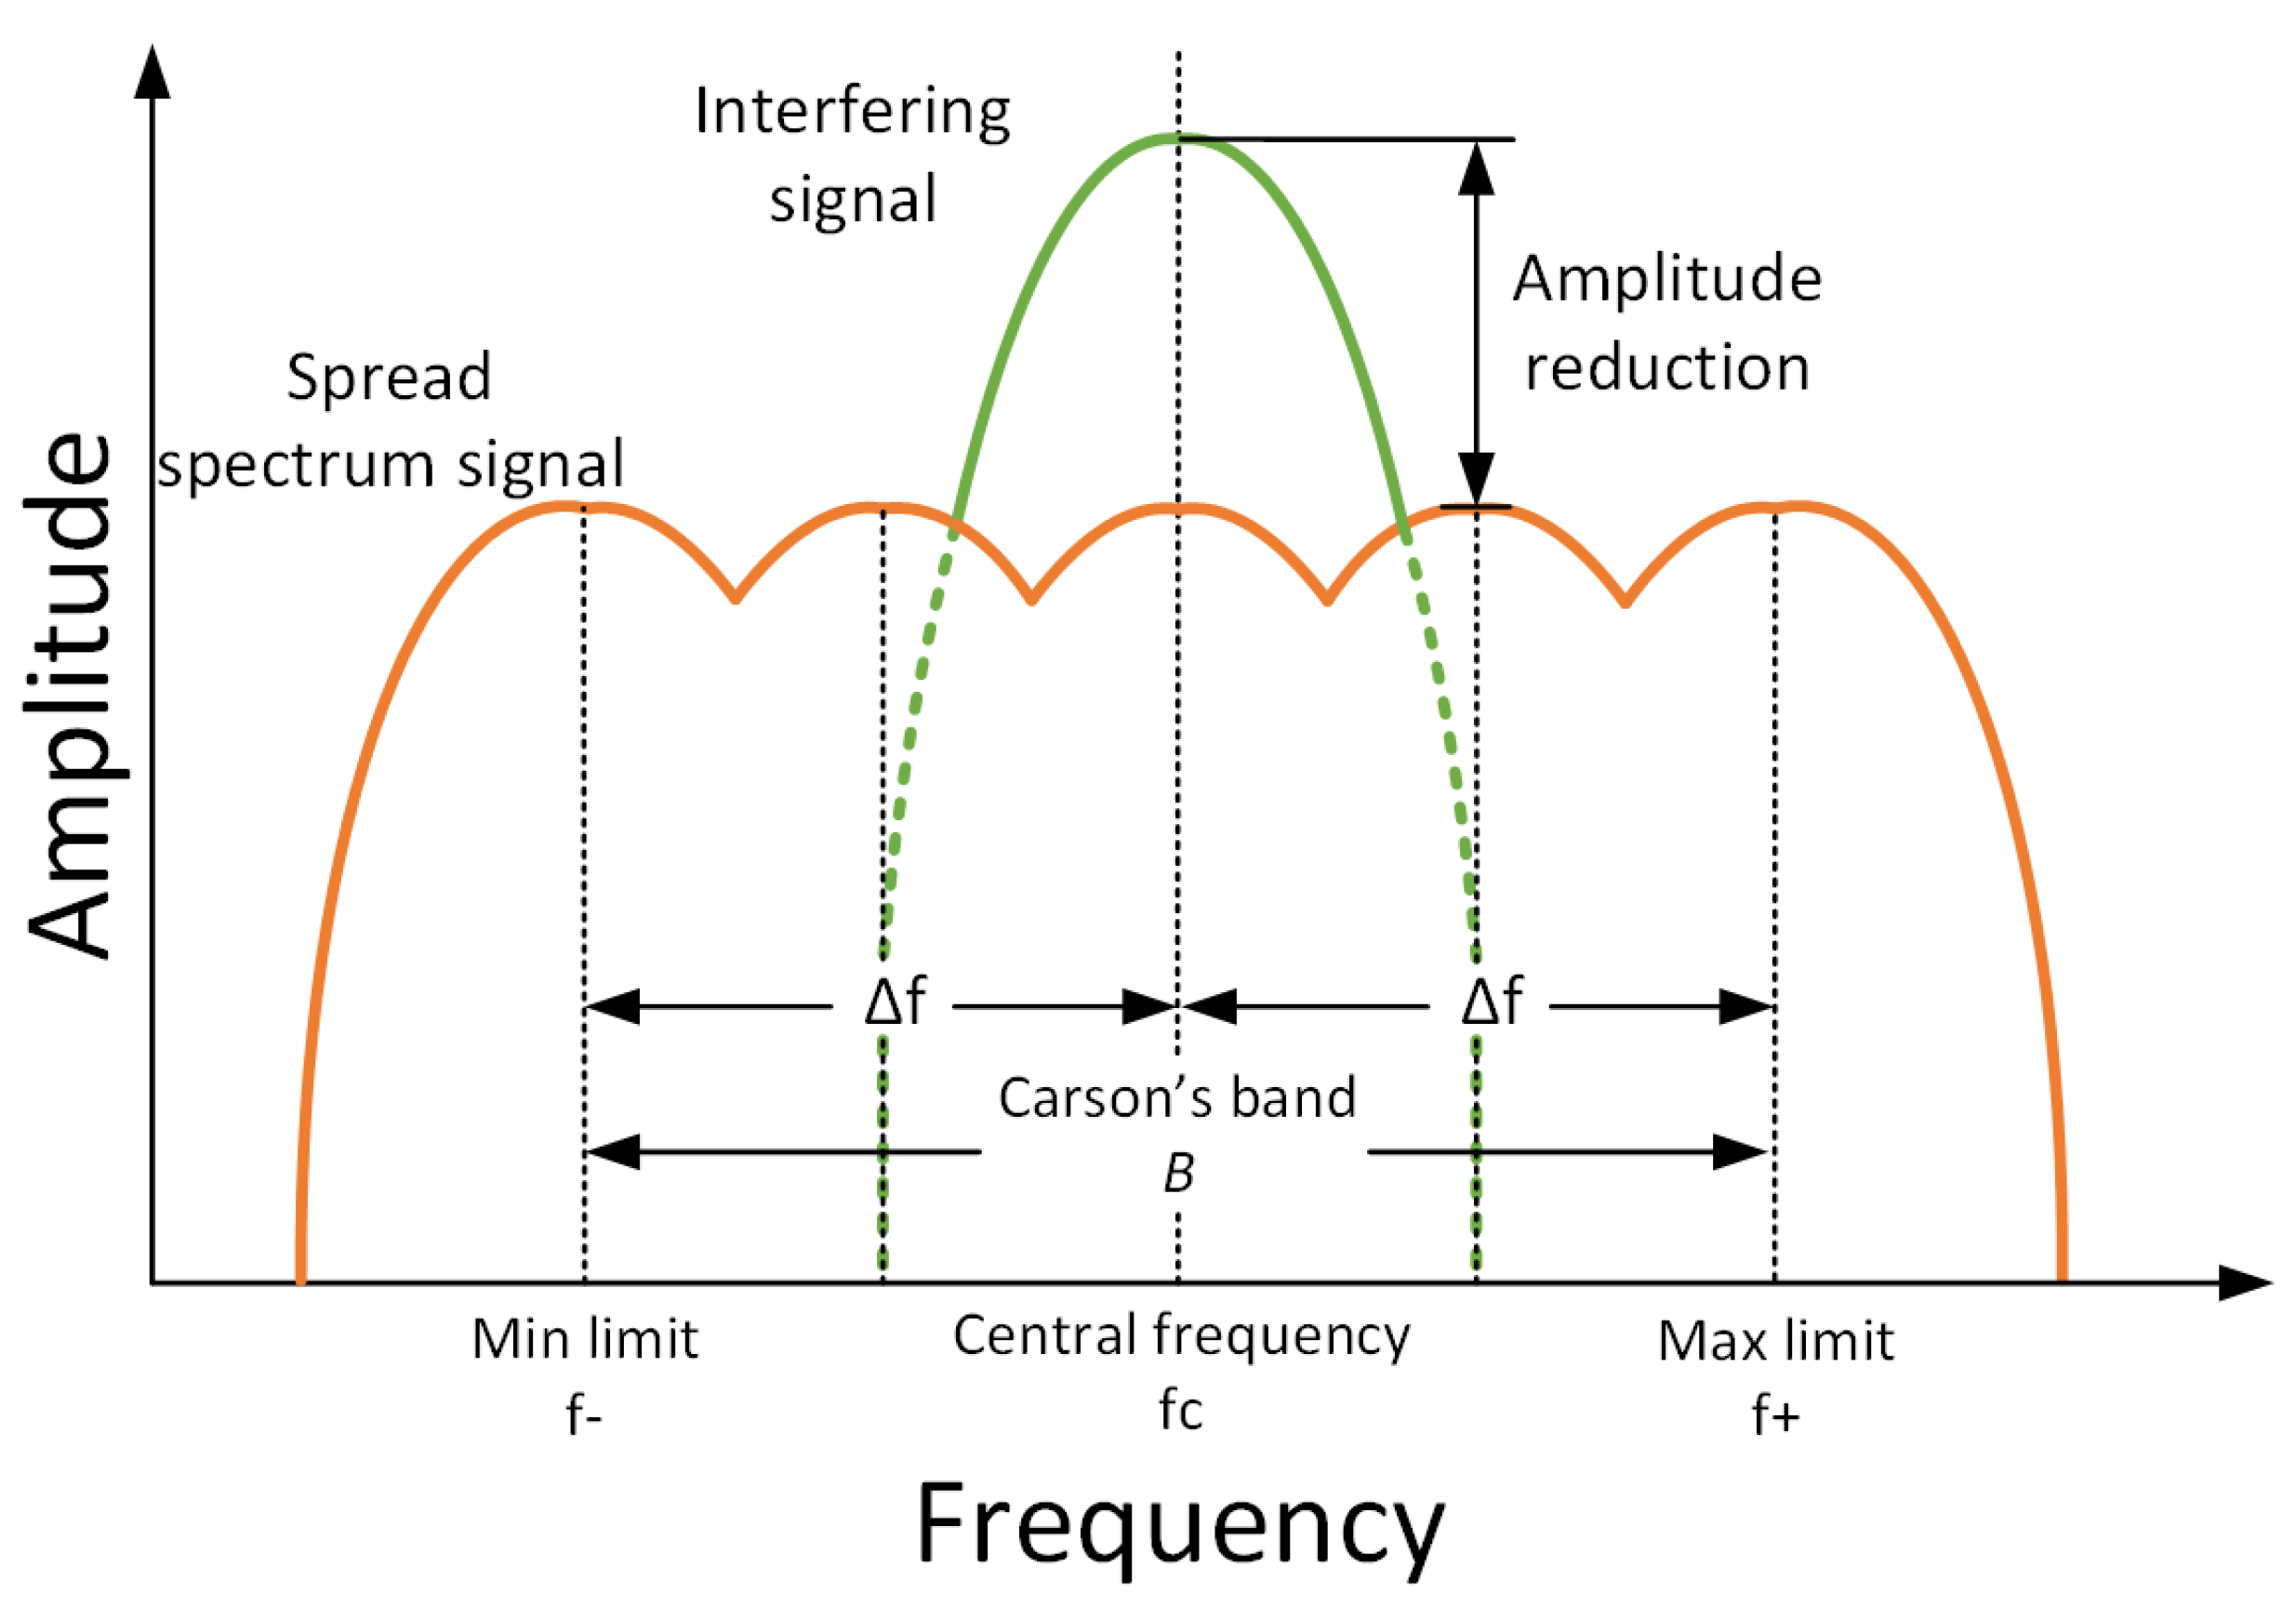
21]. One method for diffusing noise is spread spectrum modulation, which focuses on a certain frequency. This is an effort to re-distribute the EMI’s energy of an interfering signal. By dispersing the waveform energy over a larger frequency range, it lowers the peak energy of a narrowband interference signal to a broadband interference signal as can be seen in
Figure 4. This can be done with periodical, non-periodical or even with hybrid algorithms.
The usage of ssm is mainly based on analogue frequency modulation assumptions. The main idea behind frequency modulation is achieved with two main signals, the carrier and the modulating signal as given by:
where the term
is the carrier frequency,
is the frequency deviation,
is the modulating signal frequency and
is the modulating signal function. This theory can be extended to account for a rule that defines the limits of the frequencies to be modulated. This rules is refereed to as Carson’s rule as can be seen in (
2).
In this equation, is the frequency deviation (same as ) based on the spreading range defined to the baseline frequency modulation to be mitigated (). The value of is the modulating signal and can be periodic (e.g. sine and triangular) or non-periodic (random and chaotic).
One important aspect of the generation of Spread Spectrum profiles is the sampling time of the main device used to generate the switching frequencies. Utilizing a non-fixed frequency clock significantly reduces the EMI peak energy, which causes the EMI energy to be dispersed to various frequencies. This can only be formally achieved by randomising the clock of the device which can be computationally costly, however many papers focused on Chaotic modulation were analysed to determine the real improvement.
To generate the Spread Spectrum driving patterns a microcontroller with strong computational capabilities or a Field Programmable Gate Array (FPGA) can be utilised, the sampling ratio of the driving signal and the spreading factor may be adjusted according to particular needs and paramters. In this work, the Texas Instruments C2000 microcontroller is used. For CISPR-16 Band A, the Resolution Bandwidth (RBW) of 200 Hz for the measuring apparatus is chosen. A variety of driving signals and sampling ratios have been selected in order to establish the optimal scenario to reduce the influence of the switching frequency for the Device Under Test (DUT).
Common Spread Spectrum techniques applied to Power Converters for EMI decrease are being studied due to the growth of smart grids and renewable energy grids. The strategies used are different considering the methods and resources used ranging from basic Random generators [
22], Chaotic generators such as the ones in [
23] and [
24], and even random generators with controlled repetition rates based on pseudo-random algorithms [
25]. In all of these strategies, the Peak decrease is considerable and can be between 10 - 20 dB
V.
However, an important division of the nature of the modulating signal must be analysed from the generation of the clocking nature of the device used, this is often overseen by the authors applying these modulation techniques.
There are 3 important parameters in spread spectrum modulation, such as spreading factor (
), sampling frequency of the signal (
) and modulation index (
m). The spreading factor is expressed as a percentage in relation to the modulation’s intended central frequency (
).
5. Experimental Setup
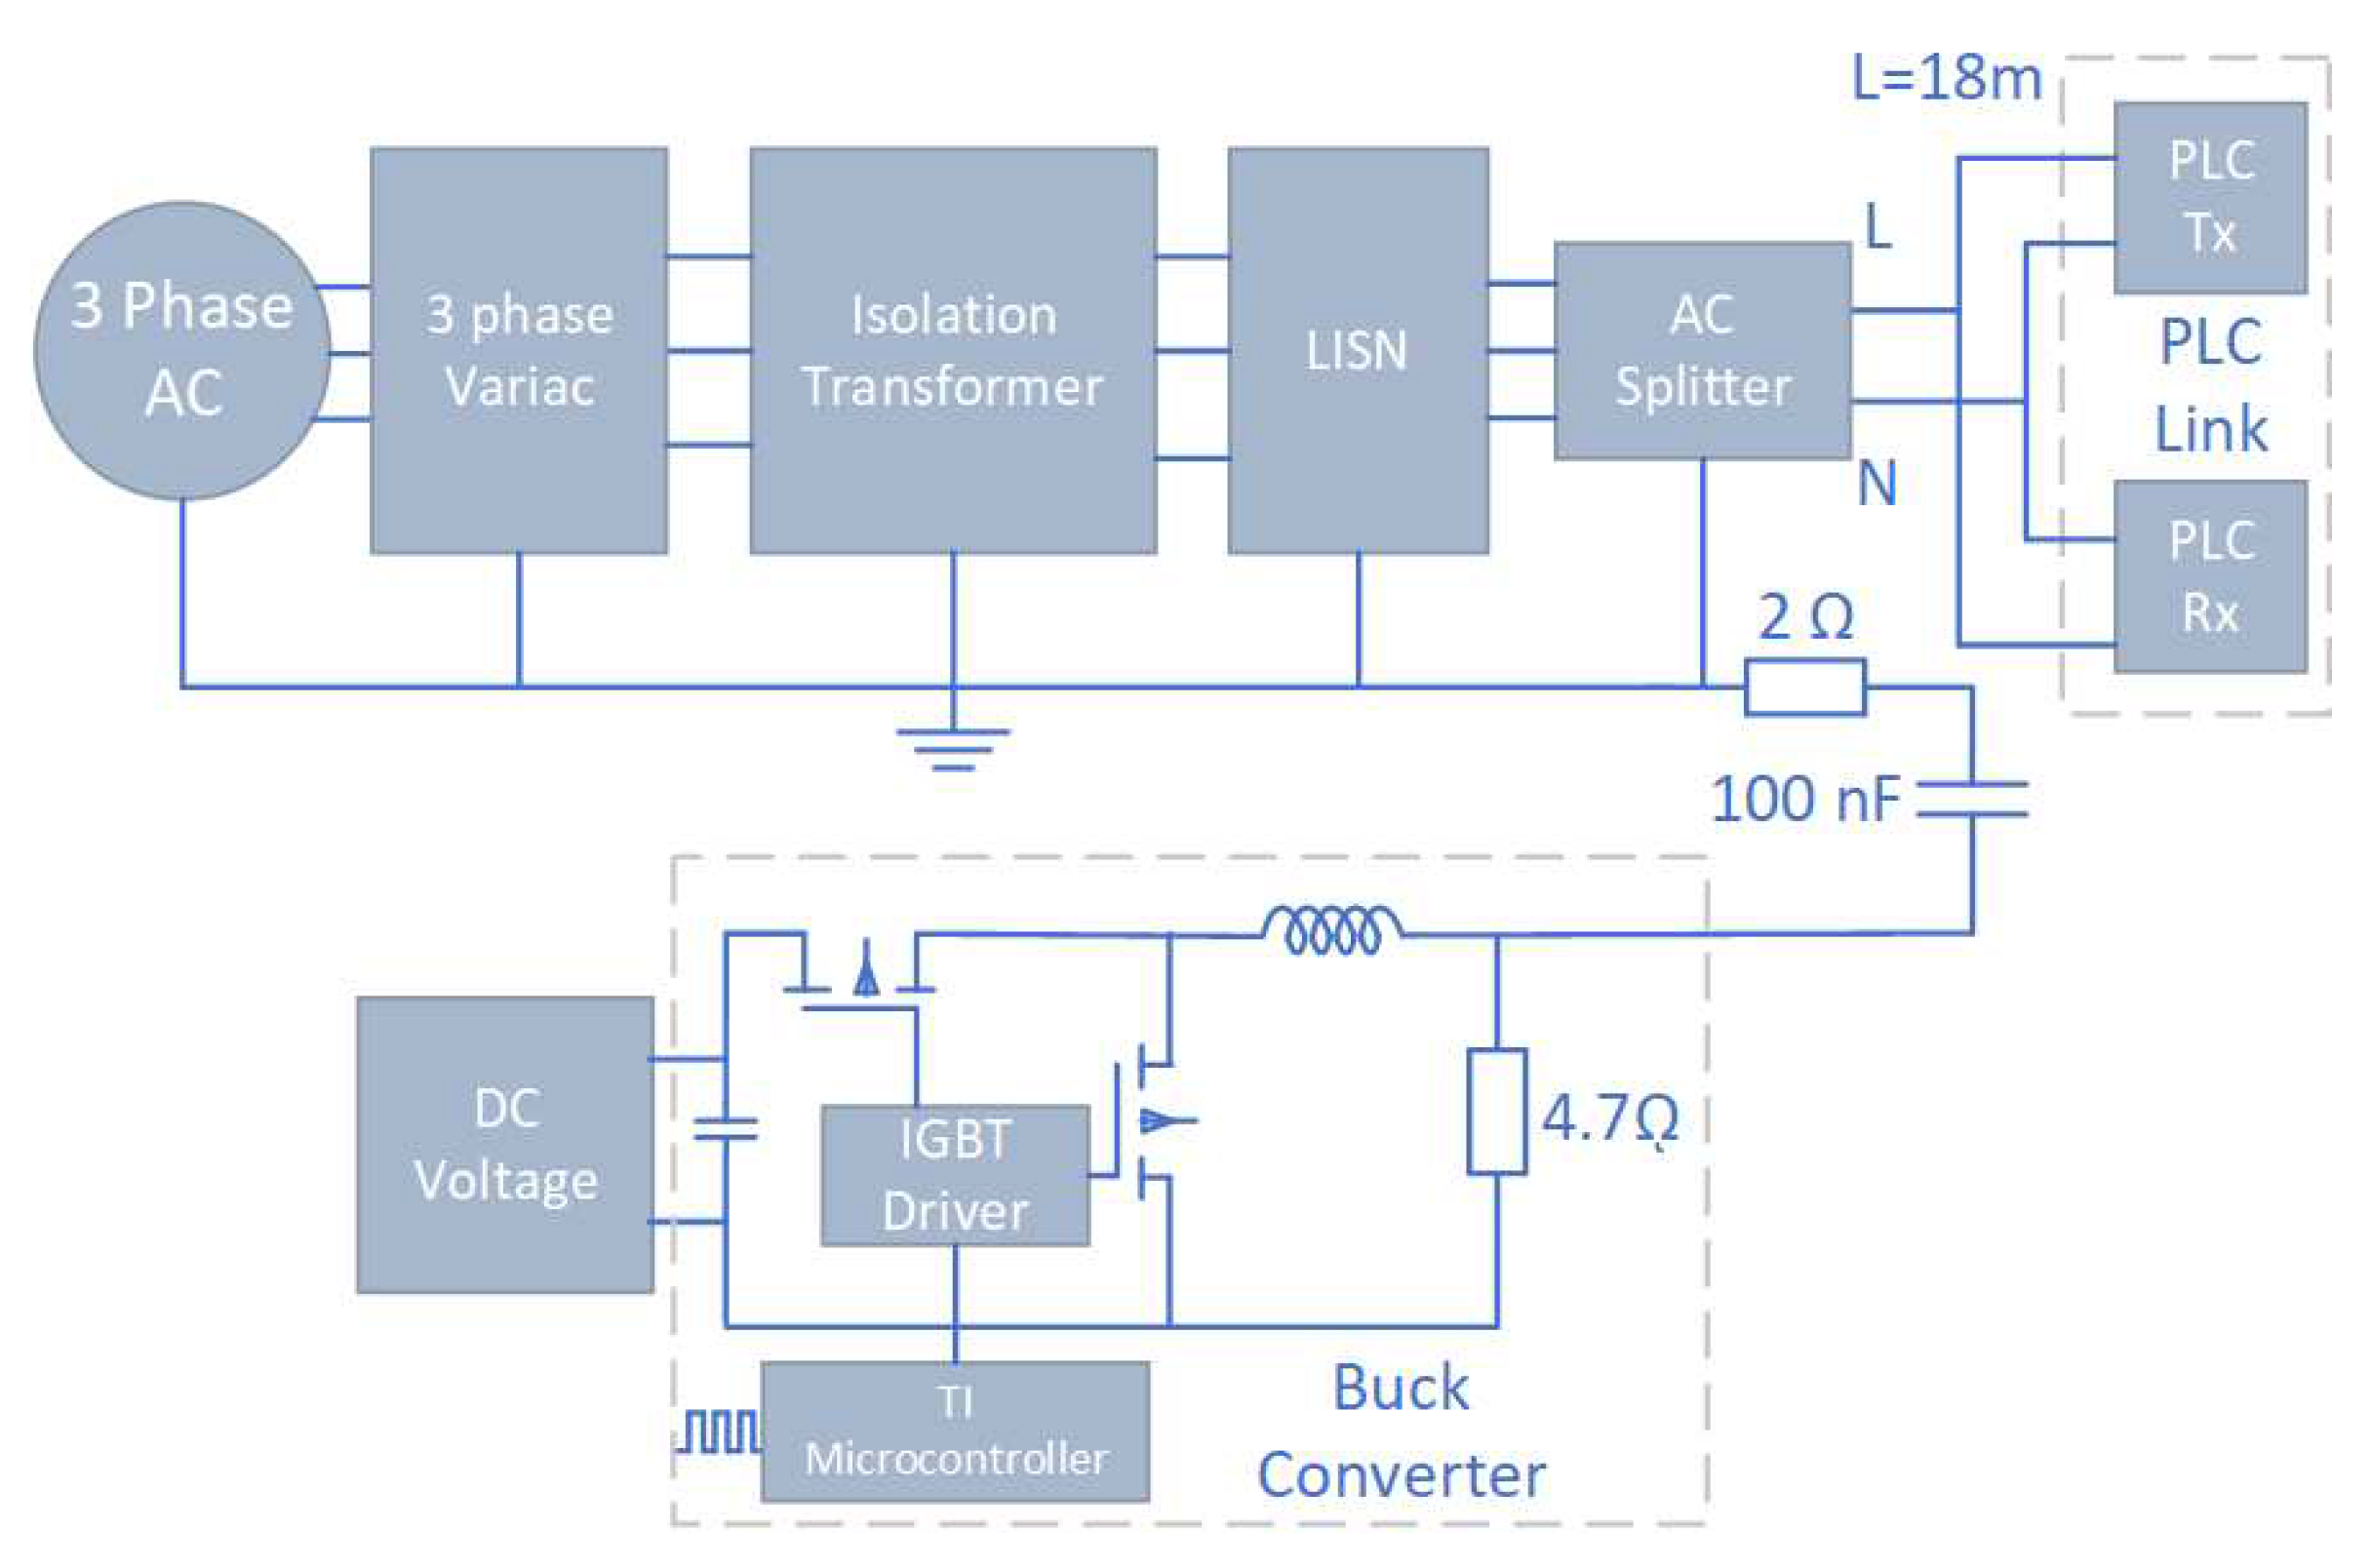
The experimental set-up in this study consists of 2 parts. The first part is the communication circuit including PLC modems and the second one is the power circuit including the DC converter. Due to the mutual coupling of the circuit wires, EMI may transfer between the these two circuits. Two G3-PLC modems make up the communication circuit, which represents point-to-point communication between a particular transmitter and receiver. As seen in
Figure 5, the circuit utilizes two Microchip ATPL360 PLC modems, each of which is set up to operate utilizing the G3-PLC mode and the CENELEC-A standard frequency range and two G3-PLC modems are connected by an 18 m long 230 V AC cable to carry the communication signal. In order to isolate outside EMI noise and ensure the durability of the findings, the line stabilization impedance network (LISN) and isolation transformer are also connected between the PLC circuit and the grid.The purpose of using the isolation transformer is to separate the AC line and the grid. These two circuits are artificially coupled by means of a low value capacitor. The equipment used in this experiment set is briefly described below.
PLC Modems. Two PL360 modems from Microchip, one of which is transmitter and one is receiver, in G3 PLC standard were used. They make it possible to assess the effectiveness of point-to-point Power Line Communications.
Power Supply. The Power Supply provides 60 V with a maximum current of 6 A.
LISN. The LISN used is the Schwarzbeck NSLK 8127. This LISN is CISPR-16 compliant with a frequency range from 9 kHz to 30 MHz.
Spectrum Analyser. The configured parameters are given by the Resolution Bandwidth (RBW) of 200 Hz, the frequency bandwidth to be analysed is from 9 kHz to 150 kHz to account for the low frequency band.
EMI Receiver. The EMI receiver is the Rohde & Schwarz ESR3 with a frequency range of 9 kHz to 3.6 GHz (CISPR-16 compliant)
Power Converter The DC-DC converter is a half bridge converter with SiC-based Mosfet transistors (manufactured by Wolfspeed). The converter topology is a Synchronous Buck Converter with a base switching frequency of 50 kHz. The converter uses an input capacitor of 5.1 uF and the output capacitor is 470 uF to decrease the ripple generated and to provide a steady voltage at the output. The switching frequency of the dc converter is set to 63 kHz, which is the intermediate operating frequency of the G3-PLC. The Texas Instruments C2000 board is used to generate the SSM patterns, for all of the cases, a 50 % of Duty Cycle is used. The output load of the converter is 10 .
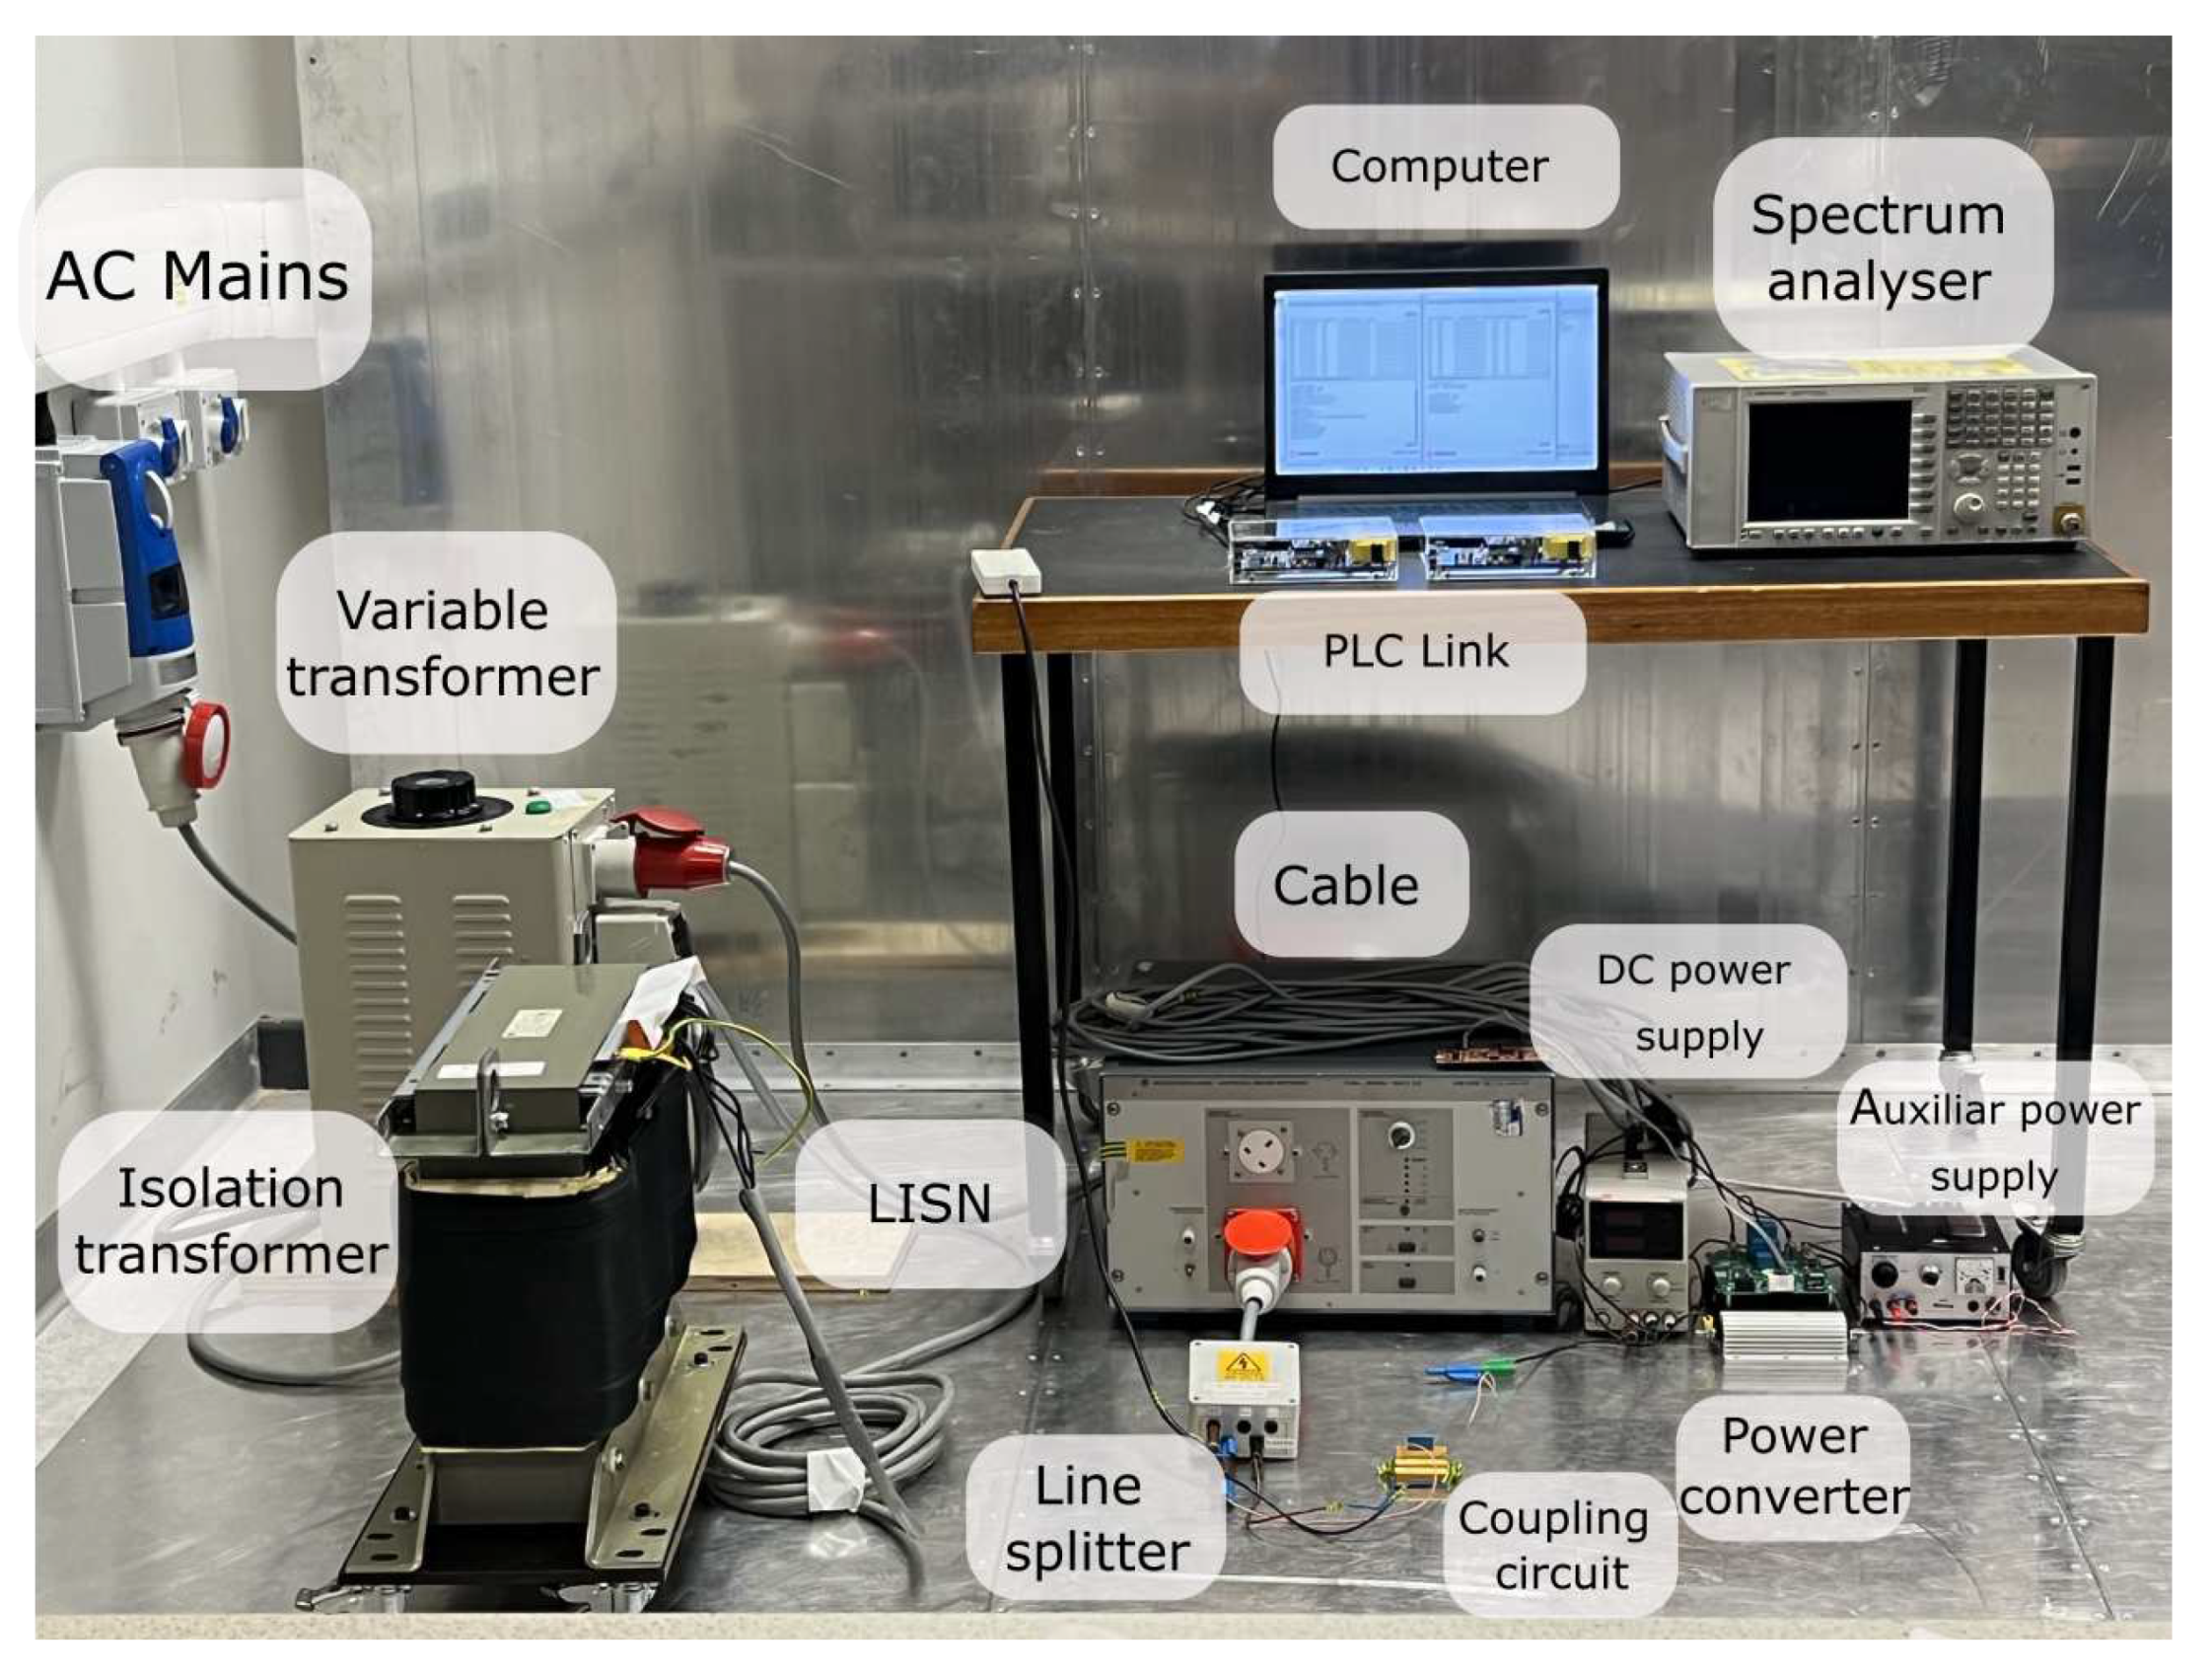
A complete figure of the set-up used for the experimental tests is shown in
Figure 6.
The measurement results are based on the Peak index value obtained from the Spectrum Analyser. The parameters of the Spectrum Analyser are shown in
Table 4.
The Frame Error Rate (FER) is used to evaluate the G3-PLC’s performance. The FER may be calculated as follows to show the ratio of successfully received data frames to all data frames transmitted by the communication system:
6. Results
In this section, the results of the experimental tests are discussed. Five different values have been used from 0.1 to 0.5 with a step of 0.1. On the basis of low frequency analysis, all measurements were made from 9 to 150 kHz for 5 samples at the same m value.
6.1. Results for = 10%
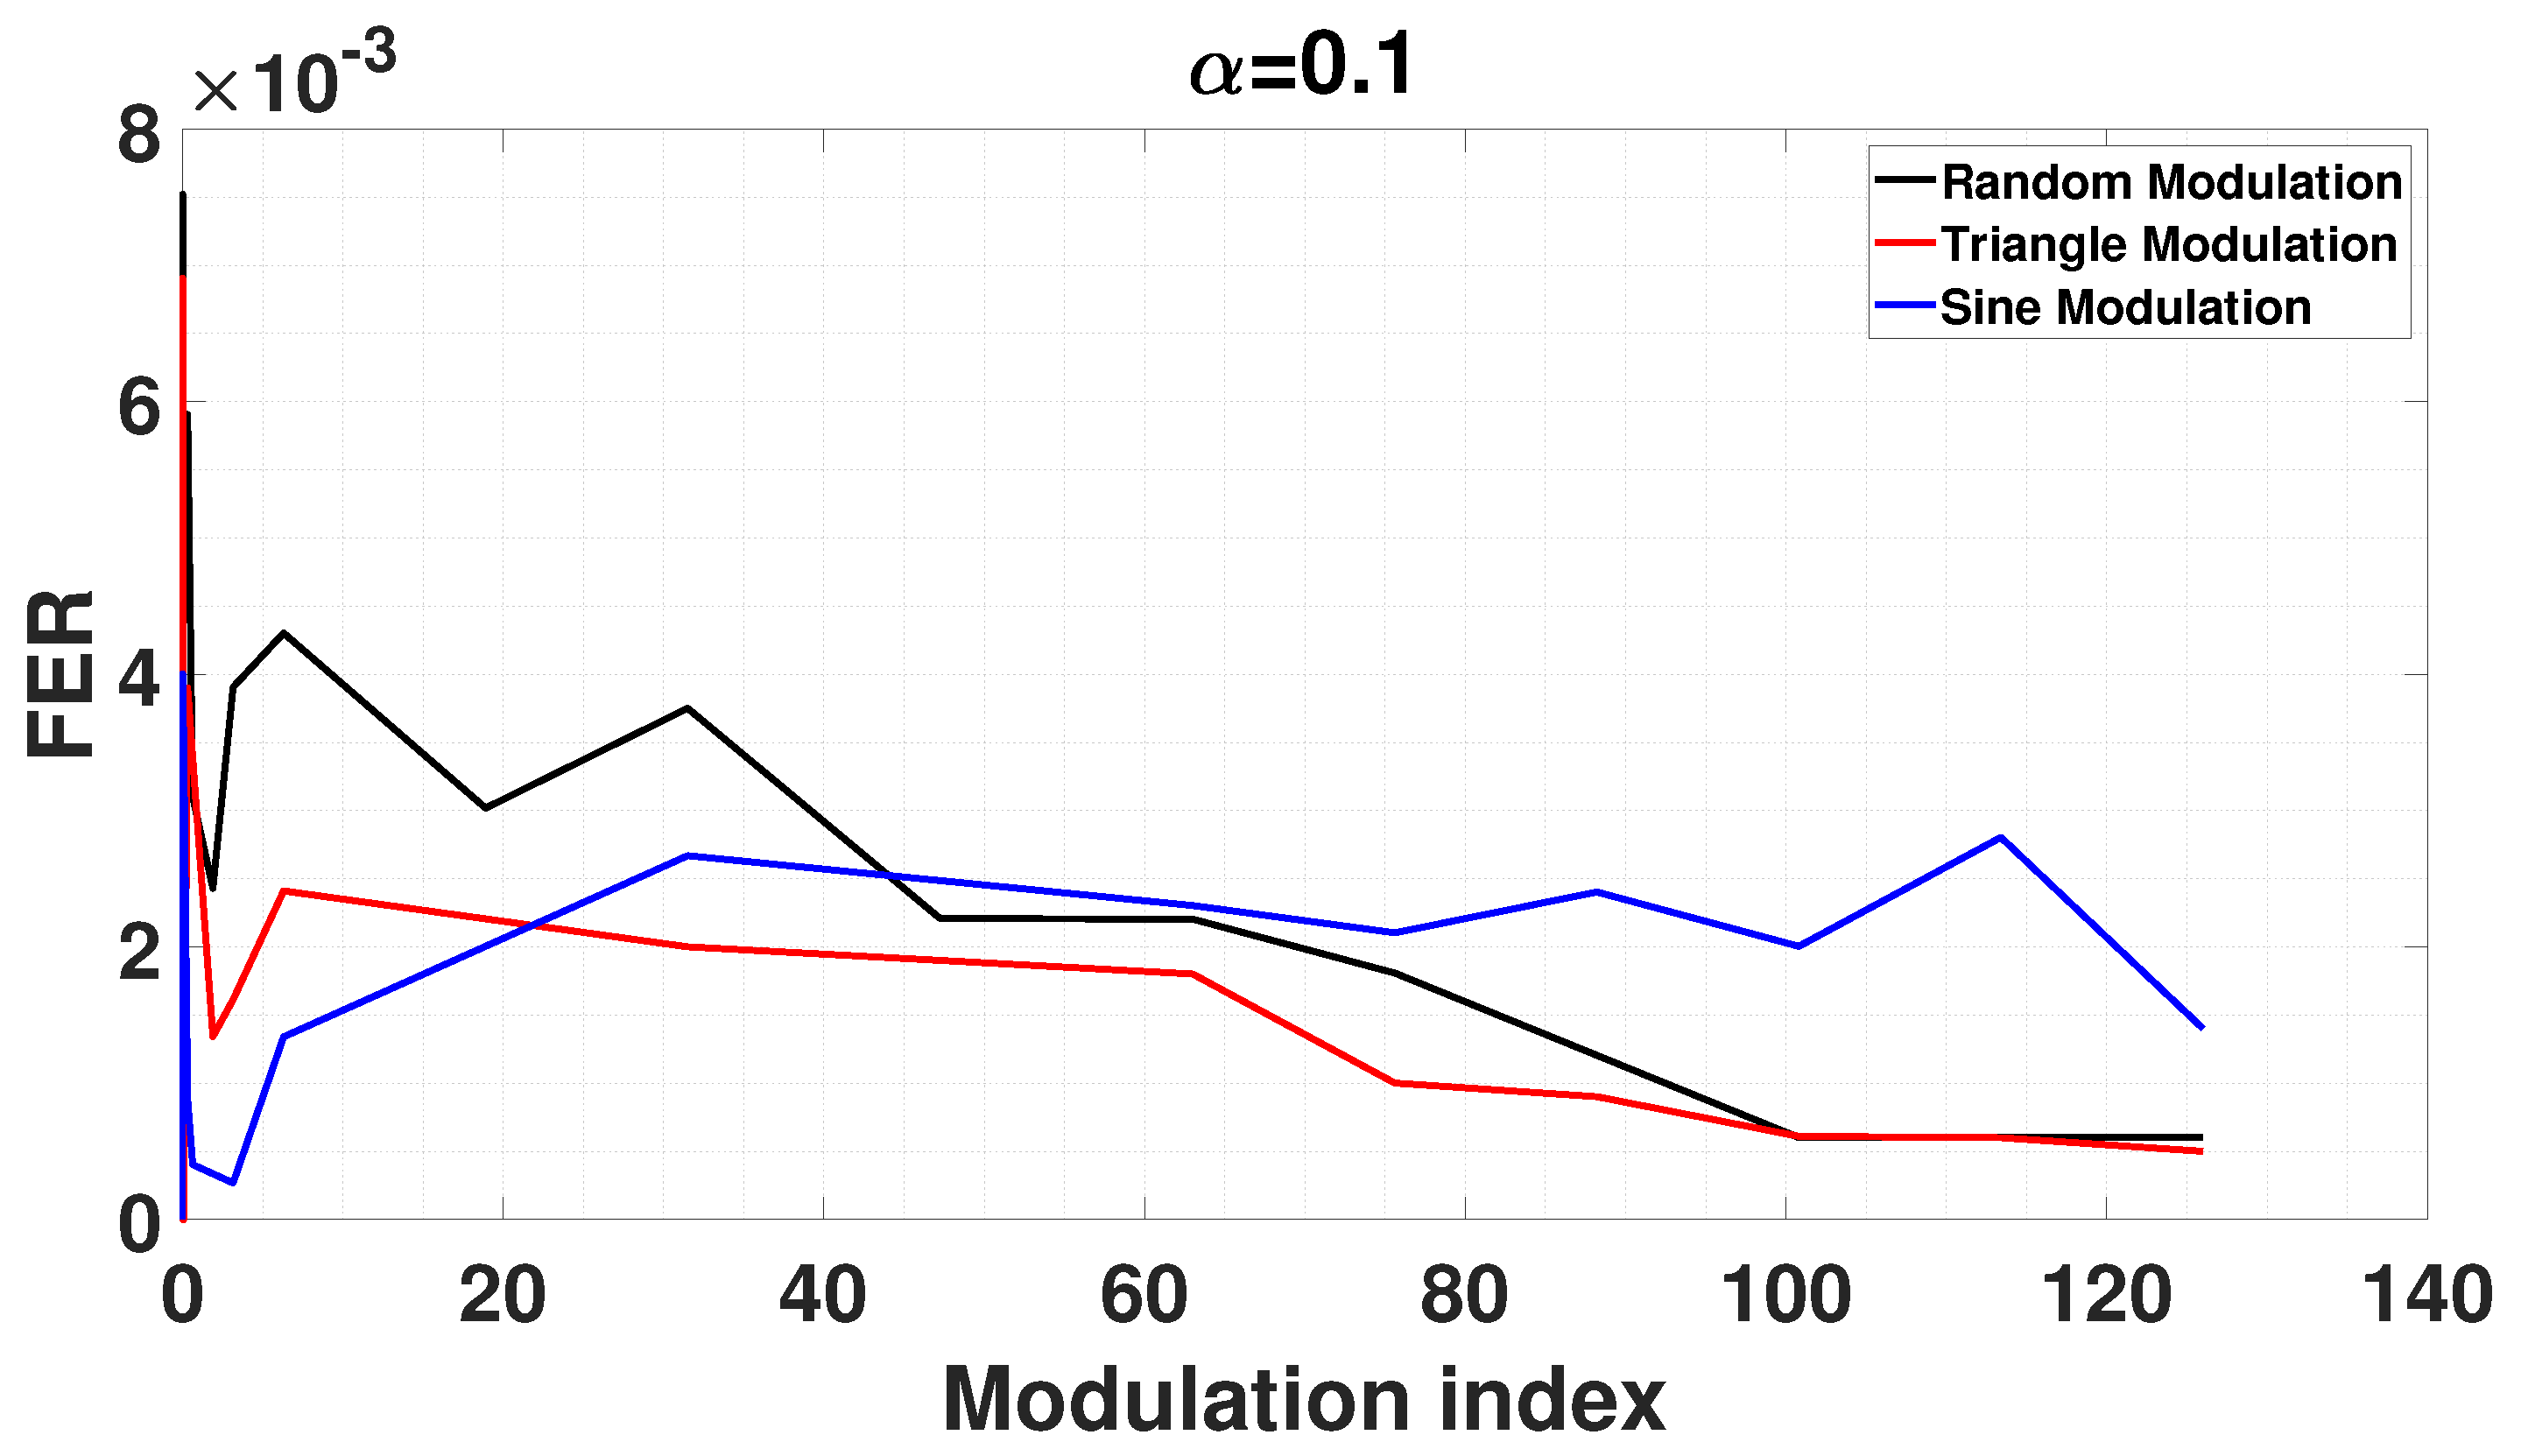
In
Figure 7, it can be seen the results when
= 0.1, for this case the signals perform similarly for the FER measured. It can be difficult to conclude which modulating signal performs better due to the different values measured for different modulation indices. From
m=0 to approximately
m=45 the highest FER measured is for a Random modulating signal but this trend changes at higher values of
m and the Sine modulating signal becomes the highest interfering signal with regards to the FER measured. As for the Sawtooth signal, this shows a decreasing trend from
m=0 to the final modulation index value of 120.
6.2. Results for = 20%
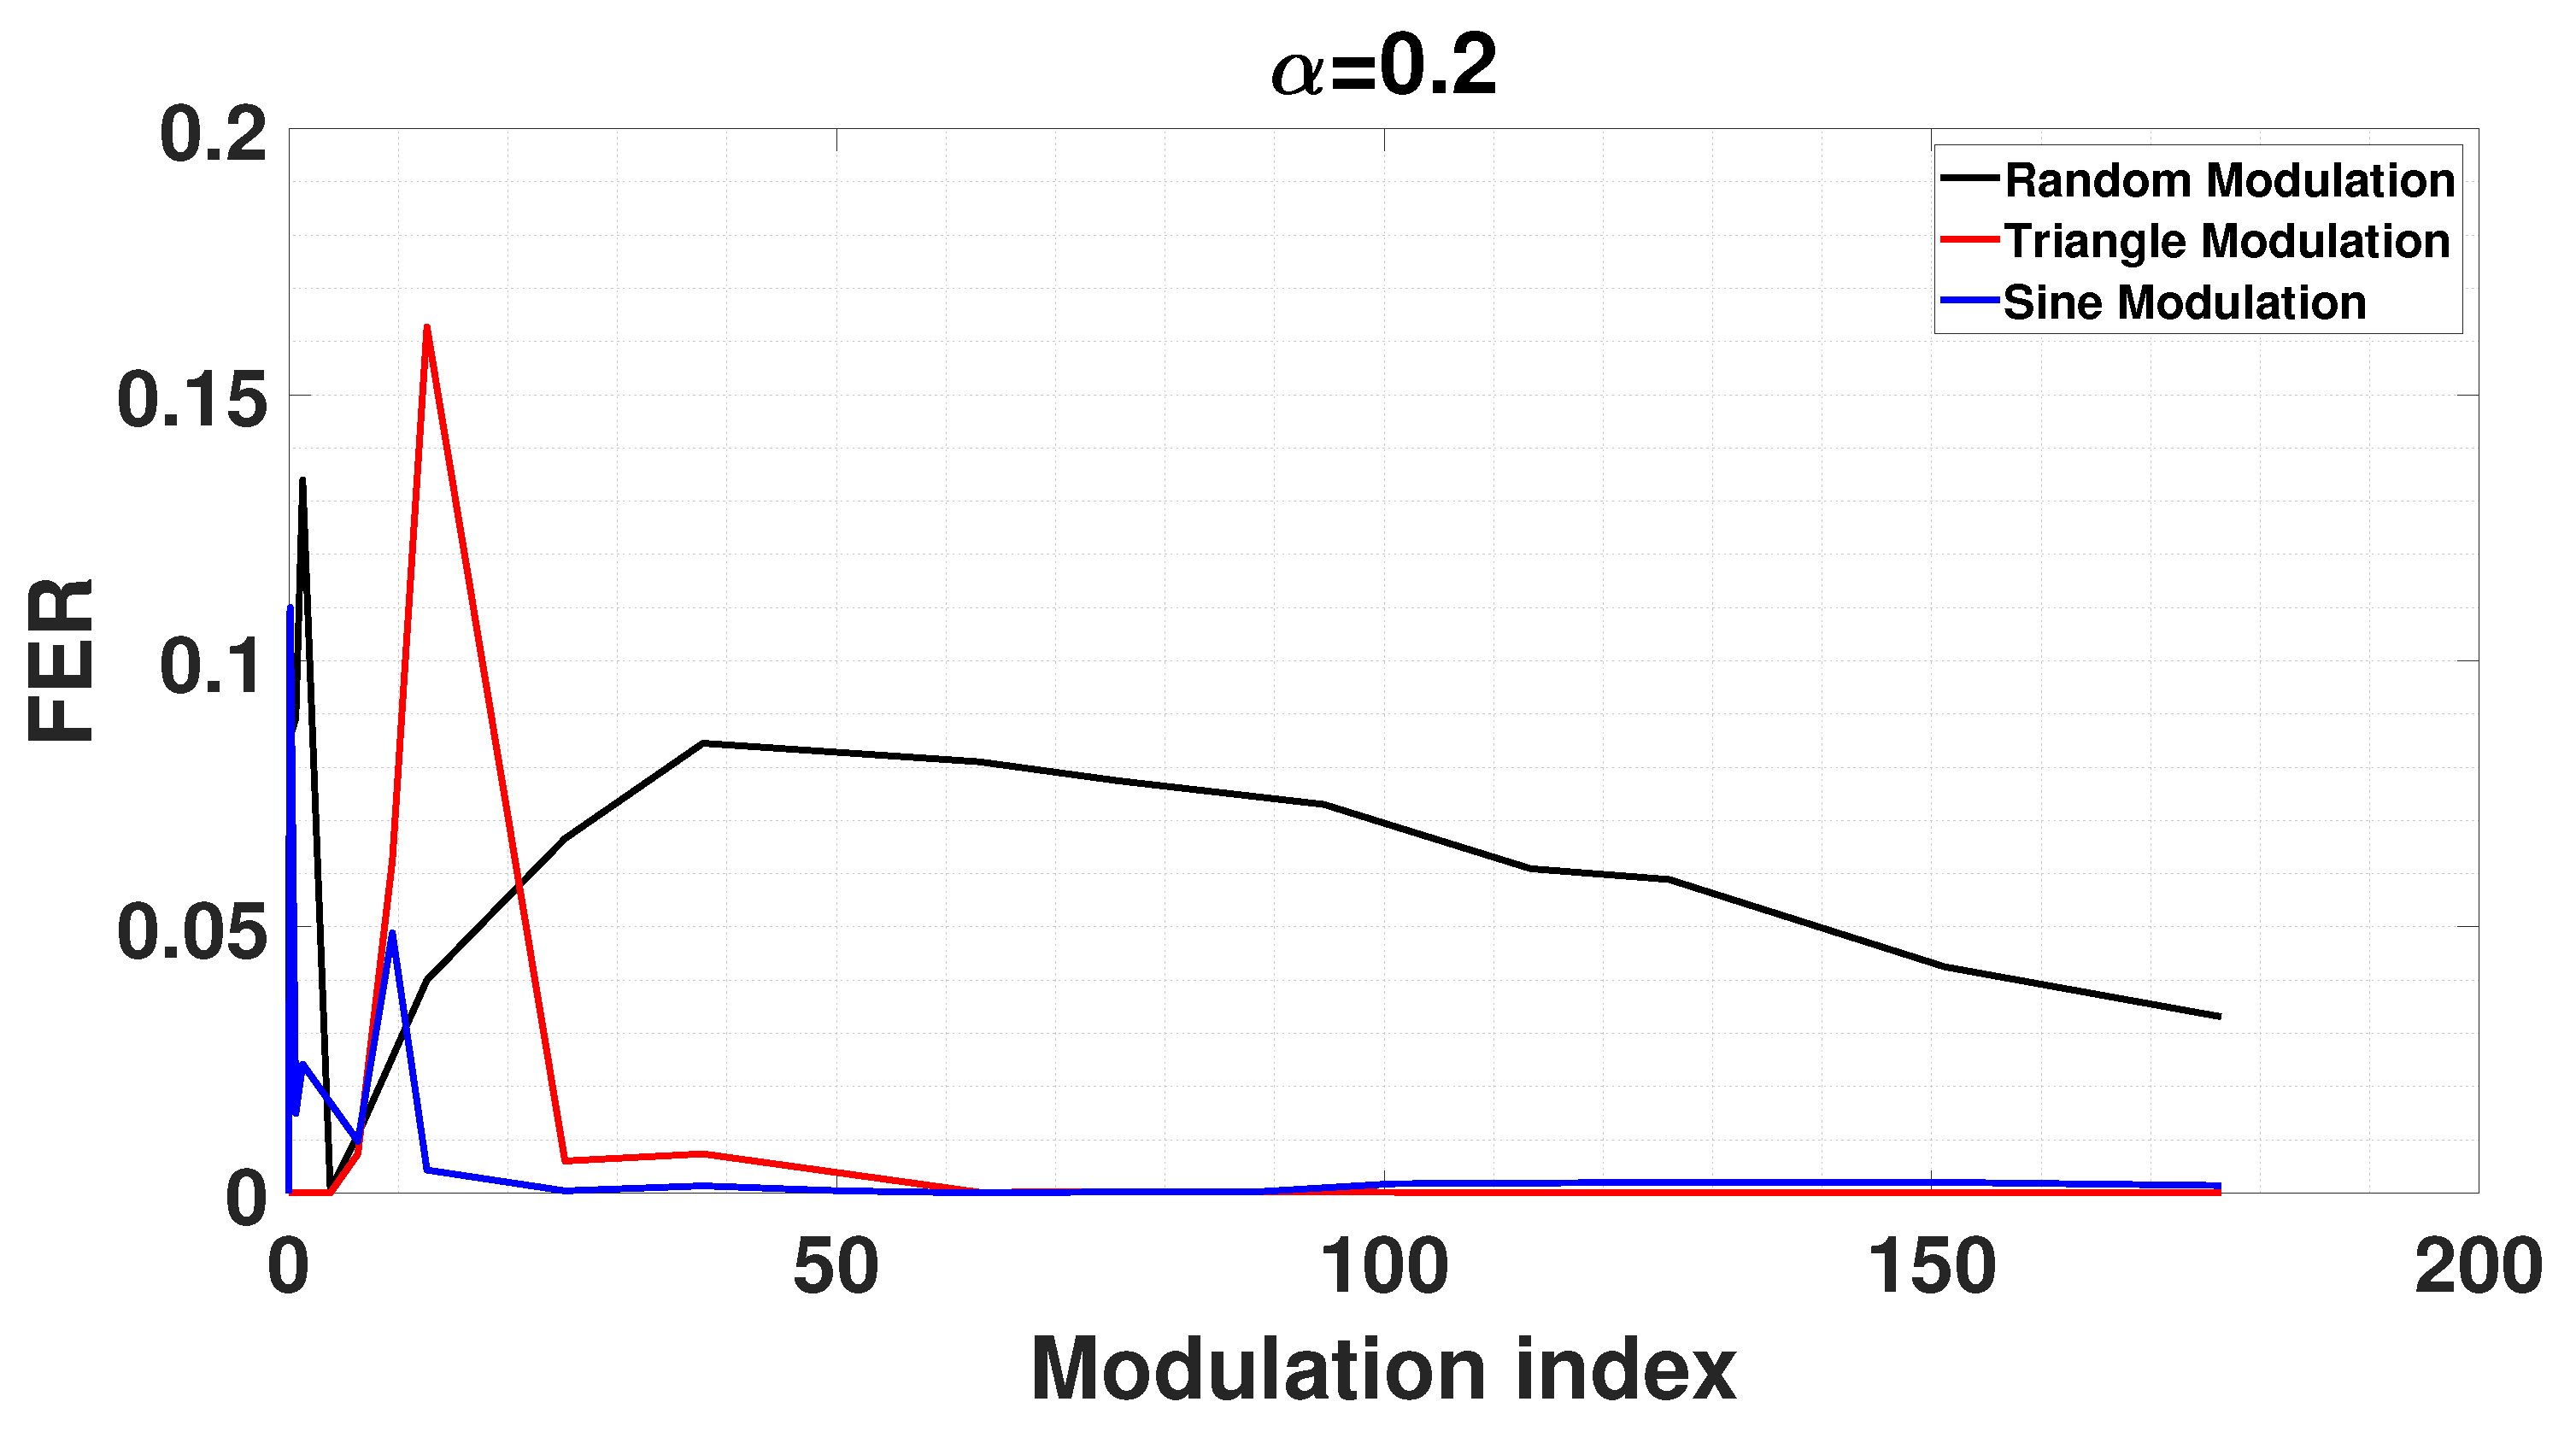
For a value of
= 0.2 the measured results are shown in In
Figure 8, there are interesting values where the100 is less than 25, for all modulation types maximum peaks are measured close to 0.1, after this trend both Triangle and Sine modulation signals generated a FER value close to zero. For a Random modulating signal there is an increasing trend that reaches a maximum point when
m=45, after reaching this point, the trend develops with a decreasing behaviour.
6.3. Results for = 30%
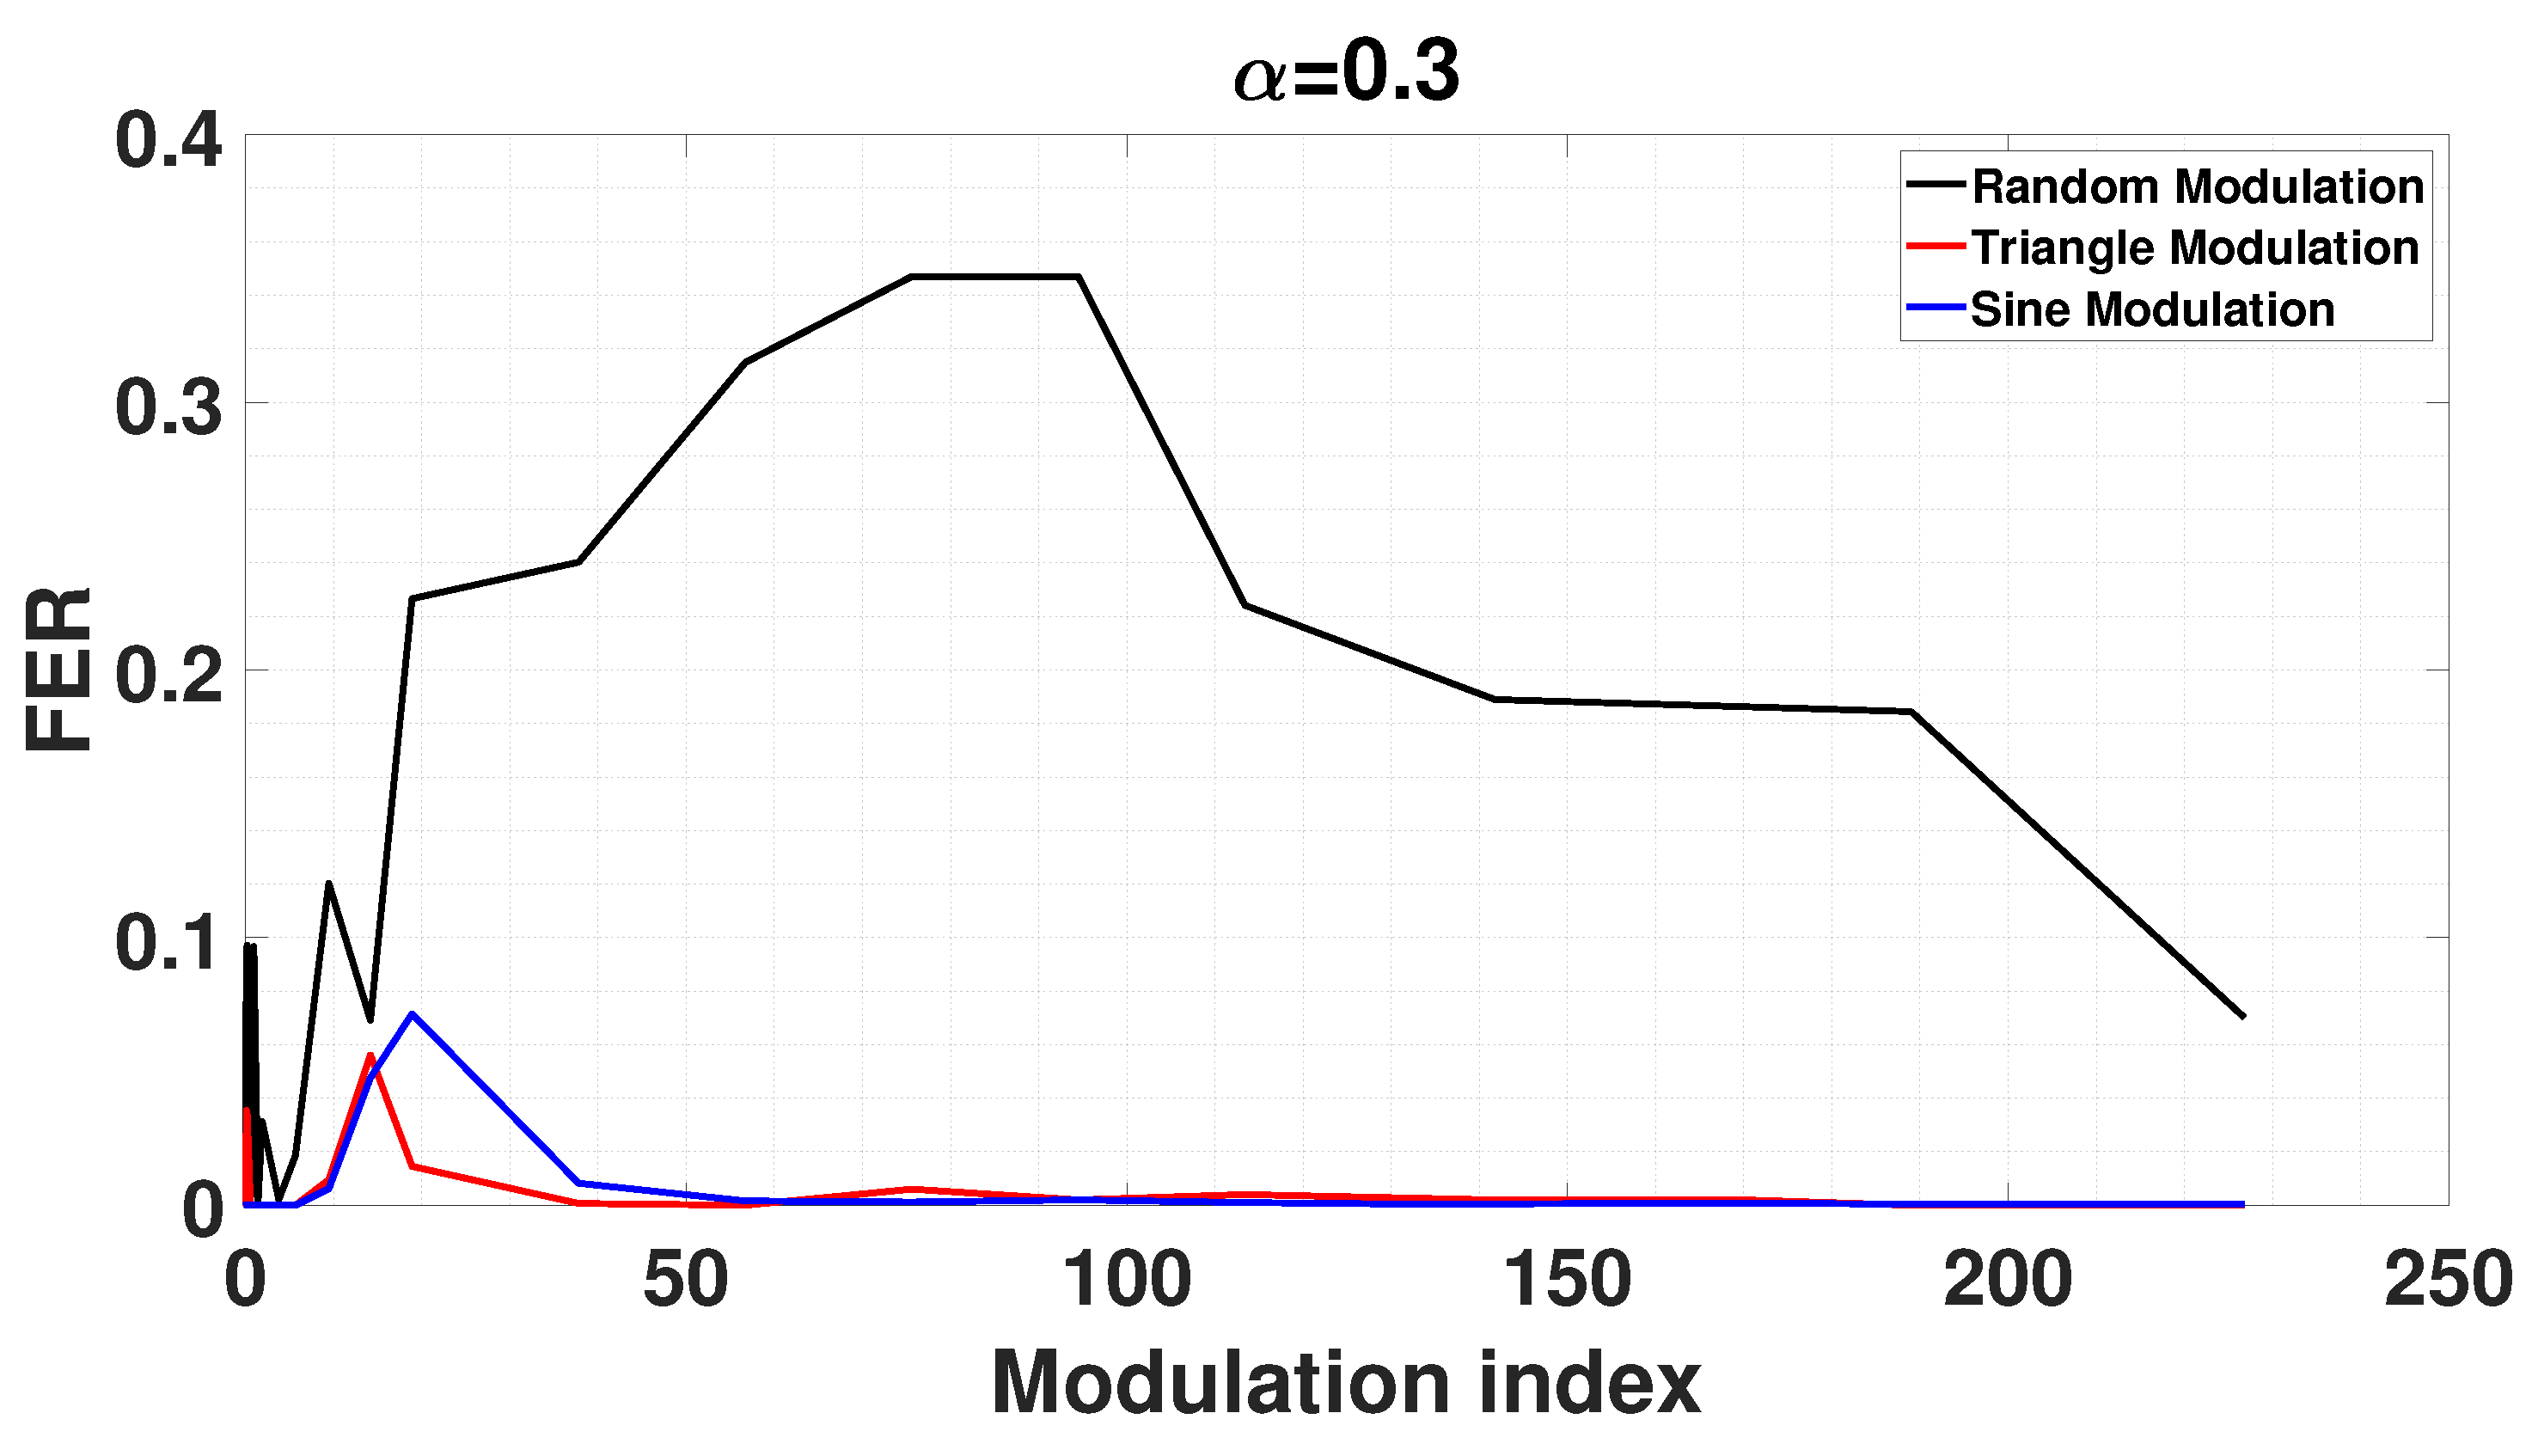
In
Figure 9 there is an increasing trend for all modulation types, after reaching the maximum point of the FER, the trend develops with a decreasing behaviour. Triangle and Sine have a very similar trend. They have a maximum value of the FER when
m=20 and
m=30 respectively, which is less than 0.1. For Random Modulation the maximum value of FER is 0.35 and it is measured when
m=100, then the value of FER decreases for higher values of m.
6.4. Results for = 40%
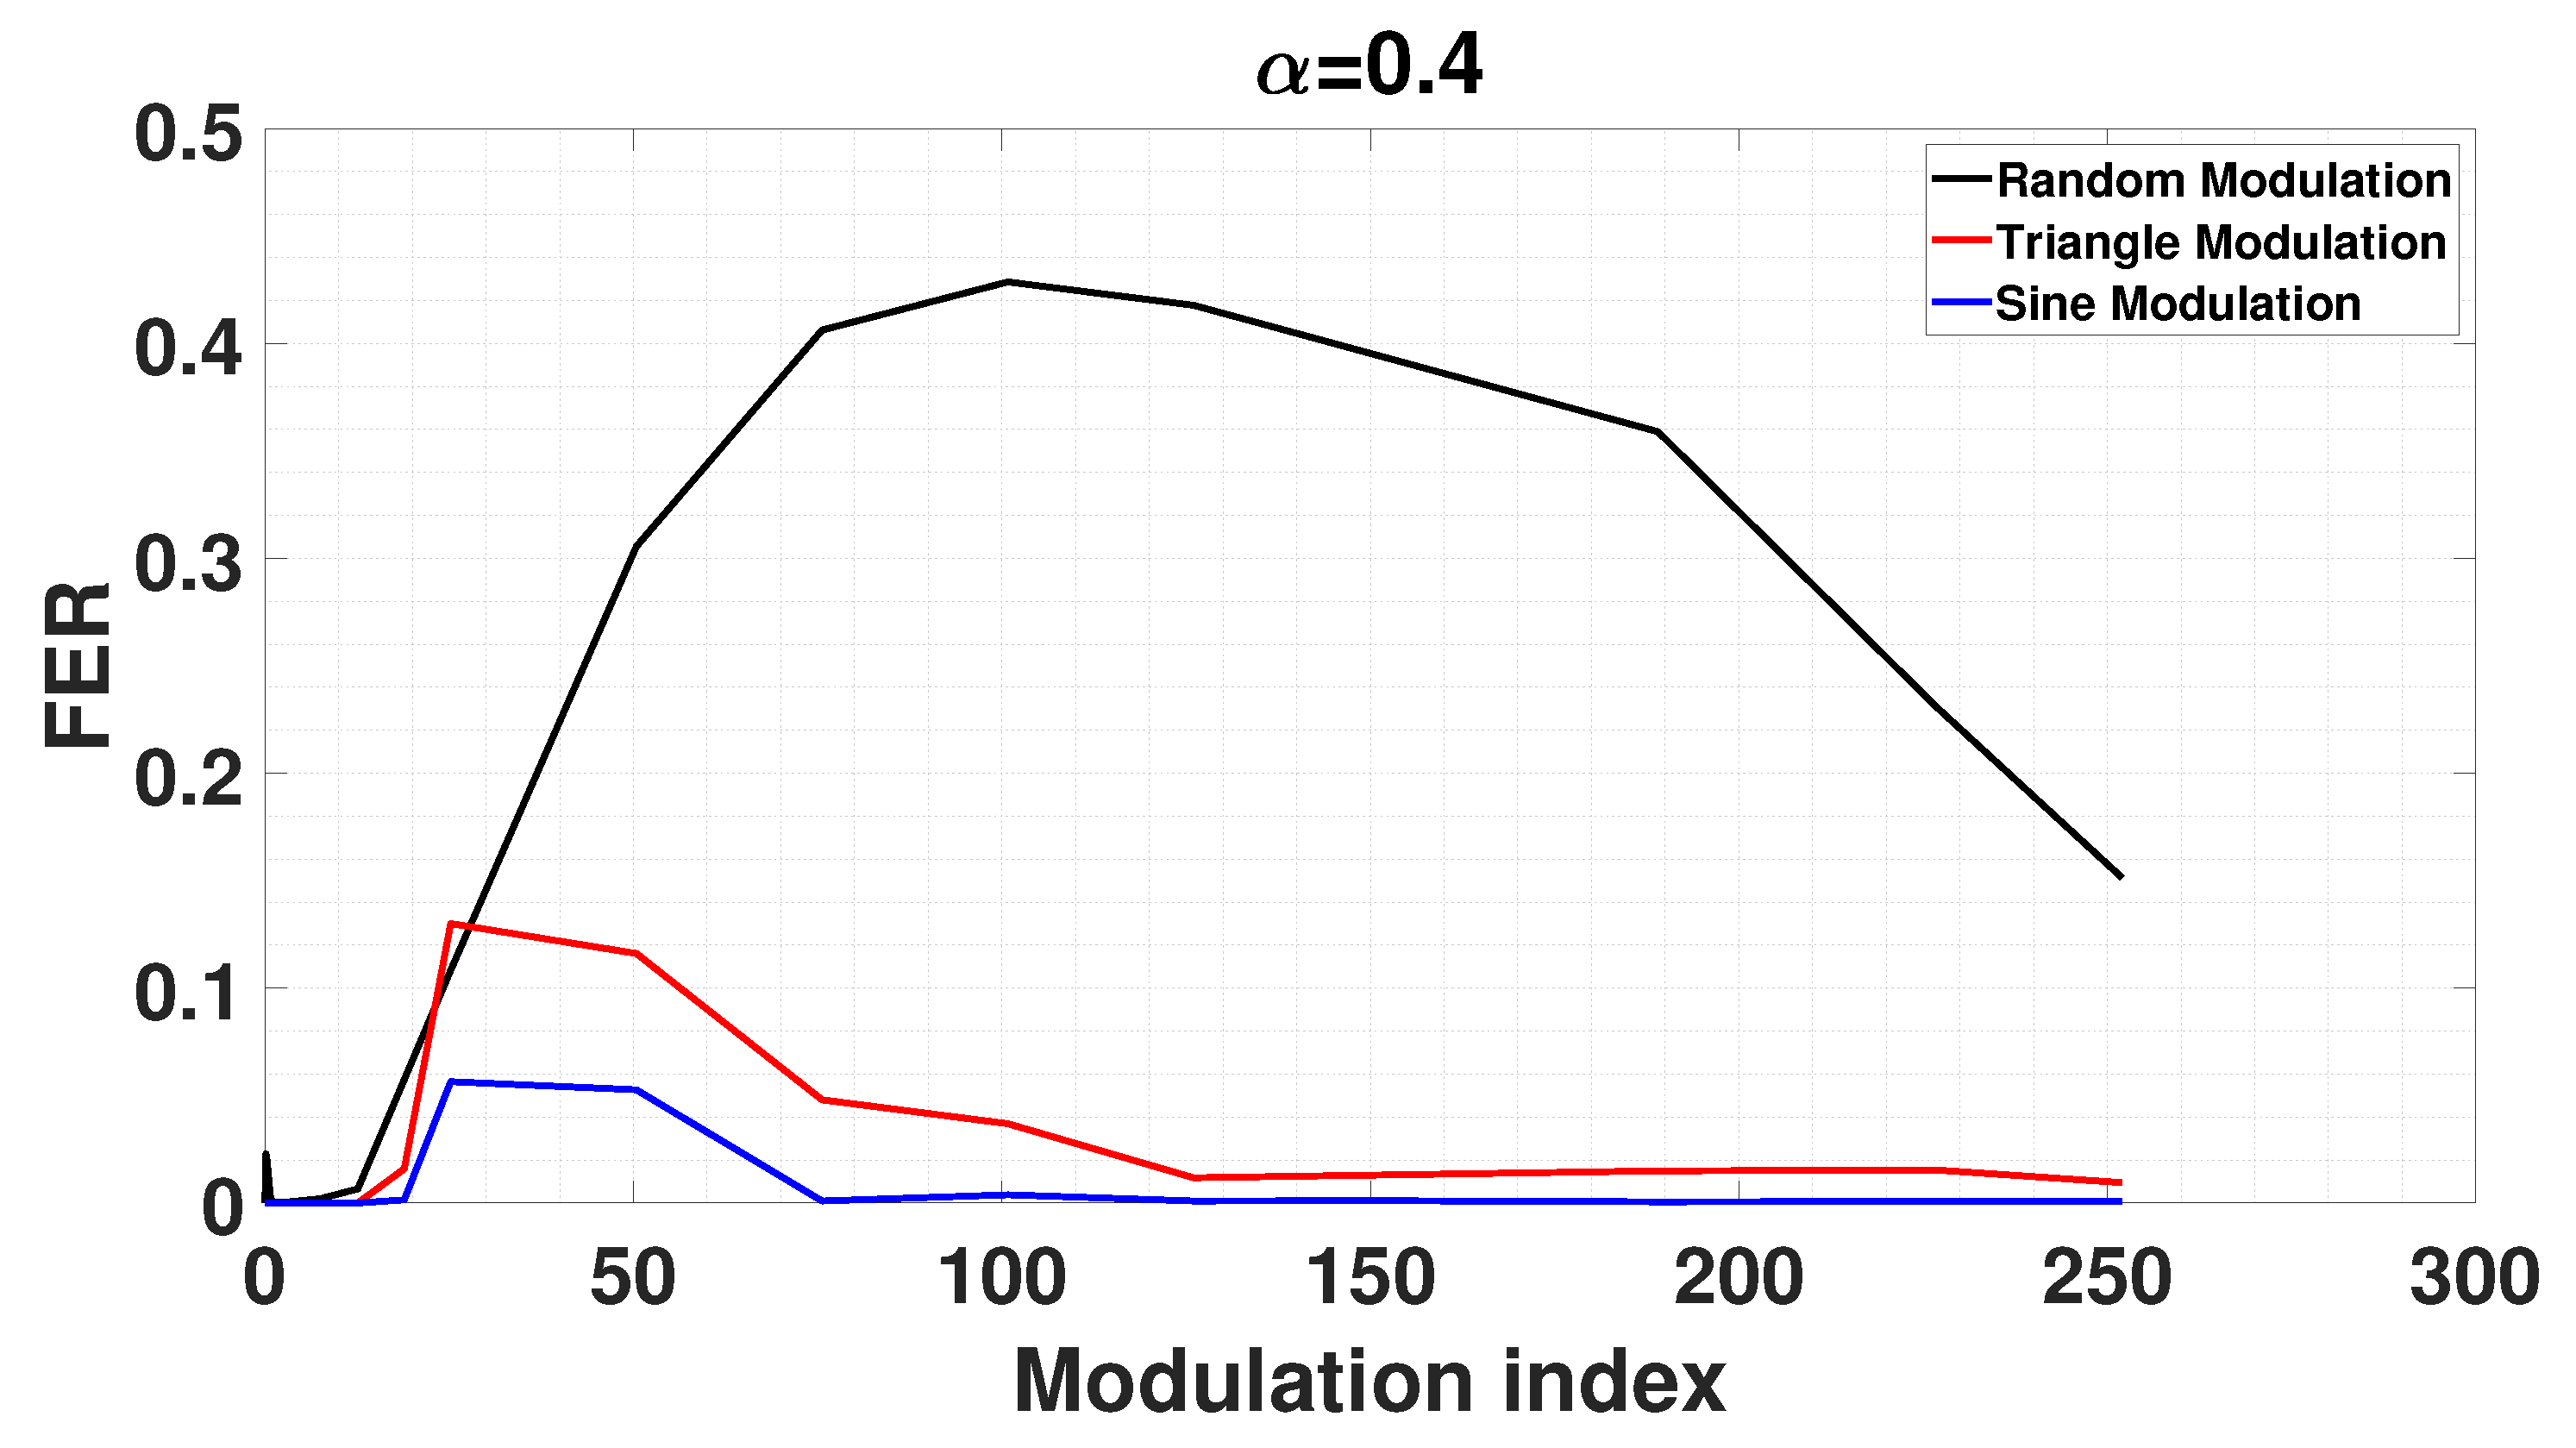
As seen in
Figure 10 there are similar trends in all 3 graphs for all modulation types. For Sine modulation, the maximum value of FER is 0.06 when
m=30, for triangle modulation the maximum value of FER is 0.13 when
m=30. When the random modulation is examined, it is seen that the Fer value is very high compared to the others. When
m=100, the maximum value of FER is 0.42.
6.5. Results for = 50%
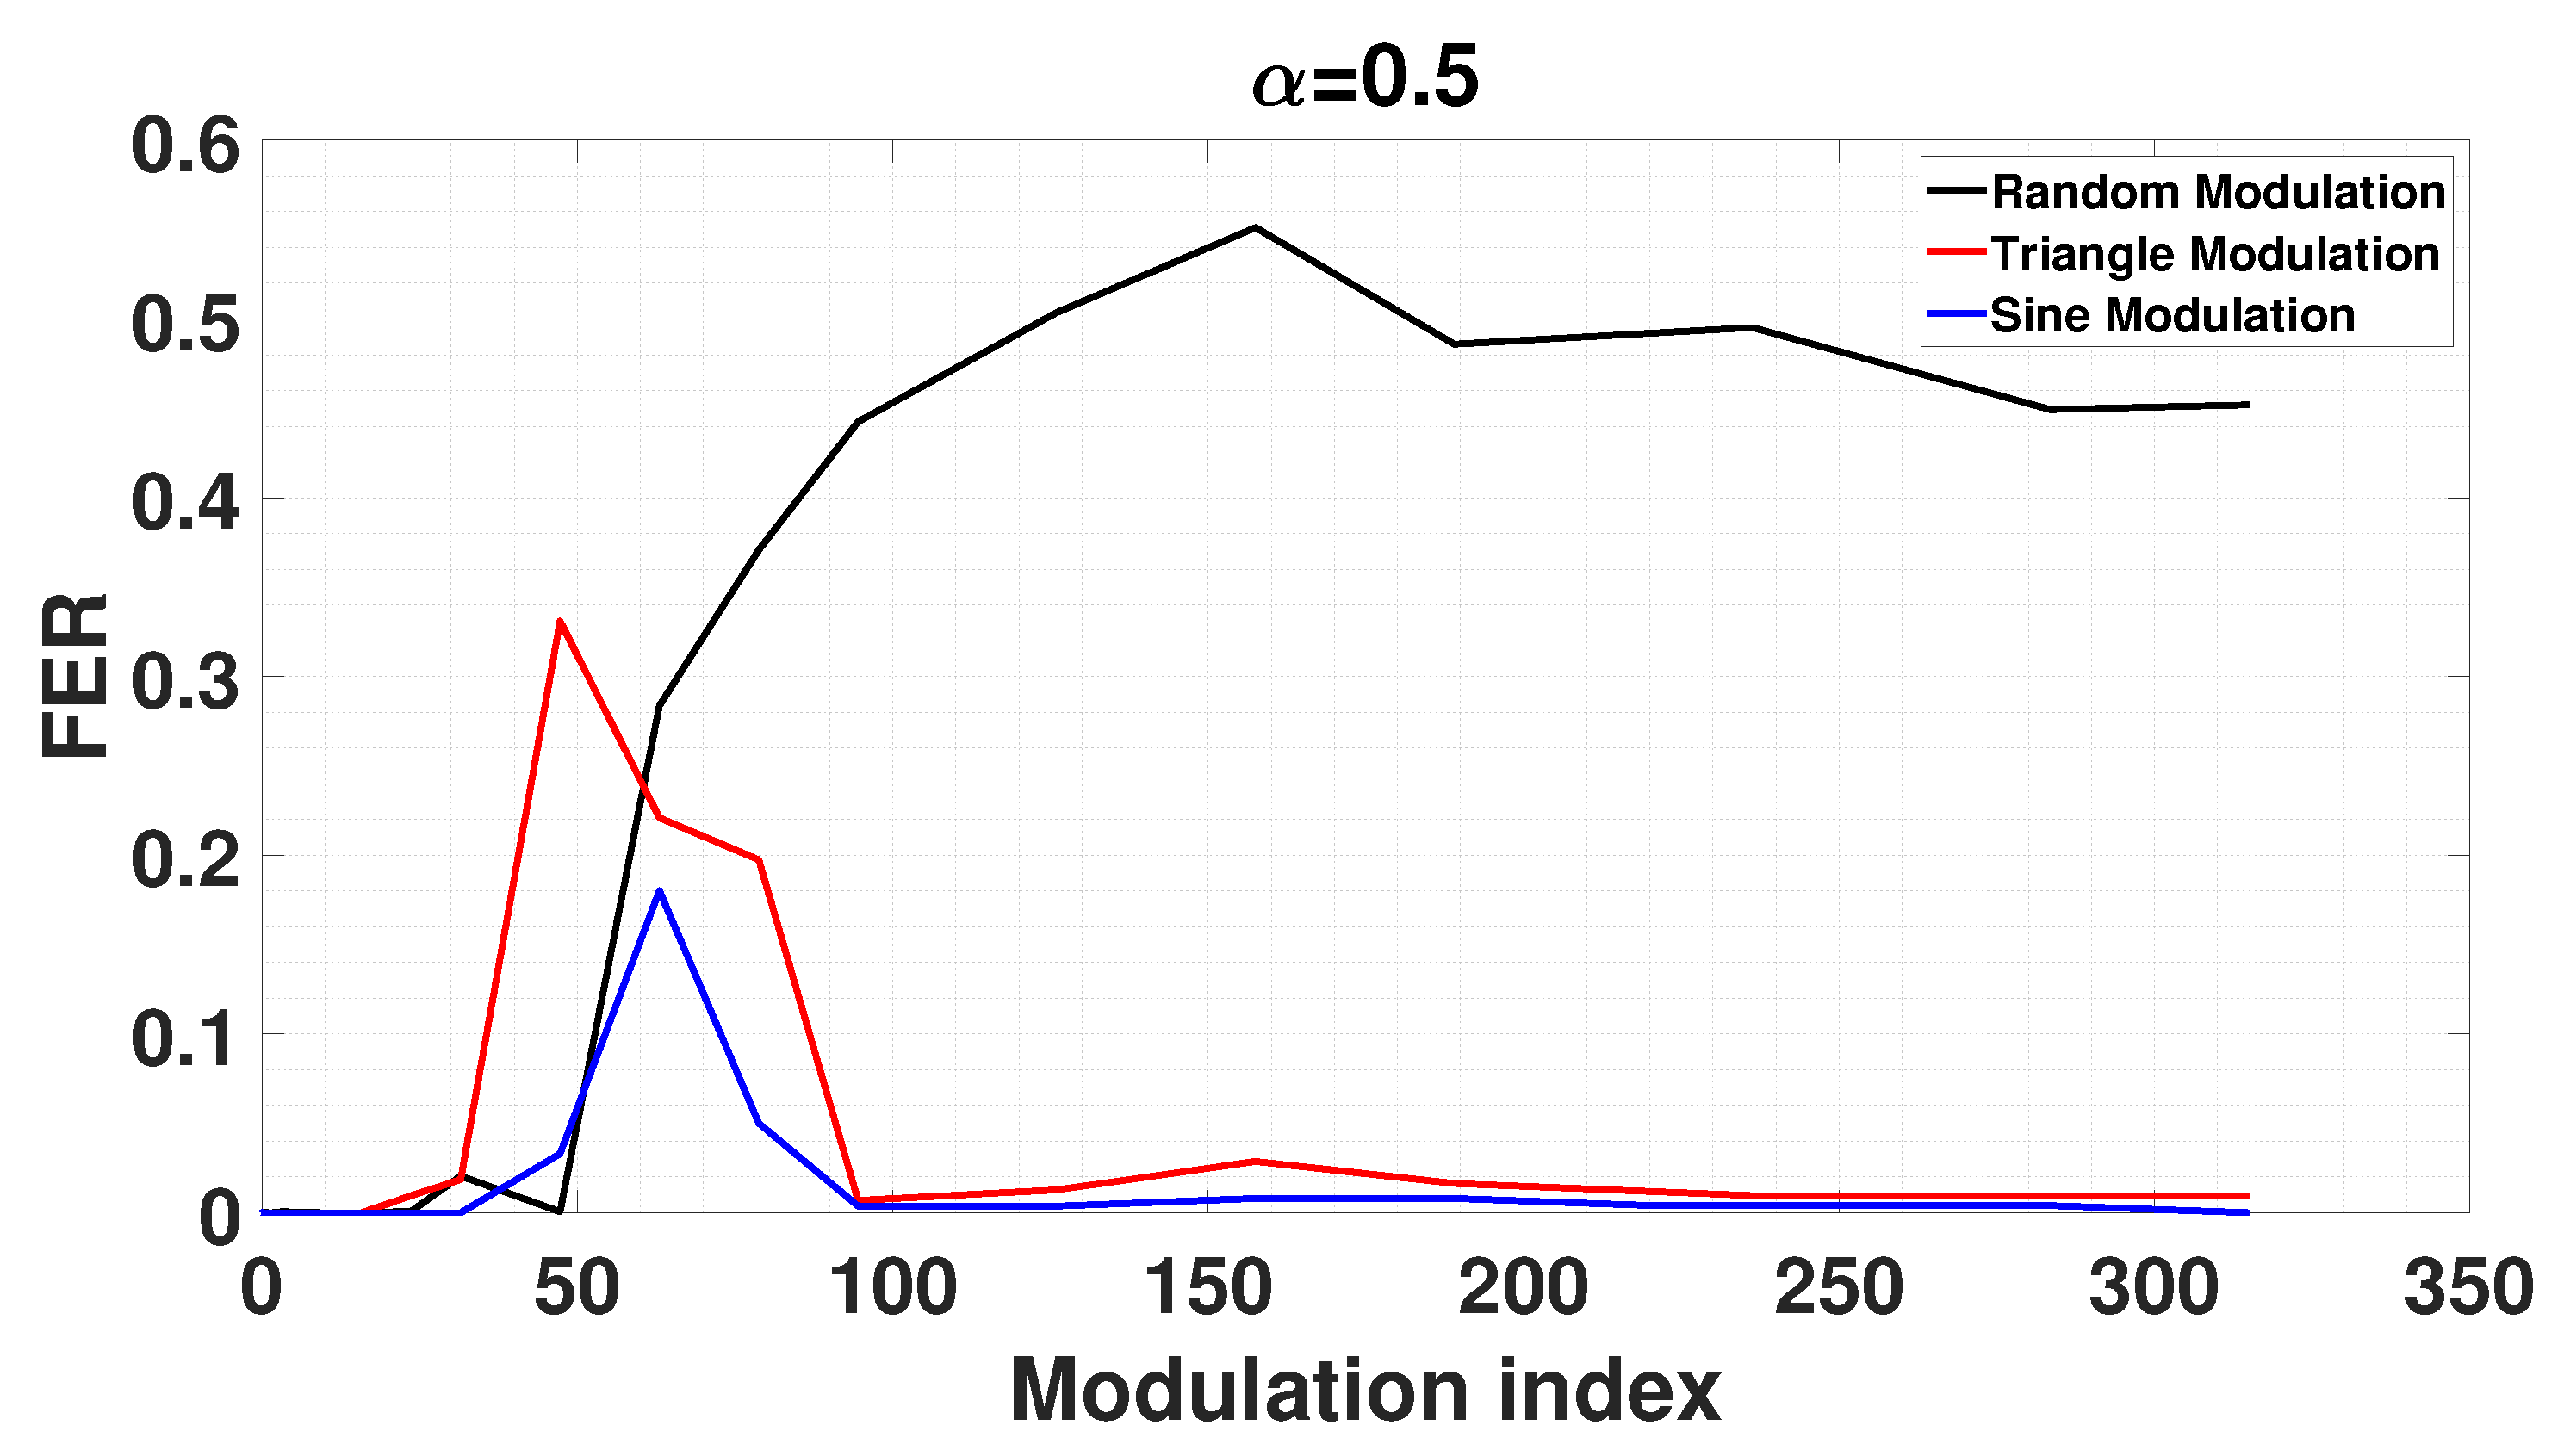
In
Figure 11 it can be seen that the graphs of all (Sine and Triangle) modulation types have the same trend. While FER takes values close to zero at low modulation index values, FER value grows and reaches its maximum value at increasing modulation index values. For Sine, Triangle and Random Modulation the Maximum FER values respectively are 0.19 while
m=65, 0.32 while
m=50 and 0.55 while
m=160. After the maximum FER value, the FER value decreases to zero at
m=100 for sine and triangle modulations. But even at
m=300 in random modulation it still has a very high Fer value, even if it decreases slightly.
6.6. EMI for Random Modulation
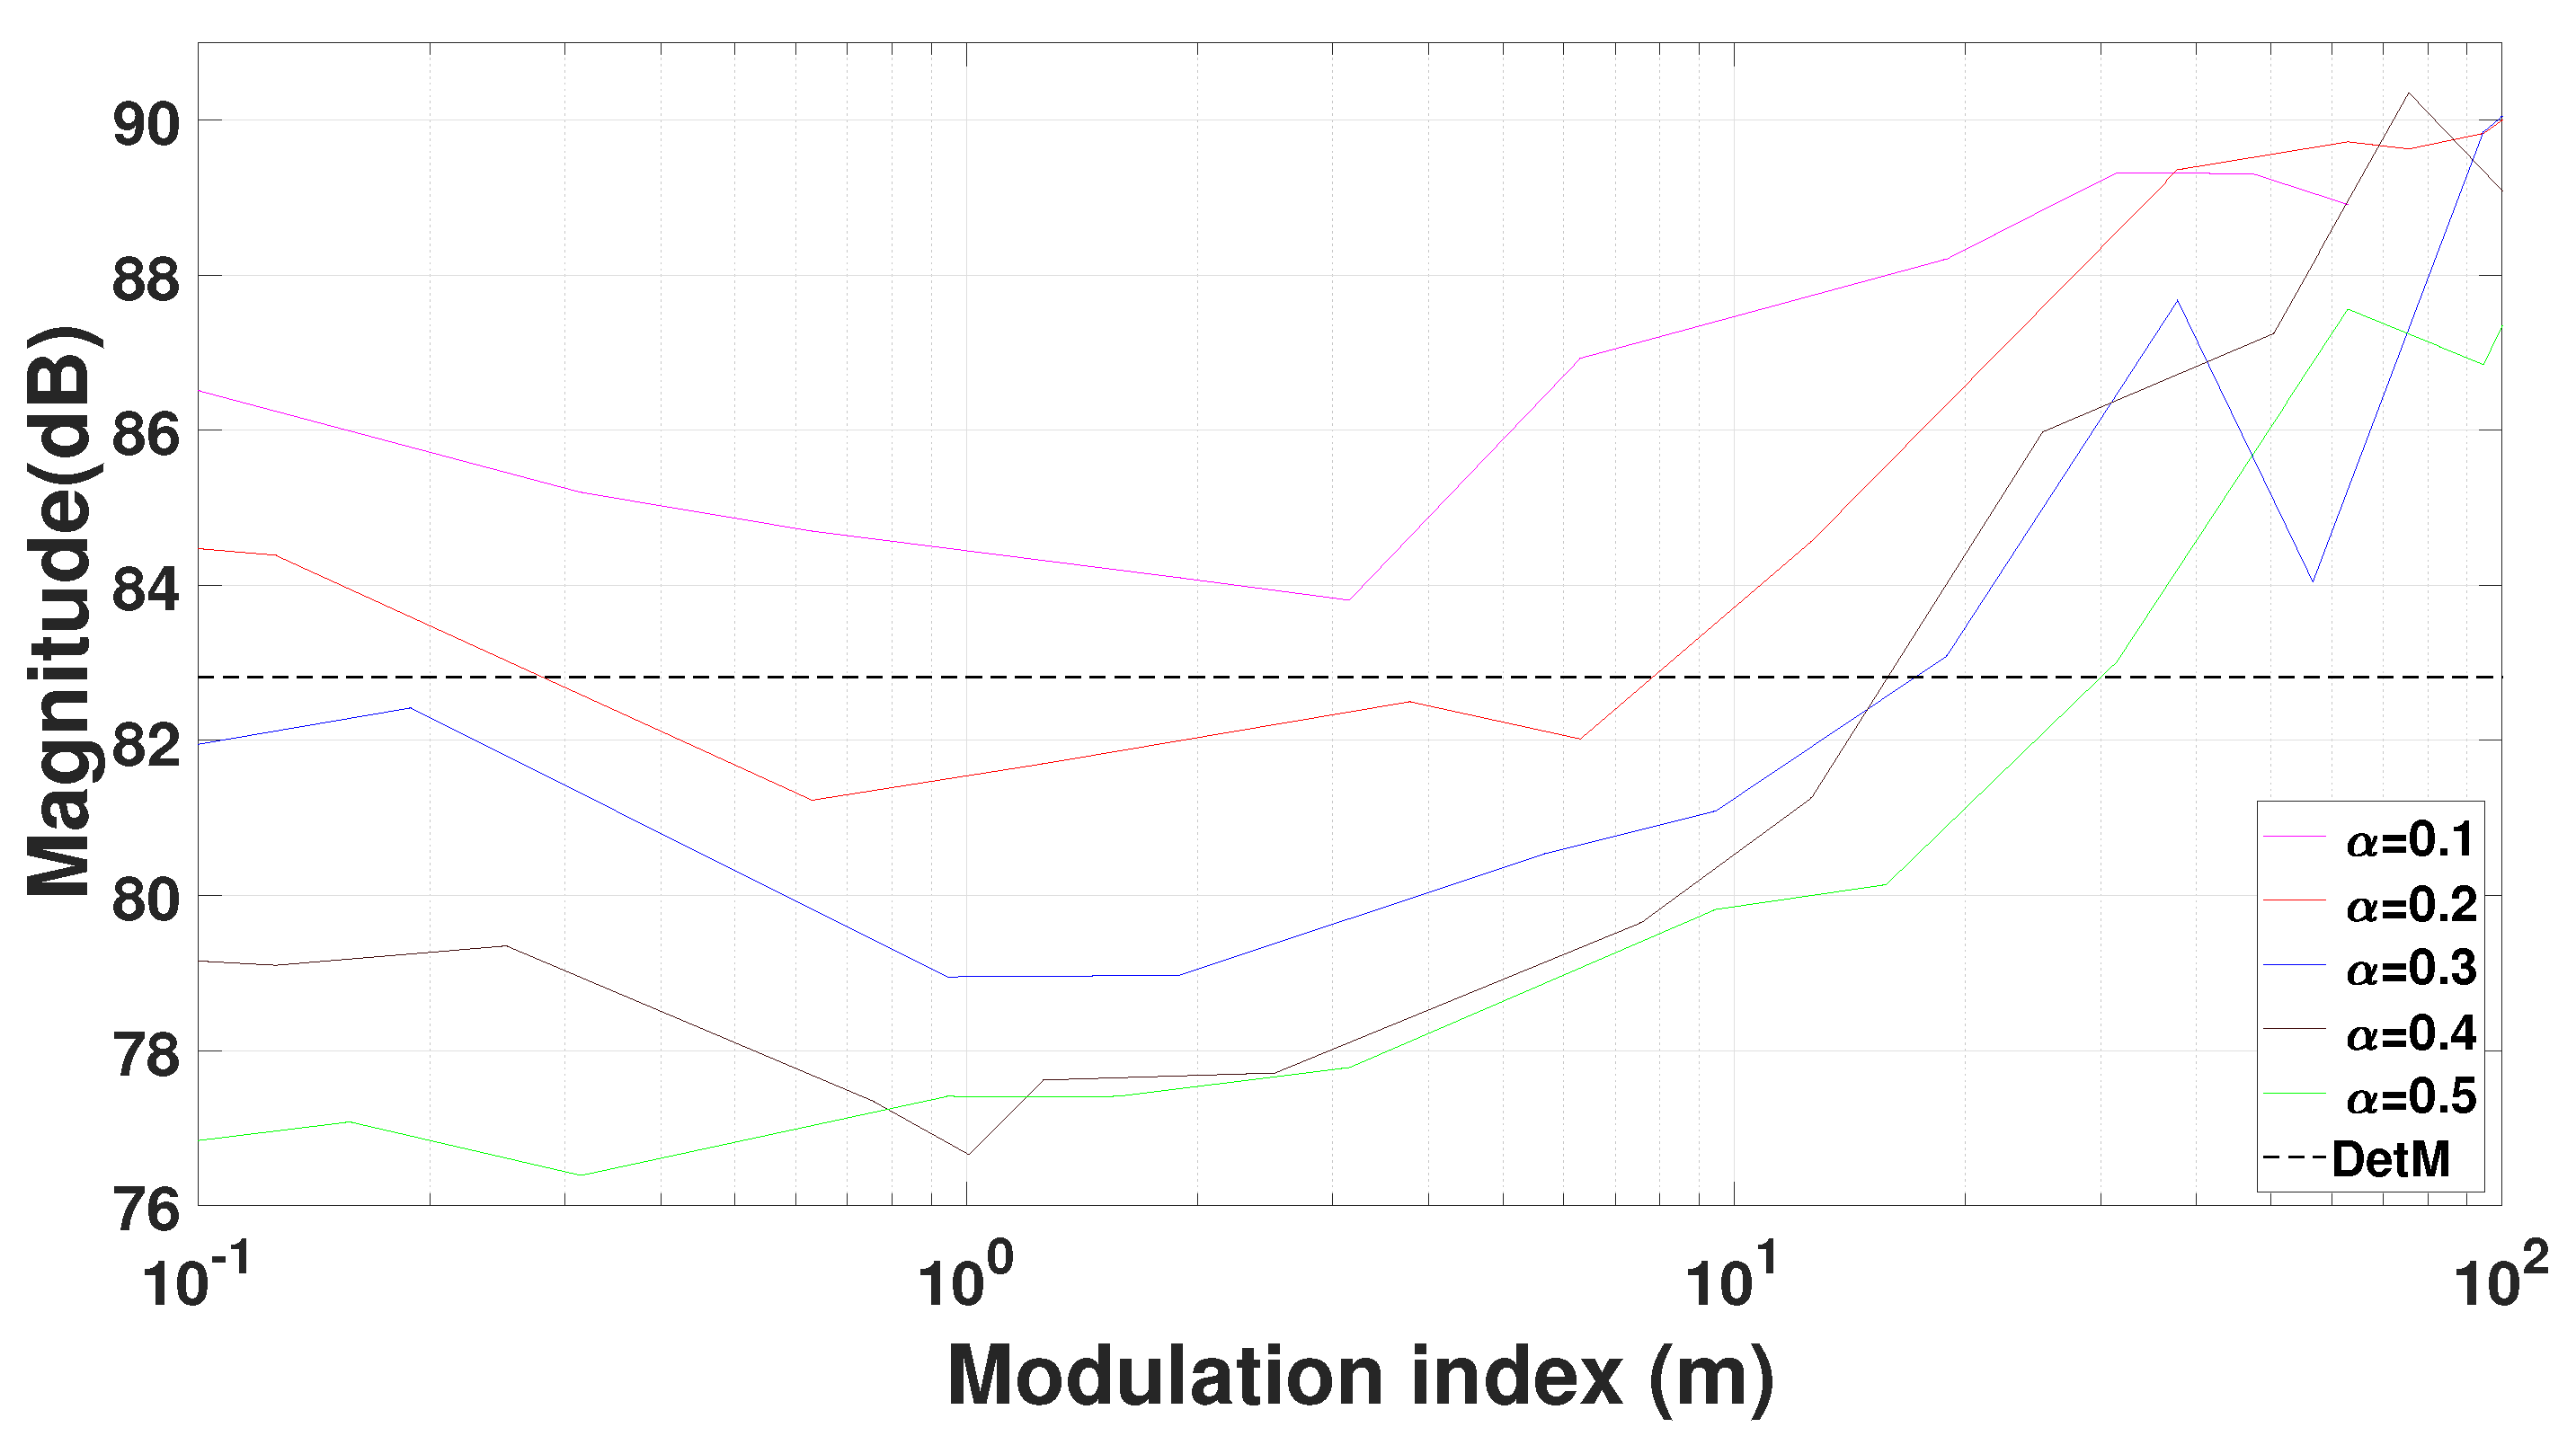
In
Figure 12, the peak index of a CISPR-16 EMI receiver is given for understanding behaviour in the frequency domain. According to this When
=0.1, for all the modulation indices value, modulating signal exceeds the DetM mitigation limit. Since no mitigation is accomplished, these modulating frequencies must be avoided. The greatest mitigation of EMI is obtained when alpha=0.5 and m=0.315. Afterwards, a considerable mitigation is obtained when alpha=0.4 and m=1. As the modulation index grows, the modulation signals for all alpha values are located above DetM. This means no mitigation is achieved
7. Discussion
Having shown the pictures in the last section, it is clear that the selection of a particular signal will generate different FER. The minimum and maximum FER values according to all alpha values are given in the
Table 5 in order to better understand and examine the graphs. Considering this, the following can be discussed,
The usage of a Random Modulating signal starts to generate a considerable degradation of the quality of the PLC communication with a spreading factor bigger than or equal to 30%.
The minimum value of FER is zero at all alpha values except alpha=0.1.
Very low values of FER are measured when the modulation index exceeds a value of 50 for alpha values of 0.3, 0.4 and 0.5.
The maximum FER values obtained for increasing alpha values are examined, it is clearly seen that the FER values increase for all three modulation methods.
Random modulation gives the largest FER value.
In this study, unlike other studies, 3 different modulation types used for switching DC-DC converter are emphasized. Again, the effects of modulation index, spreading factor and sampling frequency of the signal parameters, which were not considered in other studies, on the communication system were examined.
Thus, depending on how much the EMI decreases in the time domain for each modulation type due to the changing alpha values, the modulation index and accordingly the alpha coefficient must be decided, taking into account the residual in the FER.
Having considered the previous points it is clear that the application of a certain signal is a process that must be considered according to particular needs since this can have a considerable impact on the quality of the communication link.
8. Conclusions
This study has demonstrated the impact of EMI on the G3-PLC communication channel performance caused by a spread-spectrum modulated SiC-based buck converter. The modulation index m is an important variable when considering the FER measured, this is due to the close nature of the modulating signal sampling frequency and the spreading factor . In fact, for lower values such as 0.1 and 0.2 the three signals perform in similarly considering only the maximum points of the FER value. However, considering higher values of alpha (0.3 to 0.5) it seems that Random Modulation generates more FER when is compared to the other signals for higher values of m. This brings to the discussion of choosing the best modulation profile for specific purposes. The key finding of this study is that using spread spectrum to reduce the EMI produced in the frequency domain by the power converter (as its source) results in a significant degradation of the communication link quality. The selection of a modulation profile to decrease the EMI generated by a switching converter in close interaction with a communication link such as the one presented here must be analysed for a particular problem. It is worth mentioning that for every modulation there will be important trade-offs that must be considered and demonstrated in this paper.
Author Contributions
For research articles with several authors, a short paragraph specifying their individual contributions must be provided. The following statements should be used “Conceptualization, S.U.E.; methodology, S.U.E. and A.P.Q.; software, S.U.E.; validation, S.U.E., A.P.Q. and D.T.; formal analysis, S.U.E.; investigation, S.U.E. and A.P.Q.; resources, S.U.E.; data curation, S.U.E. and A.P.Q.; writing—original draft preparation, S.U.E.; writing—review and editing, S.U.E., A.P.Q. and D.T.; visualization, S.U.E. and A.P.Q.; supervision, S.U.E. and D.T.; project administration, S.U.E.; All authors have read and agreed to the published version of the manuscript.
Funding
This project has received funding from the TUBITAK 2219.
Informed Consent Statement
Not applicable.
Data Availability Statement
Not applicable.
Conflicts of Interest
The authors declare no conflict of interest.
Abbreviations
| CENELEC |
The European Committee for Electrotechnical Standardization |
| CISPR |
International Special Committee on Radio Interference |
| DUT |
Device Under Test |
| EMI |
Electromagnetic Interference |
| EN |
European Norm |
| FDM |
Frequency Division Multiplexing |
| FER |
Frame Error Rate |
| FPGA |
Field Programmable Gate Array |
| LSIN |
Line Stabilization Impedance Network |
| NB |
Narrow Band |
| OFDM |
Orthogonal Frequency Division Multiplexing |
| PLC |
Power Line Communication |
| PRIME |
Power-line Related Intelligent Metering Evolution |
| RBW |
Resolution Bandwidth |
| SiC |
Silicon Carbide |
| SNR |
Signal to Noise Ratio |
| SSM |
Spread Spectrum Modulation |
References
- Wibisono, M.A.; Moonen, N.; Leferink, F. Interference of LED Lamps on Narrowband Power Line Communication. In Proceedings of the 2020 IEEE International Symposium on Electromagnetic Compatibility and Signal/Power Integrity (EM-CSI), Reno, NV, USA, 28 July–28 August 2020; pp. 219–221. [Google Scholar]
- Goyal, A. Performance enhancement of power line communication using OFDM and CDMA. Master thesis, Department of Electronics and Communication Engineering National Institute of Technology, Rourkela, Odisha, India, 2013. [Google Scholar]
- Routin, J. , ve Brown, C. E. L. (1897). Power line signaling electricity meters, UK Patent Office, London:. British Patent No. 24833, 1897. [Google Scholar]
- Loubery, C. R. (1901). Einrichtung zur elektrishen Zeichengebung an die Theilnehmer eines Starkstromnetzes, Berlin:. German Patent 118717, March 15, 1901. [Google Scholar]
- Cano, C.; Pittolo, A.; Malone, D.; Lampe, L.; Tonello, A.M.; Dabak, A. State-of-the-art in Power Line Communications: From the Applications to the Medium. IEEE J. Sel. Areas Commun. 2016, 34, 1935–1952. [Google Scholar] [CrossRef]
- Hoch, M. Comparison of PLC G3 and PRIME. In Proceedings of the 2011 IEEE International Symposium on Power Line Communications and Its Applications, Udine, Italy, 3–6 April 2011; pp. 165–169. [Google Scholar]
- Matanza, J.; Alexandres, S.; Rodriguez-Morcillo, C. Performance evaluation of two narrowband PLC systems: PRIME and G3. Comput. Stand. Interfaces 2013, 36, 1. [Google Scholar] [CrossRef]
- Rönnberg, S.K.; Bollen, M.H.; Amaris, H.; Chang, G.W.; Gu, I.Y.; Kocewiak, Ł.H.; Meyer, J.; Olofsson, M.; Ribeiro, P.F.; et al. On waveform distortion in the frequency range of 2 kHz–150 kHz—Review and research challenges. Electr. Power Syst. Res. 2017, 150, 1–10. [Google Scholar] [CrossRef]
- Meyer, J.; Khokhlov, V.; Klatt, M.; Blum, J.; Waniek, C.; Wohlfahrt, T.; Myrzik, J. Overview and Classification of Interferences in the Frequency Range 2–150 kHz (Supraharmonics). In Proceedings of the International Symposium on Power Electronics, Electrical Drives, Amalfi, Italy, 20–22 June 2018, Automation and Motion (SPEEDAM 2018); pp. 165–170. [Google Scholar]
- D. Kumar, F. Zare and A. Ghosh, "DC Microgrid Technology: System Architectures, AC Grid Interfaces, Grounding Schemes, Power Quality, Communication Networks, Applications, and Standardizations Aspects," in IEEE Access, vol. 5, pp. 12230-1 2256, 2017. [CrossRef]
- D. Thomas, "Conducted emissions in distribution systems (1 kHz–1 MHz)," in IEEE Electromagnetic Compatibility Magazine, vol. 2, no. 2, pp. 101-104, Second Quarter 2013. [CrossRef]
- K. Mainali and R. Oruganti, "Conducted EMI Mitigation Techniques for Switch-Mode Power Converters: A Survey," in IEEE Transactions on Power Electronics, vol. 25, no. 9, pp. 2344-2356, Sept. 2010. [CrossRef]
- B. Deutschmann, B. Auinger and G. Winkler, "Spread spectrum parameter optimization to suppress certain frequency spectral components," 2017 11th International Workshop on the Electromagnetic Compatibility of Integrated Circuits (EMCCompo), 2017, pp. 39-44,. [CrossRef]
- F. Pareschi, R. Rovatti and G. Setti, "EMI Reduction via Spread Spectrum in DC/DC Converters: State of the Art, Optimization, and Tradeoffs," in IEEE Access, vol. 3, pp. 2857- 2874, 2015. [CrossRef]
- G3-PLC User Guidelines. Available online: https://g3-plc.com/g3-plc/specifications-user-guidelines/ (accessed on 25 October 2021).
- Berger, L.A. , Schwager, A. and Garzas, J.J.E. (2013). Power line communications for smart grid applications. Journal of Electrical and Computer Engineering. 2013. 1-16. [CrossRef]
- https://ww1.microchip.com/downloads/en/DeviceDoc/PL360-EK-User-Guide-DS50002730B.pdf.
- Nee R., V. , Prasad R., OFDM for Wireless Multimedia Communications, Artech House, 2000.
- Li, Y. , Winters J, Sollenberger N., 2002. MIMO-OFDM for wireless communications: signal detection with enhanced channel estimation, IEEE Transactions on Communications, vol. 50, 1471-1477.
- Cimini L., J. , 1994. Analysis and Simulation of Digital Mobile Channel Using Orthogonal Frequency Division Multiplexing, IEEE Transactions on Communications, vol. 42(2), 2908-2914.
- J. Balcells, A. Santolaria, A. Orlandi, D. Gonzalez and J. Gago, "EMI reduction in switched power converters using frequency Modulation techniques," in IEEE Transactions on Electromagnetic Compatibility, vol. 47, no. 3, pp. 569-576, Aug. 2005. [CrossRef]
- Loschi Hermes, Piotr Lezynski, Robert Smolenski, Douglas Nascimento and Wojciech Sleszynski, "FPGA-Based System for Electromagnetic Interference Evaluation in Random Modulated DC/DC Converters", in MDPI Energies, vol. 13, no. 9, 2020. [CrossRef]
- Sudhakar N, Rajasekar N and Shanmuga Sundari A, "FPGA based Chaotic PWM combined with soft switching for effective EMI mitigation in boost converter," 2016 International Conference on Energy Efficient Technologies for Sustainability (ICEETS), Nagercoil, India, 2016, pp. 148-152. [CrossRef]
- G. Marsala and A. Ragusa, "Chaos PWM for EMI reduction in a high boost DC-DC converter with coupled inductors," 2017 IEEE 5th International Symposium on Electromagnetic Compatibility (EMC-Beijing), Beijing, China, 2017, pp. 1-6. [CrossRef]
- A. Pena-Quintal et al., "Impact of Pseudo-Random Modulation on Measured Conducted EMI," in IEEE Electromagnetic Compatibility Magazine, vol. 11, no. 2, pp. 84-92, 2nd Quarter 2022. [CrossRef]
Figure 1.
Comparison of different driving signals in time-domain and its result if frequency-domain for Deterministic, Sine Wave, Sawtooth and Random wave.
Figure 1.
Comparison of different driving signals in time-domain and its result if frequency-domain for Deterministic, Sine Wave, Sawtooth and Random wave.
Figure 2.
Orthogonality in time domain.
Figure 2.
Orthogonality in time domain.
Figure 3.
Orthogonality in frequency domain.
Figure 3.
Orthogonality in frequency domain.
Figure 4.
Graphical explanation of Spread Spectrum for noise dispersion
Figure 4.
Graphical explanation of Spread Spectrum for noise dispersion
Figure 5.
Experimental test set-up block diagram.
Figure 5.
Experimental test set-up block diagram.
Figure 6.
Experimental test set-up used for the measurements.
Figure 6.
Experimental test set-up used for the measurements.
Figure 7.
Comparison of Random Modulation, Triangle Modulation and Sine Modulation when =0.1.
Figure 7.
Comparison of Random Modulation, Triangle Modulation and Sine Modulation when =0.1.
Figure 8.
Comparison of Random Modulation, Triangle Modulation and Sine Modulation when =0.2
Figure 8.
Comparison of Random Modulation, Triangle Modulation and Sine Modulation when =0.2
Figure 9.
Comparison of Random Modulation, Triangle Modulation and Sine Modulation when =0.3
Figure 9.
Comparison of Random Modulation, Triangle Modulation and Sine Modulation when =0.3
Figure 10.
Comparison of Random Modulation, Triangle Modulation and Sine Modulation when =0.4
Figure 10.
Comparison of Random Modulation, Triangle Modulation and Sine Modulation when =0.4
Figure 11.
Comparison of Random Modulation, Triangle Modulation and Sine Modulation when =0.5
Figure 11.
Comparison of Random Modulation, Triangle Modulation and Sine Modulation when =0.5
Figure 12.
Random modulation results for all values with different modulation indices
Figure 12.
Random modulation results for all values with different modulation indices
Table 1.
G3-PLC system parameters.
Table 1.
G3-PLC system parameters.
| Parameter |
G3-PLC Standart |
Frequency |
| EUROPEAN |
CENELEC |
3kHz-148.5 kHZ |
| ABD |
FEC |
10 kHz-490kHz |
| JAPAN |
ARIB |
10 kHz-450kHz |
Table 2.
CENELEC frequency bands.
Table 2.
CENELEC frequency bands.
| CENELEC Frequency Band |
Frequency Range |
| Band A |
9 kHz-95 kHz |
| Band B |
95 kHz-125 kHz |
| Band C |
125 kHz-140 kHz |
| Band D |
140 kHz-148.5 kHz |
Table 3.
NB-PLC Frequency Range.
Table 3.
NB-PLC Frequency Range.
| Parameter |
G3-PLC |
| Type of Modulation |
OFDM |
| Sampling Frequency |
400 kHz |
| Number of FFT points |
256 |
| Max. Data Rate |
33.4 kbps |
| First Frequency |
35.9 kHz |
| Last Frequency |
90.6 kHz |
| Number of cyclic Prefix samples |
30 |
| Sub-Carrier spacing |
1.5625 |
Table 4.
Spectrum Analyser Parameters.
Table 4.
Spectrum Analyser Parameters.
| Parameter |
Value |
| Frequency range |
9 kHz - 150 kHz |
| IF Bandwidth |
200 Hz |
| Dwell time |
100 ms |
Table 5.
Absolute FER values measured.
Table 5.
Absolute FER values measured.
| |
Sine |
Sine |
Triangle |
Triangle |
Random |
Random |
|
min FER |
max FER |
min FER |
max FER |
min FER |
max FER |
| 0.1 |
0.000026 |
0.0028 |
0.0005 |
0.002 |
0.0006 |
0.0043 |
| 0.2 |
0.0 |
0.110 |
0.0 |
0.162 |
0.0 |
0.084 |
| 0.3 |
0.0 |
0.071 |
0.0 |
0.056 |
0.0 |
0.347 |
| 0.4 |
0.0 |
0.056 |
0.0 |
0.130 |
0.0 |
0.428 |
| 0.5 |
0.0 |
0.180 |
0.0 |
0.331 |
0.0 |
0.551 |
|
Disclaimer/Publisher’s Note: The statements, opinions and data contained in all publications are solely those of the individual author(s) and contributor(s) and not of MDPI and/or the editor(s). MDPI and/or the editor(s) disclaim responsibility for any injury to people or property resulting from any ideas, methods, instructions or products referred to in the content. |
© 2023 by the authors. Licensee MDPI, Basel, Switzerland. This article is an open access article distributed under the terms and conditions of the Creative Commons Attribution (CC BY) license (http://creativecommons.org/licenses/by/4.0/).
