1. Introduction
In the last decades many farmers affected by severe economic distress and extreme weather events started considering and cultivating alternative crops.
Cannabis sativa L., one of the oldest crops known by humankind, thanks to the last decades' diffusion of low tetrahydrocannabinol (THC) concentration varieties, is experiencing a worldwide distribution [
1,
2]. Despite the potential use in numerous industries (energy, feed, health, etc.), knowledge and supply chains about
Canapa Sativa L. are still limited [
3,
4,
5]. High public interest in this crop is increasing with the need for genetic improvement [
6,
7] and performance optimization.
Remote sensing technologies introduction is a valuable solution to optimize cultivation techniques and input distribution and to perform more reliable and effective recognition procedures thanks to usable, near real-time information based on cultivars and cultivation environment knowledge [
8]. Despite the numerous image thresholding techniques proposed in the literature, their performance analyses are relatively limited. Plant emergence and stand establishment are key indicators routinely assessed in Canapa improvement research [
9,
10]. Automatic Unmanned Aerial System (UAS) image processing for plant numbering in the field represents a valuable solution to manual plant counting performed at regular intervals. Image processing, widely used to solve various agriculture problems such as classification, object detection, object counting, and many more, can help extract crucial information from the image automatically. Canopy height models (CHM) derived from structure from motion or light detection and ranging (LiDAR) technologies represent a technique for canopy height, size, and biomass measurement also used to separate crop pixels from soil [
11,
12]. Likewise, Otsu thresholding, widely used in many computer vision applications and employable with vegetation indexes, is a single-intensity threshold method that separates pixels into the foreground and background classes [
13]. Differently from Machine Learning (ML) techniques, computer vision does not require large labeled datasets, training, test, and validation phases to perform plant segmentation, resulting in an easier application and fast results obtainment.
Accurate plant information extraction from sensors and images is currently a bottleneck that depends on correct image segmentation [
14]. Multispectral and hyperspectral images provide crucial information that can be used together with advanced ML tools to develop a direct method to discriminate cannabis from similar plants [
15]. ML requires high quality data in a specific format and free from extraneous features to build models able to perform fast and automatic classification, recommendations, or prediction operations. Pre-processing techniques, essential to make the data suitable for model training, testing, and validating, are complex and time-consuming [
16]. Between the multiple ML algorithms randomly selected or chosen after performance comparison, it is hard to choose the appropriate and suitable one to build and customize the learning model, delaying the deployment process. ML model building needs long training and multiple testing, generally time-consuming tasks. Moreover, the deployment of models is particularly challenging because of the complexity of the real-world scenario and the required deployment skills to employ the models using third-party software and hardware [
17,
18,
19,
20,
21].
Relevant works report systems for plant detection and counting, showing different techniques and approaches. Sharma et al. used multi-spectral UAS images acquired at 15 m height combined with GIS software to estimate the number of plants of two different potato varieties [
22]. The results showed a high Pearson correlation coefficient (r = 0.82) between image-based and manual counting. Another example is the implementation of computer vision using the Excess Green Index (EXG) and Otsu's method and transfer learning using convolutional neural networks to identify and count plants in a spinach field [
23]. A similar experiment by Shirzadifar et al. [
24] on Maize crop reported a detection algorithm using the EXG index and the k-means clustering technique, achieving an average accuracy of 46% and 91% in the field, respectively. Fully automatic plant counting in sugar beet, maize, and strawberry fields was performed by Barreto et al. [
25] using UAS images and deep learning analysis. The number of crops per plot was automatically predicted in five locations at different growth stages, showing errors of less than 4.6 % for sugar beet and that the arrangement of plants in the field is a crucial factor influencing detection performance. The algorithm proposed by Fan et al. [
26], based on deep neural networks for tobacco plant detection from UAS images, consisted of three stages. The first stage consisted of obtaining candidate regions of tobacco plants, containing either a tobacco plant or a non-tobacco plant, from UAS images. Second, the development of a deep convolutional neural network, trained to classify the candidate regions as either tobacco or non-tobacco plant regions. In the third step, the non-tobacco plant regions were removed.
Most of the proposed and analyzed works rely on machine learning systems for detecting and counting plants. Is it possible to obtain comparable performance using traditional segmentation techniques, or machine learning is the only approach suitable for a reliable detection? The work aimed to compare and evaluate the potential of two thresholding segmentation techniques for Cannabis sativa L. plants detection in two experimental fields in Sardinia (Italy) in a multi-temporal scale and evaluate the potential of such techniques to provide reliable information for farm management.
2. Materials and Methods
2.1. Study Site
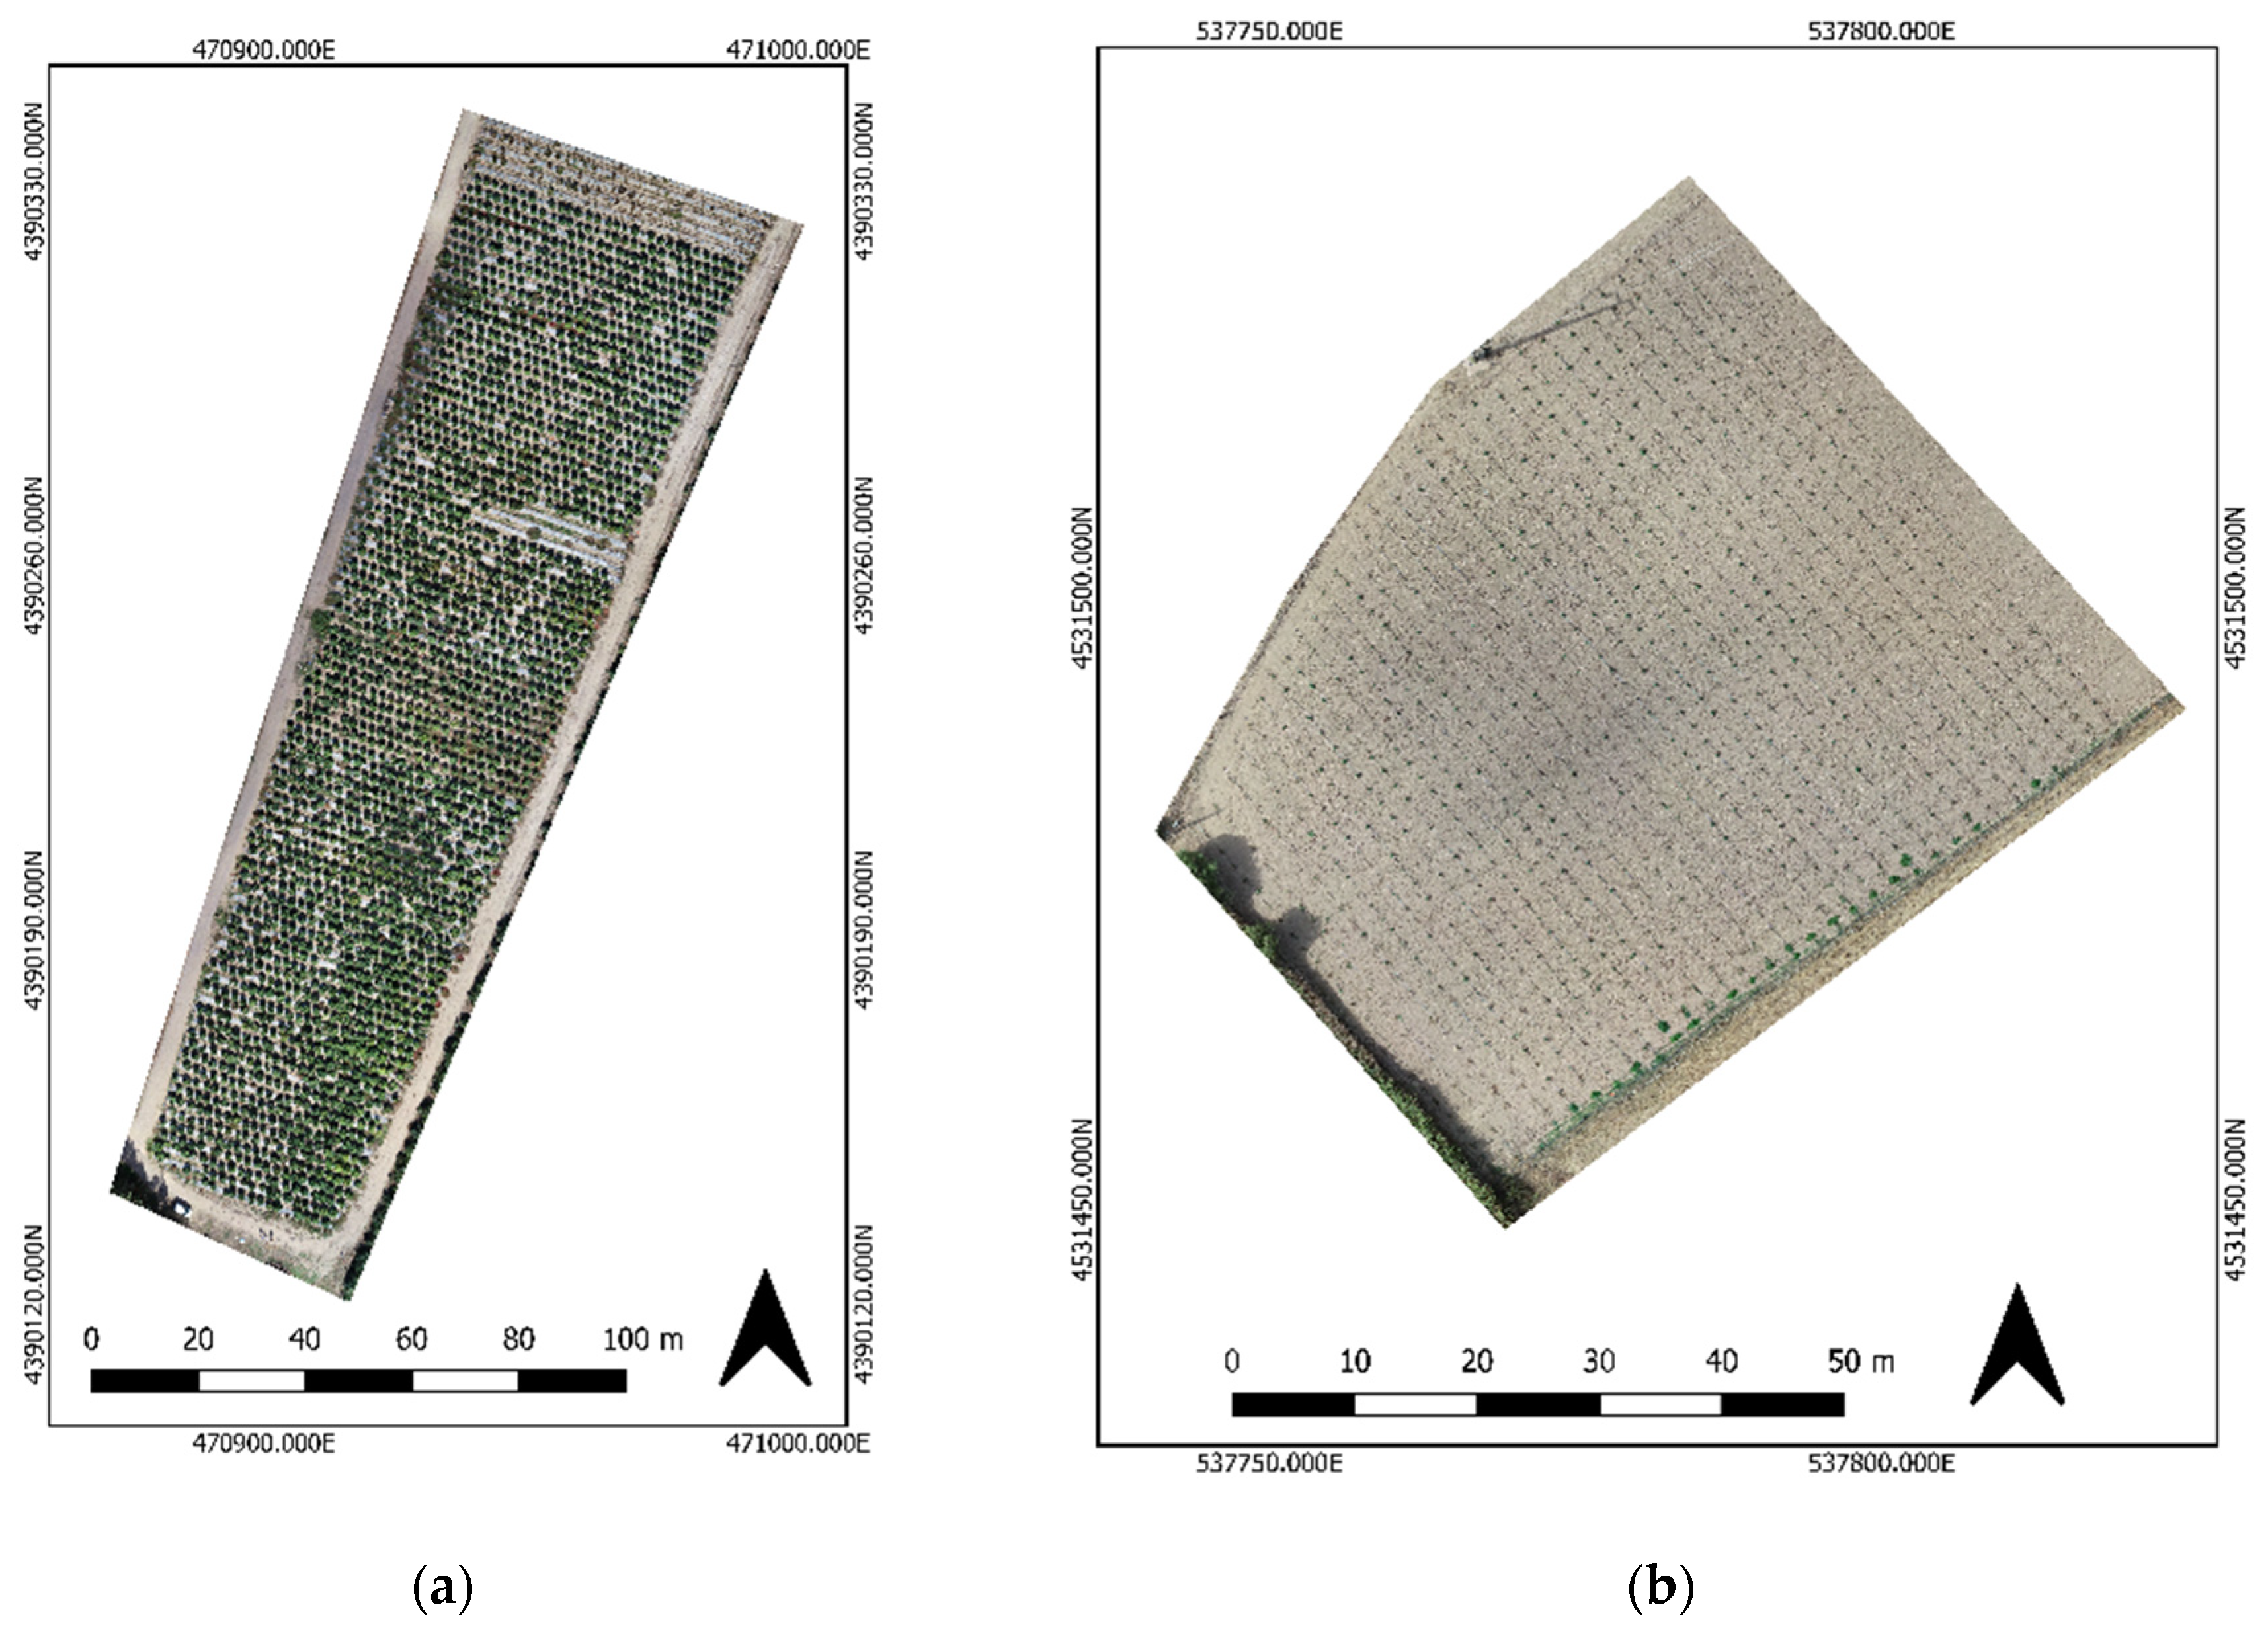
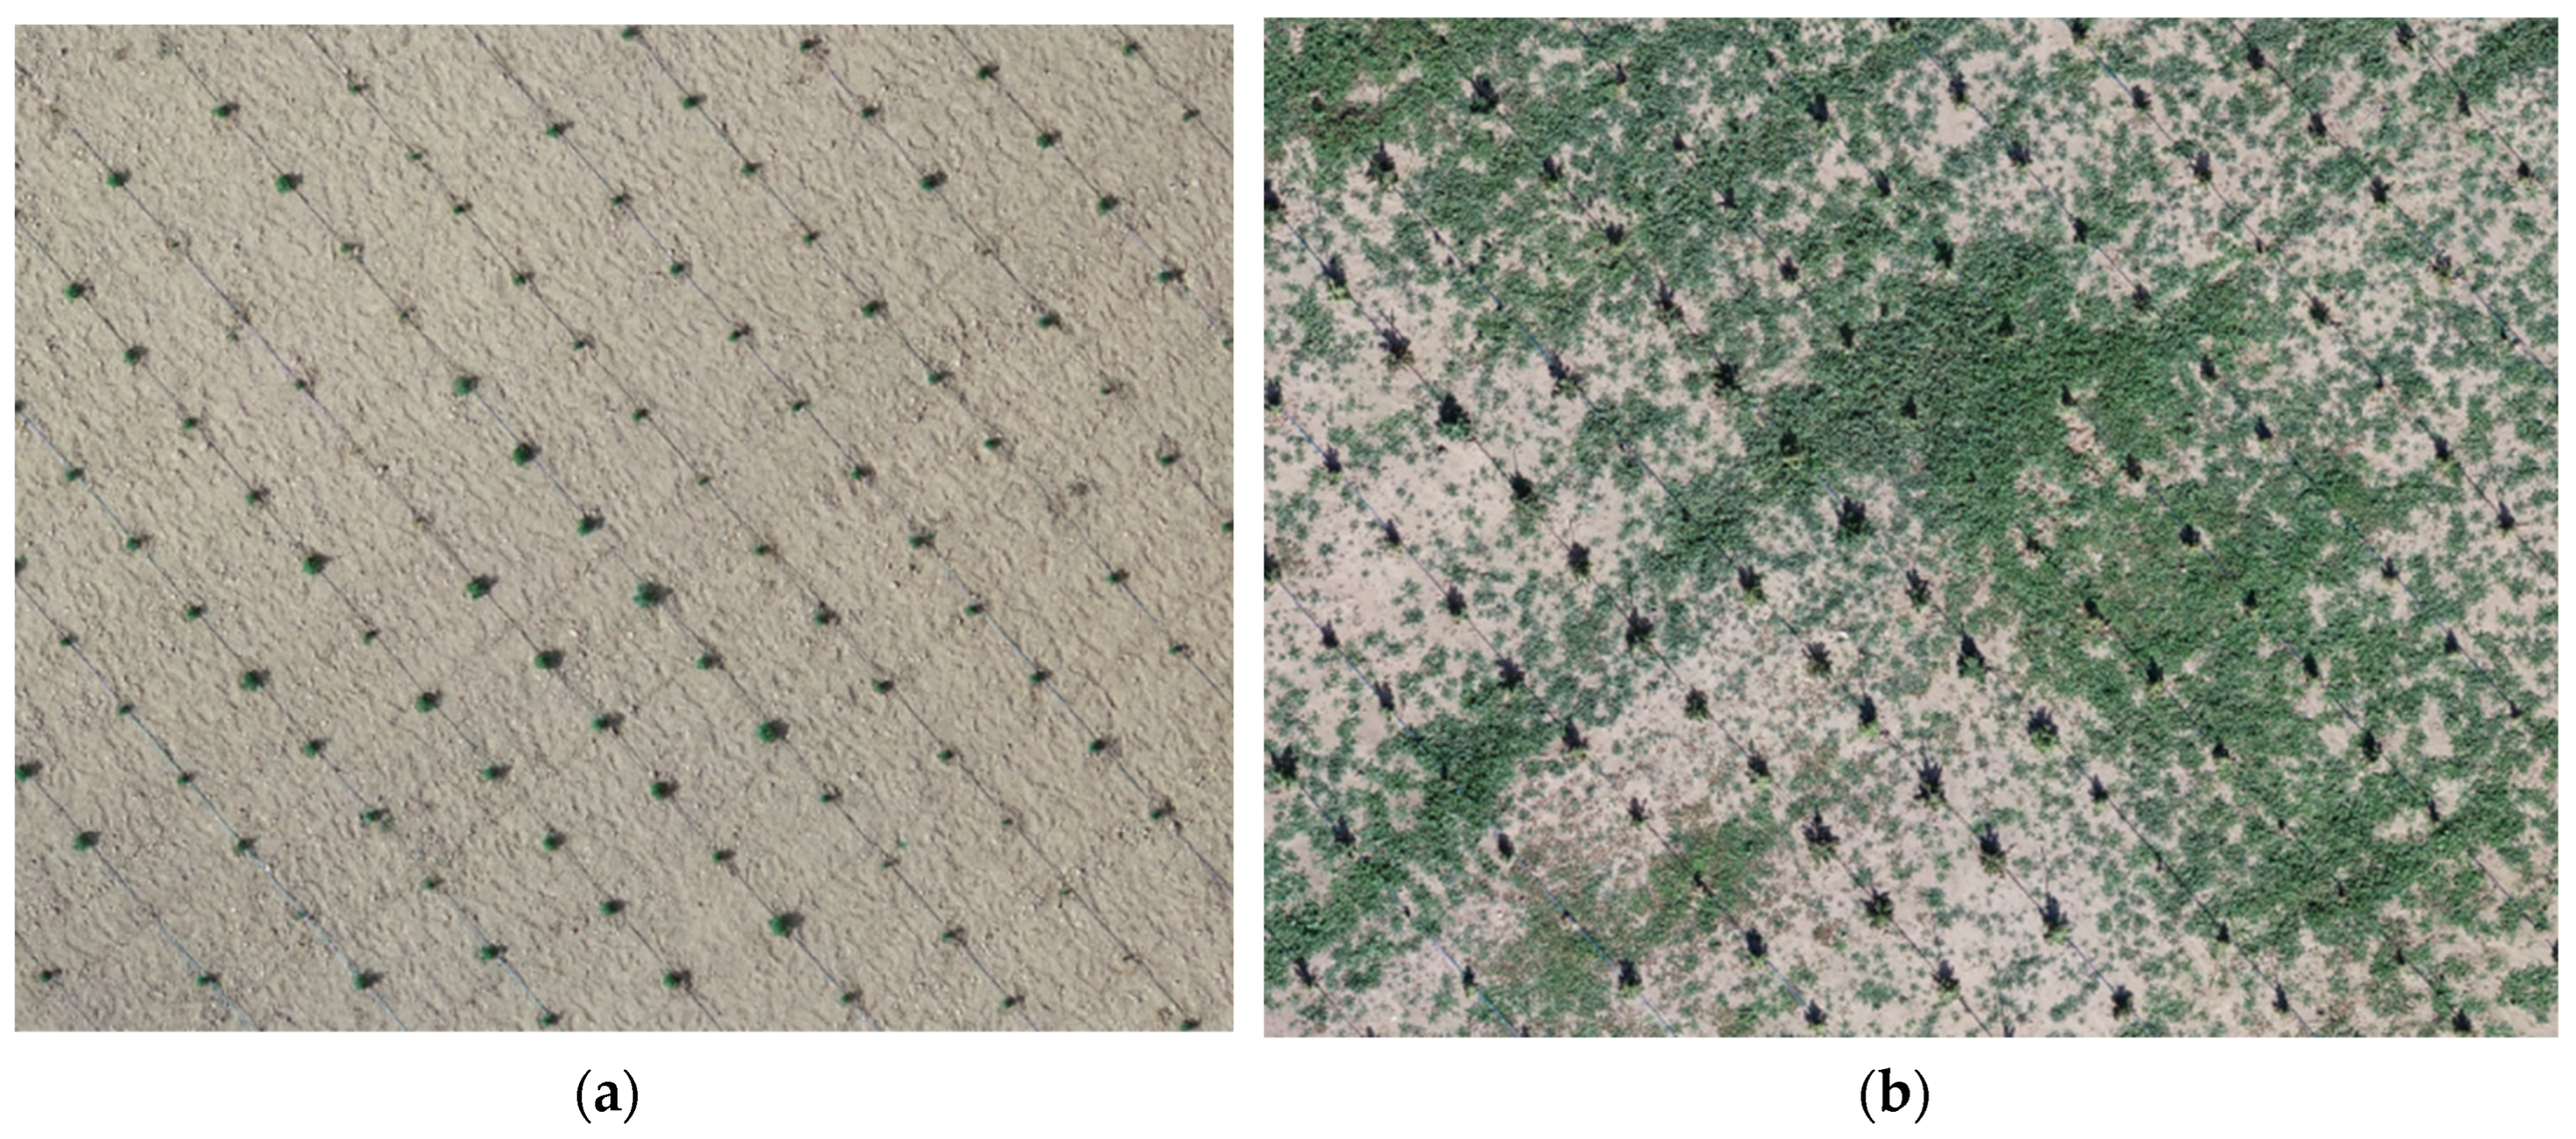
Experiments took place in two study sites: Olbia (North-East Sardinia, Italy, Lat. 40° 93’ 37”; Long. 9° 44’ 88”, WGS84 EPSG 4326, at 37 m above sea level) and Guspini (Sud-West Sardinia, Italy, Lat. 39° 66’ 16”; Long. 8° 66’ 12”, WGS84 EPSG 4326, at 17 m above sea level). In Guspini, 2500
Canapa sativa L. (cv. Kompolti) plants were planted (1.8 m x 2.0 m) on a 10000 m2 surface (
Figure 1a), where another scientific survey was already running to monitor the phenotypic plants’ response to different agronomic management combined with inoculation of rhizobia and the use of mulching cloths to limit the growth and development of weed on the rows. Another 1000 plants (2.00 m x 1.50 m) of the same cultivar were planted on a 3200 m
2 surface in Olbia (
Figure 1b).
The experimental field in Guspini consisted of four plots (two of them were replications of the same treatment). Treatment 1 comprised mulching cloths and rhizobia inoculation, treatment 2 consisted of no mulching cloths and rhizobia inoculation, and treatment 3 comprised mulching cloths and no rhizobia inoculation.
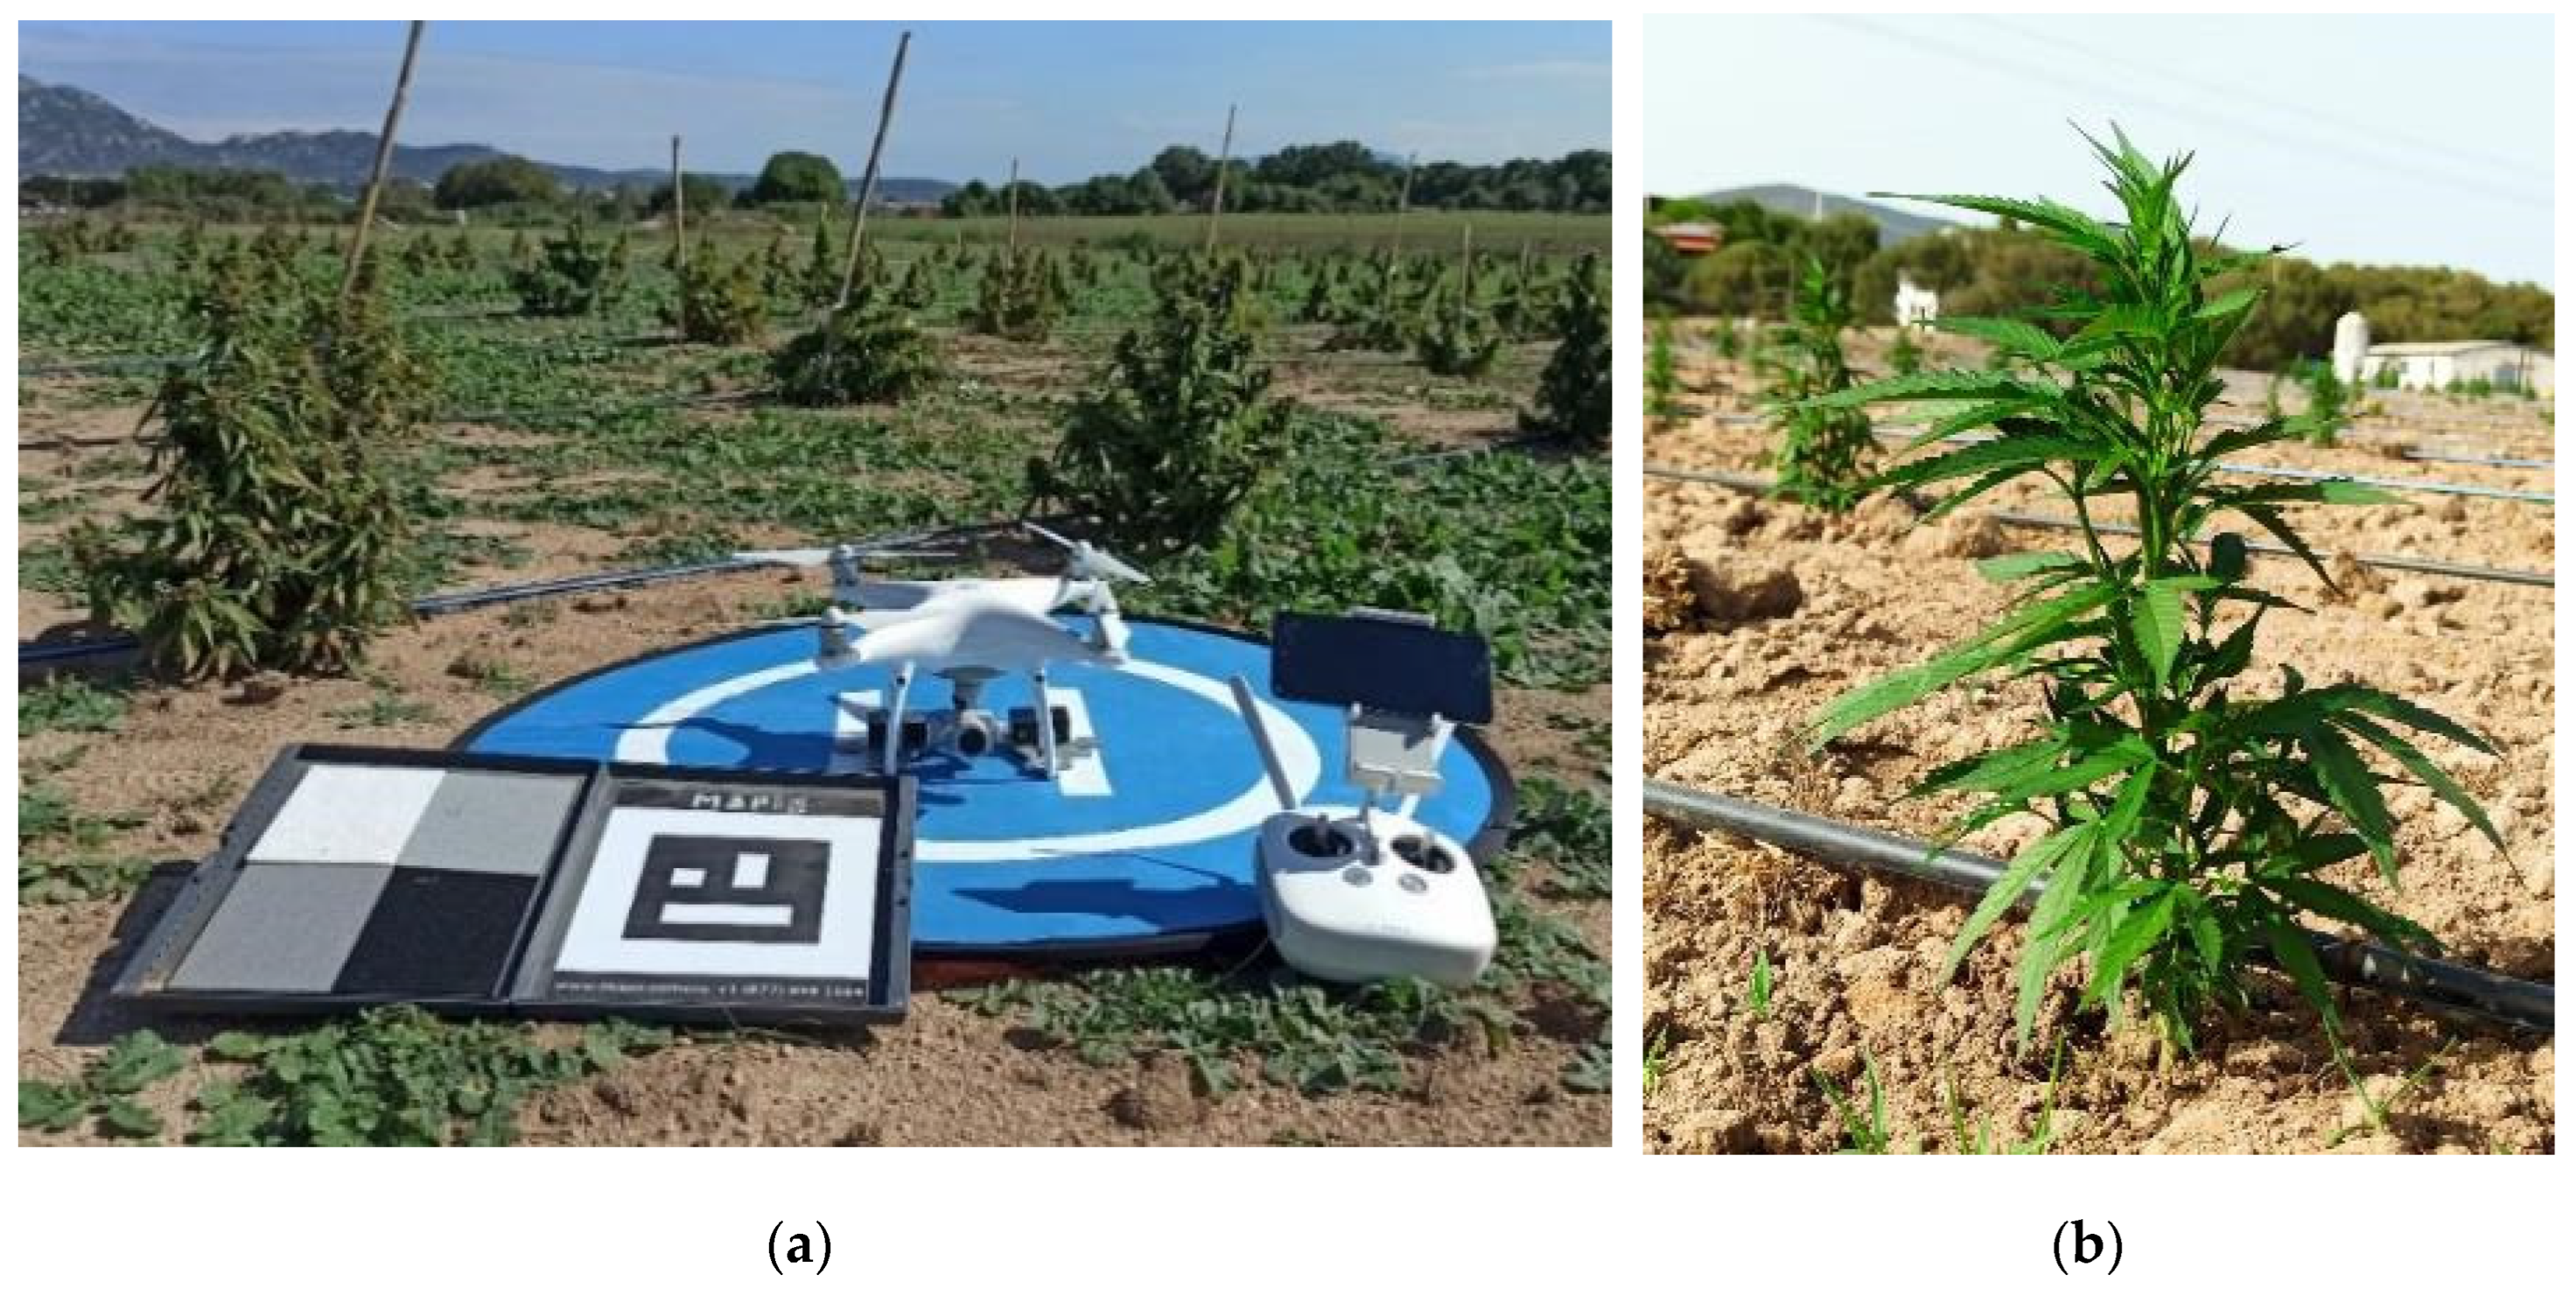
Due to the stunted growth of plants in the Olbia study site in the last phenological phases (
Figure 2b), the research team decided to execute a single flight over the second study site (Guspini) to test the proposed techniques on “normal” grown plants and compare the results with smaller plants of Olbia.
2.2. UAS Platform and Implemented Sensors
The UAS DJI Phantom 4 Pro (
Figure 2a) equipped with RGB CMOS 1" sensor of 21 megapixels resolution, 8.8 mm/24 mm (35 mm format equivalent), Field of View (FOV) 84°, and f/2.8-f/11 autofocus 1 m-∞ was deployed to perform the remote photos acquisition. Two Mapir Survey 3 multispectral cameras were implemented on board of the UAS. One equipped with a Red Green NIR (RGN) filter, able to capture the reflected light of 660 nm (Red), 550 nm (Green), and 850 nm (Near Infra-Red), and the second with a Red Edge (RE) filter for 725 nm light detection. A GNSS Reach RS+ (Emlid) connected to an NTRIP correction system was used to record X-Y coordinates of six Ground Control Points (GCPs) in Olbia and 10 GCPs in Guspini for accurate orthomosaics orthorectification. UAS flights were planned through the DJI Pilot android app (flight details are reported in
Table 1).
2.3. Surveying Dates
In Olbia site were performed multiple flights during crop’s development phases. The first flight (7 July 2021) aimed at obtaining the digital model of the reference ground elevation (Digital Terrain Model, DTM). The absence of plants helped simplify and optimize CHM calculation for the next surveying days. On this date, the UAS was equipped with only RGB cameras. The second flight was performed on 12 August 2021 (BBCH 25 [
27]). This surveying was crucial for obtaining orthomosaics where the only vegetation in the field was the small Canapa plants without any weeds. Thanks to this specific approach, it was possible to apply the segmentation technique based on vegetation indexes. During this flight also multispectral cameras were implemented. The last two flights, executed on 30 September 2021 (BBCH 55) and 11 October 2021 (BBCH 67) respectively during the swelling of inflorescences and few days before harvesting, were intended to compare and verify the performance of the two segmentation techniques for plant detection. For each flight, except the first one with the bare soil, RGB and multispectral sensors were employed, capturing the reflected radiance in red, green, blue, near infra-red (NIR), and RE spectra.
The Guspini survey was performed only on 8 October 2021, a few days before harvesting. The purposes of this flight were the same as described for the other study site.
The flight conditions faced during the experiments were optimal: sunny days, clear sky, and strong wind absence at both sites.
2.4. Software Employed
Two software were used during the experiments: Agisoft Metashape (a structure from motion software) to process the UAS’s images and obtain the digital models, and QGIS to analyze the orthomosaics and perform the segmentation.
2.5. CHM Segmentation of Canapa sativa L.
CHM segmentation is based on the height difference between the soil surface plus the overlying Canapa plants (Digital Surface Model, DSM) and the soil (the DTM), performed using the raster calculator tool in QGIS.
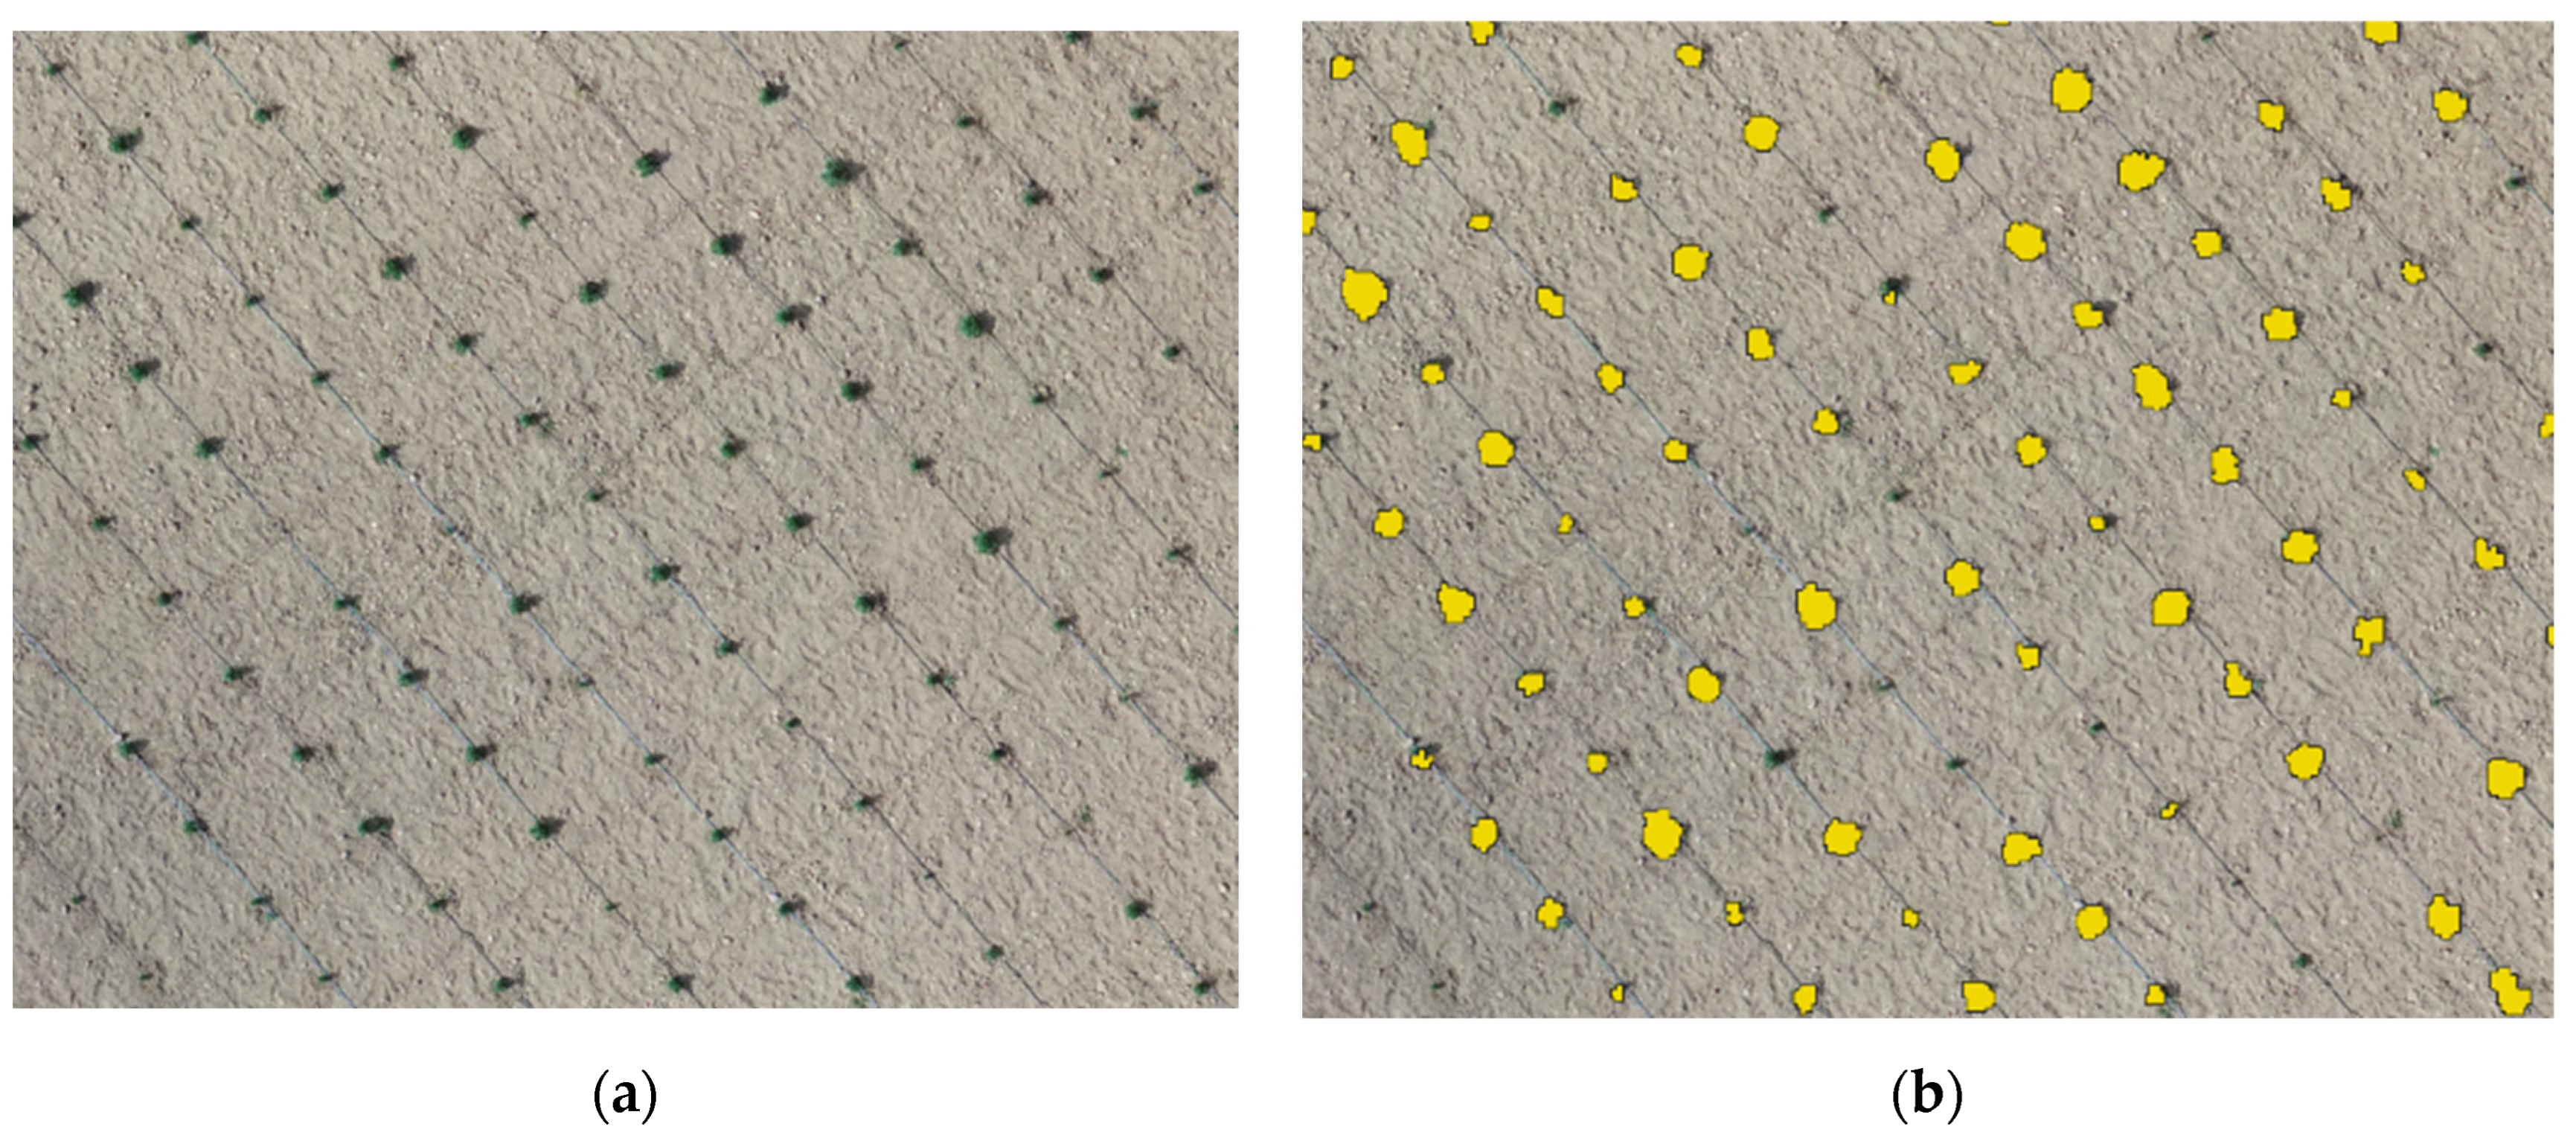
Figure 3.
A portion of the study area (a) and the yellow polygons obtained through Canopy Height Model (CHM) segmentation (b) after the manual removal of undesired polygons. The image highlights how the CHM segmentation technique helped to detect most of the plants.
Figure 3.
A portion of the study area (a) and the yellow polygons obtained through Canopy Height Model (CHM) segmentation (b) after the manual removal of undesired polygons. The image highlights how the CHM segmentation technique helped to detect most of the plants.
The raster calculation tool was used to apply threshold height of 0 m to separate plant pixels from soil pixels. This value was chosen because of the best performances in detecting Canapa plants. Thanks to the conversion of the obtained raster into a vector layer, it was possible to obtain the detected plants number. The side effect was represented by the detection of other objects besides plants like stones, weeds, part of the soil, etc. Of the multiple threshold heights tried during the elaboration process, no one was able to detect only
Canapa Sativa L. plants and no secondary elements. For this reason, once found the best threshold height based on the bigger number of plants and the lowest number of secondary objects, it was necessary to execute a manual cleaning procedure to remove all noise polygons from the study area (
Figure 2).
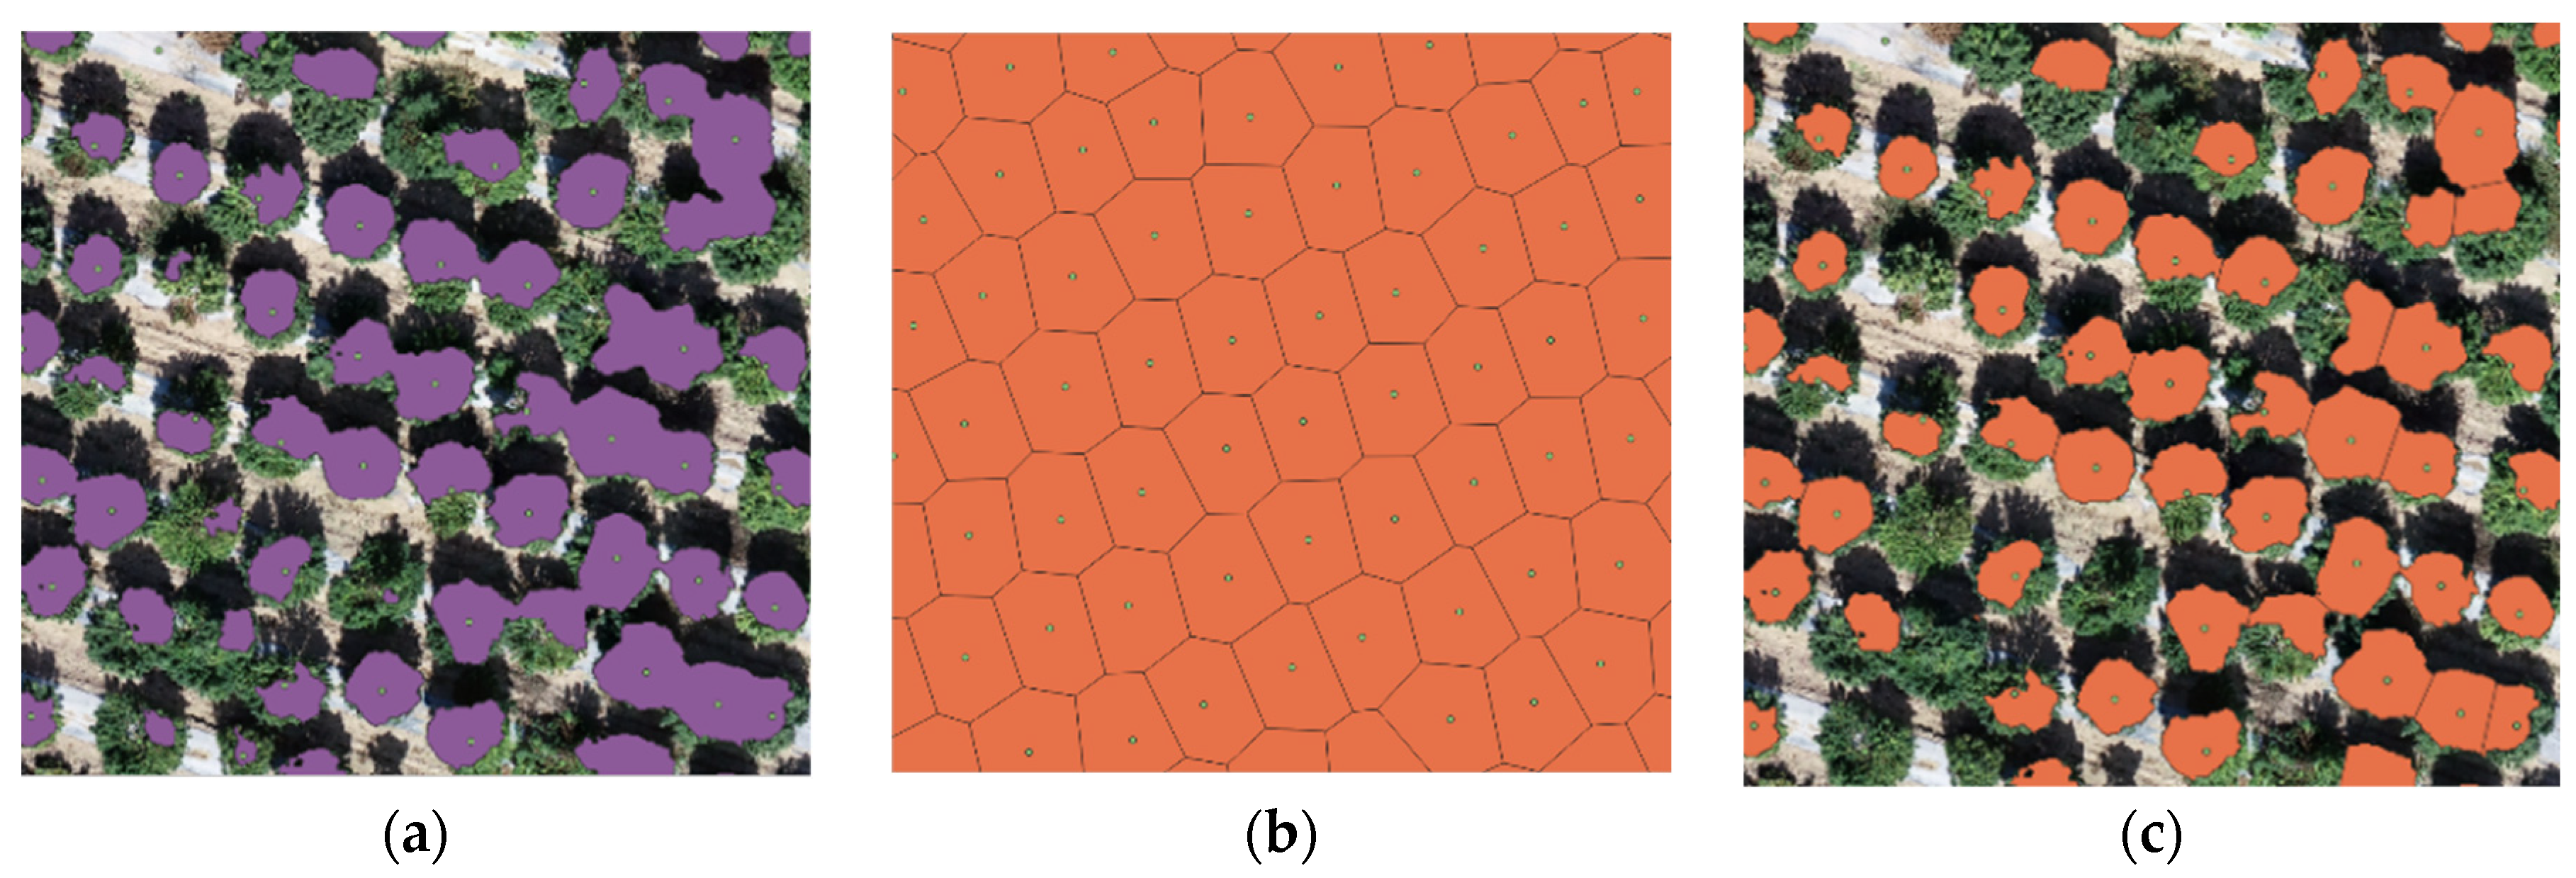
For Guspini plants segmentation, the challenge derived from the presence of grown entangled plants. The segmentation provided several polygons consisting of several plants each, resulting in problems and errors in estimating the number of plants (
Figure 4a). The problem was overcome by using the Voronoi tool in QGIS. Starting with the manually added plant positions, it was possible to create a Voronoi map with a polygon number equal to the exact number of plants (
Figure 4b). The creation of the Voronoi map was possible only thanks to the manual positioning of all plants. The previous polygons obtained with the CHM segmentation technique were then clipped using the Voronoi map (
Figure 4c).
The result shows the ability of this procedure to separate all merged plants in the same polygon and give a more reliable plant number. In the discussion section the problem related with the positioning of all Canapa sativa L. plants will be discussed to reduce the effort needed to place manually each plant and to automatize the process.
2.5. Otsu Thresholding Technique for Canapa sativa L. Segmentation
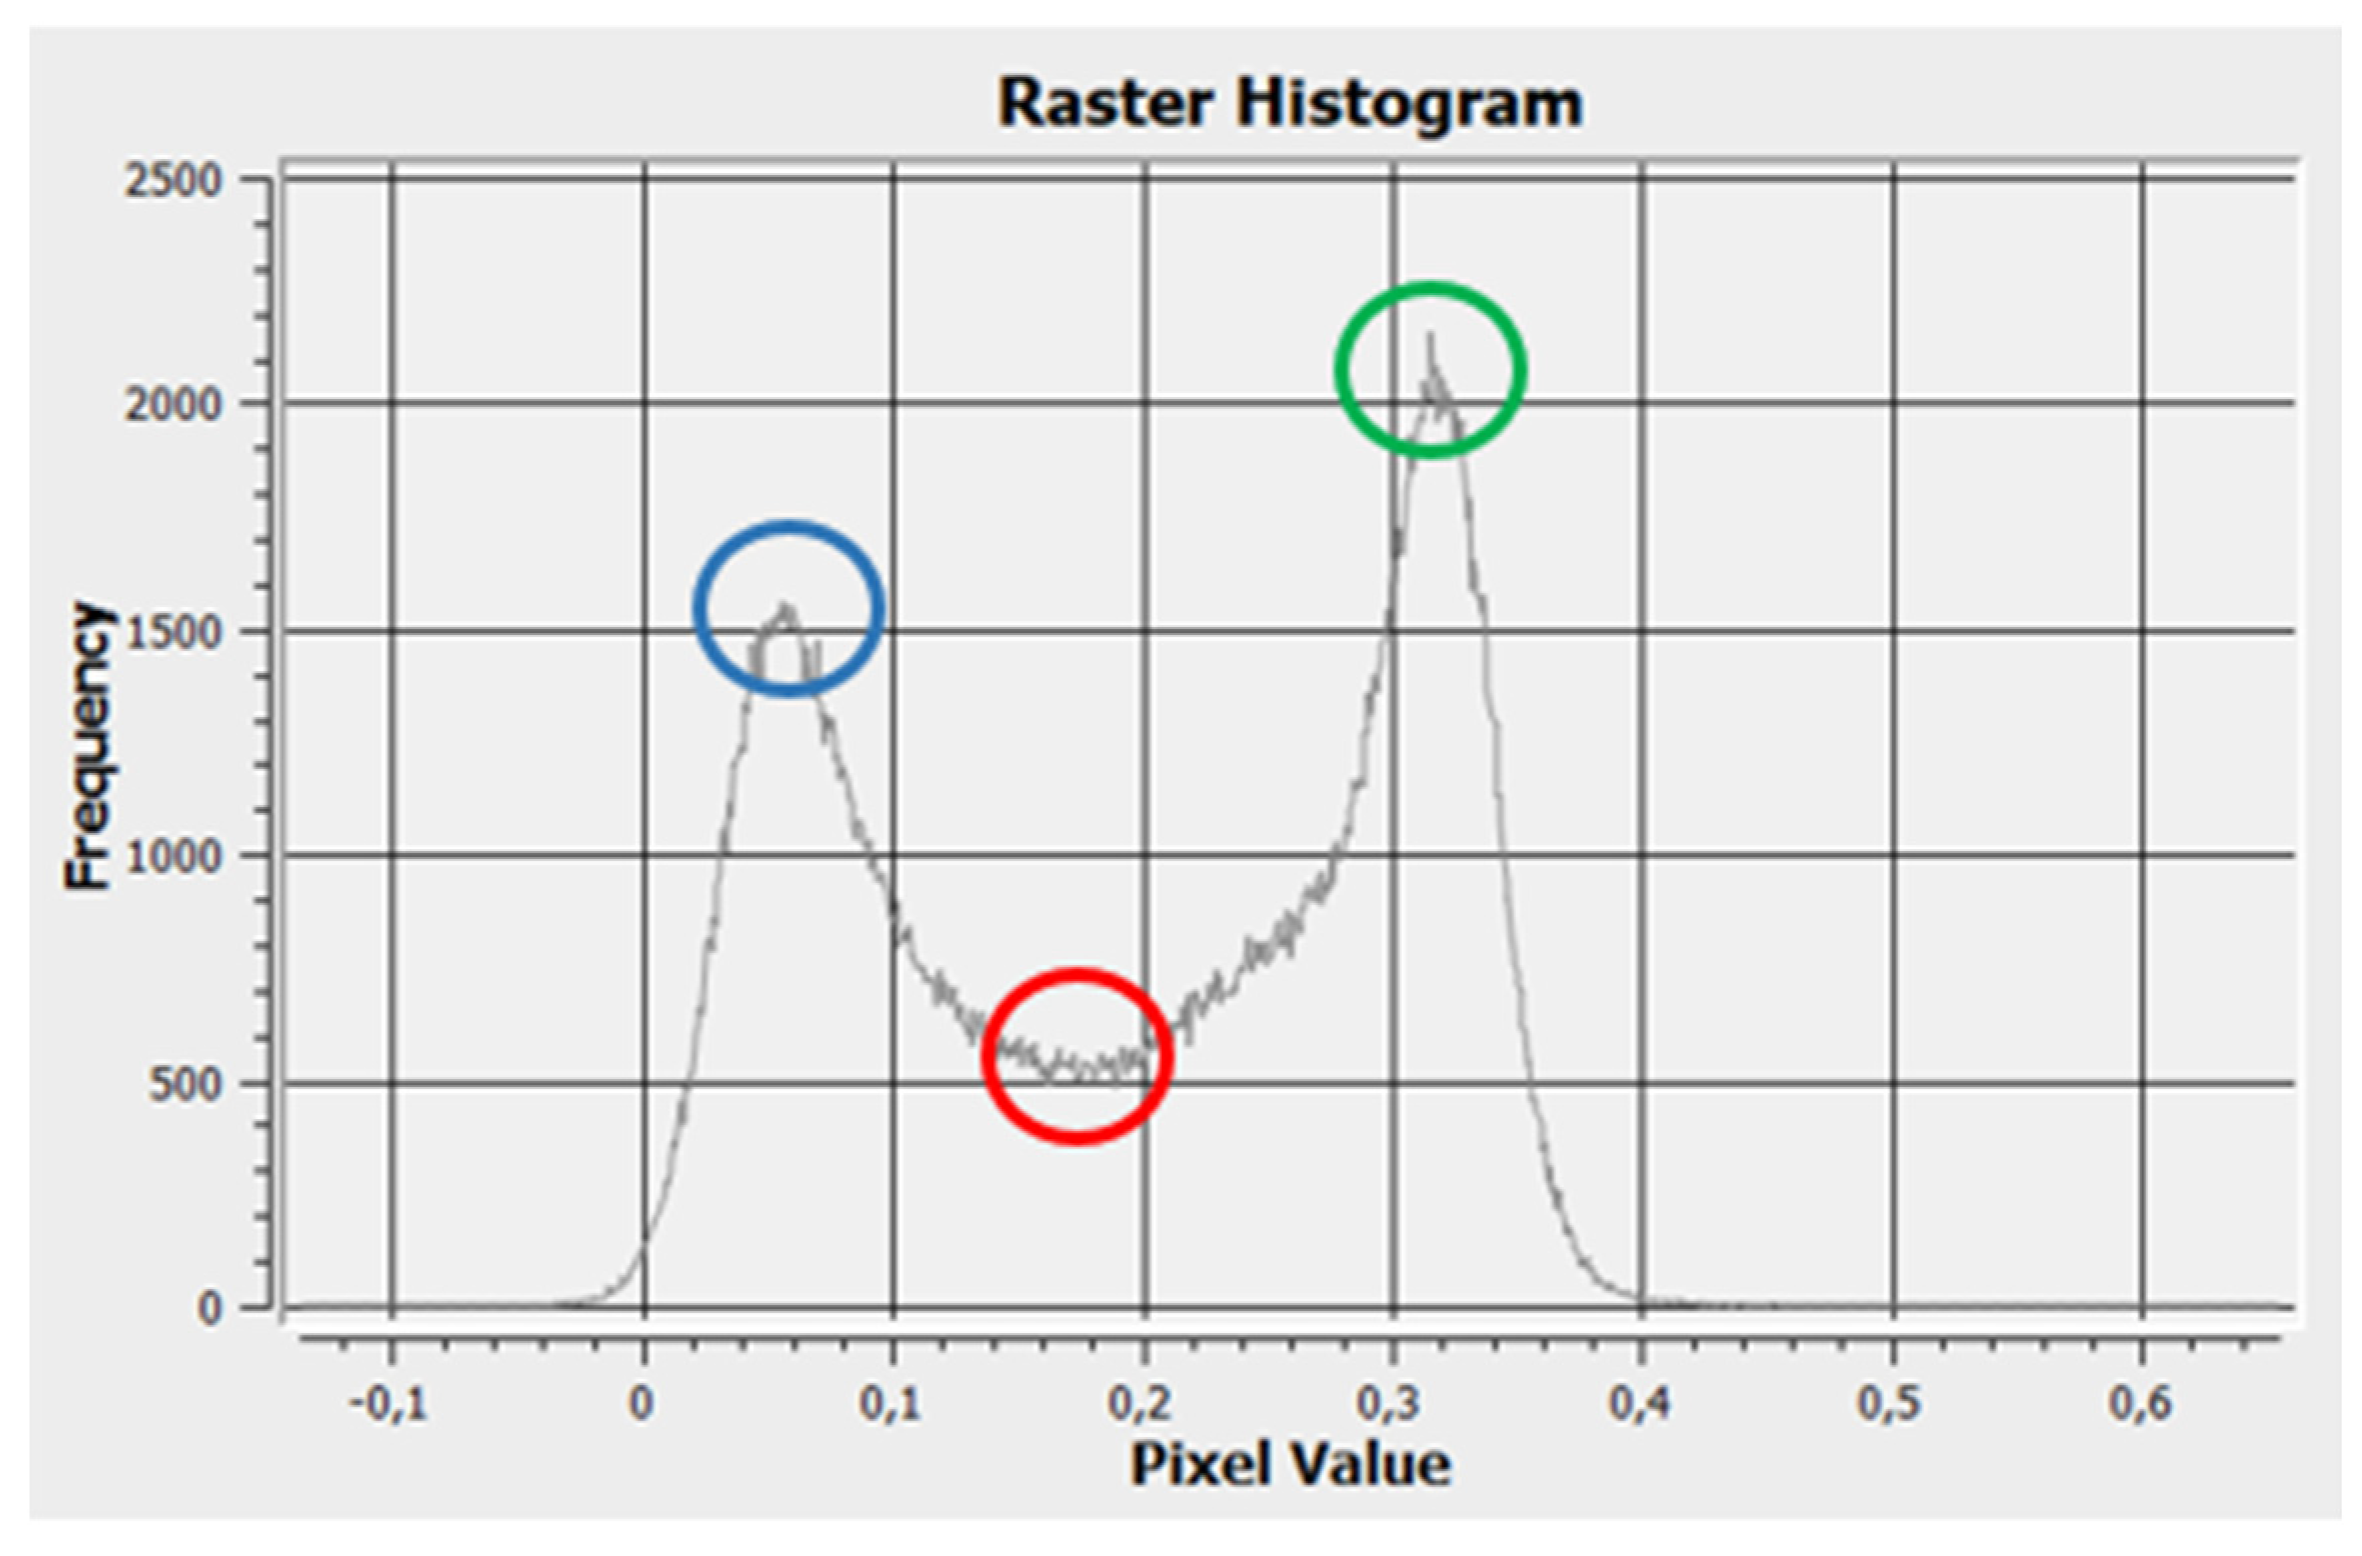
The Otsu thresholding technique derived by the reflectance distribution of vegetation indexes is based on the ability to differentiate between soil and plants' pixels. Starting with the analysis of the vegetation indexes’ histogram created on QGIS, it was selected using a python script. The 0.15 NDVI value was obtained as threshold (
Figure 5).
Using the raster calculator tool, a new raster able to differentiate between plants and soil pixels was created. The polygon cleaning procedure is the same described for the CHM segmentation procedure. Due to the massive presence of weeds surrounding Canapa plants, it was possible to perform this technique only on the first surveying date in Olbia. The other dates were characterized by the presence of large zone constituted mainly by weeds (
Figure 6).
2.6. Otsu Thresholding Technique for Canapa sativa L. Segmentation
The detection performances evaluation of the proposed supervised procedure started from the polygons derived by plants segmentation. The digital models used for the elaboration were 3 for Olbia and 1 for Guspini study sites. The possibility to use 3 digital models in Olbia was crucial to evaluate the performances of the missing plant detection procedure through the developing stages of the crop. The 8 October 2021 model obtained for Guspini had the objective of evaluating the procedure in a different site and comparing the results with the ones from Olbia in the days before harvesting with different volume growth of plants (small plants for Olbia and well grown plants in Guspini).
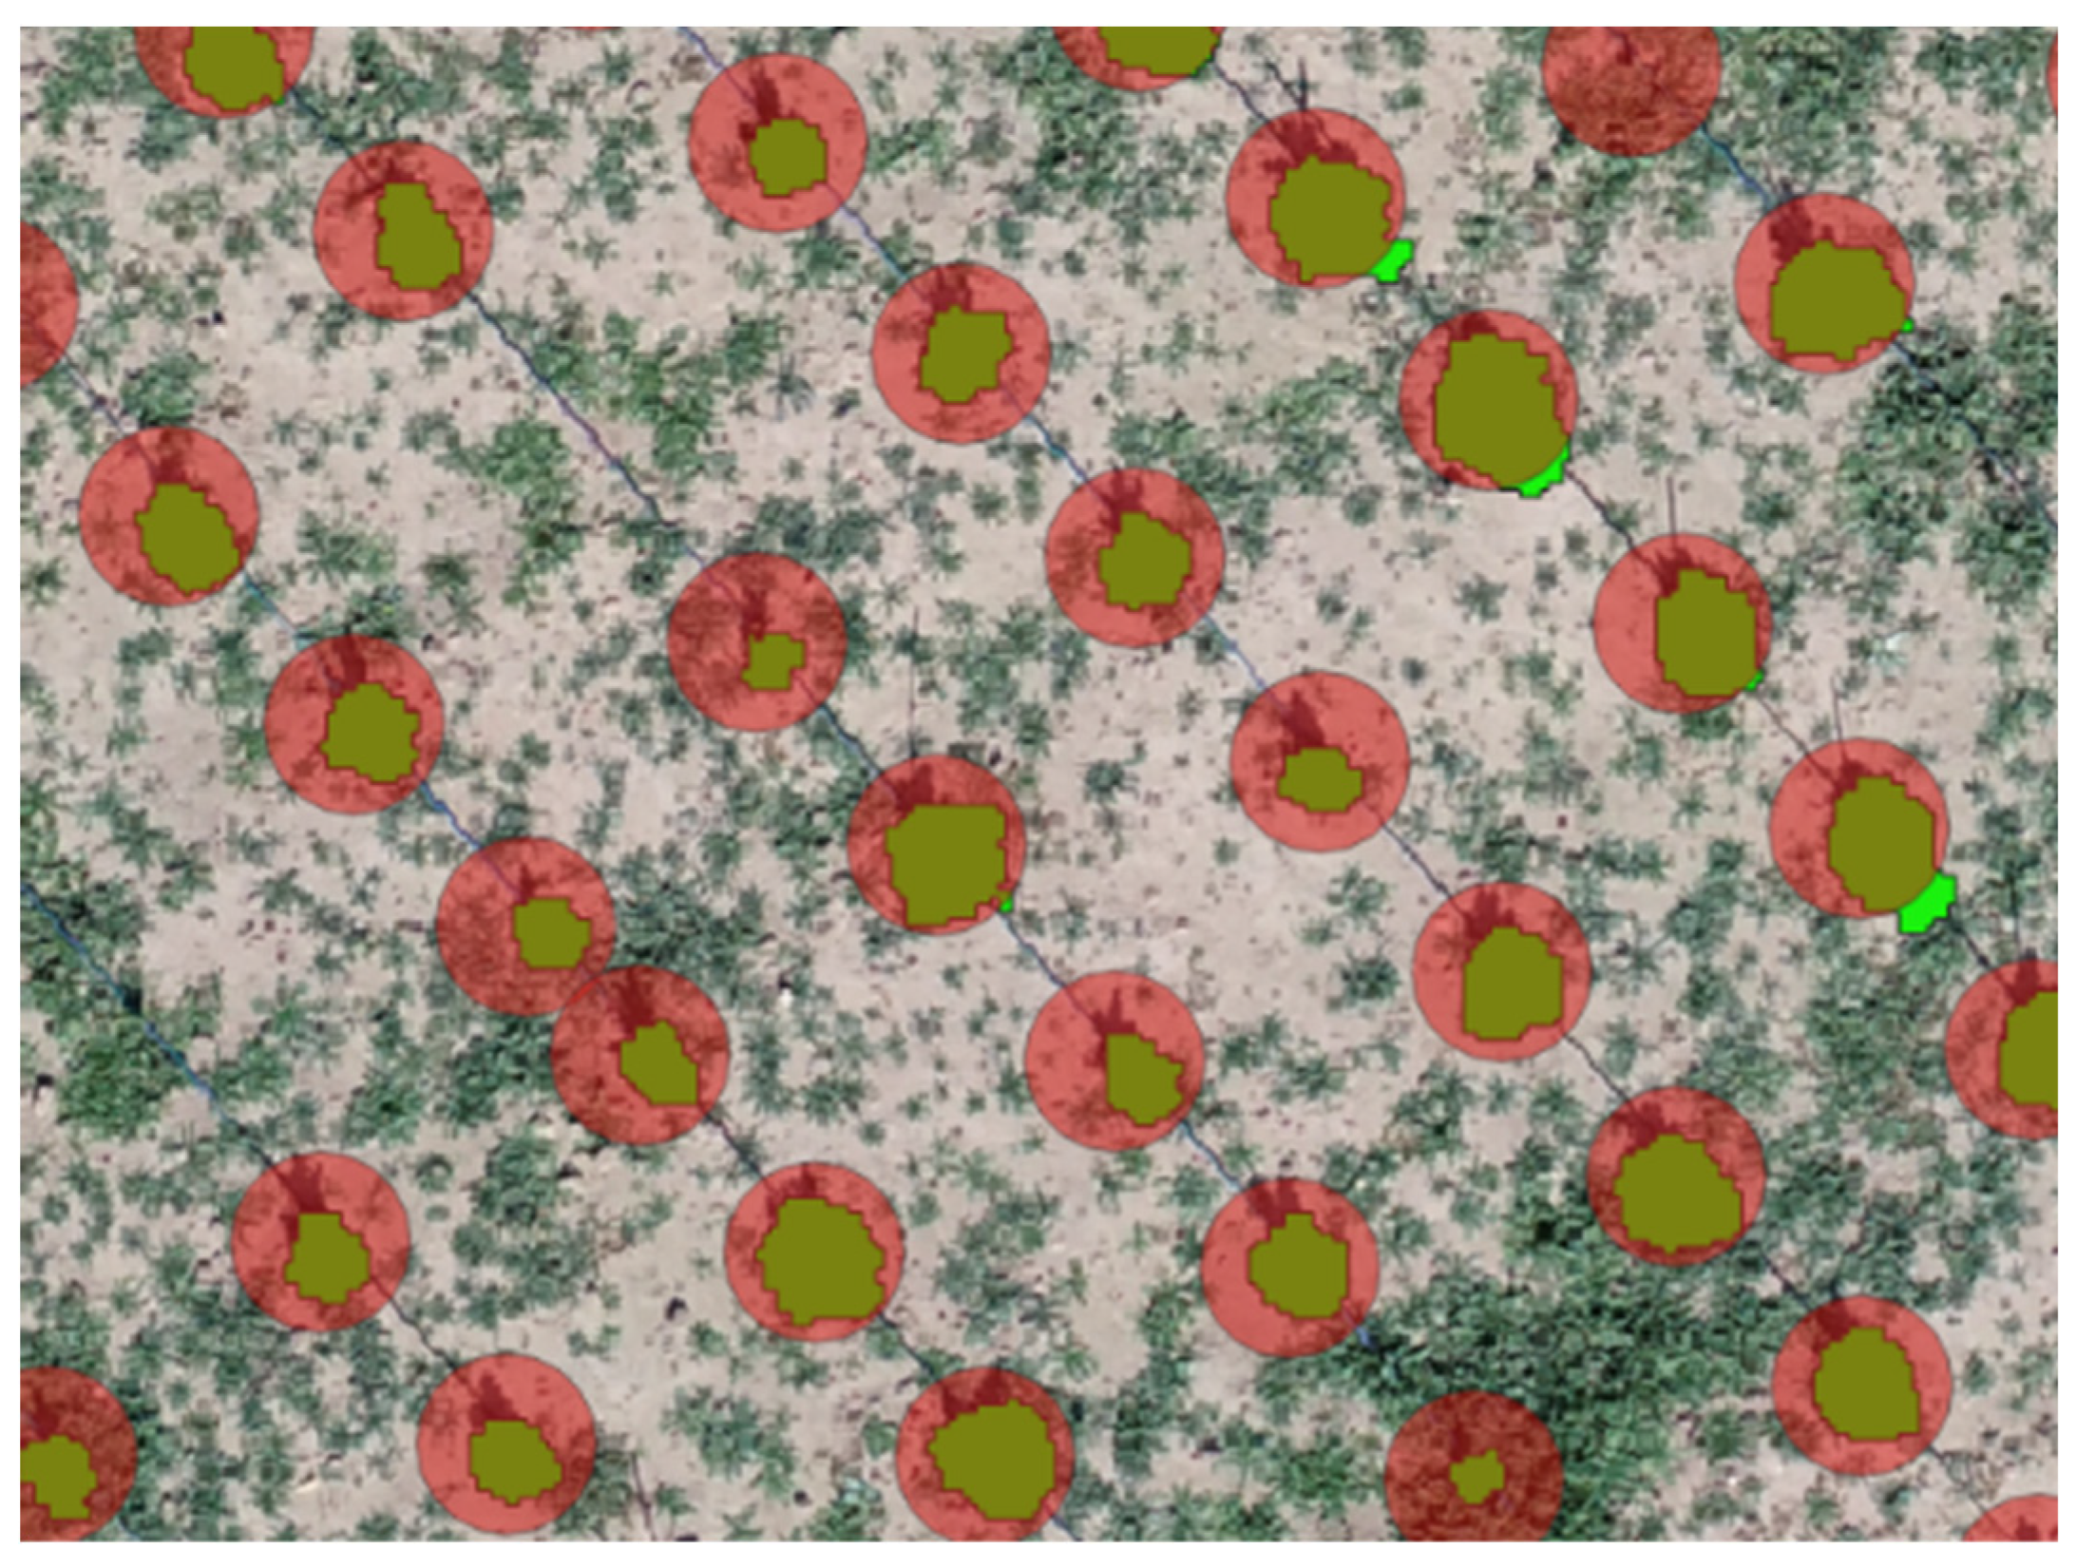
The first step for the performance evaluation was represented by the segmentation procedure described in the previous two chapters. The next phase regarded the creation of circular buffered plant positions derived from the buffered plant position inserted manually. The diameter of each buffered plant positions was 0.5 m (this value was selected based on the planting distance). This last procedure was essential to be completely sure of overlapping the small Canapa plant polygons created during the segmentation process and not perfectly positioned over the related plant position as shown in
Figure 7.
Thanks to the tool “extract by location” in QGIS and the two overlaying layers, it was possible to automatically distinguish between detected Canapa plant (true positive) and the sum of missing and undetected plant (respectively true negative and false negative). This process is based on the overlapping between green plant polygons, extracted by the segmentation process, and the red circles buffered plant positions inserted manually (sure position of the plants after the plantation) to select only the plants still present in the field. If the buffered plant position corresponded to a segmented plant, this polygon was counted, otherwise, if no segmented plant was selected by the buffered plant position, it was counted as a missing/undetected plant. This process was performed for plants segmented by Otsu and CHM methods in both experimental study sites.
The last step regarded the missing plant detection process performance through the following definitions:
True Positive (TP), polygons detected through the segmentation procedure that are effectively Canapa plants;
True Negative (TN), Canapa plants that were not detected using segmentation techniques and effectively are not present into the field and considered as real missing plants;
False Positive (FP), polygons recognized as plants that are not Canapa (e.g., weeds, rocks, etc.);
False Negative (FN), real Canapa plants present in the field that were not detected by the segmentation process and classified as missing plants.
The detection accuracy was also calculated (equation 1) and reported in Table 4 in the results section:
3. Results
3.1. Segmentation Results
Table 2 reports the two segmentation techniques results. Where the “Plants” indentation refers to the number of plants present in every single date of survey during the growing season and manually inserted in QGIS
; “segmented polygons” refers to plant polygons generated after the segmentation procedure
; the “plant polygons” are the plants obtained after the manual deletion of all the polygons representing extraneous objects (FP). The obtained results show how the value of segmented polygon is a counting estimation close to the real number of plants present in the field (Ground Truth). Nonetheless, a fair number of polygons does not include a plant, forcing the research team to execute a manual removing, decreasing the number of detected Canapa plants inside the field.
If only the real plants values are considered, the number of detected plants tends to increase during the growing season, reaching the 86.6% and 84.7% of existing plants respectively in Olbia and Guspini study sites. It can be noticed how the Otsu technique has been able to perform the segmentation only in the first date reaching a 95% of detected plants. This result is particularly interesting since it allows the obtainment of the position of each plant at the beginning of the growing season. Such information is crucial to speed up the detection process and the multispectral analysis in the following surveying dates. In the remaining dates it was not possible to get any reliable detection results due to the presence of weeds covering the surface between the Canapa plants.
On the contrary, the CHM technique showed better performances in the latter phenological phase of plant development.
Table 2 helps have a better understanding of how the segmentation techniques perform in terms of created polygons. Despite the improving performances, it can be stated that without a manual supervision plants detection would be compromised by the presence of FP polygons.
3.2. Detection Performances
Table 3 reports the obtained results of the detection procedure. The TP, TN, and FN metrics (already defined in section 2.4.4) are also reported in percentage referring to the plants' number during the survey date. FP values are equal to zero in each date thanks to the manual removal executed by the operator. For this reason, they were not considered in plant detection performances (
Table 3) since they were completely manually removed. This result helps define the segmentation techniques’ performance to detect Canapa plants. Otsu technique showed the highest performances in terms of correctly detected plants (TP) compared to the CHM during the first surveying date. The number of TP tends to decrease in the second date due to the presence of weeds in the field and the need to switch to the CHM technique, not the best choice when the size of the plants is still reduced.
Voronoi techniques described in section 2.5 helped gaining better results, moving from 1844 (84%) to 2039 (93.7%) correctly detected plants. During the growing season many plants died, decreasing the total number in the field. This reduction was detected thanks to the system described in section 2.6 and showed that the proposed techniques can detect missing plants (TN). In the first date FN values derived by CHM are higher than the one obtained though the Otsu technique, confirming the bigger reliability of Otsu at the beginning of the growing season. Again, Voronoi technique helped improving the detection performance by reducing the FN values in Guspini.
Table 4 reports the accuracy results based on the equation reported in section 2.6. Results confirm what stated for
Table 3: Otsu is the best segmentation technique during the early season reaching 0.95 accuracy (considerably higher compared to the CHM); the accuracy reached high performance during the whole growing season; Voronoi technique sensibly improved the accuracy reaching a 0.94 value in Guspini.
3. Discussion
In relation to the first objective, regarding the efficiency evaluation of the two segmentation techniques, the two techniques supplied good results in both study sites characterized by different conditions. OTSU method is preferable in the first phase when only Canapa plants are present and should be used as substitute of plants manual positioning procedure. As highlighted in the materials and methods section, the entire process of detection performances evaluation was possible thanks to the manual positioning of plants location. Such procedure is time-consuming and non-sustainable for high extension surfaces. The possibility of using the OTSU technique to avoid long preliminary procedure, would allow the obtainment of almost all plants positions, followed by a manual supervision and the additional plant positioning (if needed). The CHM segmentation technique was revealed to be preferable when plants volume increase, resulting in a higher percentage of classified polygons. The presence of weeds (generally of smaller size) is overcome by considering only pixels over a specific height Above Ground Level (AGL). Both segmentation procedures could be applied to crops that have similar conformation and are planted following the same criteria.
Otsu segmentation allowed to precisely segment plants only on the first survey date (12 August 2021) in Olbia because the only visible vegetation was represented by Canapa sativa plants. For the other flights, the same technique was highly influenced by the presence of weeds easily confusable with the crop. For these reasons Otsu technique was considered unreliable after the first development phases (
Table 2). CHM segmentation technique, if compared with Otsu method in the first date (12 August 2021), resulted as unreliable due to the limited height of the plants and the flight height of the UAS. A highest resolution sensor would have helped to increase the monitoring operation performance. In
Table 2 of the total 746 generated polygons, the Otsu technique detected 713 of them (95.5 %), against the 477 polygons (63.9 %) detected through CHM technique. Based on the limits described for the Otsu technique, the CHM showed to be preferable when plants’ volume increase, moving from the 63.9 % of plants detected in the first date on 12 August 2021, to 83.2 % on 30 September 2021, and 86.6 % on 11 October 2021. In Olbia the chosen CHM threshold height of 0.0 m showed the lowest value of undetected plants, while in Guspini 0.6 m was chosen for similar reasons: lower values of height included weeds and extraneous object, while higher threshold height excluded multiple Canapa polygons.
OTSU was able to detect the 95.6 % of plants present in the field in Olbia on 12 august 2021, while CHM the 93.7 % in Guspini on 8 October 2021. These two results are essential to confirm how the combination of the two techniques could allow high detection performances in normal scenarios, like the one reported in Guspini. In
Table 3 the CHM segmentation in Guspini detected 1844 plant polygons out of 2175 (84.7%). But thanks to the implementation of the Voronoi tool, the number increased to 2039, with an 9 % increment of detected plants. This result, confirmed also by the accuracy improvement, is significant because Voronoi technique is generally included as a tool in all geographic information system software, so usable without any programming skills.
On 12 August 2021, OTSU and CHM segmentation generated different false negative values, respectively 33 for OTSU and 269 for CHM (
Table 3). The 100% of the undetected plants were false negative, delineating the OTSU technique as the more reliable in the first stages of the crop development when only Canapa plants are present into the field. However, CHM was the only technique capable of performing segmentation when the plants reached larger size and volumes. The undetected plants were represented by a small percentage (referred to the total number of plants) of missing plants, removed or dead after the implantation. The detection system performances increase as the plants’ volume increase.
The accuracy values highlight high detection performances, except for the first survey when the CHM segmentation technique was used. The best accuracy values were reached on 12 August for Olbia and 8 November for Guspini, confirming what stated above. Such high values have been reached because the FP polygons were considered as zero because manually removed. It is worth noting that the real FP values ranged from 173 to 479 in Olbia, and from 288 to 1963 in Guspini study site. In an unsupervised process such values would have severely affected the accuracy performance of detection.
It is relevant to highlight that, the entire procedure of plant detection was based on the manual placement of plants position, hardly replicable in normal situation. This limit could be overcome by using the OTSU segmentation at the beginning of the cultivation season when only Canapa plants are present in the field and use the CHM method to have a more reliable plant detection. To monitor the efficiency of the missing plant detection through the growing season, it is recommended to use the first plant number detection as a reference number to detect where plants are missing.
The proposed procedure is useful to perform spectral analysis of the crop excluding weeds, soil, and extraneous objects from the procedure, but it still lacks in plant borders exact detection. In fact, the polygons generated around the single Canapa plants are far from being perfectly overlaid by the generated polygons, affecting the obtainment of vegetation index data free from soil influence. This limitation is most noticeable in Olbia study site, characterized by smaller plants, than Guspini where the bigger plants were more easily detectable.
One of the possible solutions to increase the accuracy and reliability of the process would have been to reduce the flight altitude AGL, also increasing the detail of the photos. This approach would have probably increased the quality of the process but would also have led to incomparable results with the “normal” flight acquisition setting, making also difficult its evaluation for practical use. Flight height of 40 m resulted suitable for the obtainment of digital models (multispectral orthomosaics, DTM, DSM, CHM), using an average working time of 7 hours for each acquisition date.
Nowadays, new automatic procedure for Plant segmentation and detection based on machine learning approaches are under studies, but they imply complex training, test, and validation process and specific programming skills to be implemented. Even the proposed procedure requires specific knowledge of Structure for Motion and GIS software, but they are generally provided with a user-friendly interface and wide libraries of tools that help simplifying the process. It is worth noting that in an unsupervised process the high FP detected values would have severely affected the accuracy performance of detection. Even if faster and more intuitive, the overall described results are not reliable, unless performed under the supervision of an operator. In future agriculture scenarios, characterized by autonomous vehicle implemented with sensors, solutions involving machine learning based object detection systems could represent the best option to perform real time operations [
22,
23,
24,
25,
26]. The major limit is still related to the obtainment of photo datasets and their labeling, crucial operation for machine learning processes The datasets used for the development and testing of algorithms are often small and private, hence research teams have to rely on a small amount of existing open-source data sets characterized by the absence of a standardized format that may influence the learning effect [
28]. If datasets are not always available, approaches to facilitate labelling could represent a game changing tool [
29]. The proposed methodology represents a preliminary approach for the development of an automatic procedure for UAS images labeling support, creating the labeling shapes needed to train and test a detection network, or to provide candidate regions [
25,
26,
30]. Labeling procedure is essential for the obtainment of a well-trained network and represents a laborious operation carried out by operators. Such approach could help to increase the quality and speed up the labeling operation by providing multiple polygons tracing the target plants’ outlines.
The processes described in the work are finalized to provide the farmer of important information as decision support system during crucial crop development phases like size, height, stress, missing plants, etc. In the future such procedures will be compared to verify the real advantages of a machine learning process in terms of detection performance and time required to obtain the results.
5. Conclusions
The comparison between two segmentation techniques for the detection of Cannabis sativa L. plants in two experimental fields in Sardinia (Italy) showed better performance of the OTSU segmentation in the initial phase of cultivation to localize the plants and use it as a reference to evaluate detection performance. The CHM technique showed increasing performance in the Olbia study site but, due to the small size of the crop, it was not possible to achieve the same values obtained in Guspini, where the plants showed greater vegetative development. Although faster and more intuitive, the overall results described are not reliable unless carried out under the supervision of an operator. Although automatic procedures for plant segmentation and detection based on machine learning approaches imply a complex training, testing and validation process and specific programming skills, they represent the best option to obtain more reliable results and perform real-time operations. The main limitation is still related to the lack of extended labelled datasets, which are crucial for learning and testing phases. Future work will consider the comparison between supervised techniques and machine learning approaches and the development of the proposed technique as a labeling facilitation process.
Author Contributions
Conceptualization, F.G. and A.S.; methodology, F.S. and A.S.; software, L.G.; validation, L.G., A.D. and F.G.; formal analysis, F.S.; investigation, A.D.; resources, F.G.; data curation, F.S.; writing—original draft preparation, F.G. and A.S.; writing—review and editing, F.S., L.G. and A.D.; visualization, A.S.; supervision, F.G.; project administration, F.G.; funding acquisition, F.G. All authors have read and agreed to the published version of the manuscript.
Funding
This research was funded by “Fondo di Ateneo per la ricerca 2020-2021 (FAR) – Filippo Gambella”, grant number “Car 000163_UNIV”.
Acknowledgments
The authors would like to thank the two companies’ sites of the surveys: Roberto Sanciu (Olbia, Sardinia, Italy) and Naturalis (Guspini, Sardinia, Italy), and Dr. Giacomo Patteri and Dr. Antonio Pulina for the agronomic support.
Conflicts of Interest
The authors declare no conflict of interest.
References
- Moscariello, C.; Matassa, S.; Esposito, G.; Papirio, S. From Residue to Resource: The Multifaceted Environmental and Bioeconomy Potential of Industrial Hemp (Cannabis Sativa L.). Resources, Conservation and Recycling 2021, 175, 105864. [Google Scholar] [CrossRef]
- Jiang, J.; Gong, C.; Wang, J.; Tian, S.; Zhang, Y. Effects of Ultrasound Pre-Treatment on the Amount of Dissolved Organic Matter Extracted from Food Waste. Bioresource Technology 2014, 155, 266–271. [Google Scholar] [CrossRef] [PubMed]
- Ellison, S. Hemp (Cannabis Sativa L.) Research Priorities: Opinions from United States Hemp Stakeholders. GCB Bioenergy 2021, 13, 562–569. [Google Scholar] [CrossRef]
- Matassa, S.; Esposito, G.; Pirozzi, F.; Papirio, S. Exploring the Biomethane Potential of Different Industrial Hemp (Cannabis Sativa L.) Biomass Residues. Energies 2020, 13. [Google Scholar] [CrossRef]
- Asquer, C.; Melis, E.; Scano, E.A.; Carboni, G. Opportunities for Green Energy through Emerging Crops: Biogas Valorization of Cannabis Sativa L. Residues. Climate 2019, 7. [Google Scholar] [CrossRef]
- Cherney, J.H.; Small, E. Industrial Hemp in North America: Production, Politics and Potential. Agronomy 2016, 6. [Google Scholar] [CrossRef]
- Salamone, S.; Waltl, L.; Pompignan, A.; Grassi, G.; Chianese, G.; Koeberle, A.; Pollastro, F. Phytochemical Characterization of Cannabis Sativa L. Chemotype V Reveals Three New Dihydrophenanthrenoids That Favorably Reprogram Lipid Mediator Biosynthesis in Macrophages. Plants 2022, 11. [Google Scholar] [CrossRef] [PubMed]
- Bicakli, F.; Kaplan, G.; Alqasemi, A.S. Cannabis Sativa L. Spectral Discrimination and Classification Using Satellite Imagery and Machine Learning. Agriculture 2022, 12. [Google Scholar] [CrossRef]
- Mayton, H.; Amirkhani, M.; Loos, M.; Johnson, B.; Fike, J.; Johnson, C.; Myers, K.; Starr, J.; Bergstrom, G.C.; Taylor, A. Evaluation of Industrial Hemp Seed Treatments for Management of Damping-Off for Enhanced Stand Establishment. Agriculture 2022, 12. [Google Scholar] [CrossRef]
- Werf, H.M.G. van der; Wijlhuizen, M.; Schutter, J.A.A. de Plant Density and Self-Thinning Affect Yield and Quality of Fibre Hemp (Cannabis Sativa L.). Field Crops Research 1995, 40, 153–164. [Google Scholar] [CrossRef]
- Aeberli, A.; Johansen, K.; Robson, A.; Lamb, D.W.; Phinn, S. Detection of Banana Plants Using Multi-Temporal Multispectral UAV Imagery. Remote Sensing 2021, 13. [Google Scholar] [CrossRef]
- Wang, T.; Mei, X.; Thomasson, J.A.; Yang, C.; Han, X.; Yadav, P.K.; Shi, Y. GIS-Based Volunteer Cotton Habitat Prediction and Plant-Level Detection with UAV Remote Sensing. Computers and Electronics in Agriculture 2022, 193, 106629. [Google Scholar] [CrossRef]
- Dutta, K.; Talukdar, D.; Bora, S.S. Segmentation of Unhealthy Leaves in Cruciferous Crops for Early Disease Detection Using Vegetative Indices and Otsu Thresholding of Aerial Images. Measurement 2022, 189, 110478. [Google Scholar] [CrossRef]
- Adams, J.; Qiu, Y.; Xu, Y.; Schnable, J.C. Plant Segmentation by Supervised Machine Learning Methods. The Plant Phenome Journal 2020, 3, e20001. [Google Scholar] [CrossRef]
- Pereira, J.F.Q.; Pimentel, M.F.; Amigo, J.M.; Honorato, R.S. Detection and Identification of Cannabis Sativa L. Using near Infrared Hyperspectral Imaging and Machine Learning Methods. A Feasibility Study. Spectrochimica Acta Part A: Molecular and Biomolecular Spectroscopy 2020, 237, 118385. [Google Scholar] [CrossRef]
- Meshram, V.; Patil, K.; Meshram, V.; Hanchate, D.; Ramkteke, S.D. Machine Learning in Agriculture Domain: A State-of-Art Survey. Artificial Intelligence in the Life Sciences 2021, 1, 100010. [Google Scholar] [CrossRef]
- Benos, L.; Tagarakis, A.C.; Dolias, G.; Berruto, R.; Kateris, D.; Bochtis, D. Machine Learning in Agriculture: A Comprehensive Updated Review. Sensors 2021, 21. [Google Scholar] [CrossRef]
- Habibi, L.N.; Watanabe, T.; Matsui, T.; Tanaka, T.S.T. Machine Learning Techniques to Predict Soybean Plant Density Using UAV and Satellite-Based Remote Sensing. Remote Sensing 2021, 13. [Google Scholar] [CrossRef]
- Kartal, S.; Choudhary, S.; Masner, J.; Kholová, J.; Stočes, M.; Gattu, P.; Schwartz, S.; Kissel, E. Machine Learning-Based Plant Detection Algorithms to Automate Counting Tasks Using 3D Canopy Scans. Sensors 2021, 21. [Google Scholar] [CrossRef]
- Liakos, K.G.; Busato, P.; Moshou, D.; Pearson, S.; Bochtis, D. Machine Learning in Agriculture: A Review. Sensors 2018, 18. [Google Scholar] [CrossRef]
- Sharma, A.; Jain, A.; Gupta, P.; Chowdary, V. Machine Learning Applications for Precision Agriculture: A Comprehensive Review. IEEE Access 2021, 9, 4843–4873. [Google Scholar] [CrossRef]
- Sankaran, S.; Quirós, J.J.; Knowles, N.R.; Knowles, L.O. High-Resolution Aerial Imaging Based Estimation of Crop Emergence in Potatoes. American Journal of Potato Research 2017, 94, 658–663. [Google Scholar] [CrossRef]
- Valente, J.; Sari, B.; Kooistra, L.; Kramer, H.; Mücher, S. Automated Crop Plant Counting from Very High-Resolution Aerial Imagery. Precision Agriculture 2020, 21, 1366–1384. [Google Scholar] [CrossRef]
- Shirzadifar, A.; Maharlooei, M.; Bajwa, S.G.; Oduor, P.G.; Nowatzki, J.F. Mapping Crop Stand Count and Planting Uniformity Using High Resolution Imagery in a Maize Crop. Biosystems Engineering 2020, 200, 377–390. [Google Scholar] [CrossRef]
- Barreto, A.; Lottes, P.; Yamati, F.R.I.; Baumgarten, S.; Wolf, N.A.; Stachniss, C.; Mahlein, A.-K.; Paulus, S. Automatic UAV-Based Counting of Seedlings in Sugar-Beet Field and Extension to Maize and Strawberry. Computers and Electronics in Agriculture 2021, 191, 106493. [Google Scholar] [CrossRef]
- Fan, Z.; Lu, J.; Gong, M.; Xie, H.; Goodman, E.D. Automatic Tobacco Plant Detection in UAV Images via Deep Neural Networks. IEEE Journal of Selected Topics in Applied Earth Observations and Remote Sensing 2018, 11, 876–887. [Google Scholar] [CrossRef]
- Mishchenko, S.; Mokher, J.; Laiko, I.; Burbulis, N.; Kyrychenko, H.; Dudukova, S. Phenological Growth Stages of Hemp (Cannabis Sativa L.): Codification and Description According to the BBCH Scale. zemesukiomokslai 2017, 24. [Google Scholar] [CrossRef]
- Wspanialy, P.; Brooks, J.; Moussa, M. An Image Labeling Tool and Agricultural Dataset for Deep Learning 2020.
- Li, J.; Meng, L.; Yang, B.; Tao, C.; Li, L.; Zhang, W. LabelRS: An Automated Toolbox to Make Deep Learning Samples from Remote Sensing Images. Remote Sensing 2021, 13. [Google Scholar] [CrossRef]
- Ahmad, A.; Saraswat, D.; Aggarwal, V.; Etienne, A.; Hancock, B. Performance of Deep Learning Models for Classifying and Detecting Common Weeds in Corn and Soybean Production Systems. Computers and Electronics in Agriculture 2021, 184, 106081. [Google Scholar] [CrossRef]
|
Disclaimer/Publisher’s Note: The statements, opinions and data contained in all publications are solely those of the individual author(s) and contributor(s) and not of MDPI and/or the editor(s). MDPI and/or the editor(s) disclaim responsibility for any injury to people or property resulting from any ideas, methods, instructions or products referred to in the content. |
© 2023 by the authors. Licensee MDPI, Basel, Switzerland. This article is an open access article distributed under the terms and conditions of the Creative Commons Attribution (CC BY) license (http://creativecommons.org/licenses/by/4.0/).
