Submitted:
17 May 2023
Posted:
17 May 2023
You are already at the latest version
Abstract
Keywords:
1. Introduction
2. Experimental Details
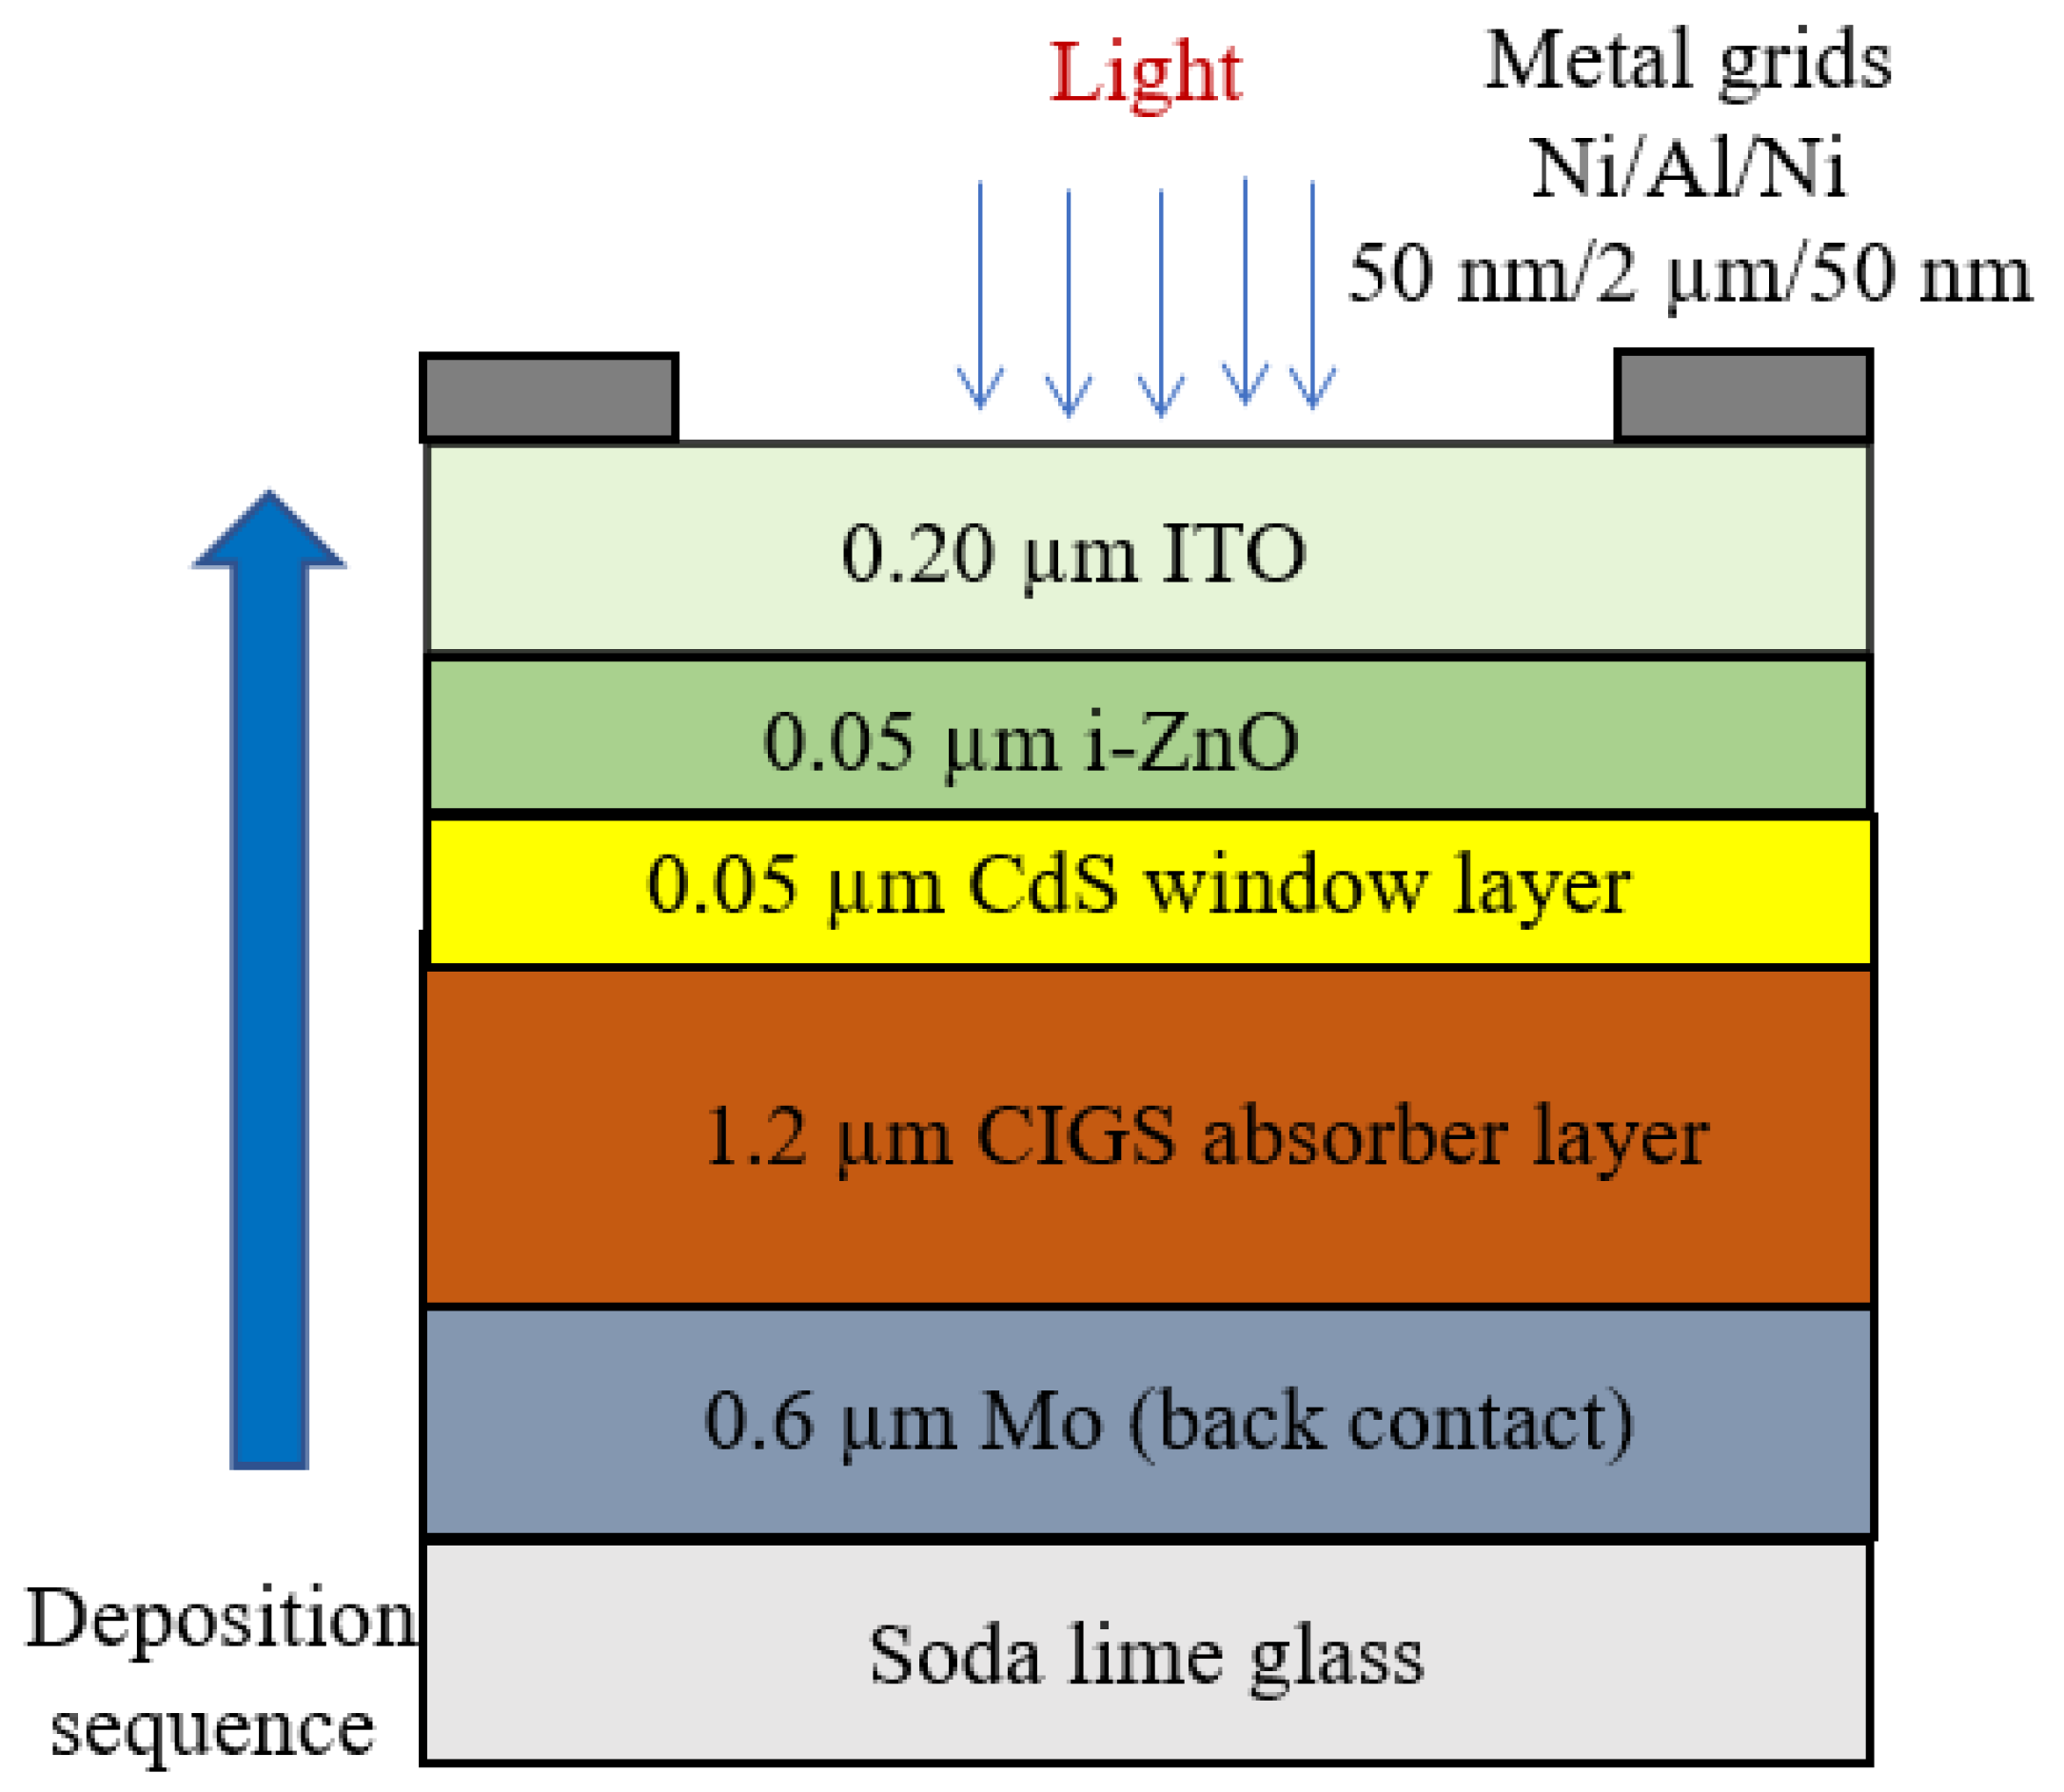
2.1. SE Analysis and EQE SIMULATION

3. Conclusion
ACKOWLEDGEMENT
References
- Wagner, S.; Shay, J.; Migliorato, P.; Kasper, H. CuInSe2/CdS heterojunction photovoltaic detectors. Applied Physics Letters 1974, 25, 434–435. [Google Scholar] [CrossRef]
- Shay, J.; Wagner, S.; Kasper, H. Efficient CuInSe2/CdS solar cells. Applied Physics Letters 1975, 27, 89–90. [Google Scholar] [CrossRef]
- Shafarman, W.N.; Klenk, R.; McCandless, B.E. Device and material characterization of Cu (InGa) Se2 solar cells with increasing band gap. Journal of Applied Physics 1996, 79, 7324–7328. [Google Scholar] [CrossRef]
- Ramanathan, K.; Contreras, M.A.; Perkins, C.L.; Asher, S.; Hasoon, F.S.; Keane, J.; Young, D.; Romero, M.; Metzger, W.; Noufi, R. Properties of 19.2% efficiency ZnO/CdS/CuInGaSe2 thin-film solar cells. Progress in Photovoltaics: research and applications 2003, 11, 225–230. [Google Scholar] [CrossRef]
- Kazmerski, L.; White, F.; Morgan, G. Thin-film CuInSe2/CdS heterojunction solar cells. Applied Physics Letters 1976, 29, 268–270. [Google Scholar] [CrossRef]
- Sapkota, D.R.; Pradhan, P.; Koirala, P.; Irving, R.; Phillips, A.B.; Ellingson, R.J.; Heben, M.J.; Marsillac, S.; Podraza, N.J.; Collins, R.W. Structural and Optical Properties of Two-Stage CuInSe2 Thin Films Studied by Real Time Spectroscopic Ellipsometry. In Proceedings of 2019 IEEE 46th Photovoltaic Specialists Conference (PVSC), 16-21 June 2019; pp. 0943–0948. [Google Scholar]
- Sapkota, D.R.; Koirala, P.; Pradhan, P.; Shrestha, N.; Junda, M.M.; Phillips, A.B.; Ellingson, R.J.; Heben, M.J.; Marsillac, S.; Podraza, N.J. Spectroscopic Ellipsometry Investigation of CuInSe2 as a Narrow Bandgap Component of Thin Film Tandem Solar Cells. In Proceedings of 2018 IEEE 7th World Conference on Photovoltaic Energy Conversion (WCPEC)(A Joint Conference of 45th IEEE PVSC, 28th PVSEC & 34th EU PVSEC); pp. 1943–1948.
- Sapkota, D.; Koirala, P.; Pradhan, P.; Collins, R. Real Time Spectroscopic Ellipsometry Analysis of the Structural Evolution and Optical Properties of CuInSe2. Bulletin of the American Physical Society 2018, 63. [Google Scholar]
- Repins, I.; Contreras, M.A.; Egaas, B.; DeHart, C.; Scharf, J.; Perkins, C.L.; To, B.; Noufi, R. 19· 9%-efficient ZnO/CdS/CuInGaSe2 solar cell with 81· 2% fill factor. Progress in Photovoltaics: Research and applications 2008, 16, 235–239. [Google Scholar] [CrossRef]
- Shafarman, W.N.; Siebentritt, S.; Stolt, L. Cu(In,Ga)Se2 Solar Cells. Handbook of photovoltaic science and engineering 2010, 546–599. [Google Scholar]
- Jackson, P.; Hariskos, D.; Lotter, E.; Paetel, S.; Wuerz, R.; Menner, R.; Wischmann, W.; Powalla, M. New world record efficiency for Cu(In,Ga)Se2 thin-film solar cells beyond 20%. Progress in Photovoltaics: Research and Applications 2011, 19, 894–897. [Google Scholar] [CrossRef]
- Chirilă, A.; Buecheler, S.; Pianezzi, F.; Bloesch, P.; Gretener, C.; Uhl, A.R.; Fella, C.; Kranz, L.; Perrenoud, J.; Seyrling, S. Highly efficient Cu(In,Ga)Se2 solar cells grown on flexible polymer films. Nature materials 2011, 10, 857–861. [Google Scholar] [CrossRef]
- Jackson, P.; Hariskos, D.; Wuerz, R.; Wischmann, W.; Powalla, M. Compositional investigation of potassium doped Cu(In,Ga)Se2 solar cells with efficiencies up to 20.8%. physica status solidi (RRL)–Rapid Research Letters 2014, 8, 219–222. [Google Scholar] [CrossRef]
- Jackson, P.; Wuerz, R.; Hariskos, D.; Lotter, E.; Witte, W.; Powalla, M. Effects of heavy alkali elements in Cu(In,Ga)Se2 solar cells with efficiencies up to 22.6%. physica status solidi (RRL)–Rapid Research Letters 2016, 10, 583–586. [Google Scholar] [CrossRef]
- Jackson, P.; Hariskos, D.; Wuerz, R.; Kiowski, O.; Bauer, A.; Friedlmeier, T.M.; Powalla, M. Properties of Cu(In,Ga)Se2 solar cells with new record efficiencies up to 21.7%. physica status solidi (RRL)–Rapid Research Letters 2015, 9, 28–31. [Google Scholar] [CrossRef]
- Nakamura, M.; Yamaguchi, K.; Kimoto, Y.; Yasaki, Y.; Kato, T.; Sugimoto, H. Cd-free Cu(In,Ga)(Se,S)2 thin-film solar cell with record efficiency of 23.35%. IEEE Journal of Photovoltaics 2019, 9, 1863–1867. [Google Scholar] [CrossRef]
- Alaani, M.A.R.; Koirala, P.; Phillips, A.B.; Liyanage, G.K.; Awni, R.A.; Sapkota, D.R.; Ramanujam, B.; Heben, M.J.; O’Leary, S.K.; Podraza, N.J. Optical Properties of Magnesium-Zinc Oxide for Thin Film Photovoltaics. Materials 2021, 14, 5649. [Google Scholar] [CrossRef] [PubMed]
- Jamarkattel, M.K.; Phillips, A.B.; Subedi, I.; Abudulimu, A.; Bastola, E.; Li, D.-B.; Mathew, X.; Yan, Y.; Ellingson, R.J.; Podraza, N.J. Indium Gallium Oxide Emitters for High-Efficiency CdTe-Based Solar Cells. ACS Applied Energy Materials 2022. [Google Scholar] [CrossRef]
- Sapkota, D.R.; Shan, A.; Ramanujam, B.; Pradhan, P.; Irving, R.; Phillips, A.B.; Heben, M.J.; Ellingson, R.J.; Marsillac, S.; Podraza, N.J. Spectroscopic Ellipsometry Analysis and Quantum Efficiency Simulation of CuInSe 2 Solar Cells. In Proceedings of 2022 IEEE 49th Photovoltaics Specialists Conference (PVSC); pp. 0407–0412. [CrossRef]
- Alkhayat, R.B.; Sapkota, D.R. Study of Degradation of Cu (In, Ga) Se 2 Solar Cell Parameters due to Temperature. In Proceedings of 2022 IEEE 49th Photovoltaics Specialists Conference (PVSC); pp. 1252–1256. [CrossRef]
- Ahangharnejhad, R.H.; Song, Z.; Phillips, A.B.; Watthage, S.C.; Almutawah, Z.S.; Sapkota, D.R.; Koirala, P.; Collins, R.W.; Yan, Y.; Heben, M.J. Optical design of perovskite solar cells for applications in monolithic tandem configuration with CuInSe2 bottom cells. MRS Advances 2018, 3, 3111–3119. [Google Scholar] [CrossRef]
- Hosseinian Ahangharnejhad, R.; Song, Z.; Phillips, A.; Watthage, S.; Almutawah, Z.; Sapkota, D.R.; Koirala, P.; Collins, R.; Yan, Y.; Heben, M. Optical design of perovskite solar cells for applications in tandem configuration with CuInSe2 bottom cells. Bulletin of the American Physical Society 2018, 63. [Google Scholar]
- Shrestha, N.; Sapkota, D.R.; Subedi, K.K.; Pradhan, P.; Koirala, P.; Phillips, A.B.; Collins, R.W.; Heben, M.J.; Ellingson, R.J. Identification of defect levels in copper indium diselenide (CuInSe2) thin films via photoluminescence studies. MRS advances 2018, 3, 3135–3141. [Google Scholar] [CrossRef]
- Uprety, P.; Wang, C.; Koirala, P.; Sapkota, D.; Ghimire, K.; Junda, M.; Collins, R. Application of Optical Hall Effect to PV Relevant Materials. Bulletin of the American Physical Society 2018, 63. [Google Scholar]
- Sapkota, D.R.; Pradhan, P.; Irving, R.; Grice, C.R.; Phillips, A.B.; Heben, M.J.; Marsillac, S.; Podraza, N.J.; Collins, R.W. Evaluation of CuInSe2 Materials and Solar Cells Co-evaporated at Different Rates Based on Real Time Spectroscopic Ellipsometry Calibrations. In Proceedings of 2021 IEEE 48th Photovoltaic Specialists Conference (PVSC); pp. 0451–0458. [CrossRef]
- Uprety, P.; Wang, C.; Koirala, P.; Sapkota, D.R.; Ghimire, K.; Junda, M.M.; Yan, Y.; Collins, R.W.; Podraza, N.J. Optical Hall Effect of PV Device Materials. IEEE Journal of Photovoltaics 2018, 8, 1793–1799. [Google Scholar] [CrossRef]
- Sapkota, D.R.; Pradhan, P.; Koirala, P.; Ramanujam, B.; Grice, C.; Irving, R.; Heben, M.J.; Collins, R.W. Optimization of the CuInSe2 Absorber for the Bottom Cell of a Polycrystalline Thin Film Tandem Solar Cell. Bulletin of the American Physical Society 2020, 65. [Google Scholar]
- Sapkota, D.R. Characterization and Optimization of CuInSe2 Solar Cells Applicable for Tandem Devices. University of Toledo, 2022.
- Orgassa, K.; Schock, H.W.; Werner, J. Alternative back contact materials for thin film Cu (In,Ga)Se2 solar cells. Thin Solid Films 2003, 431, 387–391. [Google Scholar] [CrossRef]
- Minemoto, T.; Matsui, T.; Takakura, H.; Hamakawa, Y.; Negami, T.; Hashimoto, Y.; Uenoyama, T.; Kitagawa, M. Theoretical analysis of the effect of conduction band offset of window/CIS layers on performance of CIS solar cells using device simulation. solar Energy Materials and solar Cells 2001, 67, 83–88. [Google Scholar] [CrossRef]
- Pradhan, P.; Aryal, P.; Ibdah, A.-R.; Koirala, P.; Li, J.; Podraza, N.J.; Rockett, A.A.; Marsillac, S.; Collins, R.W. Effect of molybdenum deposition temperature on the performance of CuIn1− xGaxSe2 solar cells. In Proceedings of 2015 IEEE 42nd Photovoltaic Specialist Conference (PVSC); pp. 1–4. [CrossRef]
- Aryal, P. Optical and photovoltaic properties of copper indium-gallium diselenide materials and solar cells; The University of Toledo, 2014. [Google Scholar]
- Fujiwara, H.; Koh, J.; Rovira, P.; Collins, R. Assessment of effective-medium theories in the analysis of nucleation and microscopic surface roughness evolution for semiconductor thin films. Physical Review B 2000, 61, 10832. [Google Scholar] [CrossRef]
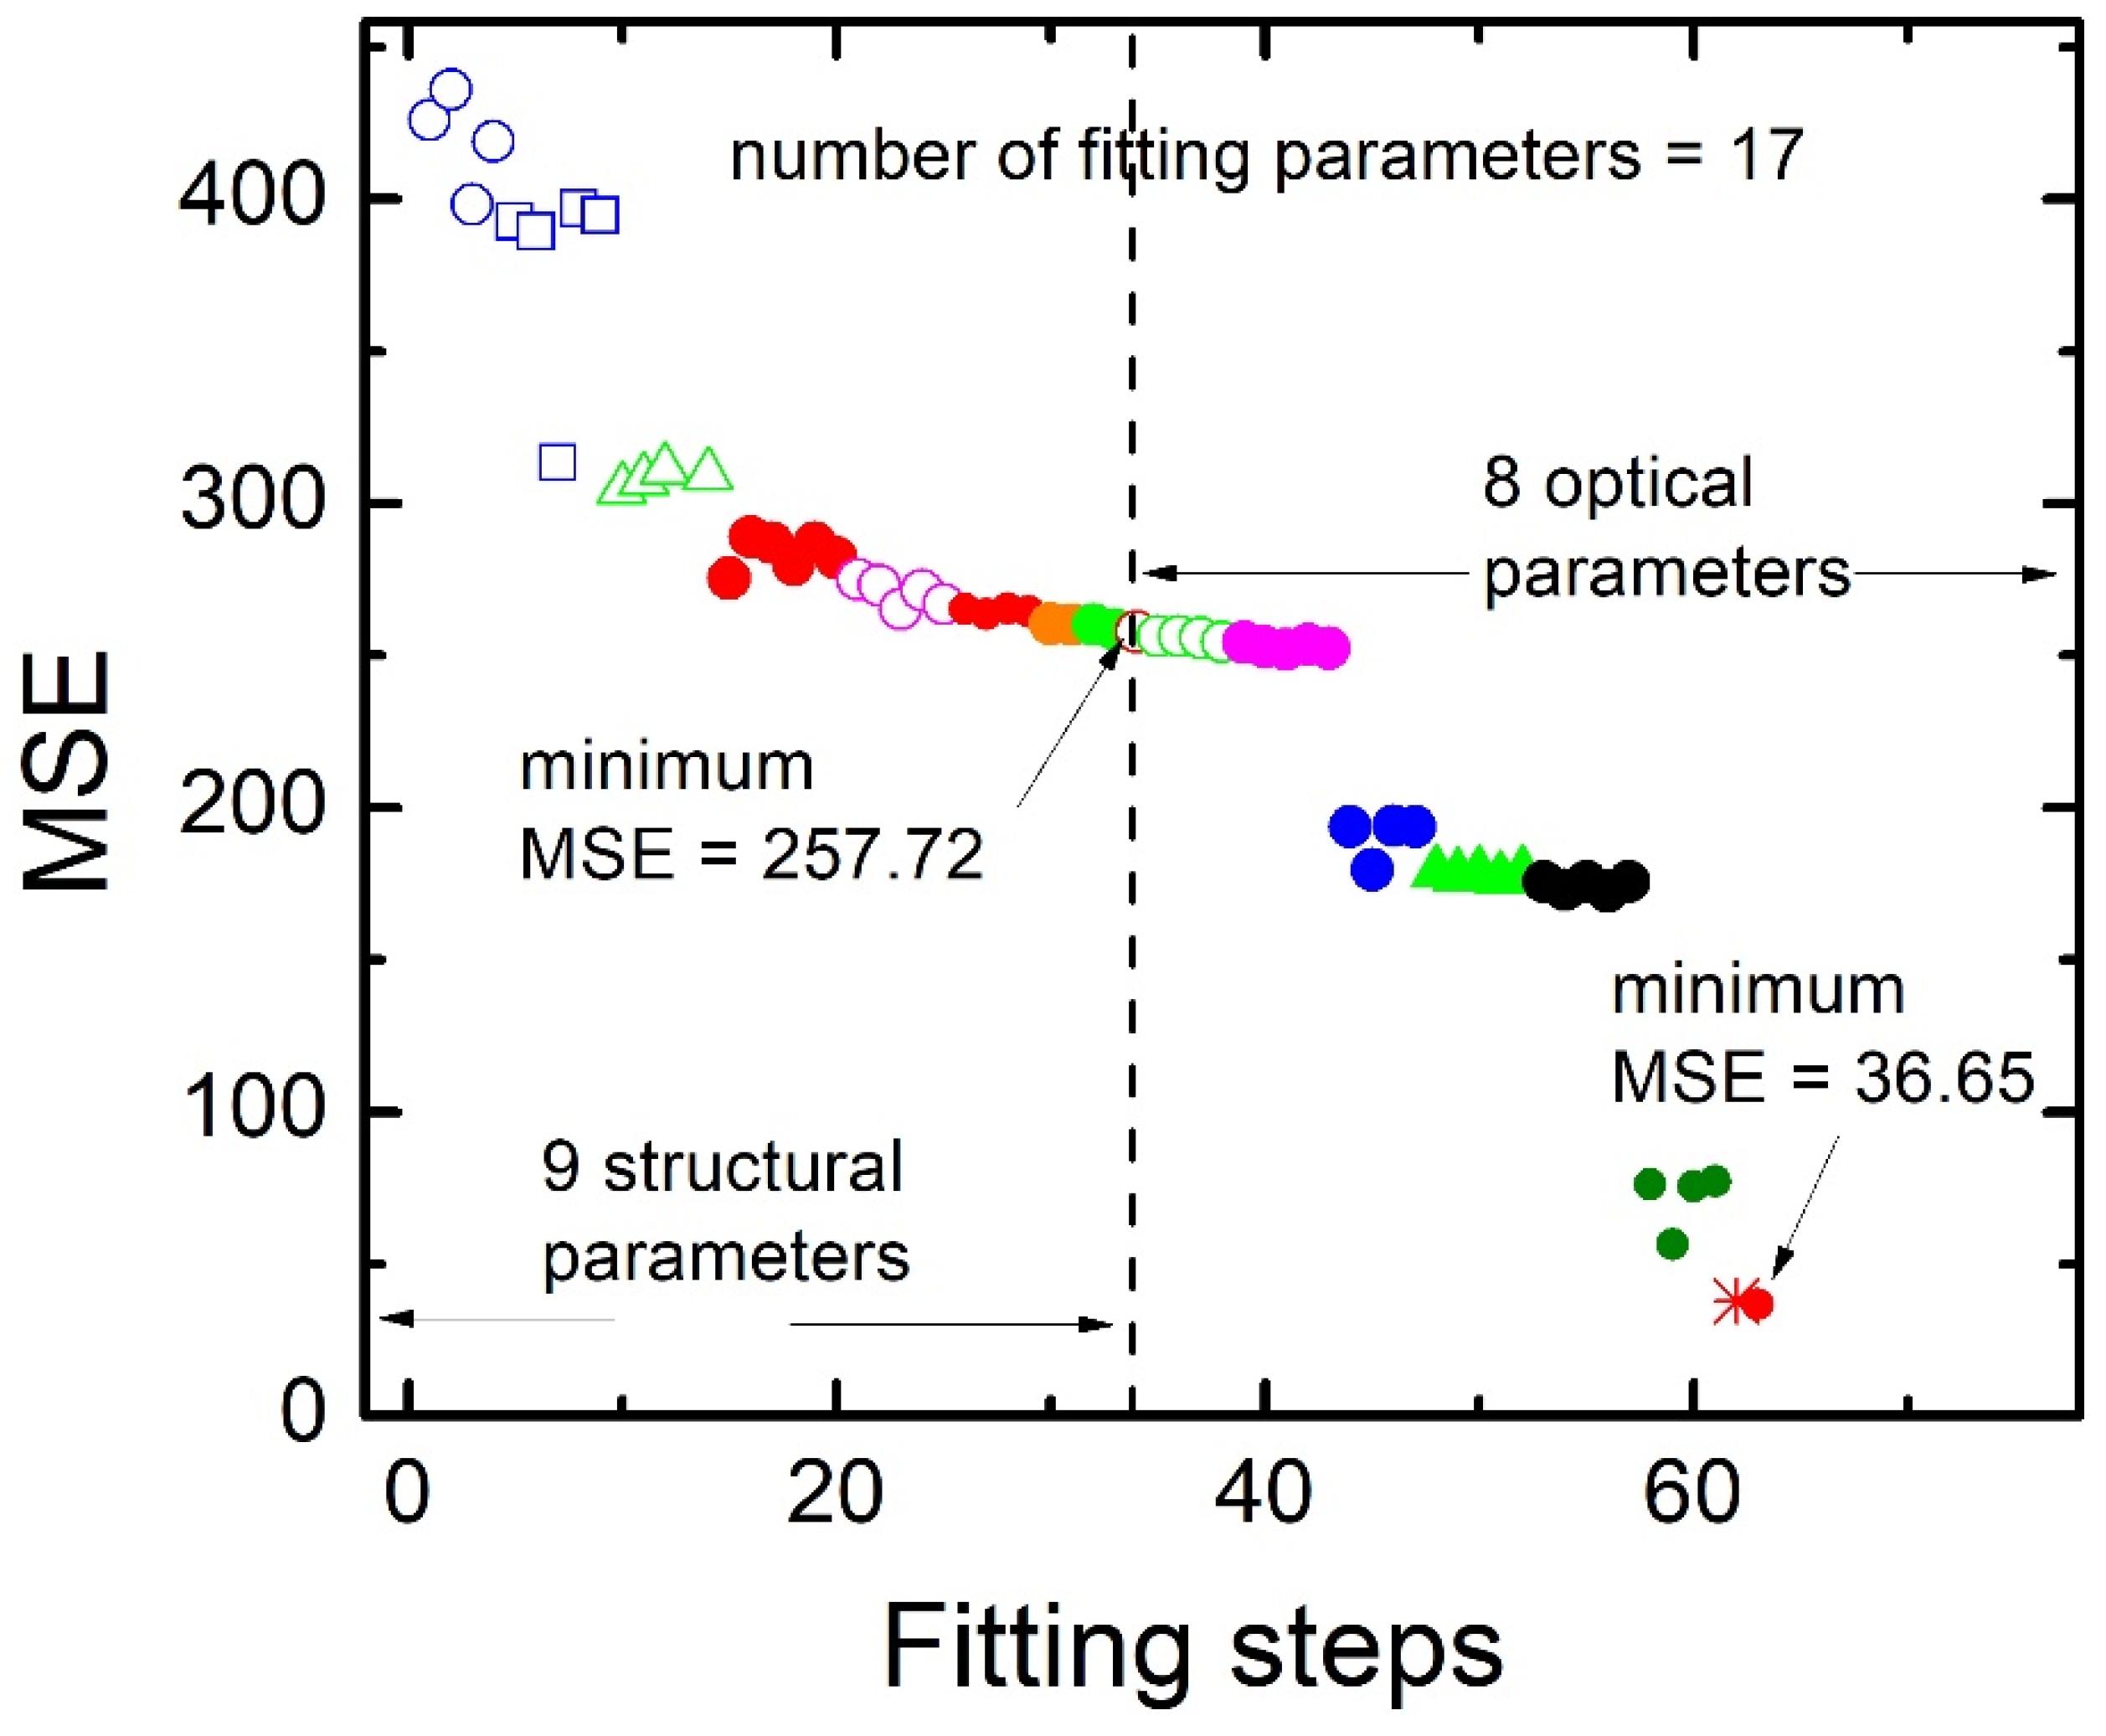
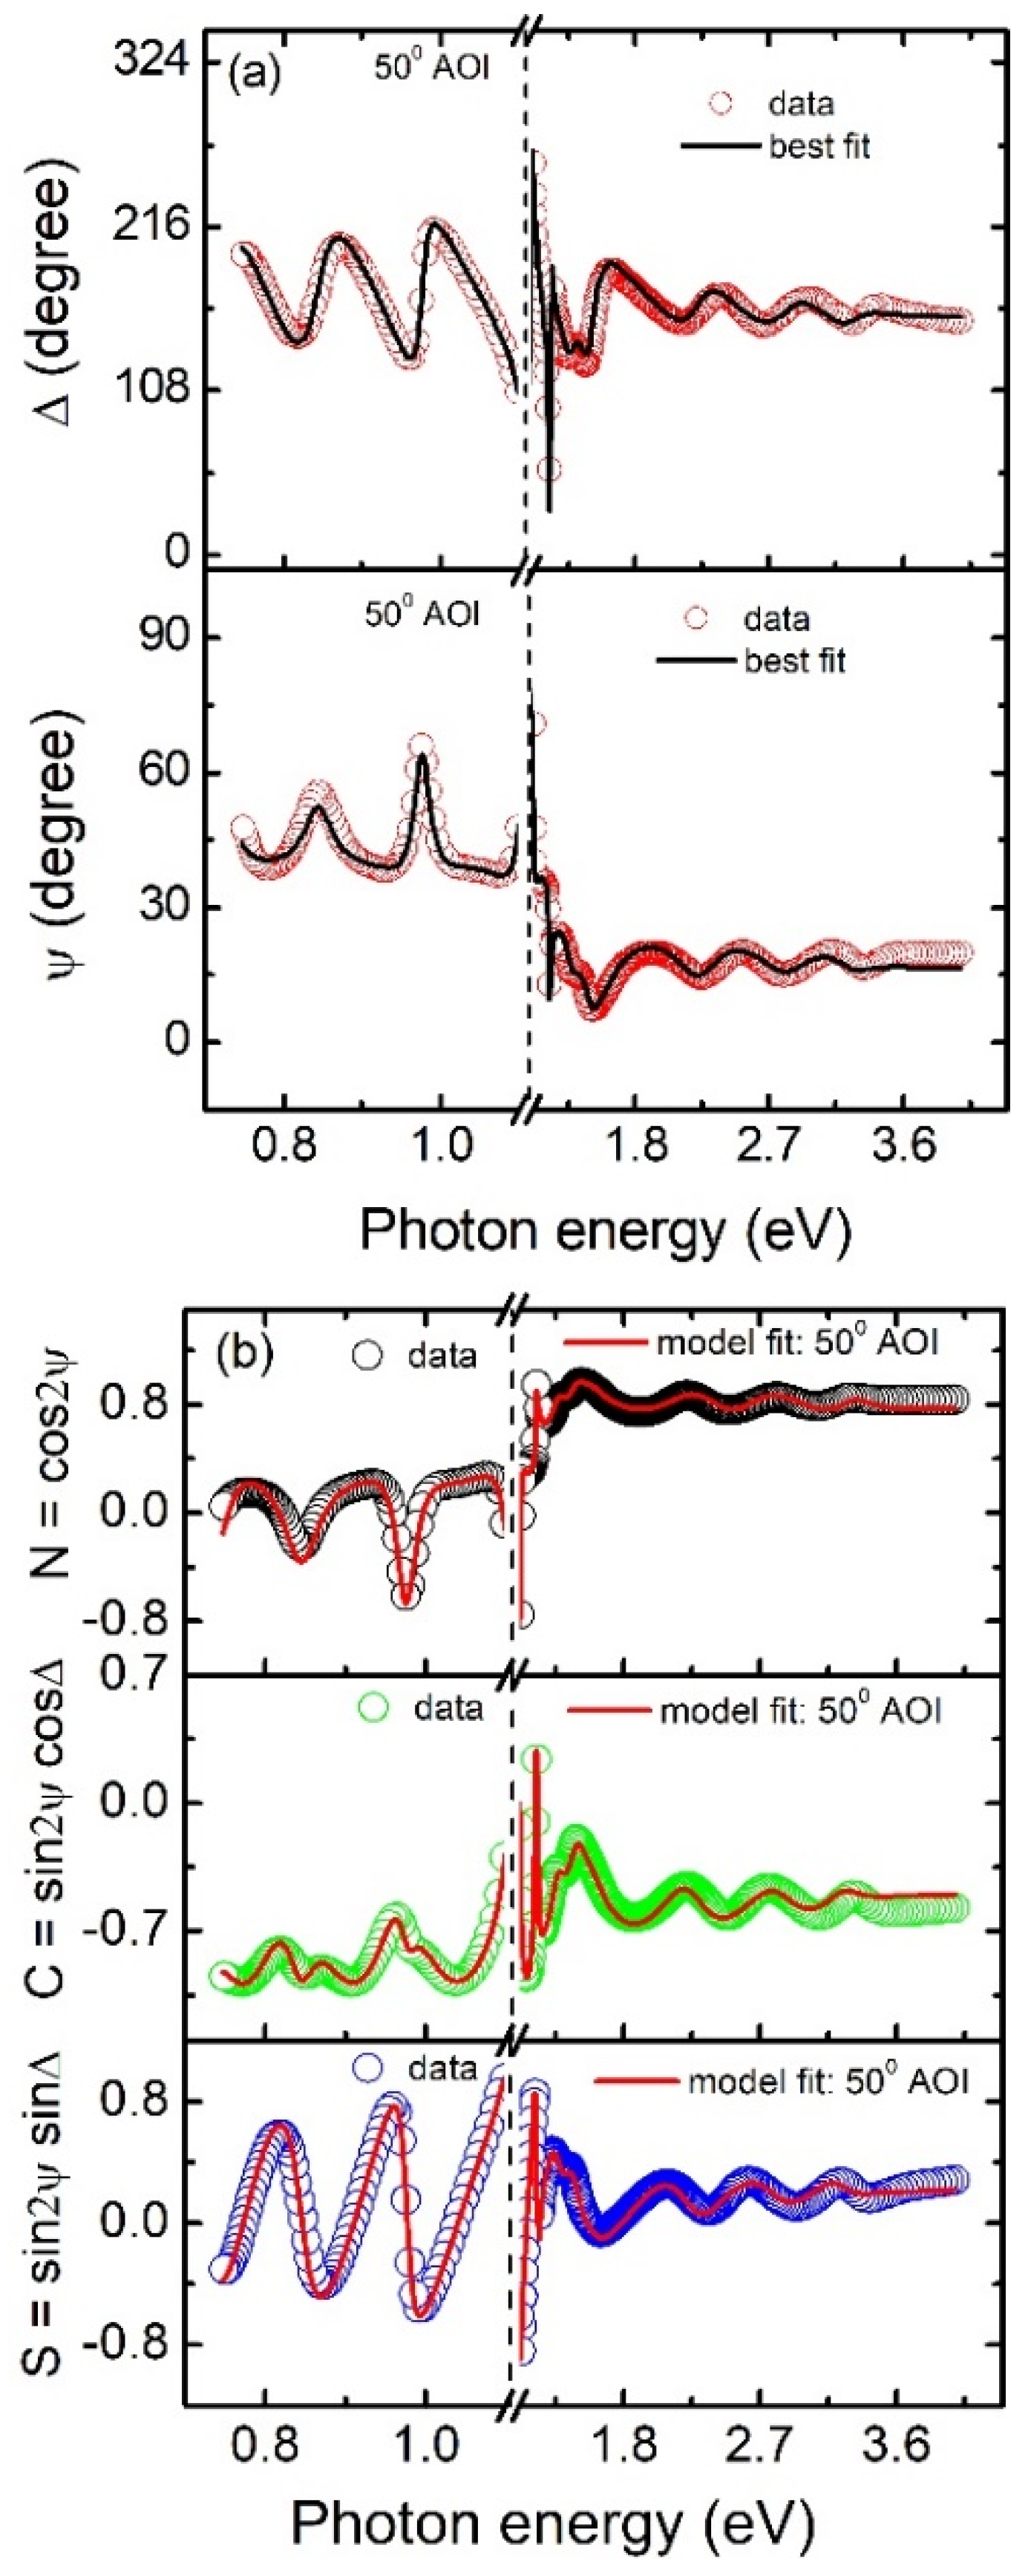
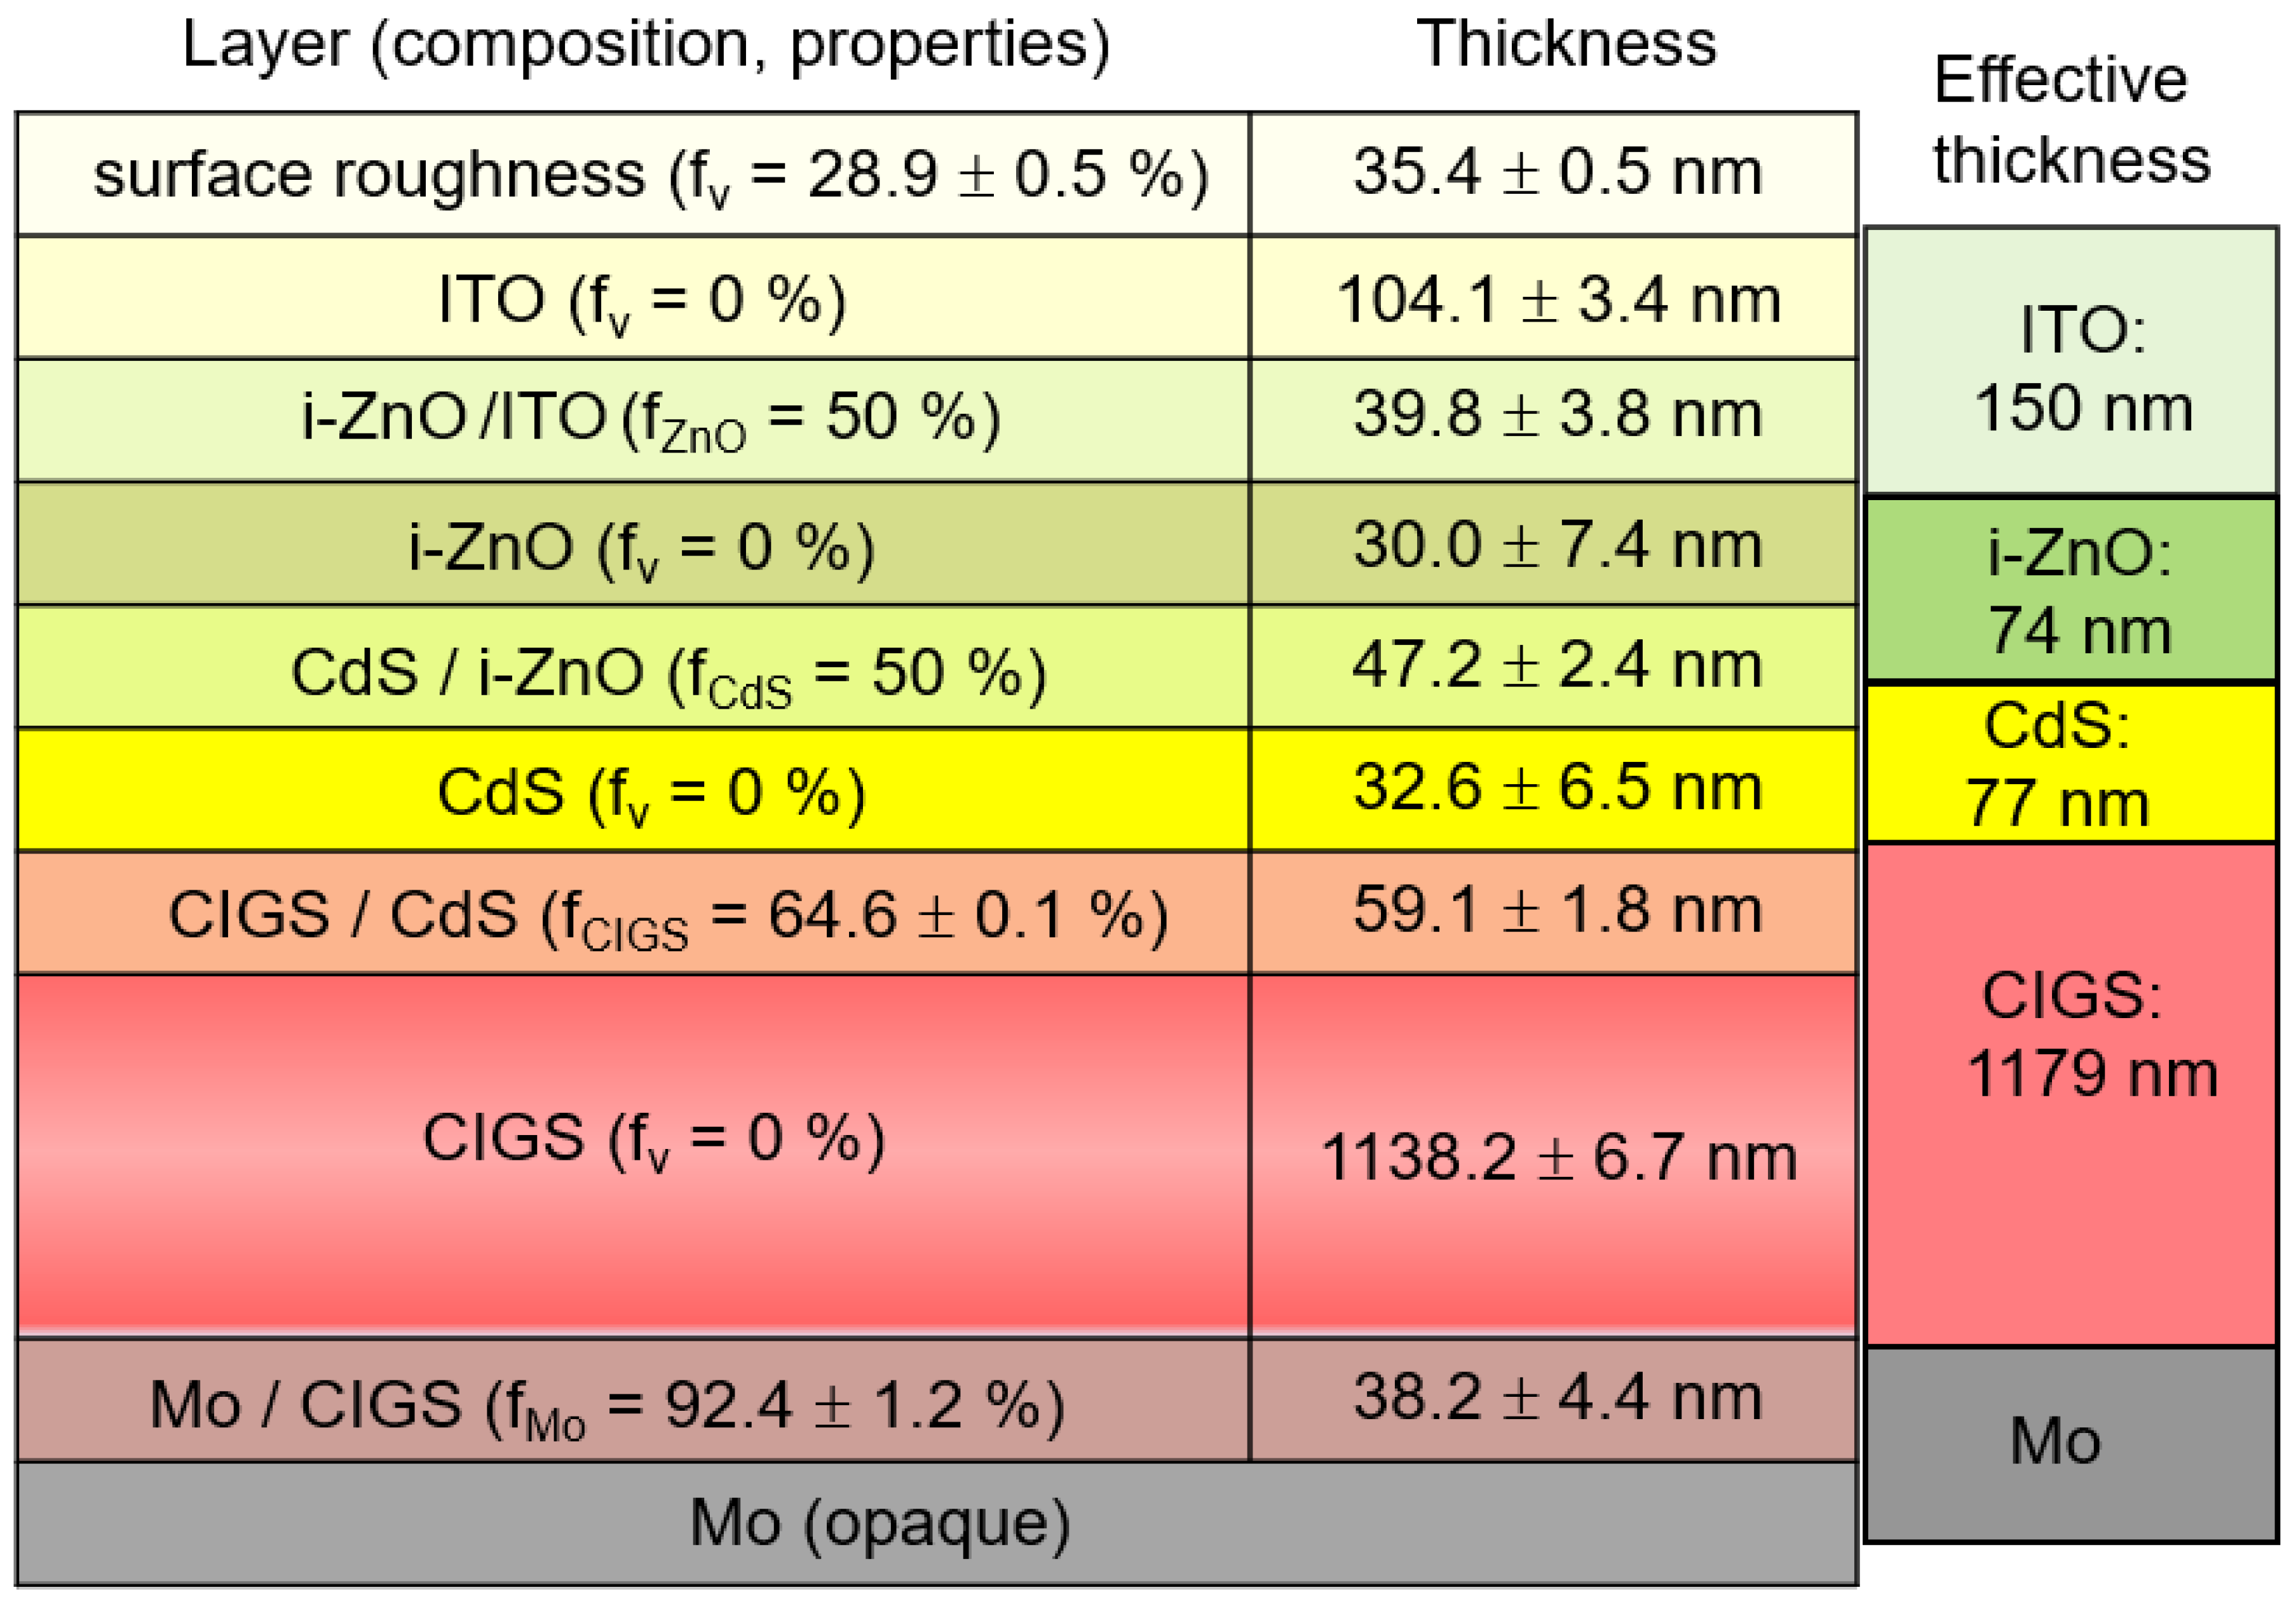
Disclaimer/Publisher’s Note: The statements, opinions and data contained in all publications are solely those of the individual author(s) and contributor(s) and not of MDPI and/or the editor(s). MDPI and/or the editor(s) disclaim responsibility for any injury to people or property resulting from any ideas, methods, instructions or products referred to in the content. |
© 2023 by the authors. Licensee MDPI, Basel, Switzerland. This article is an open access article distributed under the terms and conditions of the Creative Commons Attribution (CC BY) license (http://creativecommons.org/licenses/by/4.0/).


