Preprint
Article

A Spatio-Temporal Information Extraction Method based on Multimodal Social Media Data: A Case Study on Urban Inundation

Altmetrics

Downloads

265

Views

147

Comments

0

A peer-reviewed article of this preprint also exists.

Submitted:

15 May 2023

Posted:

17 May 2023

Read the latest preprint version here

Alerts
Abstract
With the prevalence and evolution of social media platforms, social media data have emerged as a crucial source for obtaining spatio-temporal information about various urban events. Providing accurate spatio-temporal information of these events enhances the capacities of urban management and emergency response. However, existing research mostly focuses on the textual content while mining this spatio-temporal information, often neglecting data from other modalities like images and videos.To address this, our study introduces a novel method for extracting spatio-temporal information from multi-modal social media data (MIST-SMMD), serving as a valuable supplement to current urban event monitoring methods. Leveraging deep learning and Geographic Information System (GIS) technologies, we extract spatio-temporal information from large-scale, multi-modal Weibo data about urban waterlogging events at both coarse and fine granularities.Through an in-depth experimental evaluation of the “July 20 Zhengzhou extreme rainstorm” event, the results show that in coarse-grained spatial information extraction solely using textual data, our method achieves a Spatial Precision of 87.54% within a 60m range and 100% Spatial Precision within a 201m range. In the fine-grained spatial information extraction, by incorporating other modalities such as images and videos, the Spatial Error saw a significant improvement, with MAESE increasing by 95.53% and RMSESE by 93.62%.These outcomes illustrate the capability of the MIST-SMMD method in extracting spatio-temporal information of urban events at both coarse and fine granularities. They also confirm the notable advantage of multi-modal data in enhancing the accuracy of spatial information extraction.
Keywords: 
Subject: Environmental and Earth Sciences  -   Geography

1. Introduction

Spatio-temporal information extraction is a subfield of spatio-temporal data analysis and data mining. The richness of data sources is a critical prerequisite in practical applications. With the rapid development of internet technology, social media platforms have become the main channels for people to acquire and share information[1]. As of December 2022, the number of monthly active users on Weibo increased by 13 million year-on-year, reaching 586 million, a historic high[2]. Along with the prevalence of social media, numerous events with latent spatio-temporal information are widely disseminated, these pieces of information have substantial value in urban management and incident response. For instance, traffic planning, disaster management sentiment spatial analysis, and disaster analysis based on geographic tags[3,4,5,6], timely and accurate acquisition and analysis of spatio-temporal information are crucial for urban management departments to formulate scientifically reasonable response measures.
Due to the convenience of text information processing, existing research often focuses on utilizing unimodal data (especially text data) for spatio-temporal information extraction, including rule-based methods and Named Entity Recognition (NER) methods. Rule-based methods rely on manually defined rules and patterns to extract information, usually requiring domain knowledge and linguistic resources[7]. These methods, which require no significant annotated data or complex computational resources and have the advantage of rapidly implementing system prototypes, are widely adopted by many studies[8,9]. However, the diversity, informality, and ambiguity of social media texts make it challenging for rule-based methods to cover all possible scenarios. These methods also require substantial human involvement and maintenance, making them unsuitable for the rapid changes, frequent updates, and vast volume of social media text. Methods based on NER extract spatio-temporal information by detecting spatio-temporal entities in text data. In recent years, thanks to the rapid development of natural language processing theory and application in the field of machine learning[10,11], many studies have begun to use this method for spatio-temporal information extraction[12,13]. The advantage of this method is that it can automatically recognize entities in the text, thereby reducing human involvement and maintenance. However, entity ambiguity, diversity of expression, and nested entities in the text may affect its extraction effect.
While using only unimodal data can effectively extract latent spatio-temporal information to some extent, existing research rarely focuses on the potential of other modal data such as images and videos. Images and video data carry latent spatial information[14], and the multimodal data formed in combination with text data can provide more accurate spatial information, which helps to further improve the accuracy and comprehensiveness of spatio-temporal information extraction. Existing studies have carried out information mining and classification based on social media multimodal data[15,16], but research on spatio-temporal information extraction from multimodal data in social media is relatively scarce. Moreover, extracting spatio-temporal information from multimodal social media data is not easy, as social media data involving public participation often exhibit noise, heterogeneity, and sparsity[17,18].
In the past twenty years, the frequency and intensity of flood disasters in major cities worldwide have increased, posing a serious threat to economic development and social stability[19]. Against this backdrop, researching how to effectively extract the spatio-temporal information of flood disasters has become an important subject. In recent years, predicting areas of potential urban flooding in the future through the spatio-temporal information monitoring of urban flood disasters has become an important means of managing urban waterlogging[20]. At present, Internet of Things (IoT) sensing technology and remote sensing technology are commonly used for urban flood disaster monitoring[21,22,23]. At a smaller spatial scale, IoT sensors can more accurately and quicklyrespond to urban waterlogging issues, enabling real-time warning and monitoring[24]. At larger spatial scales, although optical and radar satellite remote sensing can provide more effective continuous coverage of weather and waterlogging events compared to IoT sensing[25], flood disasters have a short impact time on cities and the surface water coverage is small and concentrated. Furthermore, due to the influence of clouds, vegetation canopies, and other factors, microwave remote sensing is subject to total reflection effects and cannot monitor and extract surface water information, further extending the original visit cycle[26]. Therefore, there are still many shortcomings in the current methods of extracting spatio-temporal information of flood disasters, and the above methods are unable to meet the high spatio-temporal resolution requirements for urban flood disaster monitoring. However, when flood disasters occur, people often share information on social media, which may contain the time, location, degree, impact range, and duration of the disaster[27]. This information is of great significance for urban waterlogging management and prediction. Therefore, the extraction of spatio-temporal information has become an important means to help the government understand disaster dynamics, formulate reasonable and effective response measures, and reduce disaster losses[28].
The goal of this study is to further explore the potential of other modal data (such as images and videos) for high-precision correction of extracted spatial information, based on the ability to accurately extract spatio-temporal information from social media text. To this end, we propose a general MIST-SMMD method, which seeks to provide strong support for the early warning and management of urban events and disasters by studying and addressing challenges such as multimodal data fusion and heterogeneity processing. Moreover, to evaluate and verify this method, we use urban flood waterlogging events as an example for evaluation. We make publicly available the code, models, and datasets used in this study for researchers to reproduce and conduct further research. These are located at: https://github.com/orgs/MIST-SMMD/repositories (accessed on 19 May 2023).
The main contributions of MIST-SMMD are as follows:
  • In terms of data preprocessing, we utilized a text classification model to filter relevant information compared to previous studies and removed similar posts on the same day, which helps to clean up the noise in social media data and standardize the dataset as much as possible.
  • In terms of coarse-grained spatio-temporal extraction, we proposed a set of strict rules for spatio-temporal information normalization, allowing for the maximum degree of structured potential spatio-temporal information.
  • In terms of fine-grained spatial extraction, we proposed the LSGL method, which utilizes cascading computer vision models to further improve the precision of spatial information based on coarse-grained extraction, while increasing the utilization of social media image and video modal data.

2. Methods

2.1. Technical Process

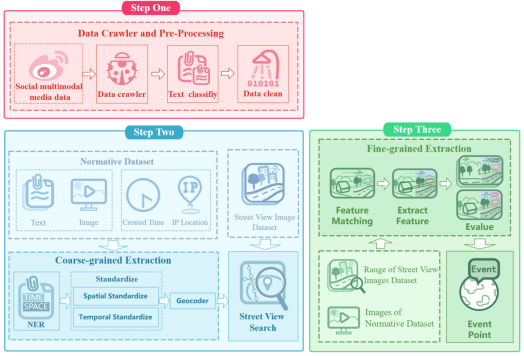
We propose a method to extract spatio-temporal information from multimodal data in social media, called MIST-SMMD (Method of Identifying Spatio-temporal Information of Social Media Multimodal Data). MIST-SMMD consists of three steps: social media data crawling and preprocessing, coarse-grained spatio-temporal information extraction, and fine-grained spatial information extraction. This method utilizes the complementarity of multimodal data and the flexibility and generalization of model cascading [29,30], sequentially processing the text and images of social media. The overall process structure is illustrated in Figure 1.

2.2. Data Craw and Pre-Process

To acquire Weibo data, we use the public interface of Sina Weibo, setting a time range and relevant city event keywords to crawl Weibo multimodal data using the Python programming language. These data include Weibo creation time, text content, images (if any), videos (if any), and IP province (starting from August 1, 2022). For videos, we extract stable frame images using optical flow method.
To process the text data efficiently, it is necessary first to clean noise data. Character-level cleaning includes removing topic tags, zero-width spaces (ZWSP), @ other users, Emoji symbols, HTML tags, etc. However, not all Weibos containing event-related keywords are related to the event. Therefore, a model can be trained to classify text related to specified city events. As an event is usually reported by multiple media, overly similar posts will cause data redundancy. Therefore, using a day as the time range, the text is vectorized and highly similar Weibos are removed using cosine similarity matrix.
After these three steps of data preprocessing, a city event Weibo dataset with overall low noise and relevant to the required events can be obtained. An example of a processed dataset is shown in Table 1.

2.3. Coarse-Grained Spatio-Temporal Information Extraction

Given that the narration of social media information has a high degree of randomness and diversity, lacking a unified text format, we have designed a set of rigorous spatio-temporal information standardization rules to efficiently extract key spatio-temporal information from a large amount of Weibo data and lay the foundation for subsequent detailed research. These rules aim to ensure that different levels of potential spatio-temporal information are maximally utilized during the standardization process.
Before standardizing spatio-temporal information, it is necessary first to extract spatio-temporal information from the text. For the preprocessed and standardized city event dataset, we use NER technology to identify entities related to spatio-temporal information. To improve the efficiency of subsequent spatio-temporal information standardization, we merge similar tags. Specifically, we combine the DATE and TIME tags into the TIME category, as they can both serve as materials for time standardization; we make the GPE tag a separate category without changing its name, as it provides a basis for spatial standardization with administrative divisions; we combine the LOC and FAC tags into the FAC category, as they both can identify specific facilities or locations, which can serve as specific place names for spatial standardization. Table 2 shows the built-in tags of concern for spatio-temporal information extraction and reclassified tag categories.
For spatio-temporal standardization, particular attention needs to be paid to time and space. Therefore, we chose the JioNLP library, which offers the best open-source time parsing tool and a convenient location parsing tool [31]. In terms of time standardization, we standardize the Weibo posting time to the "Year-Month-Day" format, omitting the specific "Hour:Minute:Second". This is because it is challenging to accurately pinpoint the time of an event such as a flood down to the "hour" level based solely on the Weibo posting time and the implicit time information in the text. Therefore, the lowest unit of time is retained only to the "day", rather than the specific details of the Weibo posting time. For spatial standardization, we transform the potential spatial information in Weibo into the "Province-City-District (County)-Specific Geographical Location" format to facilitate the understanding of subsequent geographic coding and accurately convert it to the WGS1984 latitude and longitude coordinates of the address.
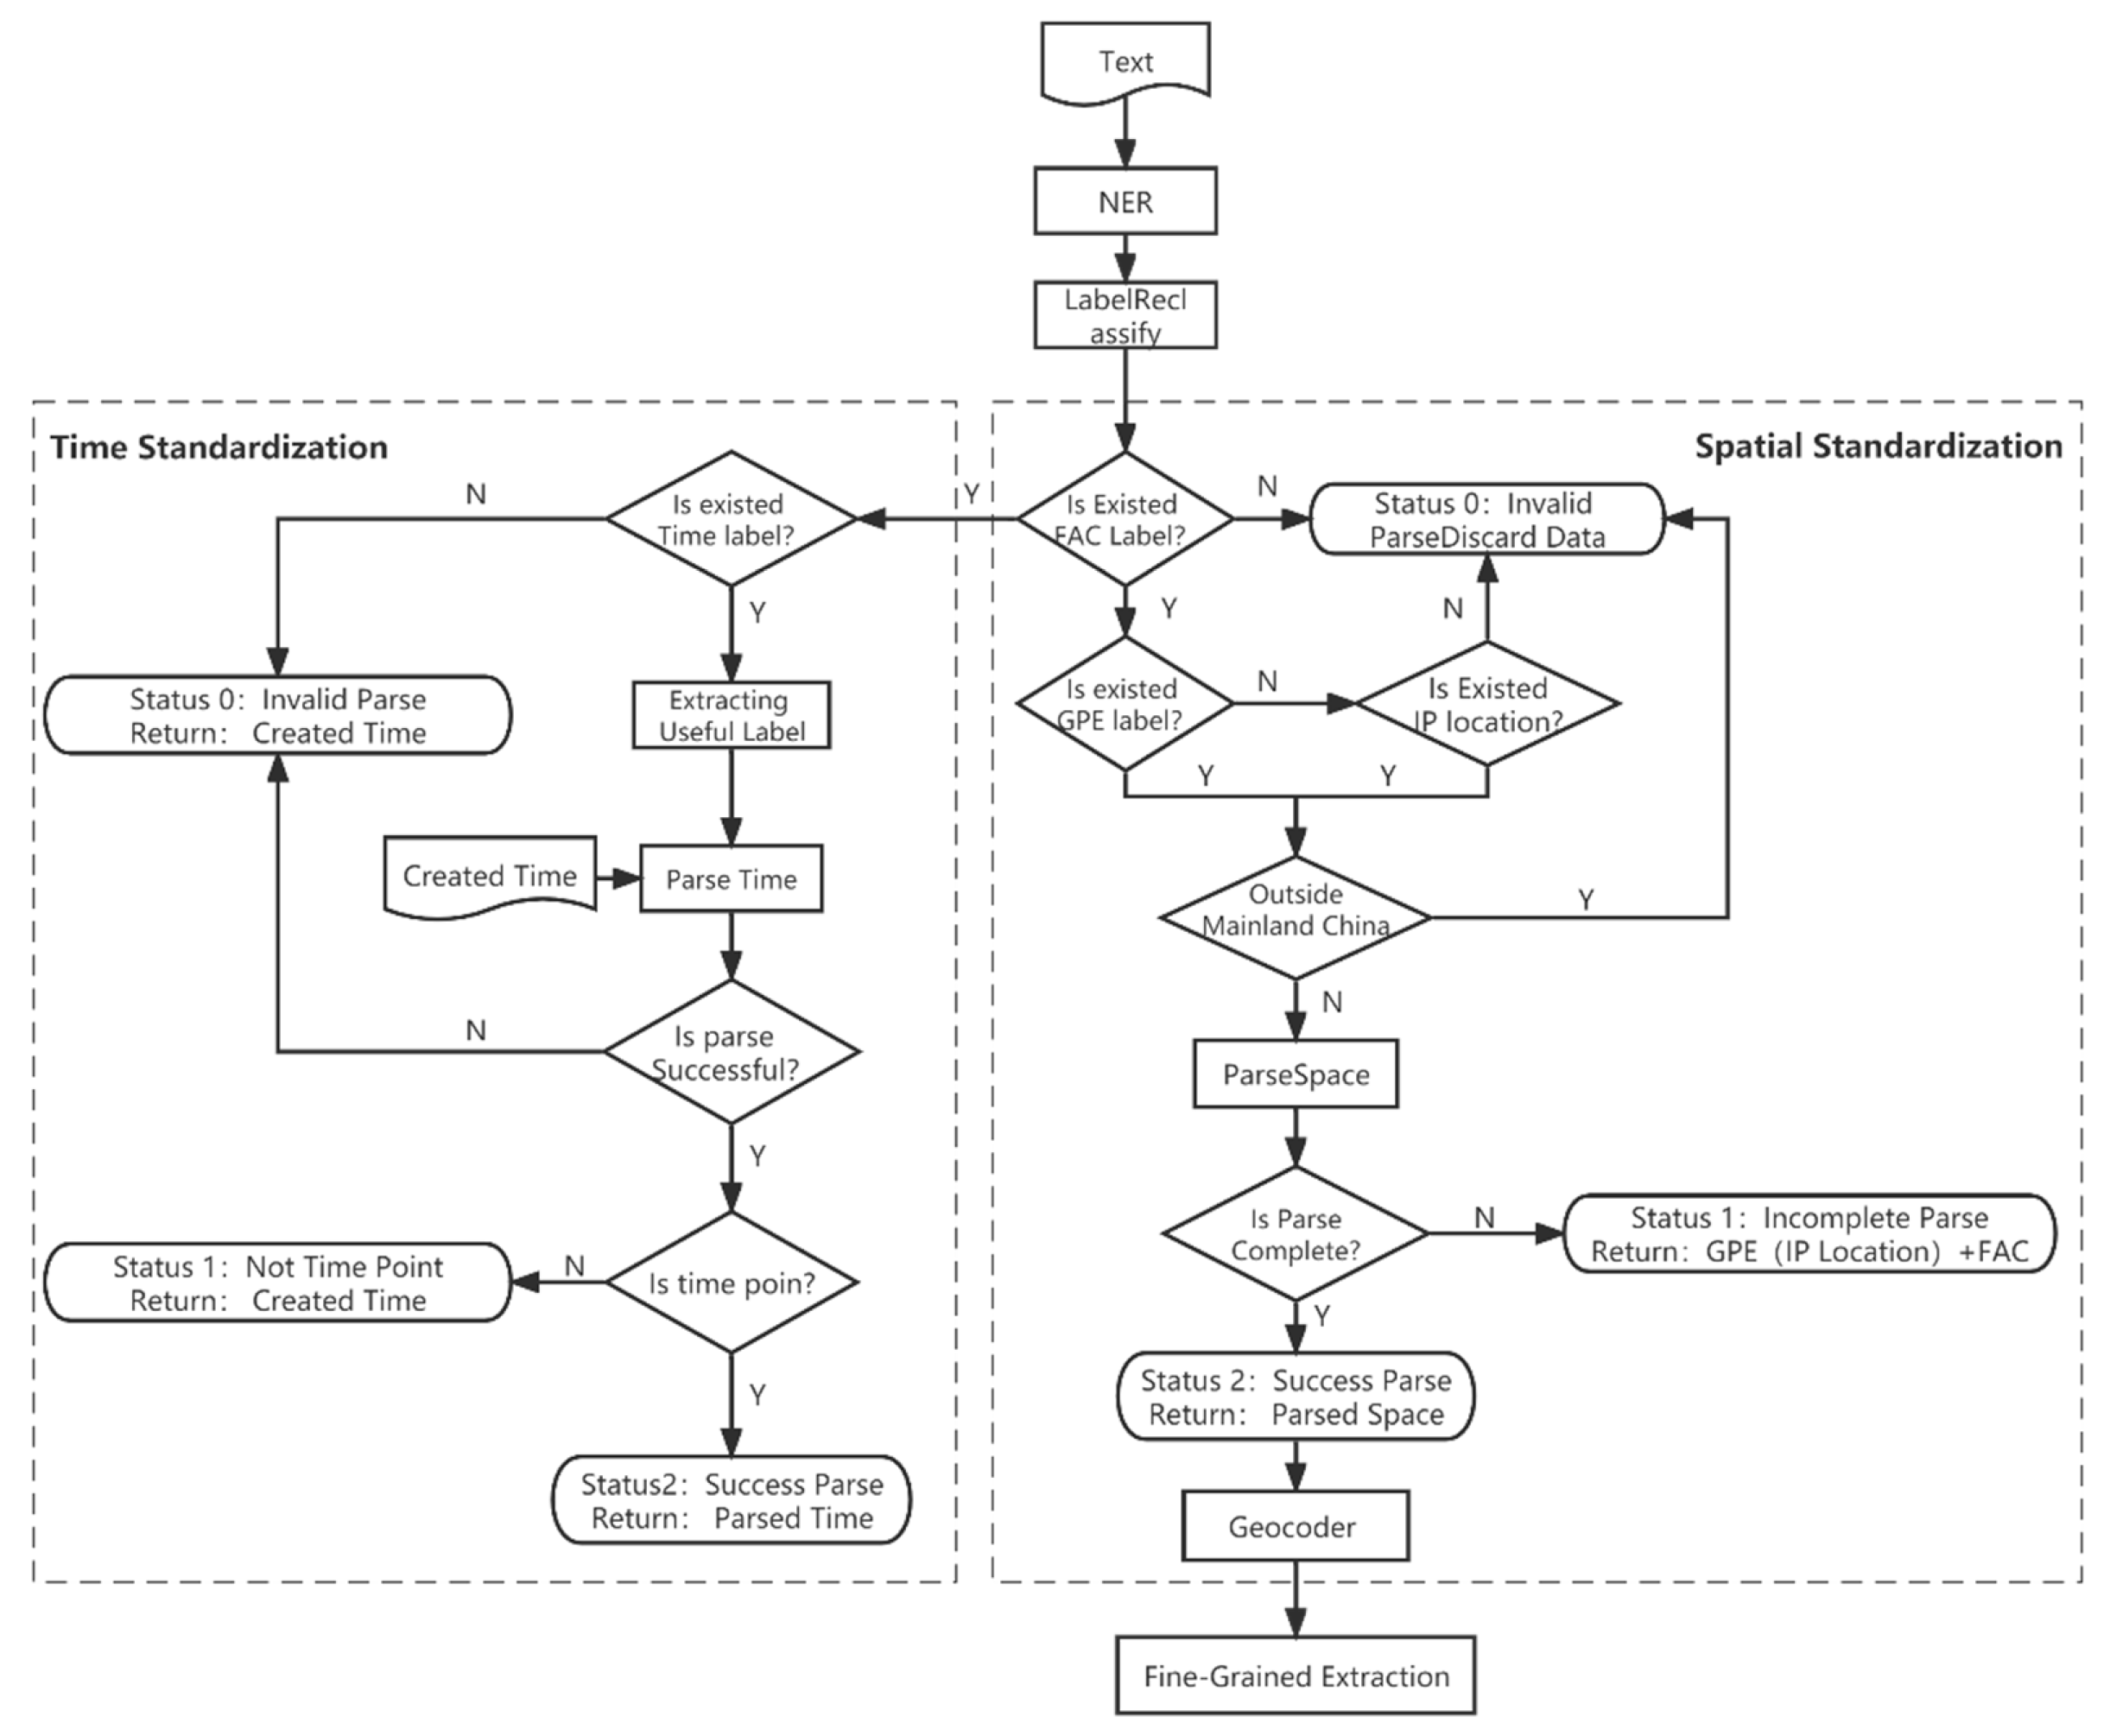
For this research, it is crucial to further refine the spatial information. Therefore, it is first necessary to remove data that do not contain FAC entities to ensure the subsequent research progress. On this basis, for time standardization, it is necessary to determine whether there are TIME class tags in the text. If not, the Weibo posting date is directly used as the final standardized time; if there is, through forward screening of some keywords, such as: "today", "yesterday", "day" etc. We use the time parsing function provided by the JioNLP library based on the Weibo posting time, identify entities with the named entity type as TIME, and use them as revision times for time standardization. Finally, only meaningful time point types are retained; if none, the Weibo posting date is used as the final time.
In the process of spatial information standardization, more situations need to be dealt with. First, determine whether there are GPE tags in the text. Similar to time standardization, address standardization also needs a benchmark. Therefore, the GPE tag is crucial. Notably, starting from August 1, 2022, the National Internet Information Office requires internet information service providers to display user IP address ownership information, providing new possibilities for texts that only have FAC tags but no GPE tags. However, cases involving foreign countries or regions outside China need to be excluded. In successful cases with GPE tags or IP address ownership and FAC tags, the address recognition function provided by JioNLP is used to standardize the content of the GPE tag to the "District (County)" unit.
The different standardized result states returned by the above spatio-temporal standardization are classified, mainly into three categories: 0, 1, and 2. Among them, 0 represents the failure of standardized parsing, 1 represents incomplete standardized parsing, and 2 represents successful standardized parsing. According to the different types of standardization parsing, we only convert the spatial information after standardization of categories 1 and 2 into Wgs1984 coordinates using the Baidu Maps geocoding API.
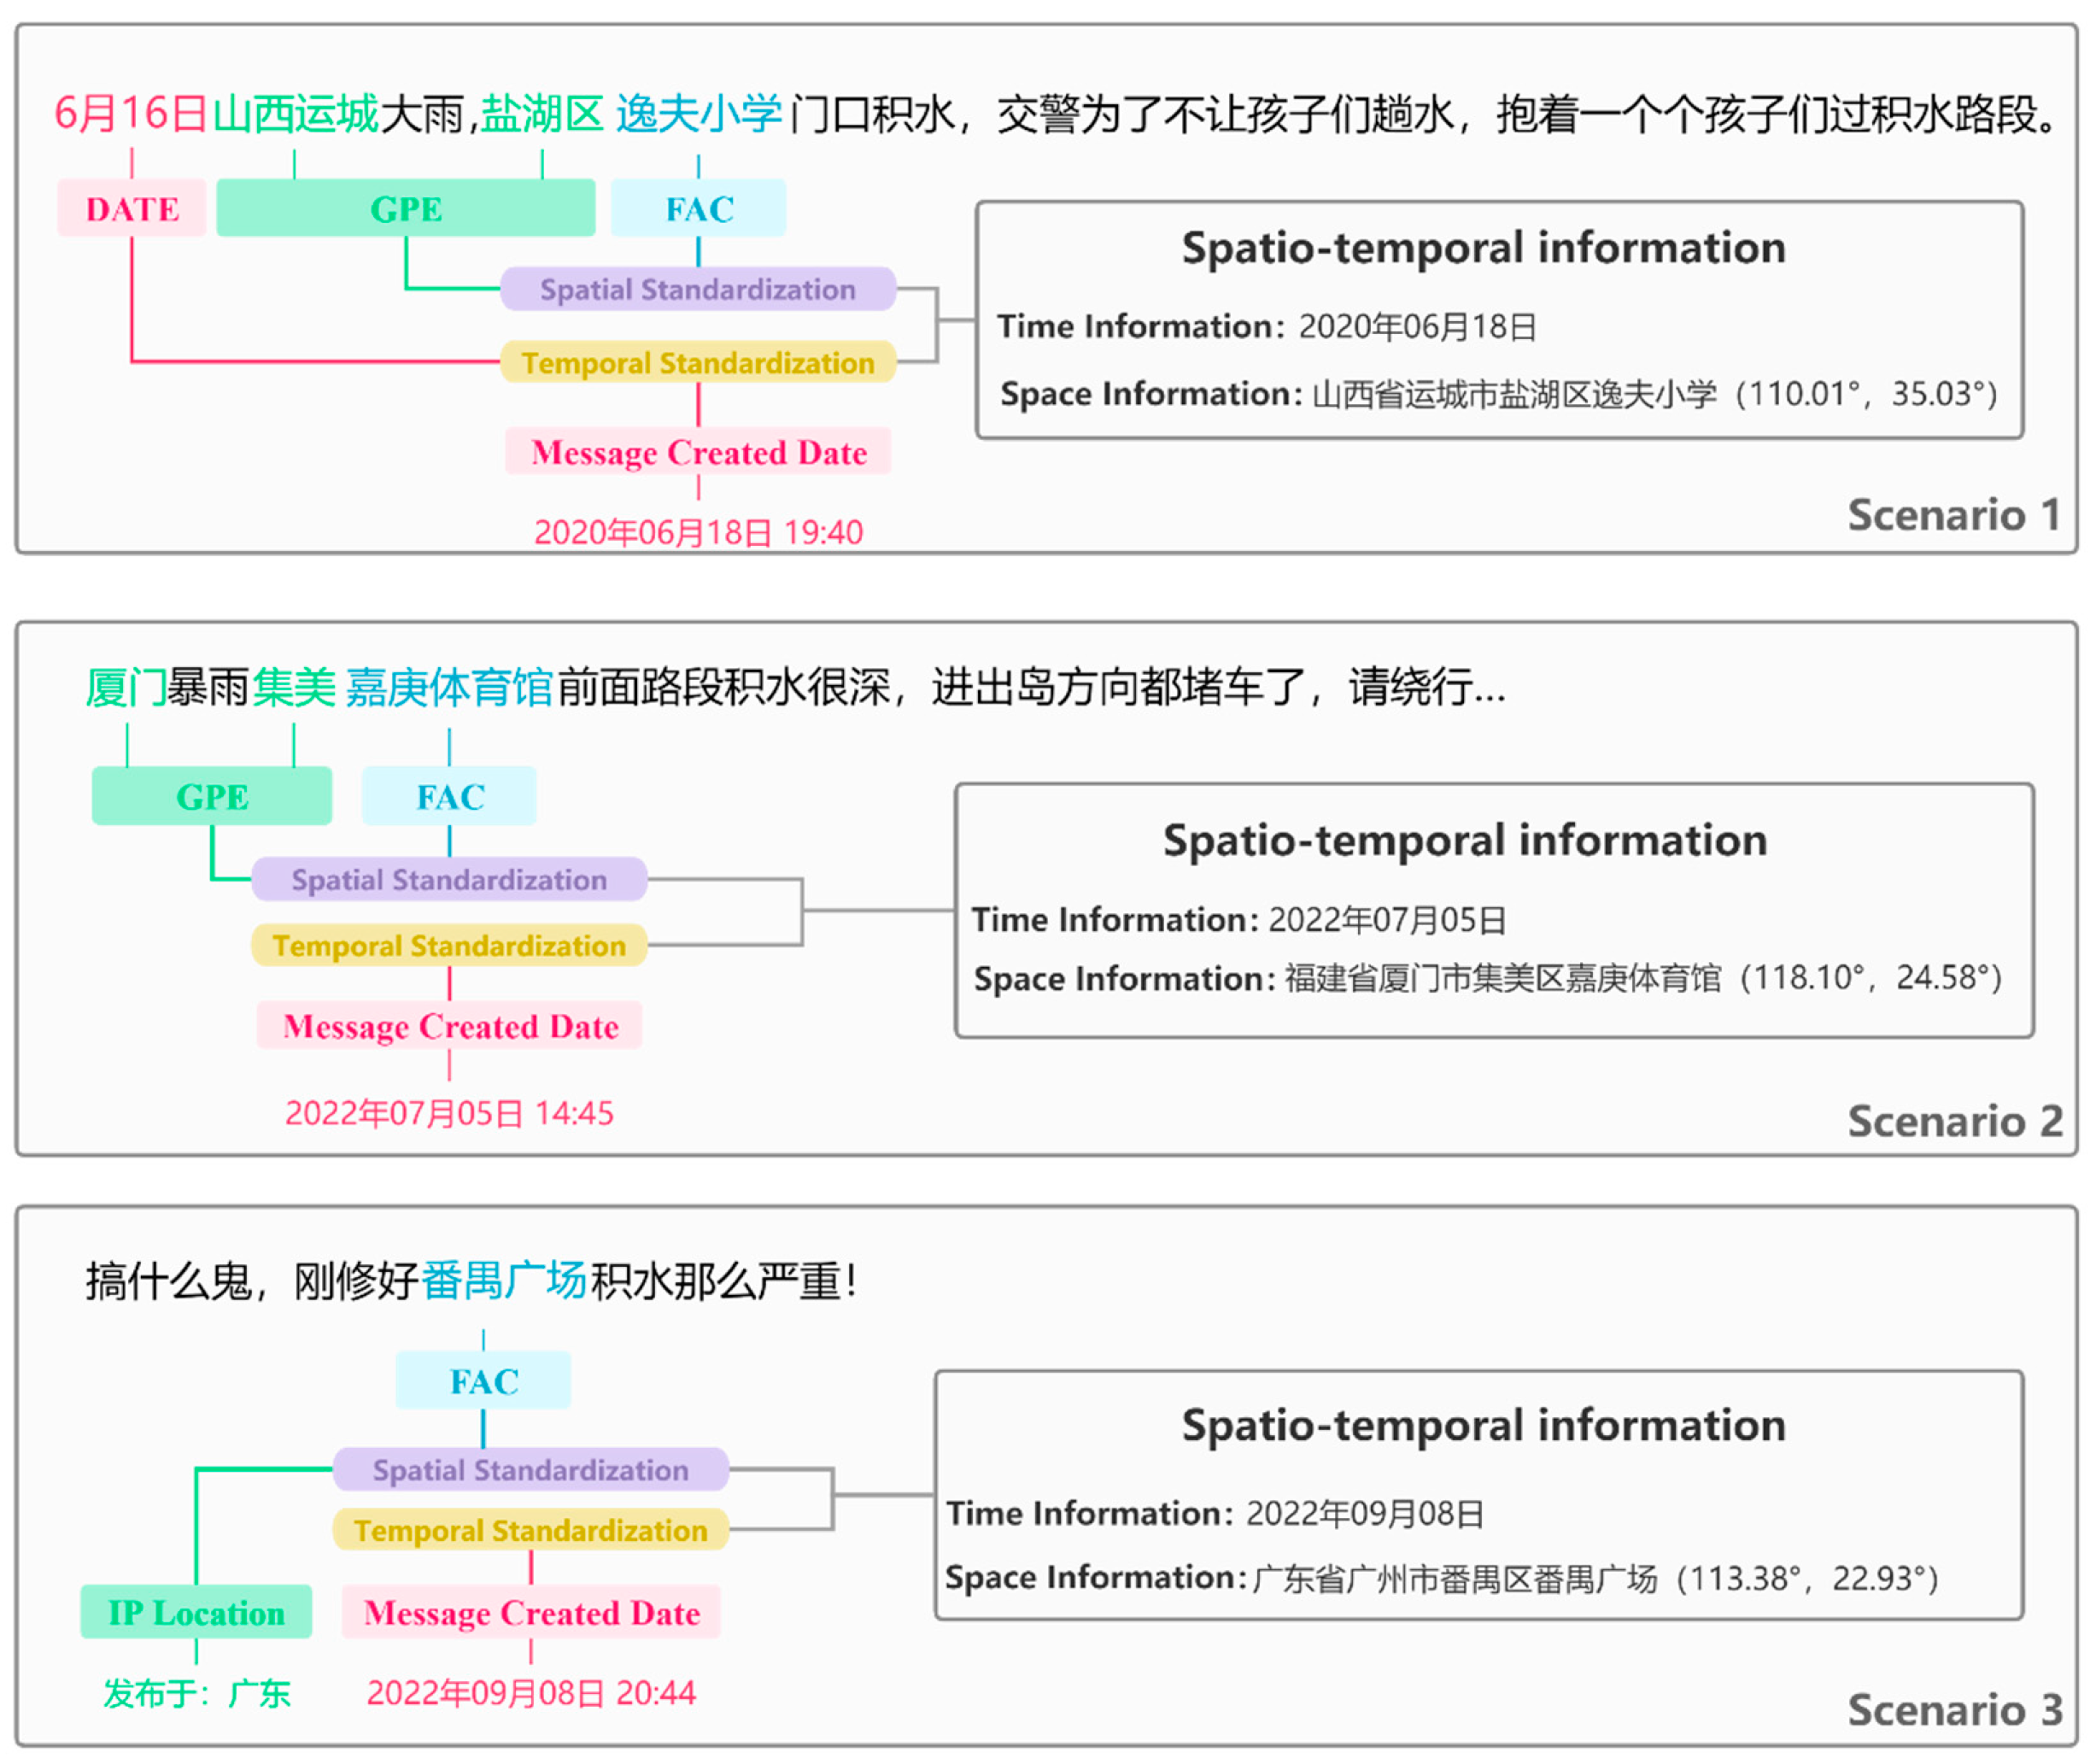
Through these steps, we have achieved effective extraction of coarse-grained spatio-temporal information, laying the foundation for further research. Our overall approach to standardizing spatio-temporal information in Weibo text is visualized in Figure 2, showing the program's response to different standardization return types. Also, three common standardization rule examples are shown in Figure 3.

3.4. Fine-Grained Extraction of Spatial Information

To extract fine-grained spatial information from social media images, a series of image processing techniques are needed to compare them with street view images containing spatial information, screening for the best match to realize information transfer. The degree of match between the social media image and the street view image determines the reliability of the fine-grained spatial information. To maximize the credibility of this process, we designed a cascading model based on match-extract-evaluate, named LSGL (LoFTR-Seg Geo-Localization).
In social media data, users often express location and orientation based on their perception or understanding of the geographical environment. Hence, the spatial coordinates extracted at a coarse grain could be a representative building or location, whereas specific orientation descriptions (e.g., "nearby," "around the corner," "next to") are difficult to define. To address this issue, we divide the standardized addresses into road and non-road types based on the classification after Baidu Map geocoding. For the road type standardized addresses, we generate street view sampling points at 5m intervals on the corresponding name's OSM vector road network. For non-road type standardized addresses, we create a buffer zone with a radius of 200 centered on it, clip the OSM vector road network within it, and generate street view sampling points at 5m intervals as well.
Due to the randomness of social media, most user-uploaded images are somewhat blurry, significantly affecting the selection of feature points. To solve this problem, the LSGL model adopts the Local Feature Transformer (LoFTR)[32] feature matching method in the matching stage. This method can not only effectively extract feature points from blurred textures but also maintain a certain relative positional relationship between feature point pairs with the help of a self-attention mechanism, significantly improving the performance level of street view image matching.
For an ideal street view image matching task, the feature matching degree between buildings often represents the similarity of the shooting locations of the two scenes. However, in actual operation, the matching task is often affected by the sky, roads, vegetation, and other features with strong similarity information, leading to a large number of feature points in the image that lack reference significance. To reduce the impact of irrelevant information on the matching task, LSGL adopts the DETR model[33], which can efficiently segment images and label them at a relatively low performance overhead level, thereby extracting reference feature points with practical significance for further evaluation.
To select the best matching street view image from all matching results and extract its coordinates, a quantitative indicator for evaluating the degree of image matching needs to be established. With this goal in mind, we use the reference feature points of each scene image to design this indicator from the two dimensions of feature vector matching degree and spatial position difference of feature points.
First, we consider the feature vector matching degree of feature points. For the LoFTR feature matching method, it can output the coordinates of the feature points and the corresponding confidence level. We first screen out feature points that do not belong to the target category based on their coordinates. Then, we use a traversal statistical method to calculate the number of remaining feature points. Next, we multiply the confidence level of each feature point and sum them, then take the average of the accumulated results to represent the credibility of all feature points in this image. This can be expressed mathematically as:
R = i = 0 n C i n ,
In the formula, R represents the feature vector matching degree of the feature point, n represents the number of feature points, and C i signifies the confidence of feature points.
Second, we consider the spatial position difference of feature points. As user images come from Weibo and are influenced by user devices, shooting level, etc., the features and objects in their images may be slightly offset compared to street view images. However, the spatial relationship between feature points should remain similar. Therefore, based on the coordinates of each pair of feature points in their respective images, we calculate their Euclidean distance and Euclidean direction as follows:
E d = ( x x 0 ) 2 + ( y y 0 ) 2 ,
E a = t a n 1 y y 0 x x 0 ,
In equations (2) and (3), E d and E a respectively denote the Euclidean distance and direction of the feature points in the user image and the reference image. x , y represent the coordinates of the feature points in the user image,while x 0 , y 0 signify the coordinates of the feature points in the reference image.
In order to assess the impact of changes in Euclidean distance and direction on the spatial position of feature points, we calculated the root mean square error for these two indices separately, resulting in RMSED and RMSEA. Multiplying these two values yields the spatial position discrepancy of the feature points, as shown in equation:
S M = R M S E d × R M S E a ,
Standardizing the indicators can more intuitively reflect the relative advantages of the evaluation results. Therefore, it is necessary to process the results of individual evaluations and round evaluations. The main methods are as follows:
S t a n R = R R m a x R m i n ,
S t a n S M = S M S R m a x S R m i n ,
In these equations, R and S M represent the matching degree and spatial position discrepancy of the feature vector in a single match, respectively. R m a x and R m i n are the optimal and worst feature vector matching degrees in a single round of matching, respectively. S R m a x and S R m i n are the optimal and worst spatial position discrepancies in a single round of matching, respectively.
Given the differing impacts of these two factors on the results of feature point matching, we have constructed the following final scoring method:
M = S t a n R S t a n S M ,
The more reliable the result of feature matching is, the higher the feature vector matching degree and the lower the spatial position matching degree.
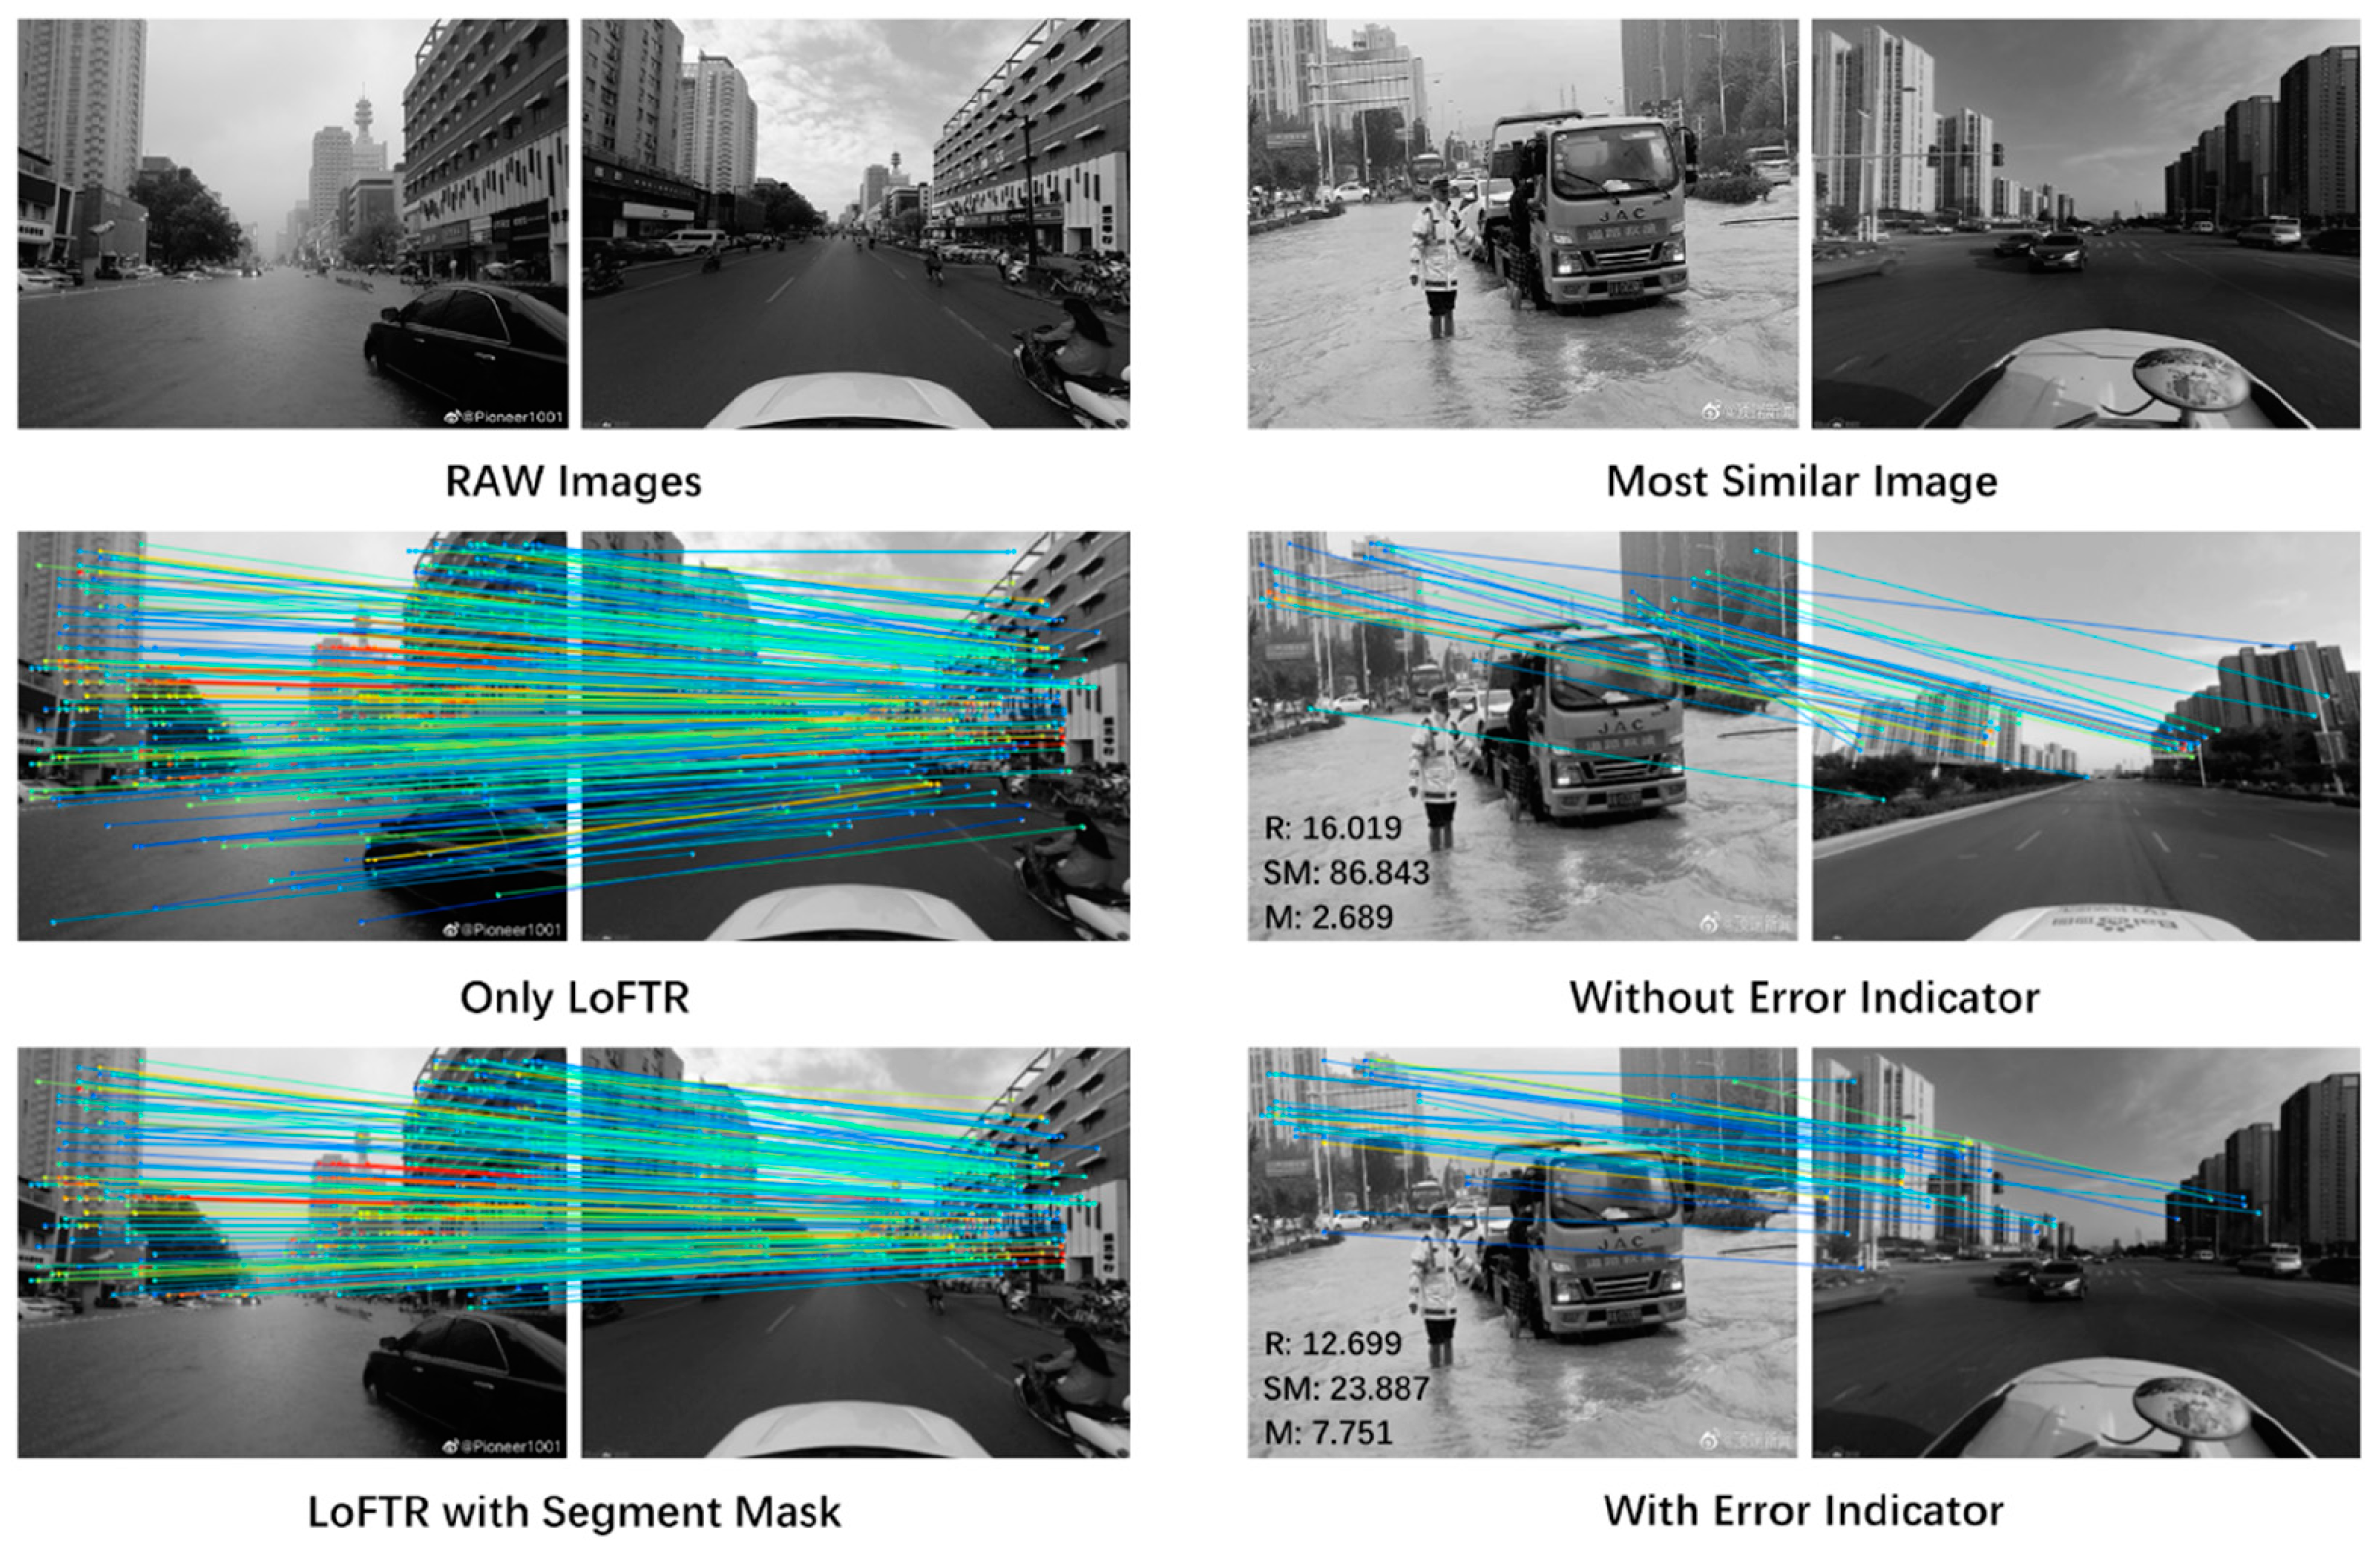
Finally, we select the image with the optimal M value from all matching results and obtain its specific coordinates. We return this as the fine-grained spatial information. Through this series of processes, we have established a cascaded model that can better extract fine-grained spatio-temporal information. Figure 4 shows the impact of each level in this model on the image matching result.

4. Experiments and Results

4.1. Research Area Dataset

The paper selected the "July 20 Heavy Rainstorm in Zhengzhou" as a case study to validate the effectiveness of the MIST-SMMD method. This event caused severe damage to the local area and sparked extensive discussion on social media, therefore it has rich potential for exploration. We employed 11 keywords highly related to urban waterlogging, such as "inundation", "water accumulation", "flooding", "water invasion", "water rise", "water disaster", "sweeping away", "drainage", "wading", "water intake", and carried out web scraping and preprocessing of Weibo data from July 18 to July 20, 2021. After data preprocessing, we obtained a normalized dataset of the Zhengzhou heavy rain and waterlogging event. Table 3 shows the statistics of Weibo data preprocessed during these three days.
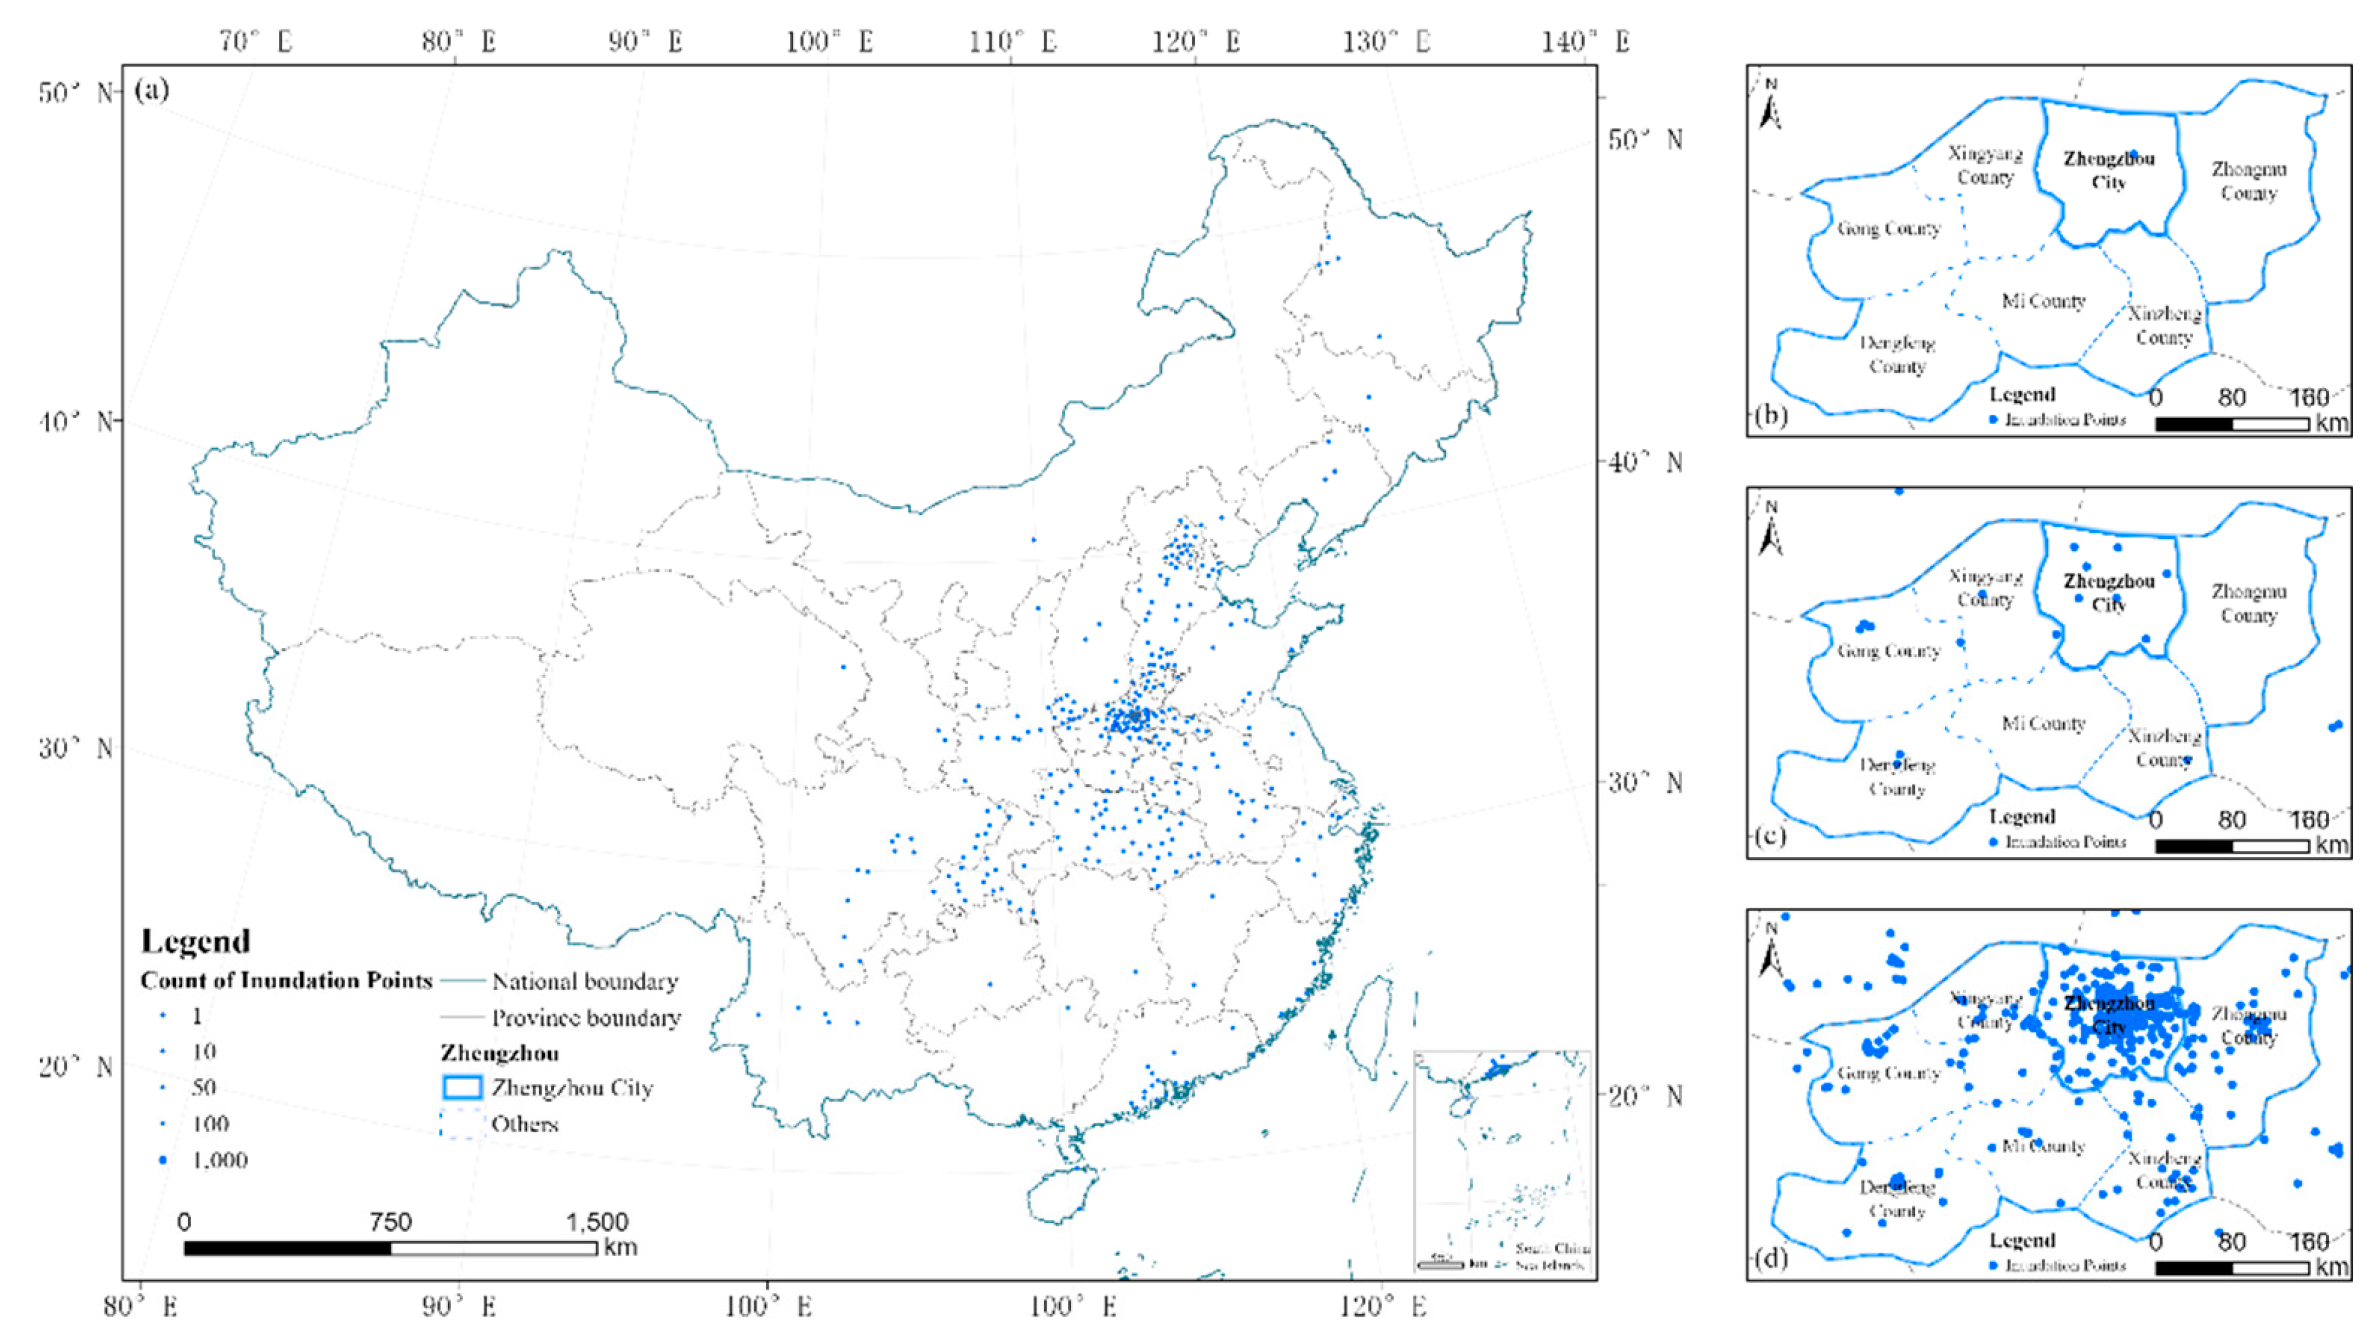
As per Table 3, Weibo data related to waterlogging events was preprocessed from the original 26,560 entries to 3,047 normalized data entries. At the same time, it can be seen that data with both text and pictures (videos) are more common than data with text only. This further confirms the richness of multimodal data in social media. However, since Weibo, this social media platform, targets users across China and even worldwide, in order to filter the data to the scope of Zhengzhou city, it is necessary to carry out coarse-grained spatio-temporal information extraction and further spatial screening. Figure 5 displays the spatial distribution of the waterlogging event points extracted at a coarse-grained level across China (a) and within the boundaries of Zhengzhou city (b,c,d) over the three days.
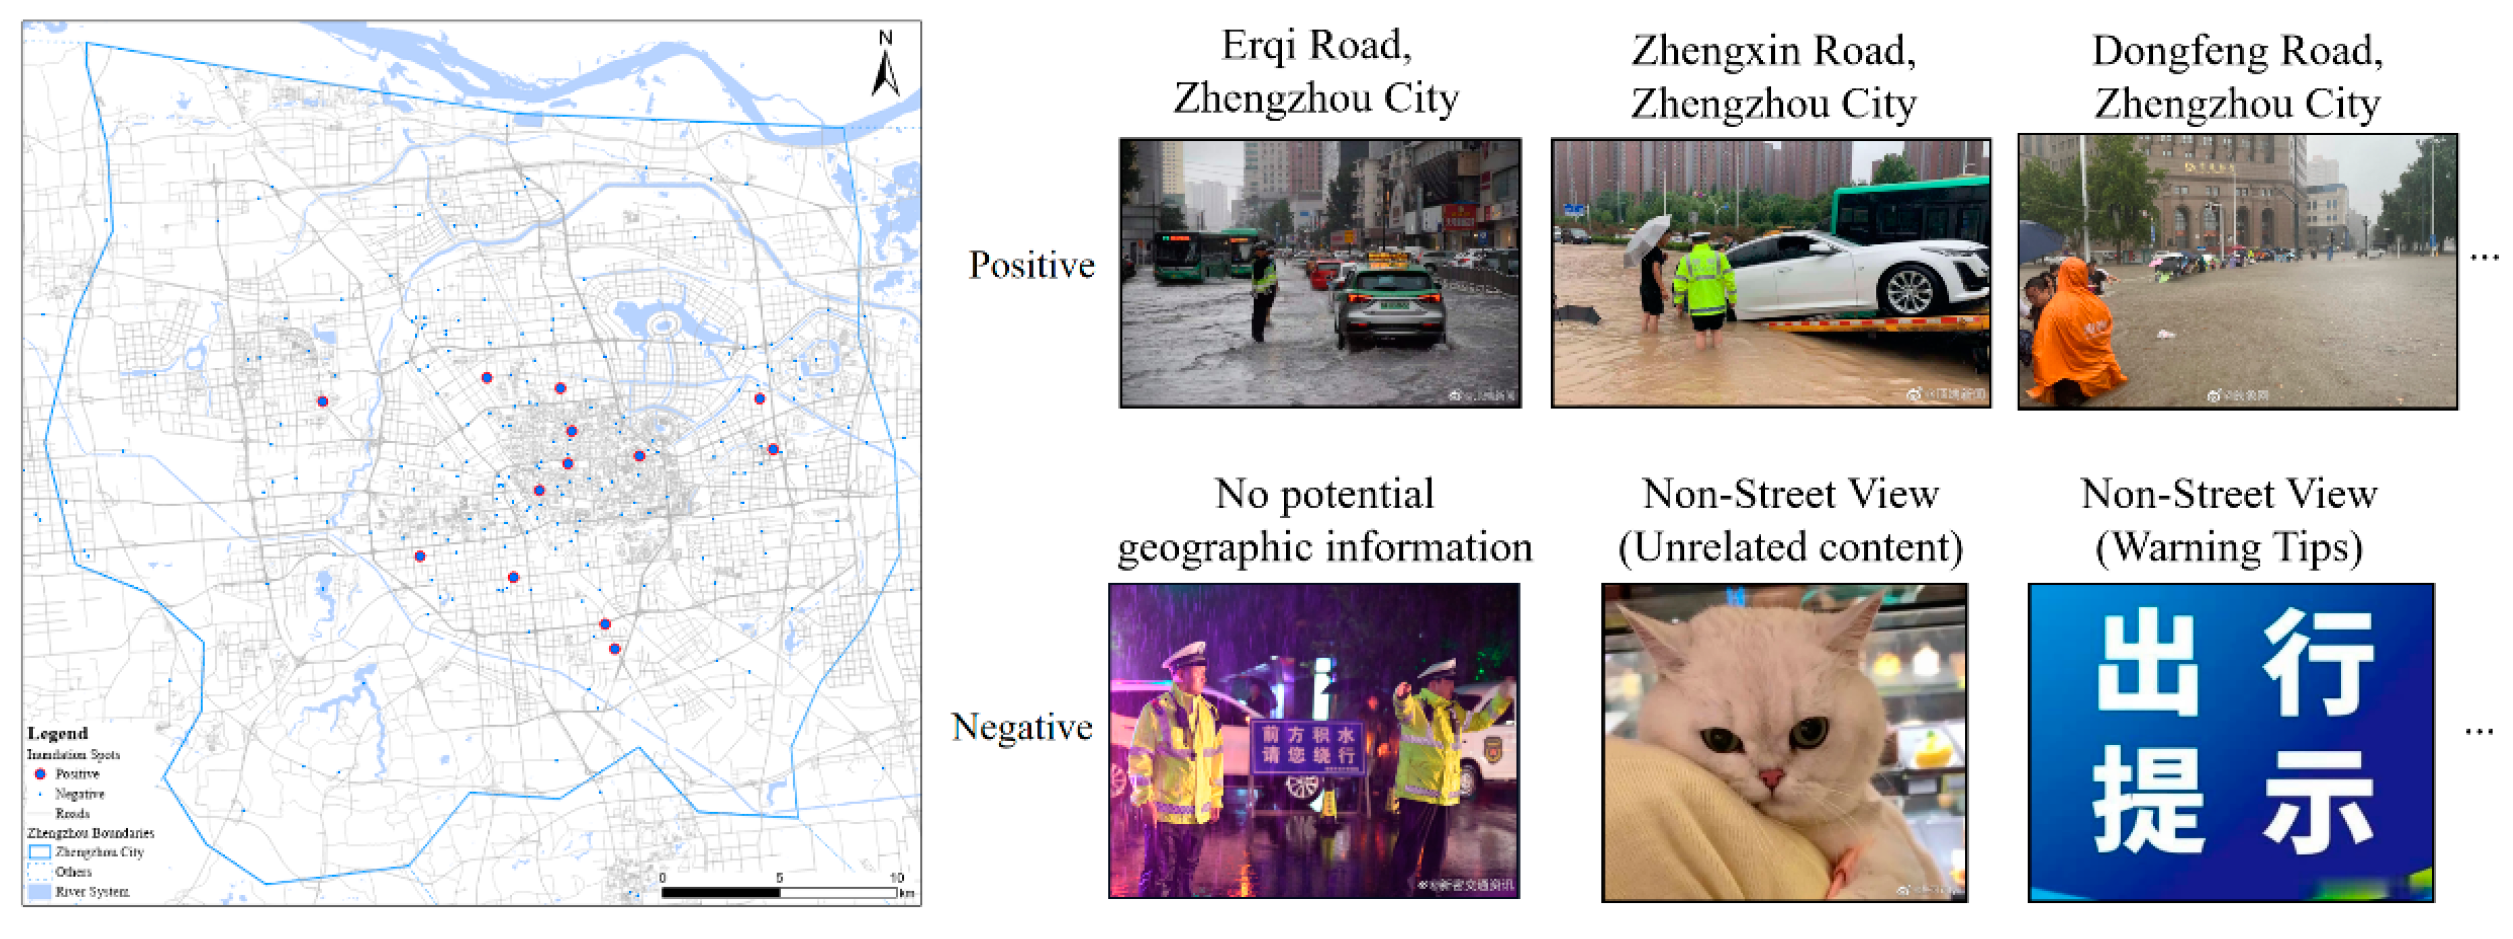
When extracting fine-grained spatial information from the normalized data, we found that over half of the Weibo posts had pictures or video data. However, due to the randomness of social media data, the pictures in the same post often have no direct connection with the text. This implies that even if a spatial information is mentioned in a post, the picture may not necessarily be related to the spatial information mentioned in the post. Such situations are common. In addition, the quality of pictures or videos uploaded by users varies greatly, and in reality, there are not many clear, high-quality street view pictures with potential spatial information available. In order to further explore multimodal data, we used a semi-manual method to determine whether each user-uploaded image was a street view photo based on street view semantic segmentation, followed by manual screening. We selected Weibo posts with high-quality related images and established a connection with the standardized addresses obtained during coarse-grained extraction. In this way, we screened out 23 pairs of high-quality Weibo text and image data, categorizing them as "Positive", while the coarse-grained standardized address points without high-quality, relevant pictures were labeled "Negative". Figure 6 shows the Positive and Negative points in Zhengzhou city area from July 18 to July 20, 2021, along with several typical Positive and Negative corresponding images.
Next, in section 4.2, we will introduce how to ensure that the waterlogging event points extracted by the MIST-SMMD method accurately reflect the spatio-temporal information of urban waterlogging.

4.2. Evaluation Metrics

To comprehensively evaluate the accuracy of the extracted event point spatial information and verify the advantages of multimodal data, this study designed two methods for evaluation.
The accuracy of the standardized spatial information extracted at the coarse-grained level is based on the spatial distribution of flood inundation in the Zhengzhou city heavy rain and flood disaster as the benchmark dataset. When the spatial information exists in a submerged area within a specified nearby range, the spatial information is considered accurate. It should be noted that ourmethod serves mainly as a supplement to traditional methods, so here we only evaluate the precision metric and do not involve recall.
The calculation formula for spatial precision is:
S p a c i a l   P r e c i s i o n = T P T P + F P ,
where T P represents the number of coarse-grained flood points where there is a submerged area within a specified nearby range, and F P represents the number of coarse-grained flood points where there is no submerged area within a specified nearby range.
For the 23 coarse-grained spatial information points that have been fine-tuned in this case study, due to the limited number of samples, we use S p a c e E r r o r as an evaluation metric to unify different methods. Moreover, we have extended two different metrics: the error between the spatial coordinates after fine-grained correction and the real coordinates under the evaluation of limited samples, and the superiority of the spatial information introduced by the image modality compared to the spatial information using only the text single modality.
M A E S E = 1 n i = 1 n S p a c e   E r r o r ,
R M S E S E = 1 n i = 1 n ( S p a c e   E r r o r ) 2 ,
In this case, S p a c e   E r r o r   is the geodesic distance between the real spatial coordinates and the fine-grained predicted spatial coordinates, where n is the number of samples.

4.3. Result

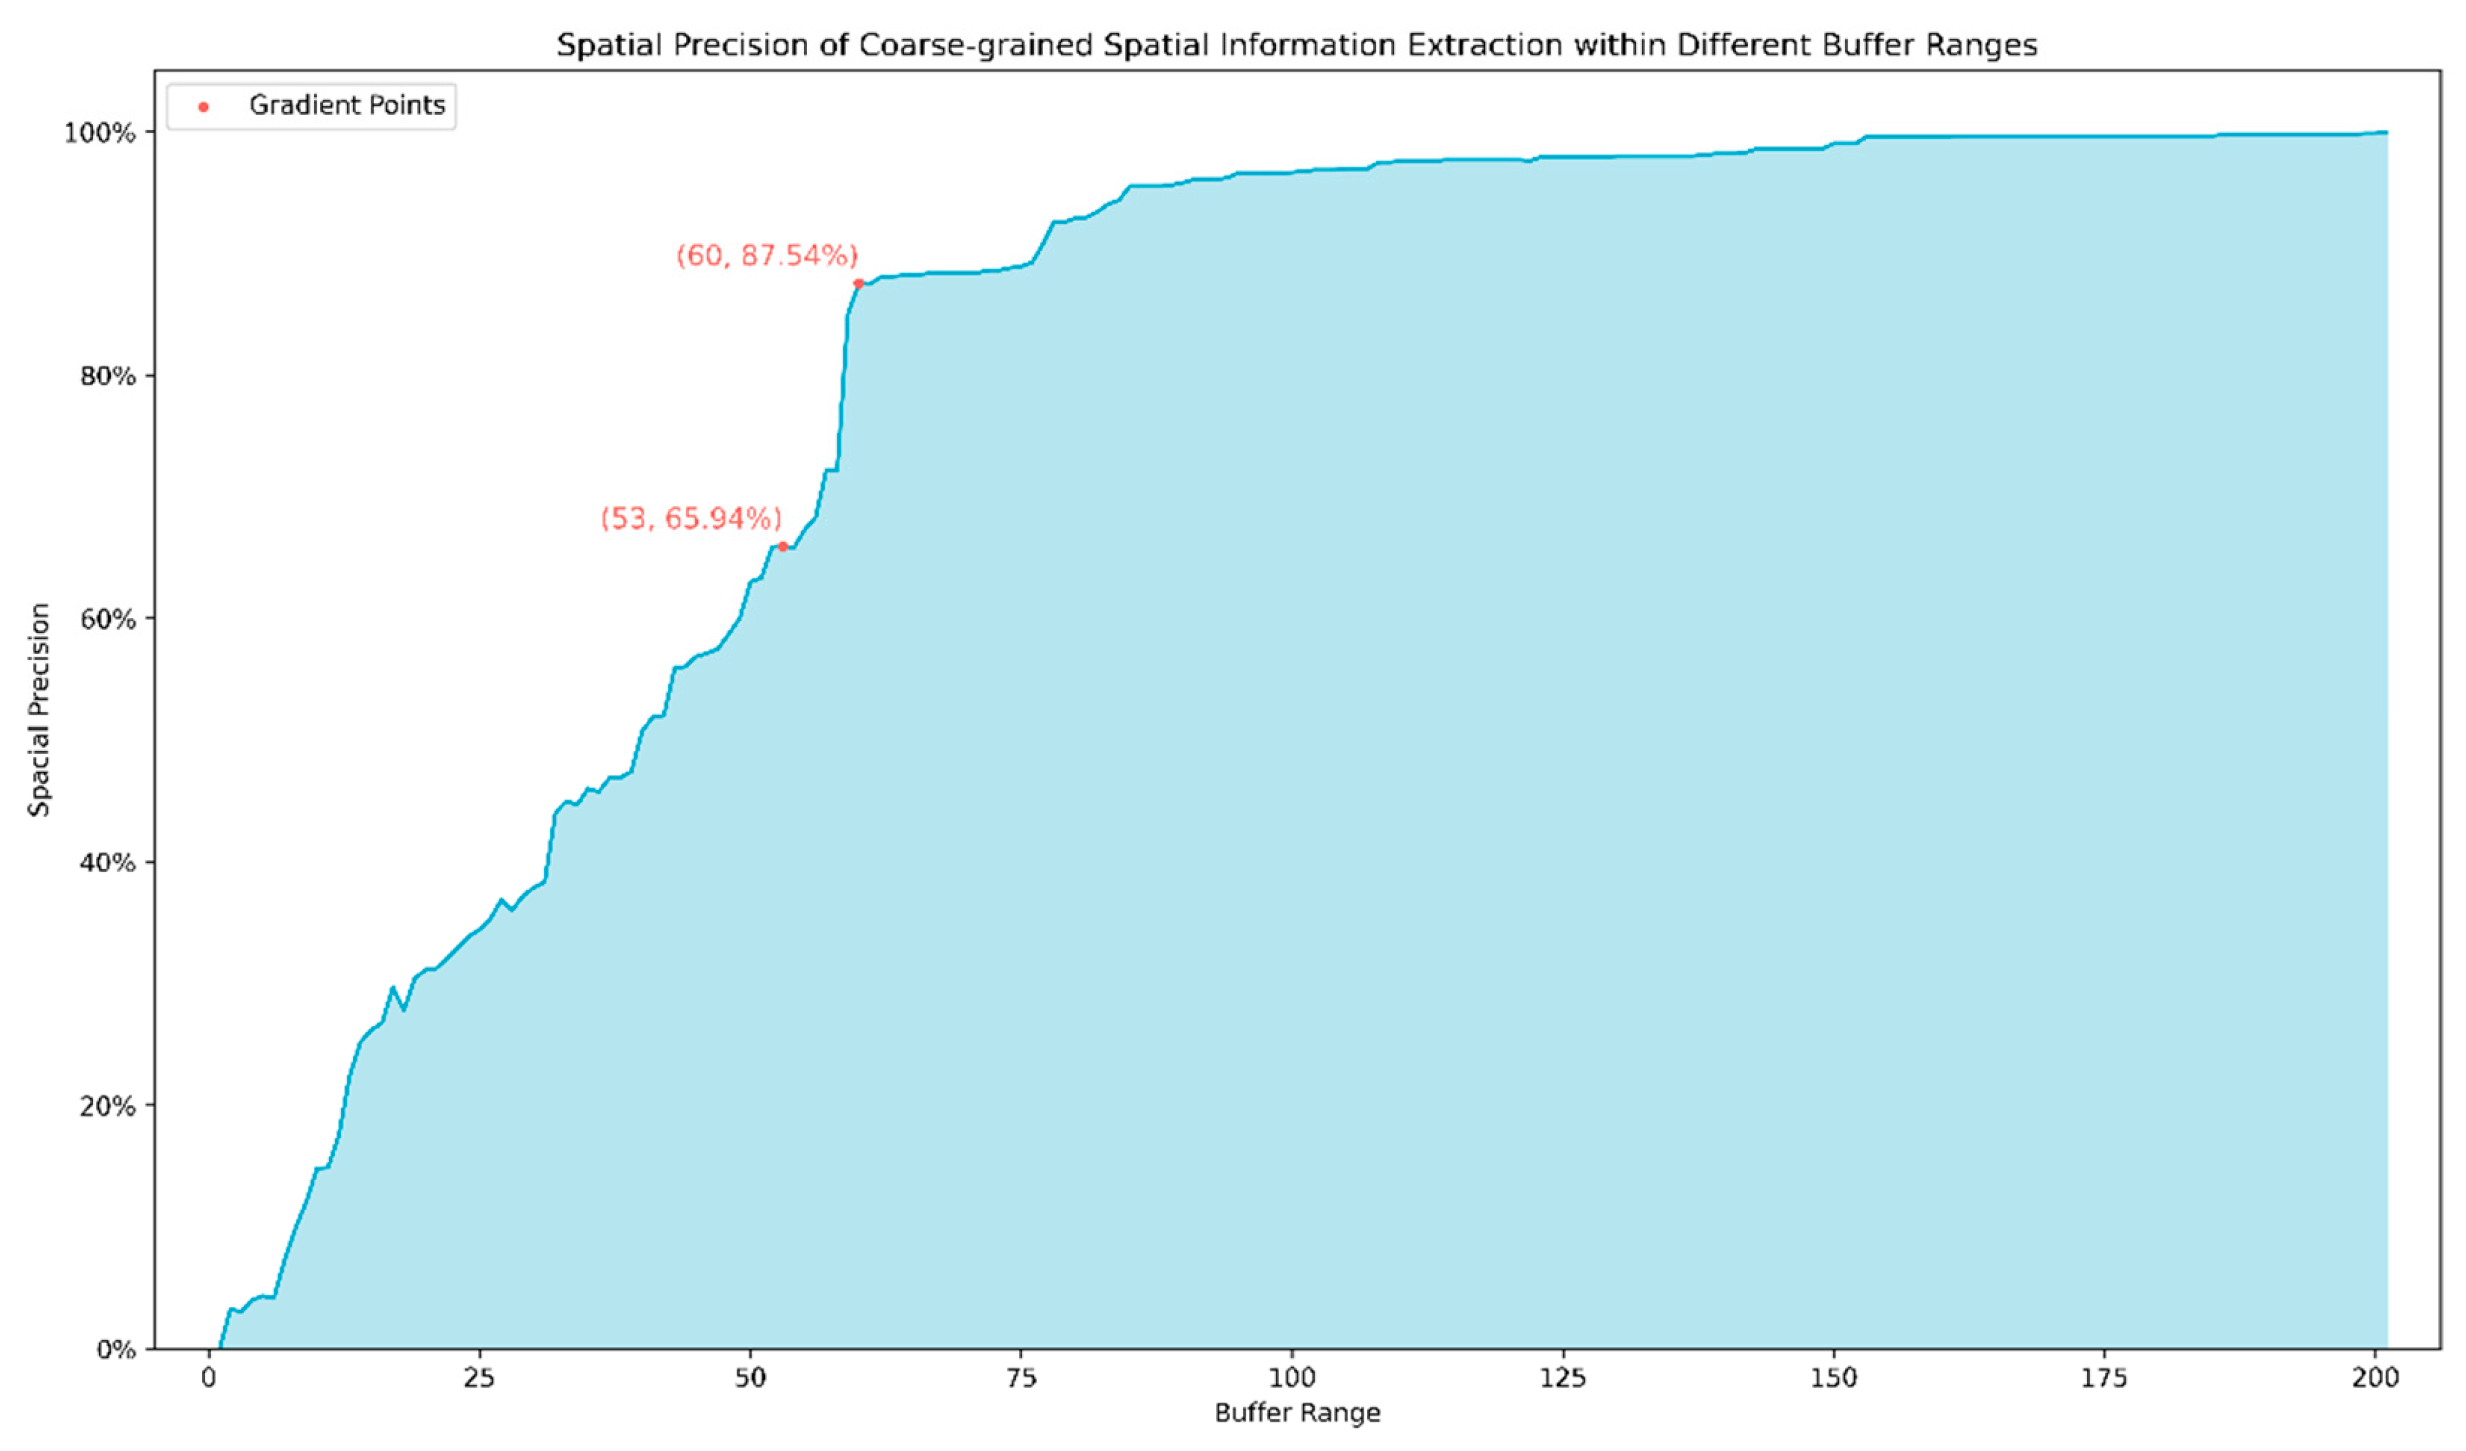
Figure 7 shows the spatial information extraction at the coarse-grained level within different distance ranges. Table 4 shows the spatial errors of different combinations of three steps in the extraction of fine-grained spatial information, including Feature Matching (FM), Semantic Segmentation (SS), and Quantitative Indicators for Feature Matching (QIFM). Finally, Table 5 shows the comparison of spatial errors between extracting coarse-grained spatial information using only text single modality and correcting coarse-grained spatial information by combining image modality data.

5. Analysis and Discussio

5.1. Effectiveness Analysis of the Method
This study conducted thorough experiments and evaluations on the "July 20 Heavy rainstorm in Zhengzhou" incident. In the coarse-grained extraction of spatial information (as shown in Figure 7), we found that as the defined nearby range increased, the Spacial Precision of the extracted waterlogging event points also increased correspondingly. Notably, we discovered two Gradient Points (referring to local maxima of the Spacial Precision curve, representing points where Spacial Precision grows rapidly within a certain range). When the range expanded to 53m, the Spacial Precision reached 65.94%, and when the range further expanded to 60m, Spacial Precision increased to 87.54%. Ultimately, within a range of 201m, Spacial Precision reached a peak of 100%. This suggests that our coarse-grained spatial information extraction method can cover most of the inundated areas within a relatively small range (such as 53m and 60m), demonstrating the effectiveness of coarse-grained spatial information extraction.
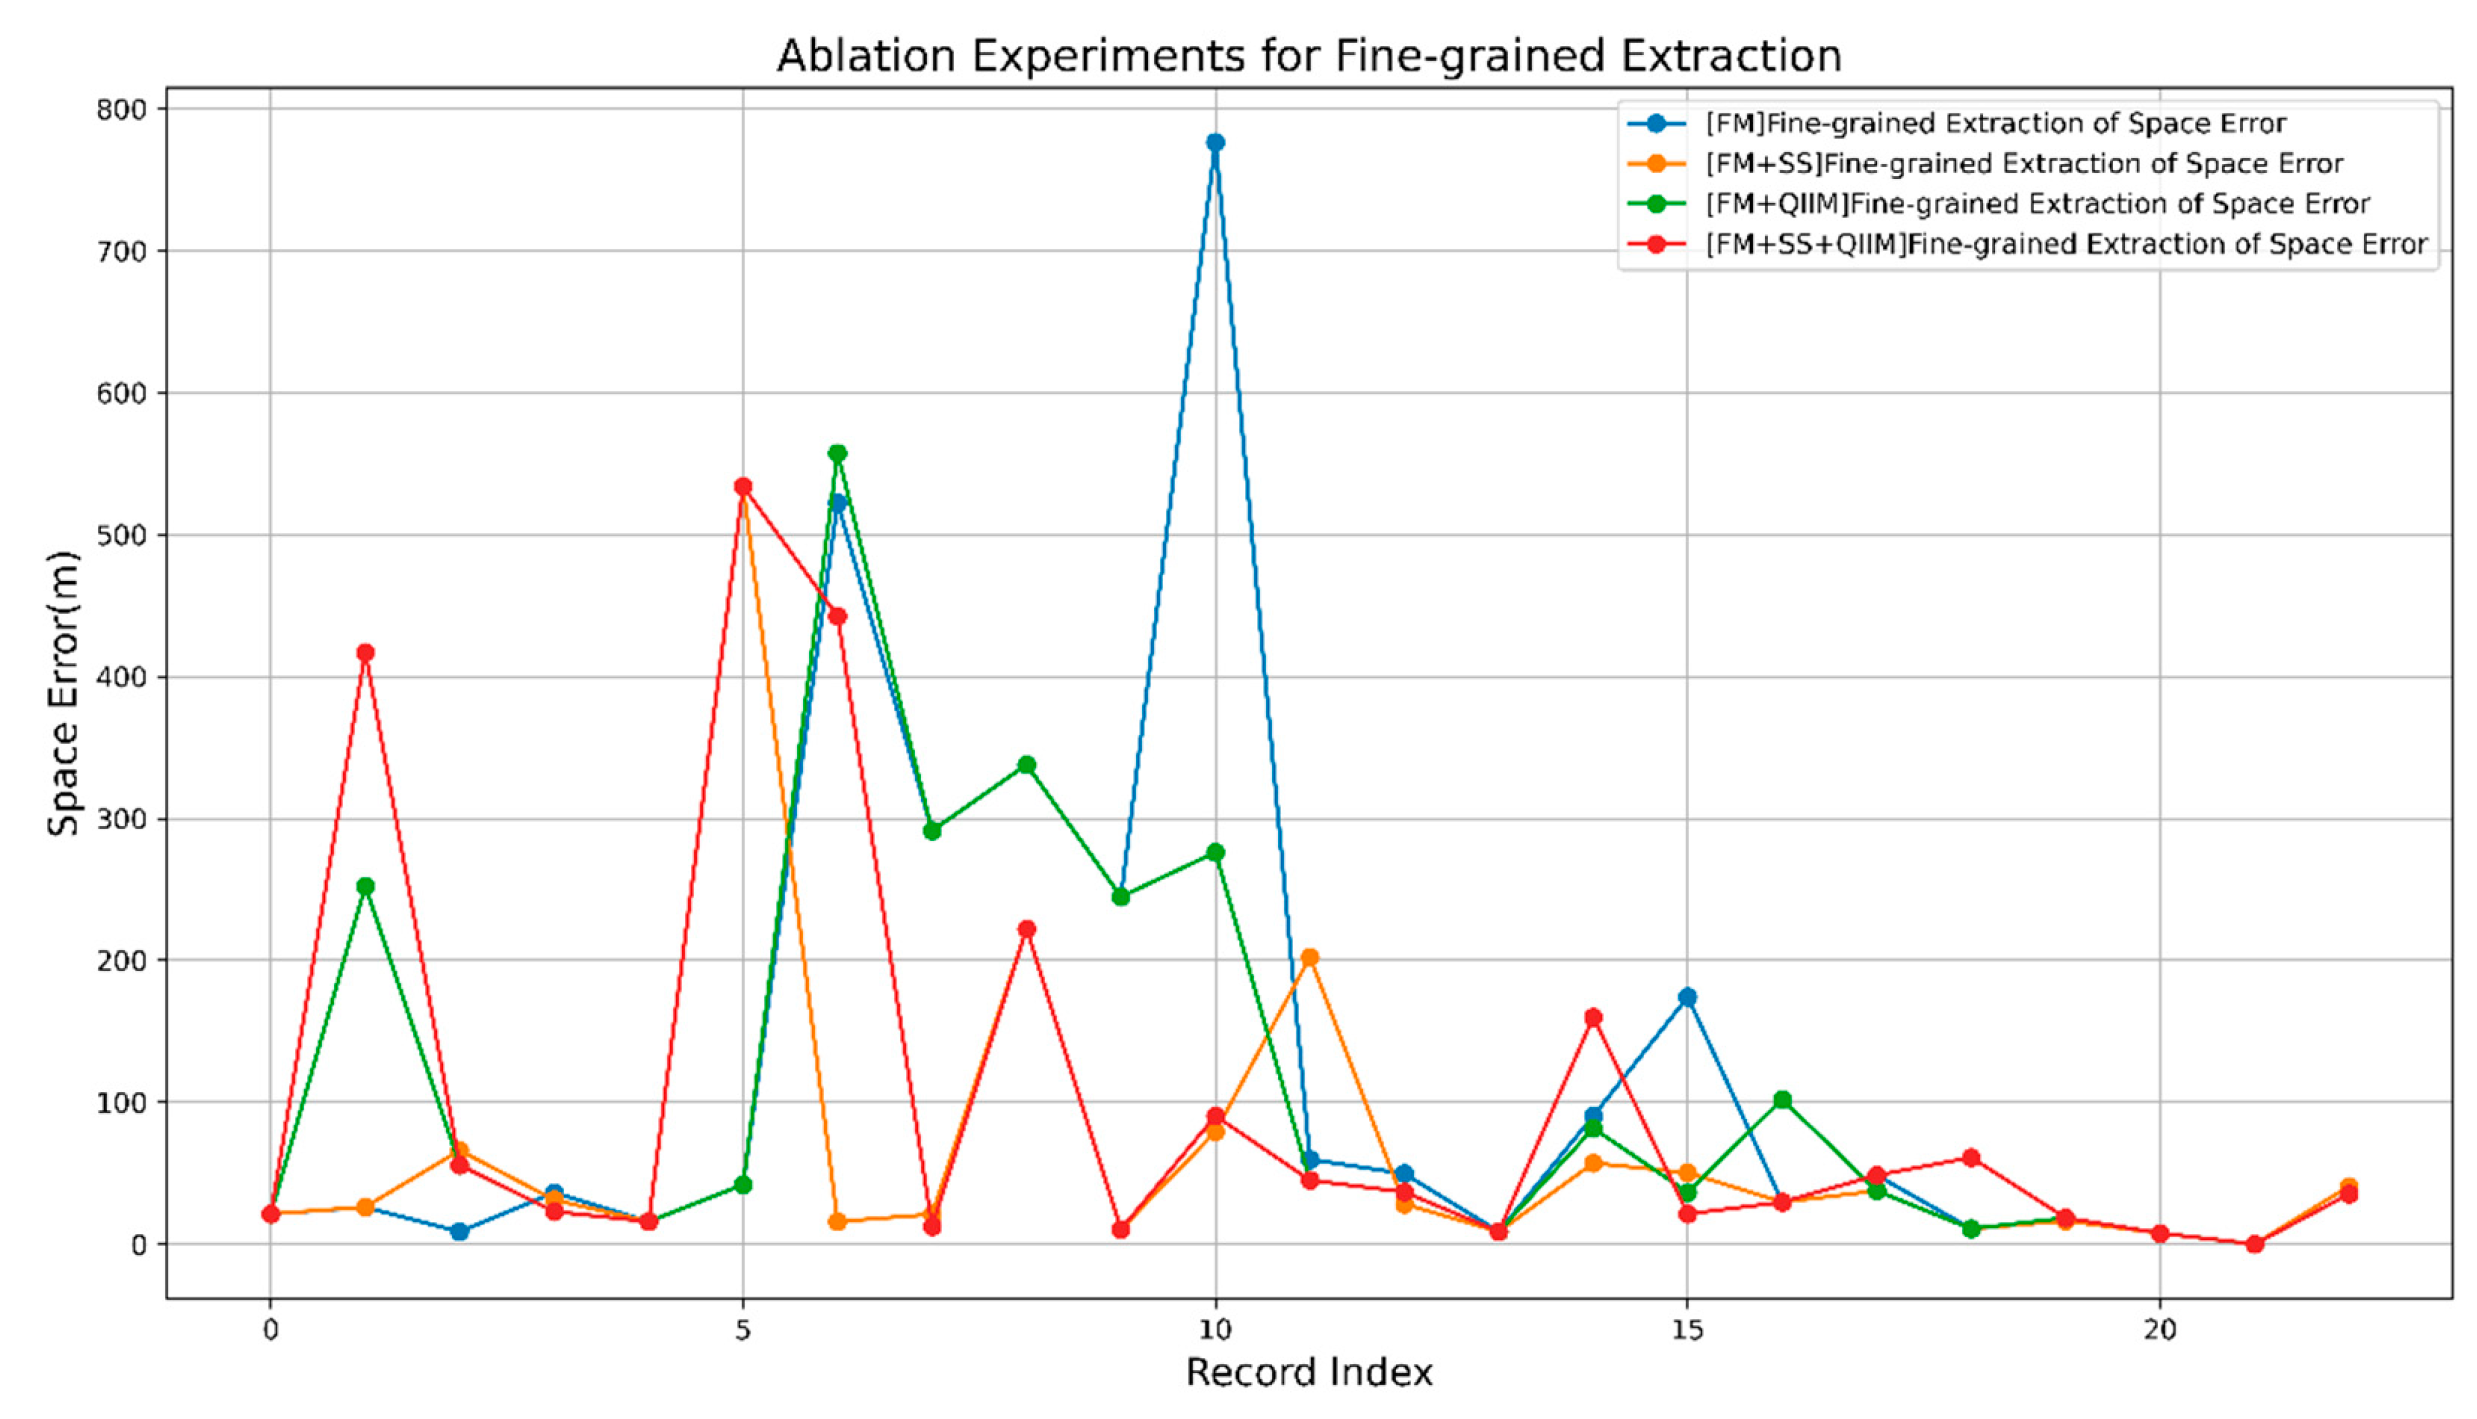
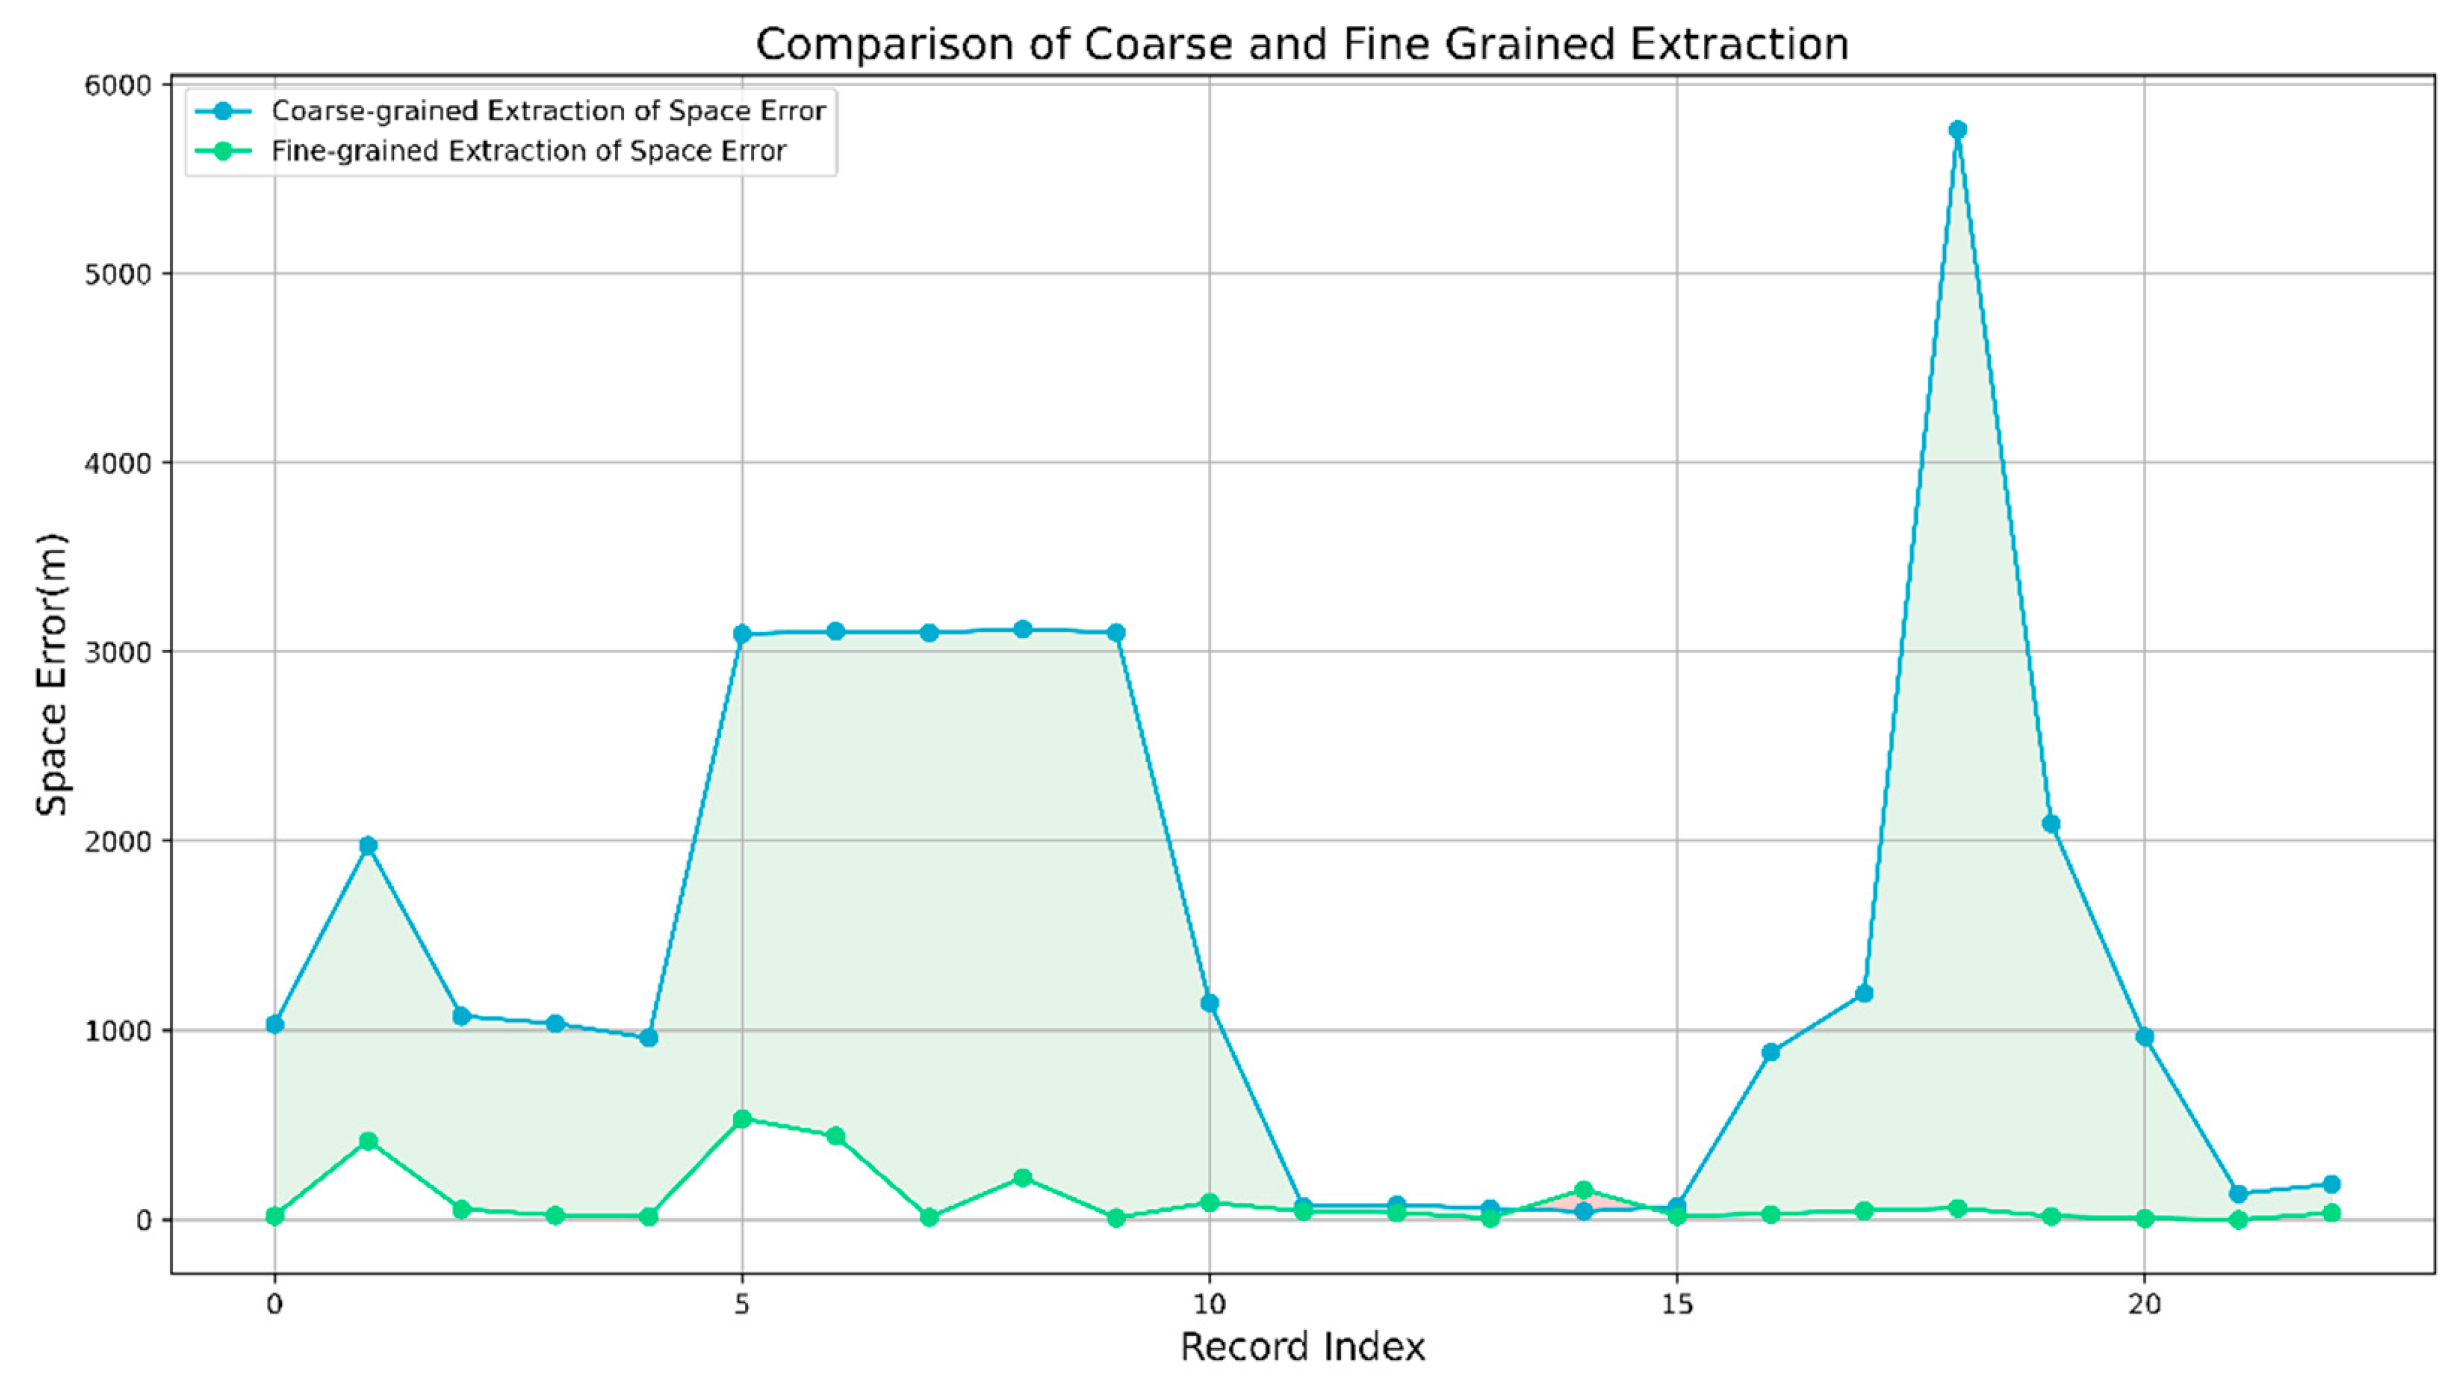
After performing fine-grained spatial information extraction on 23 pairs of high-quality image-text data, we found that, compared to the coarse-grained extraction method based solely on text, fine-grained extraction could significantly reduce spatial errors (as shown in Figure 8). The overall MAESE and RMSESE increased by 95.53% and 93.62%, respectively (as shown in Table 4). This result validates that the use of multimodal data, such as images and videos, in the process of event point spatial information extraction can effectively compensate for the spatial accuracy deficiencies of single modalities, thereby improving the accuracy of spatial information. Although the number of image-text data points for these 23 pairs is relatively small, it does not mean that our method is without value. Due to the spontaneous nature of social media data, the data points providing high-quality images are relatively scarce, but with the popularity of social media and the development of the internet, we expect this situation will improve. Additionally, by training a multimodal fusion classification model with high-quality social media data, large-scale collection can be implemented on social media, thus reducing misselections and omissions caused by manual screening of high-quality data.
Figure 8. Comparison of Coarse and Fine Grained Extraction.
Preprints 73723 g008
Figure 9. Ablation Experiments for Fine-grained Extraction.
Preprints 73723 g009
Furthermore, we observed that the inclusion of SS and QIFM can significantly improve the performance of LSGL in practice. This is mainly because SS effectively filters out irrelevant background information, while QIFM provides a more intuitive and accurate spatial distance measurement. The combination of these two methods allows LSGL to more accurately locate waterlogging event points, thereby improving overall spatial accuracy. However, there are instances where the inclusion of QIFM actually deteriorates the results. This is mainly due to the limited performance of the semantic segmentation model used for masking, resulting in imprecise generated masks. In such cases, the masks may introduce noise and interfere with the calculation of Euclidean metrics. Additionally, as shown in the case of record index 14 in Figure 7, the inclusion of QIFM worsens the results, while the coarse-grained spatial error is low, leading to a decrease in Space Error after further fine-grained extraction. This indicates that although SS and QIFM can improve the results in most cases, we need to be aware of their potential limitations and challenges. Finally, we also encountered situations where the performance of all methods was unsatisfactory. This usually occurs when distant buildings are affected by fog, making it difficult to extract distinct feature points. This highlights the challenges of fine-grained spatial information extraction in adverse conditions.

5.2. Potential Impact Analysis of Each Step

The MAESE and RMSESE of the fine-grained spatial information extraction in this study are both greater than 50, mainly due to the influence of some large error points. However, in reality, the space error for the majority of data points is only around 20. This level of error is already sufficient to meet the needs of many practical applications, such as guiding rescue and disaster relief efforts in response to sudden urban disasters or events like floods or earthquakes. In this context, social media data provides a real-time, low-cost, and wide-ranging data source that can effectively complement traditional monitoring systems. Although the accuracy of the MIST-SMMD method in extracting spatio-temporal information related to urban flooding has been validated and evaluated, limitations still exist in each step of the method.
In the data preprocessing stage, cleaning and filtering noisy data are crucial for improving the effectiveness of the method. We ensure the quality and relevance of the dataset to the target events through character cleaning, classification models, and removal of similar articles. These preprocessing steps lay a solid foundation for subsequent spatio-temporal information extraction. However, there may be cases of misclassification or missed classification in the data preprocessing process, leading to the loss of potential spatio-temporal information events.
In the coarse-grained spatio-temporal information extraction stage, we use NER technology to extract spatio-temporal information from text data. When processing text data, including text classification and NER, we choose the pre-trained Bert-base-chinese model implemented by the spaCy library. This model not only provides the required functions for text classification and named entity recognition but also has the highest efficiency among commonly used NLP tools [33], meeting the needs of processing a large amount of Weibo data. Although this model and technology can efficiently accomplish the task, they may still be limited by the uncertainties inherent in the model and technology itself, such as deviations in the extraction results for text containing ambiguity or vague expressions.
In the fine-grained spatial information extraction stage, we design the LSGL model to match and analyze the images uploaded by users on social media with the corresponding street view dataset around the location, further improving the accuracy of spatial information. From a data perspective, street view only covers fixed routes, and not all places have street view images. Additionally, factors such as the quality and shooting angle of the user-uploaded images may also affect the extraction results. The accuracy of image matching analysis may be limited by the training data of the model and the generalization capability of the model itself. It is worth noting that when dealing with multimodal data, although our method has classified the text, we still need to address the problem of determining whether the images are relevant to the standardized addresses. This may result in a large number of irrelevant images being matched with text, indirectly increasing the time cost.
Finally, it should be emphasized that our method should be considered as a supplementary approach. As mentioned earlier, there is a limited amount of multimodal data in social media that can simultaneously achieve spatio-temporal standardization parsing and accurate image matching. Therefore, the spatio-temporal information extracted from social media data can only serve as an effective supplement to traditional urban event monitoring methods and cannot completely replace them.

6. Conclusions

In this study, we have proposed an innovative method, the MIST-SMMD method, which can extract spatio-temporal information of urban events from coarse-grained to fine-grained levels through layered processing. Leveraging the advantages of multimodal data, our research has revealed the tremendous potential of social media data, especially Weibo, as a source for obtaining dynamic and high-precision information about urban events.
Our method is not only widely applicable in the field of urban disaster management but also holds potential in other areas that require real-time and accurate spatial information. For example, in the monitoring and management of traffic congestion and traffic accidents, as not all road sections are equipped with surveillance devices, our method can provide on-site spatio-temporal information about traffic congestion or real-time conditions based on real-time information on social media. This can assist traffic management departments in timely adjusting traffic signal settings or dispatching rescue vehicles, among other actions. Additionally, the images and videos on social media have potential value, such as extracting the severity of events or archiving and tracking the evolution of the same event at different time points for further in-depth analysis and time-series-based investigations.
Future research can explore additional potential directions and improvement strategies, including the adoption of more advanced models to enhance the accuracy of urban event classification and named entity extraction, more comprehensive integration of untapped information within social media, and the incorporation of other types of data sources to enhance the robustness of data extraction and analysis. Furthermore, we believe that the real-time extraction and processing of event information using multimodal social media data holds significant potential for urban emergency systems, contributing to more efficient and timely urban management, command, and disaster mitigation efforts.

Author Contributions

Conceptualization, Yilong Wu and Yingjie Chen;methodology, Yilong Wu,Yingjie Chen and Rongyu Zhang;software,Rongyu Zhang,Yilong Wu,Yingjie Chen and Zhenfei Cui;evaluation,Yilong Wu and Yingjie Chen;data annotation,Xinyi Liu;writing—original draft preparation,Yilong Wu,Jiayi Zhang and Xinyi Liu;writing—review & editing,Yong Wu and Yilong Wu.All authors have read and agreed to the published version of the manuscript.

Funding

This research was funded by Fujian Normal University College Students' Innovative Entrepreneurial Training Projects Funded in 2023, grant number cxxl-2023292”.

Acknowledgments

Thanks to Xiaochen Qin for his constructive suggestions and Shuying Luo for her art support.

Conflicts of Interest

The authors declare no conflict of interest.

Data citation

[dataset] Lu el. 2022. Spatial distribution dataset of flood inundation in Zhengzhou City, Henan Province, July 2021 by heavy rainfall and flooding; ChinaGEOSS Data Sharing Network; 2017YFB0504100.

References

  1. Ryan, T.; Allen, K.A.; Gray, D.L.; McInerney, D.M. How social are social media? A review of online social behaviour and connectedness. Journal of Relationships Research 2017, 8, e8. [Google Scholar] [CrossRef]
  2. Weibo Reports Fourth Quarter and Fiscal Year 2022 Unaudited Financial Results. Available online: http://ir.weibo.com/node/8856/pdf (accessed on 15 May 2023).
  3. Zhang, Z. Spatial analysis of Internet sensation based on social meadia—Taking the Jiuzhaigou earthquake as an example. NanJing University, 2019. [Google Scholar]
  4. Li, S.; Zhao, F.; Zhou, Y. Analysis of public opinion and disaster loss estimates from typhoonsbased on Microblog data. Ch'ing-hua Ta Hsueh Hsueh Pao, Tzu Jan K'o Hsueh Pan J. Tsinghua Univ. Sci. Technol 2022, 62, 43–51. [Google Scholar]
  5. Wu, Q.; Qiu, Y. Effectiveness Analysis of Typhoon Disaster Reflected by Microblog Data Location Information. J. Geomat.Sci. Technol. 2019, 36, 406–411. [Google Scholar]
  6. Liang, C.; Lin, G.; Zhang, M. Assessing the Effectiveness of Social Media Data in Mapping the Distribution of Typhoon Disasters. J Geogr Inf Sci 2018, 20, 807–816. [Google Scholar] [CrossRef]
  7. Yu, M.; Bambacus, M.; Cervone, G.; Clarke, K.; Duffy, D.; Huang, Q.; Li, J.; Li, W.; Li, Z.; Liu, Q. Spatio-temporal event detection: A review. International Journal of Digital Earth 2020, 13, 1339–1365. [Google Scholar] [CrossRef]
  8. Etzioni, O.; Cafarella, M.; Downey, D.; Kok, S.; Popescu, A.-M.; Shaked, T.; Soderland, S.; Weld, D.S.; Yates, A. Web-scale information extraction in knowitall: (preliminary results). In Proceedings of the Proceedings of the 13th international conference on World Wide Web, 2004; pp. 100–110. [Google Scholar] [CrossRef]
  9. Ritter, A.; Etzioni, O.; Clark, S. Open domain event extraction from twitter. In Proceedings of the Proceedings of the 18th ACM SIGKDD international conference on Knowledge discovery and data mining, 2012; pp. 1104–1112. [Google Scholar] [CrossRef]
  10. Huang, Z.; Xu, W.; Yu, K. Bidirectional LSTM-CRF models for sequence tagging. arXiv preprint 2015, arXiv:1508.01991 2015. [Google Scholar] [CrossRef]
  11. Devlin, J.; Chang, M.-W.; Lee, K.; Toutanova, K. Bert: Pre-training of deep bidirectional transformers for language understanding. arXiv preprint 2018, arXiv:1810.04805. [Google Scholar]
  12. Ma, K.; Tan, Y.; Tian, M.; Xie, X.; Qiu, Q.; Li, S.; Wang, X. Extraction of temporal information from social media messages using the BERT model. Earth Science Informatics 2022, 15, 573–584. [Google Scholar] [CrossRef]
  13. Yuan, W.; Yang, L.; Yang, Q.; Sheng, Y.; Wang, Z. Extracting Spatio-Temporal Information from Chinese Archaeological Site Text. ISPRS International Journal of Geo-Information 2022, 11, 175. [Google Scholar] [CrossRef]
  14. MacEachren, A.M.; Jaiswal, A.; Robinson, A.C.; Pezanowski, S.; Savelyev, A.; Mitra, P.; Zhang, X.; Blanford, J. SensePlace2: GeoTwitter analytics support for situational awareness. In Proceedings of the VAST 2011 - IEEE Conference on Visual Analytics Science and Technology; 2011; pp. 181–190. [Google Scholar] [CrossRef]
  15. Zou, Z.; Gan, H.; Huang, Q.; Cai, T.; Cao, K. Disaster image classification by fusing multimodal social media data. ISPRS International Journal of Geo-Information 2021, 10, 636. [Google Scholar] [CrossRef]
  16. Ofli, F.; Alam, F.; Imran, M. Analysis of social media data using multimodal deep learning for disaster response. arXiv preprint arXiv:2004.11838, 2020. [CrossRef]
  17. Baltrušaitis, T.; Ahuja, C.; Morency, L.-P. Multimodal machine learning: A survey and taxonomy. IEEE transactions on pattern analysis and machine intelligence 2018, 41, 423–443. [Google Scholar] [CrossRef] [PubMed]
  18. Shuai, X.; Hu, S.; Liu, Q. Internet media-based acquisition processing model of earthquake disaster situation. J. Nat. Disasters 2013, 22, 178–184. [Google Scholar]
  19. Zhang, S.; Yang, Z.; Wang, Y. Simulation on Flood Disaster in Urban Building Complex System Based on LBM. J Simul. 2022, 34, 2584–2594, 11.Yuan, F.; Xu, Y.; Li, Q.; Mostafavi, A. Spatio-temporal graph convolutional networks for road network inundation status prediction during urban flooding. Computers, Environment and Urban Systems 2022, 97, 101870. [Google Scholar] [CrossRef]
  20. Yuan, F.; Xu, Y.; Li, Q.; Mostafavi, A. Spatio-Temporal Graph Convolutional Networks for Road Network Inundation Status Prediction during Urban Flooding. Comput Environ Urban Syst 2022, 97, 102289. [Google Scholar] [CrossRef]
  21. Xu, L.; Ma, A. Coarse-to-fine waterlogging probability assessment based on remote sensing image and social media data. Geo-spatial Information Science 2021, 24, 279–301. [Google Scholar] [CrossRef]
  22. Panteras, G.; Cervone, G. Enhancing the temporal resolution of satellite-based flood extent generation using crowdsourced data for disaster monitoring. International journal of remote sensing 2018, 39, 1459–1474. [Google Scholar] [CrossRef]
  23. Zhang, Z.; Wang, Z.; Fang, D. Optimal Design of Urban Waterlogging Monitoring and WarningSystem in Wuhan Based on Internet of Things and GPRS Technology. Saf Environ Eng 2018, 25, 37–43. [Google Scholar]
  24. Zeng, Z.; Xv, J.; Wang, Y. Advances in flood risk identification and dynamic modelling based on remote sensing spatial information. Adv Water Sci 2018, 31, 463–472, [27]Wang, R.-Q.; Mao, H.; Wang, Y.; Rae, C.; Shaw, W. Hyper-resolution monitoring of urban flooding with social media and crowdsourcing data. Computers &Geosciences 2018, 111, 139-147. [Google Scholar] [CrossRef]
  25. Songchon, C.; Wright, G.; Beevers, L. Quality assessment of crowdsourced social media data for urban flood management. Computers, Environment and Urban Systems 2021, 90, 101690. [Google Scholar] [CrossRef]
  26. BLE, SOCIAL MEDIA & FLOOD RISK AWARENESS. Available online: https://www.fema.gov/sites/default/files/documents/fema_ble-social-media-flood-risk-awareness.pdf (accessed on 15 May 15, 2023).
  27. Chanin, S.; Grant, W.; Lindsay, B. Quality assessment of crowdsourced social media data for urban flood management. Comput Environ Urban Syst 2021, 90, 101690. [Google Scholar] [CrossRef]
  28. Wang, X.; Kondratyuk, D.; Christiansen, E.; Kitani, K.M.; Alon, Y.; Eban, E. Wisdom of committees: An overlooked approach to faster and more accurate models. arXiv preprint 2020, arXiv:2012.01988. [Google Scholar] [CrossRef]
  29. JioNLP. Available online: https://github.com/dongrixinyu/JioNLP (accessed on 15 May 2023).
  30. Sun, J.; Shen, Z.; Wang, Y.; Bao, H.; Zhou, X. LoFTR: Detector-free local feature matching with transformers. In Proceedings of the Proceedings of the IEEE/CVF conference on computer vision and pattern recognition, 2021; pp. 8922–8931.
  31. Carion, N.; Massa, F.; Synnaeve, G.; Usunier, N.; Kirillov, A.; Zagoruyko, S. End-to-end object detection with transformers. In Proceedings of the Computer Vision–ECCV 2020: 16th European Conference, Glasgow, UK, August 23–28, 2020; Proceedings, Part I 16. 2020; pp. 213–229. [Google Scholar] [CrossRef]
  32. Schmitt, X.; Kubler, S.; Robert, J.; Papadakis, M.; LeTraon, Y. A replicable comparison study of NER software: StanfordNLP, NLTK, OpenNLP, SpaCy, Gate. In Proceedings of the 2019 Sixth International Conference on Social Networks Analysis, Management and Security (SNAMS), 2019; pp. 338–343. [Google Scholar] [CrossRef]
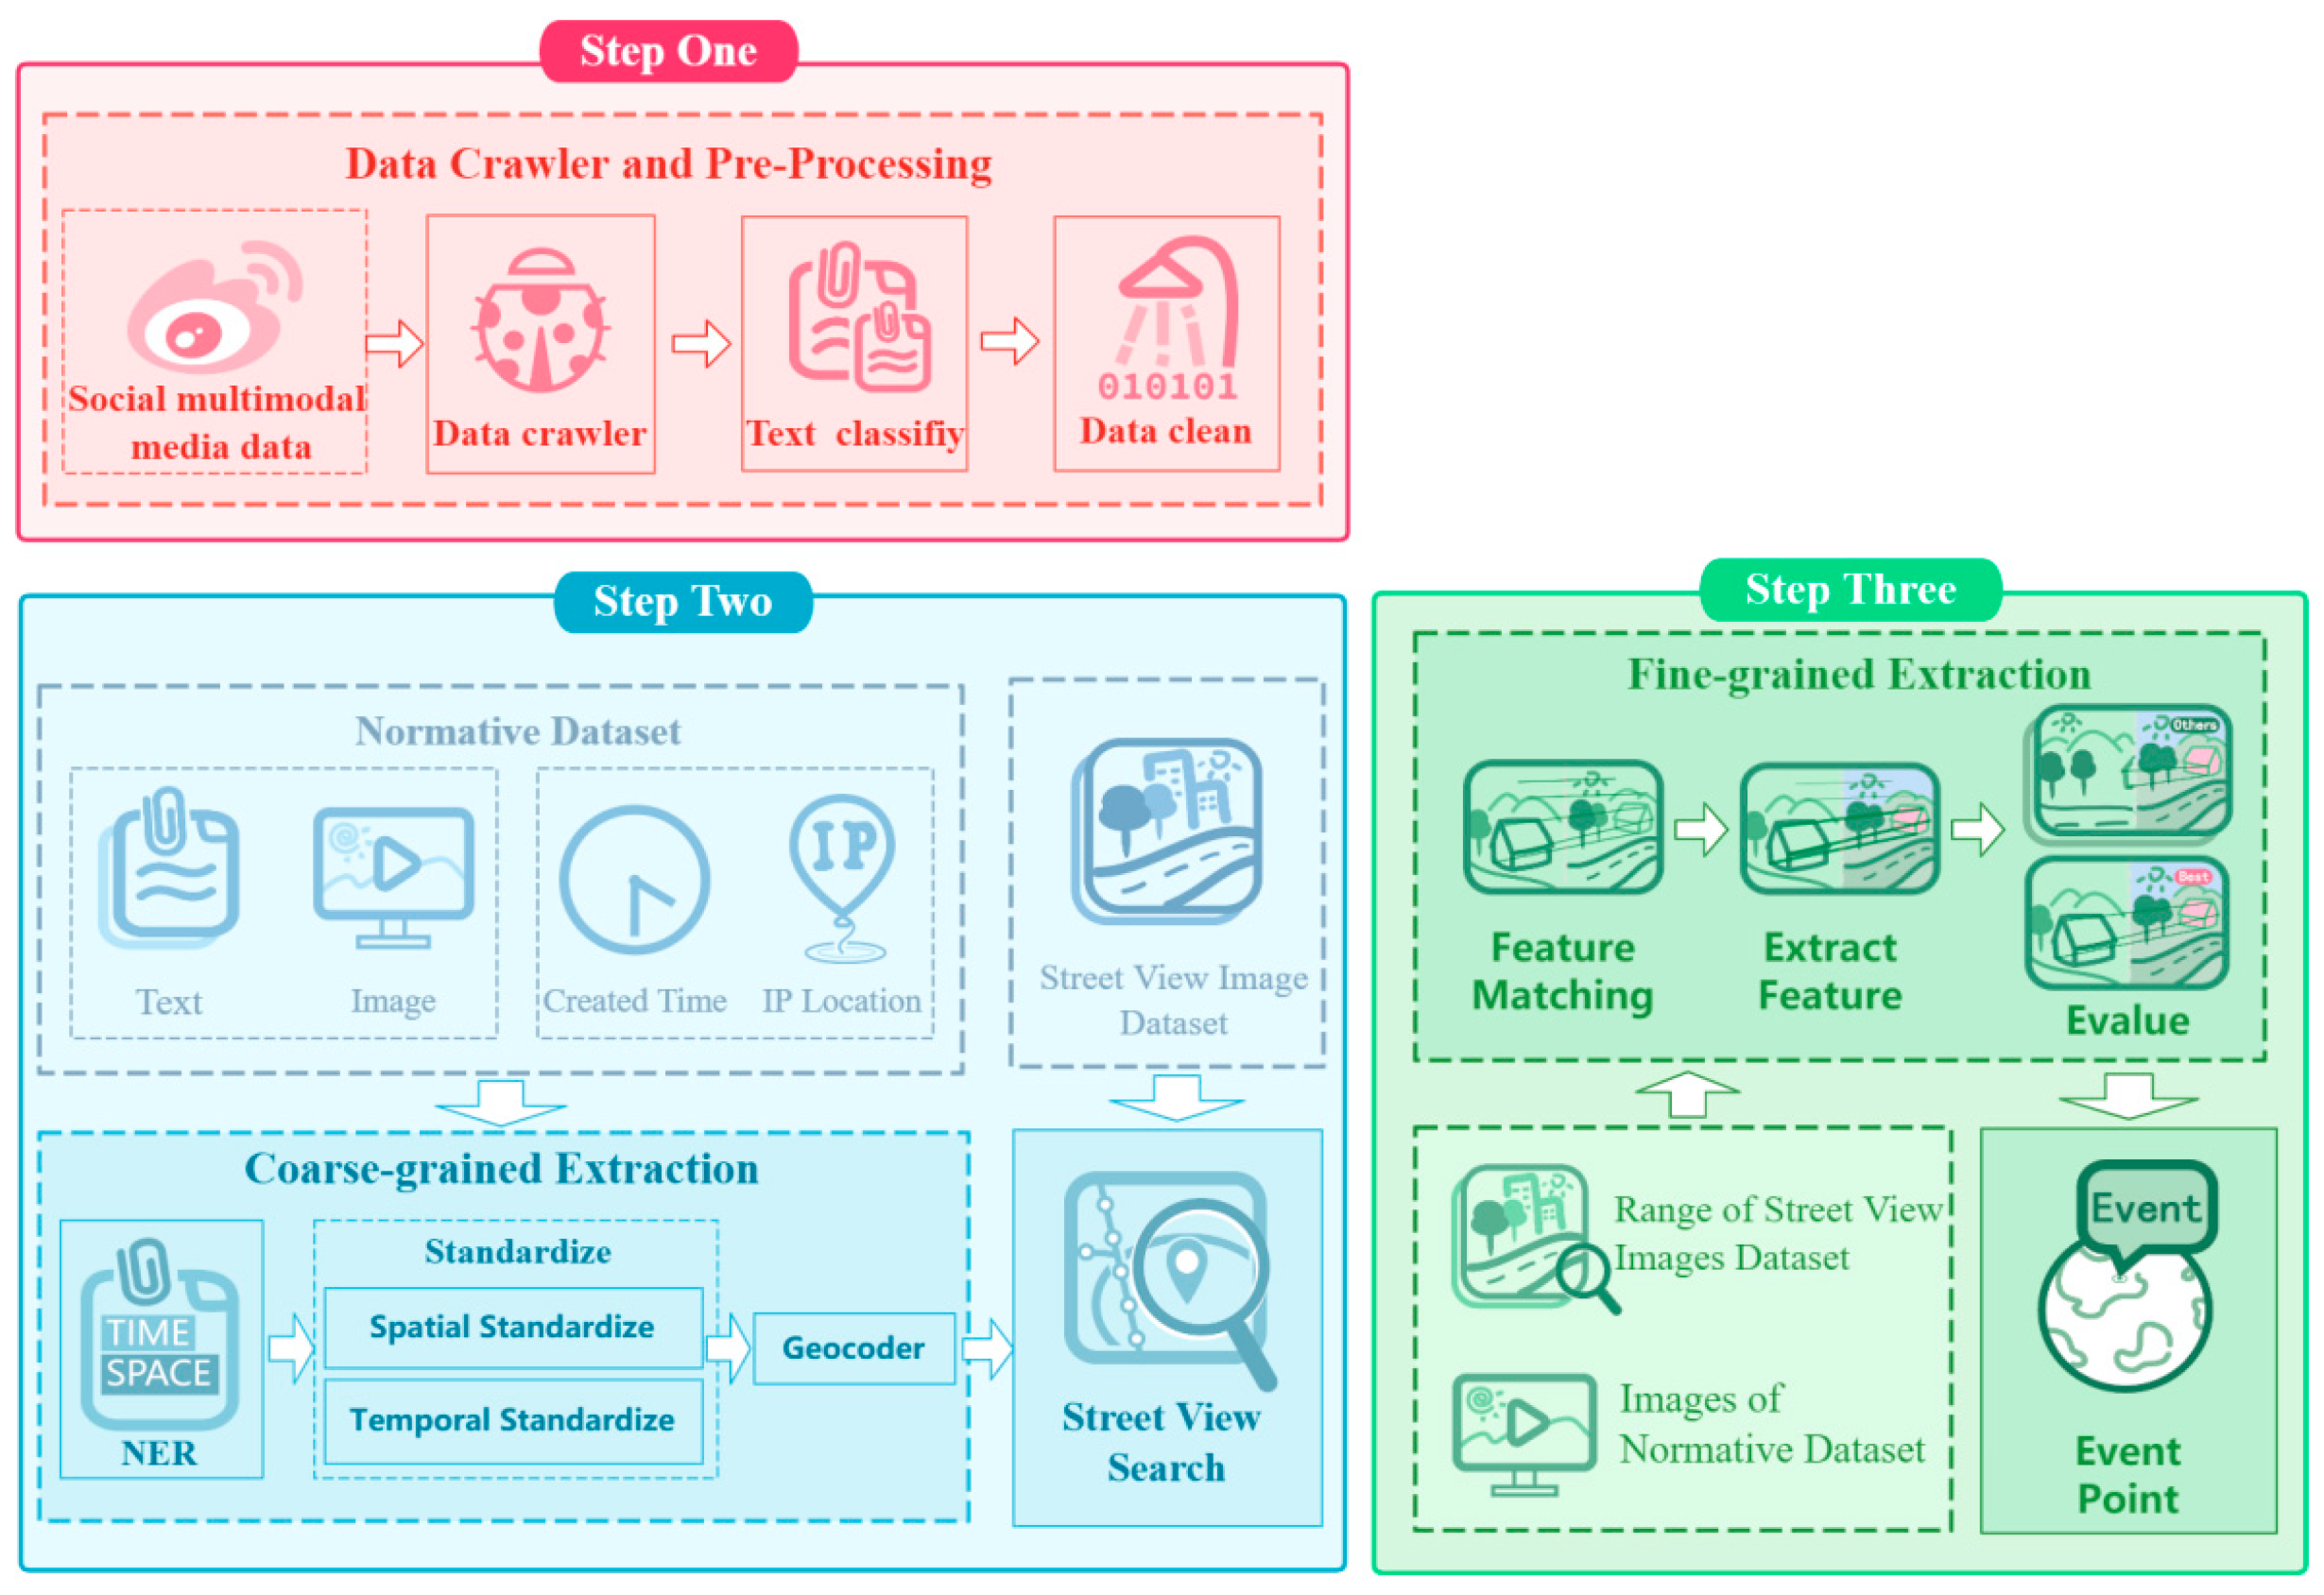
Figure 1. The overall structure of MIST-SMMD process.
Preprints 73723 g001
Figure 2. The flowchart of Spatio-temporal standardization.
Preprints 73723 g002
Figure 3. Three common examples of standardization.
Preprints 73723 g003
Figure 4. Effect of each level of model on matching results.
Preprints 73723 g004
Figure 5. Spatial distribution of inundation events during the period from July 18 to July 20. (a)Coarse-grained inundation event points extracted from China during the period from July 18 to July 20. (b)Spatial distribution of inundation event points in Zhengzhou on July 18.(c) Spatial distribution of inundation event points in Zhengzhou on July 19.(d) Spatial distribution of inundation event points in Zhengzhou on July 20.
Preprints 73723 g005
Figure 6. Spatial Distribution of Positive and Negative Points in Zhengzhou City and Corresponding Typical Images during July 18-20, 2021.
Preprints 73723 g006
Figure 7. Spatial Precision of Coarse-grained Spatial Information Extraction within Different Buffer Ranges.
Preprints 73723 g007
Table 1. Normative City Event Weibo Dataset Example.
Blog post Blog Information Blog Information Values
Preprints 73723 i001 Created time 2021/7/19 14:28:17
IP Location Nodata
7月19日,记者在郑州金岱路距离南四环一公里处发现,金岱路的车道上积水严重,南北双向六车道有近1公里的积水带,最深处能淹没半个车轮,道路双向的外侧车道水更深,机动车速度稍快行驶,就会激起高于车身两倍的水花。目前这一积水情况还在持续,现场记者没有看到抽水作业,这一路段的积水为何如此严重?为何没有排水作业?河南交通广播的记者也会持续关注。(5G现场记者:靖一、雷静) Is relevant True
Mid 4660679711922369
* Mid:Unique identification code for each Weibo post.
Table 2. Description of spaCy named entity labels and label classes classified in the present study.
Label type Named entity labels Description
TIME DATE Absolute or relative dates or periods
TIME Times smaller than a day
GPE GPE Geopolitical entity, i.e. countries, cities, states.
FAC LOC Non-GPE locations, mountain ranges, bodies of water
FAC Buildings, airports, highways, bridges, etc.
Table 3. Statistics of the Pre-processed Dataset for the July 20 Heavy Rainstorm in Zhengzhou.
Type Only text Text + Images (Video) Total
Origin 12338 14222 26560
Text classify 6750 7886 14636
Data clean 1096 1951 3047
Space Filter 623 942 1565
Table 4. Comparison of Spatial Error between Coarse-grained Spatial Information Extraction with Text Modality Only and Multi-modal Data Integration for Refining Coarse-grained Spatial Information Extraction with Image Modality.
Space Error Only Text Text + Images Improvement
MAESE 1491.13 66.63 95.53%
RMSESE 2068.43 131.88 93.62%
Table 5. Spatial Error of Fine-grained Spatial Information Extraction with Different Combinations of Quantitative Indicators for Feature Matching, Semantic Segmentation, and Feature Matching Degree.
Space Error FM FM+SS FM+QIFM FM+SS+QIFM
MAESE 124.30 66.63 110.33 100.74
RMSESE 227.35 131.88 179.42 181.16
* FM:Feature Matching; SS:Semantic Segmentation; QIFM:Quantitative Indicators for Feature Matching.
Disclaimer/Publisher’s Note: The statements, opinions and data contained in all publications are solely those of the individual author(s) and contributor(s) and not of MDPI and/or the editor(s). MDPI and/or the editor(s) disclaim responsibility for any injury to people or property resulting from any ideas, methods, instructions or products referred to in the content.
Copyright: This open access article is published under a Creative Commons CC BY 4.0 license, which permit the free download, distribution, and reuse, provided that the author and preprint are cited in any reuse.
Prerpints.org logo

Preprints.org is a free preprint server supported by MDPI in Basel, Switzerland.

Subscribe

© 2024 MDPI (Basel, Switzerland) unless otherwise stated