1. Introduction
Future climate change is expected to affect components of the hydrological cycle [
1], these changes have significant implications for water resources in the cold, arid parts of northwest China [
2,
3,
4]. These predictions and analyses are based on the regional climate and observed land surface, without considering changes in geologic structures, such as fault activity. The neighbouring glacier-fed Keriya River is located on the West Kunlun Mountains of the western Tibetan Plateau, and drains across two tectonically active Altyn-Tagh fault and the West Kunlun fault in their upper reaches of western Tibet. The river has a high meltwater contribution of 70%-75% [
5].
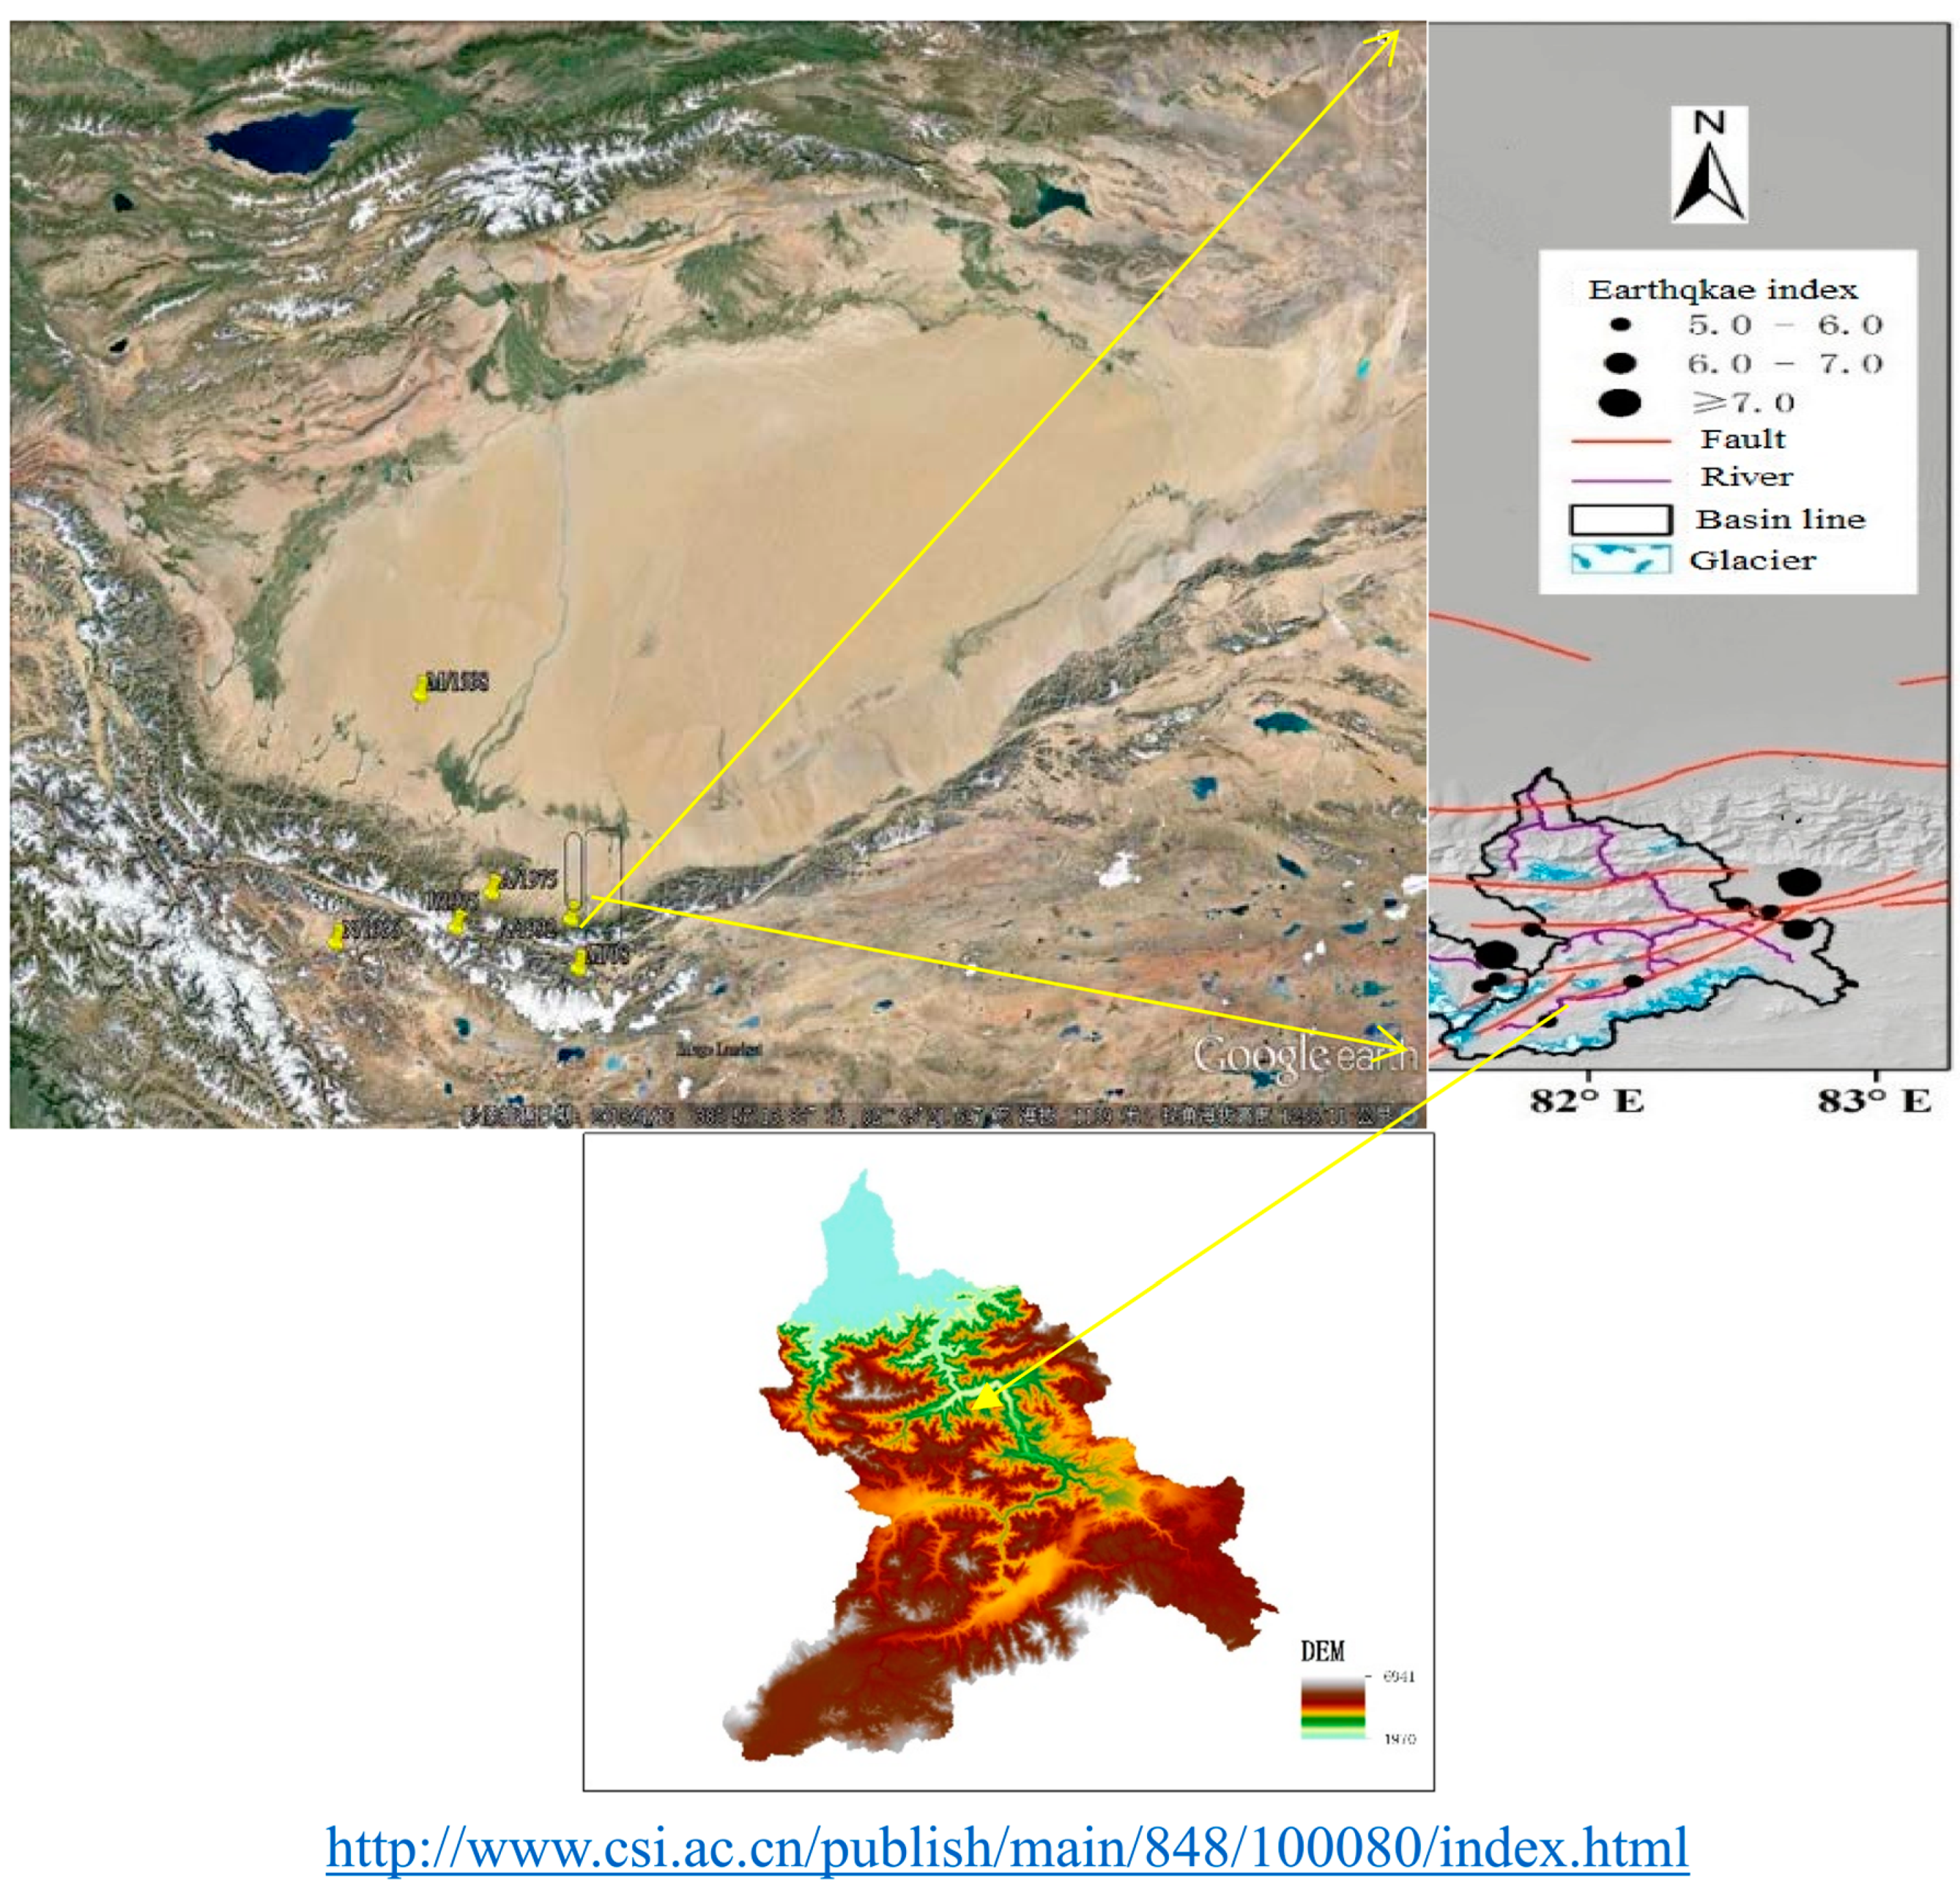
The glaciers of the Kunlun Mountains act like efficient reservoirs, allowing a large amount of meltwater to be transferred into a few oases and the Keriya River system, including the Cera River (
Figure 1a). With an annual runoff of 10.2 x 10
8 m
3, the rivers have created an extensive valley fills in its alluvial reaches. The large altitude dynamics of the Keriya River has been fascinated glacial-hydrologists from around the world for the last three decades. However, only a few numbers of studies, particularly in the upper streams, bear testimony to the international attention these rivers have received [
6,
7,
8]. The results of investigations on the glacier- fed rivers surrounding the Tarim Basin suggest that flows of the Kunlun Rivers have been underestimated and lack a statistical analysis to date [
2]. The rivers are predicted to increase with further global warming, and the glaciers in the West Kunlun Mts. were predicted in retreating or stabilizing as evidenced by both hydrometeorological records and satellite images [
9,
10,
11]. However, these predictions did not include the geologic structures and possible tectonic activity in the region. Rivers of the Kunlun flow through one of the largest faults in the world, the Altyn-Tagh Fault which is known for its unique geologic impacts apart from its hydrological significance.
The Keriya River shows a significantly hydrological diversity with the small winter and spring flows in the Tarim Basin [
12,
13]. This is strongly manifested by the geodynamics of the river across the faults as shown in
Figure 1b. Moreover, the behavior of the river is quite different in terms of its neighboring river, the Yarkand which shows evidence of advancing glaciers in the Karakoram [
14,
15,
16,
17]. This study documents the altering of the drainage systems of the river along the upper fault valleys and the transformations between surface and subsurface water. We argue that previous studies only attribute the variability of the river to the strong influence of climatic and glacial changes, we propose that changes in the multiple transfer patterns between surface water and air temperature are due to tectonic activity triggered by frequent large earthquakes, and that various melt models should be taken an account for these of glacier-fed rivers. This is very important not only for correctly understanding, assess and managing the water resources for the river, but also for understanding how the hydrological anomaly of rivers such as those in the Tarim Basin, the Indus Basin region and Central Asia, are affected by geologic factors.
2. Material
The study area covers an area of 9390 km
2 that is sandwiched between the EW–SW trend of the Altyn-Tagh Fault, the Ashkul Fault to the south and the West Kunlun Fault to the north. The Keriya River in hydrogeologic history is one of the largest tributaries of the Tarim River from the West Kunlun Mountains in western Tibet (
Figure 1a). The Keriya River in the east is a large glacier-fed watershed, its hydrometric station is at the Keriya village (the former Nunu maimatlangan, 36°28’N, 81°28’E, 1880 m, asl.). The climatic data are from station Keriya and adjacent Heishan (36°15′N, 79°46′E, 2460 m, asl.) in the river respective upper reaches. The glacio-hydrological parameters of the river are listed in
Table 1.
The Keriya River encompass a wide variety of climatic conditions including the periglacial and desert zones shown in
Figure 1. Glaciers and patterned ground features associated with continuous and dis-continuous permafrost are found in the south [
18]. A great number of glaciers are present above 4000 m, and have a total area of 985.15 km
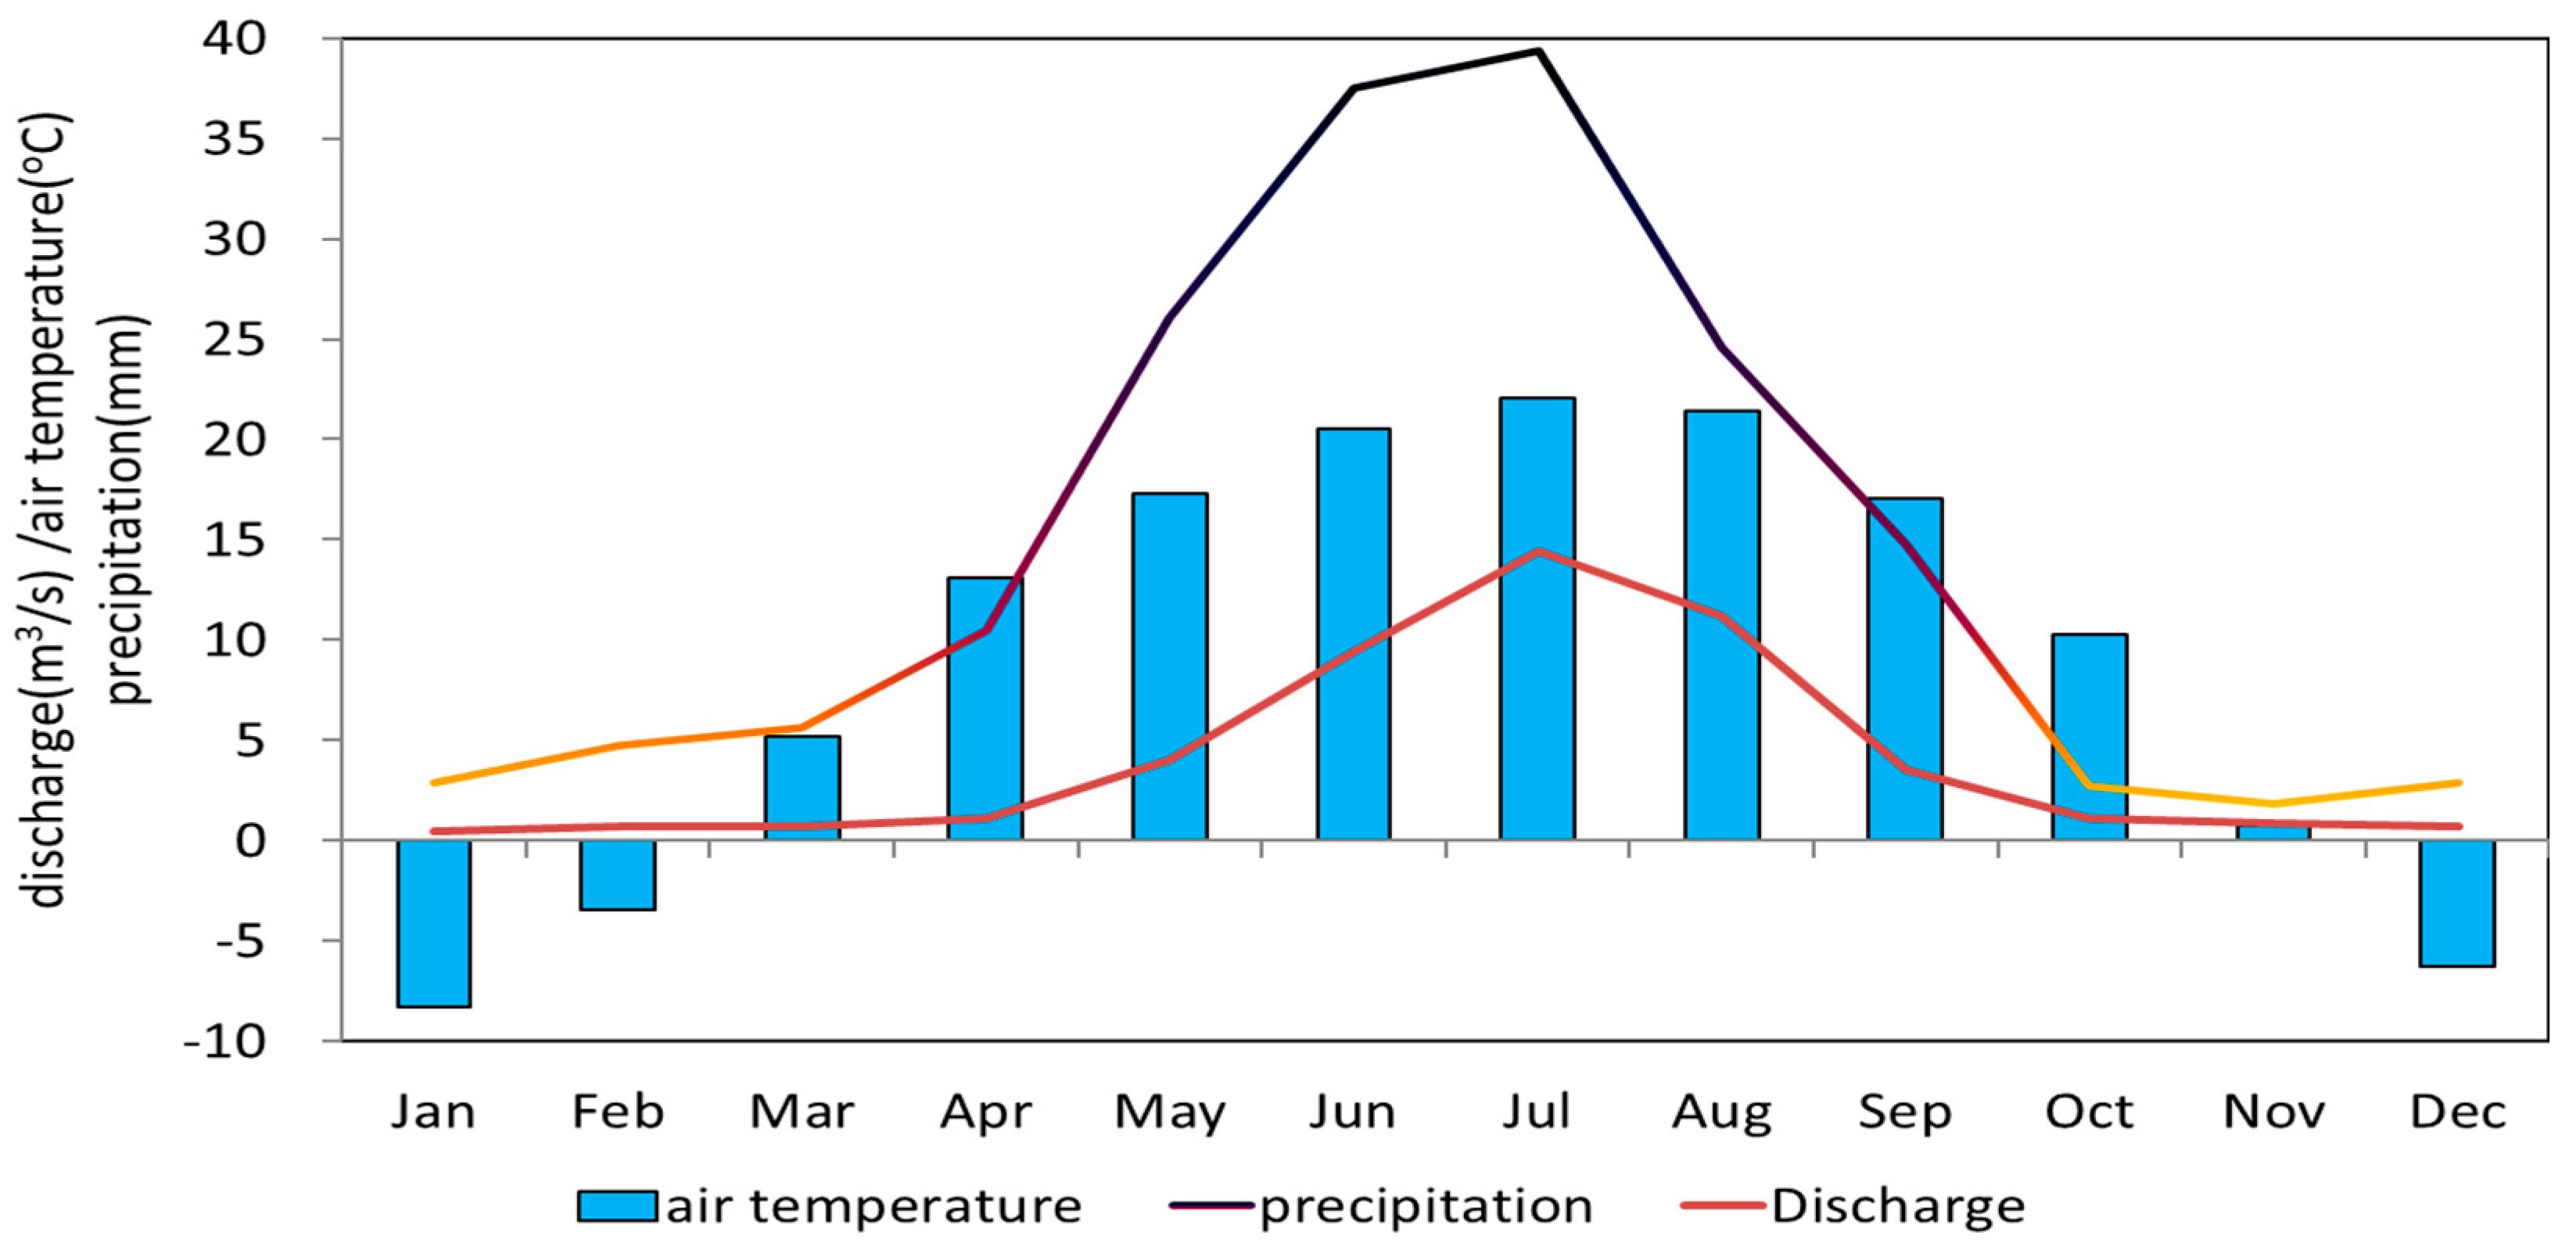
2. We used hydrological data of monthly discharge at the Keriya hydrometric station, and air temperature data from Heishan station between year 1958 to 2014. The hydrometeorological records indicate a simple pattern of streamflow under an extremely continental climate. The surface flow from glacier meltwater is the dominant contribution to the streamflow as shown in
Figure 2. The alpine precipitation varies from 70 mm in the valleys to 450 mm in the glaciated areas and increases with altitude up to 5800 m, asl [
5]. The average annual air temperature at the Keriya station is 12.5 ℃, and the estimated annual air temperature over the periglacial areas above 4200 m, asl. is below -3.6℃, according to a lapse rate of air temperature at 0.65℃/100m.
The ablation period of the large glacier Ghoza near the Keriya River headwater in 1987 was approximate 110 days from June to September, according to an investigation at 5200 m, asl.[
19]. Hence, the seasonal distribution of runoff is quite variable because the runoff is composed mainly of summer meltwater and rainfall, which account for approximately 60% to 70% of the annual runoff. The maximum runoff is in July comprising 26% to 28% of the annual runoff, and the minimum is in March with only 0.9% of the annual runoff.
With global climate change, the annual air temperature has risen by 0.9℃ since 1989, and precipitation has increased by 35% since the late 1990s in the West Kunlun Mountains, as shown in
Figure 3. As is well known, the warming is significant in the winter and spring, instead of in the summer, but wetter conditions are occurring in the summer. However, the summer flow of Keriya River is not sensitive to warming and wetting as that as other glacier-fed rivers which are surrounding the Tarim Basin.
Figure 1b shows the West Tibetan Plateau, one of the most remarkable topographic features on Earth and a classic example of continent-continent collision. In northwestern Tibet, the Altyn Fault is over 2000 km in length and the longest left lateral strike-slip fault in Asia. The fault accommodates sinistral motion between Tibet and the Tarim block within the India-Eurasia collision zone. The West Kunlun Fault are 700 km long, forming the western segment of the Altyn-tag Fault, and are associated with the many Kunlun rivers [
20,
21,
22,
23,
24,
25].
The Kunlun River penetrates along surface rupture zones that are 200 km long in the North-South direction, these zones were produced by the most recent large seismic events (Ms >6.0) in upper reaches of the rivers, including multiple earthquakes with Ms. 6.1 in May and June of 1975, an Ms. 6.0 in April 1992, Ms. 7.3 in March 2008 and 7.1 in March 2014, as recorded by the China Earthquake Network Center (
www.cenc.ac.cn) (
Figure 1a).
Table 3 illustrates the hydrograph of daily discharge of the Keriya River and the effect of the 1974 earthquakes in the West Kunlun. The discharge suddenly and significantly increased on May 29 (○ marked on yellow point) following the earthquakes, with only a gradual increase in air temperature. There was a little rainfall 4.4 mm in April and 6.4 mm in May at gauge station. The daily and monthly discharge data indicate three hydrological responses to the three mega earthquakes in shortly daily and mid-period of monthly increase, as well as the annually decrease shown in
Figure 5. The river discharge suddenly and significantly increased by four times from 11.9 m
3/s during base flow on May 27th. to a peak flow of 47.1 m
3/s on May 28th following the earthquakes. Clearly the peak flow was not a meltwater flow resulting from a gradual rise in air temperature. These earthquakes caused a series of geologic and geomorphic changes, such as systematically offset streams, displaced fluvial fans and terrace risers, pull-apart grabens, and pressure ridges or pushups which are well developed along the surface rupture zone [
25,
26]. It is not by chance that the rivers flow northward from the headwaters and then flows across a few fault zones until reaching its outlet station.
3. Data Analysis and Methods
3.1. Trend and change point test
The Mann–Kendall trend and change point test were used to explore hydro-meteorological trends and variability [
28,
29]. The Mann–Kendell test is a rank-based method that has been used in many previous studies to identify trends in hydro-meteorological variables [
30,
31,
32], and begins by evaluating the trends in the hydrological variables of a station. All trend results have been evaluated at the 95%significance level or better, to ensure an effective exploration of the trends and change point in this study.
3.2. Correlation analysis
The air temperature index and snow melt models rest upon an assumed relationship between snow-ice meltwater and air temperature usually expressed in the form of positive correlation. Because air temperature is generally the most readily available data, such models have been the most widely used method of snow-ice melt computations for many purposes, such as hydrological modelling, ice dynamic and the climate sensitivity studies [
2,
31].
Additionally, the moving correlation analysis were used to explore the relationships between hydrometeorological variables. Data associated with a group were investigated to identify significant trends after applying the Mann-Kendall test based on a harmonic analysis, while the strength of the relationships between both meteorological and hydrological variables were evaluated by a linear correlation, the calculated correlations were tested for statistical validity at the 90% significance level.
4. Results
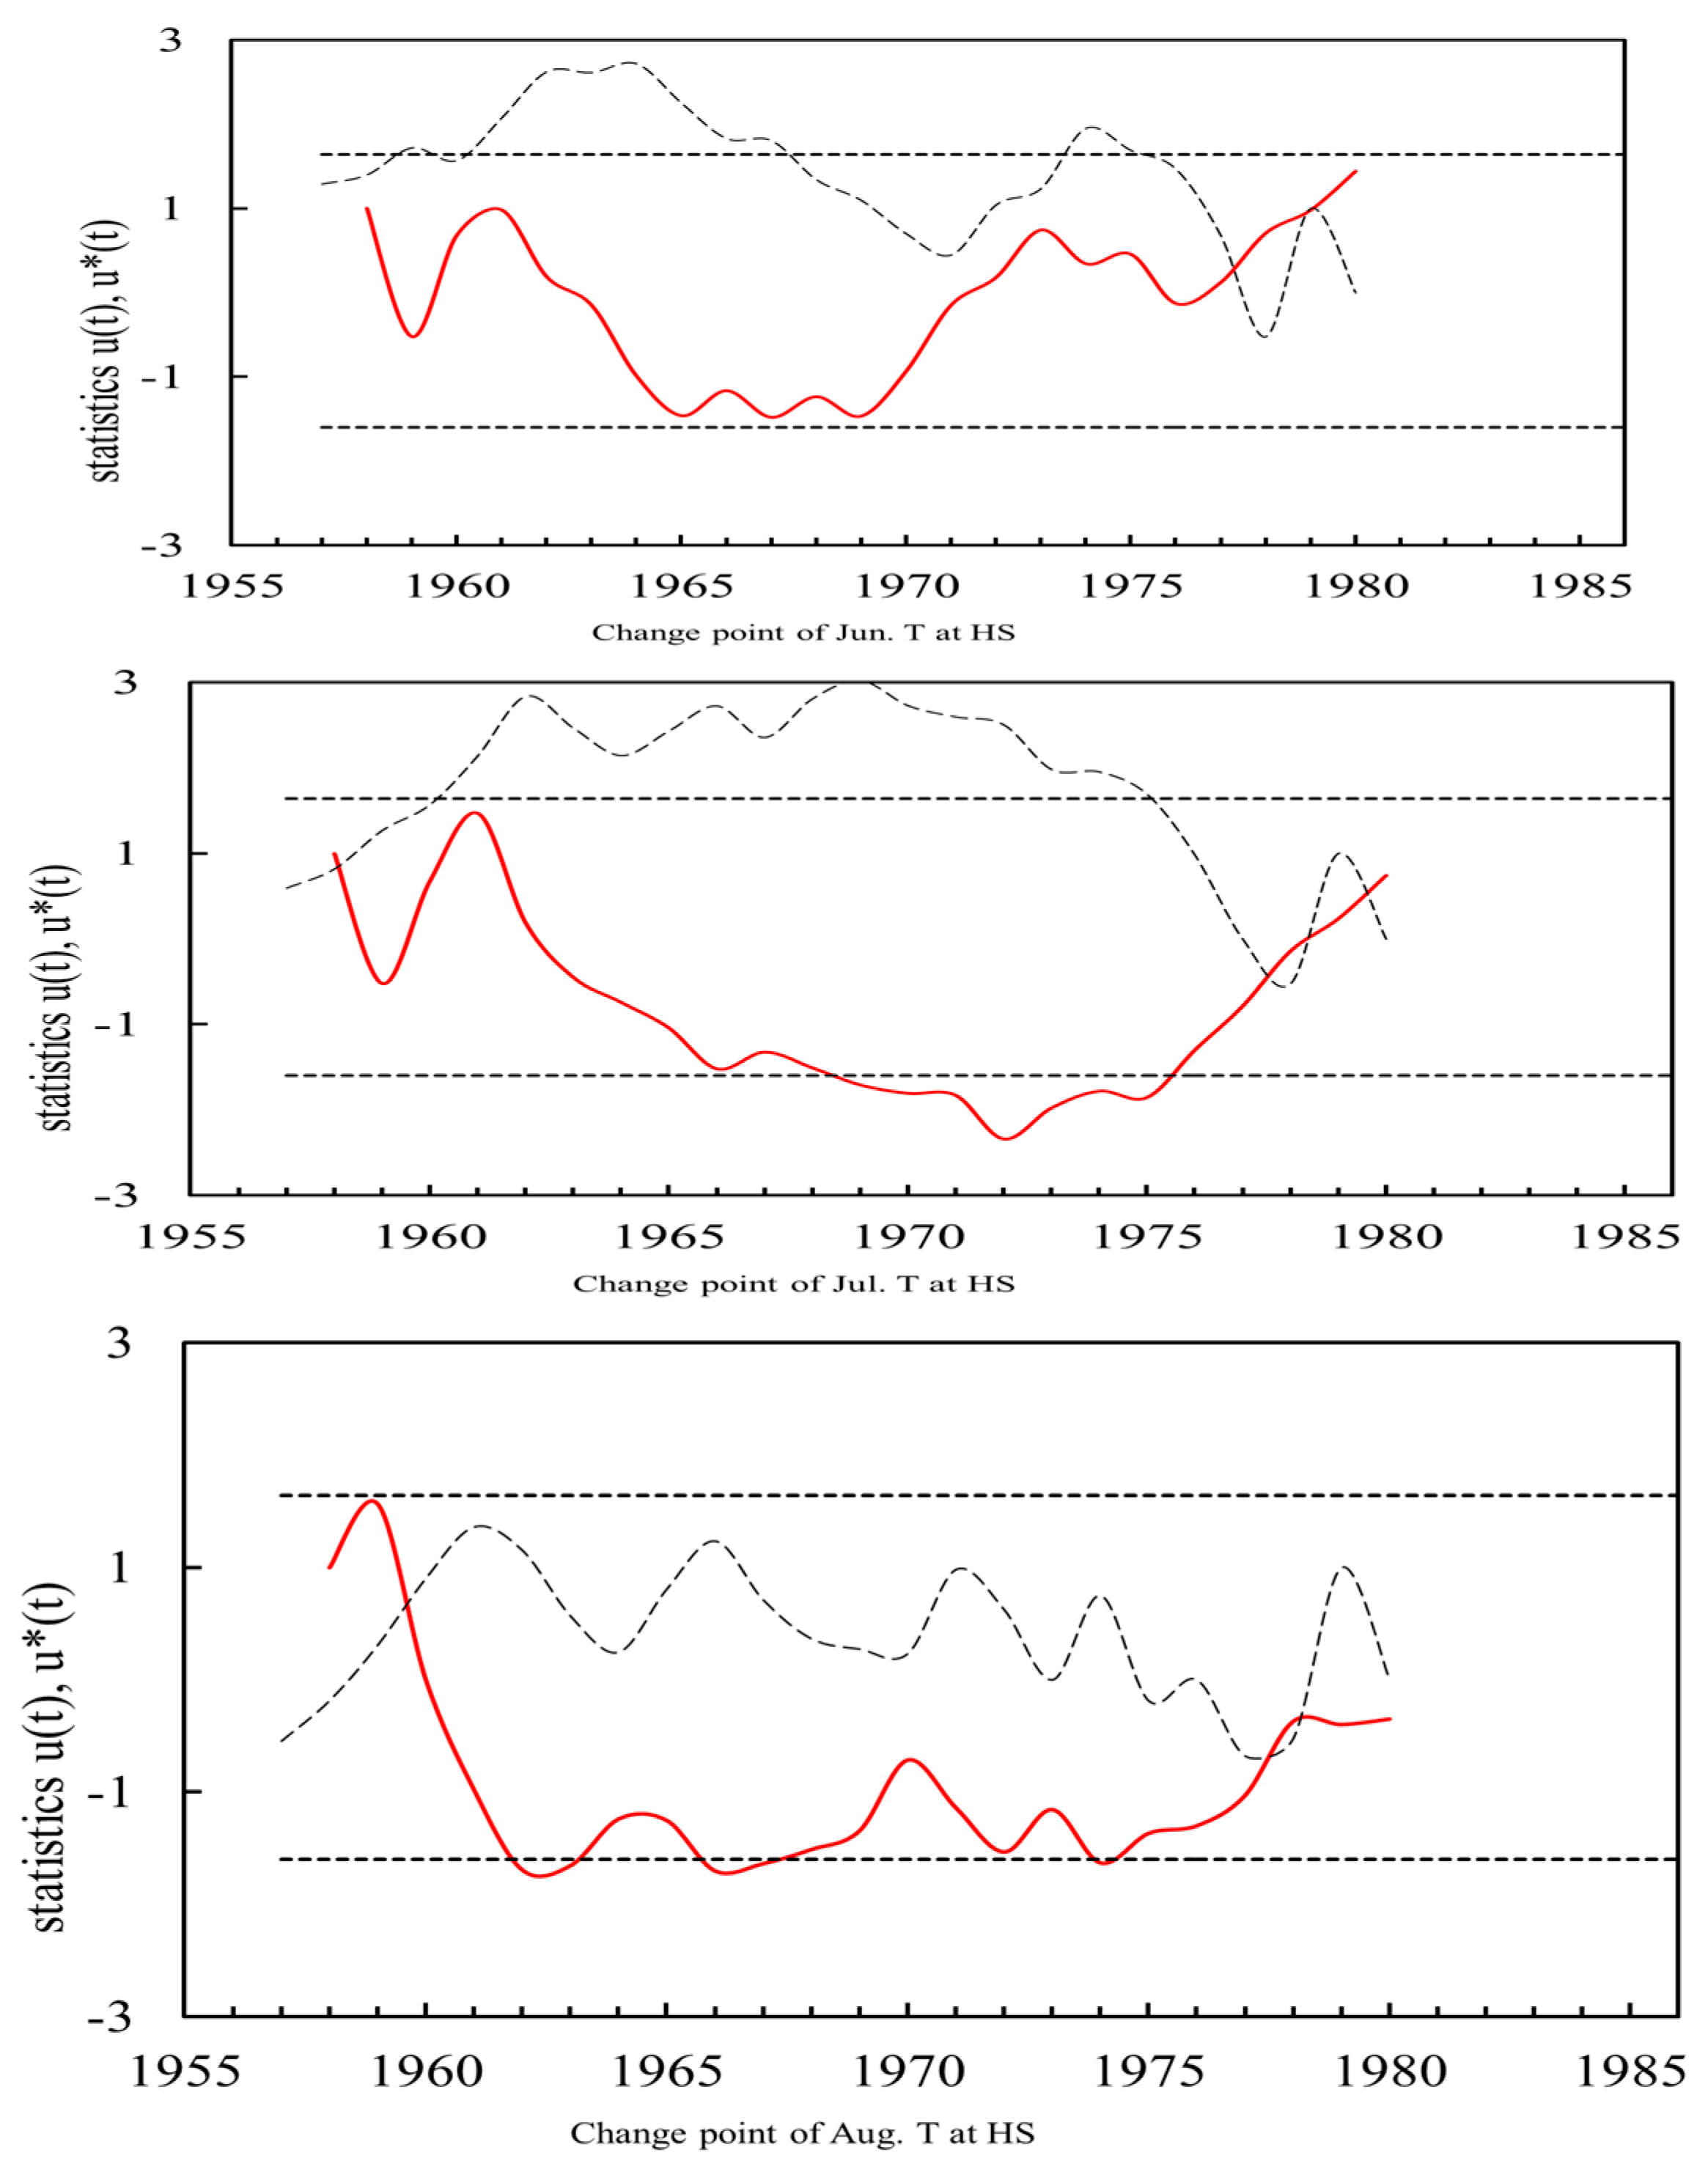
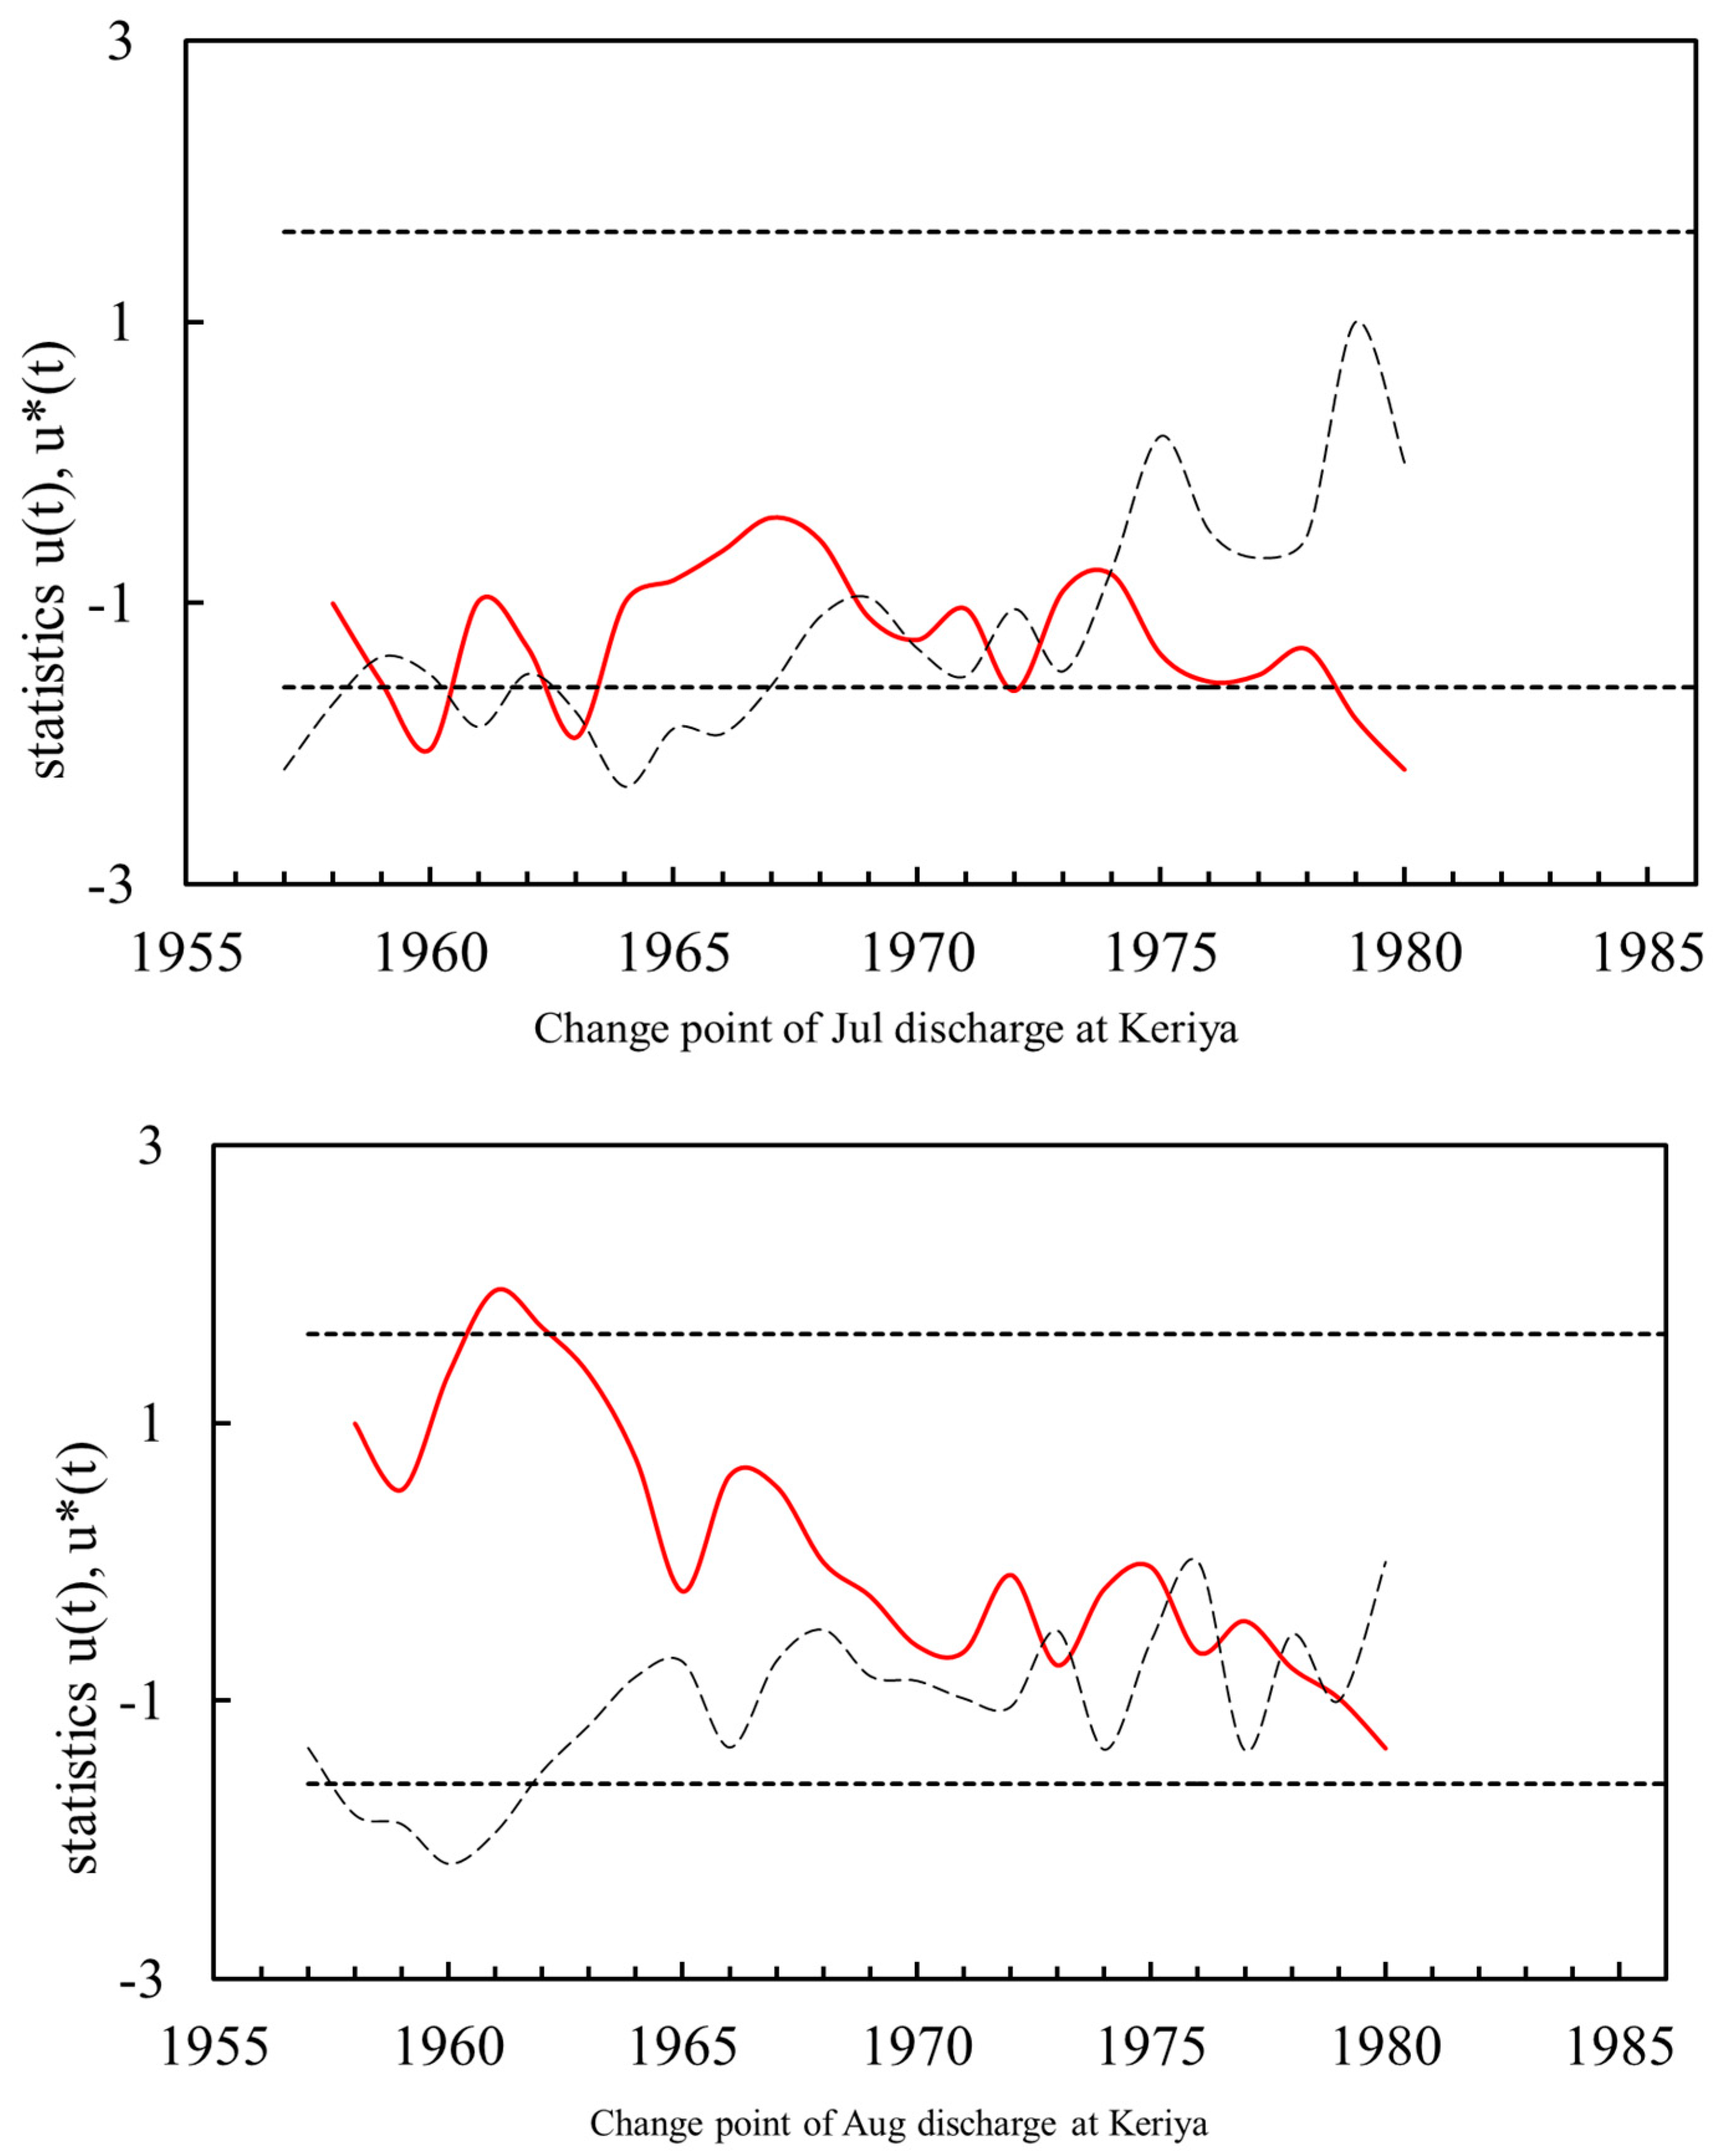
The results of the Mann–Kendall trend and change point test for monthly air temperature and discharge during the summer are shown in
Figure 5 and Figure 6 and summarized in
Table 2 for those trends at the 95% of significance level or better. The change point test reveals, a steady rise in the summer air temperature is not the only feature of the data, the time series for monthly temperatures exhibits fluctuations occurring in various years between 1956 and 1980, June air temperatures feature a significantly rise (P<0.05) since 1986, while July and August air temperatures have risen from 1976 and 2001 respectively, but without significance, implying there is considerable variability.
Due to the earthquakes in 1974,
However, the monthly discharge of the Keriya River did not show any increasing trends to respond to the warmer and wetter climate (not shown in
Figure 5), which can be attributed to a triggering flow of the meltwater flowing through the fault drainage systems.
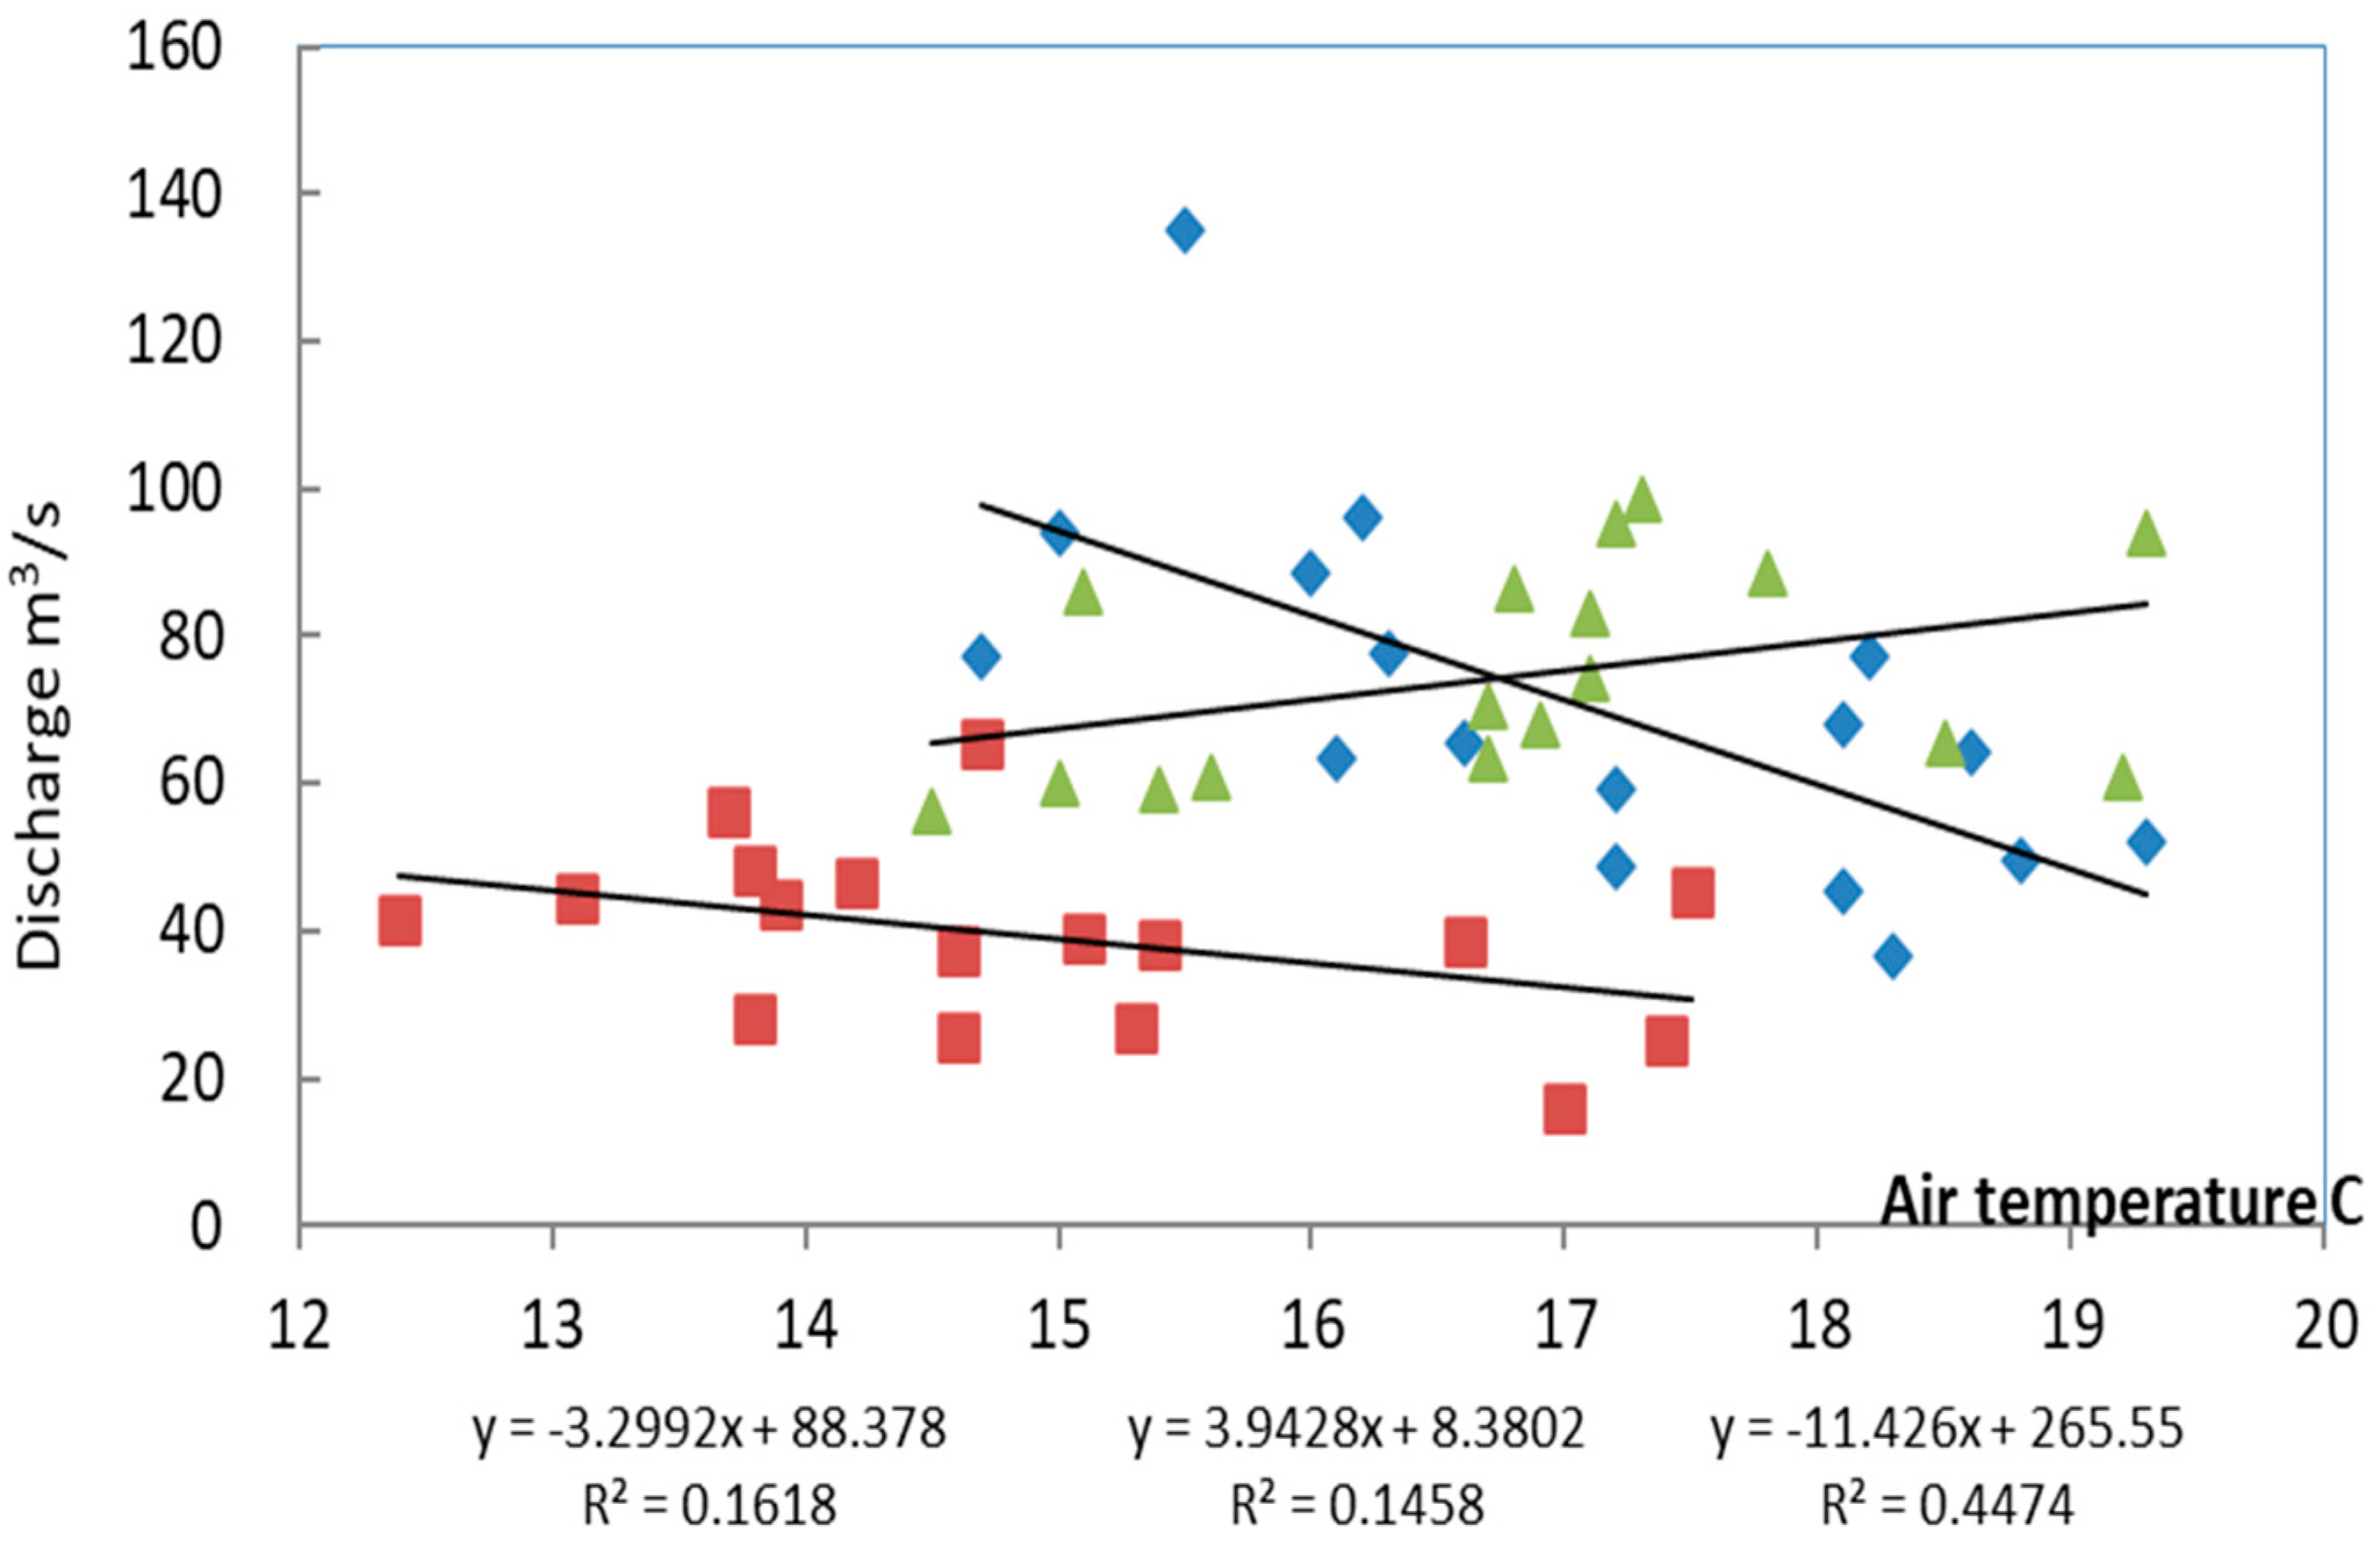
To understand the lack of a response of summer meltwater to air temperature, we calculated the correlation between the monthly air temperature and the meltwater discharge for different periods. For the river, these periods included 1958 to 1980 as a whole; 1958 to 1974 because of the multi earthquakes in 1974, and 1975 to 1980 as a period without earthquake as shown in Figure 7 (red □ -June, blue □ - July and green ▲-August). There are significantly negative correlations between monthly air temperature and discharge in June (R=0.40, P =0.12) and August (R=0.46, P=0.003) at a significance of 0.1 (90% probability), but a significantly positive correlation in July (R=0.65, P=0.06). Subsequently, there is a weakly positive correlation in June only (R=0.34, P =0.21), but none in July and August in period of 1975 to 1980 (●, ○ and ▲ for June, July and August, respectively), following the earthquakes in 1974.
Figure 5.
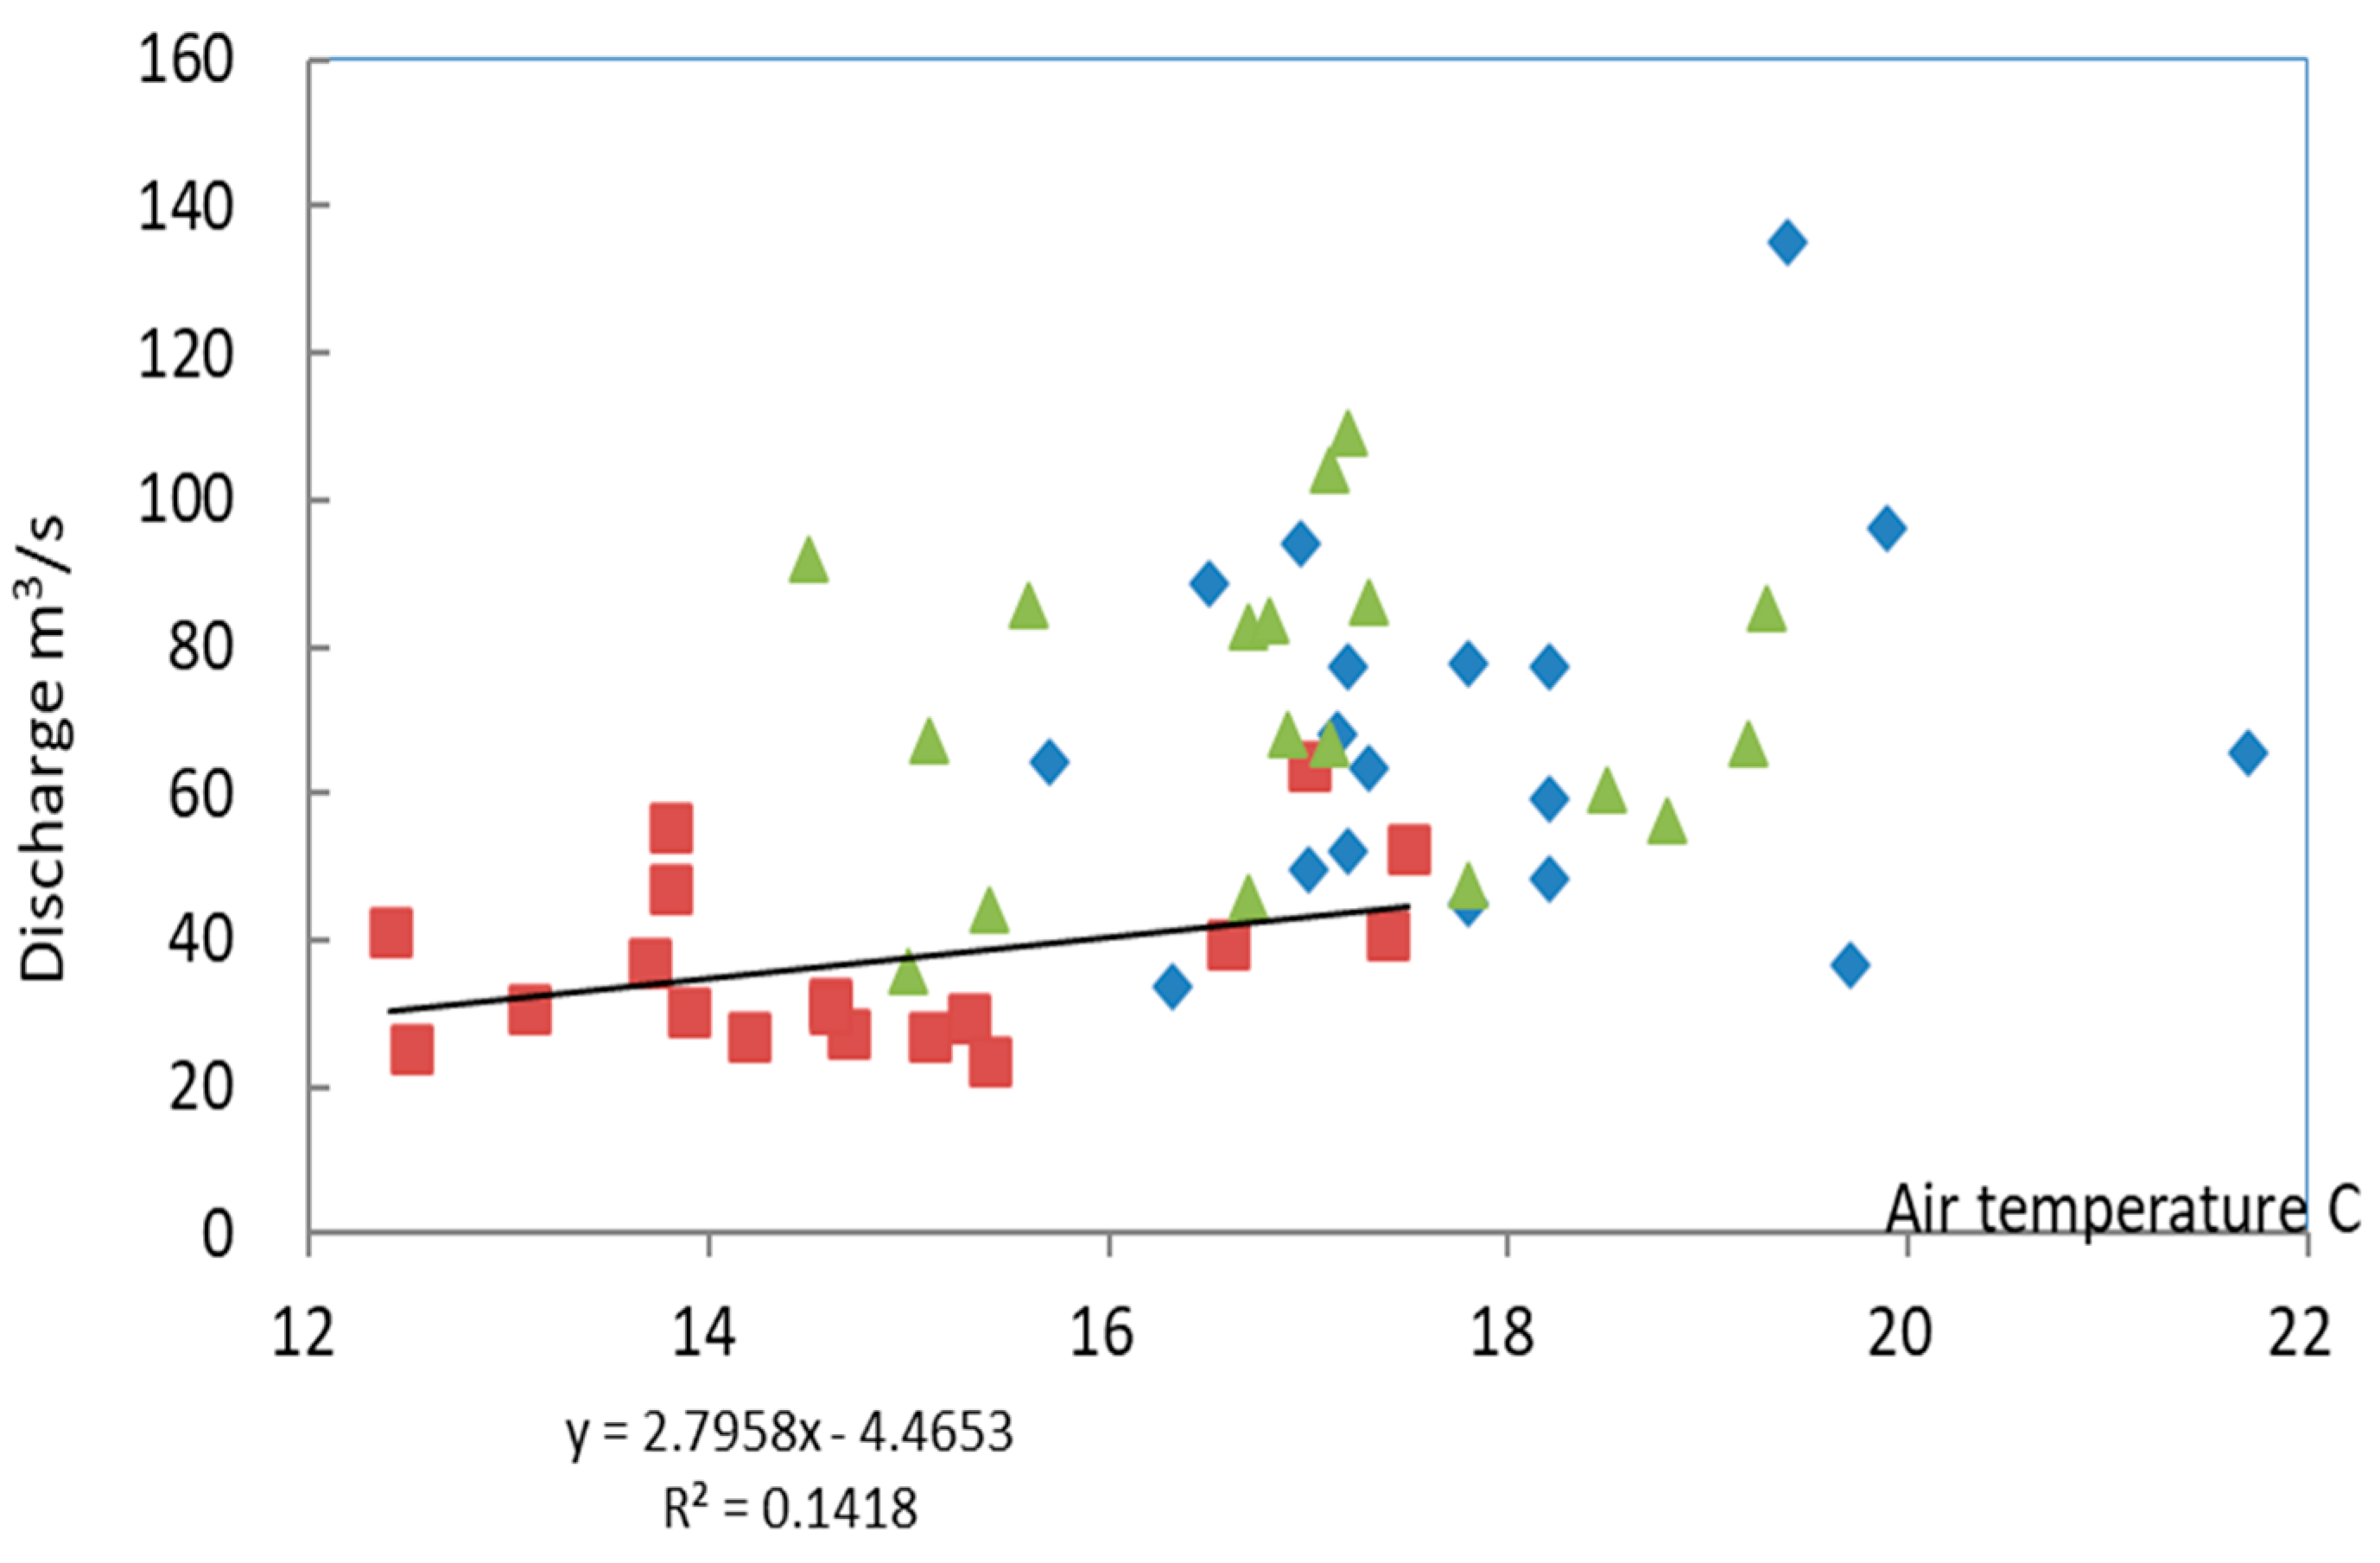
(a) Monthly correlations between monthly air temperature and discharge in summer during 1958 to 1974 (red □ -June, blue □ - July and green ▲-August). There is a significantly negative correlation between monthly air temperature and discharge in June and August at a significance of 0.1 (90% probability), but a positive correlation in July. (b) Correlations between summer monthly air temperature (June to August) and discharge for the Keriya River from 1975 to 1980, there is a weakly positive correlation in June only, but none in July and August, respectively.
As that as relationships between runoff and rainfall in rainy south China, correlation between meltwater discharge and air temperature are positive on ice-snow hydrology. Therefore it is clear that upper stream in drainage systems of the river have been modified by these seismic events, thus changing the relationship between the air temperature and meltwater flow. This observation is critical to obtaining a real picture of snow-ice melt. The inverse relationships may imply that the higher air temperatures lead to a greater loss of the meltwater because more water is transferred to the subsurface flow due to complete thawing of frozen ground which open deep drain channels. Therefore, the maximum air temperatures and high degrees of melting contribution to the poor and unsteady correlations in July.
5. Discussion
The 400 km-long Kunlun-Karakax left-lateral strike-slip fault is the westernmost segment of the ATF, which separates northwestern Tibet to the south from the Tarim Basin to the north. The western section of the Kunlun Fault exhibits clear co-seismic surface ruptures from past major earthquakes [
27,
28,
29]. Earthquakes have been observed to affect hydrological systems in a variety of ways. For example, the spring water, well levels can change dramatically, streams can become fuller and spring discharges can increase at the time of the earthquake [
21,
24,
25], distant earthquakes may even increase the permeability in faults, usually involving increases in the stream and spring discharges in response to large earthquakes. In contrast this study illustrates that water draining into the crust may trigger earthquakes. This relationship is positive feedback between earthquakes and deep drainage systems.
Understanding how the river water flows through the faults and where it enters and exits the fault poses interesting and challenging questions. It has been suggested that the water for certain lakes seeps out from the deep and extensive Xigaze- Langshan Fault zone and is transported to the Badain Jaran Desert in Inner Mongolia, 1200 km from the source lakes [
22]. In more recent studies, a significant amount of groundwater is assumed to flow from the Tibetan Plateau recharge into desert areas to the valleys and fault zones on the plateau and to the Taklimakan Desert northwest of the plateau [
11,
22]. There are the number of faults in the Kunlun catchments, especially in the southern part of our catchments. It is likely that the Kunlun rivers repeatedly drain into and out of these fault systems, though the pathways of the river water remain unknown.
The abrupt and frequent changes in the correlations between summer temperature and meltwater discharge since 1975 and 1997 is attributed to fault activity related to major earthquakes, instead of to climatic change, which should increase the contribution of summer meltwater and enhance the correlation. The meltwater percolates into the mountain’s large deep fault system and travels along deep carbonate layers that extend from the mountain to the desert. Increases or decreases in streamflow, groundwater and well levels are commonly observed following earthquakes [
23,
24,
25], the variability in the water budget of excess flow in different regions following different earthquakes, as cited earlier, may reflect the differences in the regional mechanisms of runoff generation.
Our evidence clearly supports this hypothesis and shows multiple alternations in the relationship between summer meltwater and the air temperature following seismic events. We suggest that the altering of the river regime is caused by the activities of the faults after frequently huge earthquakes which opened and closed river channels in upstream areas in 1974 and 1975, respectively. Furthermore, earthquake-induced changes of the drainage systems are responsible for percolation of summer surface water which disrupts the classical relationship between air temperature and meltwater in snow and ice melt models. We found no extraordinary increase in summer runoff despite the increasingly warmer and wetter climate in this region. This suggests that streamflow from mountain rivers, many of which discharge directly into active faults, have greatly underestimated the basin water and glacier mass budgets by amounts that are comparable to the contribution of human activity and climate change. Similarly, the water resources of the Kunlun rivers, and the rivers flowing through the surrounding faults of the Tarim Basin have been greatly under estimated in previous regional water budgets that did not consider the geologic changes.
Periodic geological events are rare. When two very different events occur closely spaced in time, it is natural to wonder whether there is a causal relationship. In the case of major earthquakes and changes in flow regimes of the rivers triggered by the multi earthquakes in 1974, a causal relationship might be expected because the drainage requires a change in stress, and earthquakes cause rapid and sometimes large changes in stress. Moreover, a spatial relationship exists, when more meltwater percolates into the fault zones, earthquakes occur more frequently.
6. Conclusions
This study highlights two statistical methods of hydrologic correlation of surface waters versus air temperature and changes in daily flow in response to the fault activity induced by multi-earthquake. Our study reveals complex indirect processes that are influenced by the seismic events and fault activity and that lead to the transformation of surface flow into subsurface. Following these earthquake-induced changes, the pattern recovers the original direct relationship between air temperature and meltwater in snow and ice hydrology that was disrupted by the event. The variety of interactions between the hydrogeologic processes provides opportunities for insight into the factors controlling on the changes in both surface and subsurface water resources that are occasionally dominated by changing geologic conditions, rather than climate. The active faults not only ultimately control the periglacial, geomorphic and hydrological processes of the Kunlun Rivers, but also may control and hide the real surface flow in the Karakoram, the Pamir, the Tien Shan Mountains and other alpine rivers of the Himalayas. Therefore, the faults exert a major influence on the long-term evolution of the entire river system.
Acknowledgments
This study was supported by the Natural Science Foundation of China (41030639). We thank Dr. Betsy Armstrong of NSIC in Boulder, USA for constructive comments and manuscript revising.
References
- IPCC. Fourth Assessment Report-Climate change: Summary to Policymakers Houghton JT, Meira F, Callander BA, Harris N, Kattenberg MK, London, New York. 2018.
- Yao, T., et al. Different glacier status with atmospheric circulations in Tibetan Plateau and surroundings, Nature 2012. [CrossRef]
- Yang. Z., Water resources of glaciers in China. Gansu Sci. Press, Lanzhou, 1991, p 6-189.
- Nakawo, M., Ageta, Y., Han, J. Climatic information from Chongce ice cap, West Kunlun, China, Annals of Glaciology, 1992, 14, 205-207. [CrossRef]
- Ujihashi, K., Liu, JS., Nakawo, M. Contribution of meltwater runoff to the rivers in West Kunlun Mts., China. IAHS. 1999,216, 293–307.
- Liu, J., H, Fukushima., T, Hiyama. Hydrological responses of meltwater from glacier covered watersheds to climate change in the Northwest China, IAHS,1999, 256,193-208.
- Abe, O., Wang, L., 2004. Meteorological characteristics in upstream regions of the Qira River, West Kunlun Mts.,China, Bulletin of Glaciological Research, Japanese Society of Snow and Ice 21,17-22.
- Shangguan D., Liu S., Ding Y., et al. Recent changes of Glaciers in Karakoran and West Kunlun Mountains, China. J. Glacio. And Geocryo. 2004,,26(2), 201-208.
- Ji, P., Guo, HD., Zhang, L. Remote sensing study of glacier dynamic change in West Kunlun Mountains in the past 20 years. Remote Sensing for Land and Resources, 2013, 25(1): 93-98.
- Li, H., J.V., Woerd, Z. Sun., et al. Co-seismic and cumulative offsets of the recent earthquakes along the Karakax left-lateral strike-slip fault in western Tibet. Gondwana Research 2012. 21,64–87. [CrossRef]
- Huang, Y., et al., Study on monthly runoff volume in winter, frozen earth and climate change in the Keriya River Basin in the Kunlun Mountains, Arid zone research 2008. 25(2),174-178.
- Hewitt, K. The Karakoram Anomaly? Glacier expansion and the ‘elevation effect’ Karakoram Himalaya. Mountain Research and Development 2005. 25(4),332–340.
- Hewitt K. Tributary glacier surges: an exceptional concentration at Panmah Glacier, Karakoram Him alaya[ J] .Journal of Glaciology, 2007, 53:181-188. [CrossRef]
- Zhou, Y., et al., Geocryology in China. Sci. Press: Beijing 2000., pp10–218.
- Cao, Z., Runoff characteristics in Gozha glacier region on the southern slope of the West Kunlun. J. Glacio. & Geocryo. 1993. 15,156-161.
- Lin Aiming, Bihong Fu, Jianming Guo, et al. Co-Seismic Strike-Slip and Rupture Length Produced by the 2001 Ms8.1 Kunlun Earthquake. Science, 2002. 296,2015-2017. [CrossRef]
- Lin, A., Kano, K.I., Guo, J., Maruyama, T. Late quaternary activity and dextral strike–slip movement on the Karakax Fault Zone, northwest Tibet. Tectonophysics 2008. 453, 44–62. [CrossRef]
- Huang, G.C., D. Roecker, S.W., Levin. Lower-crustal earthquakes in the West Kunlun range. Geophysical Research Letters 2011, 38, L01314. [CrossRef]
- Avouac, J.P., Peltzer, G. Active tectonics in Southern Xinjiang, China: analysis of terrace riser and normal fault scarp degradation along the Hotan-Qira Fault System. Journal of Geophysical Research 1993. 98 (B12), 21773–21807. [CrossRef]
- Replumaz, A., et al. Large river offsets and plio-quaternary dextral strip on the red river fault, J. Geo. Res. 2001. 106,819-836. [CrossRef]
- Chen, J., et al. Groundwater maintains dune landscape. Nature 2004. 432, 459-460. [CrossRef]
- Chen, J., C. Wang Rising springs along the Silk Road. Geology 2009. 37(3),243–246. [CrossRef]
- Milliman, JD., JP. Syvitski. Geomorphic/tectonic control of sediment discharge to the Ocean: The Importance of small mountainous Rivers. Journal of Geology 1992,100,525-544. [CrossRef]
- Montgomery, DR., M, Manga. Streamflow and water well responses to earthquakes. Science 2003.300, 2047-2049. [CrossRef]
- Rojstaczer, S., Wolf, Michel, R. permeability enhancement in the shallow crust as cause of earthquake-induced hydrological changes. Nature, 1995, 373(6511), 237-239. [CrossRef]
- Wright, T.J., Parsons, B., England, P.C., Fielding, E.J. InSAR observations of low slip rates on the major faults of Western Tibet. Science, 2004.305, 236–239. [CrossRef]
- Fu, B., et al. Late quaternary tectonic-geomorphic features along the Kangxiwa fault, Altyn-Tagh fault system, North Tibet. Quaternary Science 2006, 26(2),228-235.
- Kendall, M. Rank Correlation Measures, Charles Griffin 1975, London. pp, 5-189.
- Mann, H. Non-parametric tests against trend, Econometrica, 1954.13,245-259.
- Burn, D., Elnur M. Detection of hydrologic trends and variability, J. Hydrology 2002.255,107-122. [CrossRef]
- Hock, R., 2003. Temperature index melt modeling in mountain areas. J. Hydrology 282,104–115. [CrossRef]
- Omar, I., Aziz, A, Burn, D. Trends and variability in the hydrological regime of the Mackenzie River Basin. J. Hydrology 2006. 319,282–294. [CrossRef]
|
Disclaimer/Publisher’s Note: The statements, opinions and data contained in all publications are solely those of the individual author(s) and contributor(s) and not of MDPI and/or the editor(s). MDPI and/or the editor(s) disclaim responsibility for any injury to people or property resulting from any ideas, methods, instructions or products referred to in the content. |
© 2023 by the authors. Licensee MDPI, Basel, Switzerland. This article is an open access article distributed under the terms and conditions of the Creative Commons Attribution (CC BY) license (http://creativecommons.org/licenses/by/4.0/).
