4.2. Simulation Results and Sensitivity Analysis for Different Scenarios
The initial conditions of the model are set as follows: the initial time is 0, the final time is 12, and the time step is 0.0015625. Based on the real situation and the assumptions of the model, the revenue level for the owner-operated charging station is 100 units, the cost of retrofitting for connecting the charging station to the platform for network control and unified settlement is 60 units, the revenue increase for the charging station owner's participation in the sharing platform is 20 units, the idle loss for the charging station owner is 150 units, and the social efficiency loss for the idle charging station is 200 units. The government's cost for building the sharing platform is 80 units, the subsidy cost is 20 units, the management fee charged for charging station operation is 40 units, and the social efficiency gain from the charging station utilization improvement is 150 units. The initial values for 、and γ are set to 1, while and are set to 0.1 and 0.7, respectively.
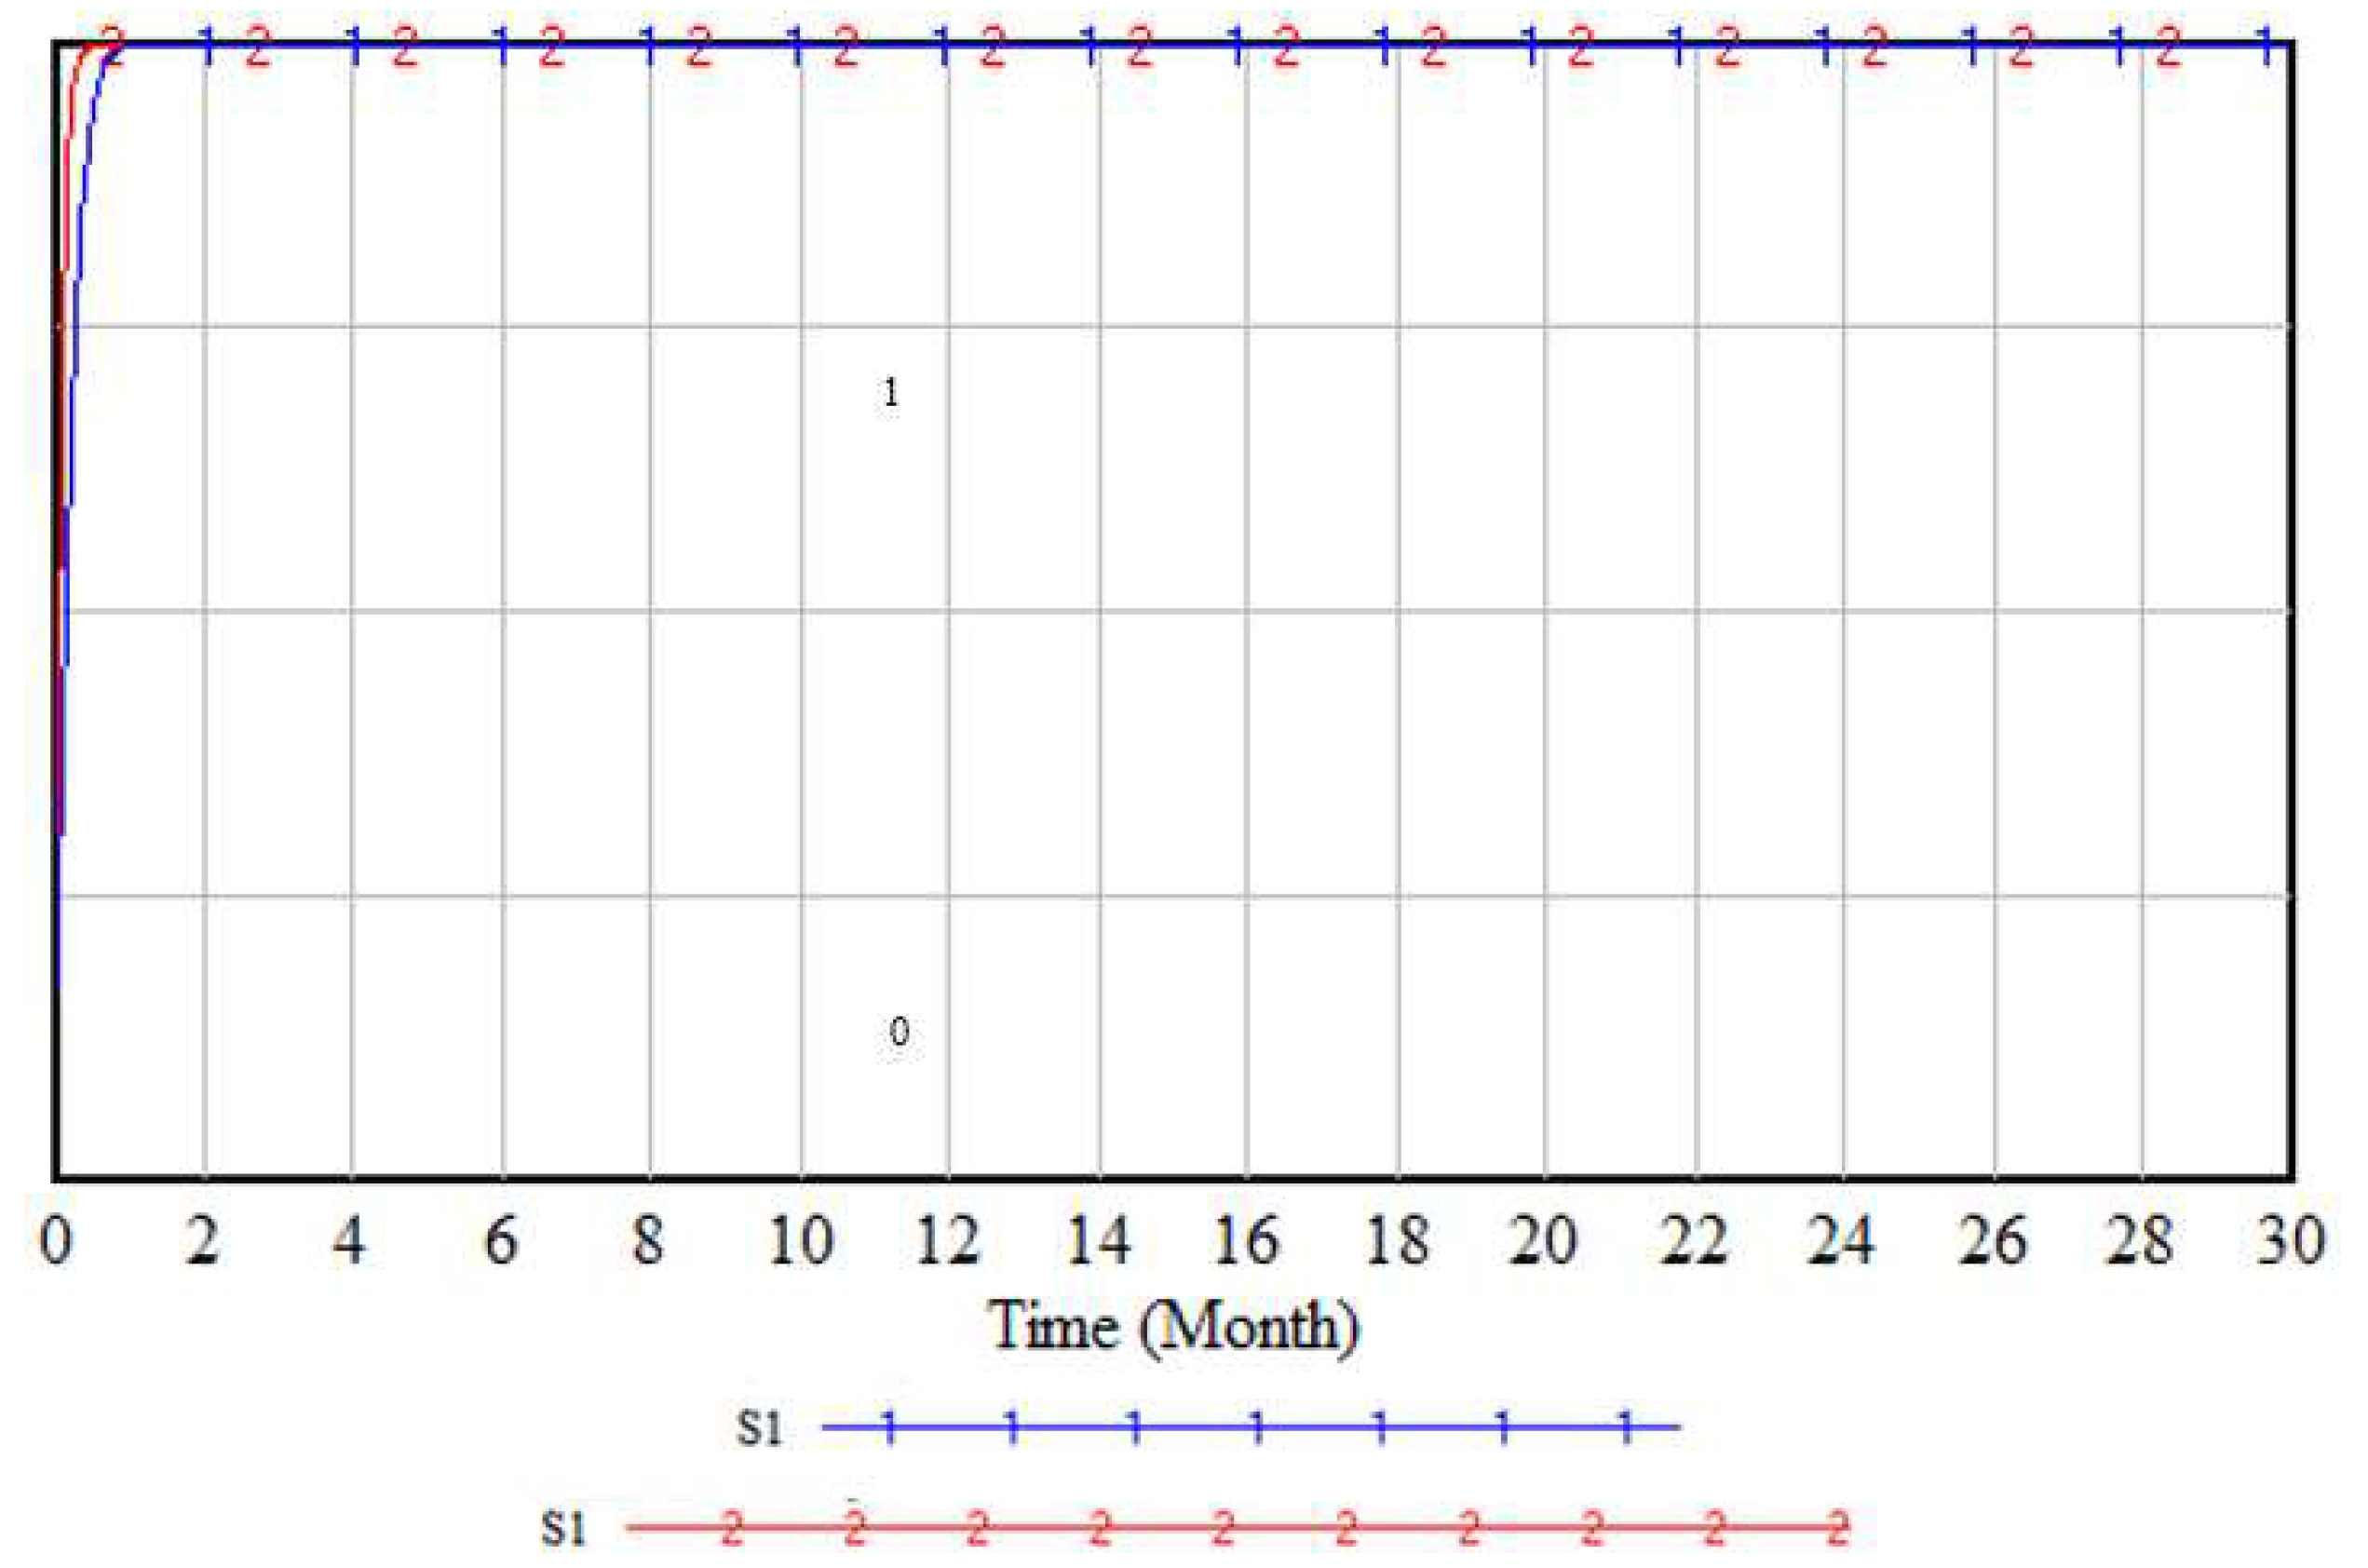
With the initial values input, the simulation results are shown in
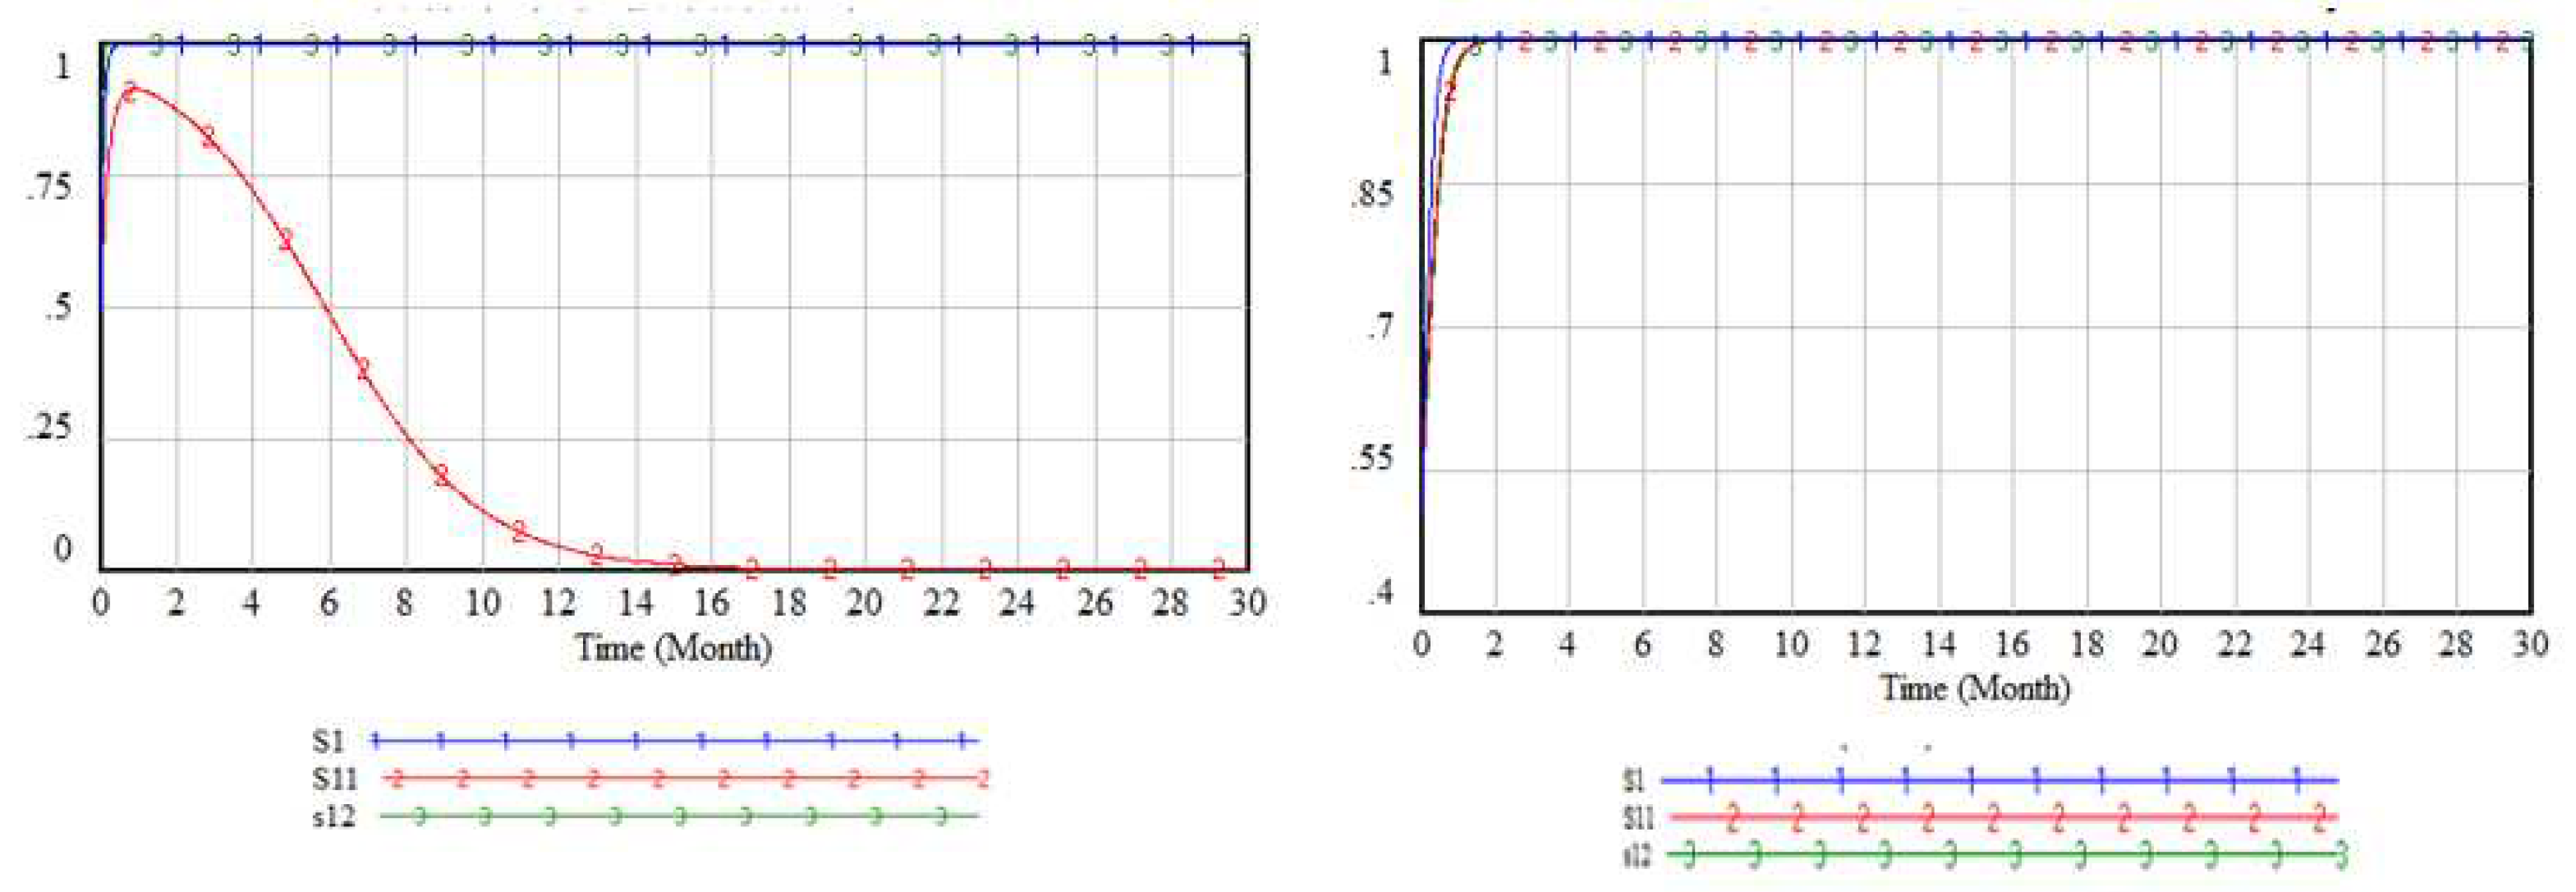
Figure 2. Under the initial parameter conditions, both the platform operator (government) and the charging station owner take active decisions, and a stable equilibrium point (1,1) is reached, which is consistent with the rough analysis of evolutionary stability. Considering the intensity factors
、
and γ and the charging station idle rate conditions
and
set in the model, different game scenarios are discussed, and simulation analyses are conducted with different parameter combinations based on the actual situation.
- (1)
Sensitivity simulation for different cost intensity cases.
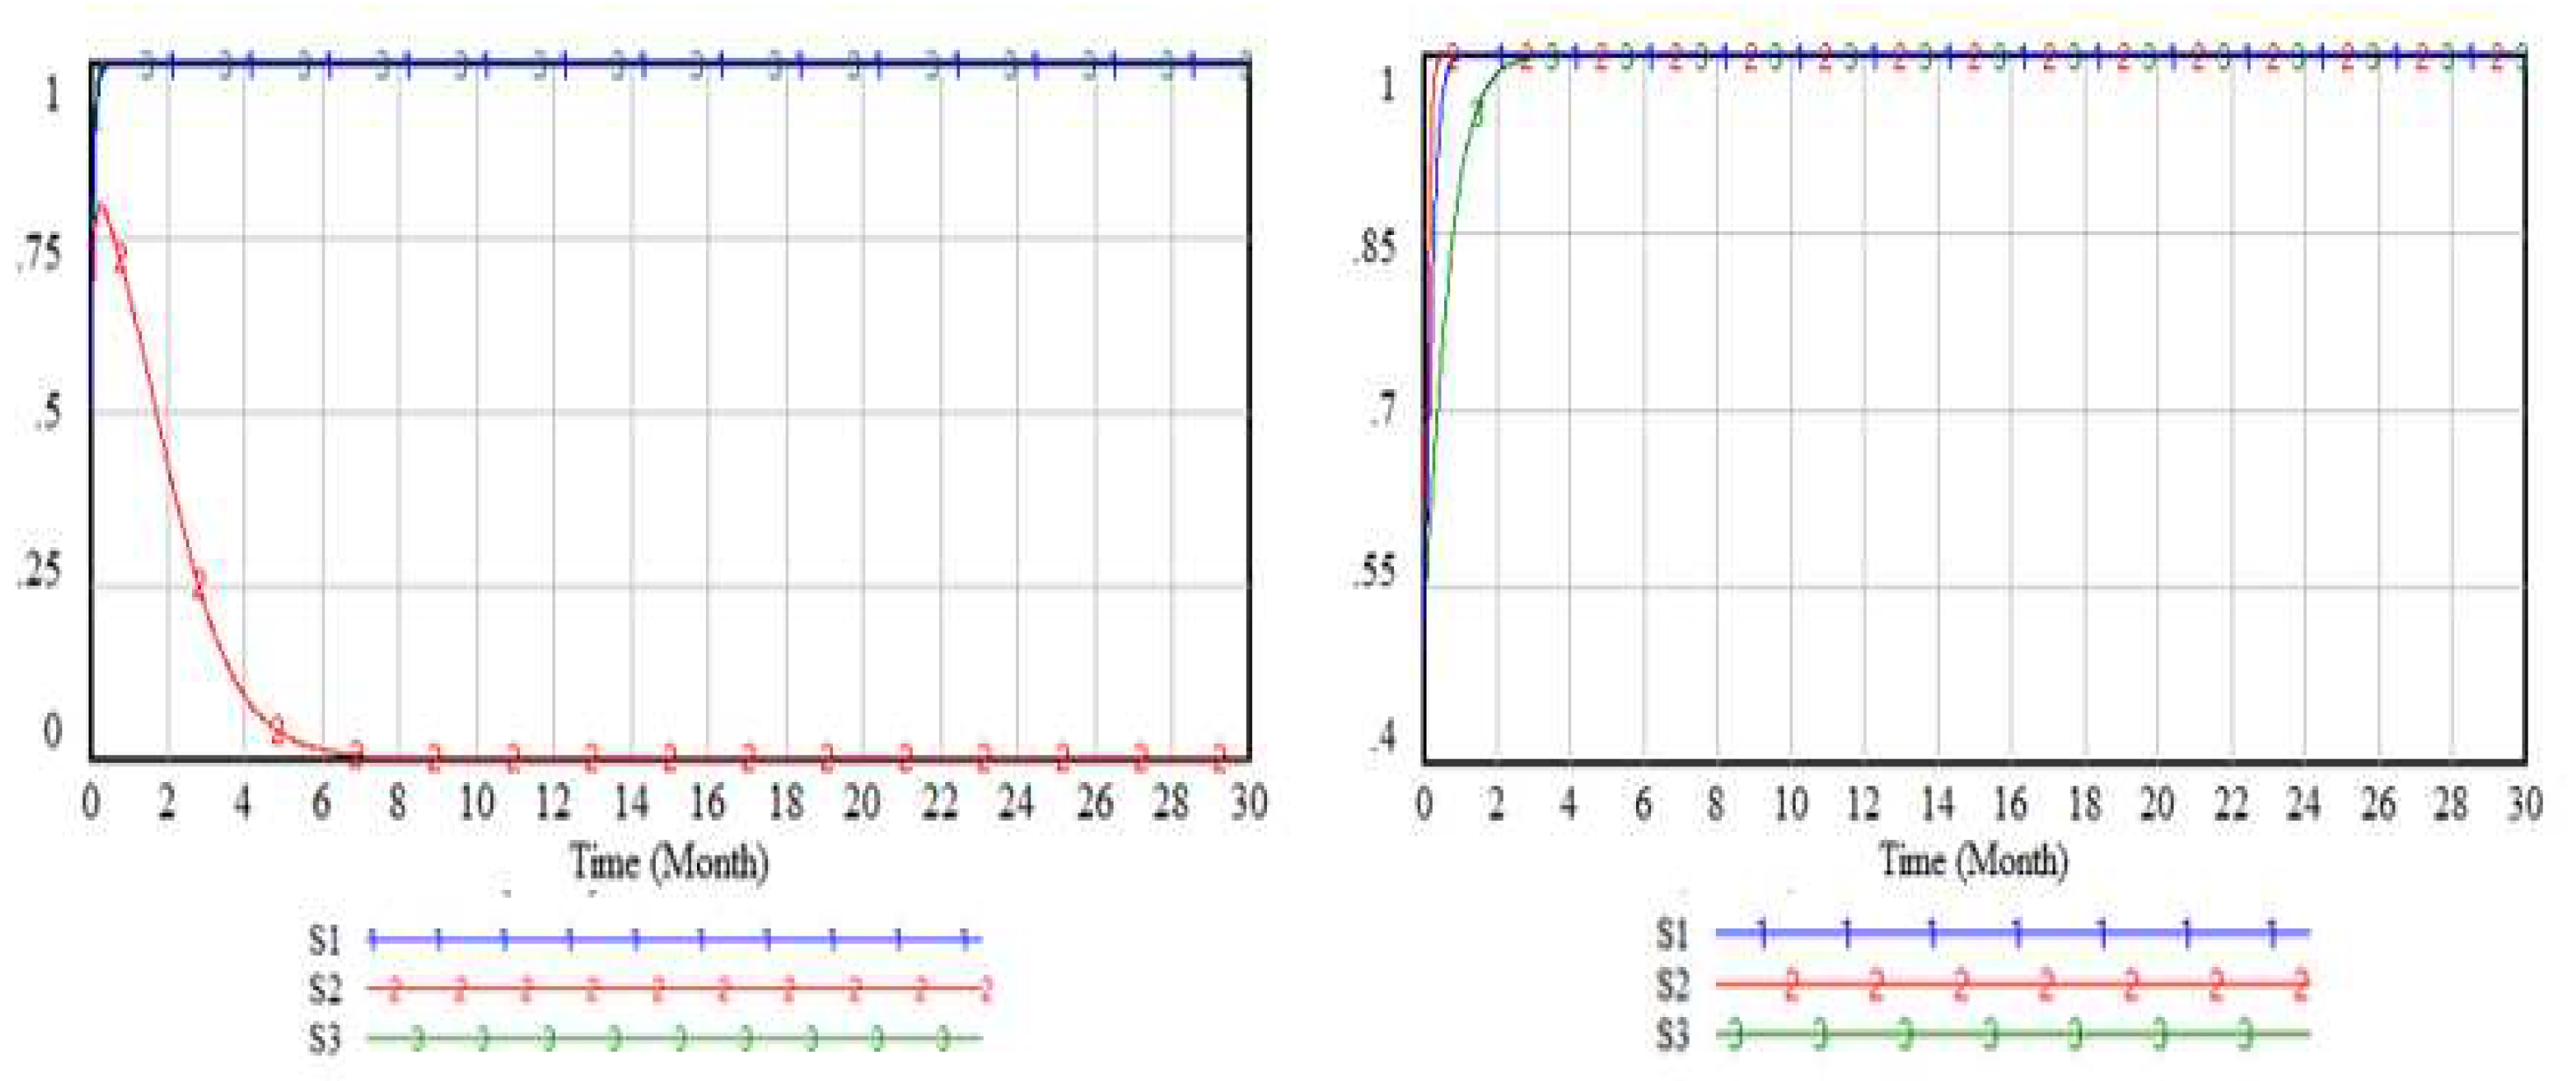
As the proactive measures taken by the platform (government) require expenditure, such as establishing a sharing platform and providing subsidies to platform users, the cost of policy-making has a significant impact on government decision-making. Only appropriate subsidies can stimulate the enthusiasm of charging station owners to join the platform and not cause excessive financial pressure. Different cost intensities will directly affect the value of . Therefore, it is necessary to discuss the values of the intensity parameter. Situation 1 is the initial parameter and serves as a control. Situation 2 is set to twice the parameter level of Situation 1, where the cost level is higher. Situation 3 is set when the cost level is lower. The value scenarios are shown in
Table 4. The simulation results are shown in
Figure 3.
As can be seen from the results, when the cost intensity increases significantly, the government's strategy choice changes (indicated by S2), shifting from an active decision to an inactive one. This indicates that cost changes have a significant impact on decision-making, and the formulation of this policy puts significant pressure on the platform party (i.e., the government) finances. On the other hand, changes in cost intensity do not alter the decision outcome for the charging station owners, but a significant increase in cost intensity can accelerate their participation rate in the platform decision-making.
- (2)
Simulation of sensitivity to the intensity of overhead costs of the platform party (government)
In the model design, in the game scenario where the platform (government) takes an active decision but the charging station owner chooses not to, the management fee for charging station operation is not exempted. γ is the intensity parameter for implementing this decision, with γ = 2 representing high management fee level and γ = 0.5 representing low management fee level, corresponding to scenarios 4 and 5 in
Table 5, respectively. The simulation results are shown in
Figure 3, compared with the initial scenario 1. The influence of different management fee levels on government policy choices is relatively small. The main impact of government decisions is still the social benefits of the policy, and the financial revenue generated by the management fee has limited impact on decision-making. The increase in management fee intensity will accelerate the rate of charging station owners joining the sharing platform decision-making, reflecting the sensitivity of charging station owner decisions to costs.
- (3)
Simulation of sensitivity to the idle rate of charging piles
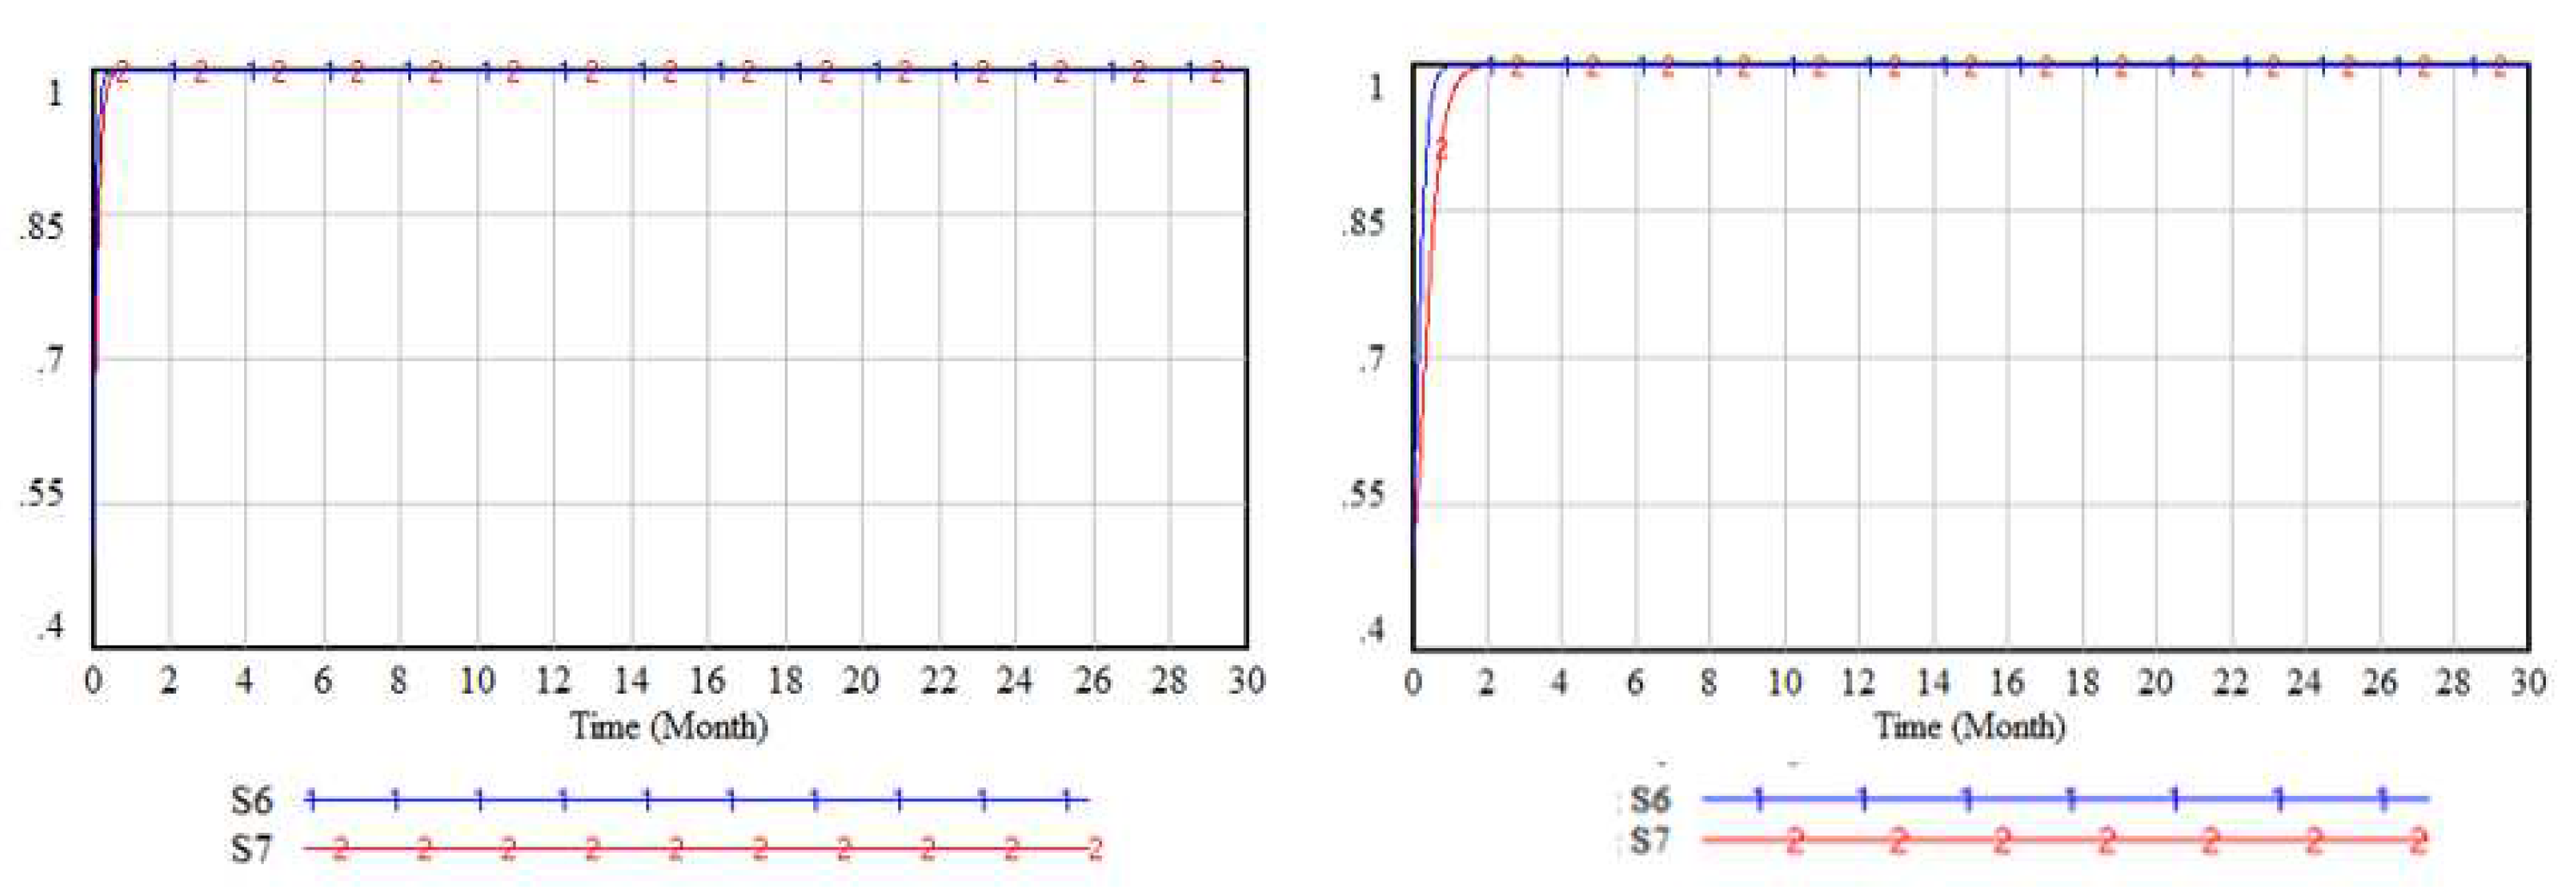
The idle rate of charging piles reflects the actual usage of charging piles. Personal charging piles are often used 1-2 times a week and have a high idle rate. The overall idle rate of charging piles in the urban area reflects the adaptation level of the overall charging infrastructure configuration, and reducing the overall idle rate is also an important goal for the charging pile platform operation to solve the uneven distribution of charging piles. Setting scenario 6 as the high idle rate scenario and scenario 7 as the low idle rate scenario, the idle rates are shown in
Table 6, and the simulation results are shown in
Figure 5. The decrease in idle rate will also reduce the rate at which the government and charging pile owners make joint decisions on platform sharing.
- (4)
Simulation of sensitivity to market development stages
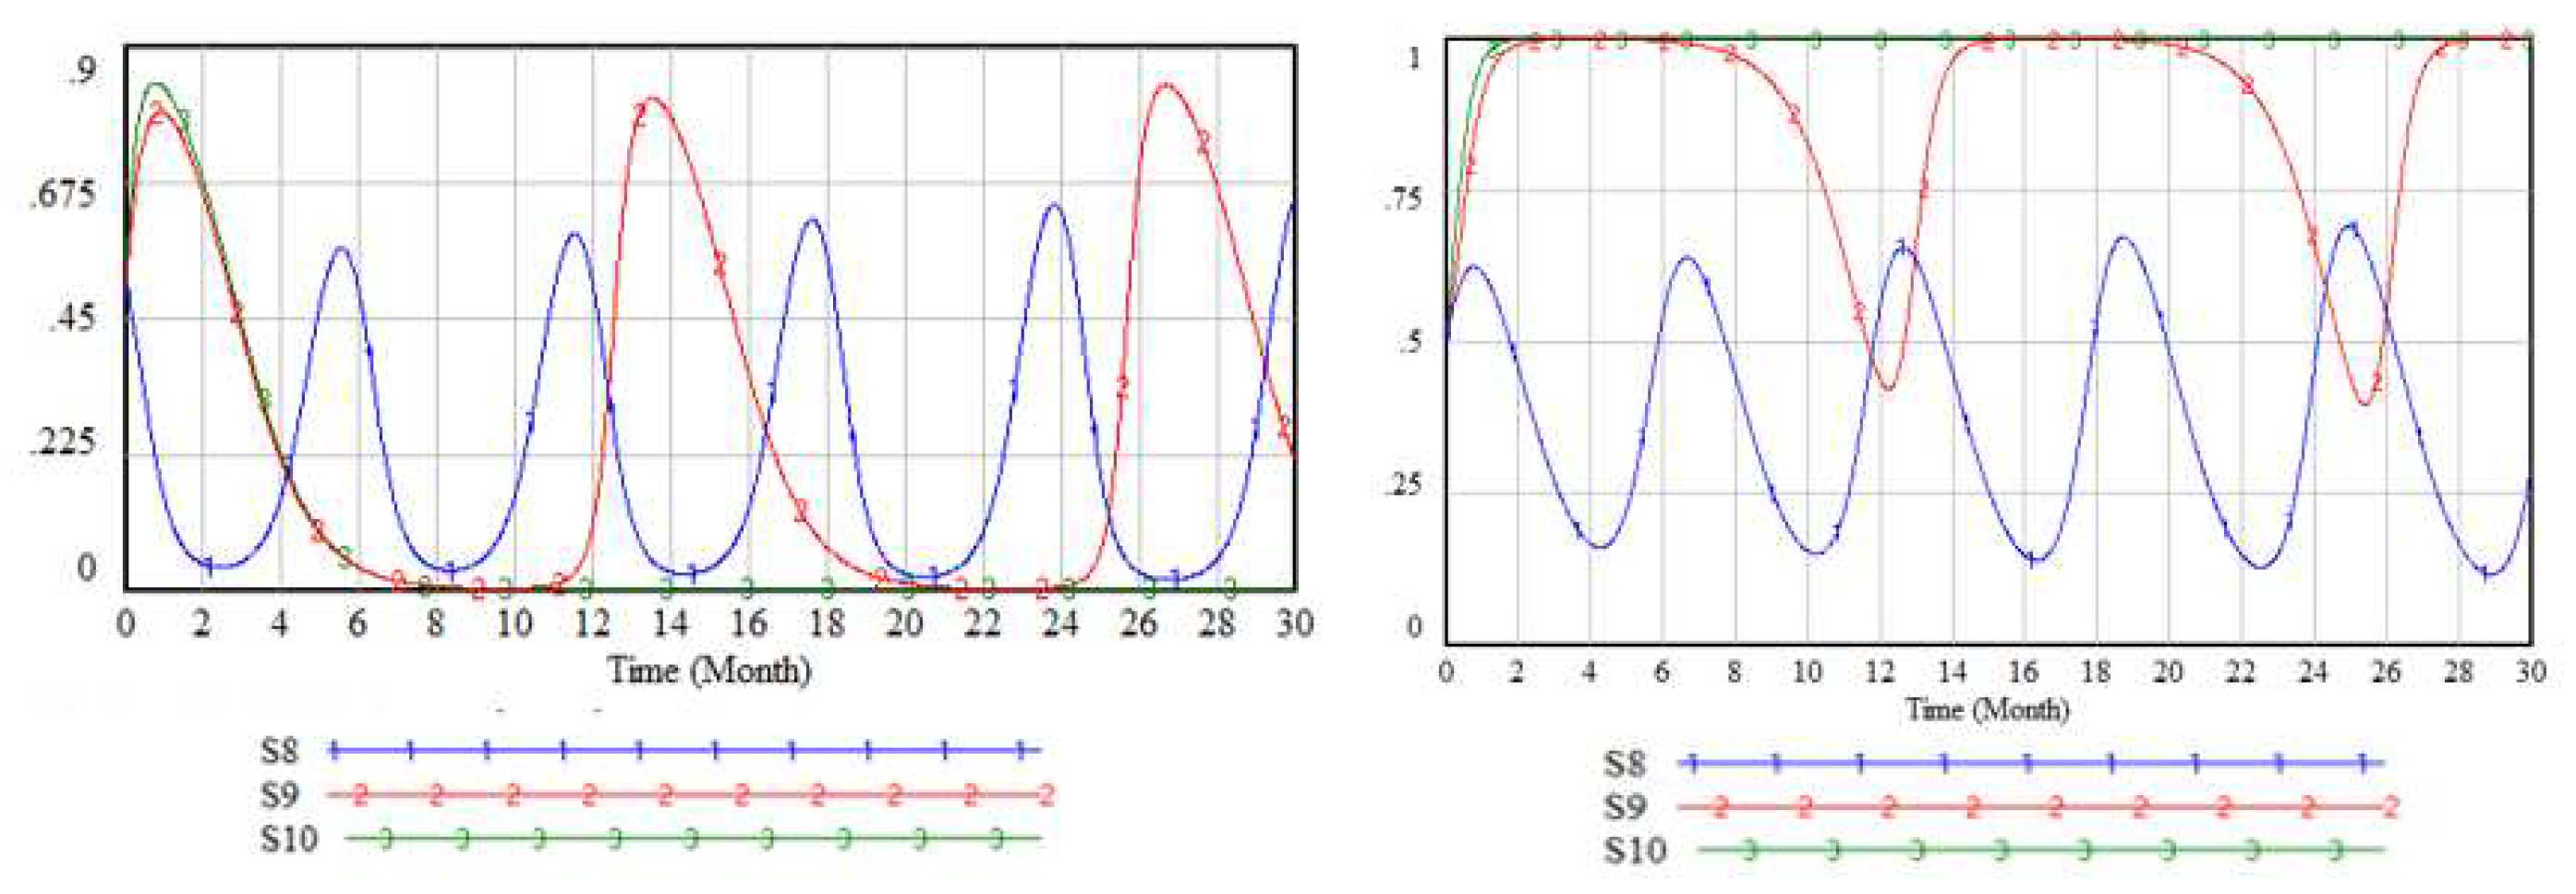
As many cities have already launched related shared charging station construction, the cost of charging station transformation will continue to change with the continuous maturity and progress of technology. Therefore, Scenario 8 is designed for the later stage of the market, where the idle rate of charging stations enters the normal range, the shared charging station market tends to be saturated, and the cost of charging station operation and maintenance increases significantly. Scenario 9 represents the mature stage of the market, where the idle rate of charging stations enters the normal range, and the transformation cost gradually decreases to a certain level as the market size expands. Scenario 10 represents the initial stage of the market, where personal charging stations grow rapidly, resulting in a rise in the overall idle rate of charging stations, and the shared charging station market is just starting, with high transformation prices. The coefficient values under each scenario are shown in
Table 7.
Under the condition that the idle rate enters the normal range, the adjustment of the decision-making behavior of both parties increases with the increase in retrofitting costs, leading to unstable fluctuations and making the game process difficult to control. It is challenging to obtain an evolutionarily stable strategy.
- (5)
Sensitivity simulation on the parameters of social benefits and charging post owners' revenue level
The social benefits reflect the improvement of the travel experience of electric vehicle drivers and the carbon reduction benefits brought by some private car owners choosing to purchase or replace their cars with electric vehicles due to the overall increase in the use of charging stations in the city. The quantification of this parameter needs to consider both the overall development of electric vehicle travel and the overall social benefits brought by the development of low-carbon transportation in the city. It is challenging to accurately determine and is compared in two scenarios, high and low. Similarly, the normal revenue level of charging station owners is also compared in two scenarios, high and low, with parameter values shown in
Table 8. The simulation results, as shown in
Figure 7, demonstrate that as the social benefits significantly decrease, the government's decision-making changes from proactive to inactive. Conversely, the improvement of social benefits accelerates the government's decision-making process towards a more proactive approach, reflecting the government's consideration of overall social development. The decision of charging station owners remains unchanged.
- (6)
Sensitivity simulation of charging stake owners' participation in revenue sharing platform
The costs and benefits of participating in a sharing platform are important considerations for charging station owners in making decisions from a business perspective. In this study, we compared two scenarios: one where the benefits of participation increase while costs remain unchanged (Scenario 13), and another where the benefits remain constant while costs increase (Scenario 14). The parameter values used in the simulation are presented in
Table 9, and the simulation results are shown in
Figure 8. When the benefits of participation in the sharing platform increase, charging station owners accelerate their decision-making process to participate. However, when the cost of retrofitting the charging stations increases significantly while the benefits remain unchanged, charging station owners switch from a participation strategy to a non-participation strategy. The government's decision remains unchanged, but the speed at which it adopts an active strategy increases when charging station owners switch to a non-participation strategy.
In conclusion, the costs and benefits of participating in a sharing platform are critical factors for charging station owners in making business decisions. As shown in our simulation results, charging station owners are more likely to participate when the benefits increase. However, if the costs increase significantly, they may choose to opt-out of the sharing platform. These findings have important implications for policymakers and charging station owners in promoting the adoption of electric vehicles and developing sustainable transportation systems.

