1. Introduction
Structural health monitoring is a critical step in composite design. Some composites are subjected to aggressive chemicals such as fuel, acid, alkaline solution, saline, and sewage [
1,
2,
3,
4]. It is crucial to monitor the health of these composites in real-time and develop a contactless sensor capable of detecting small changes that could potentially be detrimental to the composite [
5,
6,
7]. Swelling and hydrolysis of the matrix are two common results of exposure to aggressive conditions [
2,
8,
9,
10]. Swelling leads to deformation of materials that can cause an early catastrophic failure. Since swelling, corrosion, and hydrolysis are diffusion limiting, it would be clever to develop a smart sensor that can detect swelling and hydrolysis at an early stage of degradation [
2,
11,
12]. On the other hand, a characterization technique must be provided that quantifies the degradation over time during the diffusion process. Nano-indentation is a good candidate as it is a non-destructive method to determine the mechanical properties, such as stiffness and strength [
7,
10]. This is complementary to the sensor data in determining the big picture of the material behavior at the nano scale.
During degradation, micro damage can occur and transform into macroscopic cracks that lead to catastrophic failure [
9,
13,
14,
15]. This micro-damage is generally caused by stress concentration and materials’ degradation. There are many crack and deformation detection methods, such as those involving a material’s electrical, acoustic and optical properties [
16,
17,
18,
19]. Currently, studies on the effect of aggressive chemicals on composites are based on changes in volume and weight. The diffusion follows Fick’s law [
3,
20,
21]. The penetration of aggressive chemicals always changes the dielectric property of the polymer matrix. In this case, measuring the conductivity and dielectric behavior of the polymer has been proven to be a good tool in monitoring the chemical penetration process [
20,
22].
The penetration of acid occurs initially during the diffusion process. After the penetration of acid and water, hydrolysis of polymer matrix occurs, which alters the mechanical properties of the material. It is thus important to monitor the penetration of acid species in the composite. The geometry and orientation of nano-additives would affect the diffusion process [
9,
23,
24,
25]. Usually, the use of nanomaterials would increase the diffusion speed of attacking chemicals. However, many studies have shown that two-dimensional materials, such as nano-clay, graphene, and boron nitride are excellent barrier materials [
2,
26,
27,
28].
A previous study has shown that the dispersion of conductive nano-additives affects the physical properties of nanocomposites [
20,
27,
29,
30]. For that reason, a sensor using low concentration nano-additives could be. The conductive network is not established until the formation of ions occurs during degradation. During the chemical penetration process, the attacking ions become the bridging units for this network. As a result, the conductivity of nanocomposite increases upon penetration and which could be used as an indicator for monitoring of the penetration. On the other hand, CNT could form the conductive network in a very efficient way [
2,
7,
11,
29].
In this study, two methods have been utilized in order to assess the use of CNT in Polymer matrix nanocomposites. Free Space Measurements were used to monitor the changes in the material during chemical attack in real-time, while nanoindentation was used as a post-process to quantify this change as a function of time.
2. Materials and Methods
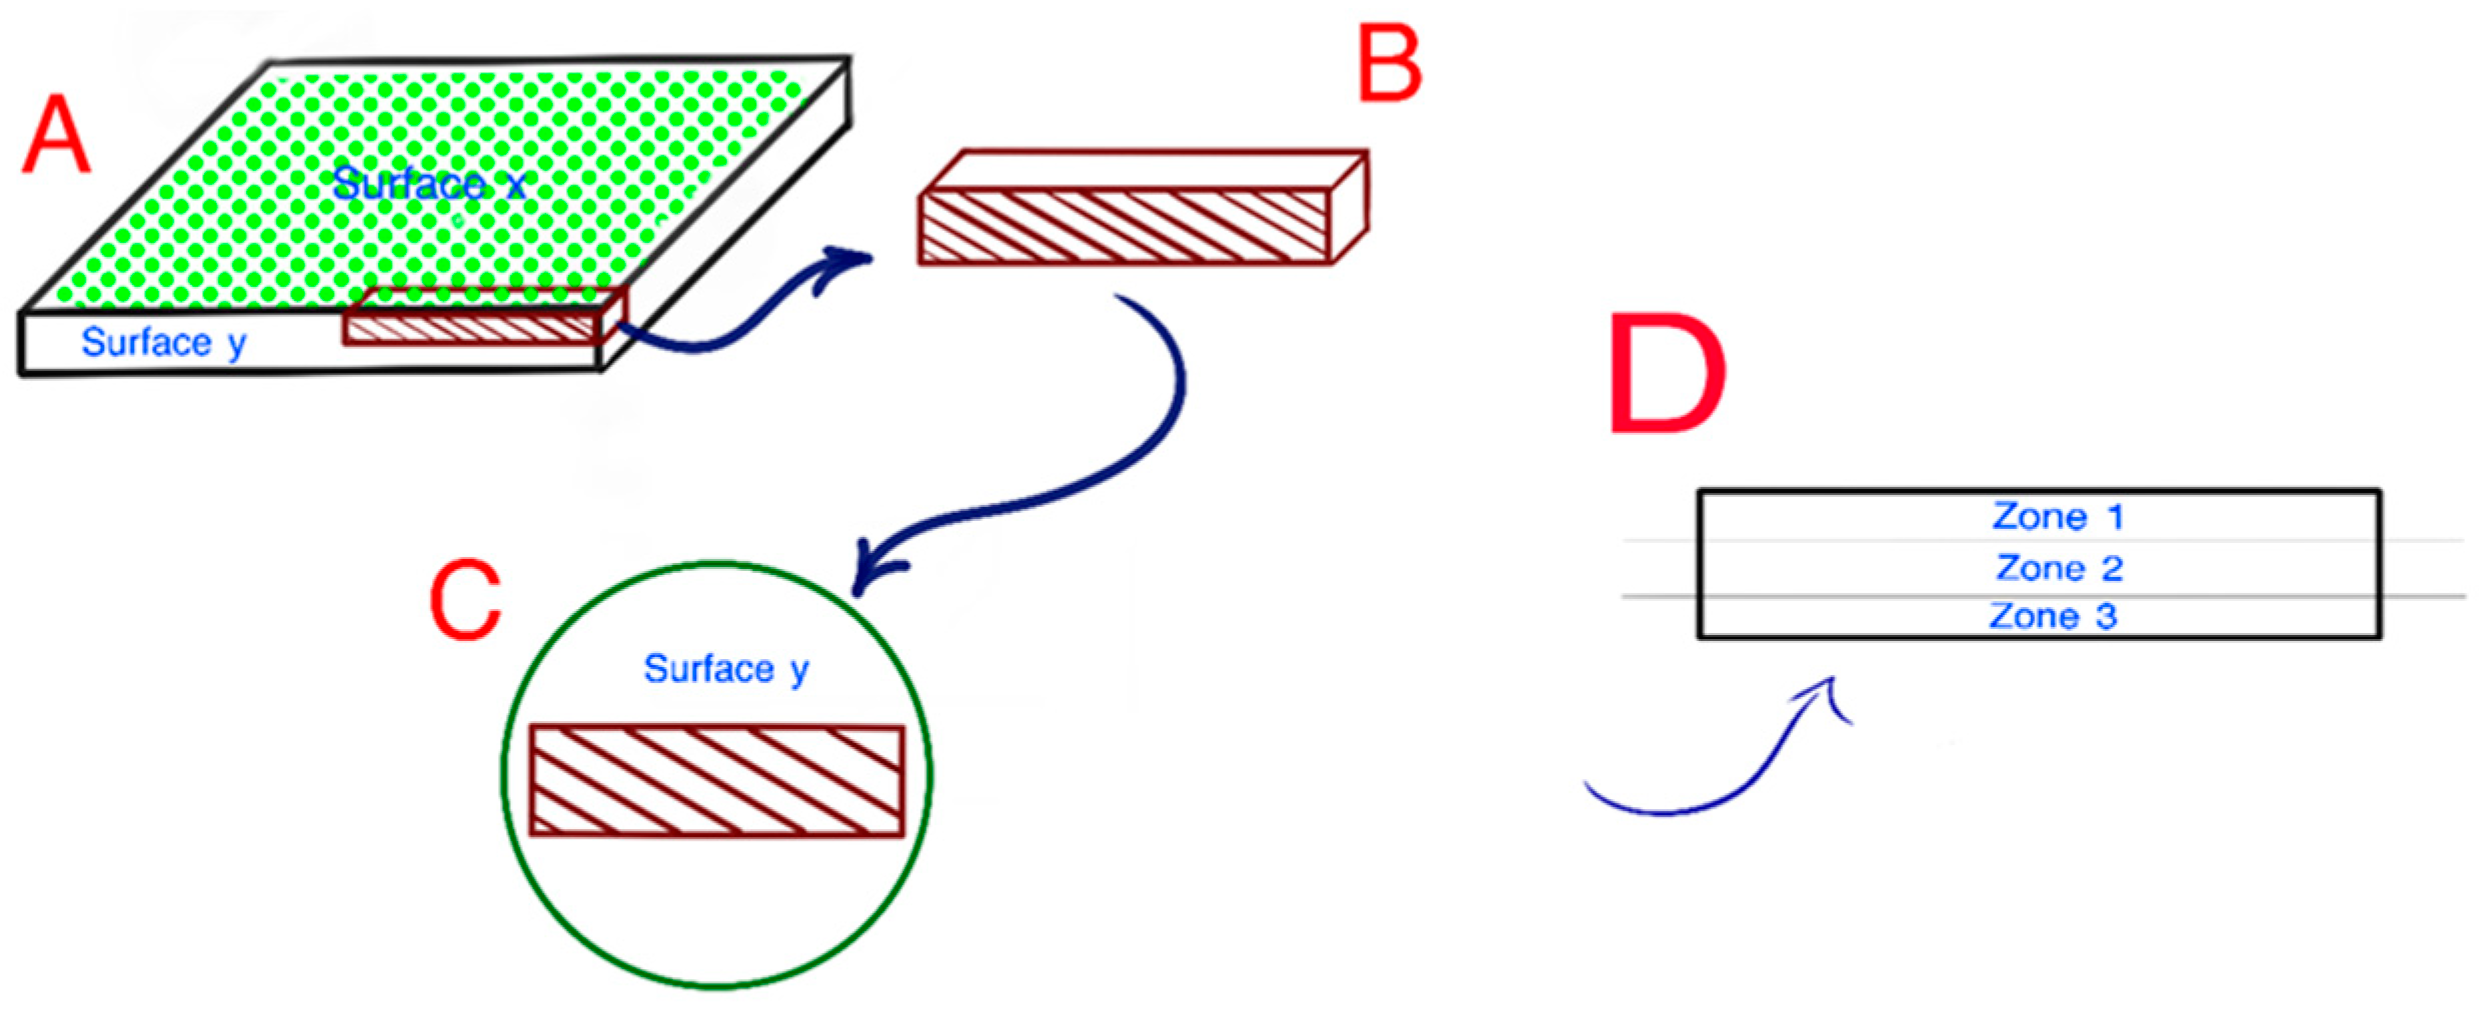
Epoxy samples containing various percentages of carbon nanotubes (CNTs) were prepared. The CNT percentages included 0 wt%, 0.5 wt%, 1 wt%, 2 wt%, 4 wt%, and 5 wt%. The samples were prepared by mixing the epoxy resin with the appropriate amount of CNTs using a mechanical stirrer until a homogeneous mixture was achieved. The mixture was then poured into sheet molds with dimensions of 10cm x 10cm x 5mm and cured at room temperature for 24 hours.
After curing, the samples were cut into smaller pieces in the x, y, and z dimensions using a diamond saw. The resulting samples were then divided into three equal zones for each CNT percentage. One set of samples was used as a control, while the other two sets were subjected to acid exposure for one week and one month, respectively. The acid exposure was carried out by immersing the samples in acid solution.
After the acid exposure period, the samples were rinsed thoroughly with distilled water and dried at room temperature. Then, the samples were characterized using to nanoindentation testing technique (a Berkovich diamond indenter with a maximum load of 1000 mN and a loading and unloading rate of 2000 mN/min). Seven indents were made on each zone of the samples, resulting in a total of twenty indents per sample and 60 indents per CNT percentage. The nanoindentation measurements were used to determine the local hardness and elastic modulus of the epoxy/CNT composites before and after acid exposure, and to evaluate the effect of CNT percentage on the acid resistance of the composites.
In addition to the nanoindentation testing, the bulk mechanical properties of the samples were evaluated using a DMA machine. The DMA experiments were performed on the control samples and the samples before and after acid exposure. The samples were subjected to a sinusoidal stress at a frequency of 1 Hz employing three-bending point technique, with a stress/strain force of 10 N at a rate of 0.5 N/min at a constant room temperature 25°C. The stress-strain curves were obtained from the DMA experiments to evaluate the effect of CNT percentage and acid exposure on the mechanical properties of the epoxy/CNT composites.
The materials characterization was performed using a Network Analyzer Agilent N230A at room temperature (25 °C). Two Flexible cables were connected to port 1 and port 2. The calibration was performed using the E-Calibration Kit N4693-60003. The free space measurements were performed using two microstrip antennas with a central resonance frequency of 5GHz. Because the beamwidth of the antenna at the main lobe is three time less than the minimum transverse dimension of the sample, the diffraction effect at the edges of the samples were negligible [56].
The measurements were performed in the far-field range at frequency range 3 GHz to 6 GHz. First, the return loss (S11) and insertion loss (S21) of the antenna were obtained in free space inside the anechoic chamber. Then, after placing the samples in between the antennas at a distance of 25 mm, the scattering parameters were measured.
Figure 1.
Illustration of sample preparation.
Figure 1.
Illustration of sample preparation.
3. Results and Discussions
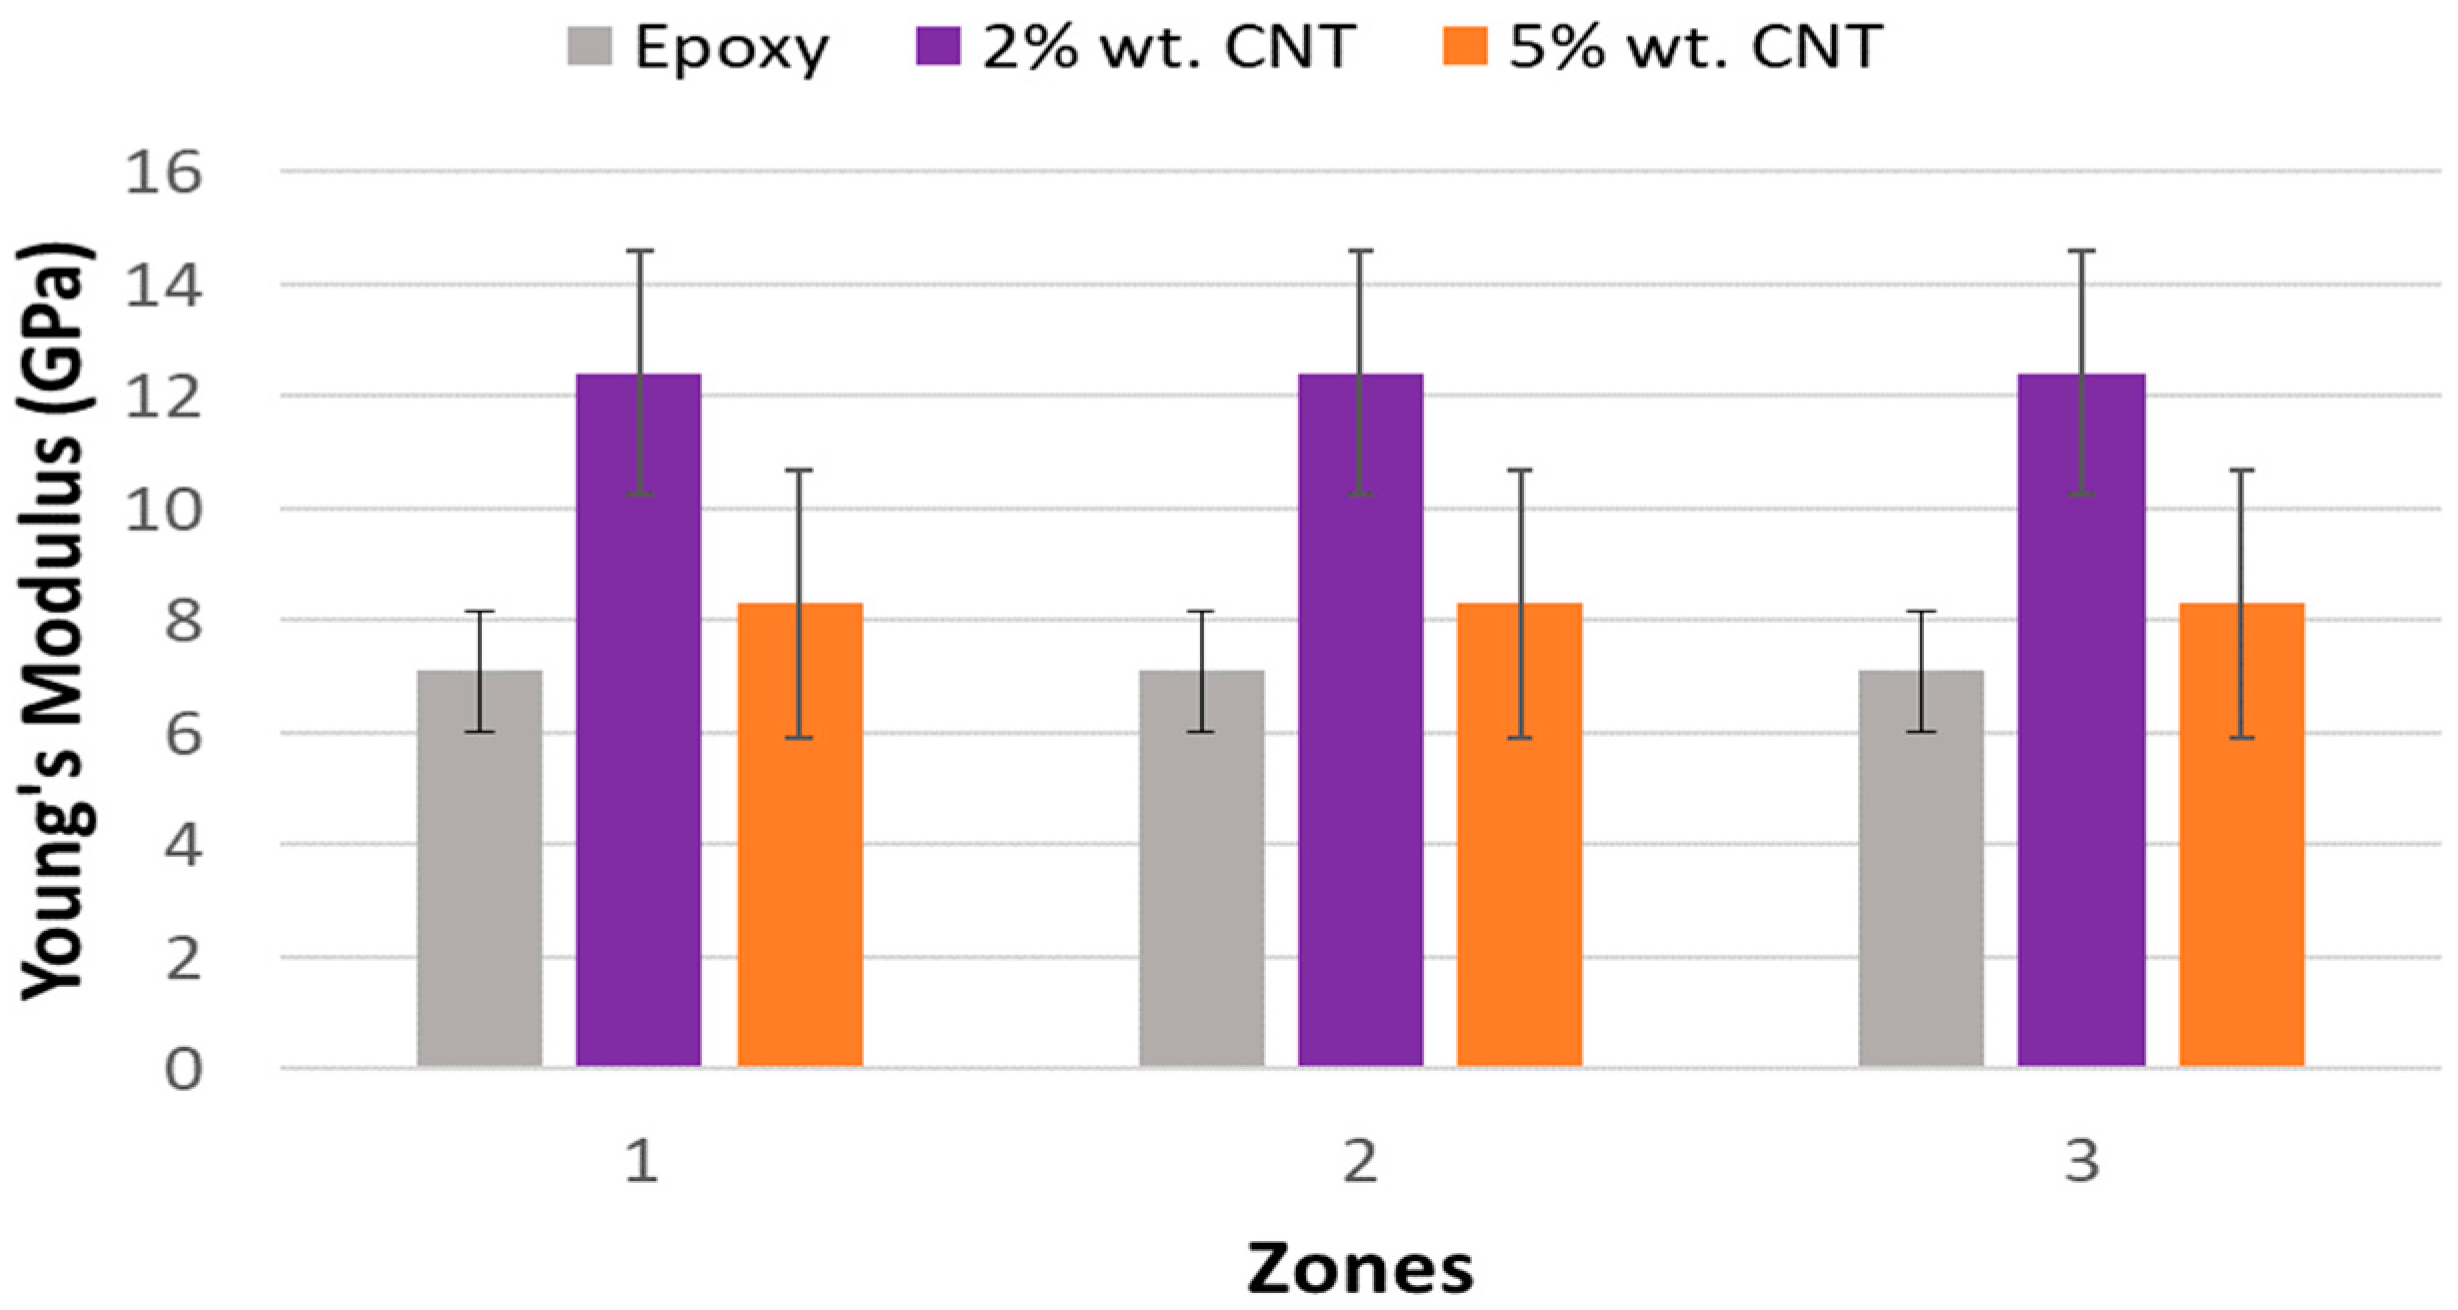
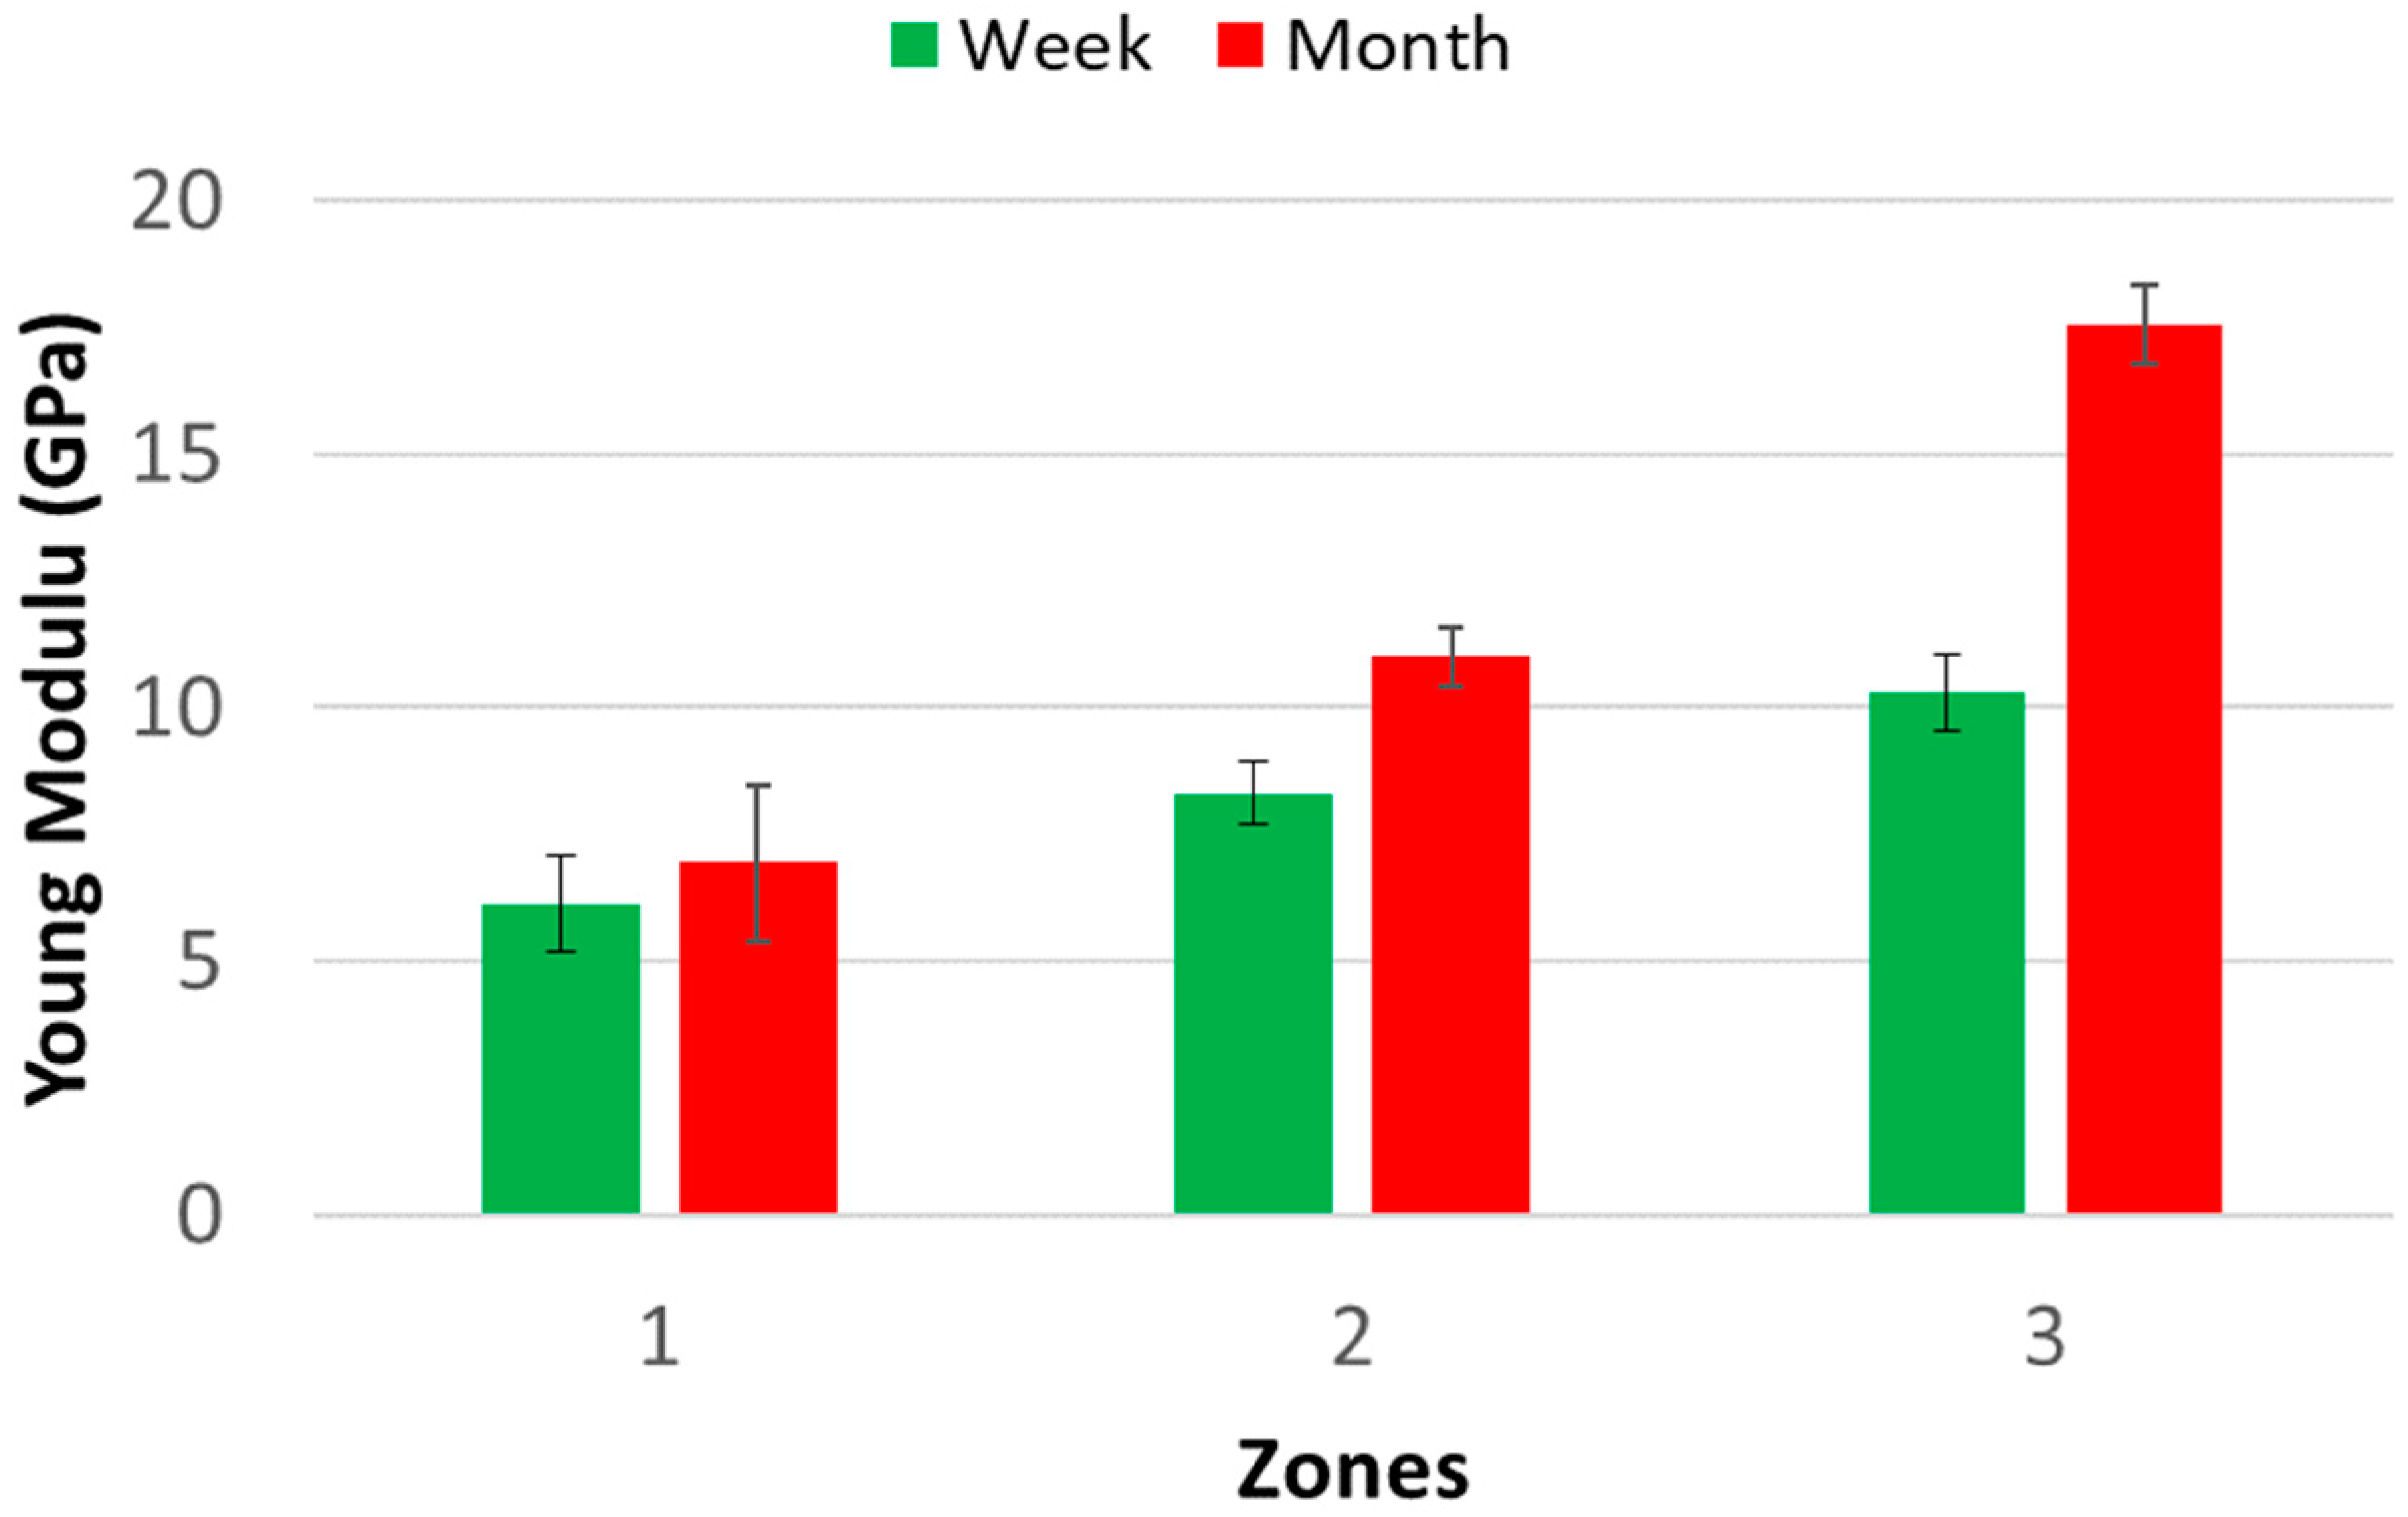
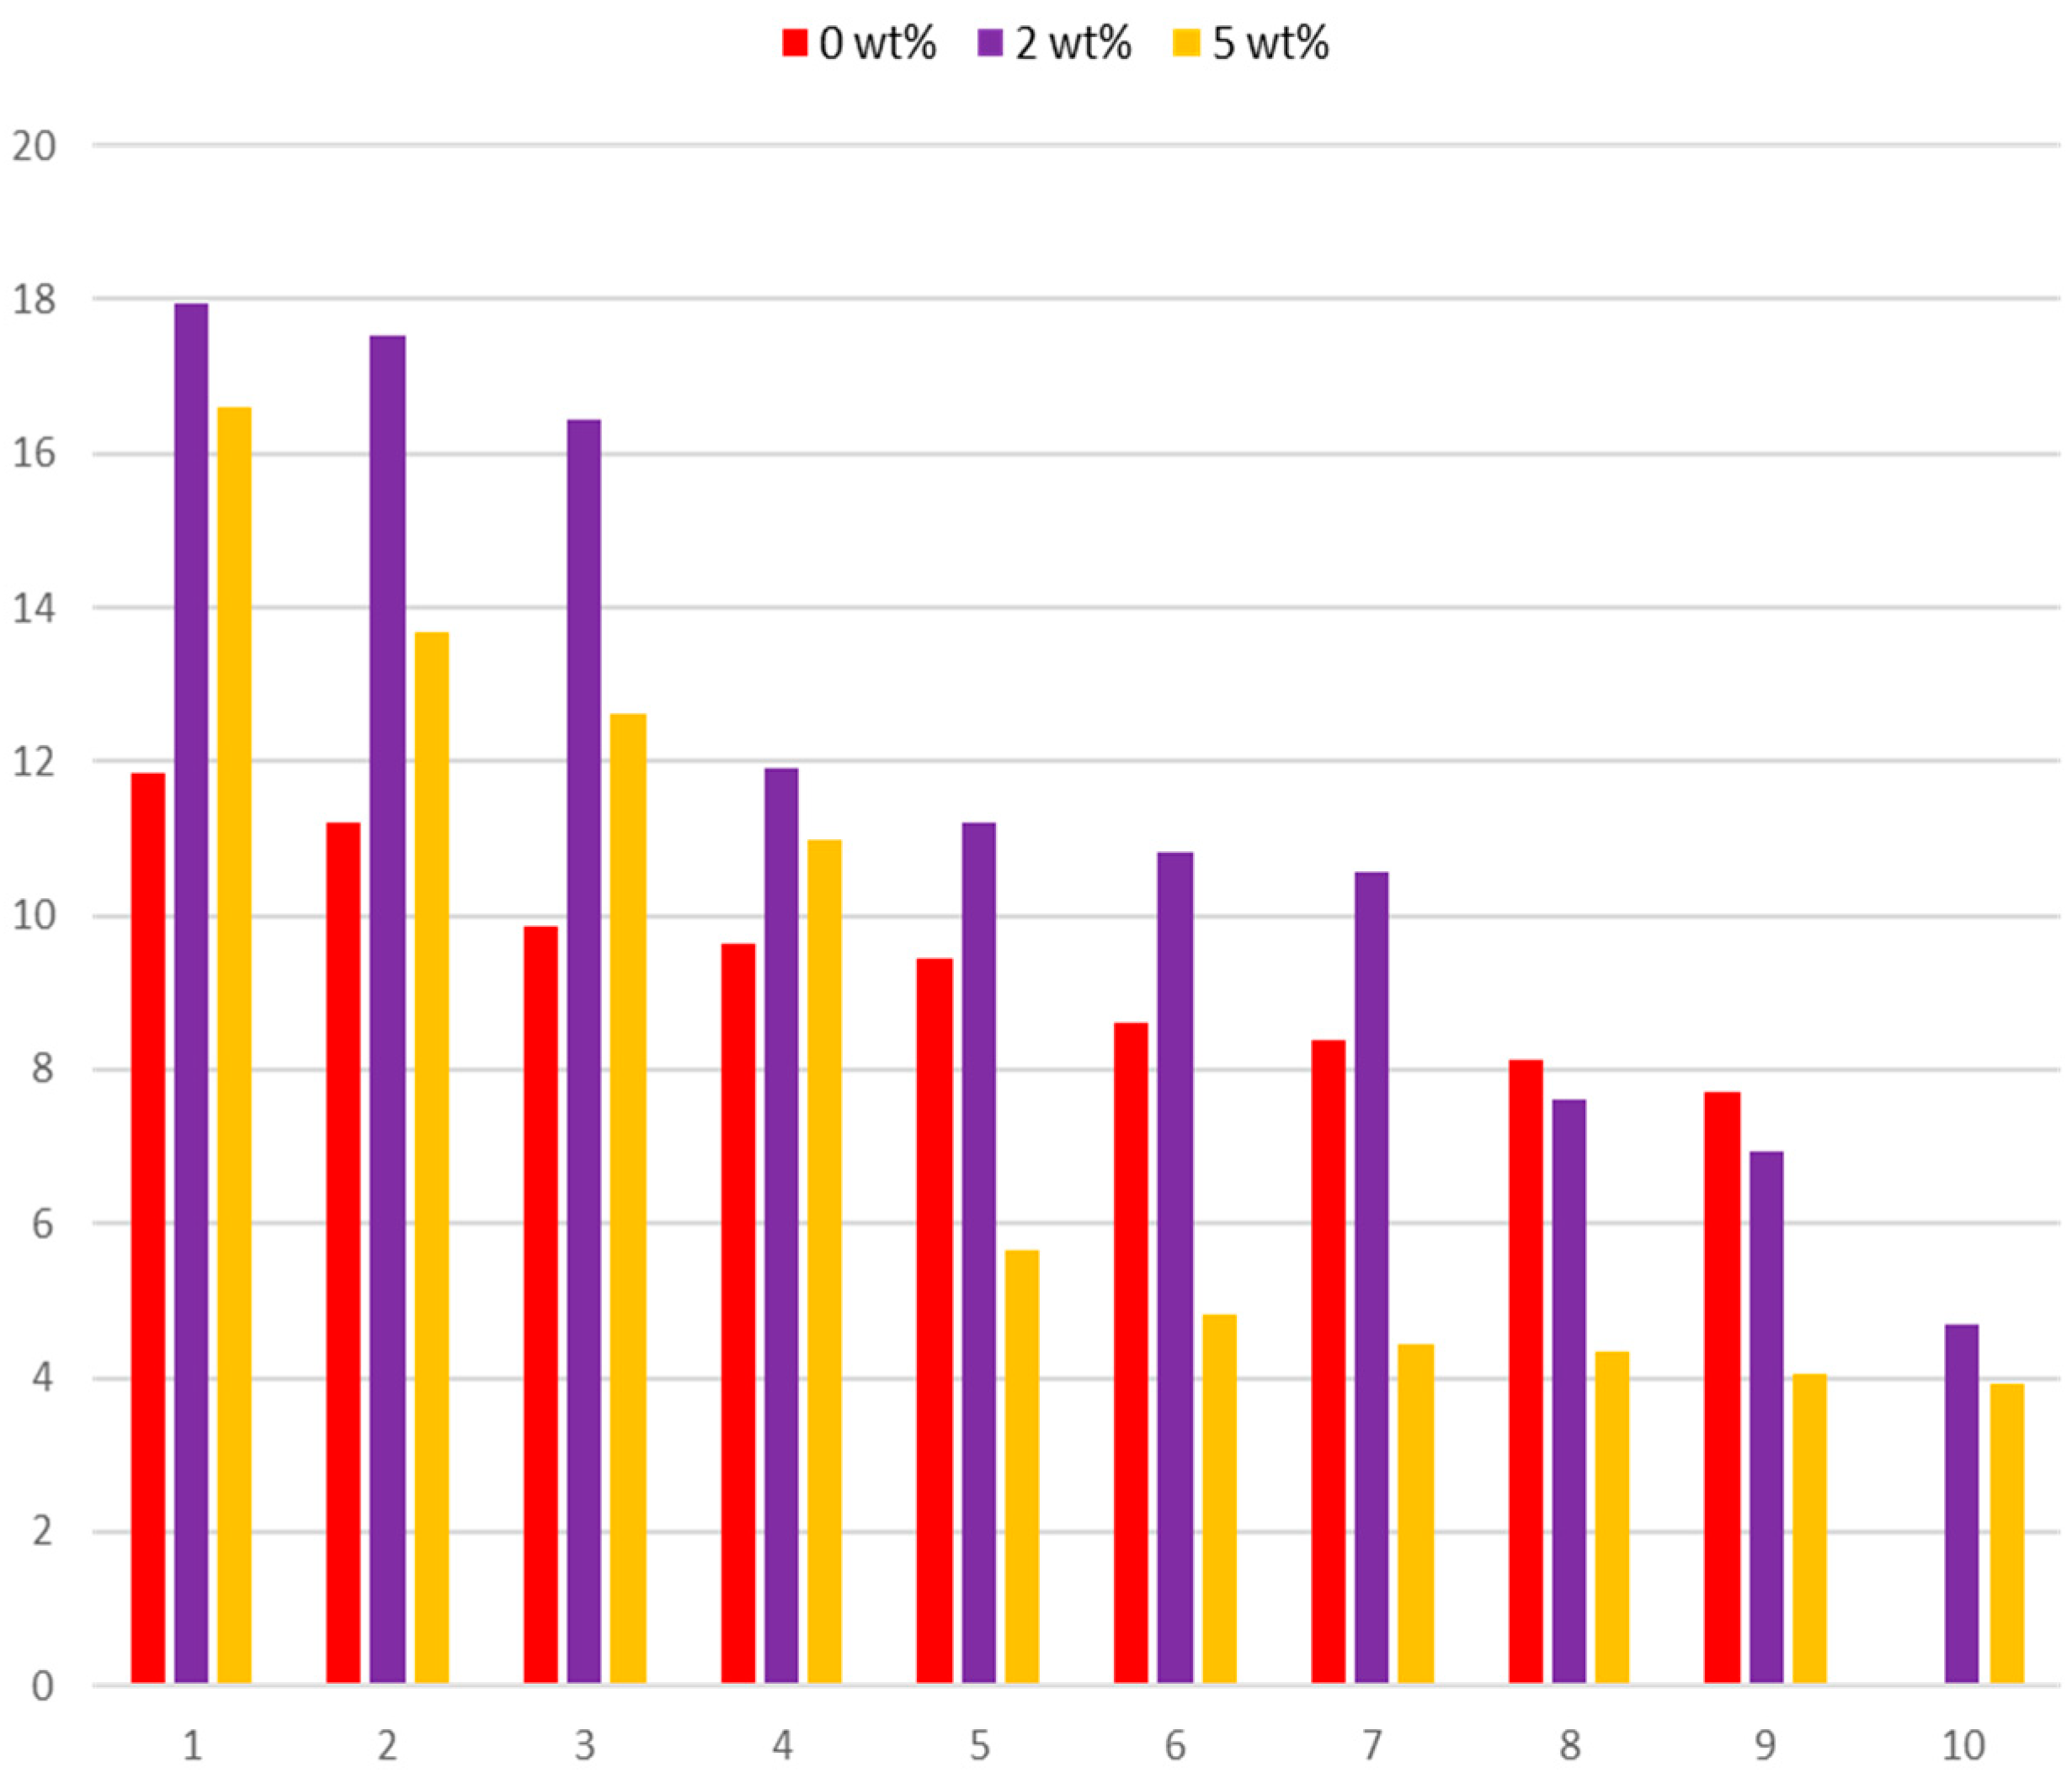
As shown in the
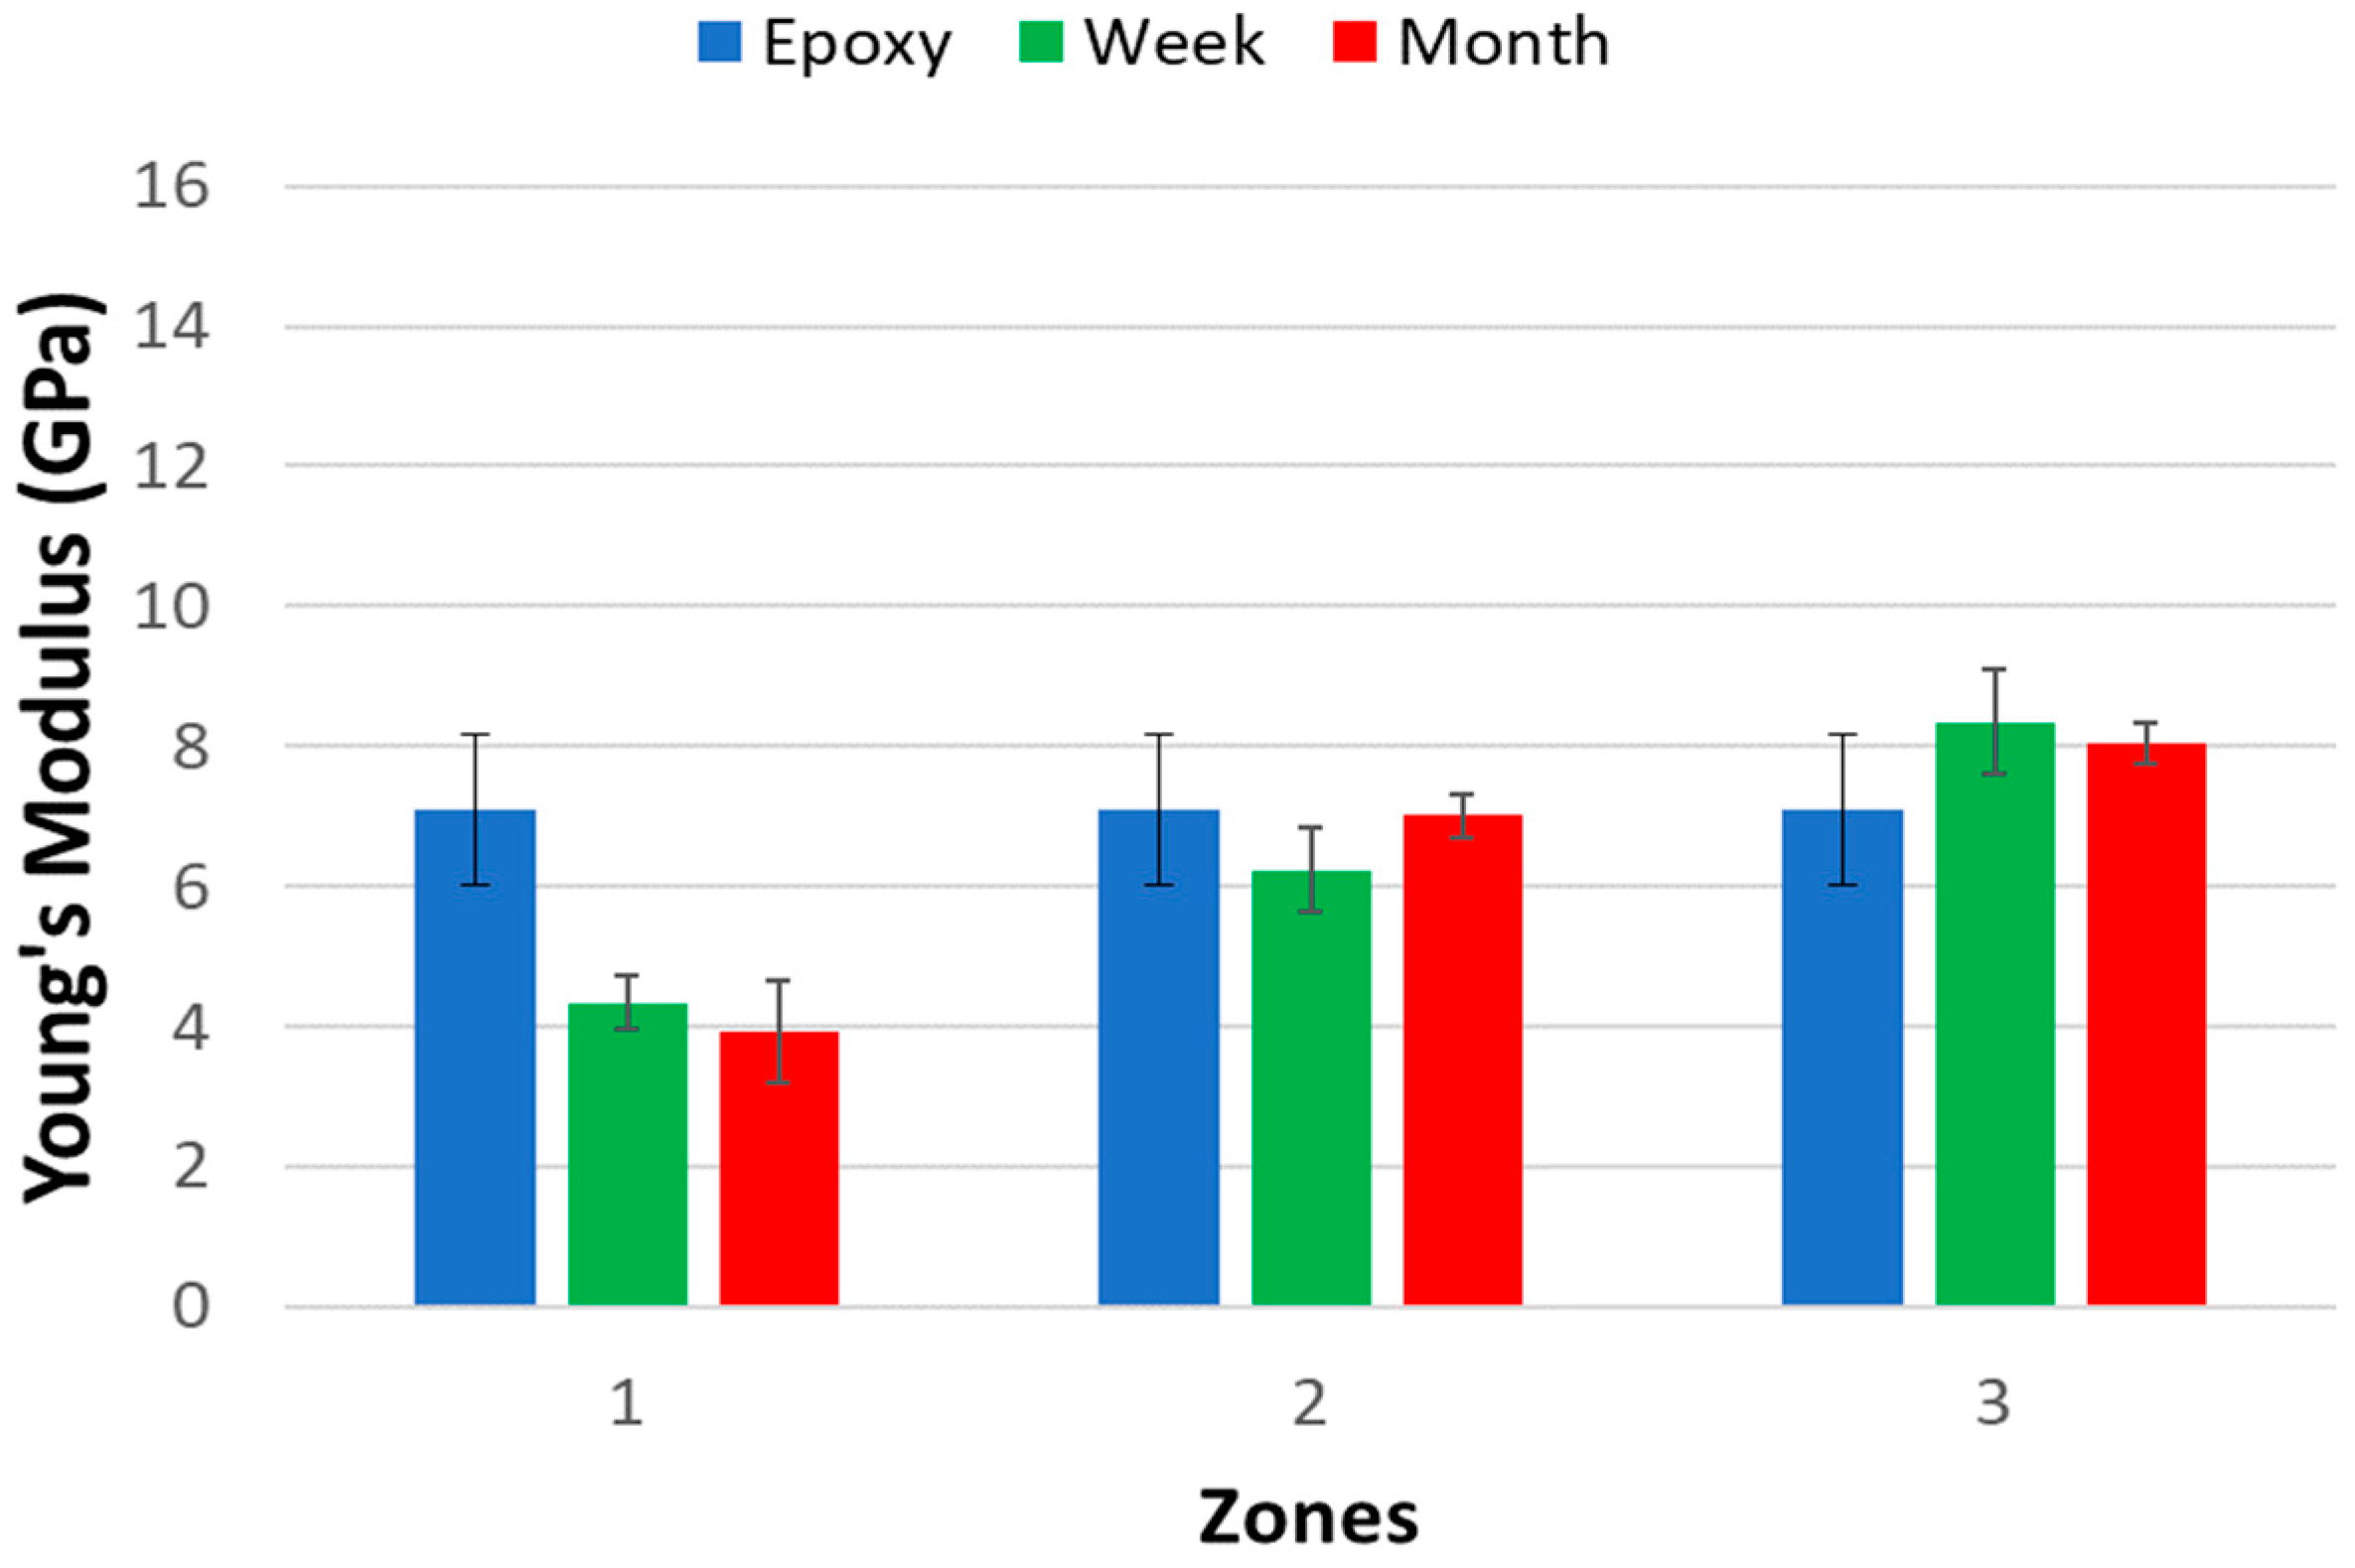
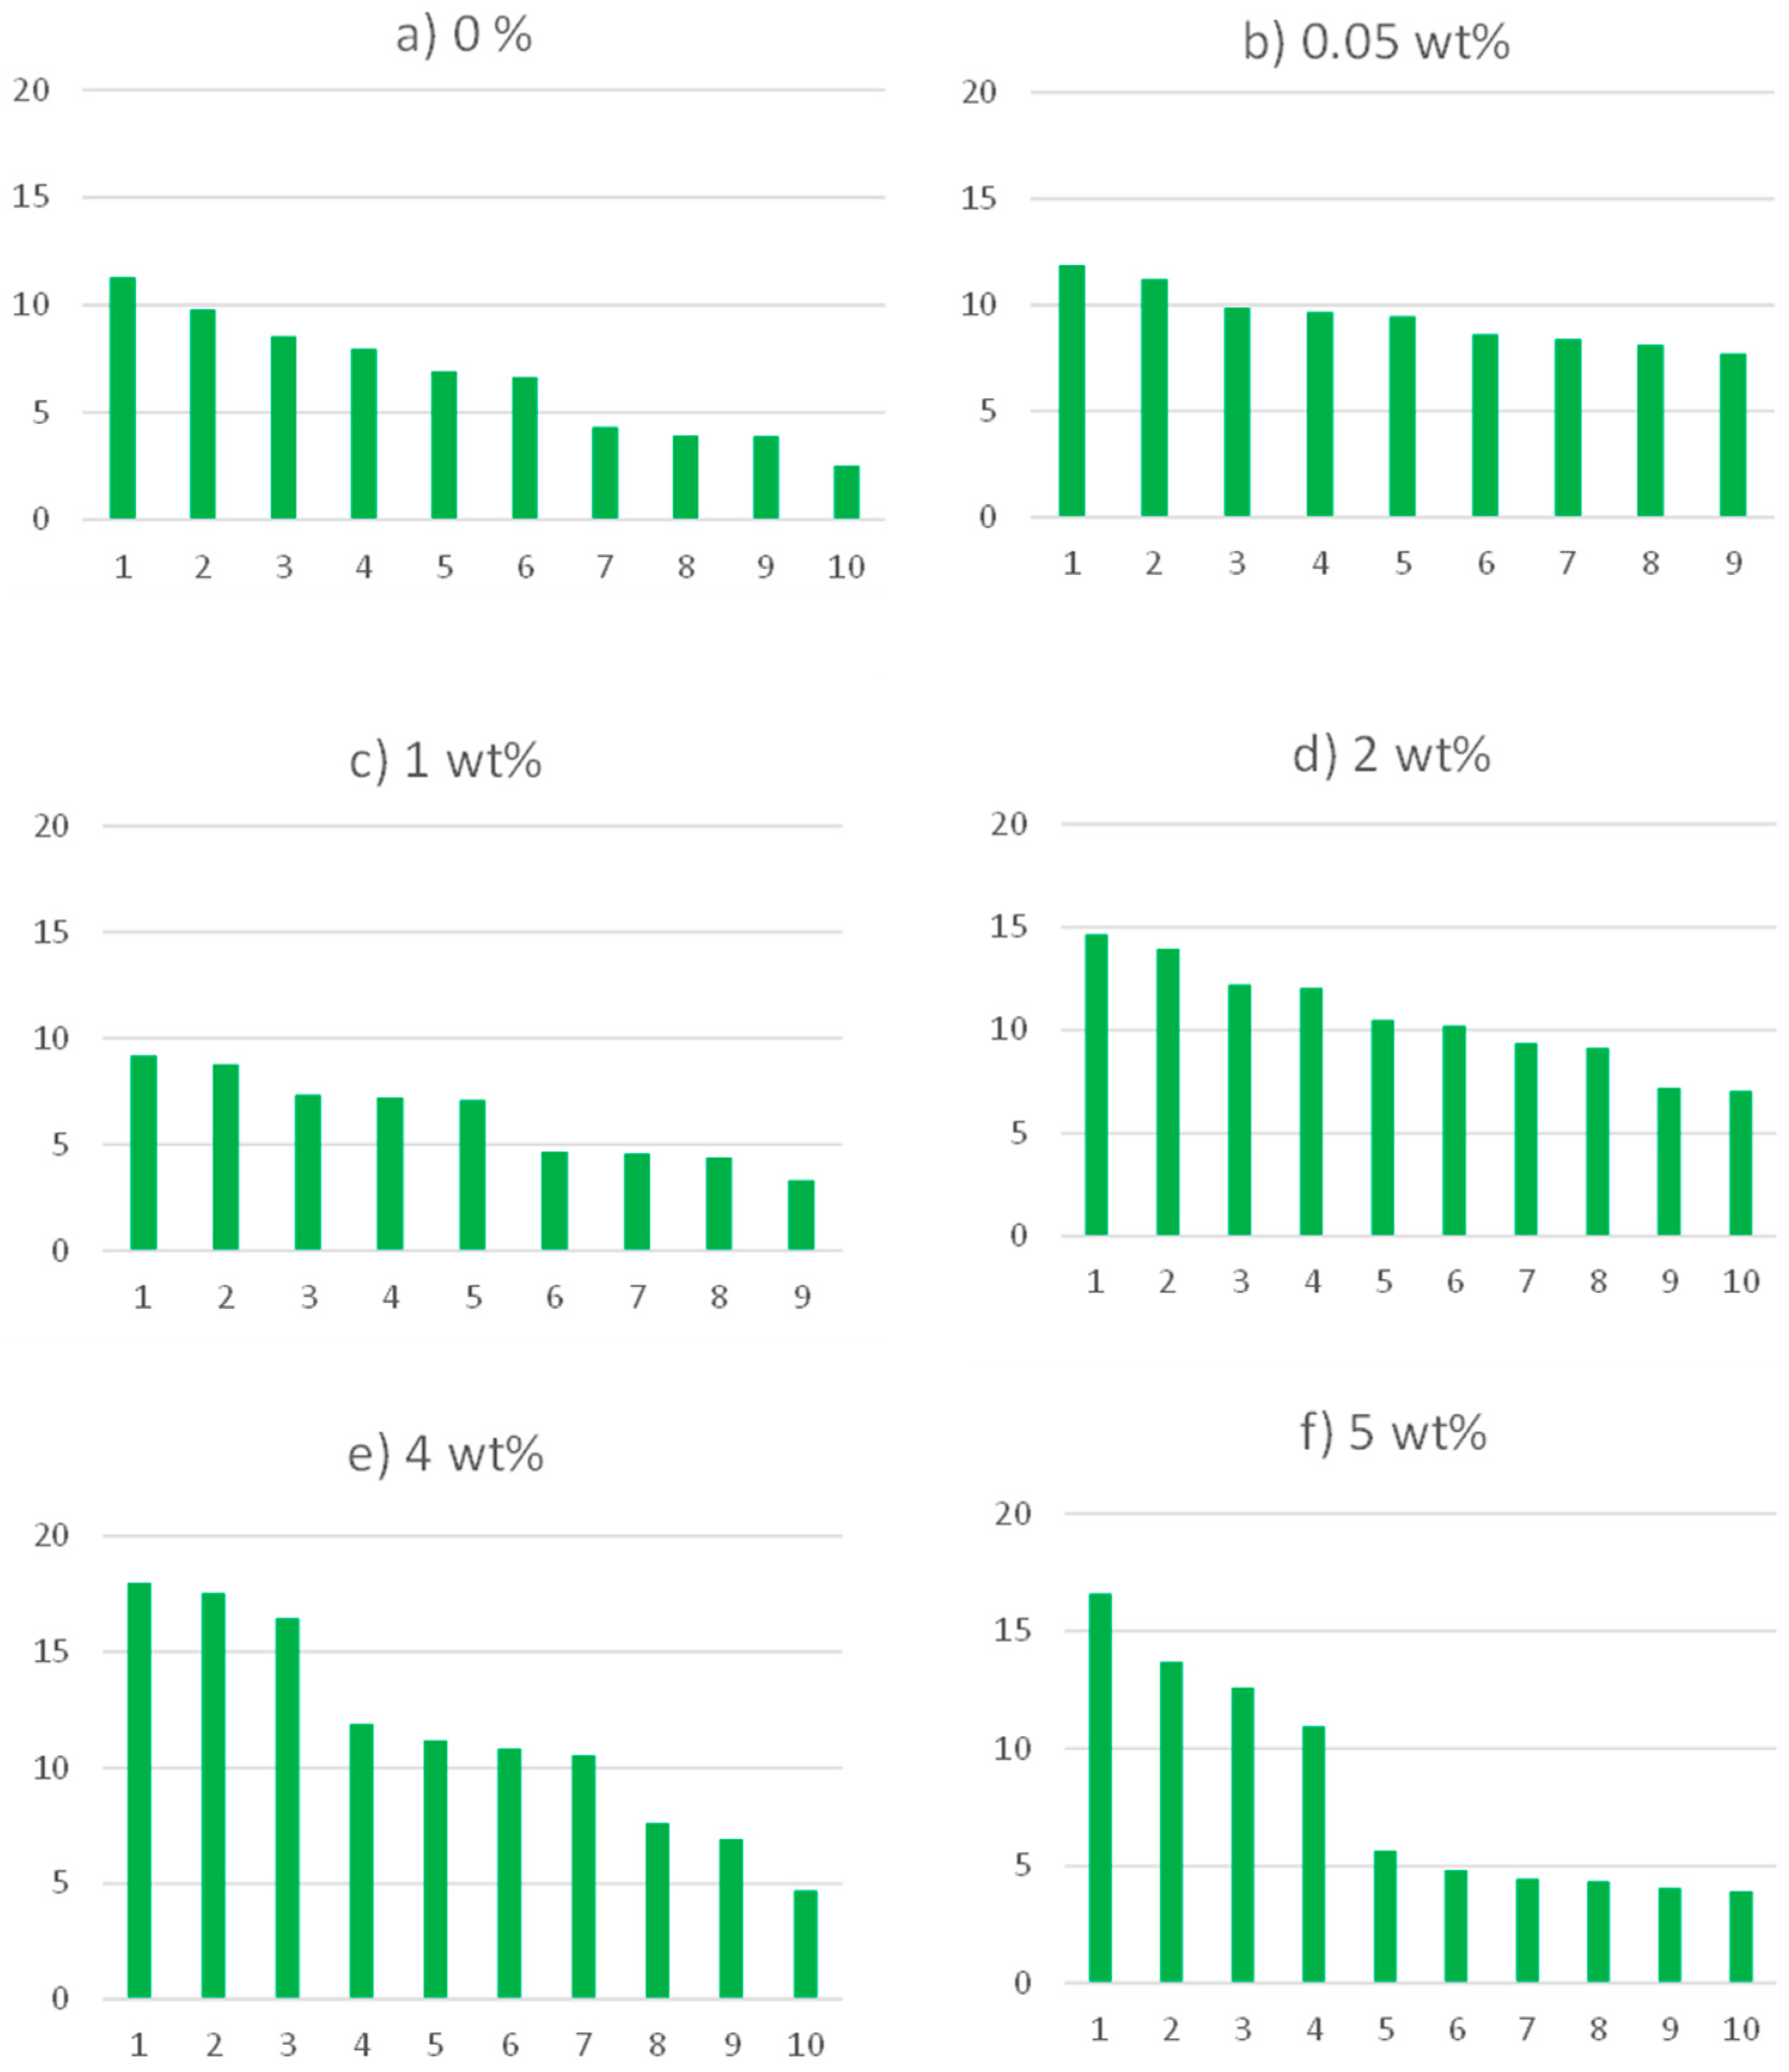
Figure 2 that before acid exposure, the stiffness value is the same regardless the zone location. However, upon acid exposure the mechanical property value of the sample has changed with time. There is a noticeable gradient in properties (
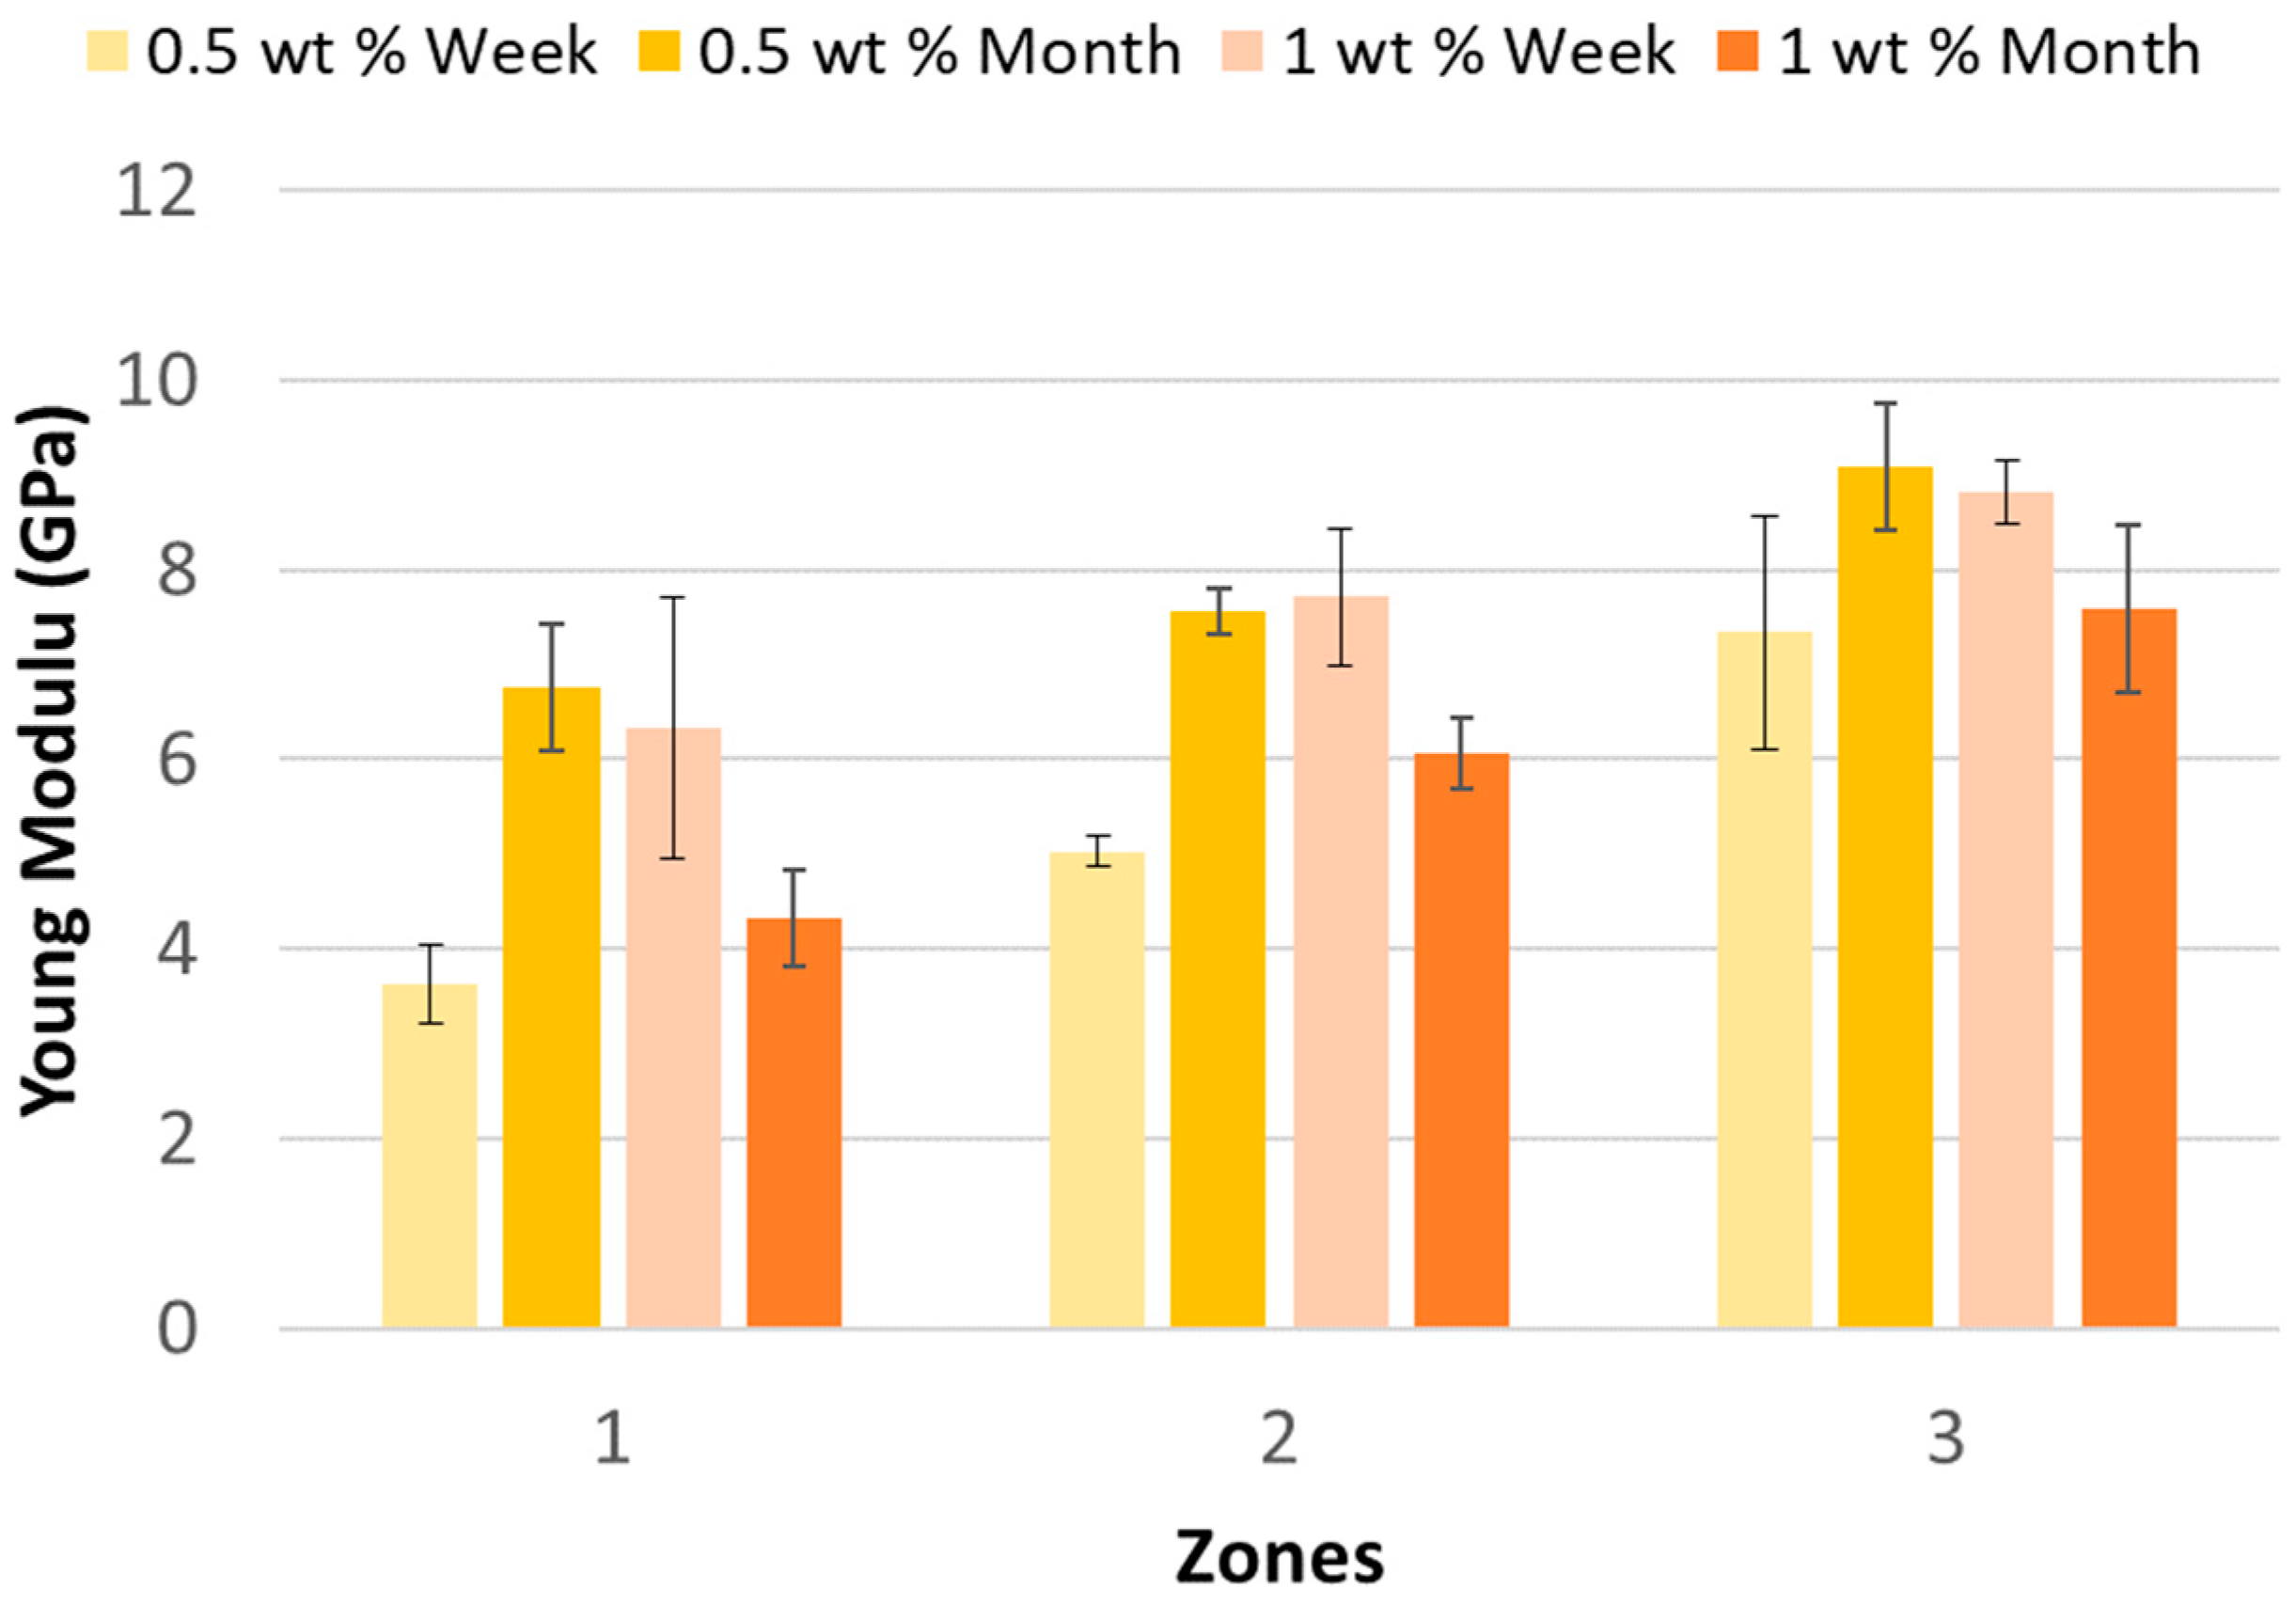
Figure 3). And this is true as the time progresses from one week to one month. As the percentage of CNT is added to the pristine polymer, the same trend was displayed (
Figure 4 and
Figure 5).
Figure 2.
Elastic Modulus of Pristine Epoxy, 2 % wt, and 5 wt % (CNT) before acid attack.
Figure 2.
Elastic Modulus of Pristine Epoxy, 2 % wt, and 5 wt % (CNT) before acid attack.
Figure 3.
Elastic Modulus of Pristine Epoxy before and After Acid exposure.
Figure 3.
Elastic Modulus of Pristine Epoxy before and After Acid exposure.
Figure 4.
Elastic Modulus of 0.5 wt % and 1 wt % After One week and Month of Acid Diffusion.
Figure 4.
Elastic Modulus of 0.5 wt % and 1 wt % After One week and Month of Acid Diffusion.
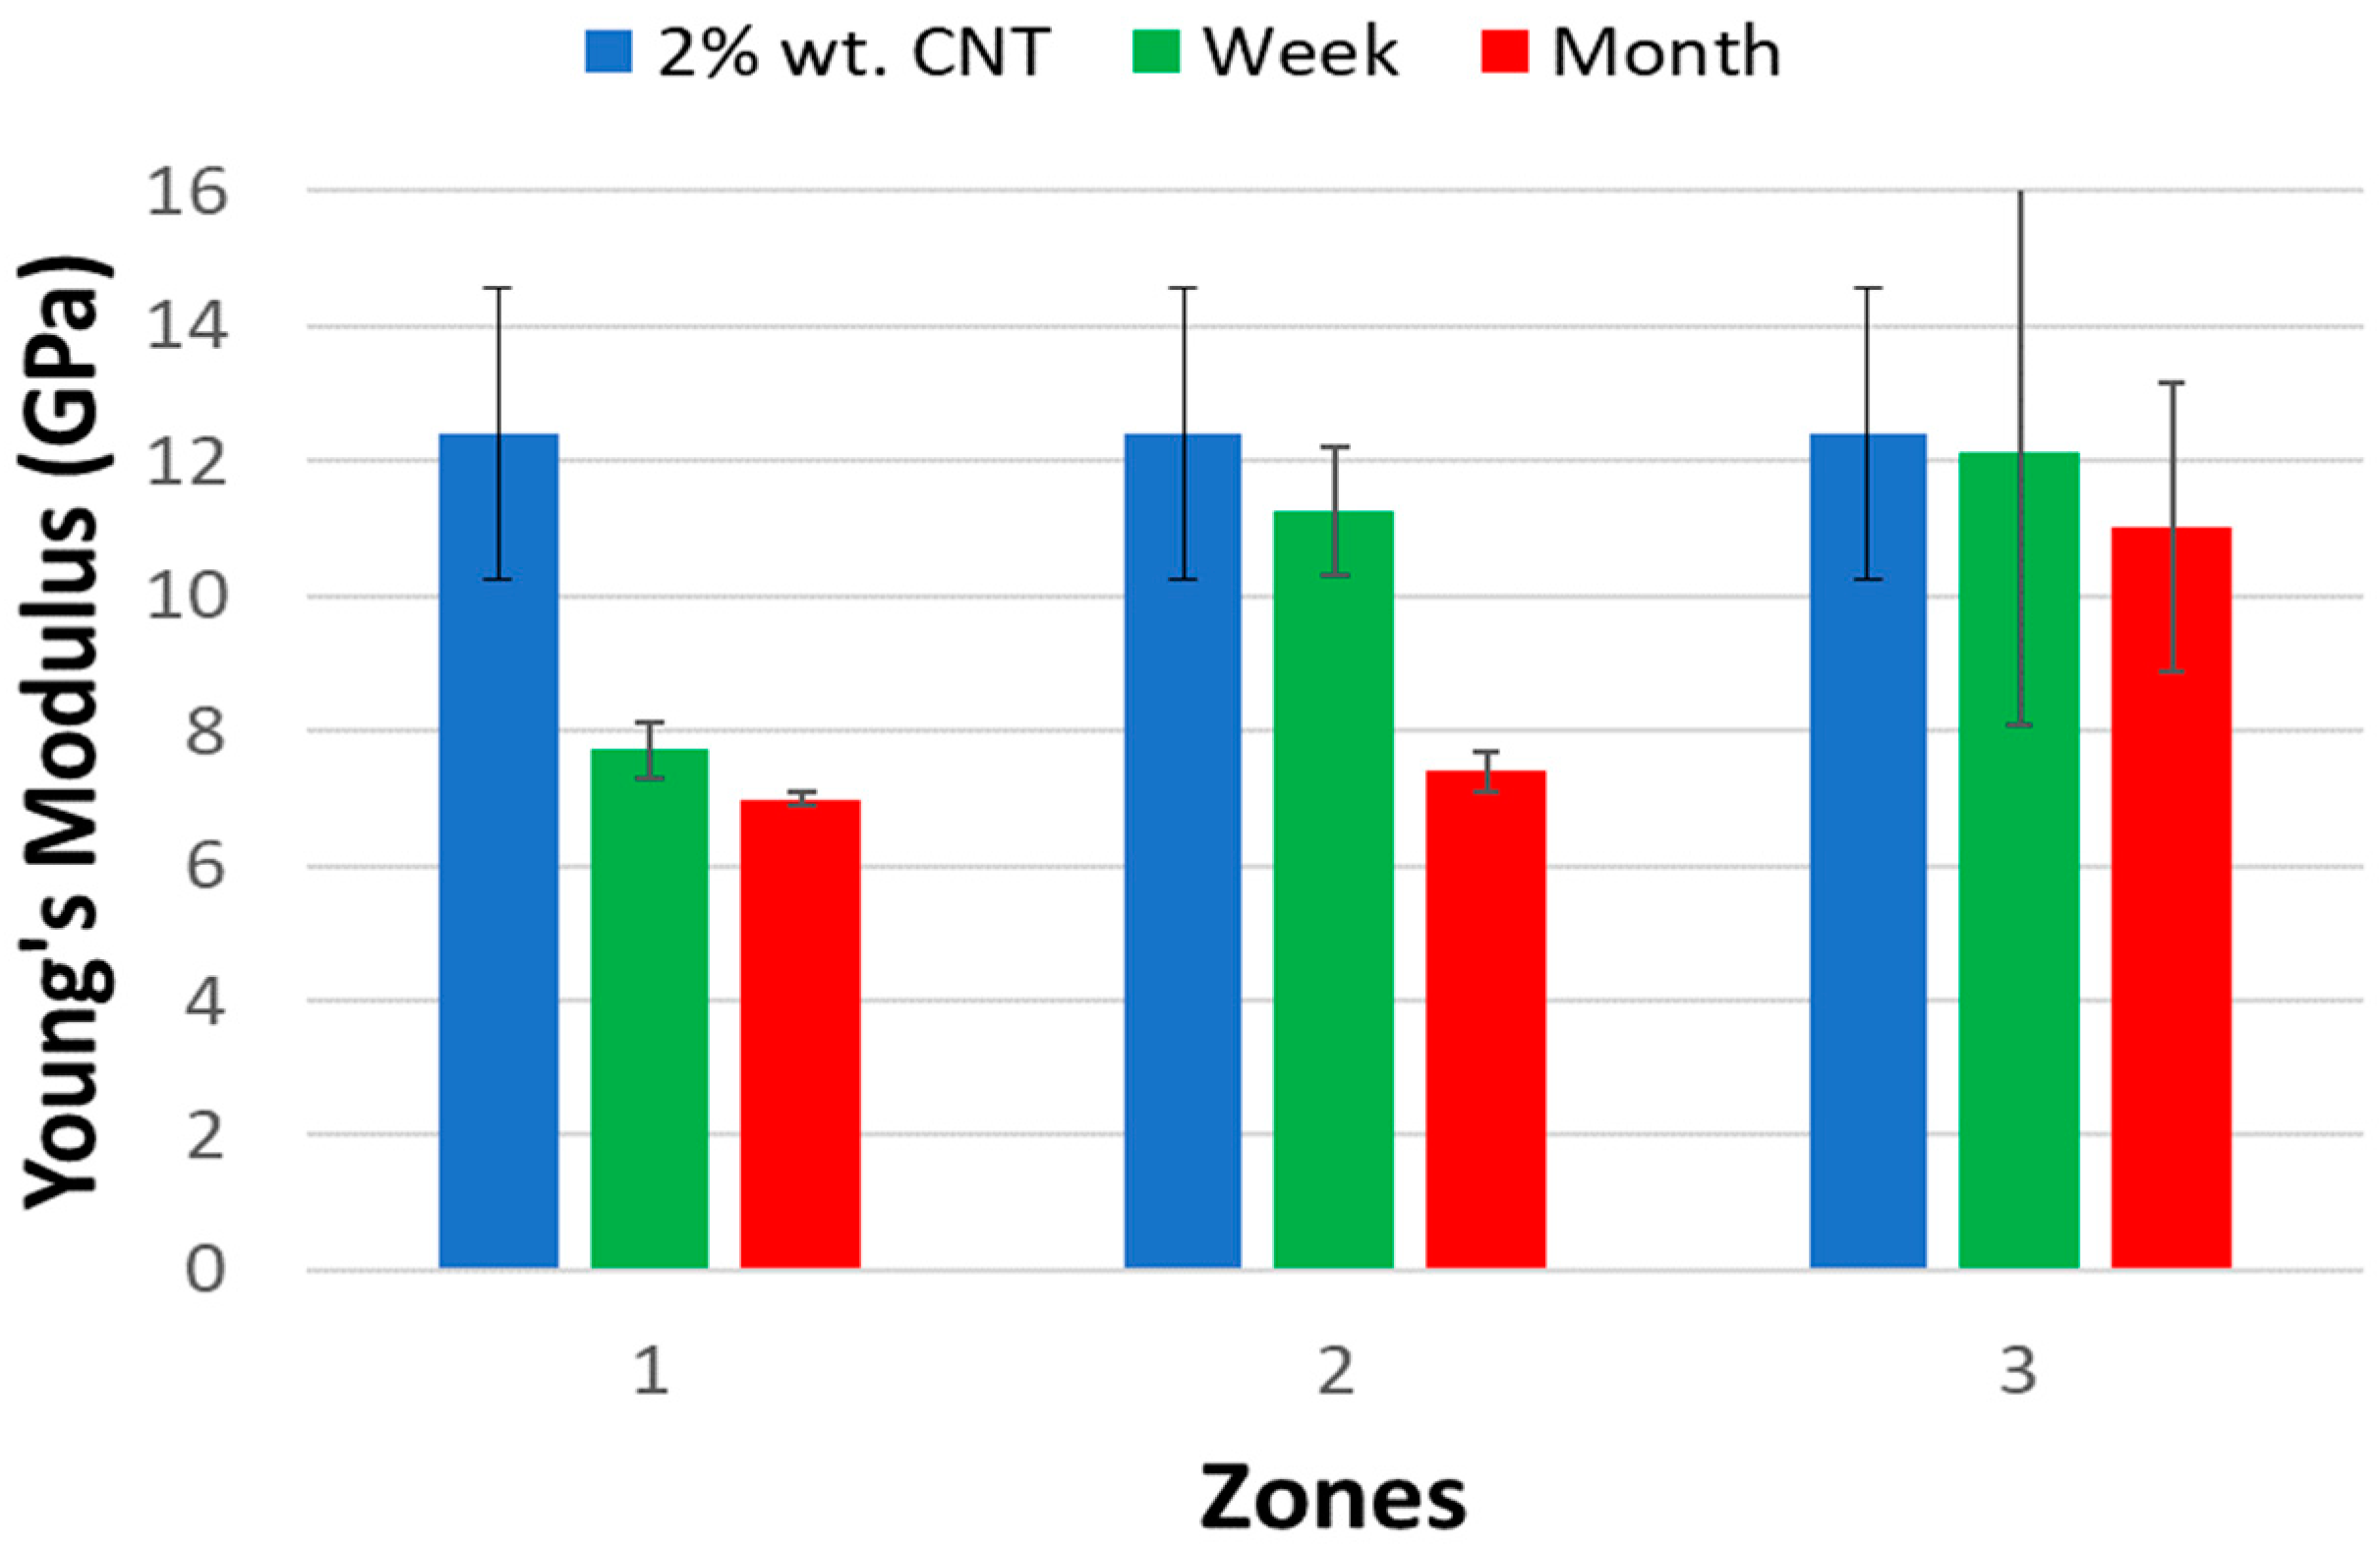
However, when we increase the amount of CNT in the host matrix and when the material was exposed to acid for one week and one month. We have observed a net reduction in the mechanical properties especially when the exposure time was very long.
Figure 5.
Elastic Modulus of 2 wt % CNT Sample before and After Acid Attack.
Figure 5.
Elastic Modulus of 2 wt % CNT Sample before and After Acid Attack.
At two percent of CNT the material tends to behave like the sample with 4%CNT (
Figure 6). Before the percolation threshold the reduction in properties, was mainly due to the presence of porosity and CNT agglomerates . As we increased the percentage of CNT the gap was reduced, CNT played a new role as reinforcement and act as a barrier which lowers and eventually stops the acid diffusion. However, before the percolation threshold, the impact of porosities was eminent and so the effect of acid attack was pertinent. After the percolation threshold the stiffness was improved drastically and the CNT plays a better role as a barrier material [
20,
22].
Figure 6.
Elastic Modulus of 4 wt % CNT Sample before and After Acid exposure.
Figure 6.
Elastic Modulus of 4 wt % CNT Sample before and After Acid exposure.
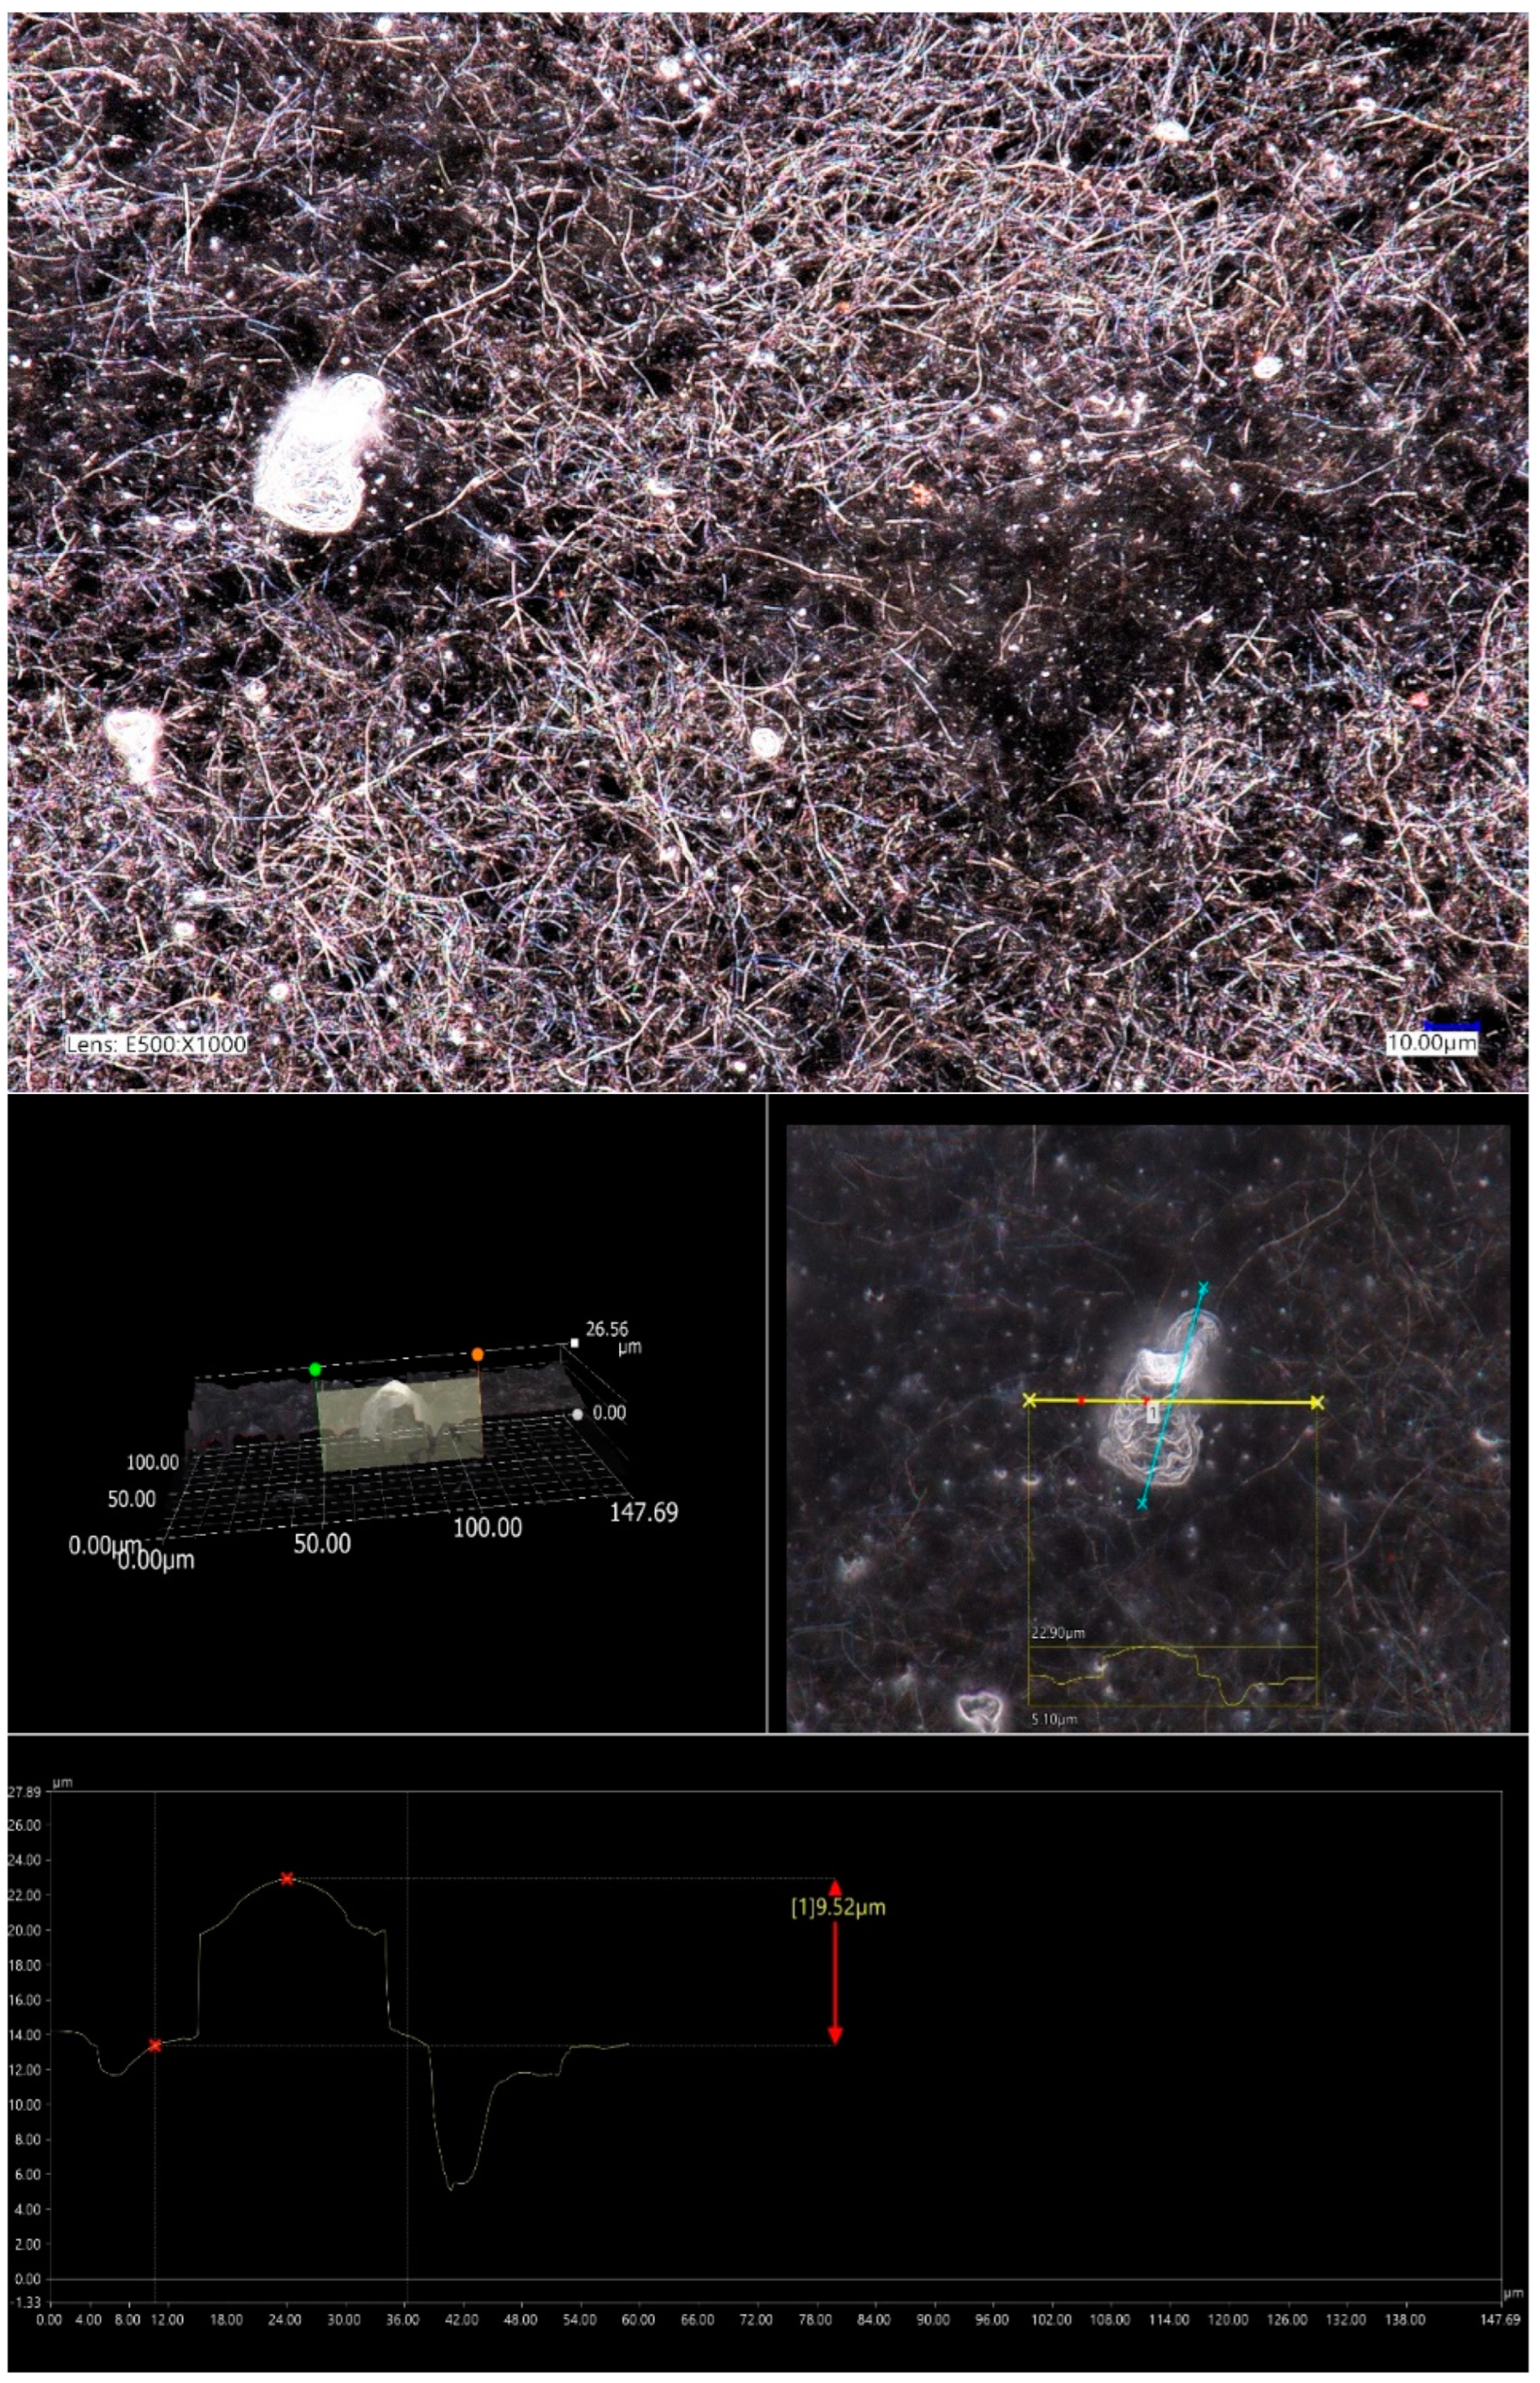
At 5 wt% of CNTs the nanofillers tend to agglomerate (
Figure 7). The formation of porosities is triggered in the vicinities of the agglomerates. There is formation of residues as a result of chemical reaction between the acid and polymer (single arrows in
Figure 7a). Which have different shape and dimensions (
Figure 7b).
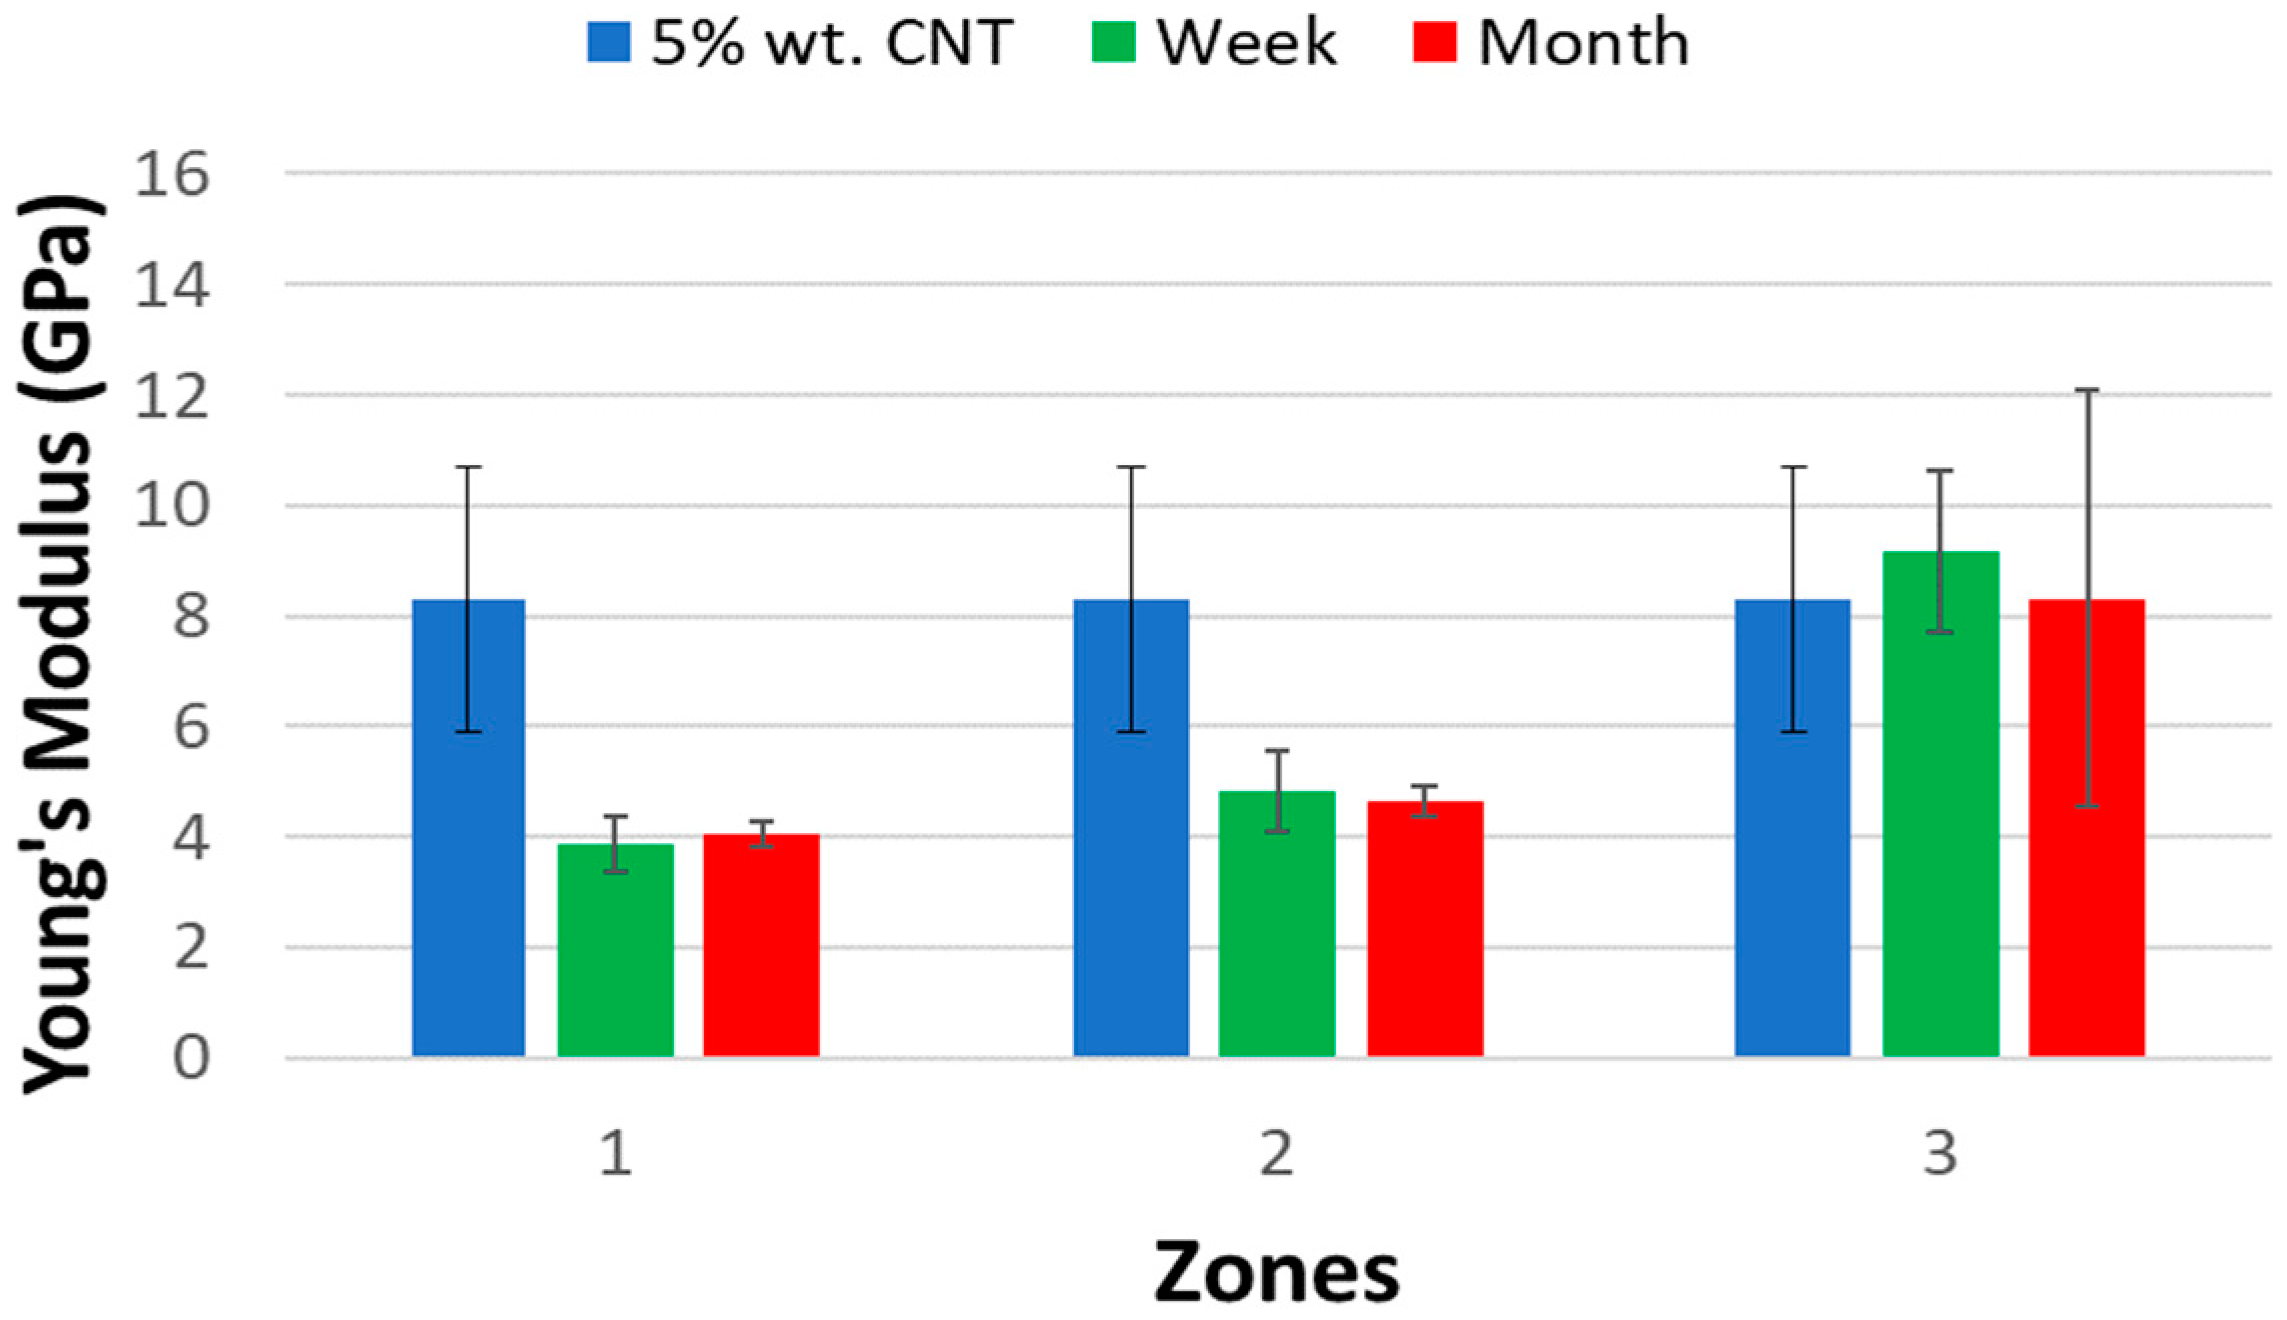
As previously stated the CNTs behave as a barrier, however, these agglomerates along with its surroundings porous could also accelerate the diffusion of acid. These is confirmed in
Figure 8, as it can be observed the behavior of the samples at one week and one month at zones 1 and zone 2 show similar reduction of values on the Elastic Modulus. At Zone three the values seems to not be affected mainly because of the CNTs barriers.
Figure 7.
a) 3D Optical 5 wt % CNT Sample After Month of Acid Attack, b) Porous Characterization.
Figure 7.
a) 3D Optical 5 wt % CNT Sample After Month of Acid Attack, b) Porous Characterization.
Figure 8.
Elastic Modulus of 5 wt % CNT Sample before and After Acid Attack.
Figure 8.
Elastic Modulus of 5 wt % CNT Sample before and After Acid Attack.
There is a gradient in mechanical properties from the core to the skin. A core skin effect was shown (
Figure 9). This is noticeable independently of CNTs percentage. As we approach to the surface the materials was exposed longer to the acid, mechanical the properties were lowered. However, the drop in properties was proportional to the percentage of CNT in the host polymer.
Figure 10 shows, clearly acid diffusion as the time progresses from one week to one month.
As shown in the mechanical data that was performed using DMA (
Figure 10), the bulk mechanical properties were higher before percolation threshold. However, after percolation threshold, the mechanical properties were drastically decreased as the agglomerations were more significant.
Figure 9.
Nanoindentation Zones Data After One Month of Acid Exposure.
Figure 9.
Nanoindentation Zones Data After One Month of Acid Exposure.
Figure 10.
DMA Data Comparision.
Figure 10.
DMA Data Comparision.
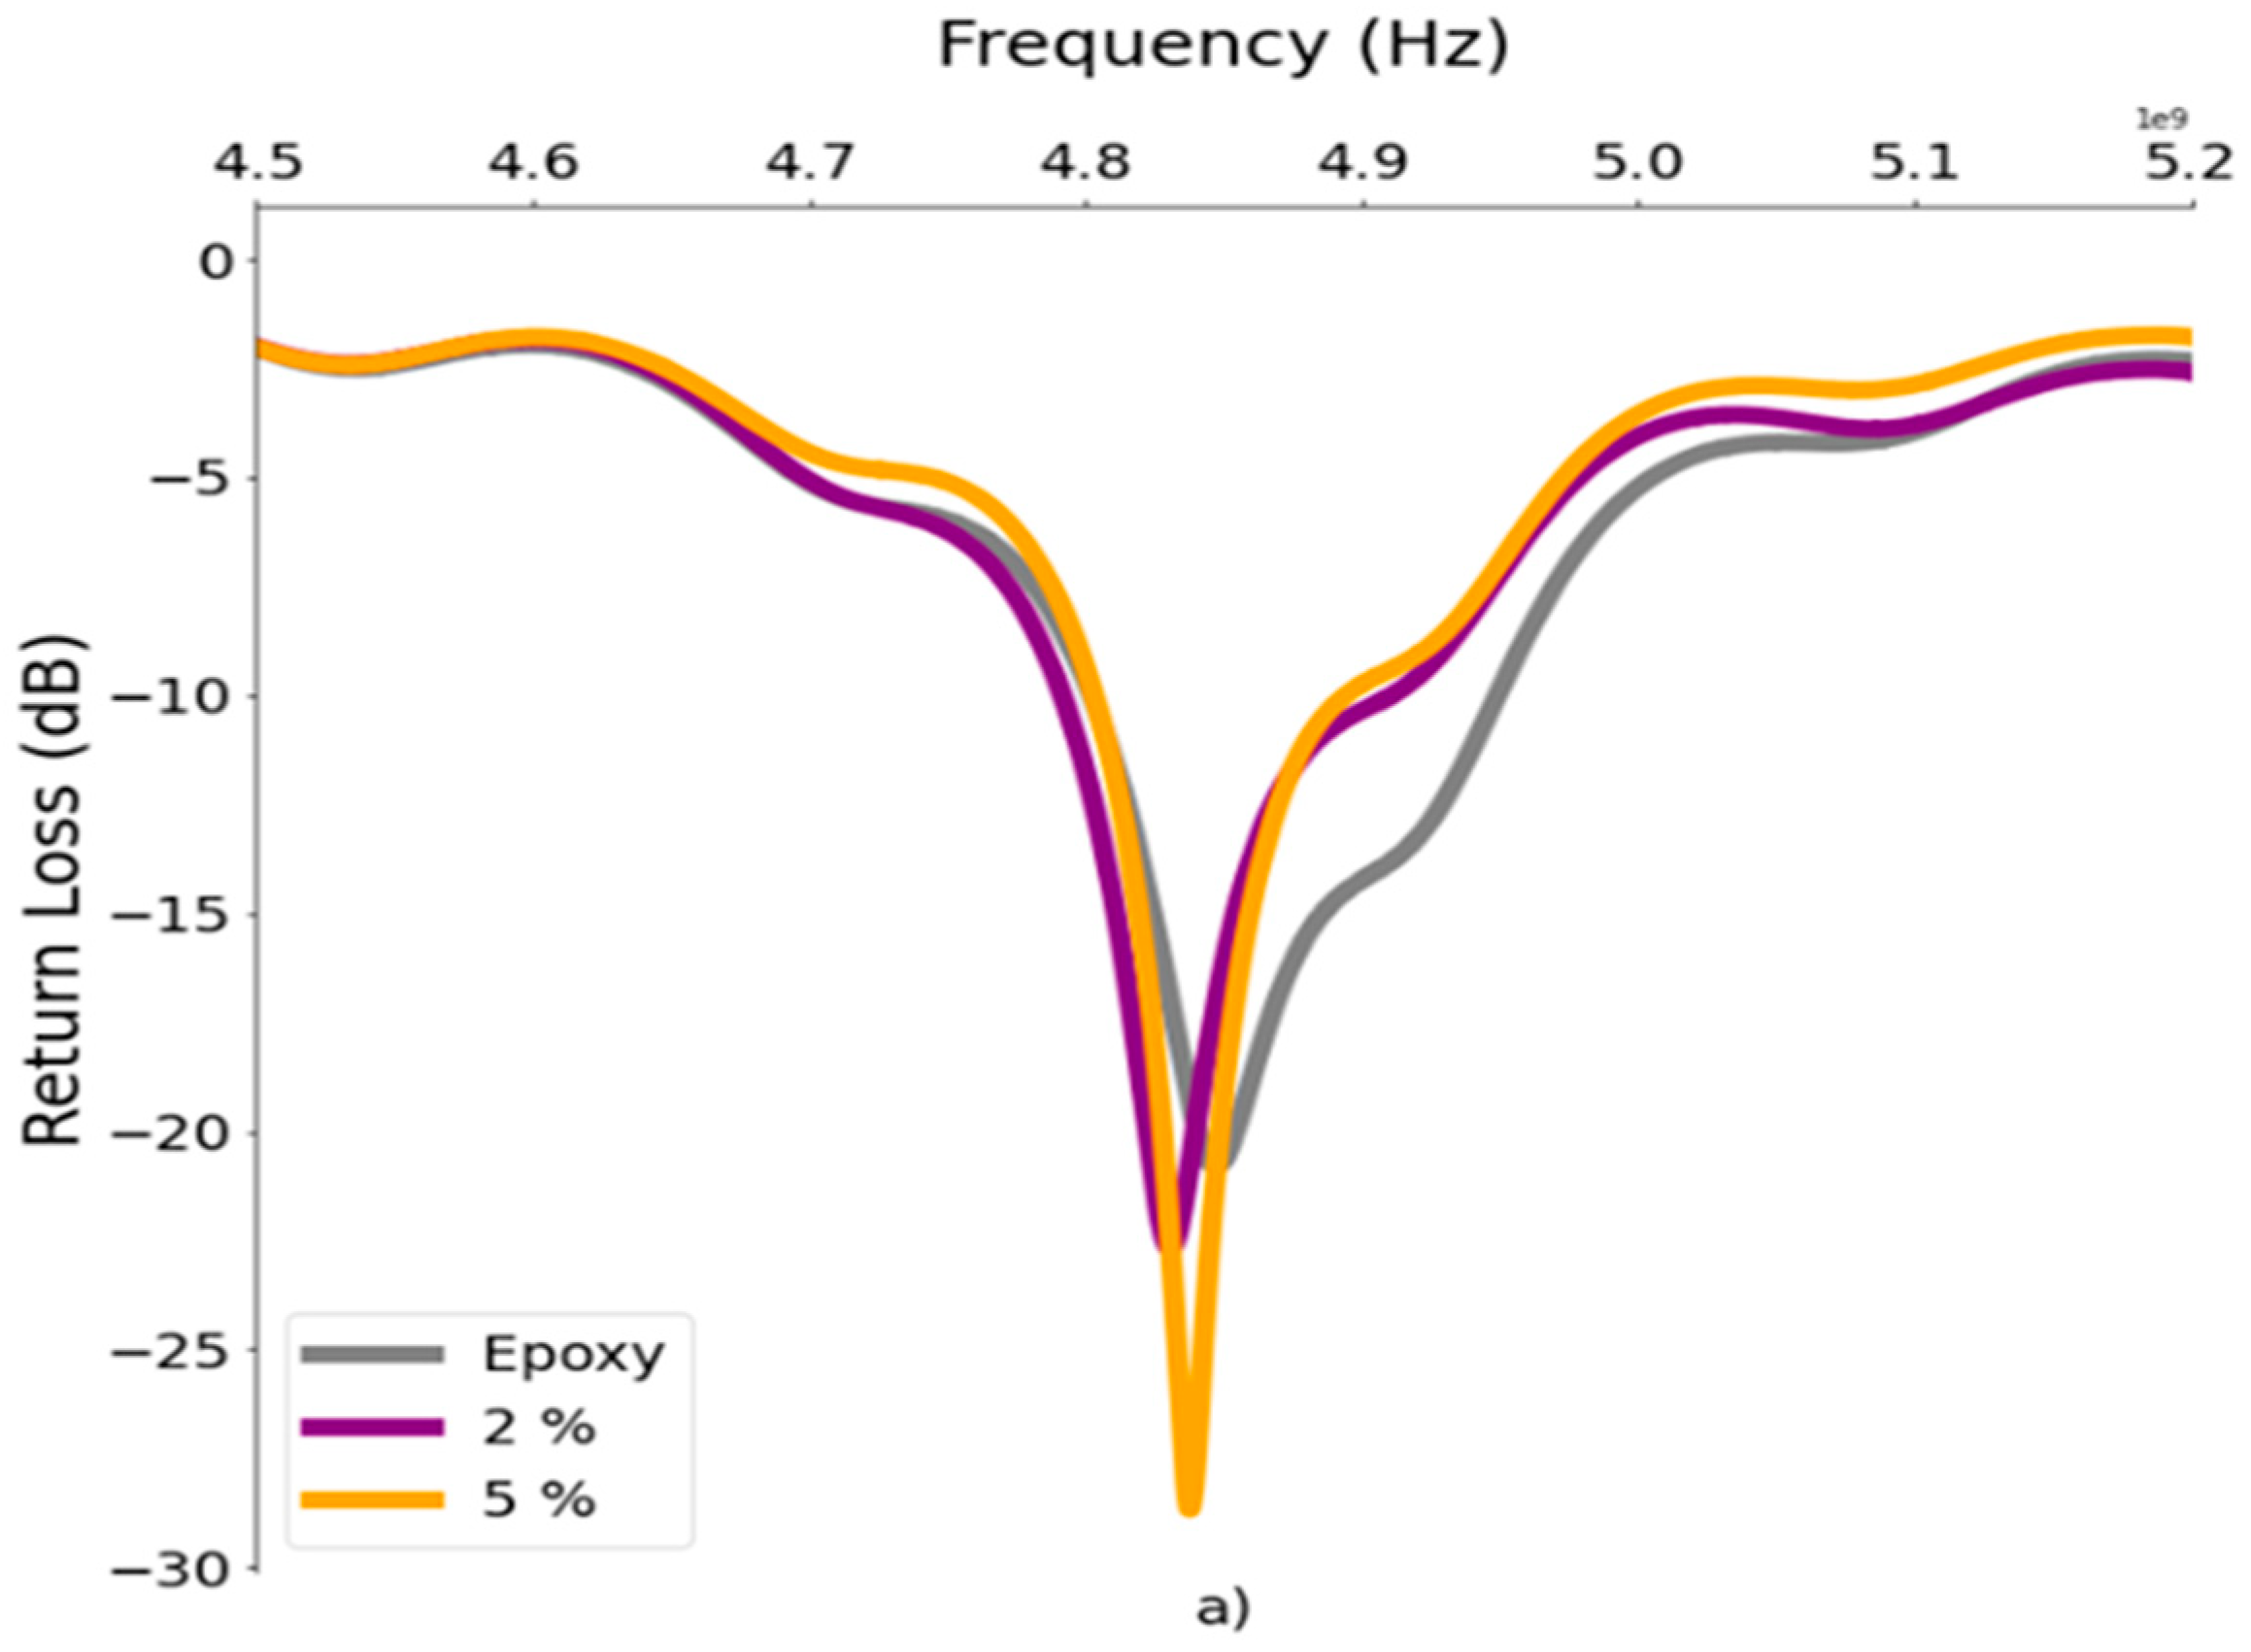
As we can see in the
Figure 11 and
Figure 12, the percentage of the CNT alters the Return Loss parameter. The trend is progressive as the CNT reaches percolation threshold [
22,
29,
31,
32]. After the exposure of acid attack, the material characteristics has changed due to the diffusion of ions. This diffusion changes the dielectric materials properties i.e. permittivity and permeability. Which the changes are reflected in the measurement through free space using a patch antenna. With the addition of CNT fillers the materials became more conductive by forming conductive network of which greatly change the dielectric properties. The change in attenuation is directly dependent to CNT concentration. Which can be spotted as the Return Loss decreases.
Figure 11.
VNA Results Before Acid Attack.
Figure 11.
VNA Results Before Acid Attack.
Figure 12.
VNA Results After one month of Acid Attack.
Figure 12.
VNA Results After one month of Acid Attack.
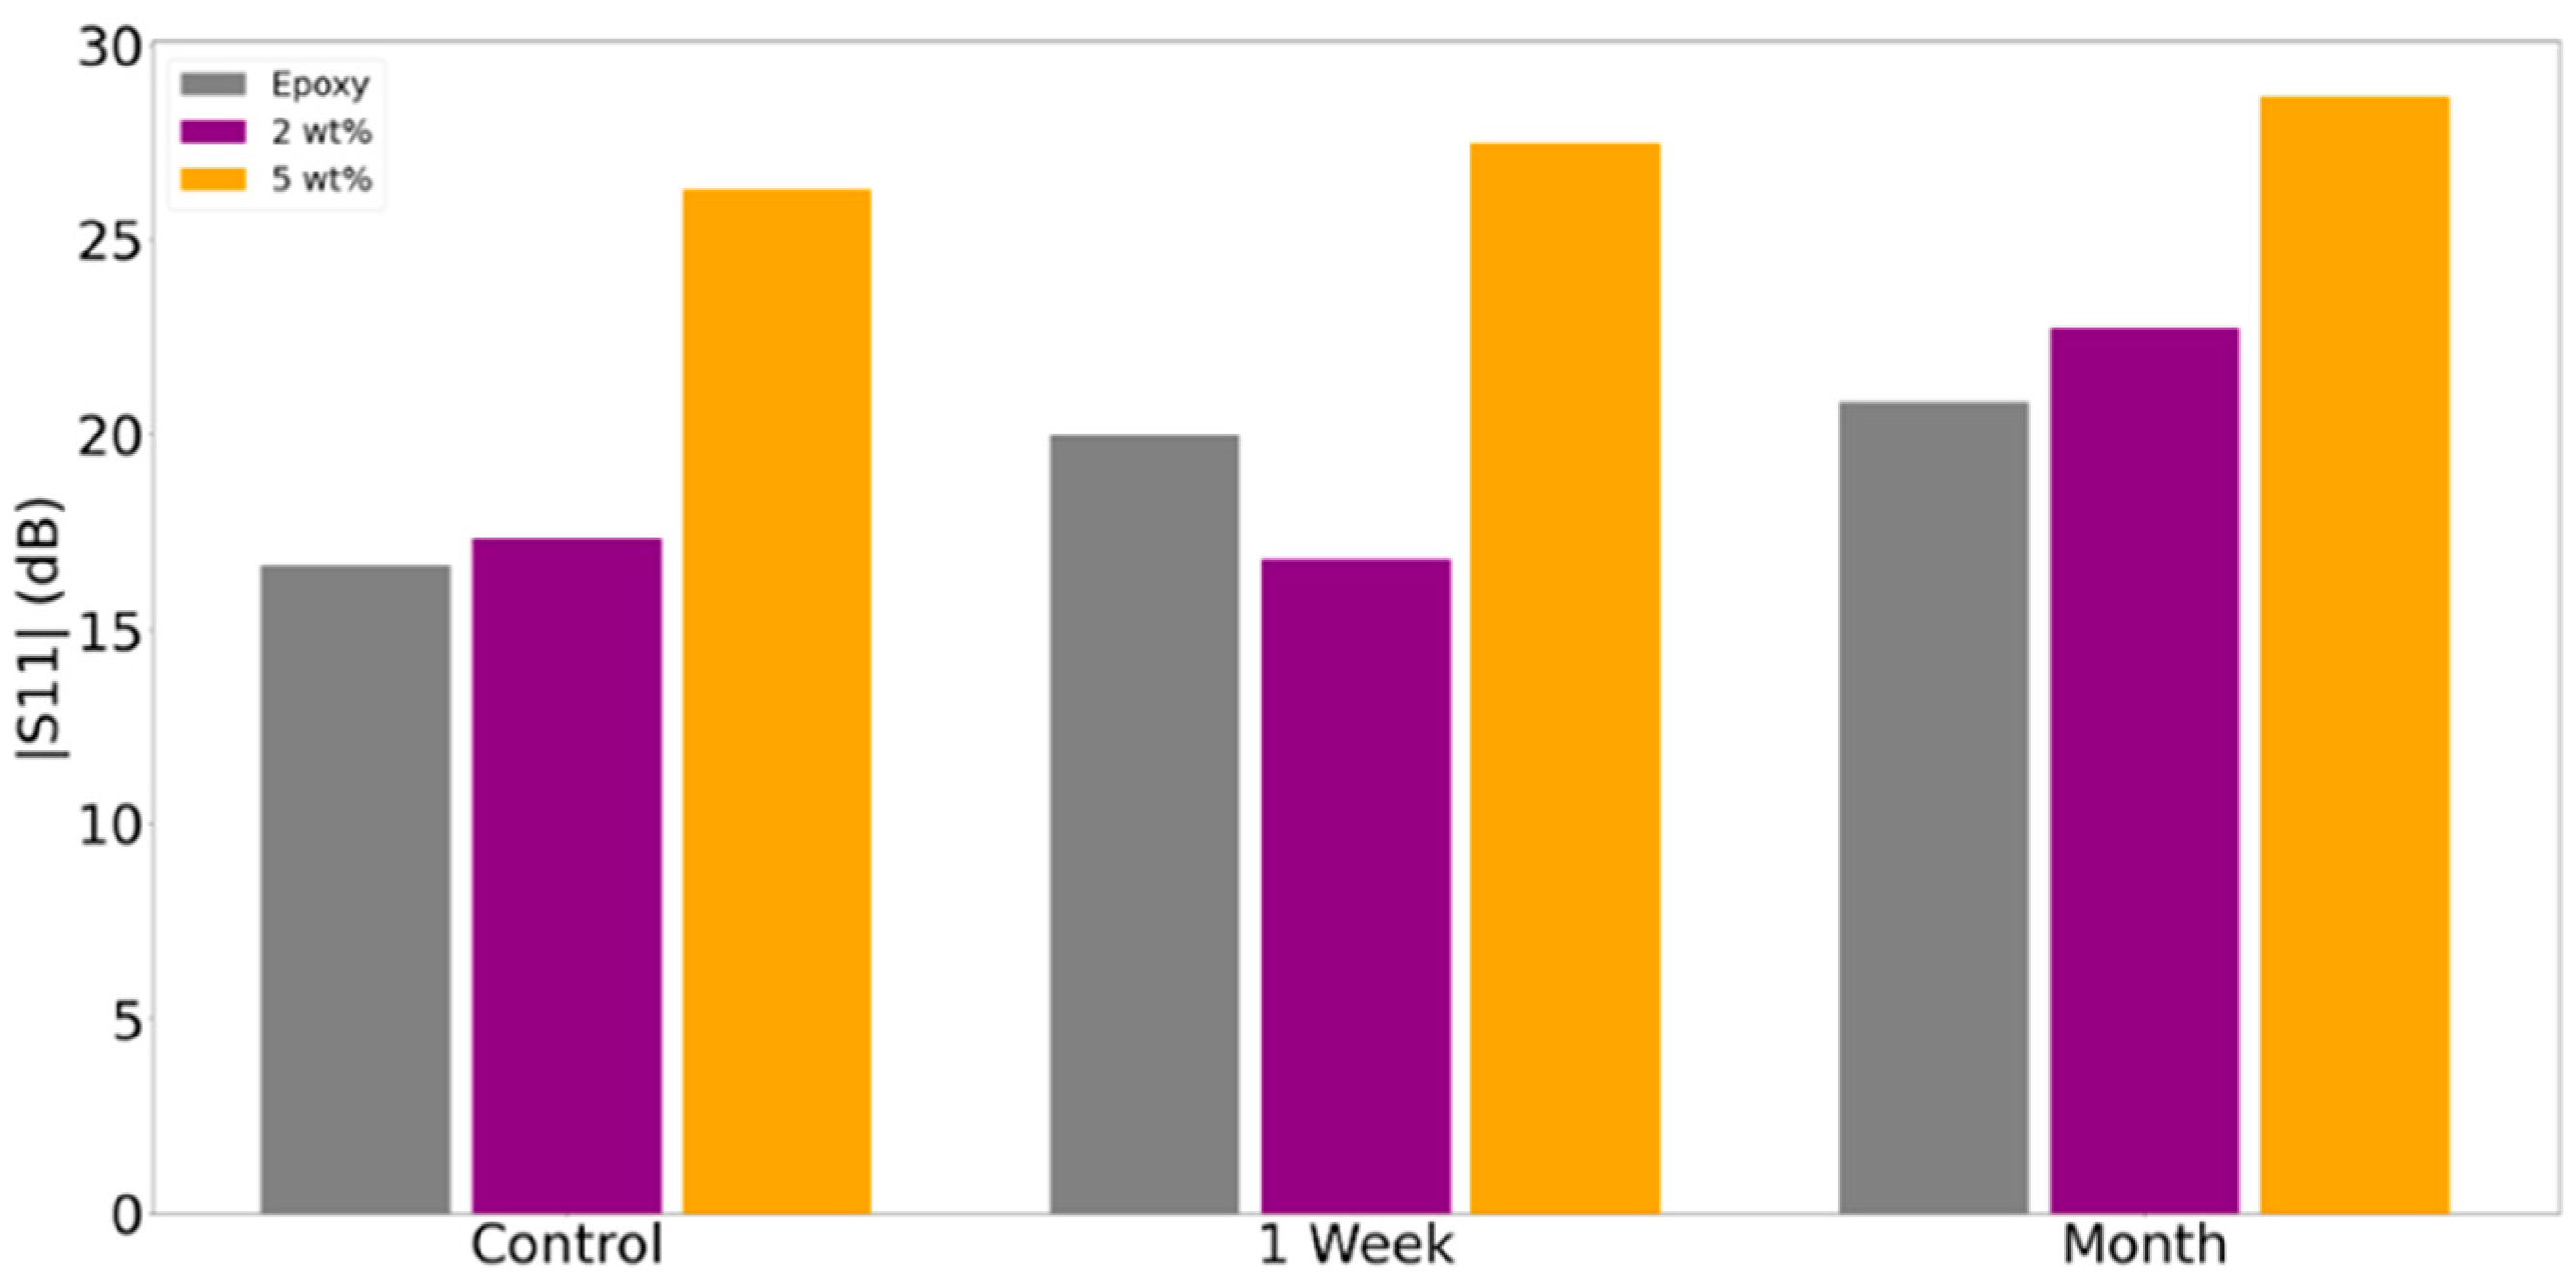
The results of the free space technique showing s-parameter (S11) are presented in
Figure 13. As the percentage of CNTs increased in the control samples, the absolute values also increased as expected. However, when the CNT percentage reached the electrical percolation threshold at around 2% , they potentially acted as a barrier to the diffusion, and this was observed in the 2% sample [
2]. The pristine epoxy was affected by acid diffusion after just one week, and the same trend was observed after one month, indicating that the diffusion was not impeded, and the alteration in the dielectric properties was consistent. In the case of the 5% sample, there was a slight gradual increase in the difference between control, one week and one month. This could be explained by the fact that the dielectric properties had already been affected by the percentage of CNTs, reaching its plateau, following the same principle as the electrical percolation threshold. Additionally, at high percentage, the CNTs barrier could be larger. However, the formation of aggregates could further facilitate diffusion by triggering porosity around their surroundings allowing ions to diffuse.
Figure 13.
VNA Results Comparison Before and After Acid Diffusion.
Figure 13.
VNA Results Comparison Before and After Acid Diffusion.
4. Conclusions
In this study, various samples were fabricated by increasing the amount of CNT from 0% to 5%. The bulk mechanical properties of the samples were measured using DMA. However, the local mechanical properties were assessed using nanoindentation technique. It was shown the mechanical properties are sensitive to agglomerations and the amount of CNT percentage added to the polymer. There is a clear trend that the behavior of the material is dependent of carbon fillers before, during and after percolation threshold.
Then the samples were subjected to acid exposure. The mechanical properties were changed as function of time. We have observed that the material upon acid exposure, starts to degrade as time progresses from one week to one month. However, the level of degradation was dependent on the amount of CNT in the host polymer. We have witnessed a degradation at nanoscale and macro scale. At macroscale, as we increased the percentage of CNT the reduction was more significant because of large aggregates and porosity as the amount of CNT had increased. At nanoscale all samples displayed the same behavior there is a gradient in mechanical properties from the core to the skin. In which the skin is in contact with the acid solution. The gradient is noticeable as the amount of CNT was increased in the host polymer.
There is an agreement between both techniques the nanoindentation data (mechanical) and VNA data (electromagnetic) measurements. During acid exposure, the diffusion of ions alters the physical properties of the samples. These properties were also influenced by the percentage of addition of CNT.
Author Contributions
Conceptualization, K.L.; methodology, K.L and M.T.; validation, K.L., and M.T.; formal analysis, S.T.; investigation, M.T and M.D and S.T.; writing—original draft preparation, S.T., K.L and K.K.L; writing—review and editing, S.T. and K.L.; supervision, K.L.; project administration, K.L. All authors have read and agreed to the published version of the manuscript.
Funding
This research received no external funding.
Data Availability Statement
Not applicable.
Conflicts of Interest
The authors declare no conflict of interest.
References
- Gotou, T.; Noda, M.; Tomiyama, T.; Sembokuya, H.; Kubouchi, M.; Tsuda, K. In situ health monitoring of corrosion resistant polymers exposed to alkaline solutions using pH indicators. Sensors Actuators, B Chem. 2006, 119, 27–32. [Google Scholar] [CrossRef]
- Liu, C.; Lafdi, K.; Chinesta, F. Durability sensor using low concentration carbon nano additives. Compos. Sci. Technol. 2020, 195, 108200. [Google Scholar] [CrossRef]
- Abastari; Sakai, T. ; Sembokuya, H.; Kubouchi, M.; Tsuda, K. Study on permeation behavior and chemical degradation of PA66 in acid solution. Polym. Degrad. Stab. 2007, 92, 379–388. [Google Scholar] [CrossRef]
- Tamayo-Vegas, S.; Lafdi, K. A Literature Review of Non-Contact Tools and Methods in Structural Health Monitoring. Eng. Technol. Open Access J. 2021, 4. [Google Scholar] [CrossRef]
- Al Habis, N.; El Moumen, A.; Tarfaoui, M.; Lafdi, K. Mechanical properties of carbon black/poly (ε-caprolactone)-based tissue scaffolds. Arab. J. Chem. 2020, 13, 3210–3217. [Google Scholar] [CrossRef]
- Bhushan, B.; Li, X. Nanomechanical characterisation of solid surfaces and thin films. Int. Mater. Rev. 2003, 48, 125–164. [Google Scholar] [CrossRef]
- Tarfaoui, M.; Lafdi, K.; Beloufa, I.; Daloia, D.; Muhsan, A. Effect of graphene nano-additives on the local mechanical behavior of derived polymer nanocomposites. Polymers 2018, 10. [Google Scholar] [CrossRef]
- Tarfaoui, M.; El Moumen, A.; Lafdi, K. Progressive damage modeling in carbon fibers/carbon nanotubes reinforced polymer composites. Compos. Part B Eng. 2017, 112, 185–195. [Google Scholar] [CrossRef]
- Liu, C.; Fang, Q.; Lafdi, K. Novel wireless sensing design for composite durability study. Compos. Commun. 2020, 22, 100511. [Google Scholar] [CrossRef]
- Khammassi, S.; Tarfaoui, M.; Lafdi, K. Study of mechanical performance of polymer nanocomposites reinforced with exfoliated graphite of different mesh sizes using micro-indentation. J. Compos. Mater. 2021, 55, 2617–2629. [Google Scholar] [CrossRef]
- Qureshi, Y.; Mostapha, T.; Lafdi, K.K.; Lafdi, K. Nanotechnology and Development of Strain Sensor for Damage Detection. IntechOpen 2019. [Google Scholar] [CrossRef]
- Al Habis, N.; Liu, C.; Dumuids, J.B.; Lafdi, K. Intelligent design of conducting network in polymers using numerical and experimental approaches. RSC Adv. 2016, 6, 95010–95020. [Google Scholar] [CrossRef]
- El Moumen, A.; Tarfaoui, M.; Benyahia, H.; Lafdi, K. Mechanical behavior of carbon nanotubes-based polymer composites under impact tests. J. Compos. Mater. 2019, 53, 925–940. [Google Scholar] [CrossRef]
- Tarfaoui, M.; El Moumen, A.; Lafdi, K.; Hassoon, O.H.; Nachtane, M. Inter laminar failure behavior in laminate carbon nanotubes-based polymer composites. J. Compos. Mater. 2018, 52, 3655–3667. [Google Scholar] [CrossRef]
- Qureshi, Y.; Tarfaoui, M.; Lafdi, K.K.; Lafdi, K. Real-time Strain Monitoring Performance of Flexible Nylon/Ag Conductive Fiber. Sensors Actuators, A Phys. 2019, 295, 612–622. [Google Scholar] [CrossRef]
- Rai, A.; Subramanian, N.; Chattopadhyay, A. Investigation of damage mechanisms in CNT nanocomposites using multiscale analysis. Int. J. Solids Struct. 2017, 120, 115–124. [Google Scholar] [CrossRef]
- Aizawa, K.; Poozesh, P.; Niezrecki, C.; Baqersad, J.; Inalpolat, M.; Heilmann, G. An acoustic-array based structural health monitoring technique for wind turbine blades. Struct. Heal. Monit. Insp. Adv. Mater. Aerospace, Civ. Infrastruct. 2015 2015, 9437, 94371P. [Google Scholar] [CrossRef]
- El Moumen, A.; Tarfaoui, M.; Lafdi, K. Mechanical characterization of carbon nanotubes based polymer composites using indentation tests. Compos. Part B Eng. 2017, 114, 1–7. [Google Scholar] [CrossRef]
- El Moumen, A.; Tarfaoui, M.; Hassoon, O.; Lafdi, K.; Benyahia, H.; Nachtane, M. Experimental Study and Numerical Modelling of Low Velocity Impact on Laminated Composite Reinforced with Thin Film Made of Carbon Nanotubes. Appl. Compos. Mater. 2018, 25, 309–320. [Google Scholar] [CrossRef]
- Tamayo-Vegas, S.; Lafdi, K.; Elsdon, M. A contactless characterization of CNT/Epoxy nanocomposites behavior under acid exposure. Compos. Struct. 2023, 305, 116508. [Google Scholar] [CrossRef]
- La Saponara, V. Environmental and chemical degradation of carbon/epoxy and structural adhesive for aerospace applications: Fickian and anomalous diffusion, Arrhenius kinetics. Compos. Struct. 2011, 93, 2180–2195. [Google Scholar] [CrossRef]
- Tamayo-Vegas, S.; Muhsan, A.; Liu, C.; Tarfaoui, M.; Lafdi, K. The Effect of Agglomeration on the Electrical and Mechanical Properties of Polymer Matrix Nanocomposites Reinforced with Carbon Nanotubes. Polymers 2022, 14, 1–18. [Google Scholar] [CrossRef] [PubMed]
- Yui, T.; Sharmin, A.; Kubouchi, M.; Aoki, S.; Nabei, T. Degradation behavior of epoxy lining materials under corrosive conditions intended for biomass gas plant. In Proceedings of the Sustainable Construction Materials and Technologies; 2013; Vol. 2013-Augus. [Google Scholar]
- Liu, Y.; Kubouchi, M.; Sembokuya, H.; Tsuda, K.; Tomiyama, T. On-line monitoring of epoxy resin exposed to acid solution. J. Mater. Sci. Technol. 2006, 22, 414–418. [Google Scholar]
- Hojo, H.; Tsuda, K.; Kubouchi, M.; Kim, D.S. Corrosion of plastics and composites in chemical environments. Met. Mater. Int. 1998, 4, 1191–1197. [Google Scholar] [CrossRef]
- Taherian, R. Experimental and analytical model for the electrical conductivity of polymer-based nanocomposites. Compos. Sci. Technol. 2016, 123, 17–31. [Google Scholar] [CrossRef]
- Tamayo-Vegas, S.; Muhsan, A.; Chang, L.; Tarfaoui, M.; Lafdi, K. Effect of CNT additives on the electrical properties of derived nanocomposites (experimentally and numerical investigation). Mater. Today Proc. 2021. [Google Scholar] [CrossRef]
- Khammassi, S.; Tarfaoui, M. Influence of exfoliated graphite filler size on the electrical, thermal, and mechanical polymer properties. J. Compos. Mater. 2020, 54, 3731–3741. [Google Scholar] [CrossRef]
- Tamayo-Vegas, S.; Muhsan, A.; Tarfaoui, M.; Lafdi, K.; Chang, L. Effect of CNT additives on the electrical properties of derived nanocomposites (experimentally and numerical investigation). Mater. Today Proc. 2021, 3–9. [Google Scholar] [CrossRef]
- Tamayo-Vegas, S.; Lafdi, K. Experimental and modelling of temperature-dependent mechanical properties of CNT/polymer nanocomposites. Mater. Today Proc. 2022, 1–8. [Google Scholar] [CrossRef]
- Kovacs, J.Z.; Velagala, B.S.; Schulte, K.; Bauhofer, W. Two percolation thresholds in carbon nanotube epoxy composites. Compos. Sci. Technol. 2007, 67, 922–928. [Google Scholar] [CrossRef]
- Ward, B. A Numerical Resistor Network Model for the Determination of Electrical Properties of Nanocomposites, Rice University, 2011.
|
Disclaimer/Publisher’s Note: The statements, opinions and data contained in all publications are solely those of the individual author(s) and contributor(s) and not of MDPI and/or the editor(s). MDPI and/or the editor(s) disclaim responsibility for any injury to people or property resulting from any ideas, methods, instructions or products referred to in the content. |
© 2023 by the authors. Licensee MDPI, Basel, Switzerland. This article is an open access article distributed under the terms and conditions of the Creative Commons Attribution (CC BY) license (http://creativecommons.org/licenses/by/4.0/).
